Churchtown, PA Map & Demographics
Churchtown Map
Churchtown Overview
$55,874
PER CAPITA INCOME
$81,518
AVG FAMILY INCOME
$80,982
AVG HOUSEHOLD INCOME
48.8%
WAGE / INCOME GAP [ % ]
51.2¢/ $1
WAGE / INCOME GAP [ $ ]
0.66
INEQUALITY / GINI INDEX
452
TOTAL POPULATION
178
MALE POPULATION
274
FEMALE POPULATION
64.96
MALES / 100 FEMALES
153.93
FEMALES / 100 MALES
46.5
MEDIAN AGE
3.6
AVG FAMILY SIZE
3.3
AVG HOUSEHOLD SIZE
177
LABOR FORCE [ PEOPLE ]
54.6%
PERCENT IN LABOR FORCE
Income in Churchtown
Income Overview in Churchtown
Per Capita Income in Churchtown is $55,874, while median incomes of families and households are $81,518 and $80,982 respectively.
| Characteristic | Number | Measure |
| Per Capita Income | 452 | $55,874 |
| Median Family Income | 119 | $81,518 |
| Mean Family Income | 119 | $209,720 |
| Median Household Income | 137 | $80,982 |
| Mean Household Income | 137 | $184,671 |
| Income Deficit | 119 | $0 |
| Wage / Income Gap (%) | 452 | 48.83% |
| Wage / Income Gap ($) | 452 | 51.17¢ per $1 |
| Gini / Inequality Index | 452 | 0.66 |
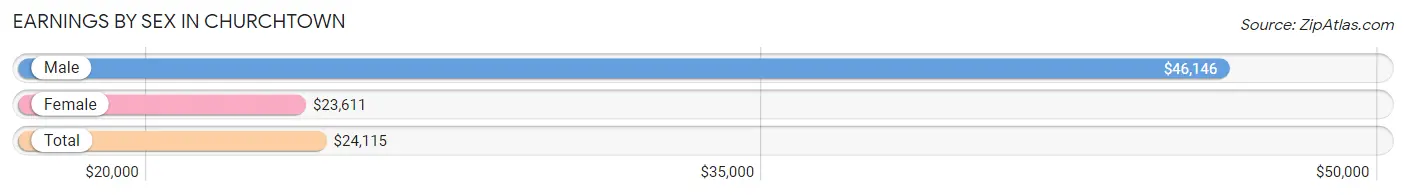
Earnings by Sex in Churchtown
Average Earnings in Churchtown are $24,115, $46,146 for men and $23,611 for women, a difference of 48.8%.
| Sex | Number | Average Earnings |
| Male | 87 (49.1%) | $46,146 |
| Female | 90 (50.8%) | $23,611 |
| Total | 177 (100.0%) | $24,115 |
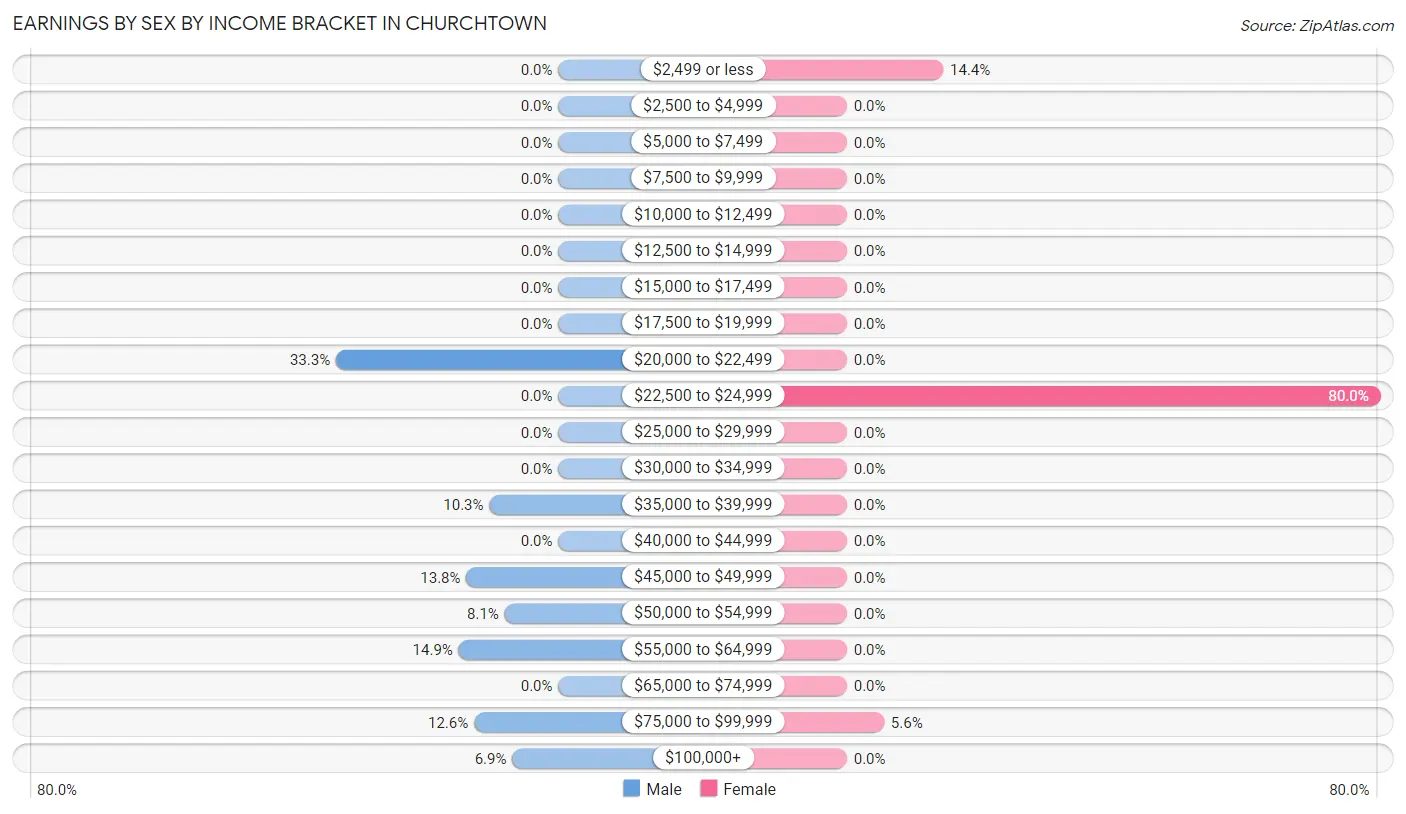
Earnings by Sex by Income Bracket in Churchtown
The most common earnings brackets in Churchtown are $20,000 to $22,499 for men (29 | 33.3%) and $22,500 to $24,999 for women (72 | 80.0%).
| Income | Male | Female |
| $2,499 or less | 0 (0.0%) | 13 (14.4%) |
| $2,500 to $4,999 | 0 (0.0%) | 0 (0.0%) |
| $5,000 to $7,499 | 0 (0.0%) | 0 (0.0%) |
| $7,500 to $9,999 | 0 (0.0%) | 0 (0.0%) |
| $10,000 to $12,499 | 0 (0.0%) | 0 (0.0%) |
| $12,500 to $14,999 | 0 (0.0%) | 0 (0.0%) |
| $15,000 to $17,499 | 0 (0.0%) | 0 (0.0%) |
| $17,500 to $19,999 | 0 (0.0%) | 0 (0.0%) |
| $20,000 to $22,499 | 29 (33.3%) | 0 (0.0%) |
| $22,500 to $24,999 | 0 (0.0%) | 72 (80.0%) |
| $25,000 to $29,999 | 0 (0.0%) | 0 (0.0%) |
| $30,000 to $34,999 | 0 (0.0%) | 0 (0.0%) |
| $35,000 to $39,999 | 9 (10.3%) | 0 (0.0%) |
| $40,000 to $44,999 | 0 (0.0%) | 0 (0.0%) |
| $45,000 to $49,999 | 12 (13.8%) | 0 (0.0%) |
| $50,000 to $54,999 | 7 (8.1%) | 0 (0.0%) |
| $55,000 to $64,999 | 13 (14.9%) | 0 (0.0%) |
| $65,000 to $74,999 | 0 (0.0%) | 0 (0.0%) |
| $75,000 to $99,999 | 11 (12.6%) | 5 (5.6%) |
| $100,000+ | 6 (6.9%) | 0 (0.0%) |
| Total | 87 (100.0%) | 90 (100.0%) |
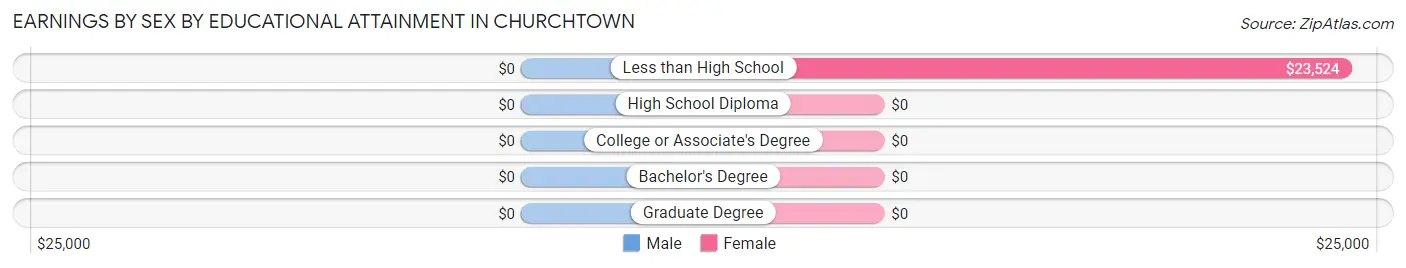
Earnings by Sex by Educational Attainment in Churchtown
| Educational Attainment | Male Income | Female Income |
| Less than High School | - | - |
| High School Diploma | - | - |
| College or Associate's Degree | - | - |
| Bachelor's Degree | - | - |
| Graduate Degree | - | - |
| Total | $46,146 | $23,611 |
Family Income in Churchtown
Family Income Brackets in Churchtown
According to the Churchtown family income data, there are 55 families falling into the $75,000 to $99,999 income range, which is the most common income bracket and makes up 46.2% of all families.
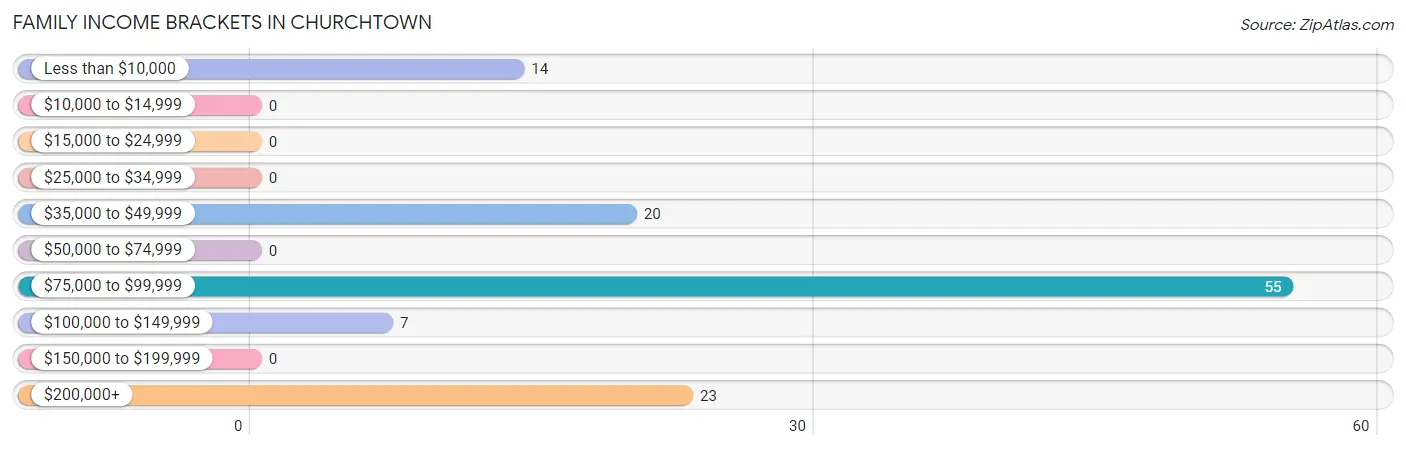
| Income Bracket | # Families | % Families |
| Less than $10,000 | 14 | 11.8% |
| $10,000 to $14,999 | 0 | 0.0% |
| $15,000 to $24,999 | 0 | 0.0% |
| $25,000 to $34,999 | 0 | 0.0% |
| $35,000 to $49,999 | 20 | 16.8% |
| $50,000 to $74,999 | 0 | 0.0% |
| $75,000 to $99,999 | 55 | 46.2% |
| $100,000 to $149,999 | 7 | 5.9% |
| $150,000 to $199,999 | 0 | 0.0% |
| $200,000+ | 23 | 19.3% |
Family Income by Famaliy Size in Churchtown
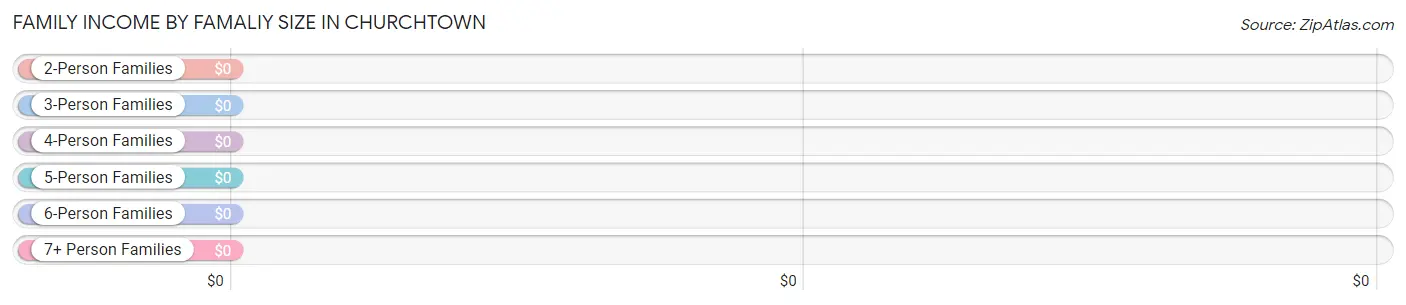
| Income Bracket | # Families | Median Income |
| 2-Person Families | 44 (37.0%) | $0 |
| 3-Person Families | 20 (16.8%) | $0 |
| 4-Person Families | 29 (24.4%) | $0 |
| 5-Person Families | 0 (0.0%) | $0 |
| 6-Person Families | 13 (10.9%) | $0 |
| 7+ Person Families | 13 (10.9%) | $0 |
| Total | 119 (100.0%) | $81,518 |
Family Income by Number of Earners in Churchtown
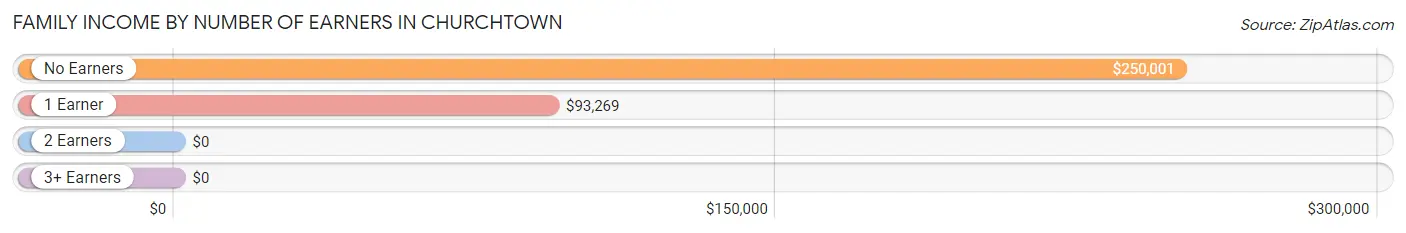
| Number of Earners | # Families | Median Income |
| No Earners | 34 (28.6%) | $250,001 |
| 1 Earner | 32 (26.9%) | $93,269 |
| 2 Earners | 24 (20.2%) | $0 |
| 3+ Earners | 29 (24.4%) | $0 |
| Total | 119 (100.0%) | $81,518 |
Household Income in Churchtown
Household Income Brackets in Churchtown
With 55 households falling in the category, the $75,000 to $99,999 income range is the most frequent in Churchtown, accounting for 40.2% of all households.
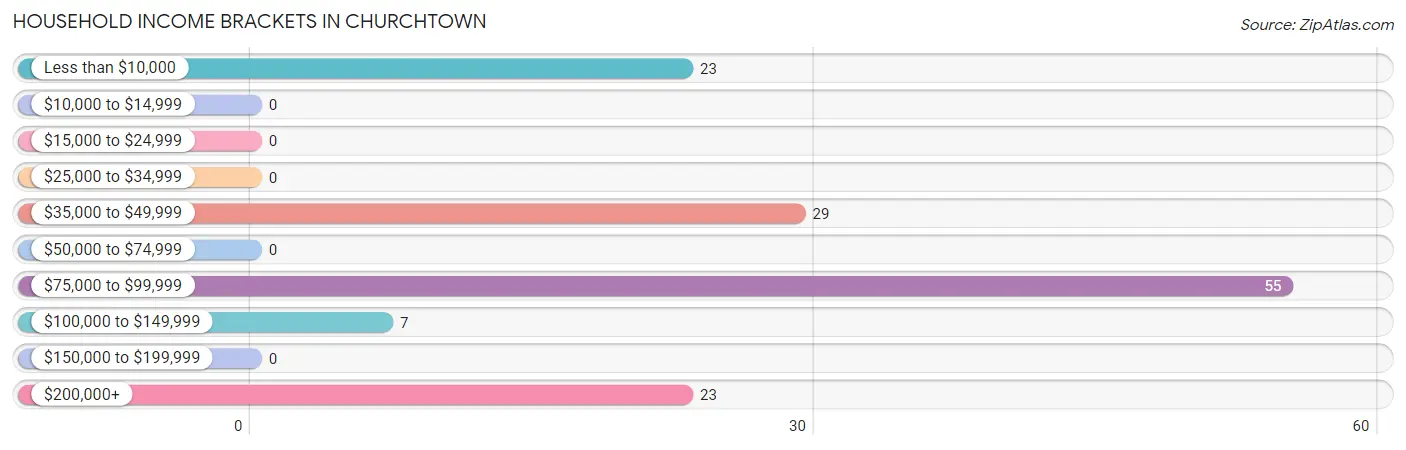
| Income Bracket | # Households | % Households |
| Less than $10,000 | 23 | 16.8% |
| $10,000 to $14,999 | 0 | 0.0% |
| $15,000 to $24,999 | 0 | 0.0% |
| $25,000 to $34,999 | 0 | 0.0% |
| $35,000 to $49,999 | 29 | 21.2% |
| $50,000 to $74,999 | 0 | 0.0% |
| $75,000 to $99,999 | 55 | 40.1% |
| $100,000 to $149,999 | 7 | 5.1% |
| $150,000 to $199,999 | 0 | 0.0% |
| $200,000+ | 23 | 16.8% |
Household Income by Householder Age in Churchtown
The median household income in Churchtown is $80,982, with the highest median household income of $81,078 found in the 45 to 64 years age bracket for the primary householder. A total of 43 households (31.4%) fall into this category. Meanwhile, the 15 to 24 years age bracket for the primary householder has the lowest median household income of $0, with 12 households (8.8%) in this group.
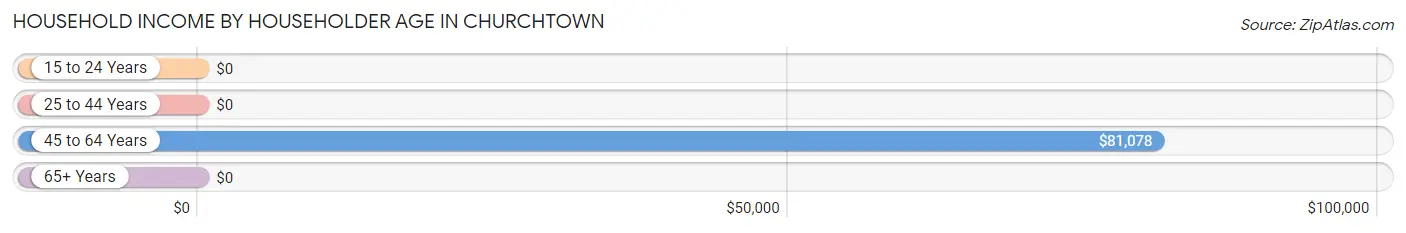
| Income Bracket | # Households | Median Income |
| 15 to 24 Years | 12 (8.8%) | $0 |
| 25 to 44 Years | 26 (19.0%) | $0 |
| 45 to 64 Years | 43 (31.4%) | $81,078 |
| 65+ Years | 56 (40.9%) | $0 |
| Total | 137 (100.0%) | $80,982 |
Poverty in Churchtown
Income Below Poverty by Sex and Age in Churchtown
With 5.1% poverty level for males and 11.0% for females among the residents of Churchtown, 25 to 34 year old males and 65 to 74 year old females are the most vulnerable to poverty, with 9 males (26.5%) and 15 females (38.5%) in their respective age groups living below the poverty level.
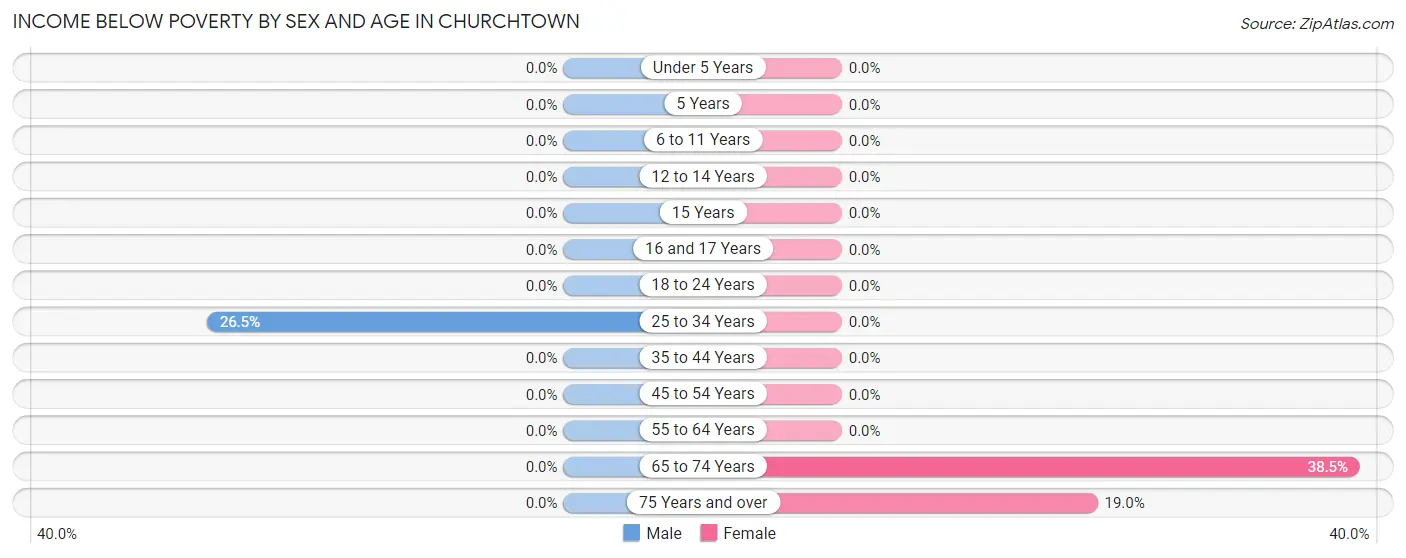
| Age Bracket | Male | Female |
| Under 5 Years | 0 (0.0%) | 0 (0.0%) |
| 5 Years | 0 (0.0%) | 0 (0.0%) |
| 6 to 11 Years | 0 (0.0%) | 0 (0.0%) |
| 12 to 14 Years | 0 (0.0%) | 0 (0.0%) |
| 15 Years | 0 (0.0%) | 0 (0.0%) |
| 16 and 17 Years | 0 (0.0%) | 0 (0.0%) |
| 18 to 24 Years | 0 (0.0%) | 0 (0.0%) |
| 25 to 34 Years | 9 (26.5%) | 0 (0.0%) |
| 35 to 44 Years | 0 (0.0%) | 0 (0.0%) |
| 45 to 54 Years | 0 (0.0%) | 0 (0.0%) |
| 55 to 64 Years | 0 (0.0%) | 0 (0.0%) |
| 65 to 74 Years | 0 (0.0%) | 15 (38.5%) |
| 75 Years and over | 0 (0.0%) | 15 (19.0%) |
| Total | 9 (5.1%) | 30 (11.0%) |
Income Above Poverty by Sex and Age in Churchtown
According to the poverty statistics in Churchtown, males aged under 5 years and females aged under 5 years are the age groups that are most secure financially, with 100.0% of males and 100.0% of females in these age groups living above the poverty line.
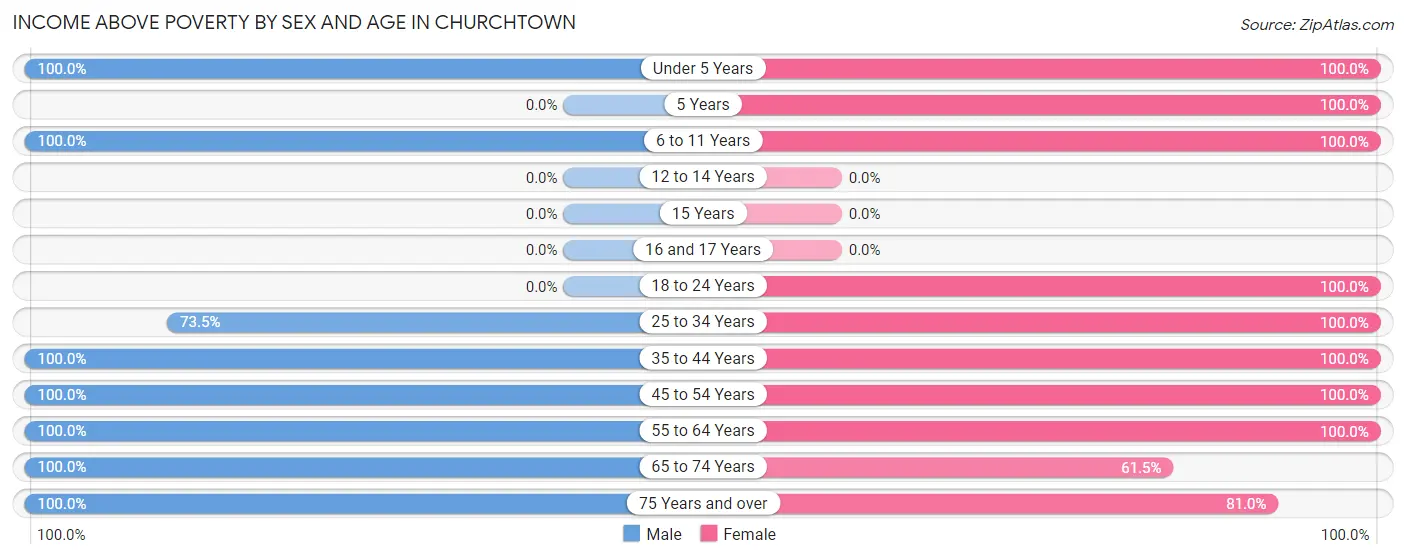
| Age Bracket | Male | Female |
| Under 5 Years | 33 (100.0%) | 24 (100.0%) |
| 5 Years | 0 (0.0%) | 12 (100.0%) |
| 6 to 11 Years | 41 (100.0%) | 18 (100.0%) |
| 12 to 14 Years | 0 (0.0%) | 0 (0.0%) |
| 15 Years | 0 (0.0%) | 0 (0.0%) |
| 16 and 17 Years | 0 (0.0%) | 0 (0.0%) |
| 18 to 24 Years | 0 (0.0%) | 12 (100.0%) |
| 25 to 34 Years | 25 (73.5%) | 12 (100.0%) |
| 35 to 44 Years | 11 (100.0%) | 13 (100.0%) |
| 45 to 54 Years | 38 (100.0%) | 32 (100.0%) |
| 55 to 64 Years | 6 (100.0%) | 33 (100.0%) |
| 65 to 74 Years | 7 (100.0%) | 24 (61.5%) |
| 75 Years and over | 8 (100.0%) | 64 (81.0%) |
| Total | 169 (94.9%) | 244 (89.0%) |
Income Below Poverty Among Married-Couple Families in Churchtown
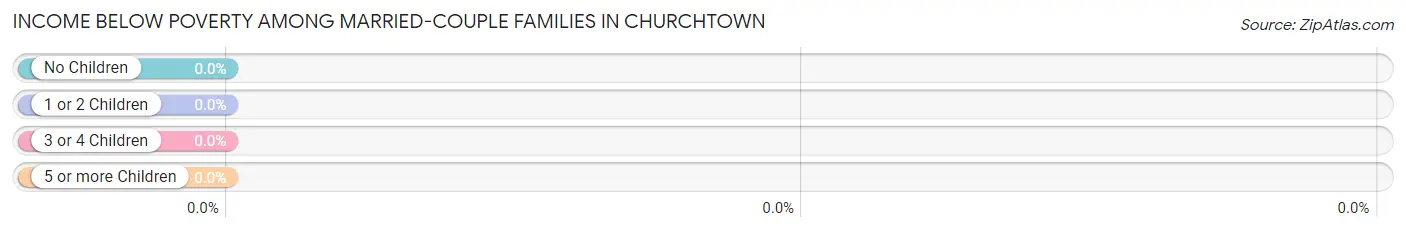
| Children | Above Poverty | Below Poverty |
| No Children | 20 (100.0%) | 0 (0.0%) |
| 1 or 2 Children | 12 (100.0%) | 0 (0.0%) |
| 3 or 4 Children | 13 (100.0%) | 0 (0.0%) |
| 5 or more Children | 13 (100.0%) | 0 (0.0%) |
| Total | 58 (100.0%) | 0 (0.0%) |
Income Below Poverty Among Single-Parent Households in Churchtown
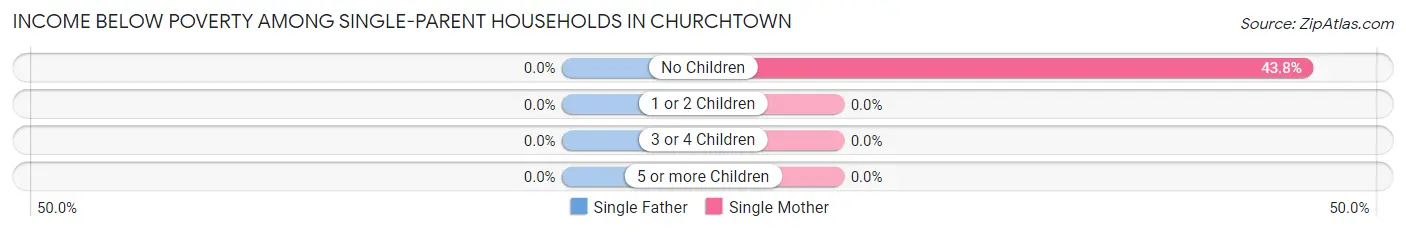
| Children | Single Father | Single Mother |
| No Children | 0 (0.0%) | 14 (43.8%) |
| 1 or 2 Children | 0 (0.0%) | 0 (0.0%) |
| 3 or 4 Children | 0 (0.0%) | 0 (0.0%) |
| 5 or more Children | 0 (0.0%) | 0 (0.0%) |
| Total | 0 (0.0%) | 14 (43.8%) |
Income Below Poverty Among Married-Couple vs Single-Parent Households in Churchtown
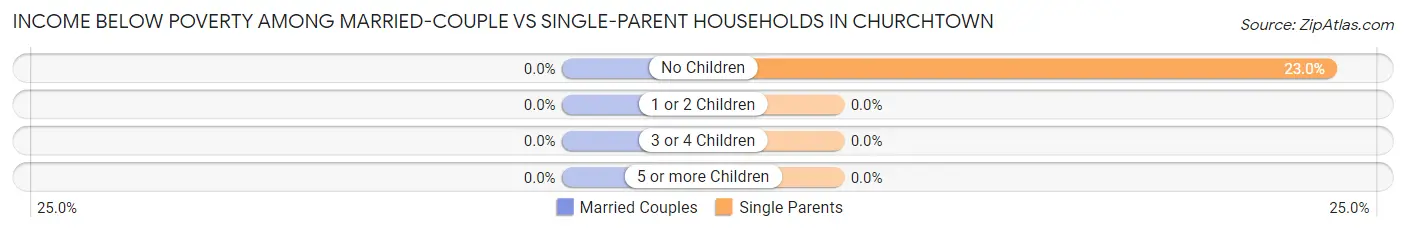
| Children | Married-Couple Families | Single-Parent Households |
| No Children | 0 (0.0%) | 14 (23.0%) |
| 1 or 2 Children | 0 (0.0%) | 0 (0.0%) |
| 3 or 4 Children | 0 (0.0%) | 0 (0.0%) |
| 5 or more Children | 0 (0.0%) | 0 (0.0%) |
| Total | 0 (0.0%) | 14 (23.0%) |
Race in Churchtown
The most populous races in Churchtown are White / Caucasian (372 | 82.3%), and Asian (80 | 17.7%).
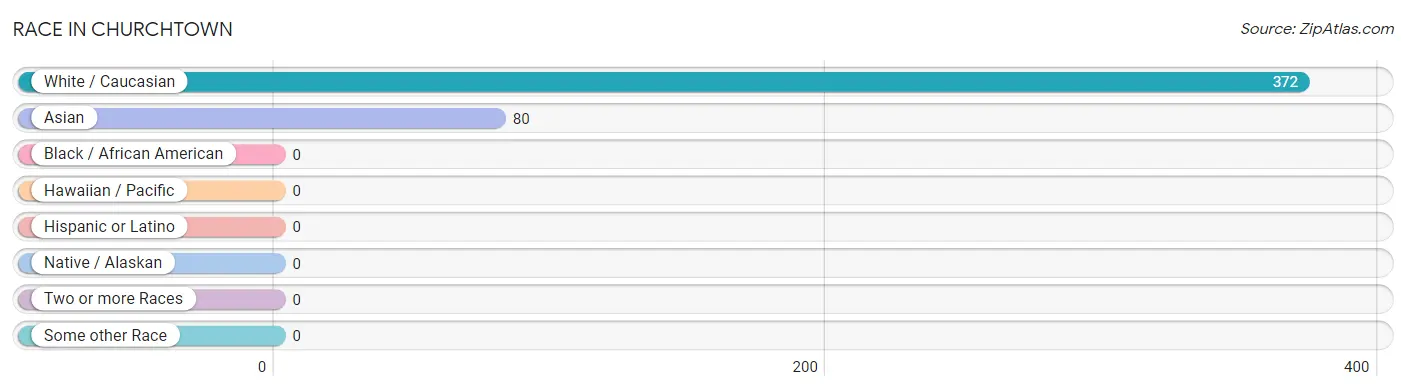
| Race | # Population | % Population |
| Asian | 80 | 17.7% |
| Black / African American | 0 | 0.0% |
| Hawaiian / Pacific | 0 | 0.0% |
| Hispanic or Latino | 0 | 0.0% |
| Native / Alaskan | 0 | 0.0% |
| White / Caucasian | 372 | 82.3% |
| Two or more Races | 0 | 0.0% |
| Some other Race | 0 | 0.0% |
| Total | 452 | 100.0% |
Ancestry in Churchtown
The most populous ancestries reported in Churchtown are Thai (80 | 17.7%), Dutch (74 | 16.4%), German (71 | 15.7%), European (38 | 8.4%), and Irish (29 | 6.4%), together accounting for 64.6% of all Churchtown residents.
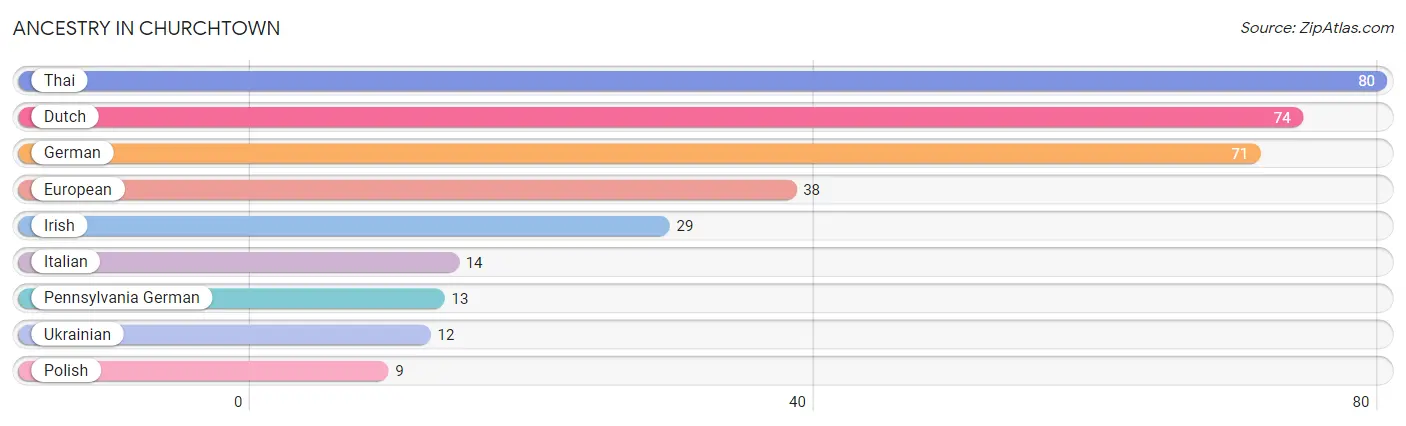
| Ancestry | # Population | % Population |
| Dutch | 74 | 16.4% |
| European | 38 | 8.4% |
| German | 71 | 15.7% |
| Irish | 29 | 6.4% |
| Italian | 14 | 3.1% |
| Pennsylvania German | 13 | 2.9% |
| Polish | 9 | 2.0% |
| Thai | 80 | 17.7% |
| Ukrainian | 12 | 2.6% | View All 9 Rows |
Immigrants in Churchtown
The most numerous immigrant groups reported in Churchtown came from , and Oceania (6 | 1.3%), together accounting for 1.3% of all Churchtown residents.

| Immigration Origin | # Population | % Population |
| Oceania | 6 | 1.3% | View All 1 Rows |
Sex and Age in Churchtown
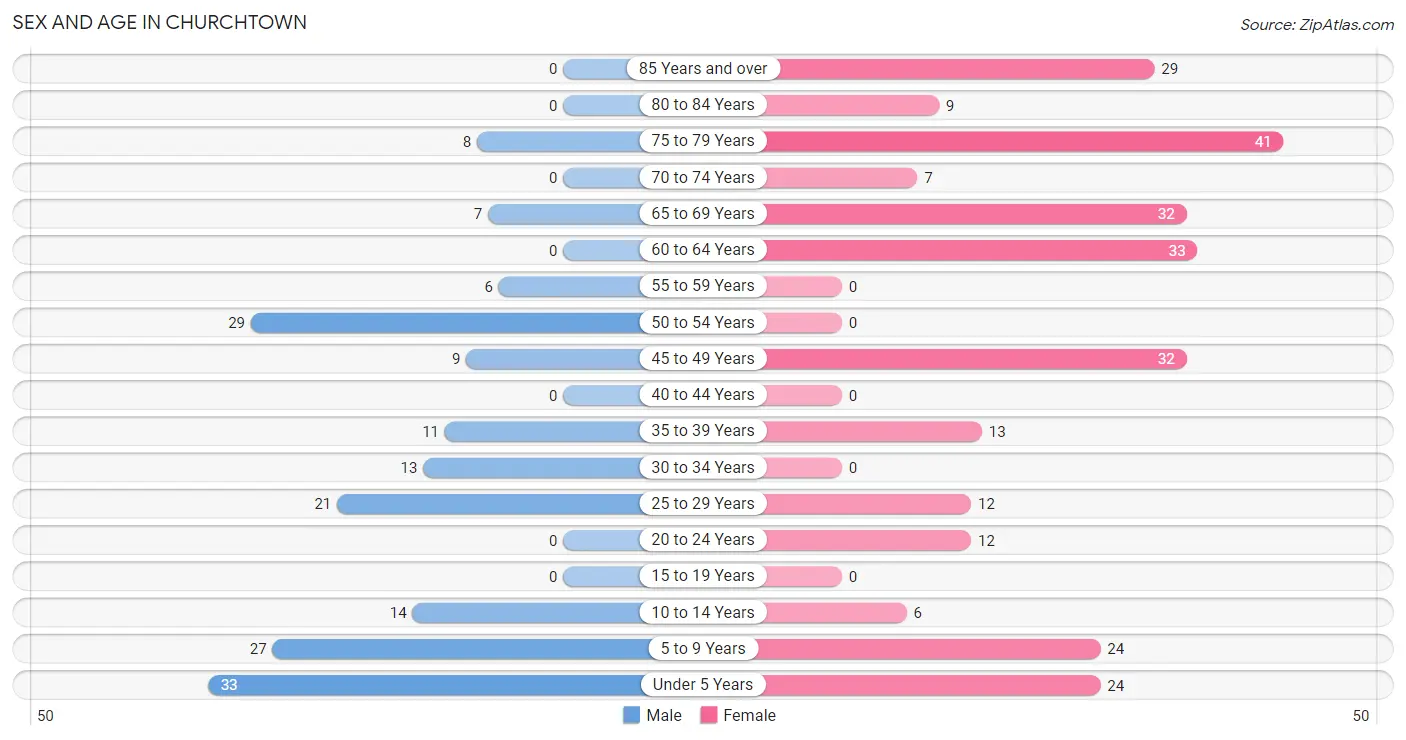
Sex and Age in Churchtown
The most populous age groups in Churchtown are Under 5 Years (33 | 18.5%) for men and 75 to 79 Years (41 | 15.0%) for women.
| Age Bracket | Male | Female |
| Under 5 Years | 33 (18.5%) | 24 (8.8%) |
| 5 to 9 Years | 27 (15.2%) | 24 (8.8%) |
| 10 to 14 Years | 14 (7.9%) | 6 (2.2%) |
| 15 to 19 Years | 0 (0.0%) | 0 (0.0%) |
| 20 to 24 Years | 0 (0.0%) | 12 (4.4%) |
| 25 to 29 Years | 21 (11.8%) | 12 (4.4%) |
| 30 to 34 Years | 13 (7.3%) | 0 (0.0%) |
| 35 to 39 Years | 11 (6.2%) | 13 (4.7%) |
| 40 to 44 Years | 0 (0.0%) | 0 (0.0%) |
| 45 to 49 Years | 9 (5.1%) | 32 (11.7%) |
| 50 to 54 Years | 29 (16.3%) | 0 (0.0%) |
| 55 to 59 Years | 6 (3.4%) | 0 (0.0%) |
| 60 to 64 Years | 0 (0.0%) | 33 (12.0%) |
| 65 to 69 Years | 7 (3.9%) | 32 (11.7%) |
| 70 to 74 Years | 0 (0.0%) | 7 (2.5%) |
| 75 to 79 Years | 8 (4.5%) | 41 (15.0%) |
| 80 to 84 Years | 0 (0.0%) | 9 (3.3%) |
| 85 Years and over | 0 (0.0%) | 29 (10.6%) |
| Total | 178 (100.0%) | 274 (100.0%) |
Families and Households in Churchtown
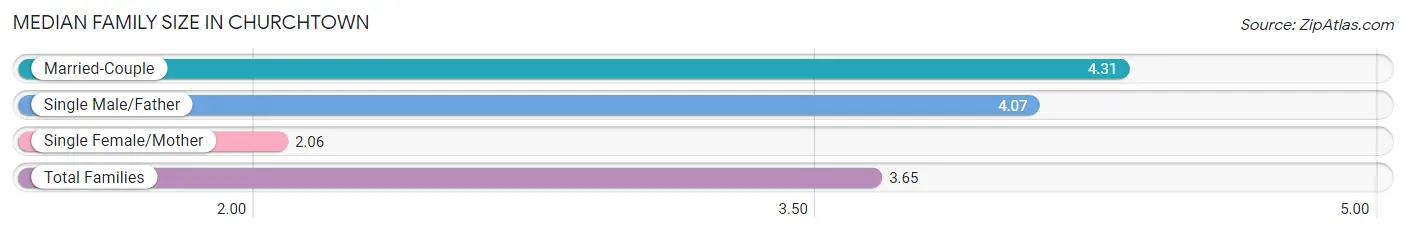
Median Family Size in Churchtown
The median family size in Churchtown is 3.65 persons per family, with married-couple families (58 | 48.7%) accounting for the largest median family size of 4.31 persons per family. On the other hand, single female/mother families (32 | 26.9%) represent the smallest median family size with 2.06 persons per family.
| Family Type | # Families | Family Size |
| Married-Couple | 58 (48.7%) | 4.31 |
| Single Male/Father | 29 (24.4%) | 4.07 |
| Single Female/Mother | 32 (26.9%) | 2.06 |
| Total Families | 119 (100.0%) | 3.65 |
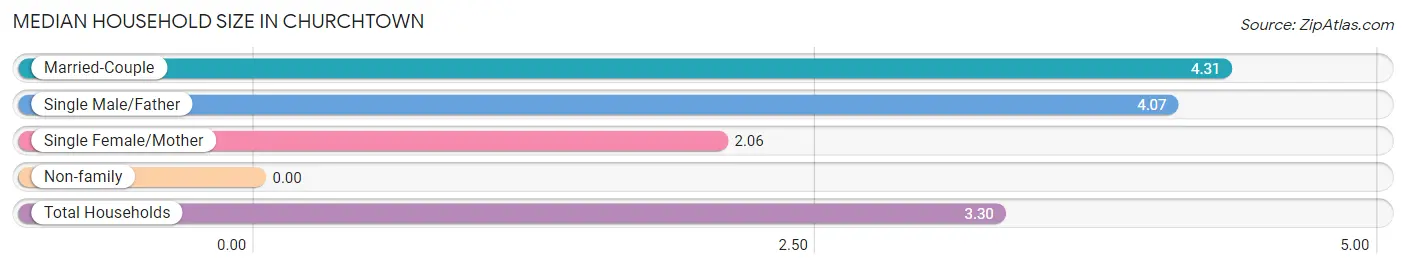
Median Household Size in Churchtown
| Household Type | # Households | Household Size |
| Married-Couple | 58 (42.3%) | 4.31 |
| Single Male/Father | 29 (21.2%) | 4.07 |
| Single Female/Mother | 32 (23.4%) | 2.06 |
| Non-family | 18 (13.1%) | - |
| Total Households | 137 (100.0%) | 3.30 |
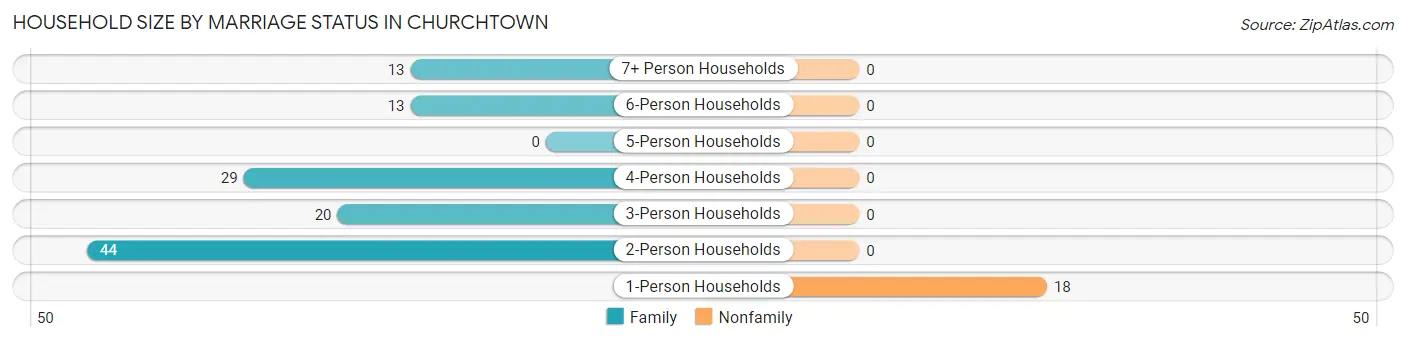
Household Size by Marriage Status in Churchtown
Out of a total of 137 households in Churchtown, 119 (86.9%) are family households, while 18 (13.1%) are nonfamily households. The most numerous type of family households are 2-person households, comprising 44, and the most common type of nonfamily households are 1-person households, comprising 18.
| Household Size | Family Households | Nonfamily Households |
| 1-Person Households | - | 18 (13.1%) |
| 2-Person Households | 44 (32.1%) | 0 (0.0%) |
| 3-Person Households | 20 (14.6%) | 0 (0.0%) |
| 4-Person Households | 29 (21.2%) | 0 (0.0%) |
| 5-Person Households | 0 (0.0%) | 0 (0.0%) |
| 6-Person Households | 13 (9.5%) | 0 (0.0%) |
| 7+ Person Households | 13 (9.5%) | 0 (0.0%) |
| Total | 119 (86.9%) | 18 (13.1%) |
Female Fertility in Churchtown
Fertility by Age in Churchtown
Average fertility rate in Churchtown is 362.0 births per 1,000 women. Women in the age bracket of 20 to 34 years have the highest fertility rate with 500.0 births per 1,000 women. Women in the age bracket of 35 to 50 years acount for 52.0% of all women with births.
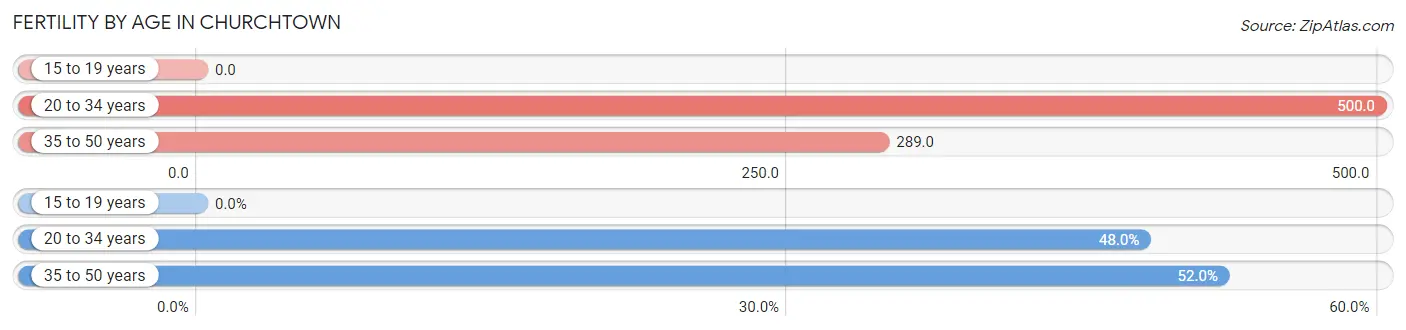
| Age Bracket | Women with Births | Births / 1,000 Women |
| 15 to 19 years | 0 (0.0%) | 0.0 |
| 20 to 34 years | 12 (48.0%) | 500.0 |
| 35 to 50 years | 13 (52.0%) | 289.0 |
| Total | 25 (100.0%) | 362.0 |
Fertility by Age by Marriage Status in Churchtown
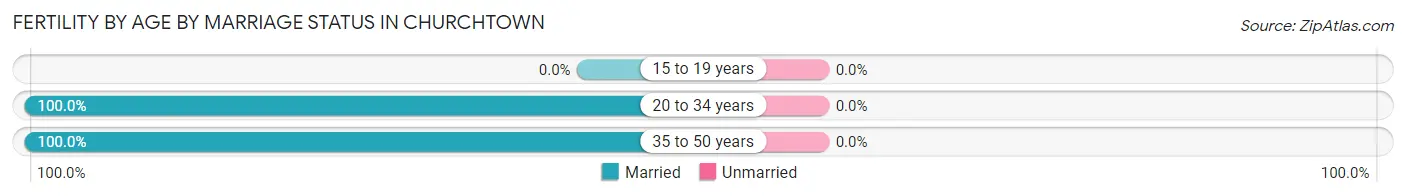
| Age Bracket | Married | Unmarried |
| 15 to 19 years | 0 (0.0%) | 0 (0.0%) |
| 20 to 34 years | 12 (100.0%) | 0 (0.0%) |
| 35 to 50 years | 13 (100.0%) | 0 (0.0%) |
| Total | 25 (100.0%) | 0 (0.0%) |
Fertility by Education in Churchtown
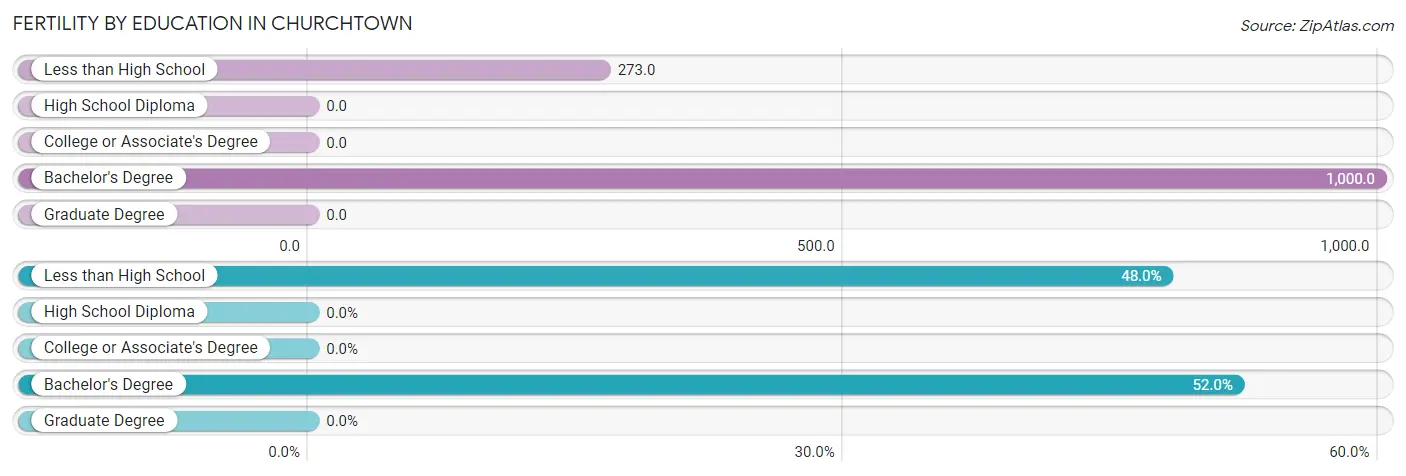
| Educational Attainment | Women with Births | Births / 1,000 Women |
| Less than High School | 12 (48.0%) | 273.0 |
| High School Diploma | 0 (0.0%) | 0.0 |
| College or Associate's Degree | 0 (0.0%) | 0.0 |
| Bachelor's Degree | 13 (52.0%) | 1,000.0 |
| Graduate Degree | 0 (0.0%) | 0.0 |
| Total | 25 (100.0%) | 362.0 |
Fertility by Education by Marriage Status in Churchtown
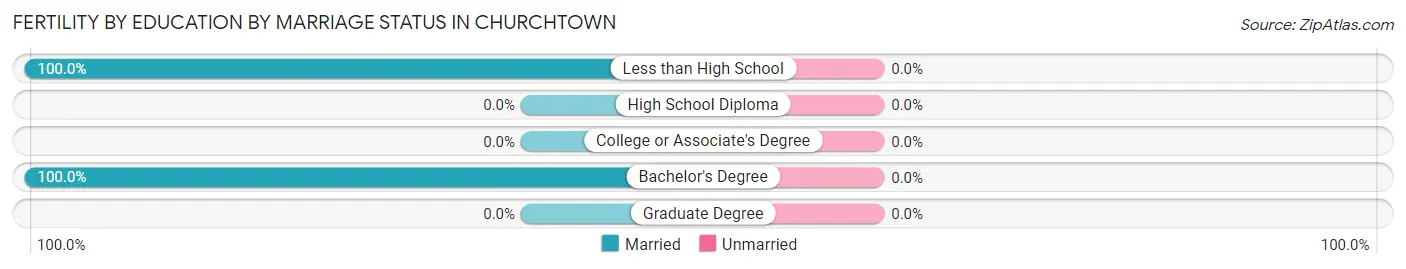
| Educational Attainment | Married | Unmarried |
| Less than High School | 12 (100.0%) | 0 (0.0%) |
| High School Diploma | 0 (0.0%) | 0 (0.0%) |
| College or Associate's Degree | 0 (0.0%) | 0 (0.0%) |
| Bachelor's Degree | 13 (100.0%) | 0 (0.0%) |
| Graduate Degree | 0 (0.0%) | 0 (0.0%) |
| Total | 25 (100.0%) | 0 (0.0%) |
Employment Characteristics in Churchtown
Employment by Class of Employer in Churchtown
Among the 177 employed individuals in Churchtown, self-employed (not incorporated) (61 | 34.5%), not-for-profit organizations (60 | 33.9%), and private company employees (47 | 26.6%) make up the most common classes of employment.
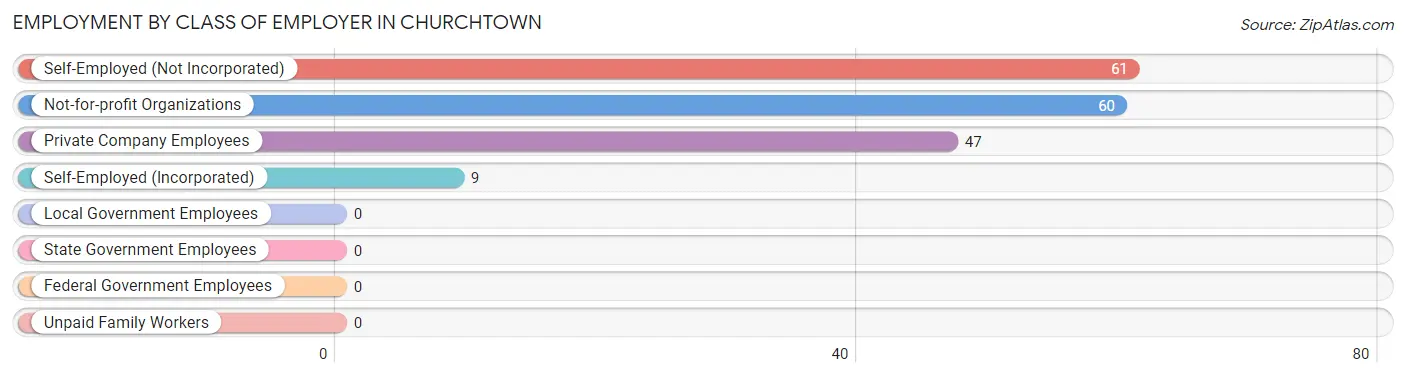
| Employer Class | # Employees | % Employees |
| Private Company Employees | 47 | 26.6% |
| Self-Employed (Incorporated) | 9 | 5.1% |
| Self-Employed (Not Incorporated) | 61 | 34.5% |
| Not-for-profit Organizations | 60 | 33.9% |
| Local Government Employees | 0 | 0.0% |
| State Government Employees | 0 | 0.0% |
| Federal Government Employees | 0 | 0.0% |
| Unpaid Family Workers | 0 | 0.0% |
| Total | 177 | 100.0% |
Employment Status by Age in Churchtown
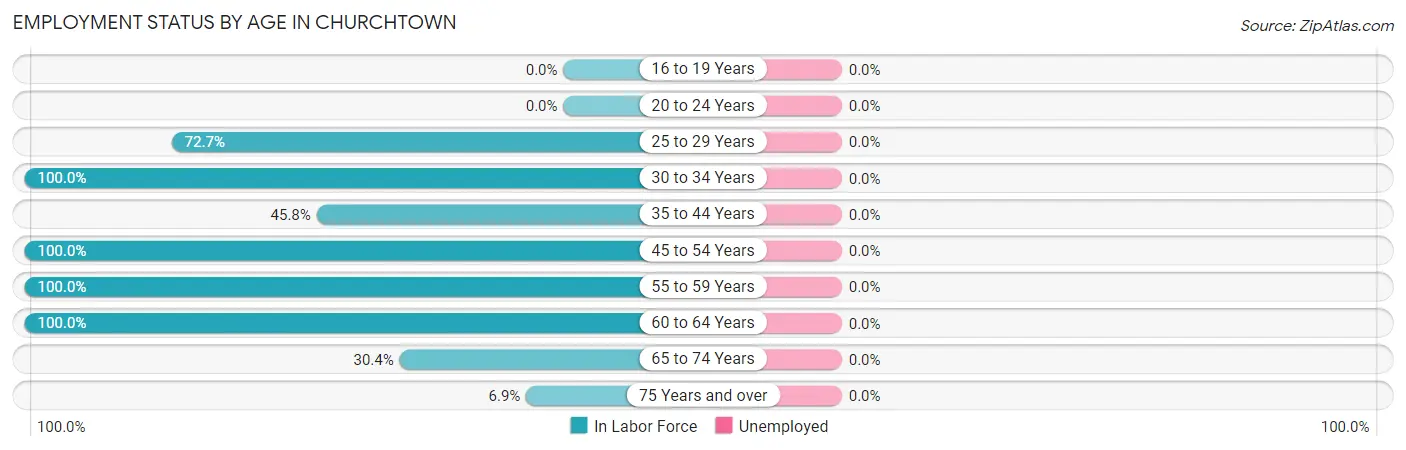
| Age Bracket | In Labor Force | Unemployed |
| 16 to 19 Years | 0 (0.0%) | 0 (0.0%) |
| 20 to 24 Years | 0 (0.0%) | 0 (0.0%) |
| 25 to 29 Years | 24 (72.7%) | 0 (0.0%) |
| 30 to 34 Years | 13 (100.0%) | 0 (0.0%) |
| 35 to 44 Years | 11 (45.8%) | 0 (0.0%) |
| 45 to 54 Years | 70 (100.0%) | 0 (0.0%) |
| 55 to 59 Years | 6 (100.0%) | 0 (0.0%) |
| 60 to 64 Years | 33 (100.0%) | 0 (0.0%) |
| 65 to 74 Years | 14 (30.4%) | 0 (0.0%) |
| 75 Years and over | 6 (6.9%) | 0 (0.0%) |
| Total | 177 (54.6%) | 0 (0.0%) |
Employment Status by Educational Attainment in Churchtown
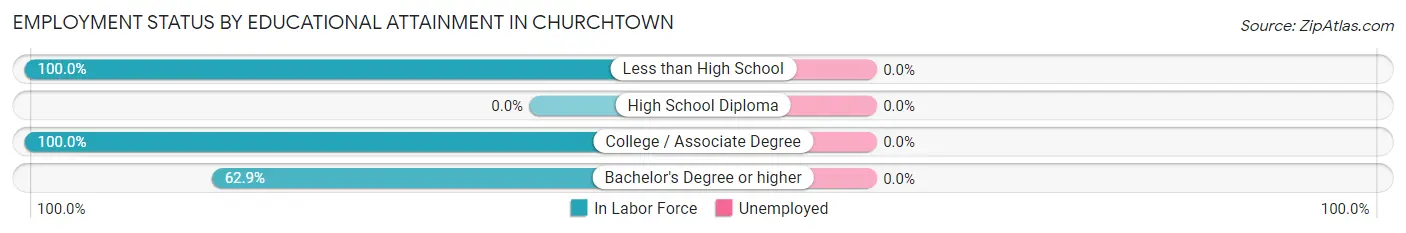
| Educational Attainment | In Labor Force | Unemployed |
| Less than High School | 114 (100.0%) | 0 (0.0%) |
| High School Diploma | 0 (0.0%) | 0 (0.0%) |
| College / Associate Degree | 21 (100.0%) | 0 (0.0%) |
| Bachelor's Degree or higher | 22 (62.9%) | 0 (0.0%) |
| Total | 157 (87.7%) | 0 (0.0%) |
Employment Occupations by Sex in Churchtown
Management, Business, Science and Arts Occupations
The most common Management, Business, Science and Arts occupations in Churchtown are Management (44 | 24.9%), and Business & Financial (5 | 2.8%).
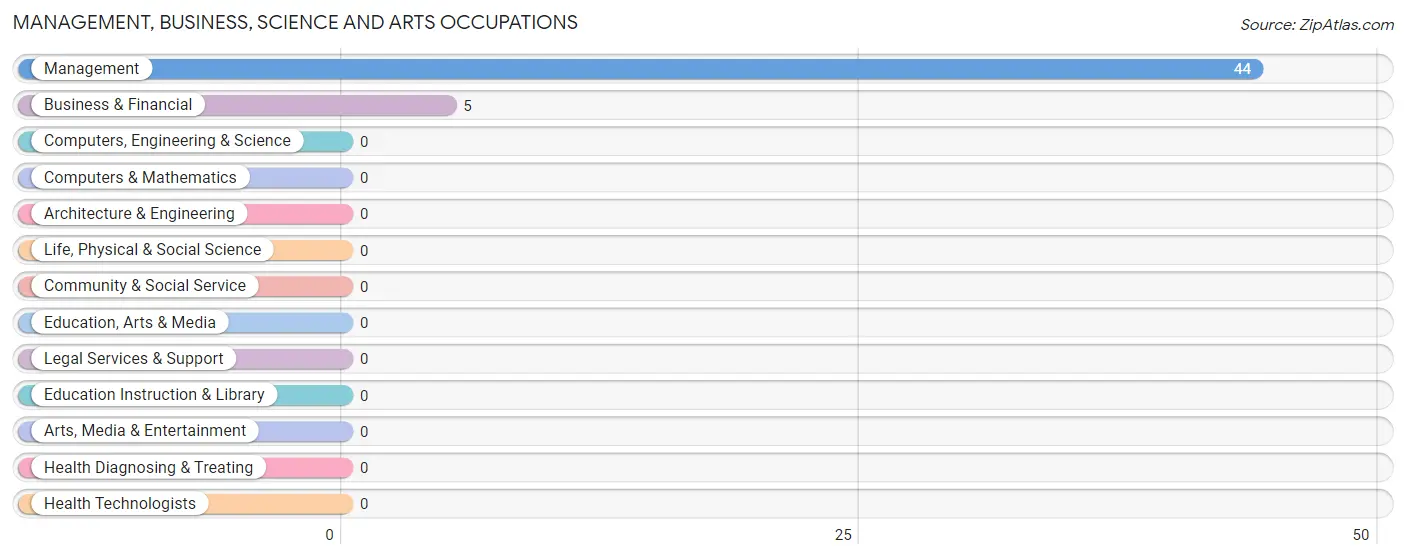
Management, Business, Science and Arts Occupations by Sex
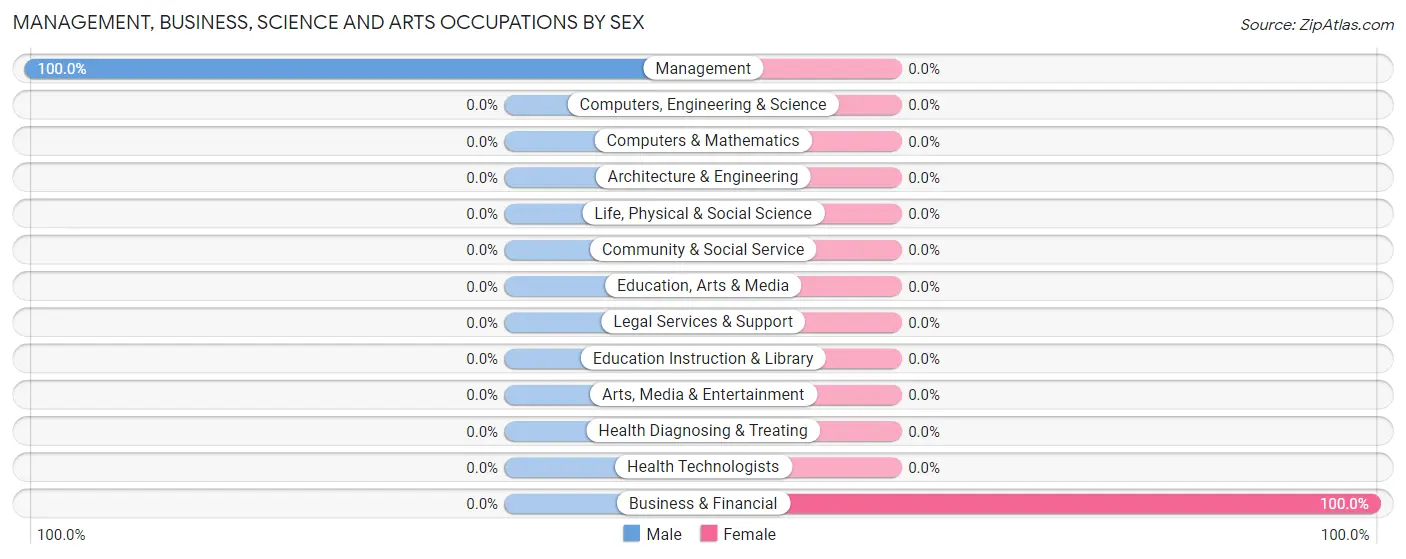
| Occupation | Male | Female |
| Management | 44 (100.0%) | 0 (0.0%) |
| Business & Financial | 0 (0.0%) | 5 (100.0%) |
| Computers, Engineering & Science | 0 (0.0%) | 0 (0.0%) |
| Computers & Mathematics | 0 (0.0%) | 0 (0.0%) |
| Architecture & Engineering | 0 (0.0%) | 0 (0.0%) |
| Life, Physical & Social Science | 0 (0.0%) | 0 (0.0%) |
| Community & Social Service | 0 (0.0%) | 0 (0.0%) |
| Education, Arts & Media | 0 (0.0%) | 0 (0.0%) |
| Legal Services & Support | 0 (0.0%) | 0 (0.0%) |
| Education Instruction & Library | 0 (0.0%) | 0 (0.0%) |
| Arts, Media & Entertainment | 0 (0.0%) | 0 (0.0%) |
| Health Diagnosing & Treating | 0 (0.0%) | 0 (0.0%) |
| Health Technologists | 0 (0.0%) | 0 (0.0%) |
| Total (Category) | 44 (89.8%) | 5 (10.2%) |
| Total (Overall) | 87 (49.1%) | 90 (50.8%) |
Services Occupations
The most common Services occupations in Churchtown are , and Cleaning & Maintenance (6 | 3.4%).
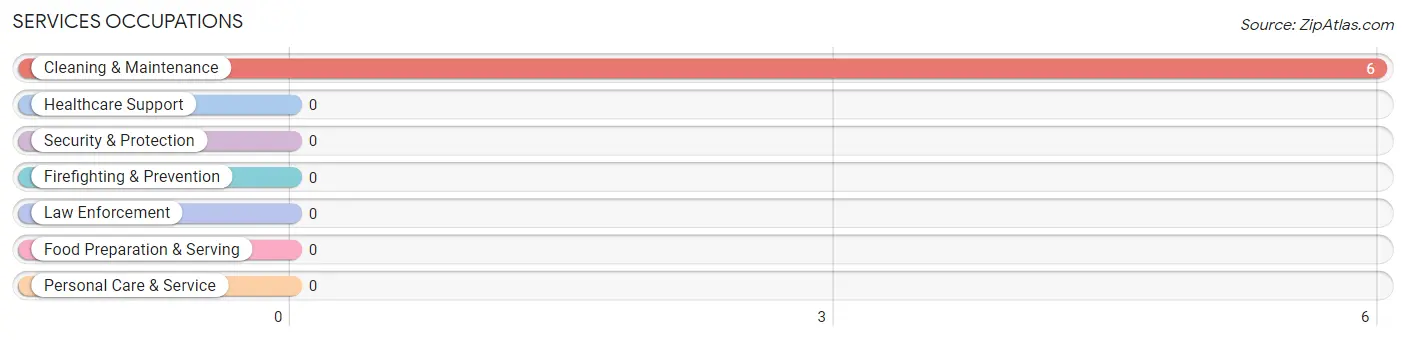
Services Occupations by Sex
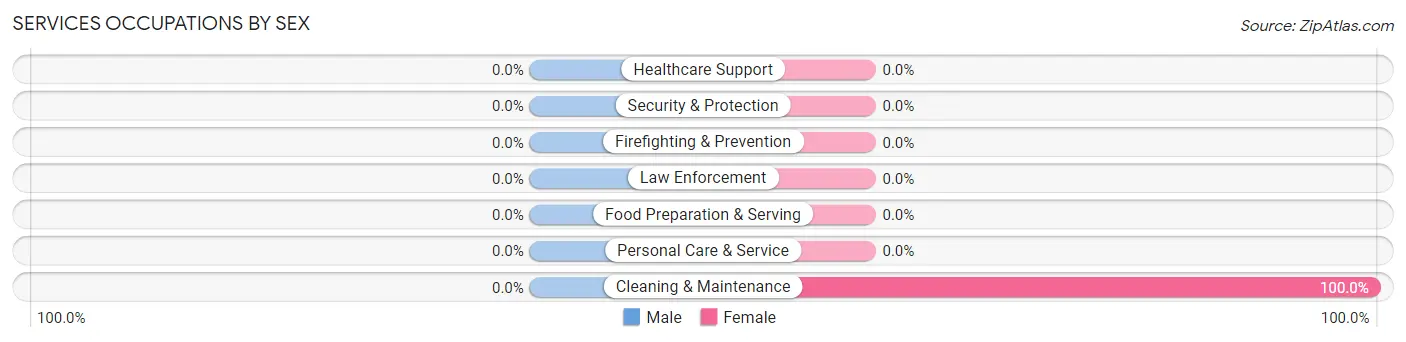
| Occupation | Male | Female |
| Healthcare Support | 0 (0.0%) | 0 (0.0%) |
| Security & Protection | 0 (0.0%) | 0 (0.0%) |
| Firefighting & Prevention | 0 (0.0%) | 0 (0.0%) |
| Law Enforcement | 0 (0.0%) | 0 (0.0%) |
| Food Preparation & Serving | 0 (0.0%) | 0 (0.0%) |
| Cleaning & Maintenance | 0 (0.0%) | 6 (100.0%) |
| Personal Care & Service | 0 (0.0%) | 0 (0.0%) |
| Total (Category) | 0 (0.0%) | 6 (100.0%) |
| Total (Overall) | 87 (49.1%) | 90 (50.8%) |
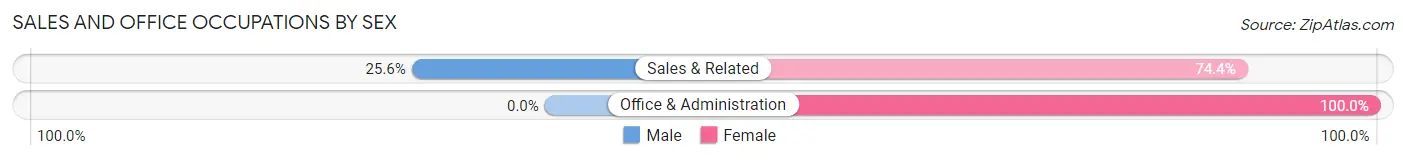
Sales and Office Occupations
The most common Sales and Office occupations in Churchtown are Sales & Related (43 | 24.3%), and Office & Administration (12 | 6.8%).
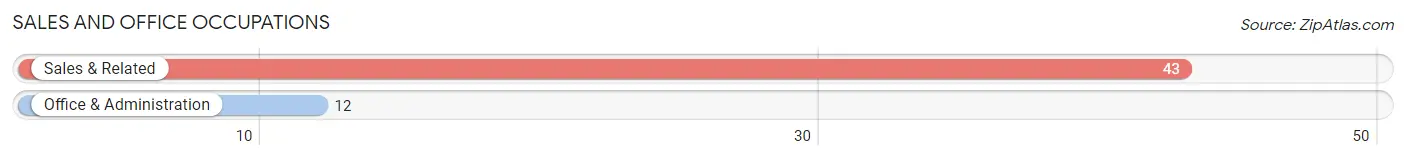
Sales and Office Occupations by Sex
| Occupation | Male | Female |
| Sales & Related | 11 (25.6%) | 32 (74.4%) |
| Office & Administration | 0 (0.0%) | 12 (100.0%) |
| Total (Category) | 11 (20.0%) | 44 (80.0%) |
| Total (Overall) | 87 (49.1%) | 90 (50.8%) |
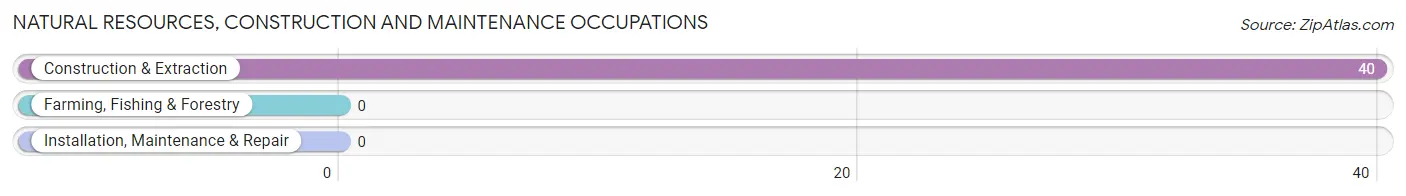
Natural Resources, Construction and Maintenance Occupations
The most common Natural Resources, Construction and Maintenance occupations in Churchtown are , and Construction & Extraction (40 | 22.6%).
Natural Resources, Construction and Maintenance Occupations by Sex
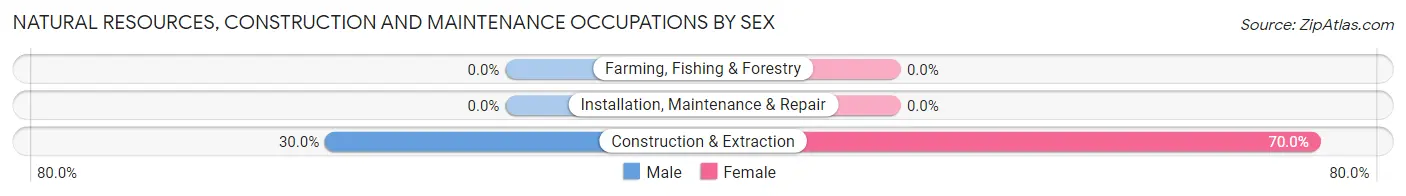
| Occupation | Male | Female |
| Farming, Fishing & Forestry | 0 (0.0%) | 0 (0.0%) |
| Construction & Extraction | 12 (30.0%) | 28 (70.0%) |
| Installation, Maintenance & Repair | 0 (0.0%) | 0 (0.0%) |
| Total (Category) | 12 (30.0%) | 28 (70.0%) |
| Total (Overall) | 87 (49.1%) | 90 (50.8%) |
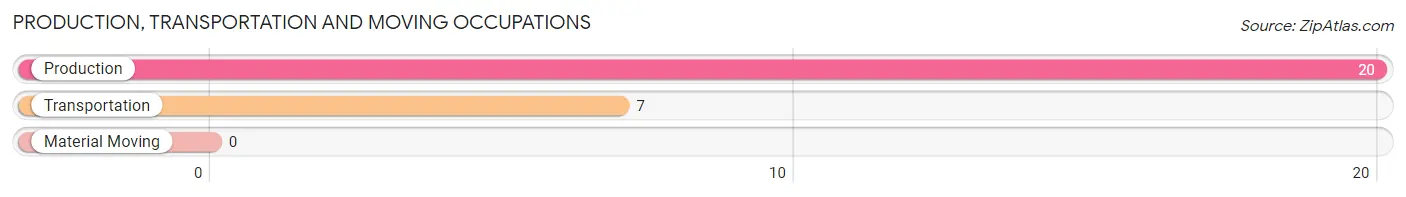
Production, Transportation and Moving Occupations
The most common Production, Transportation and Moving occupations in Churchtown are Production (20 | 11.3%), and Transportation (7 | 4.0%).
Production, Transportation and Moving Occupations by Sex
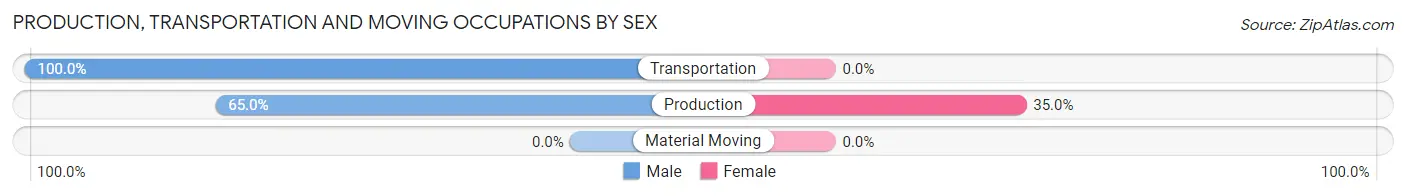
| Occupation | Male | Female |
| Production | 13 (65.0%) | 7 (35.0%) |
| Transportation | 7 (100.0%) | 0 (0.0%) |
| Material Moving | 0 (0.0%) | 0 (0.0%) |
| Total (Category) | 20 (74.1%) | 7 (25.9%) |
| Total (Overall) | 87 (49.1%) | 90 (50.8%) |
Employment Industries by Sex in Churchtown
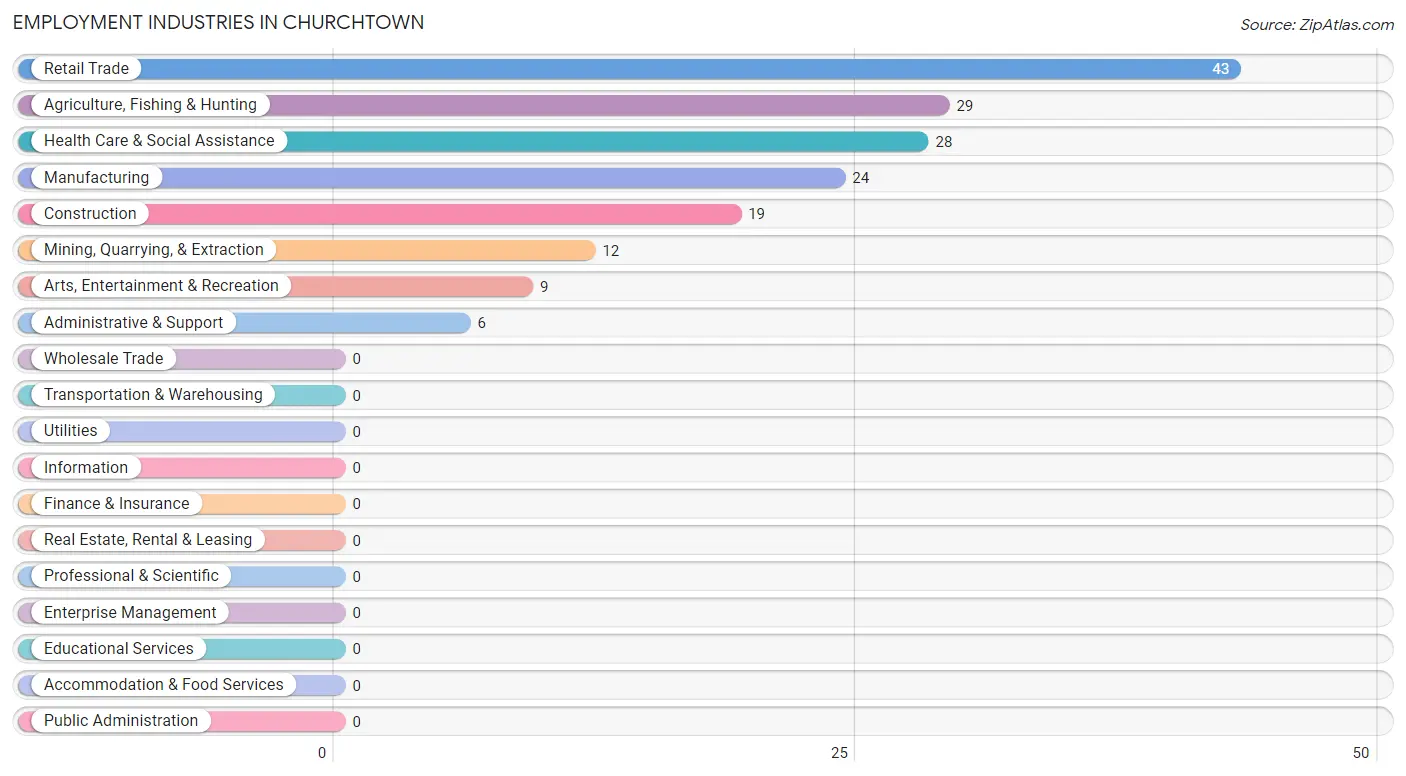
Employment Industries in Churchtown
The major employment industries in Churchtown include Retail Trade (43 | 24.3%), Agriculture, Fishing & Hunting (29 | 16.4%), Health Care & Social Assistance (28 | 15.8%), Manufacturing (24 | 13.6%), and Construction (19 | 10.7%).
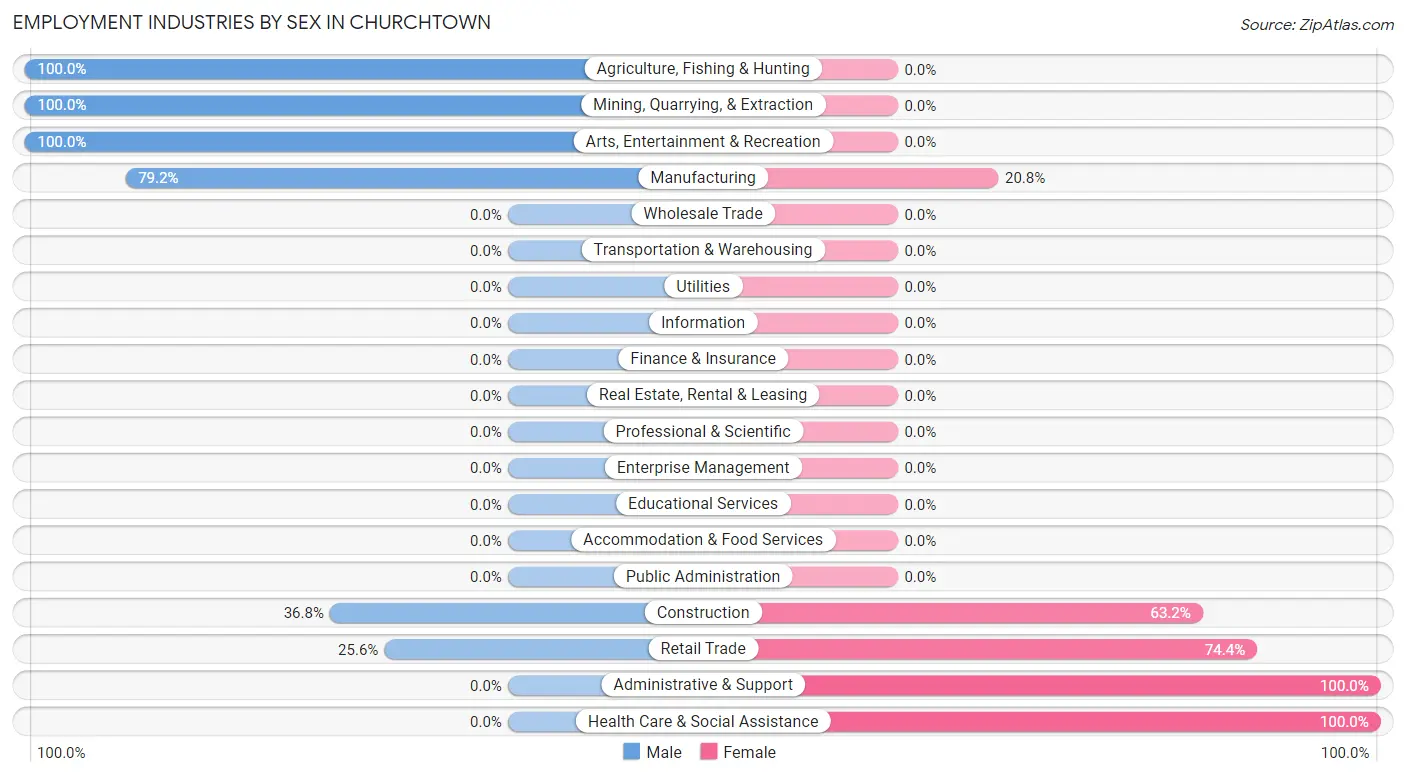
Employment Industries by Sex in Churchtown
The Churchtown industries that see more men than women are Agriculture, Fishing & Hunting (100.0%), Mining, Quarrying, & Extraction (100.0%), and Arts, Entertainment & Recreation (100.0%), whereas the industries that tend to have a higher number of women are Administrative & Support (100.0%), Health Care & Social Assistance (100.0%), and Retail Trade (74.4%).
| Industry | Male | Female |
| Agriculture, Fishing & Hunting | 29 (100.0%) | 0 (0.0%) |
| Mining, Quarrying, & Extraction | 12 (100.0%) | 0 (0.0%) |
| Construction | 7 (36.8%) | 12 (63.2%) |
| Manufacturing | 19 (79.2%) | 5 (20.8%) |
| Wholesale Trade | 0 (0.0%) | 0 (0.0%) |
| Retail Trade | 11 (25.6%) | 32 (74.4%) |
| Transportation & Warehousing | 0 (0.0%) | 0 (0.0%) |
| Utilities | 0 (0.0%) | 0 (0.0%) |
| Information | 0 (0.0%) | 0 (0.0%) |
| Finance & Insurance | 0 (0.0%) | 0 (0.0%) |
| Real Estate, Rental & Leasing | 0 (0.0%) | 0 (0.0%) |
| Professional & Scientific | 0 (0.0%) | 0 (0.0%) |
| Enterprise Management | 0 (0.0%) | 0 (0.0%) |
| Administrative & Support | 0 (0.0%) | 6 (100.0%) |
| Educational Services | 0 (0.0%) | 0 (0.0%) |
| Health Care & Social Assistance | 0 (0.0%) | 28 (100.0%) |
| Arts, Entertainment & Recreation | 9 (100.0%) | 0 (0.0%) |
| Accommodation & Food Services | 0 (0.0%) | 0 (0.0%) |
| Public Administration | 0 (0.0%) | 0 (0.0%) |
| Total | 87 (49.1%) | 90 (50.8%) |
Education in Churchtown
School Enrollment in Churchtown
The most common levels of schooling among the 59 students in Churchtown are elementary school (45 | 76.3%), and middle school (14 | 23.7%).
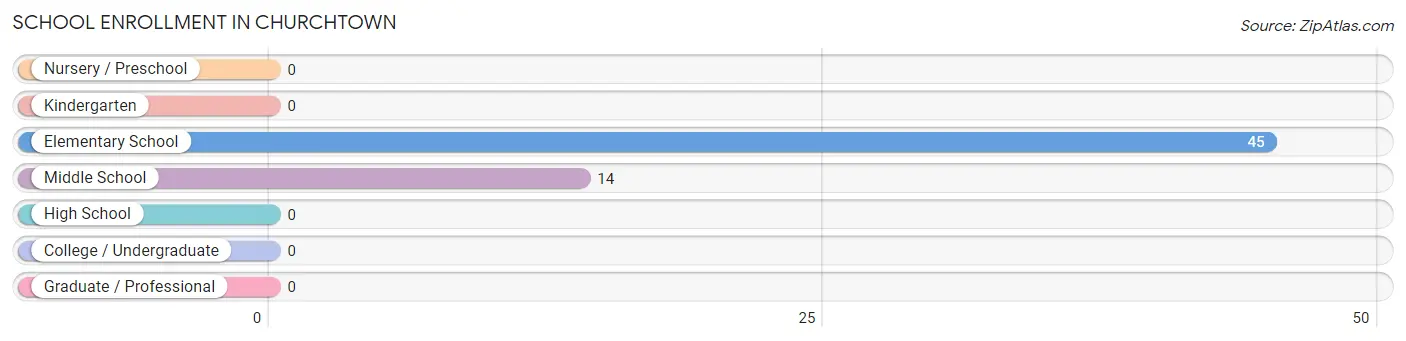
| School Level | # Students | % Students |
| Nursery / Preschool | 0 | 0.0% |
| Kindergarten | 0 | 0.0% |
| Elementary School | 45 | 76.3% |
| Middle School | 14 | 23.7% |
| High School | 0 | 0.0% |
| College / Undergraduate | 0 | 0.0% |
| Graduate / Professional | 0 | 0.0% |
| Total | 59 | 100.0% |
School Enrollment by Age by Funding Source in Churchtown
Out of a total of 59 students who are enrolled in schools in Churchtown, 45 (76.3%) attend a private institution, while the remaining 14 (23.7%) are enrolled in public schools. The age group of 5 to 9 year old has the highest likelihood of being enrolled in private schools, with 39 (100.0% in the age bracket) enrolled. Conversely, the age group of 10 to 14 year olds has the lowest likelihood of being enrolled in a private school, with 14 (70.0% in the age bracket) attending a public institution.
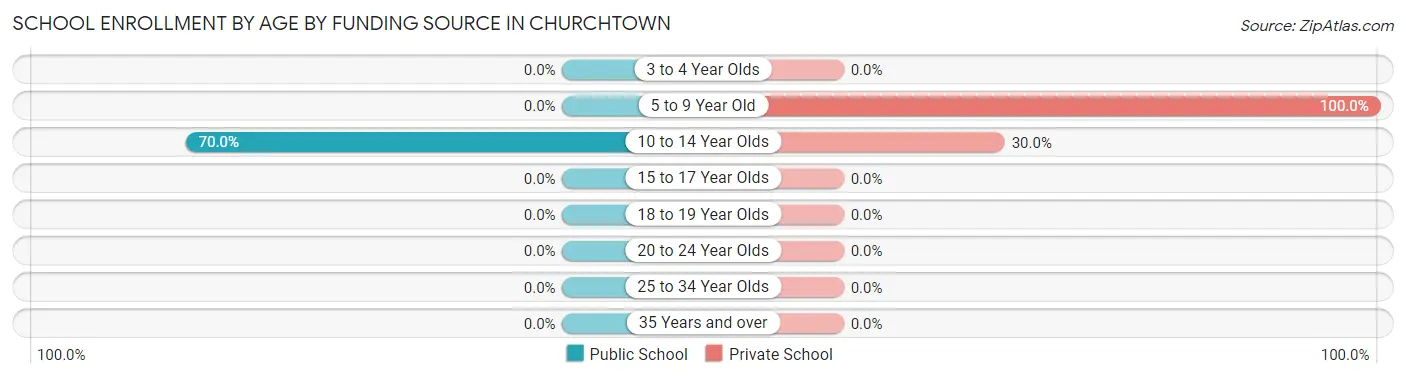
| Age Bracket | Public School | Private School |
| 3 to 4 Year Olds | 0 (0.0%) | 0 (0.0%) |
| 5 to 9 Year Old | 0 (0.0%) | 39 (100.0%) |
| 10 to 14 Year Olds | 14 (70.0%) | 6 (30.0%) |
| 15 to 17 Year Olds | 0 (0.0%) | 0 (0.0%) |
| 18 to 19 Year Olds | 0 (0.0%) | 0 (0.0%) |
| 20 to 24 Year Olds | 0 (0.0%) | 0 (0.0%) |
| 25 to 34 Year Olds | 0 (0.0%) | 0 (0.0%) |
| 35 Years and over | 0 (0.0%) | 0 (0.0%) |
| Total | 14 (23.7%) | 45 (76.3%) |
Educational Attainment by Field of Study in Churchtown
Education (13 | 37.1%), business (11 | 31.4%), and liberal arts & history (11 | 31.4%) are the most common fields of study among 35 individuals in Churchtown who have obtained a bachelor's degree or higher.
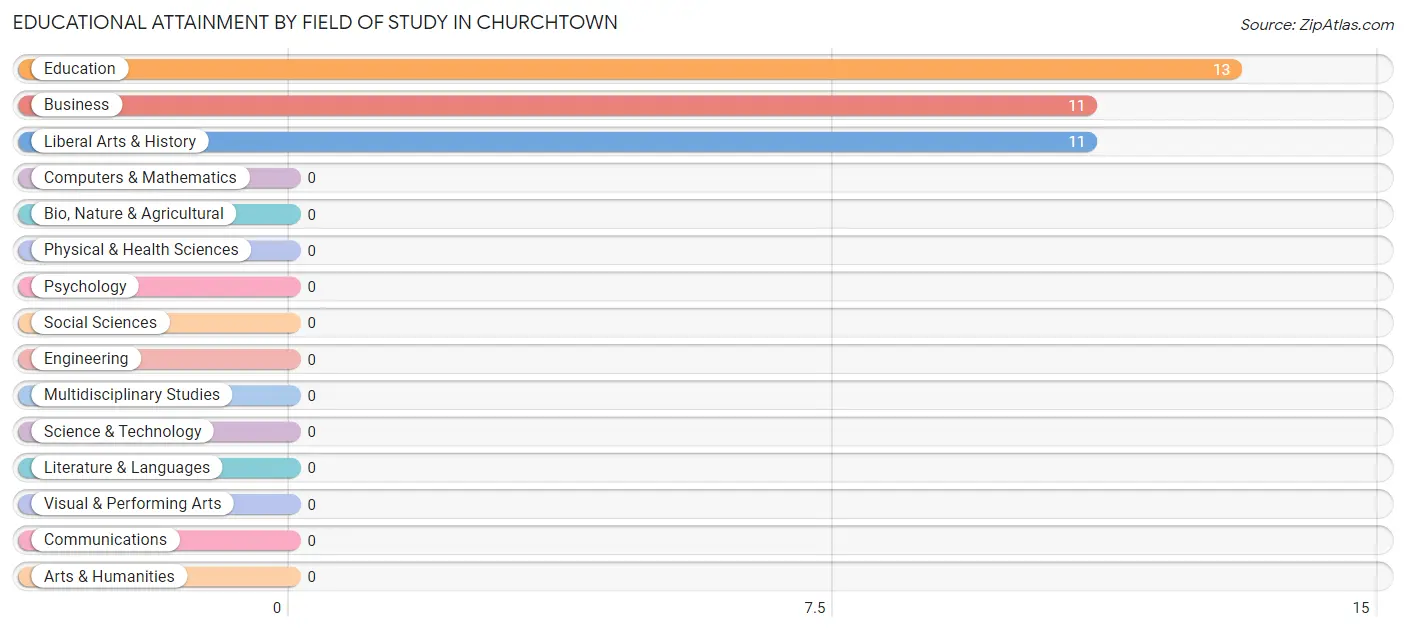
| Field of Study | # Graduates | % Graduates |
| Computers & Mathematics | 0 | 0.0% |
| Bio, Nature & Agricultural | 0 | 0.0% |
| Physical & Health Sciences | 0 | 0.0% |
| Psychology | 0 | 0.0% |
| Social Sciences | 0 | 0.0% |
| Engineering | 0 | 0.0% |
| Multidisciplinary Studies | 0 | 0.0% |
| Science & Technology | 0 | 0.0% |
| Business | 11 | 31.4% |
| Education | 13 | 37.1% |
| Literature & Languages | 0 | 0.0% |
| Liberal Arts & History | 11 | 31.4% |
| Visual & Performing Arts | 0 | 0.0% |
| Communications | 0 | 0.0% |
| Arts & Humanities | 0 | 0.0% |
| Total | 35 | 100.0% |
Transportation & Commute in Churchtown
Vehicle Availability by Sex in Churchtown
The most prevalent vehicle ownership categories in Churchtown are males with no vehicle (42, accounting for 48.3%) and females with no vehicle (85, making up 46.7%).
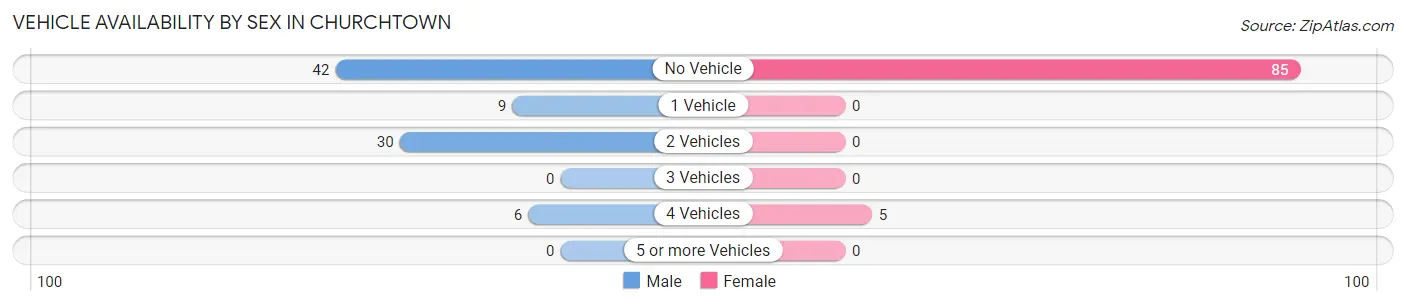
| Vehicles Available | Male | Female |
| No Vehicle | 42 (48.3%) | 85 (94.4%) |
| 1 Vehicle | 9 (10.3%) | 0 (0.0%) |
| 2 Vehicles | 30 (34.5%) | 0 (0.0%) |
| 3 Vehicles | 0 (0.0%) | 0 (0.0%) |
| 4 Vehicles | 6 (6.9%) | 5 (5.6%) |
| 5 or more Vehicles | 0 (0.0%) | 0 (0.0%) |
| Total | 87 (100.0%) | 90 (100.0%) |
Commute Time in Churchtown
The most frequently occuring commute durations in Churchtown are 20 to 24 minutes (32 commuters, 24.2%), 25 to 29 minutes (28 commuters, 21.2%), and less than 5 minutes (25 commuters, 18.9%).
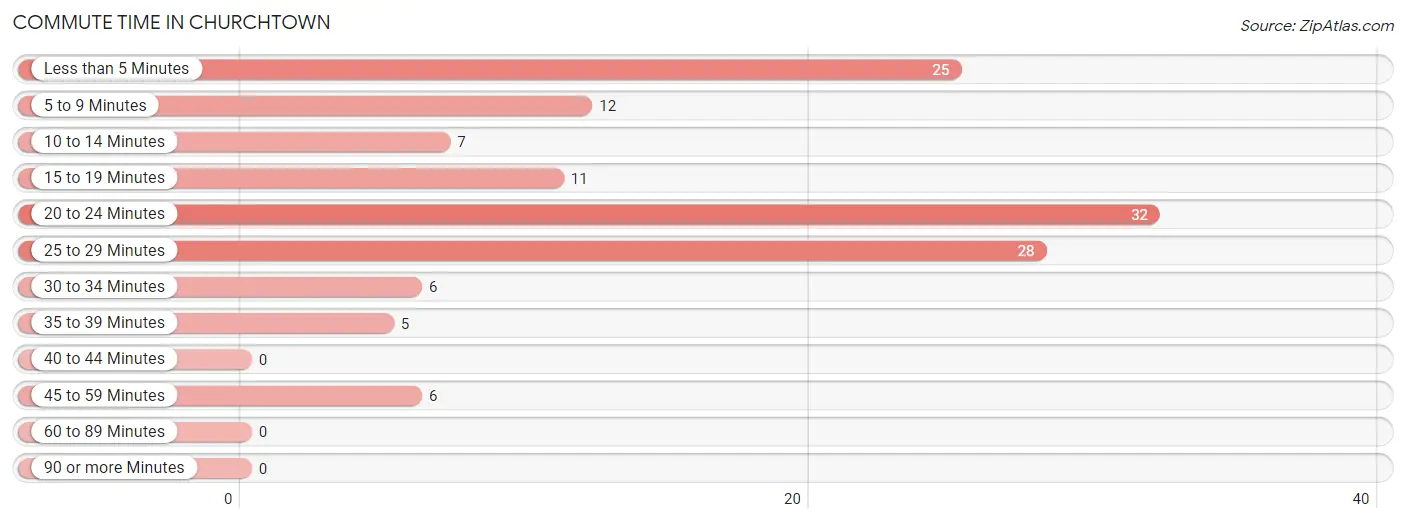
| Commute Time | # Commuters | % Commuters |
| Less than 5 Minutes | 25 | 18.9% |
| 5 to 9 Minutes | 12 | 9.1% |
| 10 to 14 Minutes | 7 | 5.3% |
| 15 to 19 Minutes | 11 | 8.3% |
| 20 to 24 Minutes | 32 | 24.2% |
| 25 to 29 Minutes | 28 | 21.2% |
| 30 to 34 Minutes | 6 | 4.5% |
| 35 to 39 Minutes | 5 | 3.8% |
| 40 to 44 Minutes | 0 | 0.0% |
| 45 to 59 Minutes | 6 | 4.5% |
| 60 to 89 Minutes | 0 | 0.0% |
| 90 or more Minutes | 0 | 0.0% |
Commute Time by Sex in Churchtown
The most common commute times in Churchtown are less than 5 minutes (13 commuters, 26.5%) for males and 20 to 24 minutes (32 commuters, 38.6%) for females.
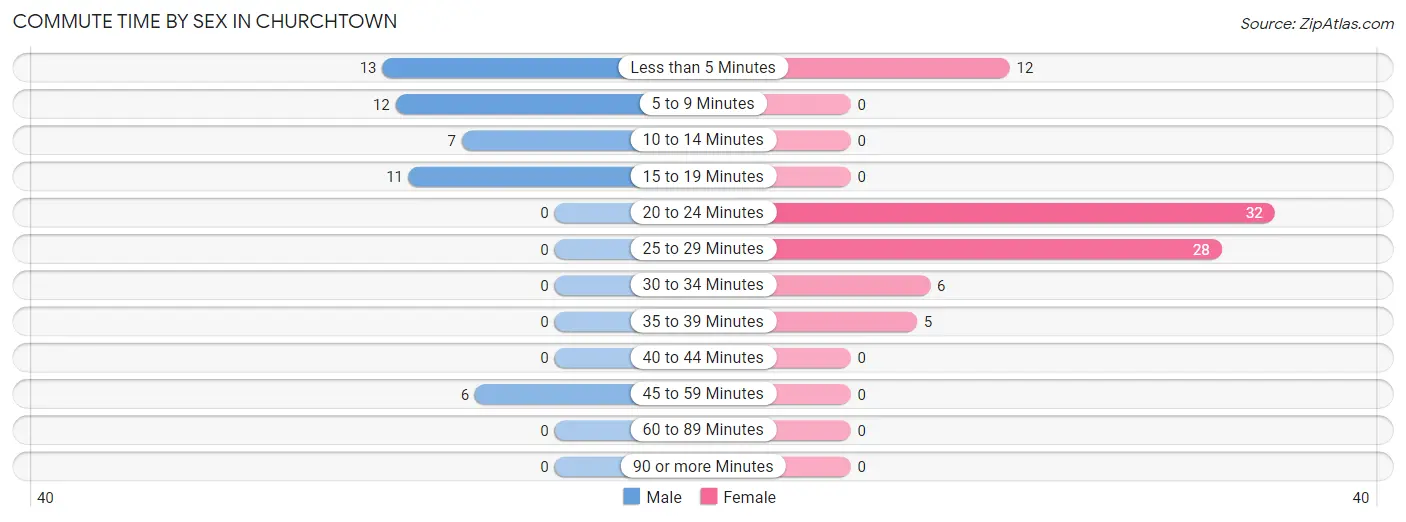
| Commute Time | Male | Female |
| Less than 5 Minutes | 13 (26.5%) | 12 (14.5%) |
| 5 to 9 Minutes | 12 (24.5%) | 0 (0.0%) |
| 10 to 14 Minutes | 7 (14.3%) | 0 (0.0%) |
| 15 to 19 Minutes | 11 (22.5%) | 0 (0.0%) |
| 20 to 24 Minutes | 0 (0.0%) | 32 (38.6%) |
| 25 to 29 Minutes | 0 (0.0%) | 28 (33.7%) |
| 30 to 34 Minutes | 0 (0.0%) | 6 (7.2%) |
| 35 to 39 Minutes | 0 (0.0%) | 5 (6.0%) |
| 40 to 44 Minutes | 0 (0.0%) | 0 (0.0%) |
| 45 to 59 Minutes | 6 (12.2%) | 0 (0.0%) |
| 60 to 89 Minutes | 0 (0.0%) | 0 (0.0%) |
| 90 or more Minutes | 0 (0.0%) | 0 (0.0%) |
Time of Departure to Work by Sex in Churchtown
The most frequent times of departure to work in Churchtown are 5:00 AM to 5:29 AM (13, 26.5%) for males and 6:30 AM to 6:59 AM (32, 38.6%) for females.
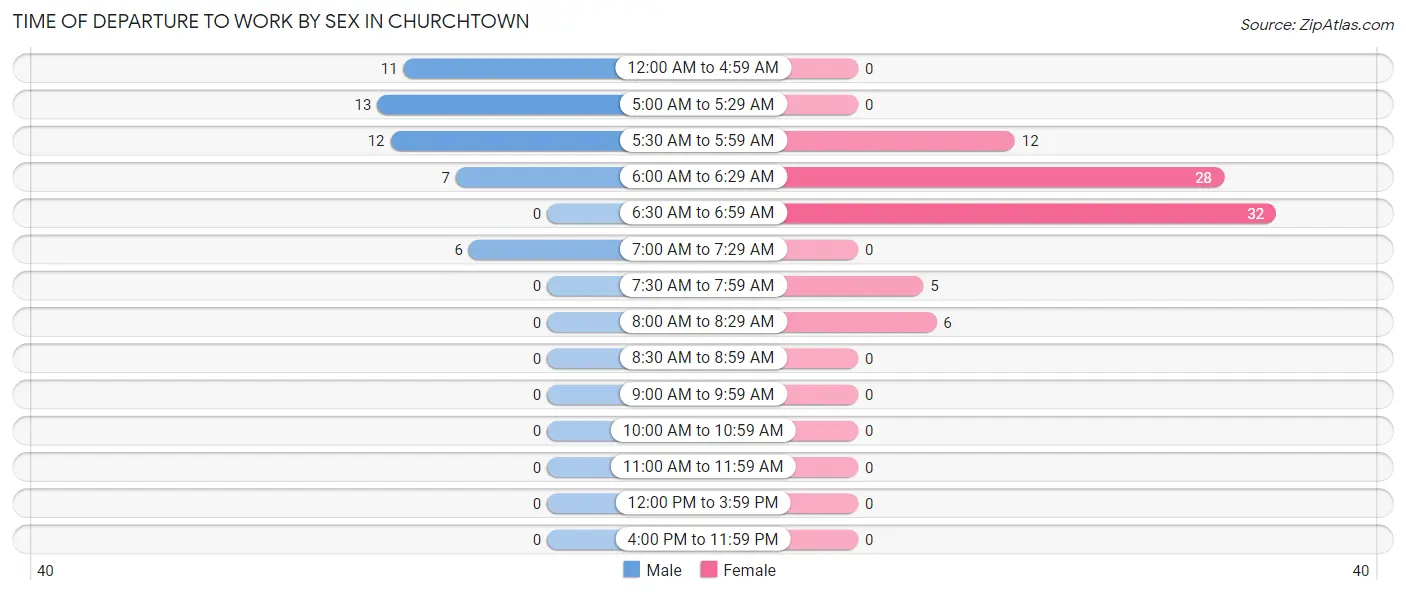
| Time of Departure | Male | Female |
| 12:00 AM to 4:59 AM | 11 (22.5%) | 0 (0.0%) |
| 5:00 AM to 5:29 AM | 13 (26.5%) | 0 (0.0%) |
| 5:30 AM to 5:59 AM | 12 (24.5%) | 12 (14.5%) |
| 6:00 AM to 6:29 AM | 7 (14.3%) | 28 (33.7%) |
| 6:30 AM to 6:59 AM | 0 (0.0%) | 32 (38.6%) |
| 7:00 AM to 7:29 AM | 6 (12.2%) | 0 (0.0%) |
| 7:30 AM to 7:59 AM | 0 (0.0%) | 5 (6.0%) |
| 8:00 AM to 8:29 AM | 0 (0.0%) | 6 (7.2%) |
| 8:30 AM to 8:59 AM | 0 (0.0%) | 0 (0.0%) |
| 9:00 AM to 9:59 AM | 0 (0.0%) | 0 (0.0%) |
| 10:00 AM to 10:59 AM | 0 (0.0%) | 0 (0.0%) |
| 11:00 AM to 11:59 AM | 0 (0.0%) | 0 (0.0%) |
| 12:00 PM to 3:59 PM | 0 (0.0%) | 0 (0.0%) |
| 4:00 PM to 11:59 PM | 0 (0.0%) | 0 (0.0%) |
| Total | 49 (100.0%) | 83 (100.0%) |
Housing Occupancy in Churchtown
Occupancy by Ownership in Churchtown
Of the total 137 dwellings in Churchtown, owner-occupied units account for 90 (65.7%), while renter-occupied units make up 47 (34.3%).
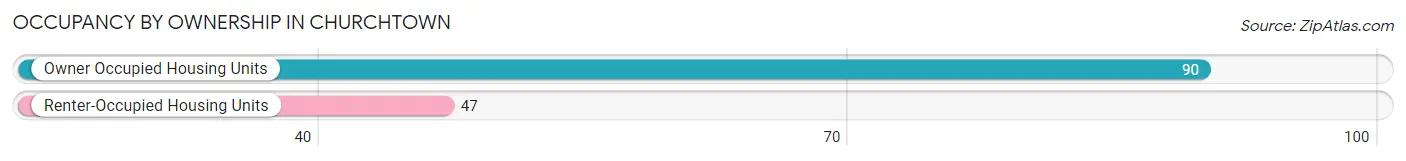
| Occupancy | # Housing Units | % Housing Units |
| Owner Occupied Housing Units | 90 | 65.7% |
| Renter-Occupied Housing Units | 47 | 34.3% |
| Total Occupied Housing Units | 137 | 100.0% |
Occupancy by Household Size in Churchtown
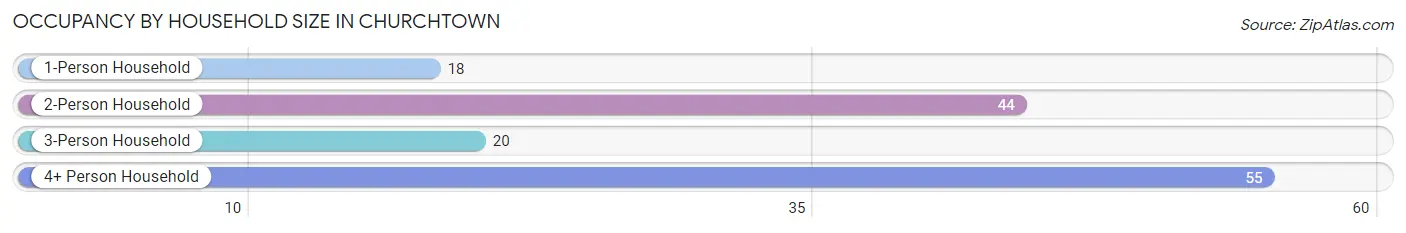
| Household Size | # Housing Units | % Housing Units |
| 1-Person Household | 18 | 13.1% |
| 2-Person Household | 44 | 32.1% |
| 3-Person Household | 20 | 14.6% |
| 4+ Person Household | 55 | 40.2% |
| Total Housing Units | 137 | 100.0% |
Occupancy by Ownership by Household Size in Churchtown
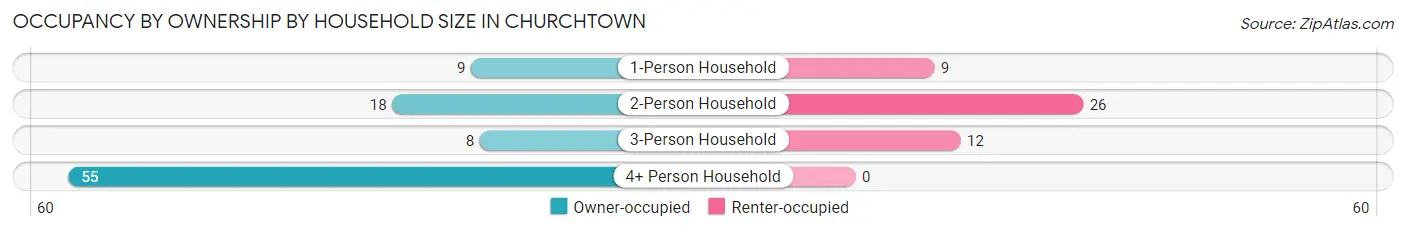
| Household Size | Owner-occupied | Renter-occupied |
| 1-Person Household | 9 (50.0%) | 9 (50.0%) |
| 2-Person Household | 18 (40.9%) | 26 (59.1%) |
| 3-Person Household | 8 (40.0%) | 12 (60.0%) |
| 4+ Person Household | 55 (100.0%) | 0 (0.0%) |
| Total Housing Units | 90 (65.7%) | 47 (34.3%) |
Occupancy by Educational Attainment in Churchtown
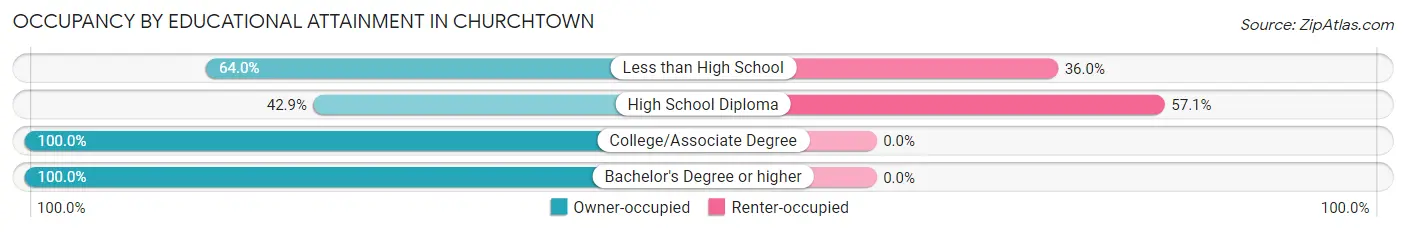
| Household Size | Owner-occupied | Renter-occupied |
| Less than High School | 48 (64.0%) | 27 (36.0%) |
| High School Diploma | 15 (42.9%) | 20 (57.1%) |
| College/Associate Degree | 9 (100.0%) | 0 (0.0%) |
| Bachelor's Degree or higher | 18 (100.0%) | 0 (0.0%) |
Occupancy by Age of Householder in Churchtown
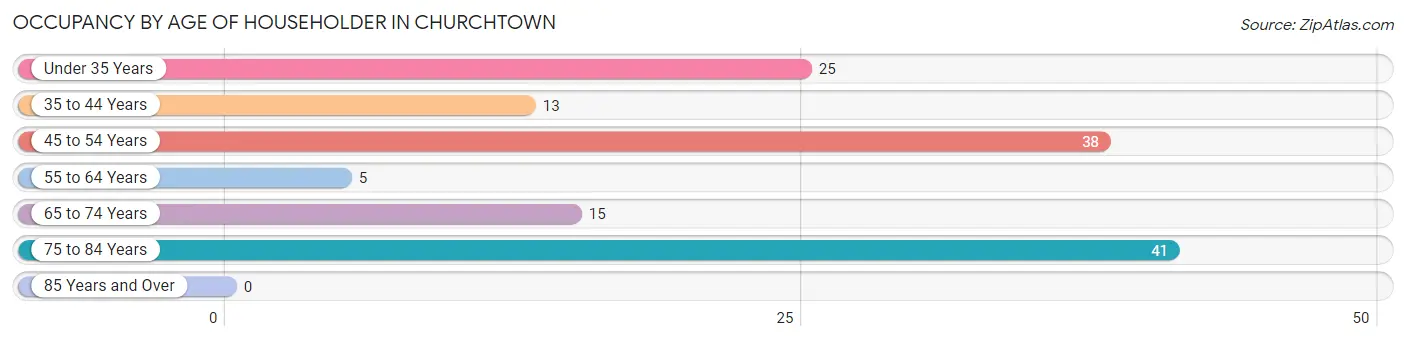
| Age Bracket | # Households | % Households |
| Under 35 Years | 25 | 18.2% |
| 35 to 44 Years | 13 | 9.5% |
| 45 to 54 Years | 38 | 27.7% |
| 55 to 64 Years | 5 | 3.6% |
| 65 to 74 Years | 15 | 11.0% |
| 75 to 84 Years | 41 | 29.9% |
| 85 Years and Over | 0 | 0.0% |
| Total | 137 | 100.0% |
Housing Finances in Churchtown
Median Income by Occupancy in Churchtown
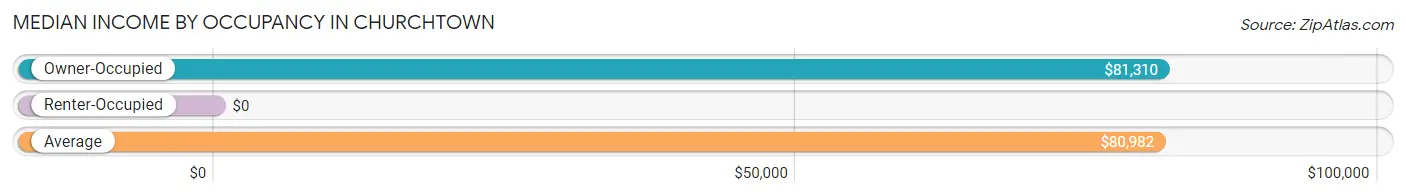
| Occupancy Type | # Households | Median Income |
| Owner-Occupied | 90 (65.7%) | $81,310 |
| Renter-Occupied | 47 (34.3%) | $0 |
| Average | 137 (100.0%) | $80,982 |
Occupancy by Householder Income Bracket in Churchtown
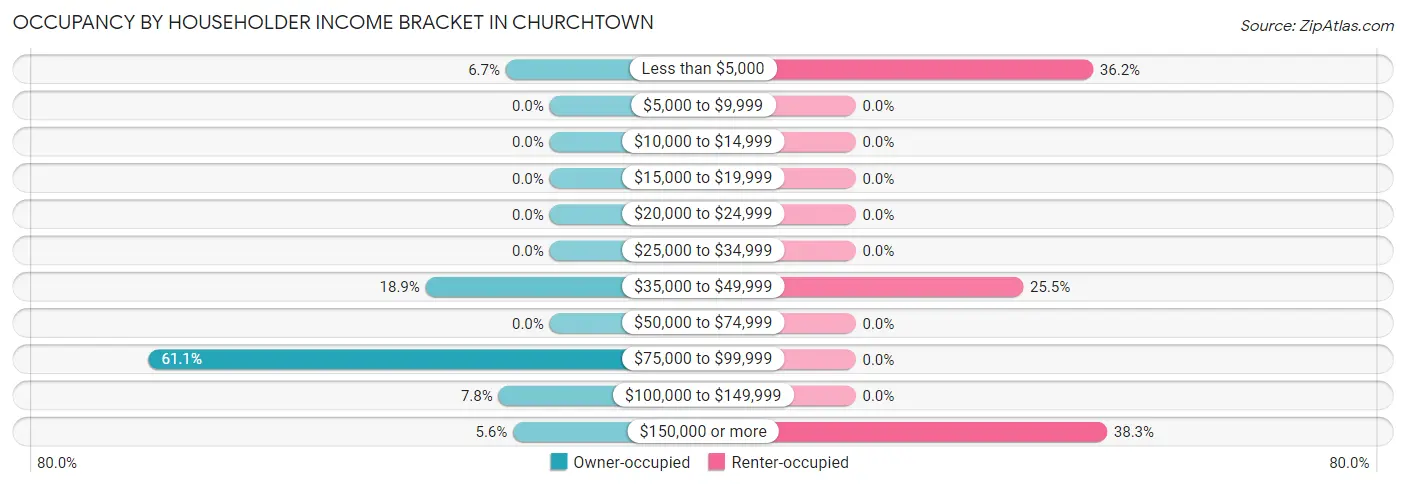
| Income Bracket | Owner-occupied | Renter-occupied |
| Less than $5,000 | 6 (6.7%) | 17 (36.2%) |
| $5,000 to $9,999 | 0 (0.0%) | 0 (0.0%) |
| $10,000 to $14,999 | 0 (0.0%) | 0 (0.0%) |
| $15,000 to $19,999 | 0 (0.0%) | 0 (0.0%) |
| $20,000 to $24,999 | 0 (0.0%) | 0 (0.0%) |
| $25,000 to $34,999 | 0 (0.0%) | 0 (0.0%) |
| $35,000 to $49,999 | 17 (18.9%) | 12 (25.5%) |
| $50,000 to $74,999 | 0 (0.0%) | 0 (0.0%) |
| $75,000 to $99,999 | 55 (61.1%) | 0 (0.0%) |
| $100,000 to $149,999 | 7 (7.8%) | 0 (0.0%) |
| $150,000 or more | 5 (5.6%) | 18 (38.3%) |
| Total | 90 (100.0%) | 47 (100.0%) |
Monthly Housing Cost Tiers in Churchtown
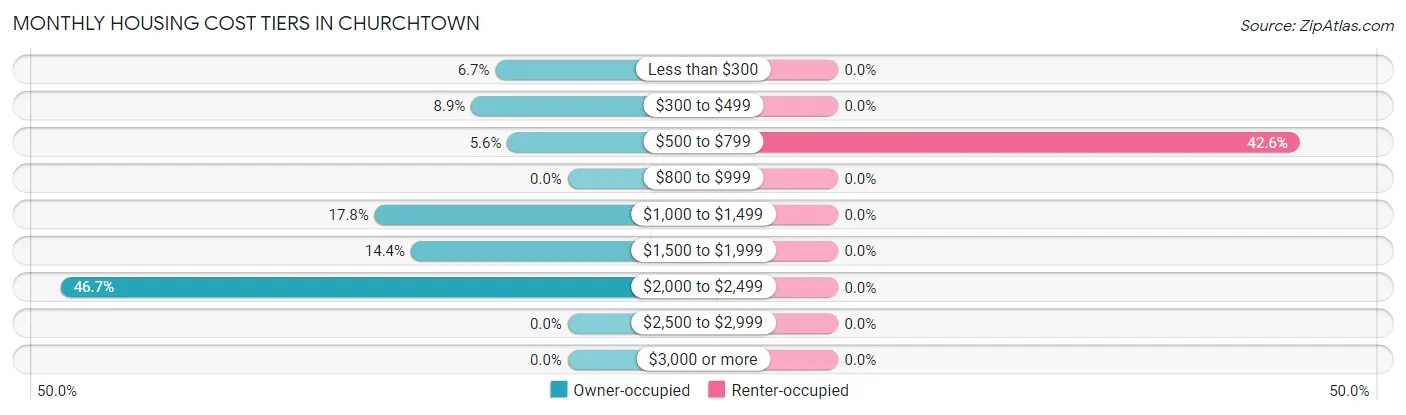
| Monthly Cost | Owner-occupied | Renter-occupied |
| Less than $300 | 6 (6.7%) | 0 (0.0%) |
| $300 to $499 | 8 (8.9%) | 0 (0.0%) |
| $500 to $799 | 5 (5.6%) | 20 (42.5%) |
| $800 to $999 | 0 (0.0%) | 0 (0.0%) |
| $1,000 to $1,499 | 16 (17.8%) | 0 (0.0%) |
| $1,500 to $1,999 | 13 (14.4%) | 0 (0.0%) |
| $2,000 to $2,499 | 42 (46.7%) | 0 (0.0%) |
| $2,500 to $2,999 | 0 (0.0%) | 0 (0.0%) |
| $3,000 or more | 0 (0.0%) | 0 (0.0%) |
| Total | 90 (100.0%) | 47 (100.0%) |
Physical Housing Characteristics in Churchtown
Housing Structures in Churchtown
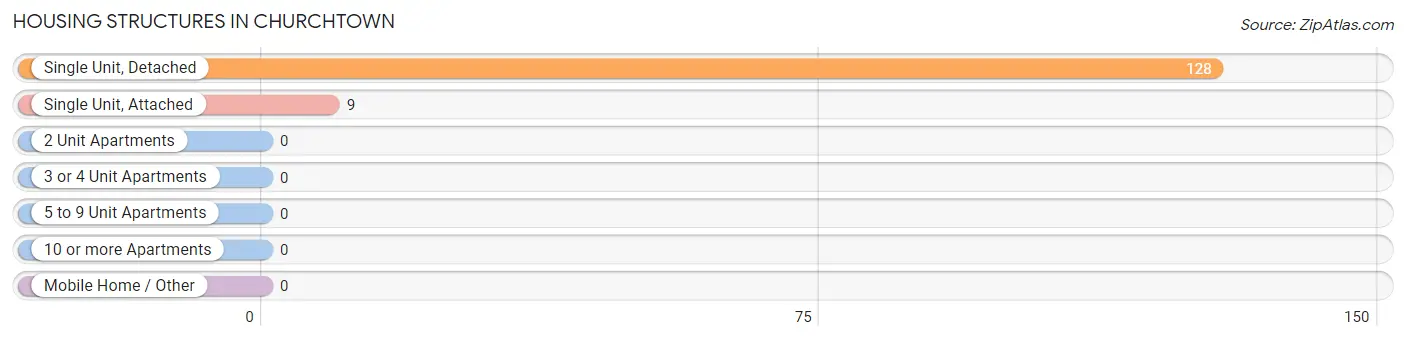
| Structure Type | # Housing Units | % Housing Units |
| Single Unit, Detached | 128 | 93.4% |
| Single Unit, Attached | 9 | 6.6% |
| 2 Unit Apartments | 0 | 0.0% |
| 3 or 4 Unit Apartments | 0 | 0.0% |
| 5 to 9 Unit Apartments | 0 | 0.0% |
| 10 or more Apartments | 0 | 0.0% |
| Mobile Home / Other | 0 | 0.0% |
| Total | 137 | 100.0% |
Housing Structures by Occupancy in Churchtown
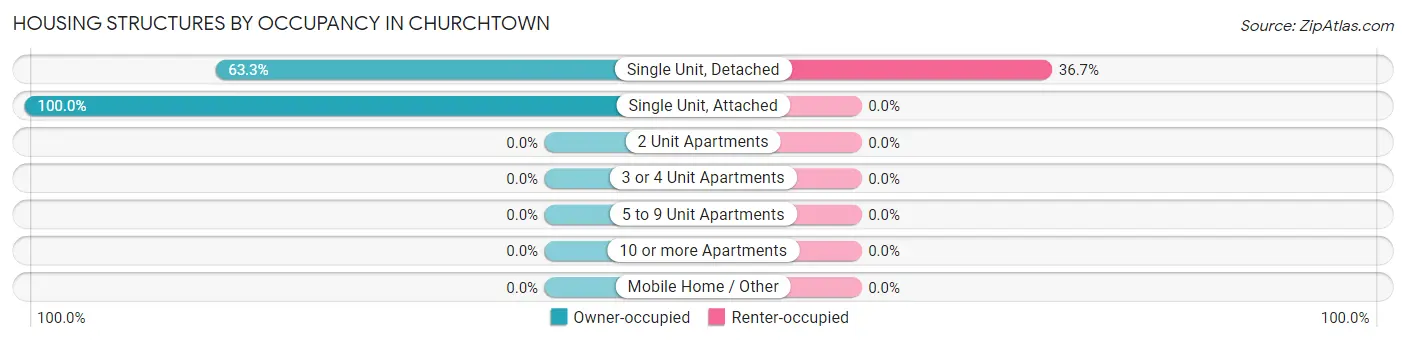
| Structure Type | Owner-occupied | Renter-occupied |
| Single Unit, Detached | 81 (63.3%) | 47 (36.7%) |
| Single Unit, Attached | 9 (100.0%) | 0 (0.0%) |
| 2 Unit Apartments | 0 (0.0%) | 0 (0.0%) |
| 3 or 4 Unit Apartments | 0 (0.0%) | 0 (0.0%) |
| 5 to 9 Unit Apartments | 0 (0.0%) | 0 (0.0%) |
| 10 or more Apartments | 0 (0.0%) | 0 (0.0%) |
| Mobile Home / Other | 0 (0.0%) | 0 (0.0%) |
| Total | 90 (65.7%) | 47 (34.3%) |
Housing Structures by Number of Rooms in Churchtown
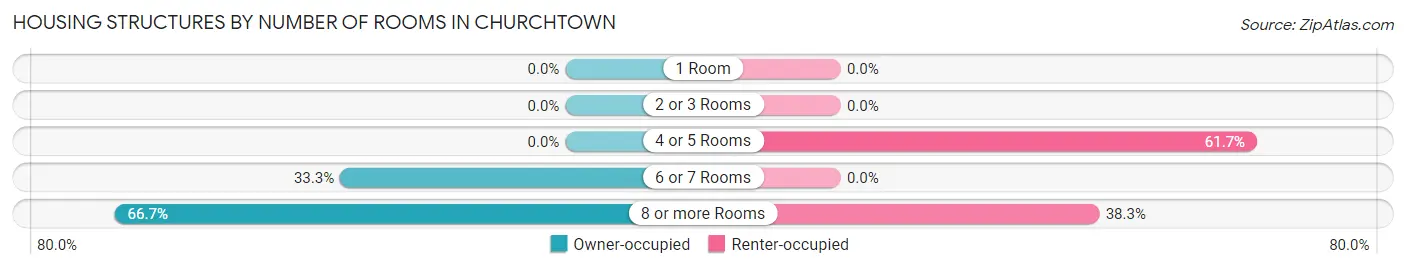
| Number of Rooms | Owner-occupied | Renter-occupied |
| 1 Room | 0 (0.0%) | 0 (0.0%) |
| 2 or 3 Rooms | 0 (0.0%) | 0 (0.0%) |
| 4 or 5 Rooms | 0 (0.0%) | 29 (61.7%) |
| 6 or 7 Rooms | 30 (33.3%) | 0 (0.0%) |
| 8 or more Rooms | 60 (66.7%) | 18 (38.3%) |
| Total | 90 (100.0%) | 47 (100.0%) |
Housing Structure by Heating Type in Churchtown
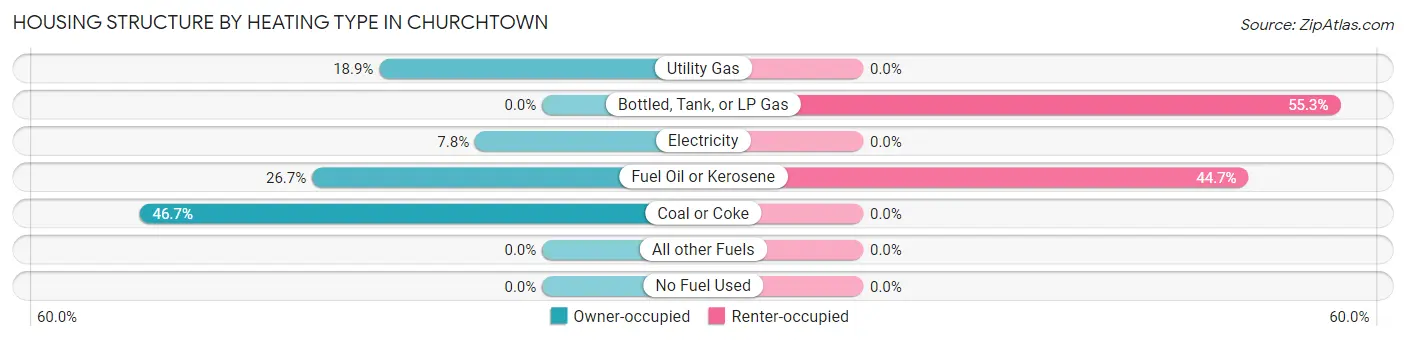
| Heating Type | Owner-occupied | Renter-occupied |
| Utility Gas | 17 (18.9%) | 0 (0.0%) |
| Bottled, Tank, or LP Gas | 0 (0.0%) | 26 (55.3%) |
| Electricity | 7 (7.8%) | 0 (0.0%) |
| Fuel Oil or Kerosene | 24 (26.7%) | 21 (44.7%) |
| Coal or Coke | 42 (46.7%) | 0 (0.0%) |
| All other Fuels | 0 (0.0%) | 0 (0.0%) |
| No Fuel Used | 0 (0.0%) | 0 (0.0%) |
| Total | 90 (100.0%) | 47 (100.0%) |
Household Vehicle Usage in Churchtown
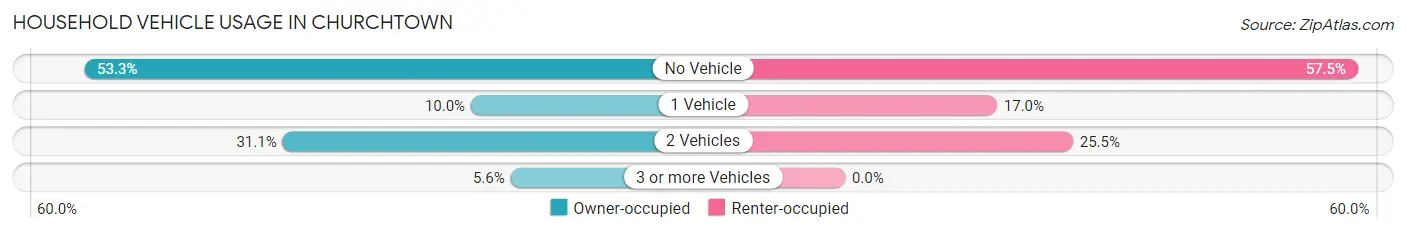
| Vehicles per Household | Owner-occupied | Renter-occupied |
| No Vehicle | 48 (53.3%) | 27 (57.5%) |
| 1 Vehicle | 9 (10.0%) | 8 (17.0%) |
| 2 Vehicles | 28 (31.1%) | 12 (25.5%) |
| 3 or more Vehicles | 5 (5.6%) | 0 (0.0%) |
| Total | 90 (100.0%) | 47 (100.0%) |
Real Estate & Mortgages in Churchtown
Real Estate and Mortgage Overview in Churchtown
| Characteristic | Without Mortgage | With Mortgage |
| Housing Units | 19 | 71 |
| Median Property Value | $332,100 | $450,000 |
| Median Household Income | - | - |
| Monthly Housing Costs | $444 | $0 |
| Real Estate Taxes | $3,700 | $0 |
Property Value by Mortgage Status in Churchtown
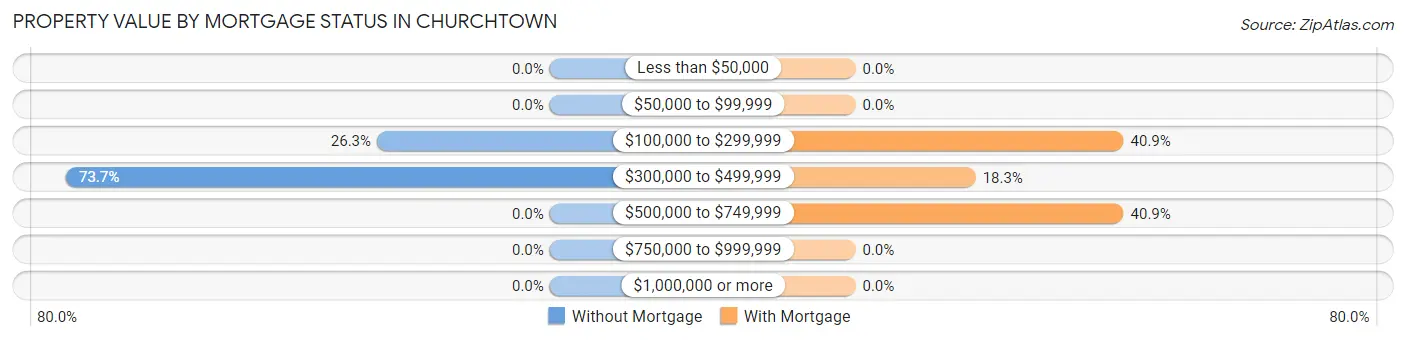
| Property Value | Without Mortgage | With Mortgage |
| Less than $50,000 | 0 (0.0%) | 0 (0.0%) |
| $50,000 to $99,999 | 0 (0.0%) | 0 (0.0%) |
| $100,000 to $299,999 | 5 (26.3%) | 29 (40.8%) |
| $300,000 to $499,999 | 14 (73.7%) | 13 (18.3%) |
| $500,000 to $749,999 | 0 (0.0%) | 29 (40.8%) |
| $750,000 to $999,999 | 0 (0.0%) | 0 (0.0%) |
| $1,000,000 or more | 0 (0.0%) | 0 (0.0%) |
| Total | 19 (100.0%) | 71 (100.0%) |
Household Income by Mortgage Status in Churchtown
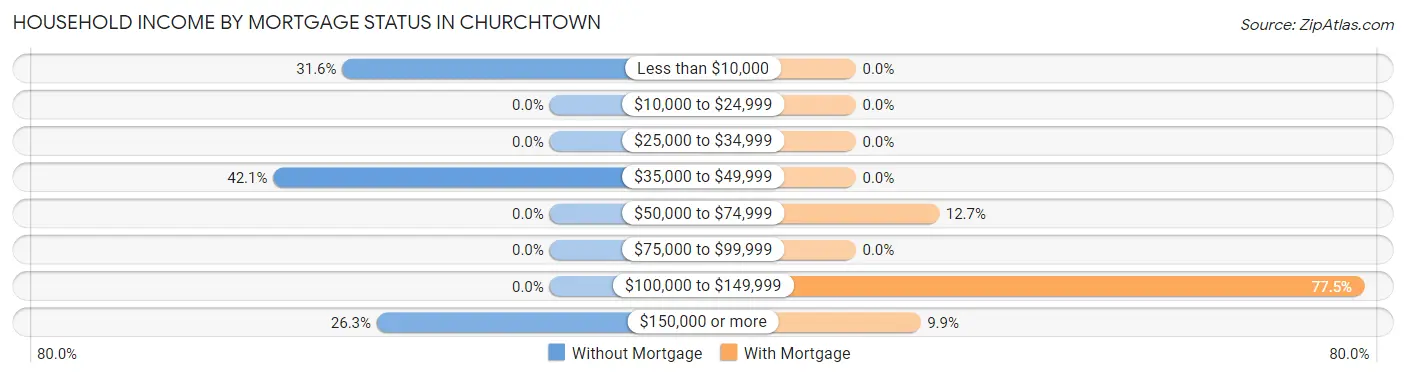
| Household Income | Without Mortgage | With Mortgage |
| Less than $10,000 | 6 (31.6%) | 0 (0.0%) |
| $10,000 to $24,999 | 0 (0.0%) | 0 (0.0%) |
| $25,000 to $34,999 | 0 (0.0%) | 0 (0.0%) |
| $35,000 to $49,999 | 8 (42.1%) | 0 (0.0%) |
| $50,000 to $74,999 | 0 (0.0%) | 9 (12.7%) |
| $75,000 to $99,999 | 0 (0.0%) | 0 (0.0%) |
| $100,000 to $149,999 | 0 (0.0%) | 55 (77.5%) |
| $150,000 or more | 5 (26.3%) | 7 (9.9%) |
| Total | 19 (100.0%) | 71 (100.0%) |
Property Value to Household Income Ratio in Churchtown
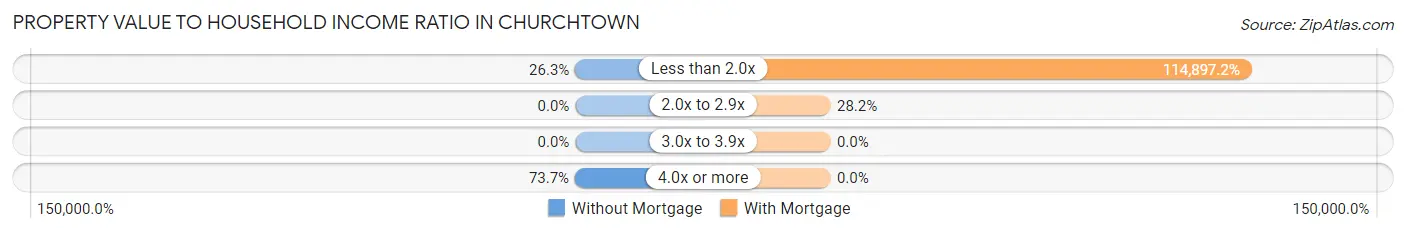
| Value-to-Income Ratio | Without Mortgage | With Mortgage |
| Less than 2.0x | 5 (26.3%) | 81,577 (114,897.2%) |
| 2.0x to 2.9x | 0 (0.0%) | 20 (28.2%) |
| 3.0x to 3.9x | 0 (0.0%) | 0 (0.0%) |
| 4.0x or more | 14 (73.7%) | 0 (0.0%) |
| Total | 19 (100.0%) | 71 (100.0%) |
Real Estate Taxes by Mortgage Status in Churchtown
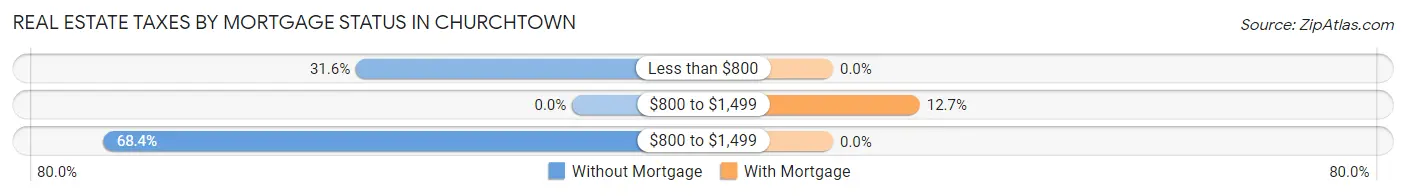
| Property Taxes | Without Mortgage | With Mortgage |
| Less than $800 | 6 (31.6%) | 0 (0.0%) |
| $800 to $1,499 | 0 (0.0%) | 9 (12.7%) |
| $800 to $1,499 | 13 (68.4%) | 0 (0.0%) |
| Total | 19 (100.0%) | 71 (100.0%) |
Health & Disability in Churchtown
Health Insurance Coverage by Age in Churchtown
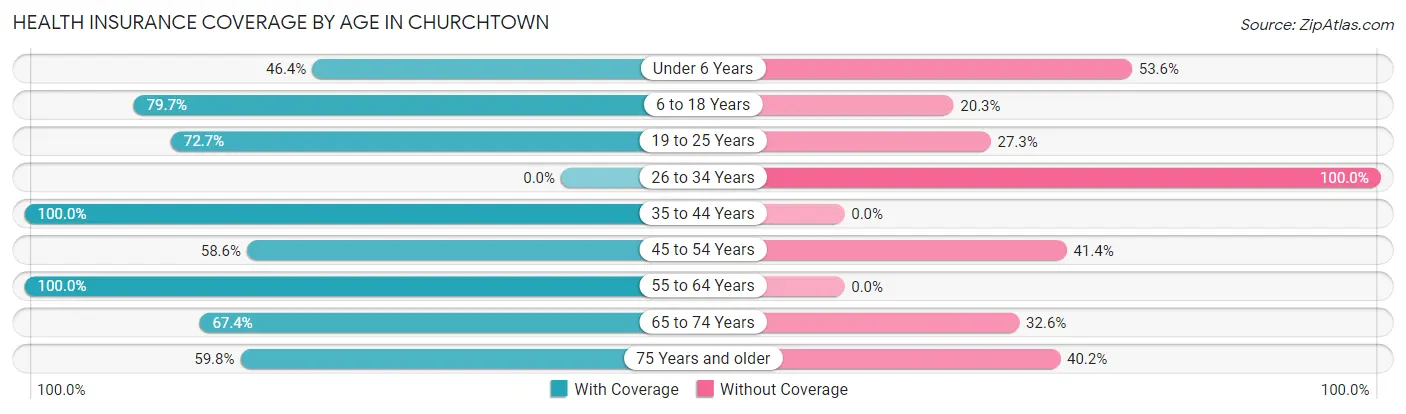
| Age Bracket | With Coverage | Without Coverage |
| Under 6 Years | 32 (46.4%) | 37 (53.6%) |
| 6 to 18 Years | 47 (79.7%) | 12 (20.3%) |
| 19 to 25 Years | 24 (72.7%) | 9 (27.3%) |
| 26 to 34 Years | 0 (0.0%) | 25 (100.0%) |
| 35 to 44 Years | 24 (100.0%) | 0 (0.0%) |
| 45 to 54 Years | 41 (58.6%) | 29 (41.4%) |
| 55 to 64 Years | 39 (100.0%) | 0 (0.0%) |
| 65 to 74 Years | 31 (67.4%) | 15 (32.6%) |
| 75 Years and older | 52 (59.8%) | 35 (40.2%) |
| Total | 290 (64.2%) | 162 (35.8%) |
Health Insurance Coverage by Citizenship Status in Churchtown
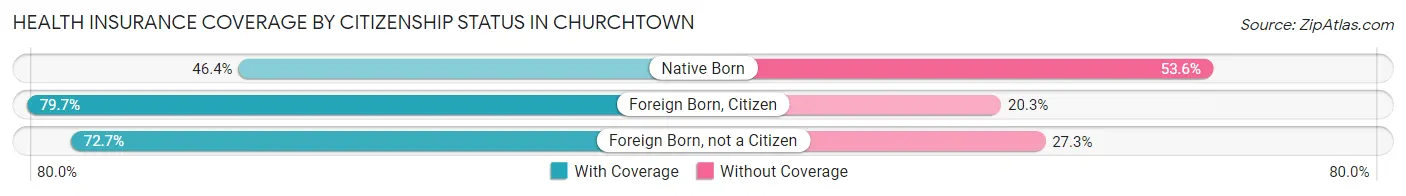
| Citizenship Status | With Coverage | Without Coverage |
| Native Born | 32 (46.4%) | 37 (53.6%) |
| Foreign Born, Citizen | 47 (79.7%) | 12 (20.3%) |
| Foreign Born, not a Citizen | 24 (72.7%) | 9 (27.3%) |
Health Insurance Coverage by Household Income in Churchtown
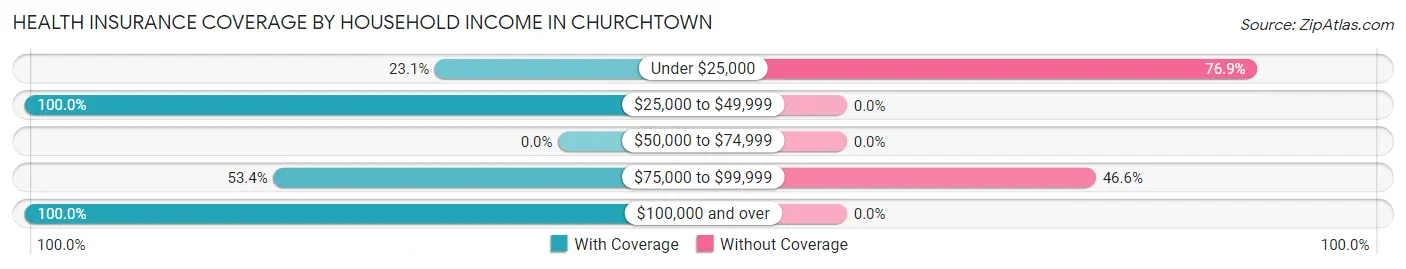
| Household Income | With Coverage | Without Coverage |
| Under $25,000 | 9 (23.1%) | 30 (76.9%) |
| $25,000 to $49,999 | 70 (100.0%) | 0 (0.0%) |
| $50,000 to $74,999 | 0 (0.0%) | 0 (0.0%) |
| $75,000 to $99,999 | 151 (53.4%) | 132 (46.6%) |
| $100,000 and over | 60 (100.0%) | 0 (0.0%) |
Public vs Private Health Insurance Coverage by Age in Churchtown
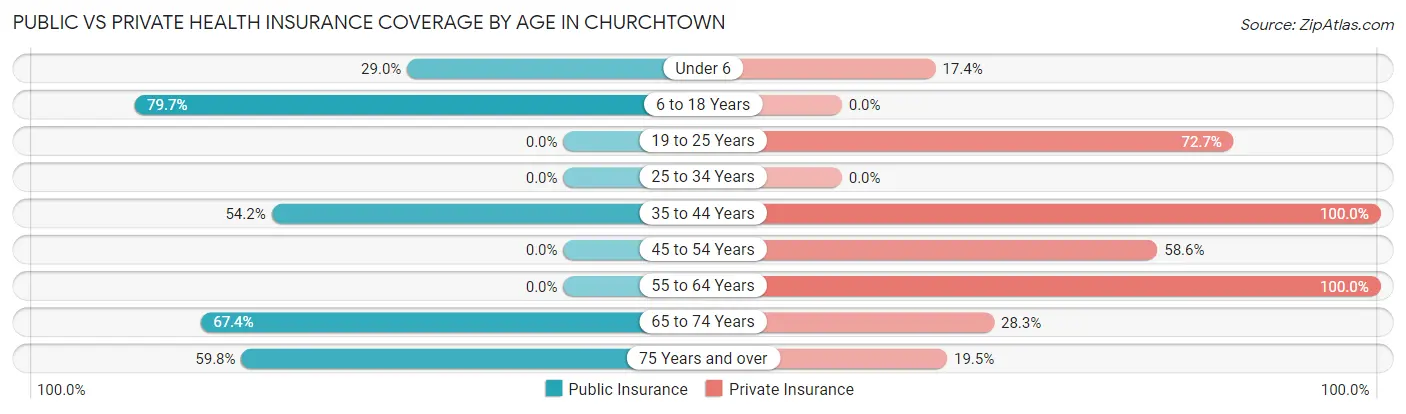
| Age Bracket | Public Insurance | Private Insurance |
| Under 6 | 20 (29.0%) | 12 (17.4%) |
| 6 to 18 Years | 47 (79.7%) | 0 (0.0%) |
| 19 to 25 Years | 0 (0.0%) | 24 (72.7%) |
| 25 to 34 Years | 0 (0.0%) | 0 (0.0%) |
| 35 to 44 Years | 13 (54.2%) | 24 (100.0%) |
| 45 to 54 Years | 0 (0.0%) | 41 (58.6%) |
| 55 to 64 Years | 0 (0.0%) | 39 (100.0%) |
| 65 to 74 Years | 31 (67.4%) | 13 (28.3%) |
| 75 Years and over | 52 (59.8%) | 17 (19.5%) |
| Total | 163 (36.1%) | 170 (37.6%) |
Disability Status by Sex by Age in Churchtown
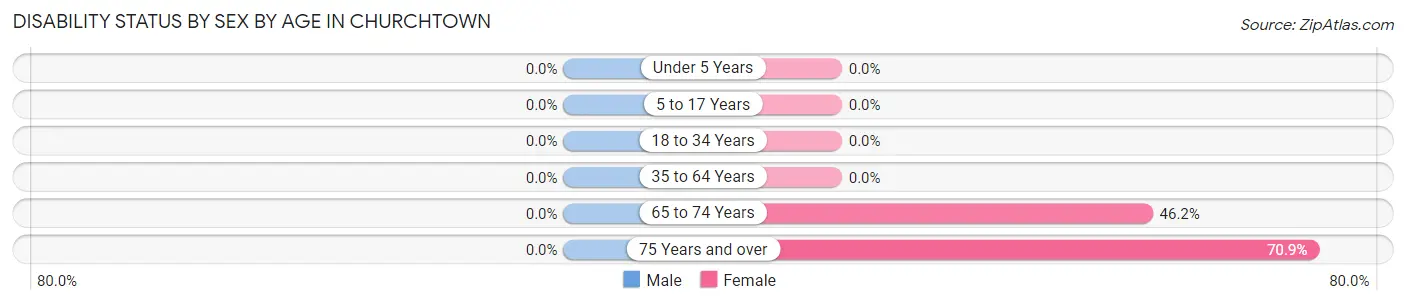
| Age Bracket | Male | Female |
| Under 5 Years | 0 (0.0%) | 0 (0.0%) |
| 5 to 17 Years | 0 (0.0%) | 0 (0.0%) |
| 18 to 34 Years | 0 (0.0%) | 0 (0.0%) |
| 35 to 64 Years | 0 (0.0%) | 0 (0.0%) |
| 65 to 74 Years | 0 (0.0%) | 18 (46.2%) |
| 75 Years and over | 0 (0.0%) | 56 (70.9%) |
Disability Class by Sex by Age in Churchtown
Disability Class: Hearing Difficulty
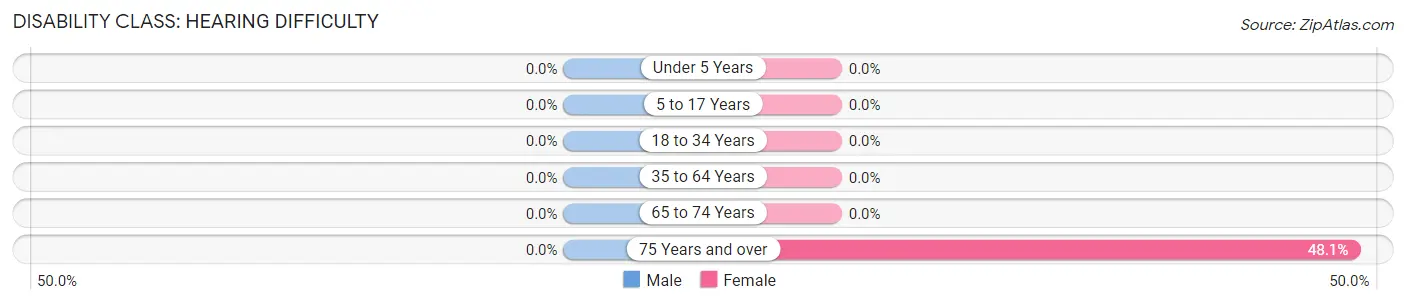
| Age Bracket | Male | Female |
| Under 5 Years | 0 (0.0%) | 0 (0.0%) |
| 5 to 17 Years | 0 (0.0%) | 0 (0.0%) |
| 18 to 34 Years | 0 (0.0%) | 0 (0.0%) |
| 35 to 64 Years | 0 (0.0%) | 0 (0.0%) |
| 65 to 74 Years | 0 (0.0%) | 0 (0.0%) |
| 75 Years and over | 0 (0.0%) | 38 (48.1%) |
Disability Class: Vision Difficulty
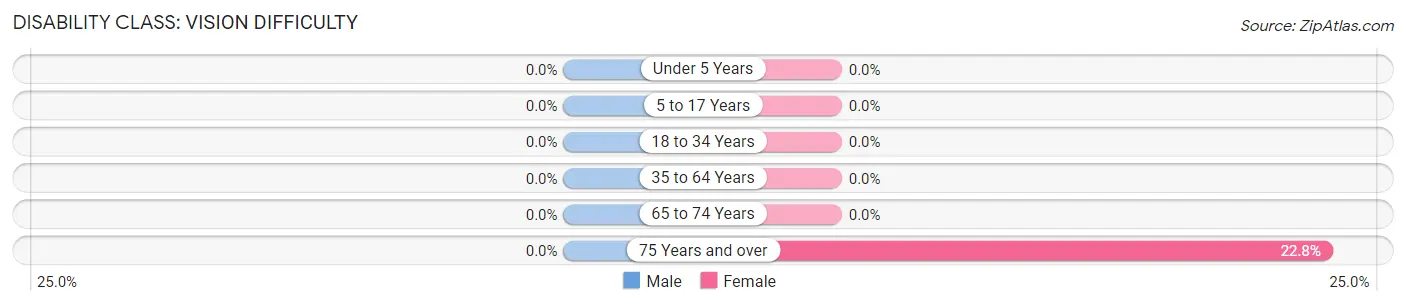
| Age Bracket | Male | Female |
| Under 5 Years | 0 (0.0%) | 0 (0.0%) |
| 5 to 17 Years | 0 (0.0%) | 0 (0.0%) |
| 18 to 34 Years | 0 (0.0%) | 0 (0.0%) |
| 35 to 64 Years | 0 (0.0%) | 0 (0.0%) |
| 65 to 74 Years | 0 (0.0%) | 0 (0.0%) |
| 75 Years and over | 0 (0.0%) | 18 (22.8%) |
Disability Class: Cognitive Difficulty
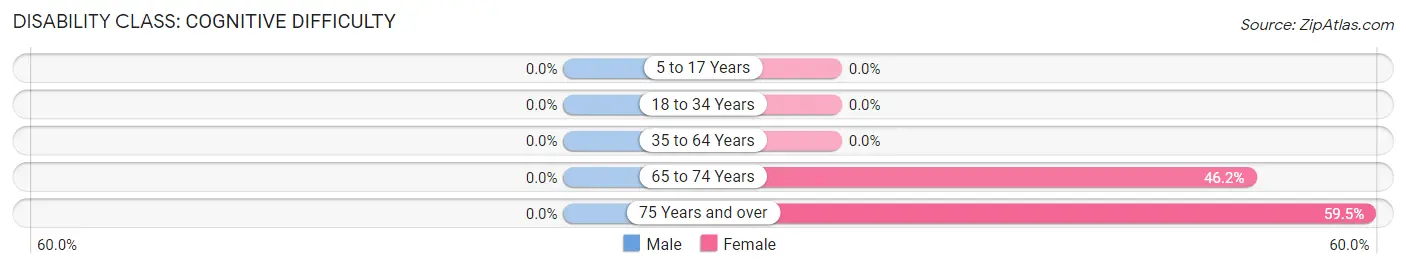
| Age Bracket | Male | Female |
| 5 to 17 Years | 0 (0.0%) | 0 (0.0%) |
| 18 to 34 Years | 0 (0.0%) | 0 (0.0%) |
| 35 to 64 Years | 0 (0.0%) | 0 (0.0%) |
| 65 to 74 Years | 0 (0.0%) | 18 (46.2%) |
| 75 Years and over | 0 (0.0%) | 47 (59.5%) |
Disability Class: Ambulatory Difficulty
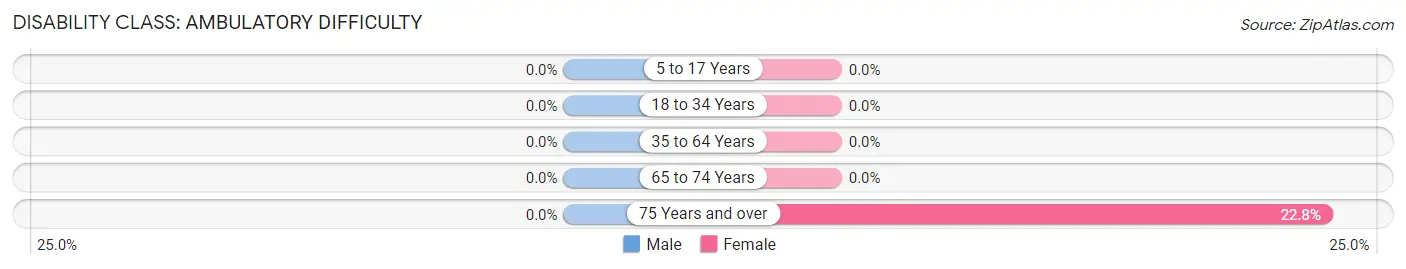
| Age Bracket | Male | Female |
| 5 to 17 Years | 0 (0.0%) | 0 (0.0%) |
| 18 to 34 Years | 0 (0.0%) | 0 (0.0%) |
| 35 to 64 Years | 0 (0.0%) | 0 (0.0%) |
| 65 to 74 Years | 0 (0.0%) | 0 (0.0%) |
| 75 Years and over | 0 (0.0%) | 18 (22.8%) |
Disability Class: Self-Care Difficulty
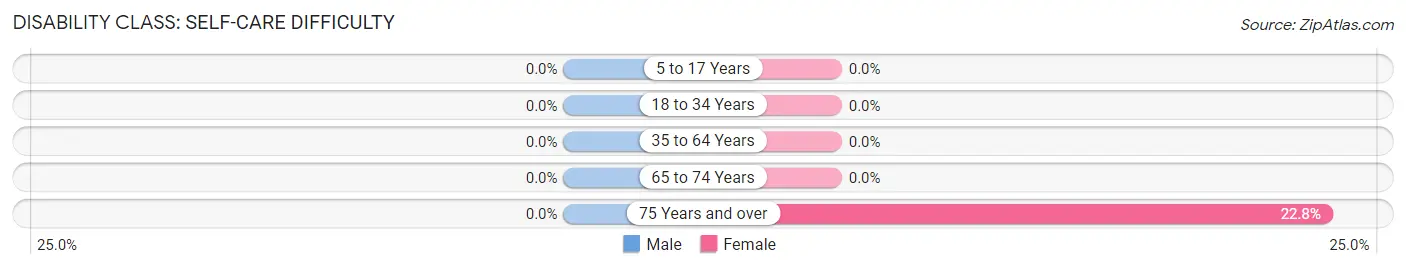
| Age Bracket | Male | Female |
| 5 to 17 Years | 0 (0.0%) | 0 (0.0%) |
| 18 to 34 Years | 0 (0.0%) | 0 (0.0%) |
| 35 to 64 Years | 0 (0.0%) | 0 (0.0%) |
| 65 to 74 Years | 0 (0.0%) | 0 (0.0%) |
| 75 Years and over | 0 (0.0%) | 18 (22.8%) |
Technology Access in Churchtown
Computing Device Access in Churchtown
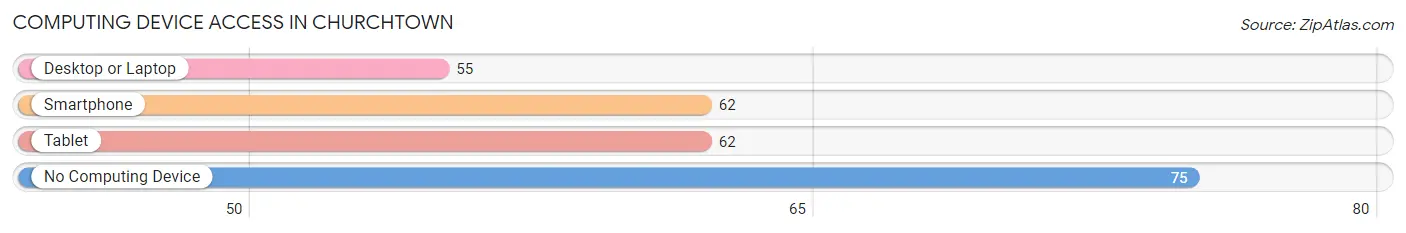
| Device Type | # Households | % Households |
| Desktop or Laptop | 55 | 40.2% |
| Smartphone | 62 | 45.3% |
| Tablet | 62 | 45.3% |
| No Computing Device | 75 | 54.7% |
| Total | 137 | 100.0% |
Internet Access in Churchtown
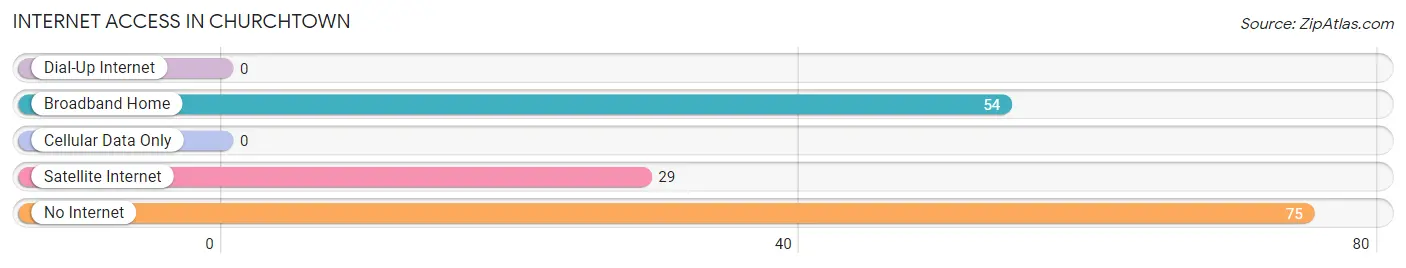
| Internet Type | # Households | % Households |
| Dial-Up Internet | 0 | 0.0% |
| Broadband Home | 54 | 39.4% |
| Cellular Data Only | 0 | 0.0% |
| Satellite Internet | 29 | 21.2% |
| No Internet | 75 | 54.7% |
| Total | 137 | 100.0% |
Churchtown Summary
Town History
The small town of Churchtown, Pennsylvania is located in Lancaster County, about 20 miles east of the city of Lancaster. The town was founded in 1737 by a group of German immigrants who had come to the area in search of religious freedom. The town was originally known as “Kirchdorf”, which translates to “Church Village” in German. The town was officially incorporated in 1845 and was renamed Churchtown.
The town has a rich history of religious diversity. The first settlers were Mennonites, who were followed by Amish, Lutheran, and Catholic immigrants. The town was also home to a number of African-American families who had escaped slavery in the south. The town was a major stop on the Underground Railroad, and many of the town’s churches were used as safe houses for escaped slaves.
The town has also been home to a number of notable figures, including the famous abolitionist and former slave, Harriet Tubman. Tubman lived in Churchtown for a number of years and was an active member of the local African Methodist Episcopal Church.
Geography
Churchtown is located in the southeastern corner of Lancaster County, about 20 miles east of the city of Lancaster. The town is situated in a rural area, surrounded by rolling hills and farmland. The town is located on the banks of the Conestoga River, which flows through the town and provides a source of recreation for the town’s residents.
The town is located in the humid continental climate zone, with hot summers and cold winters. The average temperature in the summer is around 75 degrees Fahrenheit, and the average temperature in the winter is around 30 degrees Fahrenheit. The town receives an average of 40 inches of precipitation per year, with most of it falling in the form of snow in the winter months.
Economy
The economy of Churchtown is largely based on agriculture. The town is home to a number of farms, which produce a variety of crops, including corn, soybeans, wheat, and hay. The town is also home to a number of small businesses, including restaurants, shops, and other services.
The town is also home to a number of manufacturing companies, which produce a variety of products, including furniture, clothing, and electronics. The town is also home to a number of small businesses, including restaurants, shops, and other services.
Demographics
As of the 2010 census, the population of Churchtown was 1,845. The town is predominantly white, with a small African-American population. The town is also home to a number of other ethnic groups, including Hispanic, Asian, and Native American.
The median household income in Churchtown is $50,000, and the median home value is $150,000. The town has a low unemployment rate, and the majority of the town’s residents are employed in the agricultural, manufacturing, and service industries.
Conclusion
Churchtown, Pennsylvania is a small town with a rich history and a diverse population. The town is home to a number of farms, businesses, and manufacturing companies, and the town’s economy is largely based on agriculture. The town is also home to a number of ethnic groups, and the median household income is $50,000. Churchtown is a great place to live and work, and it is a great example of the diversity and history of Pennsylvania.
Common Questions
What is Per Capita Income in Churchtown?
Per Capita income in Churchtown is $55,874.
What is the Median Family Income in Churchtown?
Median Family Income in Churchtown is $81,518.
What is the Median Household income in Churchtown?
Median Household Income in Churchtown is $80,982.
What is Income or Wage Gap in Churchtown?
Income or Wage Gap in Churchtown is 48.8%.
Women in Churchtown earn 51.2 cents for every dollar earned by a man.
What is Inequality or Gini Index in Churchtown?
Inequality or Gini Index in Churchtown is 0.66.
What is the Total Population of Churchtown?
Total Population of Churchtown is 452.
What is the Total Male Population of Churchtown?
Total Male Population of Churchtown is 178.
What is the Total Female Population of Churchtown?
Total Female Population of Churchtown is 274.
What is the Ratio of Males per 100 Females in Churchtown?
There are 64.96 Males per 100 Females in Churchtown.
What is the Ratio of Females per 100 Males in Churchtown?
There are 153.93 Females per 100 Males in Churchtown.
What is the Median Population Age in Churchtown?
Median Population Age in Churchtown is 46.5 Years.
What is the Average Family Size in Churchtown
Average Family Size in Churchtown is 3.6 People.
What is the Average Household Size in Churchtown
Average Household Size in Churchtown is 3.3 People.
How Large is the Labor Force in Churchtown?
There are 177 People in the Labor Forcein in Churchtown.
What is the Percentage of People in the Labor Force in Churchtown?
54.6% of People are in the Labor Force in Churchtown.