Edgeworth borough, PA Map & Demographics
Edgeworth borough Overview
$122,468
PER CAPITA INCOME
$250,001
AVG FAMILY INCOME
$208,333
AVG HOUSEHOLD INCOME
55.4%
WAGE / INCOME GAP [ % ]
44.6¢/ $1
WAGE / INCOME GAP [ $ ]
0.52
INEQUALITY / GINI INDEX
1,520
TOTAL POPULATION
767
MALE POPULATION
753
FEMALE POPULATION
101.86
MALES / 100 FEMALES
98.17
FEMALES / 100 MALES
47.2
MEDIAN AGE
3.0
AVG FAMILY SIZE
2.6
AVG HOUSEHOLD SIZE
698
LABOR FORCE [ PEOPLE ]
58.4%
PERCENT IN LABOR FORCE
4.0%
UNEMPLOYMENT RATE
Income in Edgeworth borough
Income Overview in Edgeworth borough
Per Capita Income in Edgeworth borough is $122,468, while median incomes of families and households are $250,001 and $208,333 respectively.
| Characteristic | Number | Measure |
| Per Capita Income | 1,520 | $122,468 |
| Median Family Income | 453 | $250,001 |
| Mean Family Income | 453 | $381,925 |
| Median Household Income | 574 | $208,333 |
| Mean Household Income | 574 | $324,718 |
| Income Deficit | 453 | $0 |
| Wage / Income Gap (%) | 1,520 | 55.39% |
| Wage / Income Gap ($) | 1,520 | 44.61¢ per $1 |
| Gini / Inequality Index | 1,520 | 0.52 |
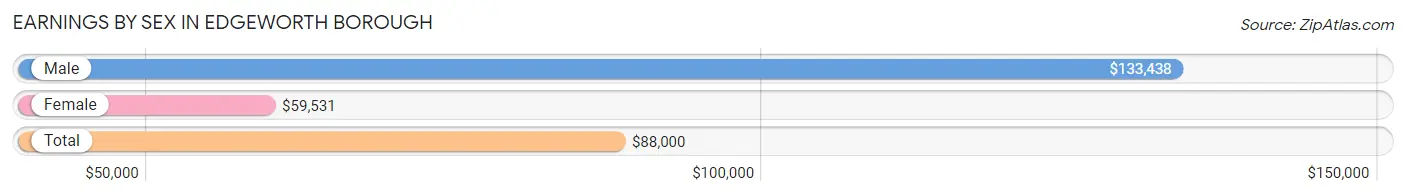
Earnings by Sex in Edgeworth borough
Average Earnings in Edgeworth borough are $88,000, $133,438 for men and $59,531 for women, a difference of 55.4%.
| Sex | Number | Average Earnings |
| Male | 457 (59.0%) | $133,438 |
| Female | 317 (41.0%) | $59,531 |
| Total | 774 (100.0%) | $88,000 |
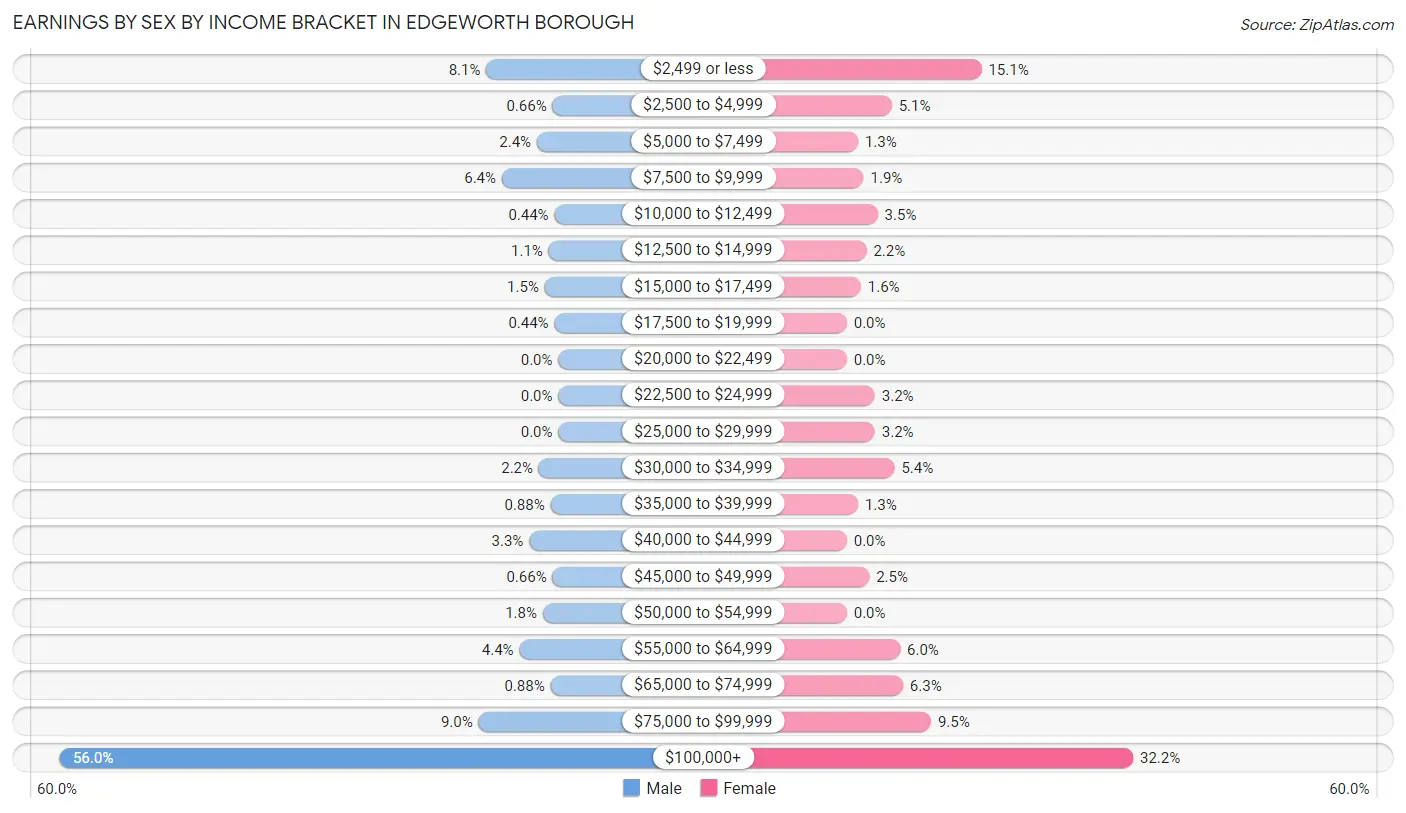
Earnings by Sex by Income Bracket in Edgeworth borough
The most common earnings brackets in Edgeworth borough are $100,000+ for men (256 | 56.0%) and $100,000+ for women (102 | 32.2%).
| Income | Male | Female |
| $2,499 or less | 37 (8.1%) | 48 (15.1%) |
| $2,500 to $4,999 | 3 (0.7%) | 16 (5.1%) |
| $5,000 to $7,499 | 11 (2.4%) | 4 (1.3%) |
| $7,500 to $9,999 | 29 (6.4%) | 6 (1.9%) |
| $10,000 to $12,499 | 2 (0.4%) | 11 (3.5%) |
| $12,500 to $14,999 | 5 (1.1%) | 7 (2.2%) |
| $15,000 to $17,499 | 7 (1.5%) | 5 (1.6%) |
| $17,500 to $19,999 | 2 (0.4%) | 0 (0.0%) |
| $20,000 to $22,499 | 0 (0.0%) | 0 (0.0%) |
| $22,500 to $24,999 | 0 (0.0%) | 10 (3.2%) |
| $25,000 to $29,999 | 0 (0.0%) | 10 (3.2%) |
| $30,000 to $34,999 | 10 (2.2%) | 17 (5.4%) |
| $35,000 to $39,999 | 4 (0.9%) | 4 (1.3%) |
| $40,000 to $44,999 | 15 (3.3%) | 0 (0.0%) |
| $45,000 to $49,999 | 3 (0.7%) | 8 (2.5%) |
| $50,000 to $54,999 | 8 (1.8%) | 0 (0.0%) |
| $55,000 to $64,999 | 20 (4.4%) | 19 (6.0%) |
| $65,000 to $74,999 | 4 (0.9%) | 20 (6.3%) |
| $75,000 to $99,999 | 41 (9.0%) | 30 (9.5%) |
| $100,000+ | 256 (56.0%) | 102 (32.2%) |
| Total | 457 (100.0%) | 317 (100.0%) |
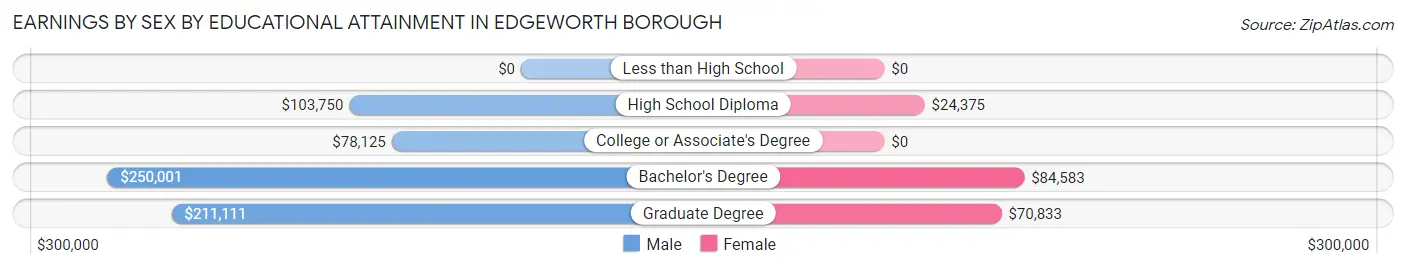
Earnings by Sex by Educational Attainment in Edgeworth borough
Average earnings in Edgeworth borough are $206,667 for men and $68,125 for women, a difference of 67.0%. Men with an educational attainment of bachelor's degree enjoy the highest average annual earnings of $250,001, while those with college or associate's degree education earn the least with $78,125. Women with an educational attainment of bachelor's degree earn the most with the average annual earnings of $84,583, while those with high school diploma education have the smallest earnings of $24,375.
| Educational Attainment | Male Income | Female Income |
| Less than High School | - | - |
| High School Diploma | $103,750 | $24,375 |
| College or Associate's Degree | $78,125 | $0 |
| Bachelor's Degree | $250,001 | $84,583 |
| Graduate Degree | $211,111 | $70,833 |
| Total | $206,667 | $68,125 |
Family Income in Edgeworth borough
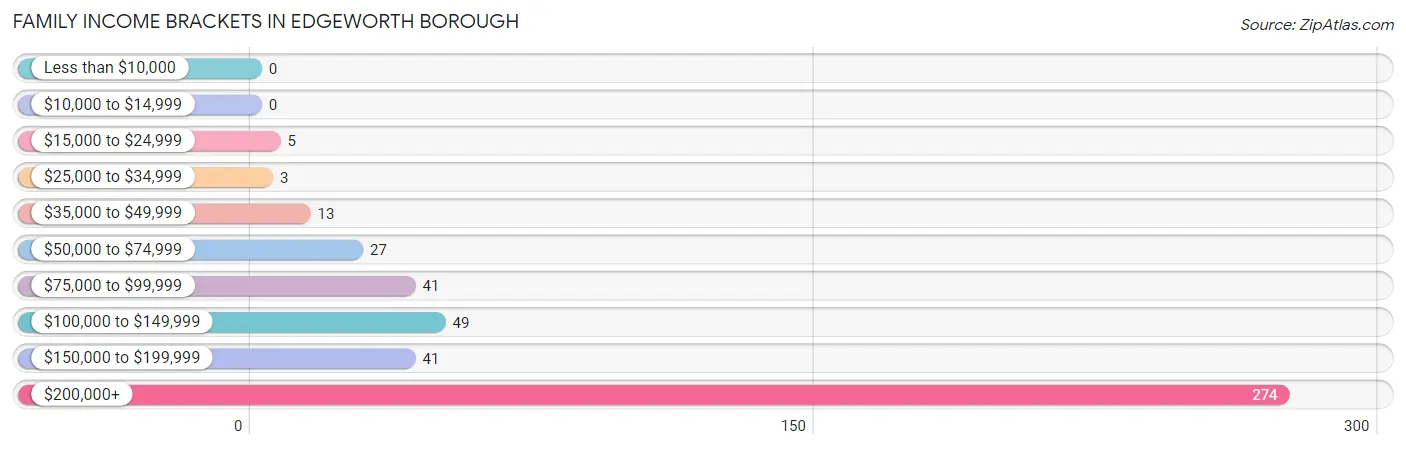
Family Income Brackets in Edgeworth borough
According to the Edgeworth borough family income data, there are 274 families falling into the $200,000+ income range, which is the most common income bracket and makes up 60.5% of all families.
| Income Bracket | # Families | % Families |
| Less than $10,000 | 0 | 0.0% |
| $10,000 to $14,999 | 0 | 0.0% |
| $15,000 to $24,999 | 5 | 1.1% |
| $25,000 to $34,999 | 3 | 0.7% |
| $35,000 to $49,999 | 13 | 2.9% |
| $50,000 to $74,999 | 27 | 6.0% |
| $75,000 to $99,999 | 41 | 9.1% |
| $100,000 to $149,999 | 49 | 10.8% |
| $150,000 to $199,999 | 41 | 9.1% |
| $200,000+ | 274 | 60.5% |
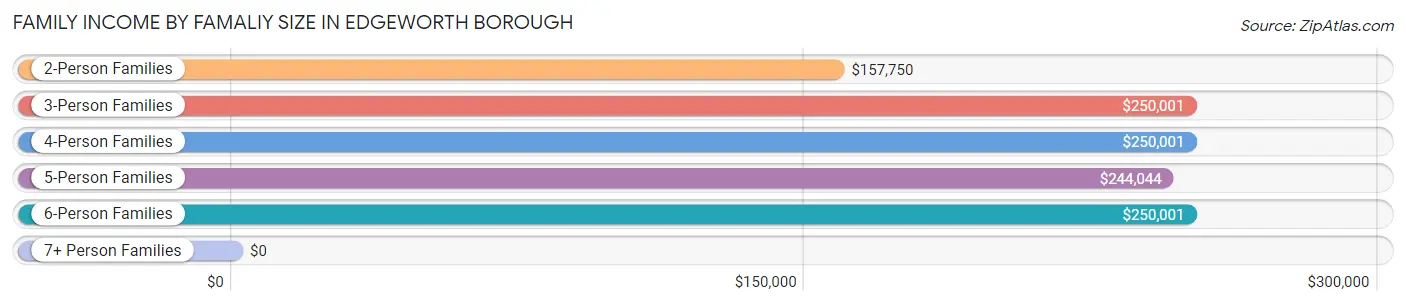
Family Income by Famaliy Size in Edgeworth borough
3-person families (96 | 21.2%) account for the highest median family income in Edgeworth borough with $250,001 per family, while 3-person families (96 | 21.2%) have the highest median income of $83,334 per family member.
| Income Bracket | # Families | Median Income |
| 2-Person Families | 219 (48.3%) | $157,750 |
| 3-Person Families | 96 (21.2%) | $250,001 |
| 4-Person Families | 74 (16.3%) | $250,001 |
| 5-Person Families | 51 (11.3%) | $244,044 |
| 6-Person Families | 13 (2.9%) | $250,001 |
| 7+ Person Families | 0 (0.0%) | $0 |
| Total | 453 (100.0%) | $250,001 |
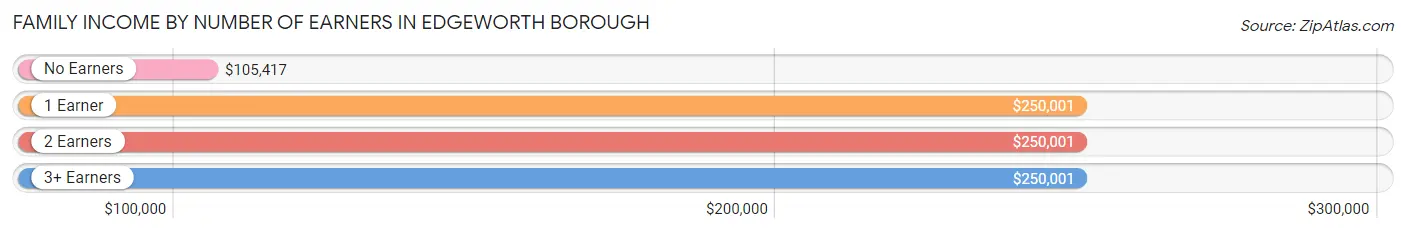
Family Income by Number of Earners in Edgeworth borough
The median family income in Edgeworth borough is $250,001, with families comprising 1 earner (137) having the highest median family income of $250,001, while families with no earners (51) have the lowest median family income of $105,417, accounting for 30.2% and 11.3% of families, respectively.
| Number of Earners | # Families | Median Income |
| No Earners | 51 (11.3%) | $105,417 |
| 1 Earner | 137 (30.2%) | $250,001 |
| 2 Earners | 223 (49.2%) | $250,001 |
| 3+ Earners | 42 (9.3%) | $250,001 |
| Total | 453 (100.0%) | $250,001 |
Household Income in Edgeworth borough
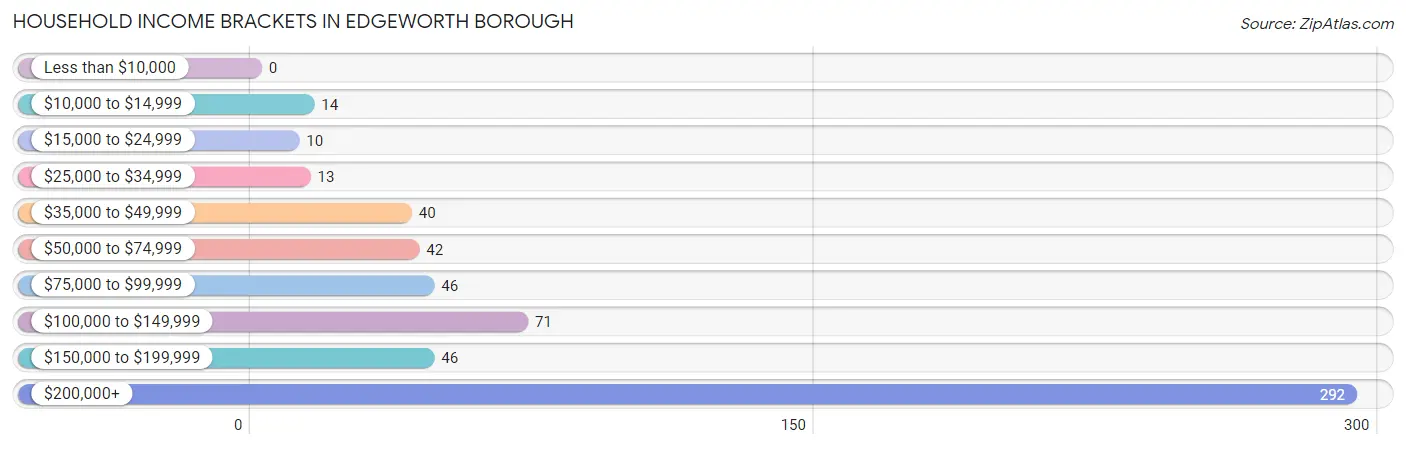
Household Income Brackets in Edgeworth borough
With 292 households falling in the category, the $200,000+ income range is the most frequent in Edgeworth borough, accounting for 50.9% of all households.
| Income Bracket | # Households | % Households |
| Less than $10,000 | 0 | 0.0% |
| $10,000 to $14,999 | 14 | 2.4% |
| $15,000 to $24,999 | 10 | 1.7% |
| $25,000 to $34,999 | 13 | 2.3% |
| $35,000 to $49,999 | 40 | 7.0% |
| $50,000 to $74,999 | 42 | 7.3% |
| $75,000 to $99,999 | 46 | 8.0% |
| $100,000 to $149,999 | 71 | 12.4% |
| $150,000 to $199,999 | 46 | 8.0% |
| $200,000+ | 292 | 50.9% |
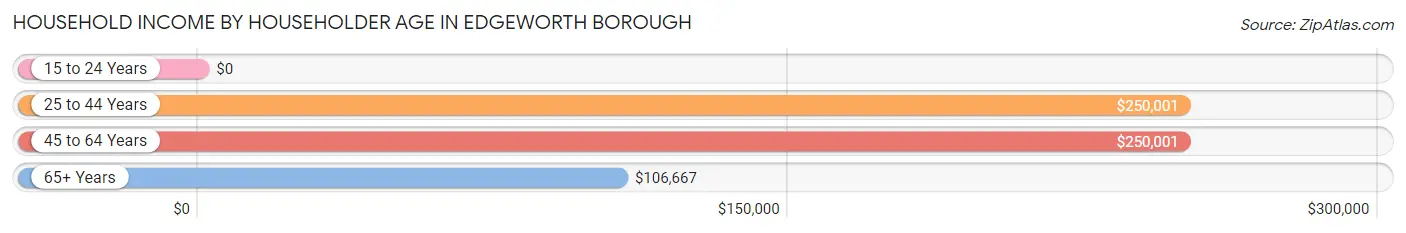
Household Income by Householder Age in Edgeworth borough
The median household income in Edgeworth borough is $208,333, with the highest median household income of $250,001 found in the 25 to 44 years age bracket for the primary householder. A total of 123 households (21.4%) fall into this category.
| Income Bracket | # Households | Median Income |
| 15 to 24 Years | 0 (0.0%) | $0 |
| 25 to 44 Years | 123 (21.4%) | $250,001 |
| 45 to 64 Years | 237 (41.3%) | $250,001 |
| 65+ Years | 214 (37.3%) | $106,667 |
| Total | 574 (100.0%) | $208,333 |
Poverty in Edgeworth borough
Income Below Poverty by Sex and Age in Edgeworth borough
With 0.3% poverty level for males and 2.1% for females among the residents of Edgeworth borough, 18 to 24 year old males and 18 to 24 year old females are the most vulnerable to poverty, with 1 males (1.1%) and 3 females (12.0%) in their respective age groups living below the poverty level.
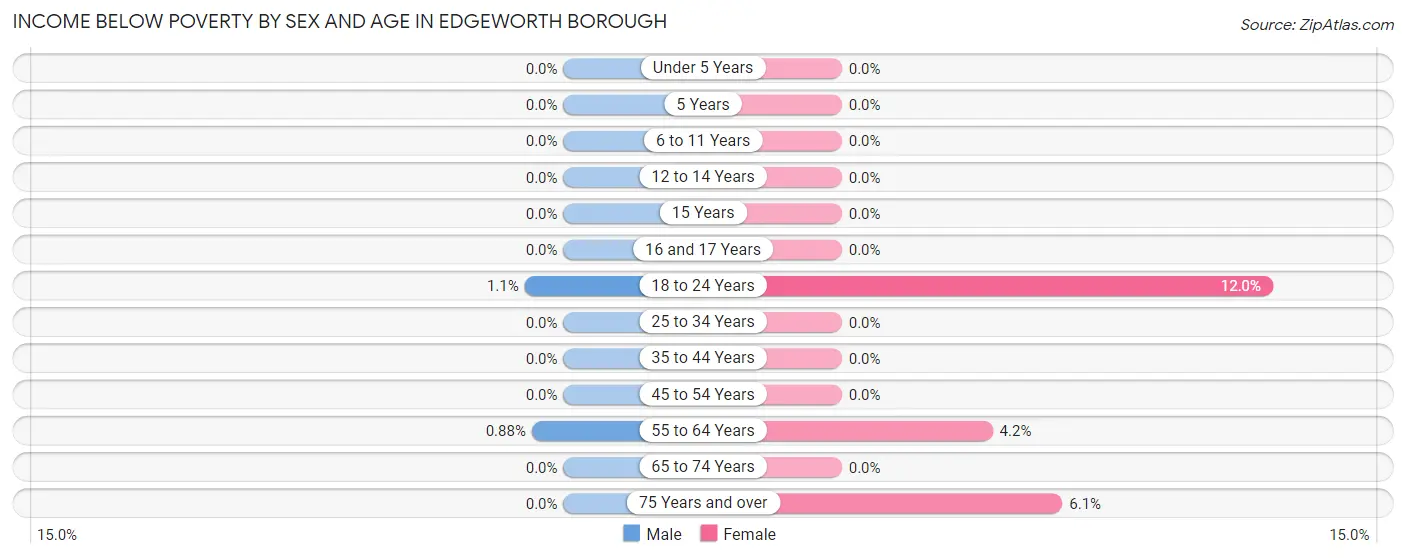
| Age Bracket | Male | Female |
| Under 5 Years | 0 (0.0%) | 0 (0.0%) |
| 5 Years | 0 (0.0%) | 0 (0.0%) |
| 6 to 11 Years | 0 (0.0%) | 0 (0.0%) |
| 12 to 14 Years | 0 (0.0%) | 0 (0.0%) |
| 15 Years | 0 (0.0%) | 0 (0.0%) |
| 16 and 17 Years | 0 (0.0%) | 0 (0.0%) |
| 18 to 24 Years | 1 (1.1%) | 3 (12.0%) |
| 25 to 34 Years | 0 (0.0%) | 0 (0.0%) |
| 35 to 44 Years | 0 (0.0%) | 0 (0.0%) |
| 45 to 54 Years | 0 (0.0%) | 0 (0.0%) |
| 55 to 64 Years | 1 (0.9%) | 6 (4.2%) |
| 65 to 74 Years | 0 (0.0%) | 0 (0.0%) |
| 75 Years and over | 0 (0.0%) | 7 (6.1%) |
| Total | 2 (0.3%) | 16 (2.1%) |
Income Above Poverty by Sex and Age in Edgeworth borough
According to the poverty statistics in Edgeworth borough, males aged under 5 years and females aged under 5 years are the age groups that are most secure financially, with 100.0% of males and 100.0% of females in these age groups living above the poverty line.
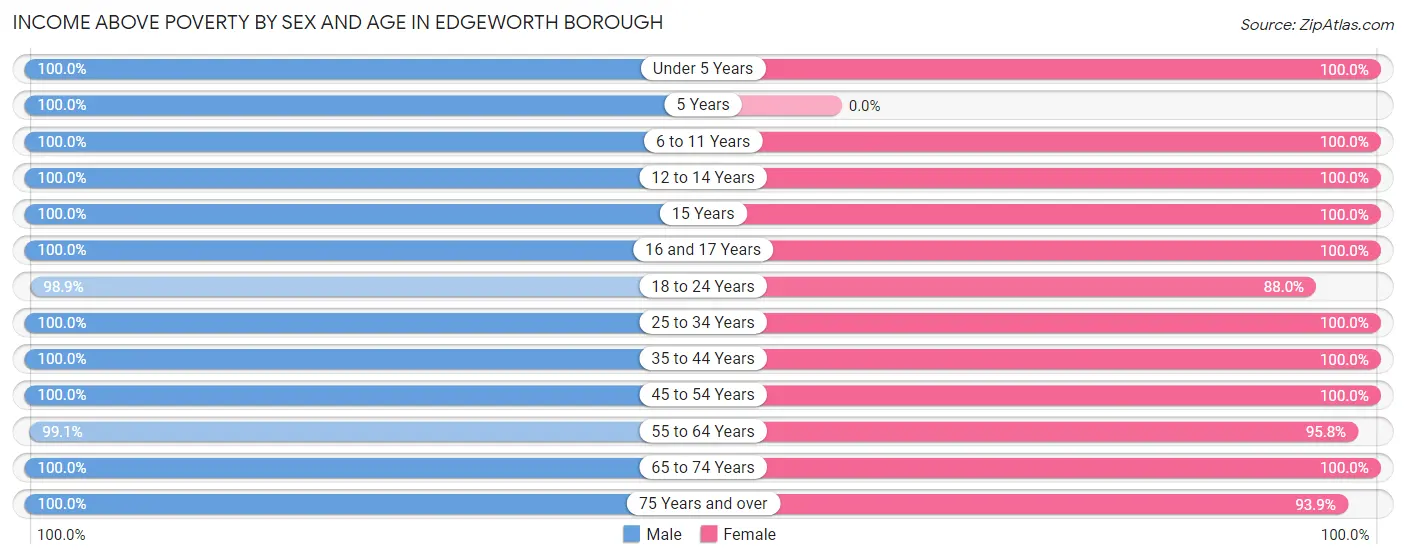
| Age Bracket | Male | Female |
| Under 5 Years | 40 (100.0%) | 48 (100.0%) |
| 5 Years | 20 (100.0%) | 0 (0.0%) |
| 6 to 11 Years | 76 (100.0%) | 39 (100.0%) |
| 12 to 14 Years | 27 (100.0%) | 48 (100.0%) |
| 15 Years | 18 (100.0%) | 8 (100.0%) |
| 16 and 17 Years | 21 (100.0%) | 13 (100.0%) |
| 18 to 24 Years | 92 (98.9%) | 22 (88.0%) |
| 25 to 34 Years | 30 (100.0%) | 29 (100.0%) |
| 35 to 44 Years | 91 (100.0%) | 110 (100.0%) |
| 45 to 54 Years | 93 (100.0%) | 92 (100.0%) |
| 55 to 64 Years | 113 (99.1%) | 137 (95.8%) |
| 65 to 74 Years | 86 (100.0%) | 84 (100.0%) |
| 75 Years and over | 58 (100.0%) | 107 (93.9%) |
| Total | 765 (99.7%) | 737 (97.9%) |
Income Below Poverty Among Married-Couple Families in Edgeworth borough
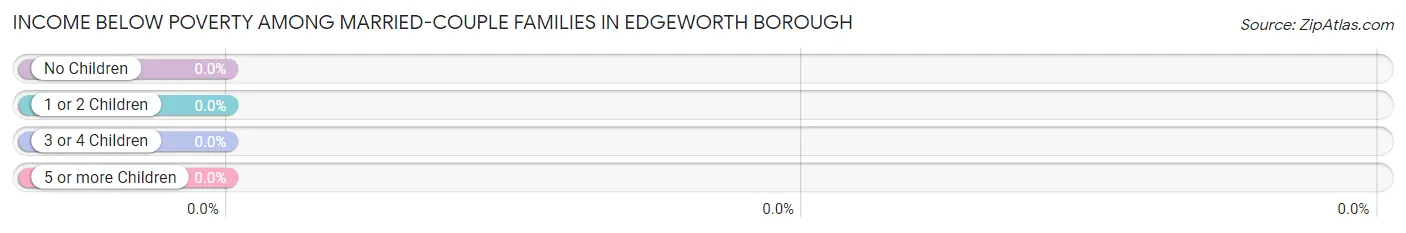
| Children | Above Poverty | Below Poverty |
| No Children | 251 (100.0%) | 0 (0.0%) |
| 1 or 2 Children | 105 (100.0%) | 0 (0.0%) |
| 3 or 4 Children | 54 (100.0%) | 0 (0.0%) |
| 5 or more Children | 0 (0.0%) | 0 (0.0%) |
| Total | 410 (100.0%) | 0 (0.0%) |
Income Below Poverty Among Single-Parent Households in Edgeworth borough
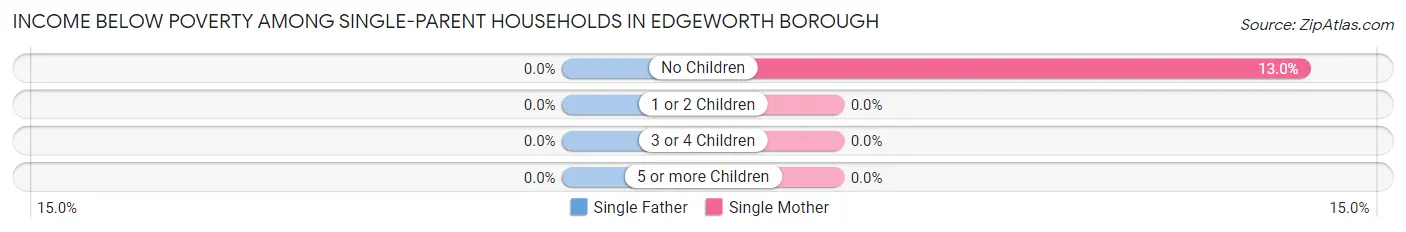
| Children | Single Father | Single Mother |
| No Children | 0 (0.0%) | 3 (13.0%) |
| 1 or 2 Children | 0 (0.0%) | 0 (0.0%) |
| 3 or 4 Children | 0 (0.0%) | 0 (0.0%) |
| 5 or more Children | 0 (0.0%) | 0 (0.0%) |
| Total | 0 (0.0%) | 3 (10.0%) |
Income Below Poverty Among Married-Couple vs Single-Parent Households in Edgeworth borough
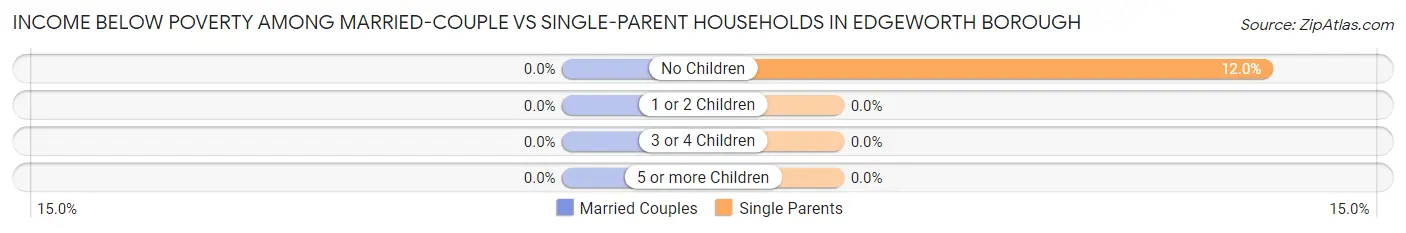
| Children | Married-Couple Families | Single-Parent Households |
| No Children | 0 (0.0%) | 3 (12.0%) |
| 1 or 2 Children | 0 (0.0%) | 0 (0.0%) |
| 3 or 4 Children | 0 (0.0%) | 0 (0.0%) |
| 5 or more Children | 0 (0.0%) | 0 (0.0%) |
| Total | 0 (0.0%) | 3 (7.0%) |
Race in Edgeworth borough
The most populous races in Edgeworth borough are White / Caucasian (1,437 | 94.5%), Hispanic or Latino (48 | 3.2%), and Two or more Races (47 | 3.1%).
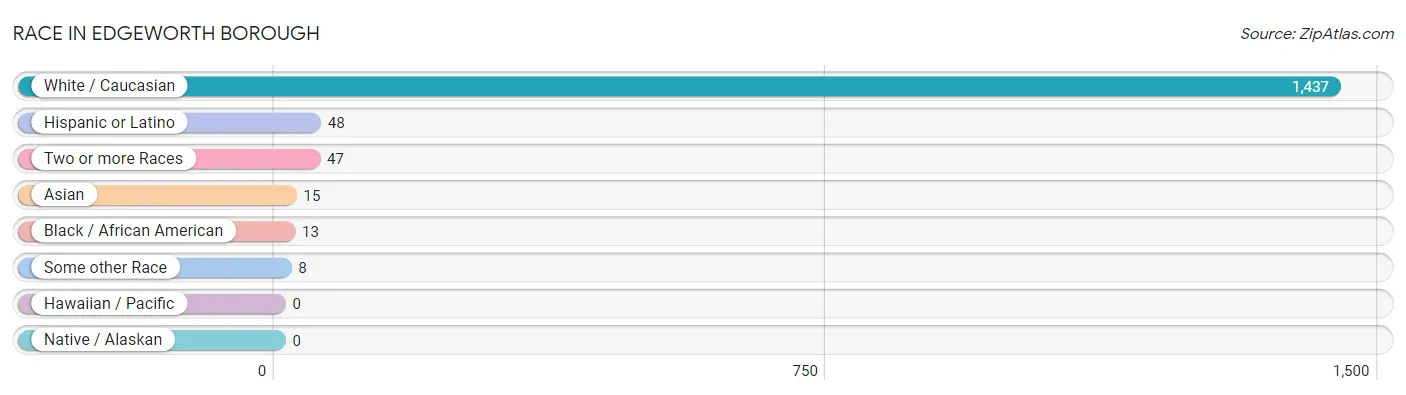
| Race | # Population | % Population |
| Asian | 15 | 1.0% |
| Black / African American | 13 | 0.9% |
| Hawaiian / Pacific | 0 | 0.0% |
| Hispanic or Latino | 48 | 3.2% |
| Native / Alaskan | 0 | 0.0% |
| White / Caucasian | 1,437 | 94.5% |
| Two or more Races | 47 | 3.1% |
| Some other Race | 8 | 0.5% |
| Total | 1,520 | 100.0% |
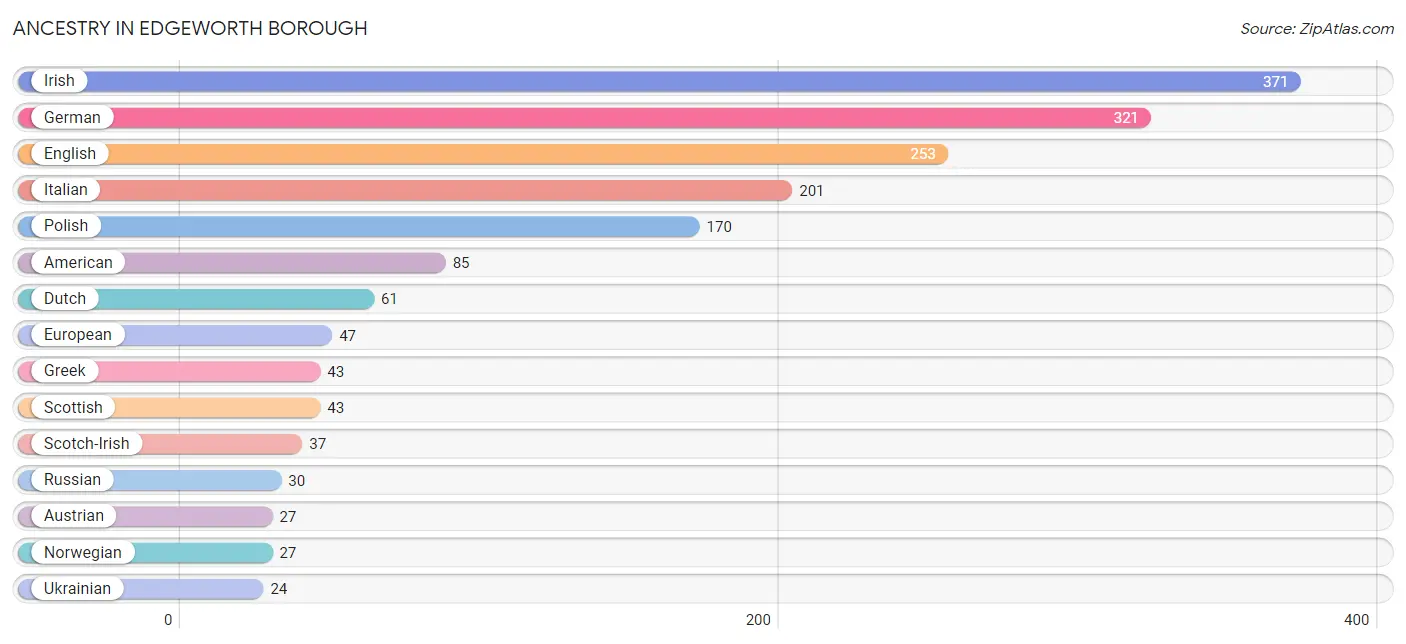
Ancestry in Edgeworth borough
The most populous ancestries reported in Edgeworth borough are Irish (371 | 24.4%), German (321 | 21.1%), English (253 | 16.6%), Italian (201 | 13.2%), and Polish (170 | 11.2%), together accounting for 86.6% of all Edgeworth borough residents.
| Ancestry | # Population | % Population |
| African | 3 | 0.2% |
| American | 85 | 5.6% |
| Arab | 2 | 0.1% |
| Austrian | 27 | 1.8% |
| British | 13 | 0.9% |
| Canadian | 13 | 0.9% |
| Central American | 22 | 1.5% |
| Croatian | 15 | 1.0% |
| Czech | 12 | 0.8% |
| Czechoslovakian | 10 | 0.7% |
| Danish | 2 | 0.1% |
| Dominican | 9 | 0.6% |
| Dutch | 61 | 4.0% |
| Eastern European | 12 | 0.8% |
| English | 253 | 16.6% |
| European | 47 | 3.1% |
| French | 22 | 1.5% |
| French Canadian | 7 | 0.5% |
| German | 321 | 21.1% |
| Greek | 43 | 2.8% |
| Honduran | 2 | 0.1% |
| Hungarian | 22 | 1.5% |
| Indian (Asian) | 9 | 0.6% |
| Irish | 371 | 24.4% |
| Italian | 201 | 13.2% |
| Lebanese | 2 | 0.1% |
| Lithuanian | 7 | 0.5% |
| Macedonian | 15 | 1.0% |
| Nicaraguan | 3 | 0.2% |
| Norwegian | 27 | 1.8% |
| Panamanian | 13 | 0.9% |
| Polish | 170 | 11.2% |
| Romanian | 13 | 0.9% |
| Russian | 30 | 2.0% |
| Salvadoran | 4 | 0.3% |
| Scandinavian | 4 | 0.3% |
| Scotch-Irish | 37 | 2.4% |
| Scottish | 43 | 2.8% |
| Serbian | 7 | 0.5% |
| Slavic | 2 | 0.1% |
| Slovak | 15 | 1.0% |
| Slovene | 8 | 0.5% |
| Spaniard | 17 | 1.1% |
| Subsaharan African | 3 | 0.2% |
| Swedish | 12 | 0.8% |
| Thai | 22 | 1.5% |
| Ukrainian | 24 | 1.6% |
| Welsh | 16 | 1.1% | View All 48 Rows |
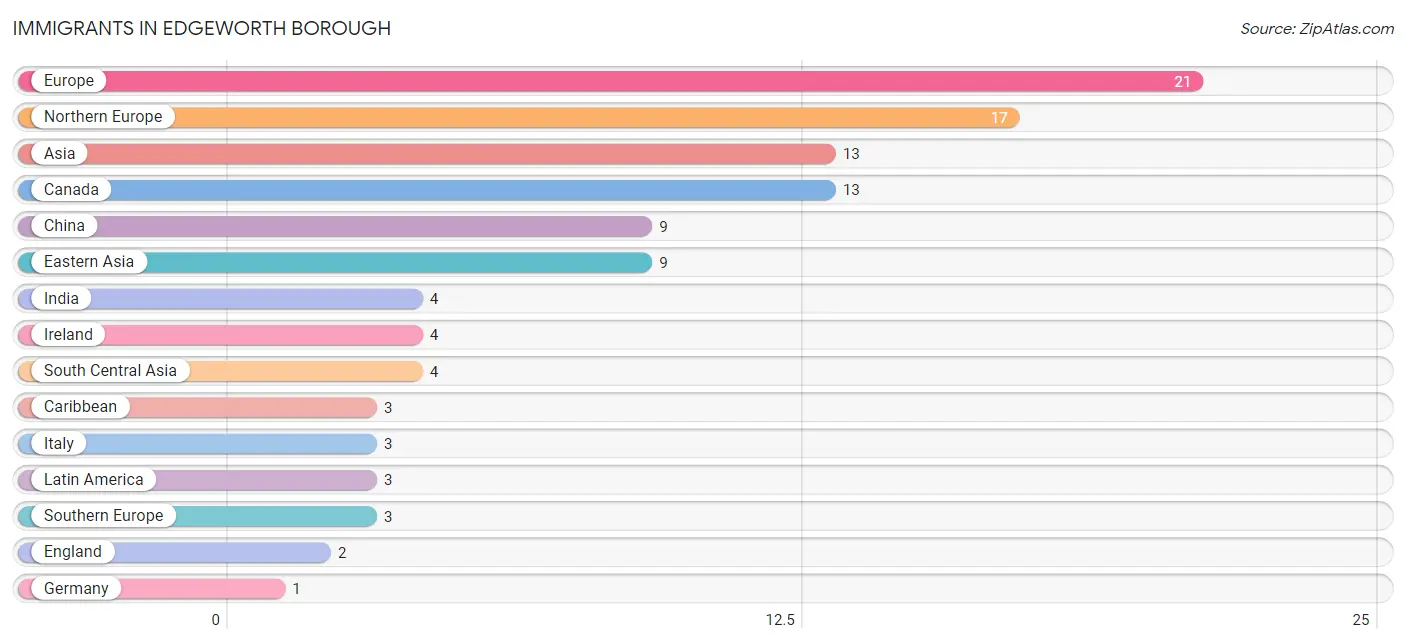
Immigrants in Edgeworth borough
The most numerous immigrant groups reported in Edgeworth borough came from Europe (21 | 1.4%), Northern Europe (17 | 1.1%), Asia (13 | 0.9%), Canada (13 | 0.9%), and China (9 | 0.6%), together accounting for 4.8% of all Edgeworth borough residents.
| Immigration Origin | # Population | % Population |
| Asia | 13 | 0.9% |
| Canada | 13 | 0.9% |
| Caribbean | 3 | 0.2% |
| China | 9 | 0.6% |
| Eastern Asia | 9 | 0.6% |
| England | 2 | 0.1% |
| Europe | 21 | 1.4% |
| Germany | 1 | 0.1% |
| India | 4 | 0.3% |
| Ireland | 4 | 0.3% |
| Italy | 3 | 0.2% |
| Latin America | 3 | 0.2% |
| Northern Europe | 17 | 1.1% |
| South Central Asia | 4 | 0.3% |
| Southern Europe | 3 | 0.2% |
| Western Europe | 1 | 0.1% | View All 16 Rows |
Sex and Age in Edgeworth borough
Sex and Age in Edgeworth borough
The most populous age groups in Edgeworth borough are 55 to 59 Years (75 | 9.8%) for men and 55 to 59 Years (85 | 11.3%) for women.
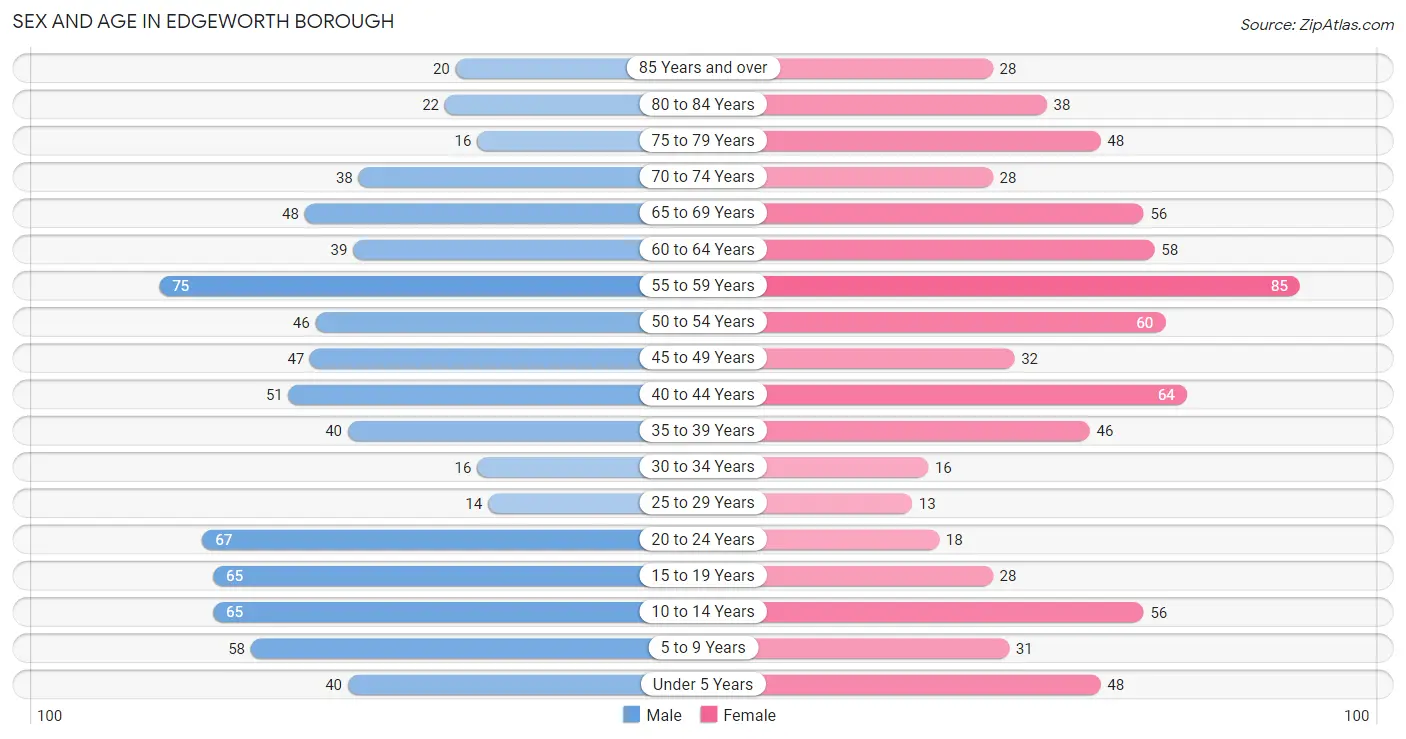
| Age Bracket | Male | Female |
| Under 5 Years | 40 (5.2%) | 48 (6.4%) |
| 5 to 9 Years | 58 (7.6%) | 31 (4.1%) |
| 10 to 14 Years | 65 (8.5%) | 56 (7.4%) |
| 15 to 19 Years | 65 (8.5%) | 28 (3.7%) |
| 20 to 24 Years | 67 (8.7%) | 18 (2.4%) |
| 25 to 29 Years | 14 (1.8%) | 13 (1.7%) |
| 30 to 34 Years | 16 (2.1%) | 16 (2.1%) |
| 35 to 39 Years | 40 (5.2%) | 46 (6.1%) |
| 40 to 44 Years | 51 (6.7%) | 64 (8.5%) |
| 45 to 49 Years | 47 (6.1%) | 32 (4.3%) |
| 50 to 54 Years | 46 (6.0%) | 60 (8.0%) |
| 55 to 59 Years | 75 (9.8%) | 85 (11.3%) |
| 60 to 64 Years | 39 (5.1%) | 58 (7.7%) |
| 65 to 69 Years | 48 (6.3%) | 56 (7.4%) |
| 70 to 74 Years | 38 (5.0%) | 28 (3.7%) |
| 75 to 79 Years | 16 (2.1%) | 48 (6.4%) |
| 80 to 84 Years | 22 (2.9%) | 38 (5.1%) |
| 85 Years and over | 20 (2.6%) | 28 (3.7%) |
| Total | 767 (100.0%) | 753 (100.0%) |
Families and Households in Edgeworth borough
Median Family Size in Edgeworth borough
The median family size in Edgeworth borough is 3.03 persons per family, with married-couple families (410 | 90.5%) accounting for the largest median family size of 3.09 persons per family. On the other hand, single female/mother families (30 | 6.6%) represent the smallest median family size with 2.37 persons per family.
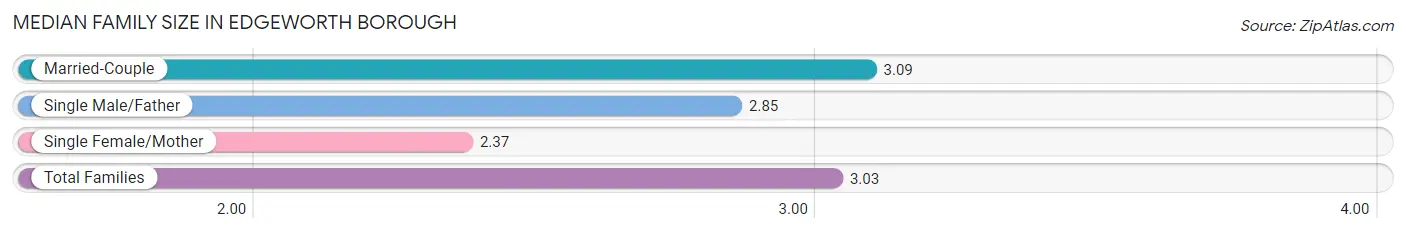
| Family Type | # Families | Family Size |
| Married-Couple | 410 (90.5%) | 3.09 |
| Single Male/Father | 13 (2.9%) | 2.85 |
| Single Female/Mother | 30 (6.6%) | 2.37 |
| Total Families | 453 (100.0%) | 3.03 |
Median Household Size in Edgeworth borough
The median household size in Edgeworth borough is 2.64 persons per household, with single male/father households (13 | 2.3%) accounting for the largest median household size of 3.15 persons per household. non-family households (121 | 21.1%) represent the smallest median household size with 1.16 persons per household.
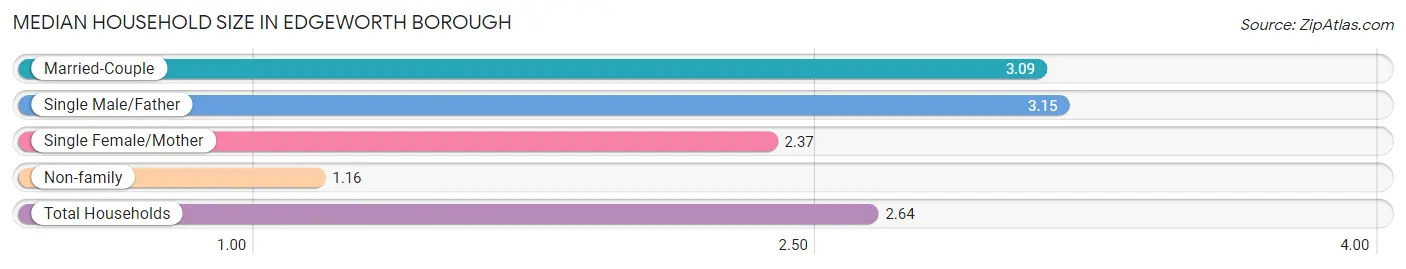
| Household Type | # Households | Household Size |
| Married-Couple | 410 (71.4%) | 3.09 |
| Single Male/Father | 13 (2.3%) | 3.15 |
| Single Female/Mother | 30 (5.2%) | 2.37 |
| Non-family | 121 (21.1%) | 1.16 |
| Total Households | 574 (100.0%) | 2.64 |
Household Size by Marriage Status in Edgeworth borough
Out of a total of 574 households in Edgeworth borough, 453 (78.9%) are family households, while 121 (21.1%) are nonfamily households. The most numerous type of family households are 2-person households, comprising 219, and the most common type of nonfamily households are 1-person households, comprising 105.
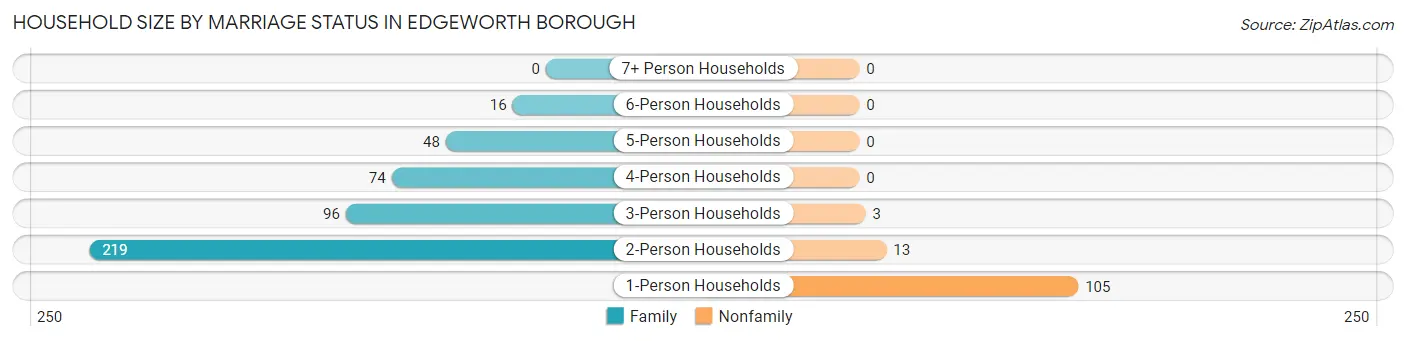
| Household Size | Family Households | Nonfamily Households |
| 1-Person Households | - | 105 (18.3%) |
| 2-Person Households | 219 (38.2%) | 13 (2.3%) |
| 3-Person Households | 96 (16.7%) | 3 (0.5%) |
| 4-Person Households | 74 (12.9%) | 0 (0.0%) |
| 5-Person Households | 48 (8.4%) | 0 (0.0%) |
| 6-Person Households | 16 (2.8%) | 0 (0.0%) |
| 7+ Person Households | 0 (0.0%) | 0 (0.0%) |
| Total | 453 (78.9%) | 121 (21.1%) |
Female Fertility in Edgeworth borough
Fertility by Age in Edgeworth borough
Average fertility rate in Edgeworth borough is 64.0 births per 1,000 women. Women in the age bracket of 35 to 50 years have the highest fertility rate with 76.0 births per 1,000 women. Women in the age bracket of 35 to 50 years acount for 78.6% of all women with births.
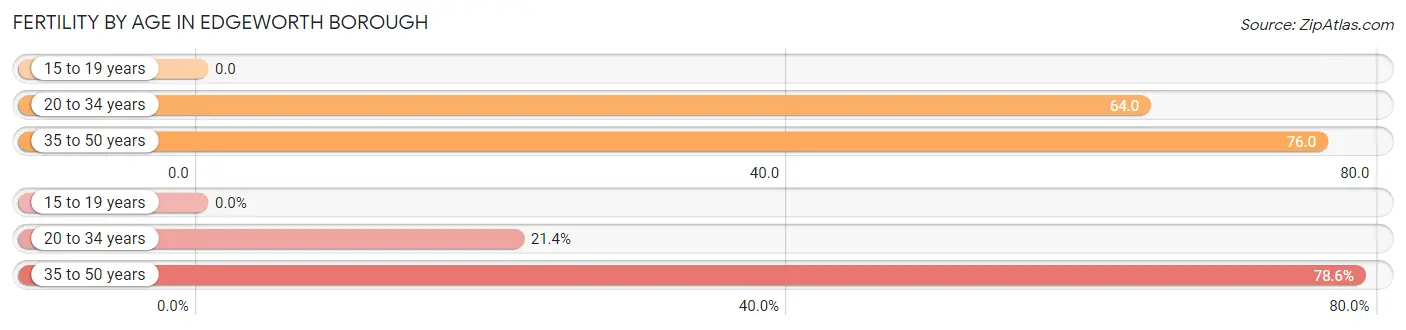
| Age Bracket | Women with Births | Births / 1,000 Women |
| 15 to 19 years | 0 (0.0%) | 0.0 |
| 20 to 34 years | 3 (21.4%) | 64.0 |
| 35 to 50 years | 11 (78.6%) | 76.0 |
| Total | 14 (100.0%) | 64.0 |
Fertility by Age by Marriage Status in Edgeworth borough
71.4% of women with births (14) in Edgeworth borough are married. The highest percentage of unmarried women with births falls into 35 to 50 years age bracket with 36.4% of them unmarried at the time of birth, while the lowest percentage of unmarried women with births belong to 20 to 34 years age bracket with 0.0% of them unmarried.
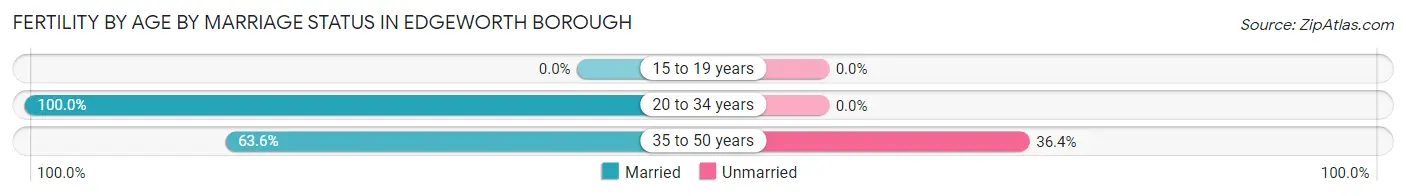
| Age Bracket | Married | Unmarried |
| 15 to 19 years | 0 (0.0%) | 0 (0.0%) |
| 20 to 34 years | 3 (100.0%) | 0 (0.0%) |
| 35 to 50 years | 7 (63.6%) | 4 (36.4%) |
| Total | 10 (71.4%) | 4 (28.6%) |
Fertility by Education in Edgeworth borough
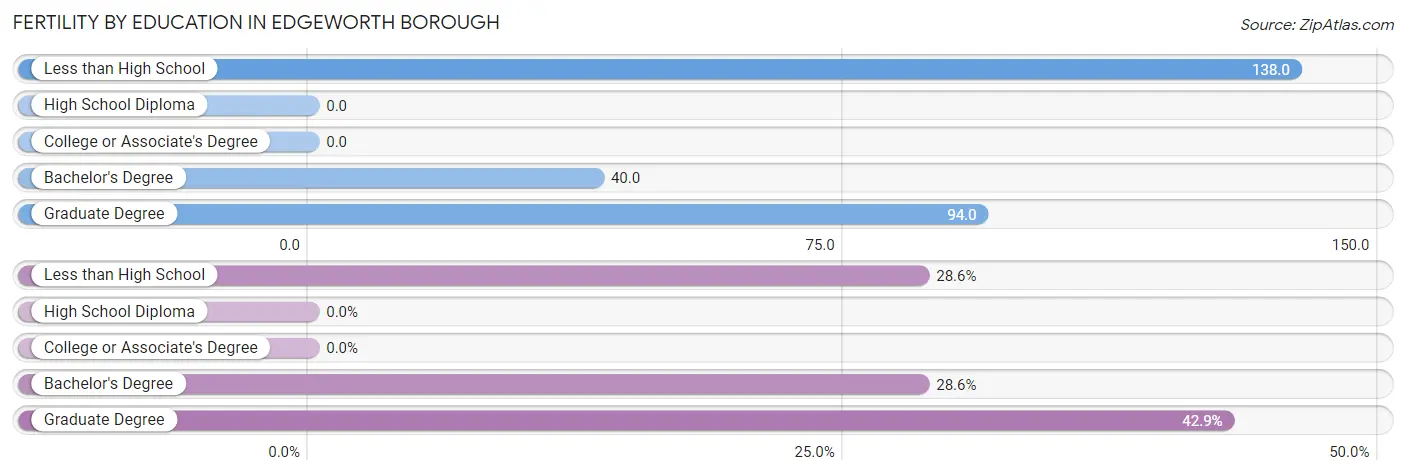
| Educational Attainment | Women with Births | Births / 1,000 Women |
| Less than High School | 4 (28.6%) | 138.0 |
| High School Diploma | 0 (0.0%) | 0.0 |
| College or Associate's Degree | 0 (0.0%) | 0.0 |
| Bachelor's Degree | 4 (28.6%) | 40.0 |
| Graduate Degree | 6 (42.9%) | 94.0 |
| Total | 14 (100.0%) | 64.0 |
Fertility by Education by Marriage Status in Edgeworth borough
28.6% of women with births in Edgeworth borough are unmarried. Women with the educational attainment of bachelor's degree are most likely to be married with 100.0% of them married at childbirth, while women with the educational attainment of less than high school are least likely to be married with 100.0% of them unmarried at childbirth.
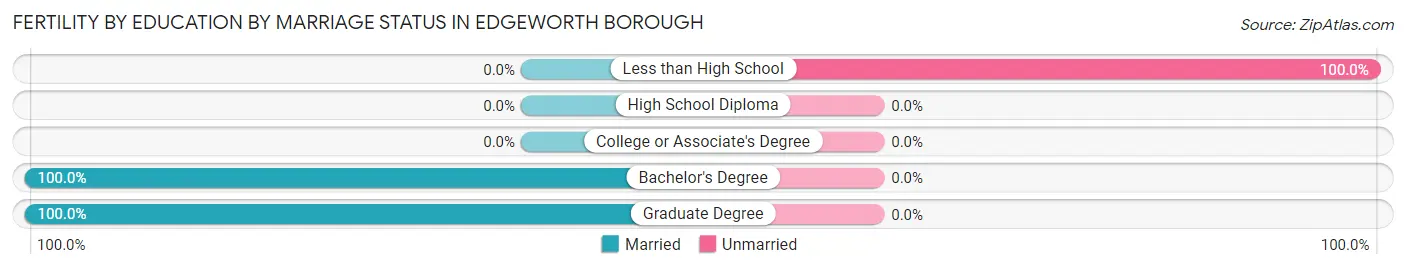
| Educational Attainment | Married | Unmarried |
| Less than High School | 0 (0.0%) | 4 (100.0%) |
| High School Diploma | 0 (0.0%) | 0 (0.0%) |
| College or Associate's Degree | 0 (0.0%) | 0 (0.0%) |
| Bachelor's Degree | 4 (100.0%) | 0 (0.0%) |
| Graduate Degree | 6 (100.0%) | 0 (0.0%) |
| Total | 10 (71.4%) | 4 (28.6%) |
Employment Characteristics in Edgeworth borough
Employment by Class of Employer in Edgeworth borough
Among the 660 employed individuals in Edgeworth borough, private company employees (437 | 66.2%), not-for-profit organizations (104 | 15.8%), and self-employed (not incorporated) (64 | 9.7%) make up the most common classes of employment.
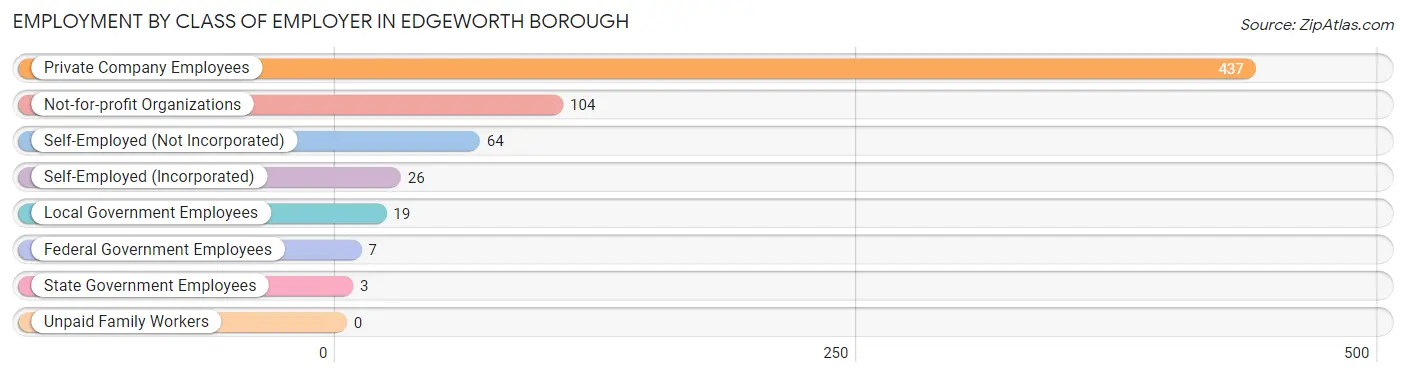
| Employer Class | # Employees | % Employees |
| Private Company Employees | 437 | 66.2% |
| Self-Employed (Incorporated) | 26 | 3.9% |
| Self-Employed (Not Incorporated) | 64 | 9.7% |
| Not-for-profit Organizations | 104 | 15.8% |
| Local Government Employees | 19 | 2.9% |
| State Government Employees | 3 | 0.4% |
| Federal Government Employees | 7 | 1.1% |
| Unpaid Family Workers | 0 | 0.0% |
| Total | 660 | 100.0% |
Employment Status by Age in Edgeworth borough
According to the labor force statistics for Edgeworth borough, out of the total population over 16 years of age (1,196), 58.4% or 698 individuals are in the labor force, with 4.0% or 28 of them unemployed. The age group with the highest labor force participation rate is 25 to 29 years, with 100.0% or 27 individuals in the labor force. Within the labor force, the 16 to 19 years age range has the highest percentage of unemployed individuals, with 50.0% or 7 of them being unemployed.
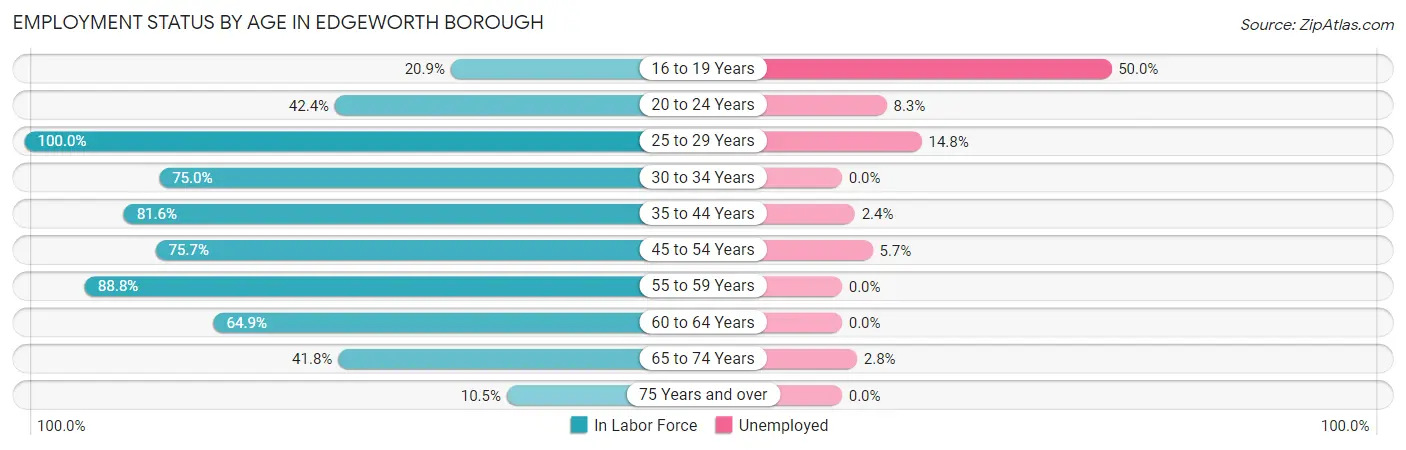
| Age Bracket | In Labor Force | Unemployed |
| 16 to 19 Years | 14 (20.9%) | 7 (50.0%) |
| 20 to 24 Years | 36 (42.4%) | 3 (8.3%) |
| 25 to 29 Years | 27 (100.0%) | 4 (14.8%) |
| 30 to 34 Years | 24 (75.0%) | 0 (0.0%) |
| 35 to 44 Years | 164 (81.6%) | 4 (2.4%) |
| 45 to 54 Years | 140 (75.7%) | 8 (5.7%) |
| 55 to 59 Years | 142 (88.8%) | 0 (0.0%) |
| 60 to 64 Years | 63 (64.9%) | 0 (0.0%) |
| 65 to 74 Years | 71 (41.8%) | 2 (2.8%) |
| 75 Years and over | 18 (10.5%) | 0 (0.0%) |
| Total | 698 (58.4%) | 28 (4.0%) |
Employment Status by Educational Attainment in Edgeworth borough
According to labor force statistics for Edgeworth borough, 79.8% of individuals (560) out of the total population between 25 and 64 years of age (702) are in the labor force, with 2.9% or 16 of them being unemployed. The group with the highest labor force participation rate are those with the educational attainment of less than high school, with 100.0% or 6 individuals in the labor force. Within the labor force, individuals with college / associate degree education have the highest percentage of unemployment, with 21.1% or 8 of them being unemployed.
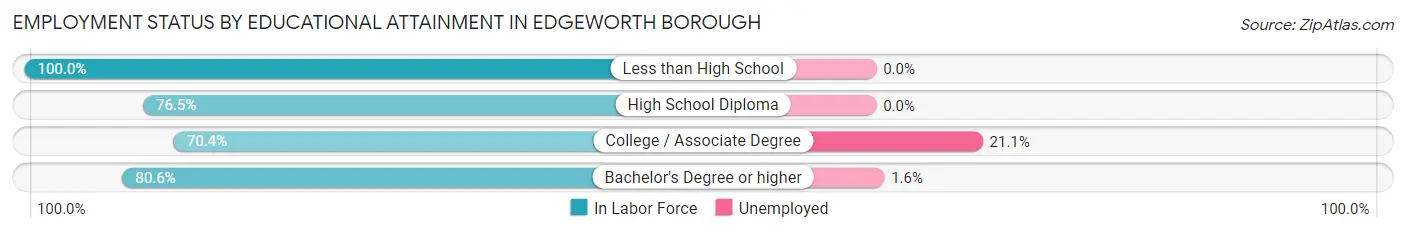
| Educational Attainment | In Labor Force | Unemployed |
| Less than High School | 6 (100.0%) | 0 (0.0%) |
| High School Diploma | 26 (76.5%) | 0 (0.0%) |
| College / Associate Degree | 38 (70.4%) | 11 (21.1%) |
| Bachelor's Degree or higher | 490 (80.6%) | 10 (1.6%) |
| Total | 560 (79.8%) | 20 (2.9%) |
Employment Occupations by Sex in Edgeworth borough
Management, Business, Science and Arts Occupations
The most common Management, Business, Science and Arts occupations in Edgeworth borough are Management (156 | 23.3%), Community & Social Service (105 | 15.7%), Health Diagnosing & Treating (91 | 13.6%), Business & Financial (88 | 13.1%), and Health Technologists (74 | 11.0%).
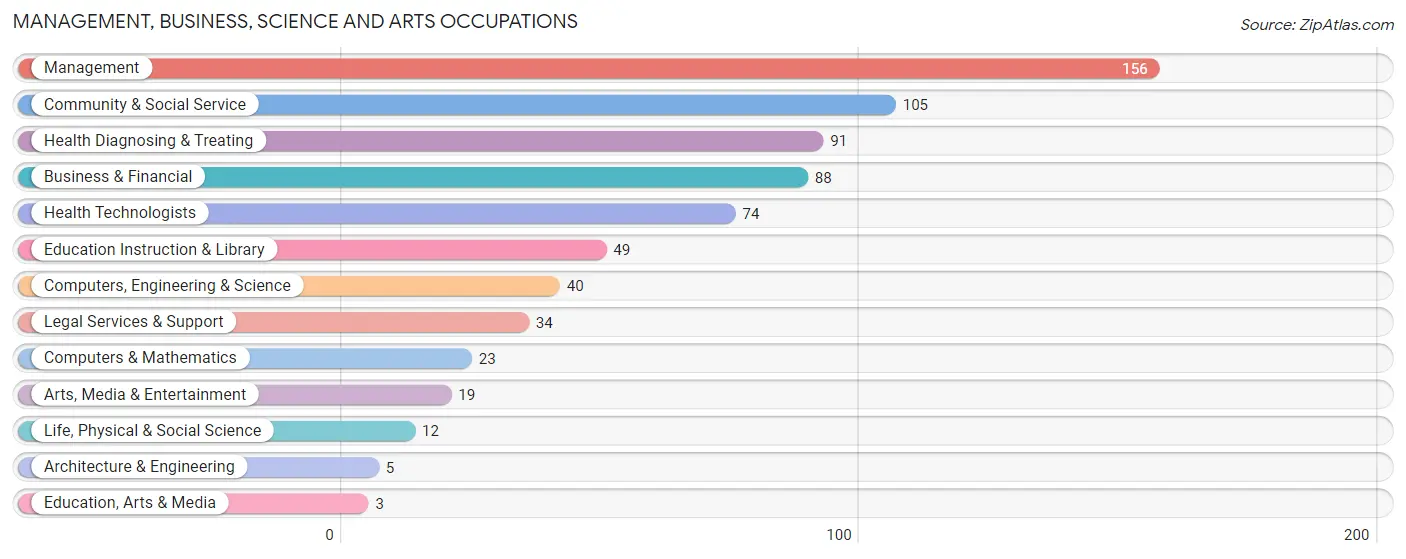
Management, Business, Science and Arts Occupations by Sex
Within the Management, Business, Science and Arts occupations in Edgeworth borough, the most male-oriented occupations are Architecture & Engineering (100.0%), Management (79.5%), and Health Diagnosing & Treating (59.3%), while the most female-oriented occupations are Education, Arts & Media (100.0%), Arts, Media & Entertainment (78.9%), and Life, Physical & Social Science (66.7%).
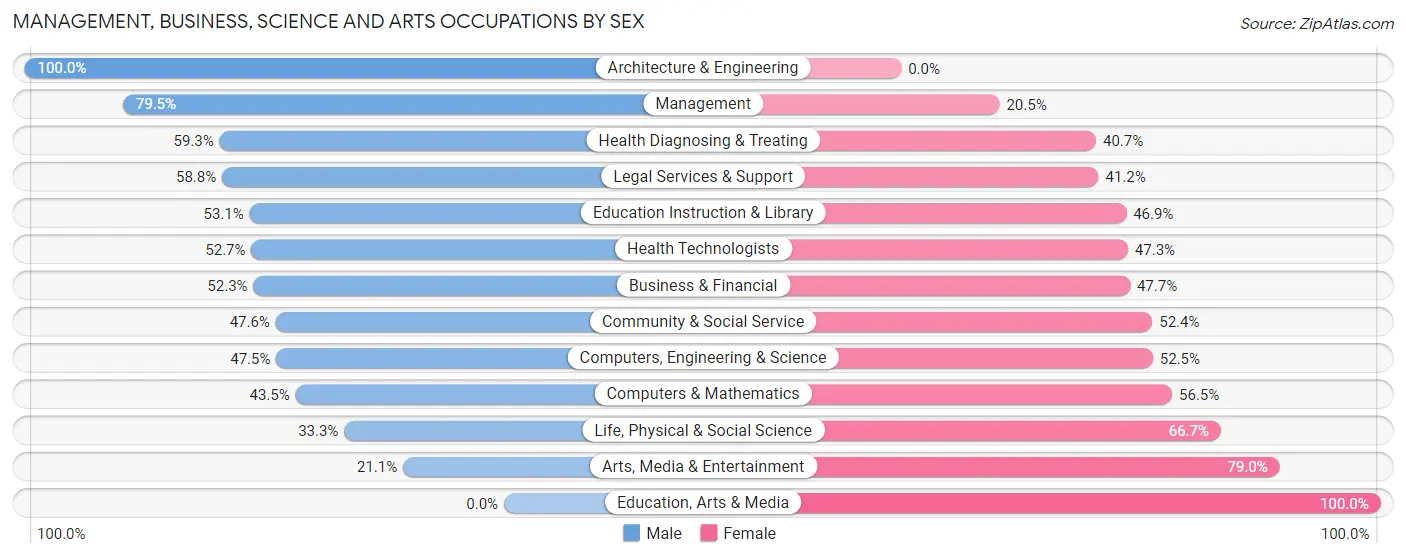
| Occupation | Male | Female |
| Management | 124 (79.5%) | 32 (20.5%) |
| Business & Financial | 46 (52.3%) | 42 (47.7%) |
| Computers, Engineering & Science | 19 (47.5%) | 21 (52.5%) |
| Computers & Mathematics | 10 (43.5%) | 13 (56.5%) |
| Architecture & Engineering | 5 (100.0%) | 0 (0.0%) |
| Life, Physical & Social Science | 4 (33.3%) | 8 (66.7%) |
| Community & Social Service | 50 (47.6%) | 55 (52.4%) |
| Education, Arts & Media | 0 (0.0%) | 3 (100.0%) |
| Legal Services & Support | 20 (58.8%) | 14 (41.2%) |
| Education Instruction & Library | 26 (53.1%) | 23 (46.9%) |
| Arts, Media & Entertainment | 4 (21.0%) | 15 (78.9%) |
| Health Diagnosing & Treating | 54 (59.3%) | 37 (40.7%) |
| Health Technologists | 39 (52.7%) | 35 (47.3%) |
| Total (Category) | 293 (61.0%) | 187 (39.0%) |
| Total (Overall) | 389 (58.0%) | 282 (42.0%) |
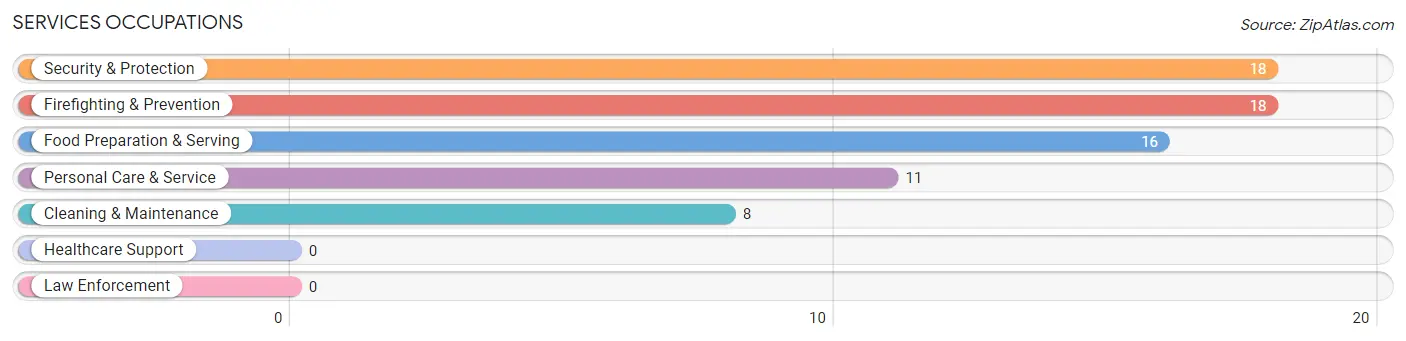
Services Occupations
The most common Services occupations in Edgeworth borough are Security & Protection (18 | 2.7%), Firefighting & Prevention (18 | 2.7%), Food Preparation & Serving (16 | 2.4%), Personal Care & Service (11 | 1.6%), and Cleaning & Maintenance (8 | 1.2%).
Services Occupations by Sex
Within the Services occupations in Edgeworth borough, the most male-oriented occupations are Cleaning & Maintenance (100.0%), Food Preparation & Serving (31.2%), and Security & Protection (16.7%), while the most female-oriented occupations are Personal Care & Service (100.0%), Security & Protection (83.3%), and Firefighting & Prevention (83.3%).
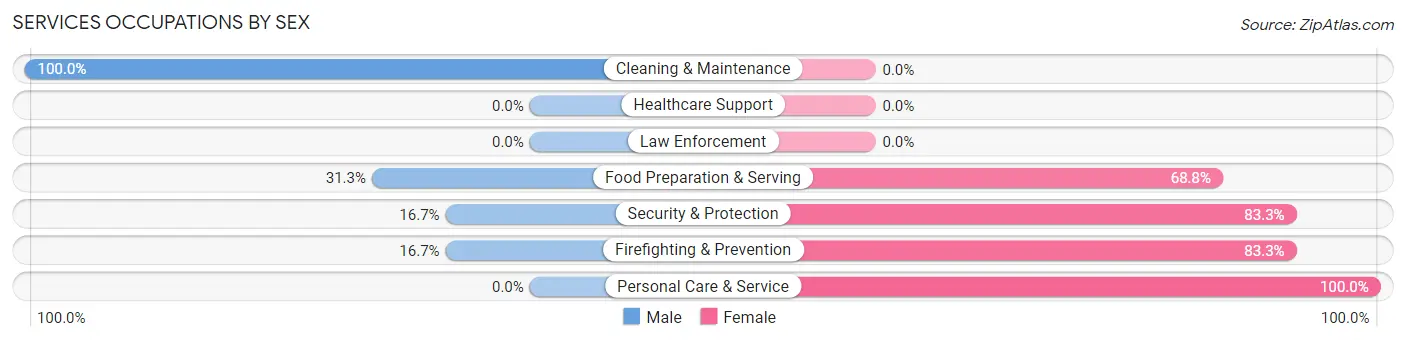
| Occupation | Male | Female |
| Healthcare Support | 0 (0.0%) | 0 (0.0%) |
| Security & Protection | 3 (16.7%) | 15 (83.3%) |
| Firefighting & Prevention | 3 (16.7%) | 15 (83.3%) |
| Law Enforcement | 0 (0.0%) | 0 (0.0%) |
| Food Preparation & Serving | 5 (31.2%) | 11 (68.8%) |
| Cleaning & Maintenance | 8 (100.0%) | 0 (0.0%) |
| Personal Care & Service | 0 (0.0%) | 11 (100.0%) |
| Total (Category) | 16 (30.2%) | 37 (69.8%) |
| Total (Overall) | 389 (58.0%) | 282 (42.0%) |
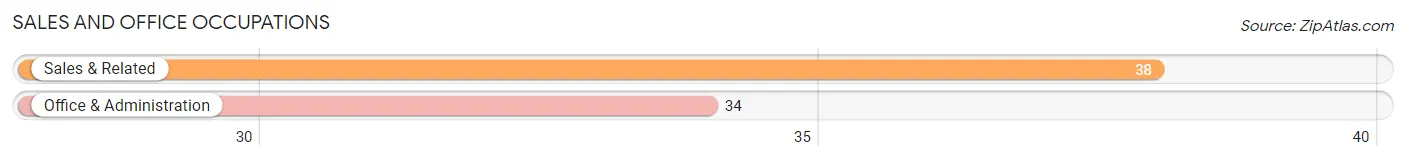
Sales and Office Occupations
The most common Sales and Office occupations in Edgeworth borough are Sales & Related (38 | 5.7%), and Office & Administration (34 | 5.1%).
Sales and Office Occupations by Sex
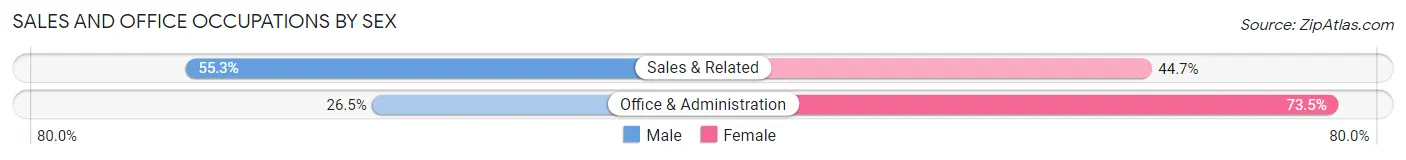
| Occupation | Male | Female |
| Sales & Related | 21 (55.3%) | 17 (44.7%) |
| Office & Administration | 9 (26.5%) | 25 (73.5%) |
| Total (Category) | 30 (41.7%) | 42 (58.3%) |
| Total (Overall) | 389 (58.0%) | 282 (42.0%) |
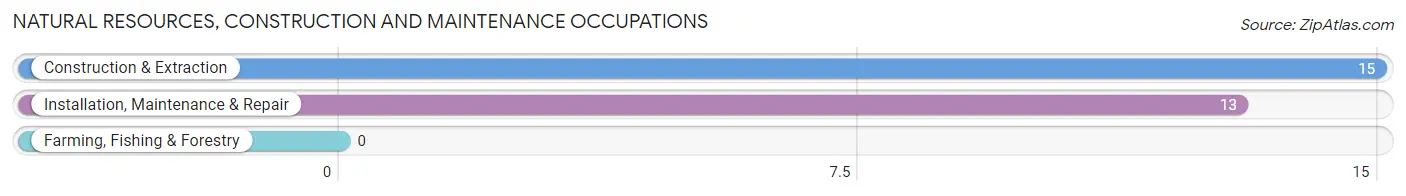
Natural Resources, Construction and Maintenance Occupations
The most common Natural Resources, Construction and Maintenance occupations in Edgeworth borough are Construction & Extraction (15 | 2.2%), and Installation, Maintenance & Repair (13 | 1.9%).
Natural Resources, Construction and Maintenance Occupations by Sex
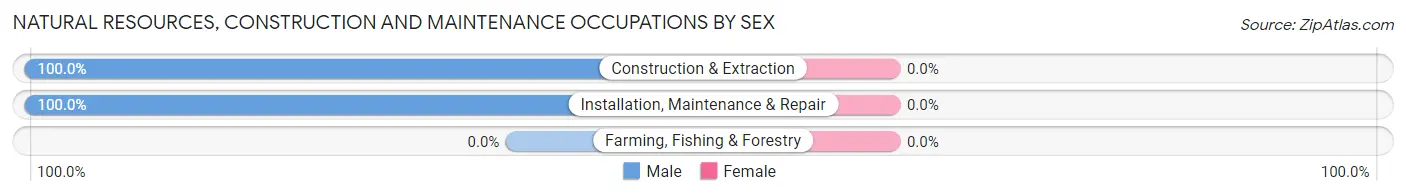
| Occupation | Male | Female |
| Farming, Fishing & Forestry | 0 (0.0%) | 0 (0.0%) |
| Construction & Extraction | 15 (100.0%) | 0 (0.0%) |
| Installation, Maintenance & Repair | 13 (100.0%) | 0 (0.0%) |
| Total (Category) | 28 (100.0%) | 0 (0.0%) |
| Total (Overall) | 389 (58.0%) | 282 (42.0%) |
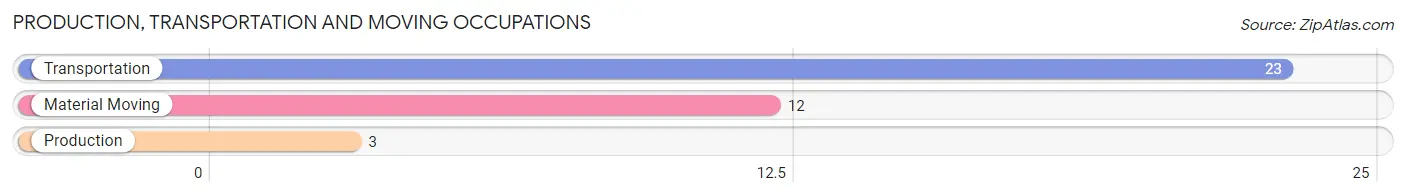
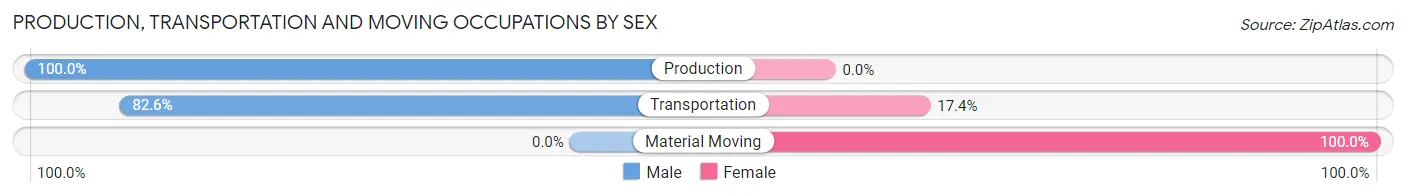
Production, Transportation and Moving Occupations
The most common Production, Transportation and Moving occupations in Edgeworth borough are Transportation (23 | 3.4%), Material Moving (12 | 1.8%), and Production (3 | 0.4%).
Production, Transportation and Moving Occupations by Sex
| Occupation | Male | Female |
| Production | 3 (100.0%) | 0 (0.0%) |
| Transportation | 19 (82.6%) | 4 (17.4%) |
| Material Moving | 0 (0.0%) | 12 (100.0%) |
| Total (Category) | 22 (57.9%) | 16 (42.1%) |
| Total (Overall) | 389 (58.0%) | 282 (42.0%) |
Employment Industries by Sex in Edgeworth borough
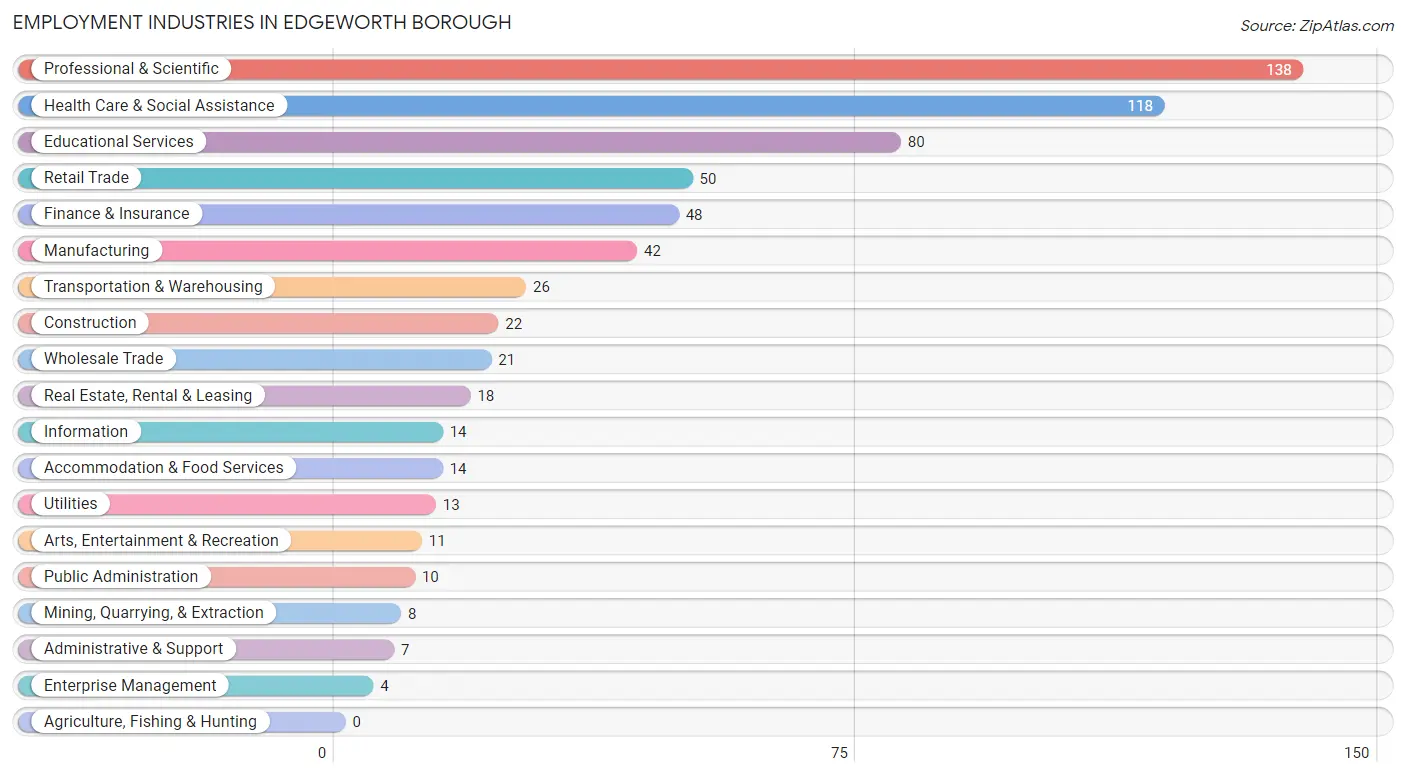
Employment Industries in Edgeworth borough
The major employment industries in Edgeworth borough include Professional & Scientific (138 | 20.6%), Health Care & Social Assistance (118 | 17.6%), Educational Services (80 | 11.9%), Retail Trade (50 | 7.4%), and Finance & Insurance (48 | 7.1%).
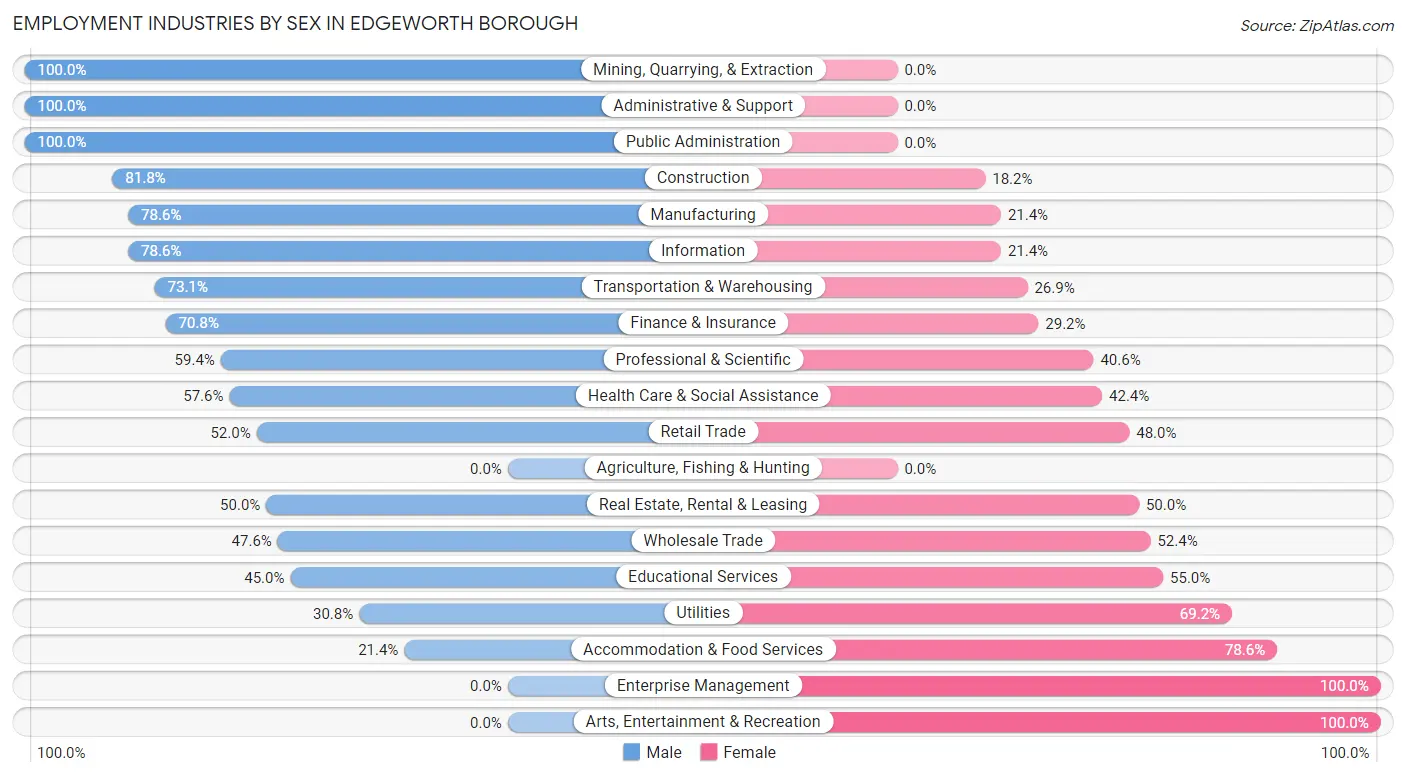
Employment Industries by Sex in Edgeworth borough
The Edgeworth borough industries that see more men than women are Mining, Quarrying, & Extraction (100.0%), Administrative & Support (100.0%), and Public Administration (100.0%), whereas the industries that tend to have a higher number of women are Enterprise Management (100.0%), Arts, Entertainment & Recreation (100.0%), and Accommodation & Food Services (78.6%).
| Industry | Male | Female |
| Agriculture, Fishing & Hunting | 0 (0.0%) | 0 (0.0%) |
| Mining, Quarrying, & Extraction | 8 (100.0%) | 0 (0.0%) |
| Construction | 18 (81.8%) | 4 (18.2%) |
| Manufacturing | 33 (78.6%) | 9 (21.4%) |
| Wholesale Trade | 10 (47.6%) | 11 (52.4%) |
| Retail Trade | 26 (52.0%) | 24 (48.0%) |
| Transportation & Warehousing | 19 (73.1%) | 7 (26.9%) |
| Utilities | 4 (30.8%) | 9 (69.2%) |
| Information | 11 (78.6%) | 3 (21.4%) |
| Finance & Insurance | 34 (70.8%) | 14 (29.2%) |
| Real Estate, Rental & Leasing | 9 (50.0%) | 9 (50.0%) |
| Professional & Scientific | 82 (59.4%) | 56 (40.6%) |
| Enterprise Management | 0 (0.0%) | 4 (100.0%) |
| Administrative & Support | 7 (100.0%) | 0 (0.0%) |
| Educational Services | 36 (45.0%) | 44 (55.0%) |
| Health Care & Social Assistance | 68 (57.6%) | 50 (42.4%) |
| Arts, Entertainment & Recreation | 0 (0.0%) | 11 (100.0%) |
| Accommodation & Food Services | 3 (21.4%) | 11 (78.6%) |
| Public Administration | 10 (100.0%) | 0 (0.0%) |
| Total | 389 (58.0%) | 282 (42.0%) |
Education in Edgeworth borough
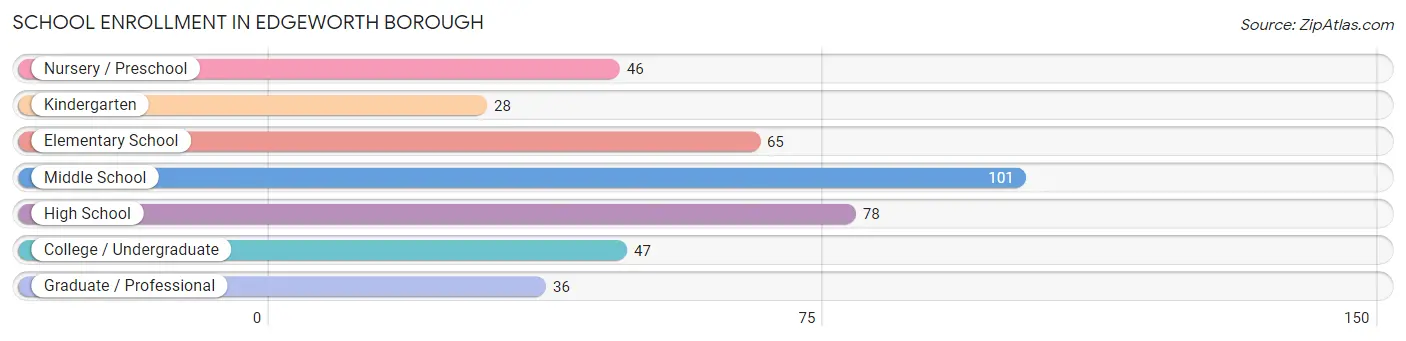
School Enrollment in Edgeworth borough
The most common levels of schooling among the 401 students in Edgeworth borough are middle school (101 | 25.2%), high school (78 | 19.5%), and elementary school (65 | 16.2%).
| School Level | # Students | % Students |
| Nursery / Preschool | 46 | 11.5% |
| Kindergarten | 28 | 7.0% |
| Elementary School | 65 | 16.2% |
| Middle School | 101 | 25.2% |
| High School | 78 | 19.5% |
| College / Undergraduate | 47 | 11.7% |
| Graduate / Professional | 36 | 9.0% |
| Total | 401 | 100.0% |
School Enrollment by Age by Funding Source in Edgeworth borough
Out of a total of 401 students who are enrolled in schools in Edgeworth borough, 179 (44.6%) attend a private institution, while the remaining 222 (55.4%) are enrolled in public schools. The age group of 35 years and over has the highest likelihood of being enrolled in private schools, with 21 (100.0% in the age bracket) enrolled. Conversely, the age group of 10 to 14 year olds has the lowest likelihood of being enrolled in a private school, with 92 (76.0% in the age bracket) attending a public institution.
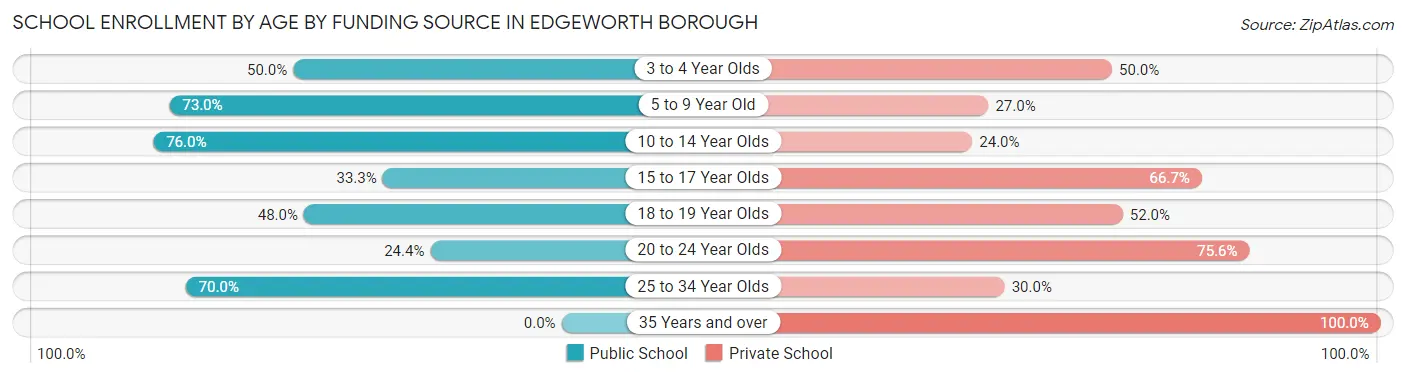
| Age Bracket | Public School | Private School |
| 3 to 4 Year Olds | 15 (50.0%) | 15 (50.0%) |
| 5 to 9 Year Old | 65 (73.0%) | 24 (27.0%) |
| 10 to 14 Year Olds | 92 (76.0%) | 29 (24.0%) |
| 15 to 17 Year Olds | 20 (33.3%) | 40 (66.7%) |
| 18 to 19 Year Olds | 12 (48.0%) | 13 (52.0%) |
| 20 to 24 Year Olds | 11 (24.4%) | 34 (75.6%) |
| 25 to 34 Year Olds | 7 (70.0%) | 3 (30.0%) |
| 35 Years and over | 0 (0.0%) | 21 (100.0%) |
| Total | 222 (55.4%) | 179 (44.6%) |
Educational Attainment by Field of Study in Edgeworth borough
Business (150 | 16.2%), social sciences (114 | 12.3%), engineering (82 | 8.9%), physical & health sciences (66 | 7.1%), and psychology (60 | 6.5%) are the most common fields of study among 924 individuals in Edgeworth borough who have obtained a bachelor's degree or higher.
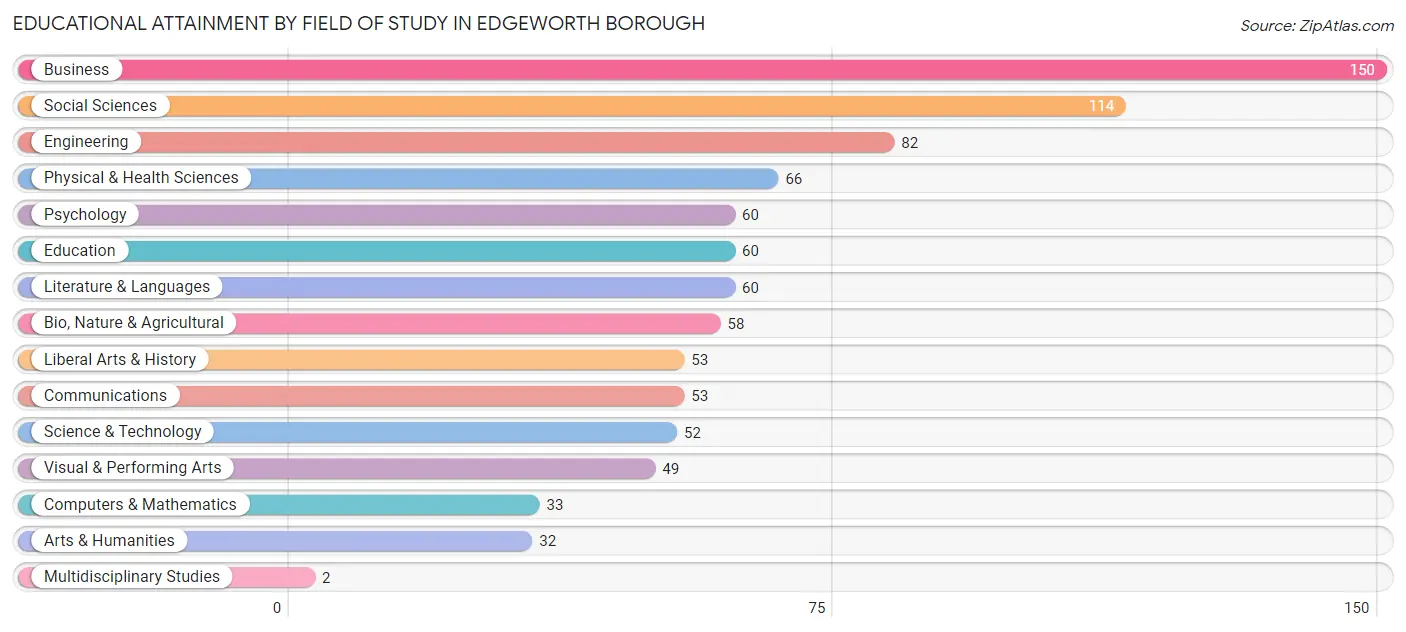
| Field of Study | # Graduates | % Graduates |
| Computers & Mathematics | 33 | 3.6% |
| Bio, Nature & Agricultural | 58 | 6.3% |
| Physical & Health Sciences | 66 | 7.1% |
| Psychology | 60 | 6.5% |
| Social Sciences | 114 | 12.3% |
| Engineering | 82 | 8.9% |
| Multidisciplinary Studies | 2 | 0.2% |
| Science & Technology | 52 | 5.6% |
| Business | 150 | 16.2% |
| Education | 60 | 6.5% |
| Literature & Languages | 60 | 6.5% |
| Liberal Arts & History | 53 | 5.7% |
| Visual & Performing Arts | 49 | 5.3% |
| Communications | 53 | 5.7% |
| Arts & Humanities | 32 | 3.5% |
| Total | 924 | 100.0% |
Transportation & Commute in Edgeworth borough
Vehicle Availability by Sex in Edgeworth borough
The most prevalent vehicle ownership categories in Edgeworth borough are males with 2 vehicles (233, accounting for 60.4%) and females with 2 vehicles (160, making up 85.0%).
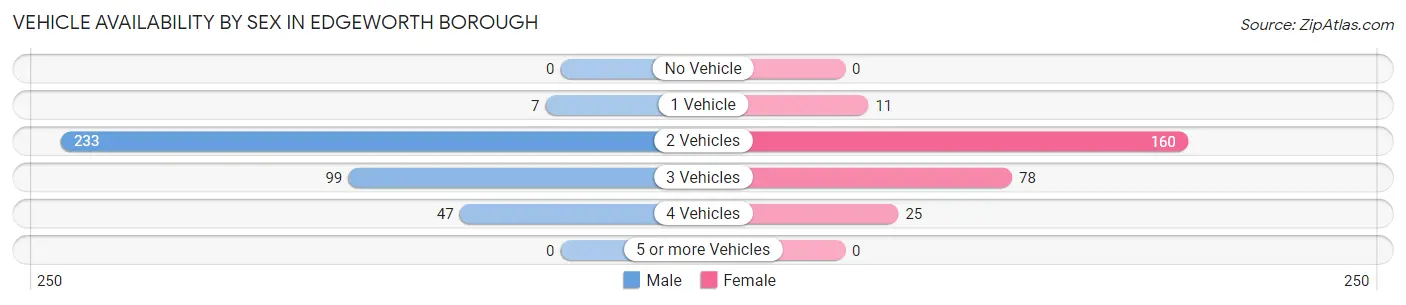
| Vehicles Available | Male | Female |
| No Vehicle | 0 (0.0%) | 0 (0.0%) |
| 1 Vehicle | 7 (1.8%) | 11 (4.0%) |
| 2 Vehicles | 233 (60.4%) | 160 (58.4%) |
| 3 Vehicles | 99 (25.7%) | 78 (28.5%) |
| 4 Vehicles | 47 (12.2%) | 25 (9.1%) |
| 5 or more Vehicles | 0 (0.0%) | 0 (0.0%) |
| Total | 386 (100.0%) | 274 (100.0%) |
Commute Time in Edgeworth borough
The most frequently occuring commute durations in Edgeworth borough are 20 to 24 minutes (99 commuters, 20.6%), 30 to 34 minutes (66 commuters, 13.8%), and 5 to 9 minutes (58 commuters, 12.1%).
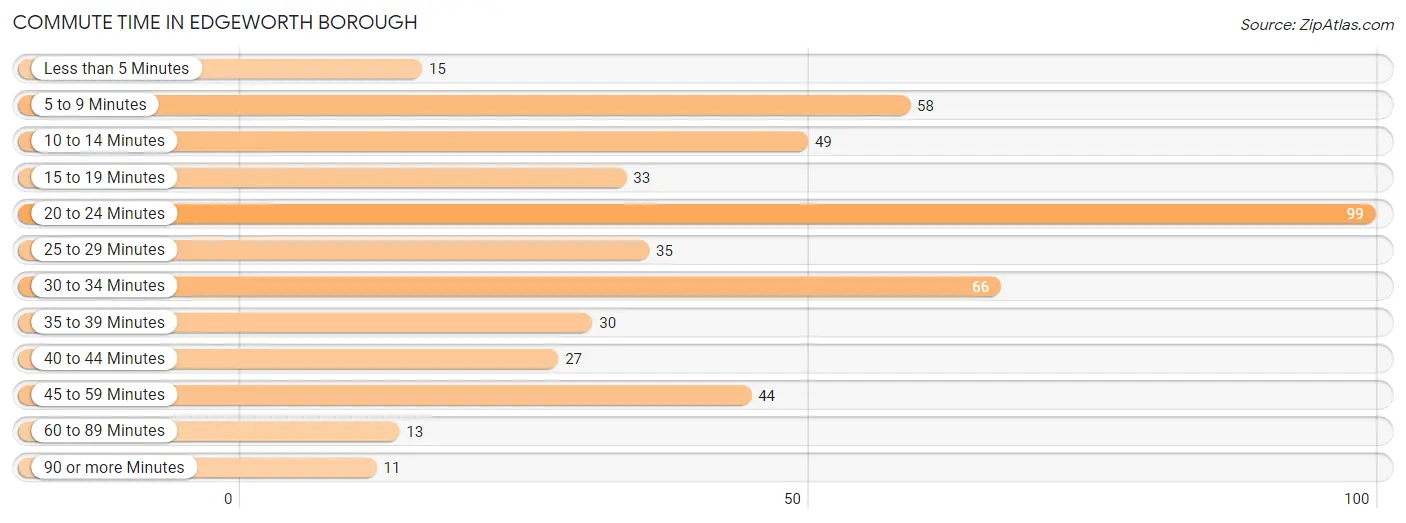
| Commute Time | # Commuters | % Commuters |
| Less than 5 Minutes | 15 | 3.1% |
| 5 to 9 Minutes | 58 | 12.1% |
| 10 to 14 Minutes | 49 | 10.2% |
| 15 to 19 Minutes | 33 | 6.9% |
| 20 to 24 Minutes | 99 | 20.6% |
| 25 to 29 Minutes | 35 | 7.3% |
| 30 to 34 Minutes | 66 | 13.8% |
| 35 to 39 Minutes | 30 | 6.2% |
| 40 to 44 Minutes | 27 | 5.6% |
| 45 to 59 Minutes | 44 | 9.2% |
| 60 to 89 Minutes | 13 | 2.7% |
| 90 or more Minutes | 11 | 2.3% |
Commute Time by Sex in Edgeworth borough
The most common commute times in Edgeworth borough are 20 to 24 minutes (52 commuters, 17.9%) for males and 20 to 24 minutes (47 commuters, 24.7%) for females.
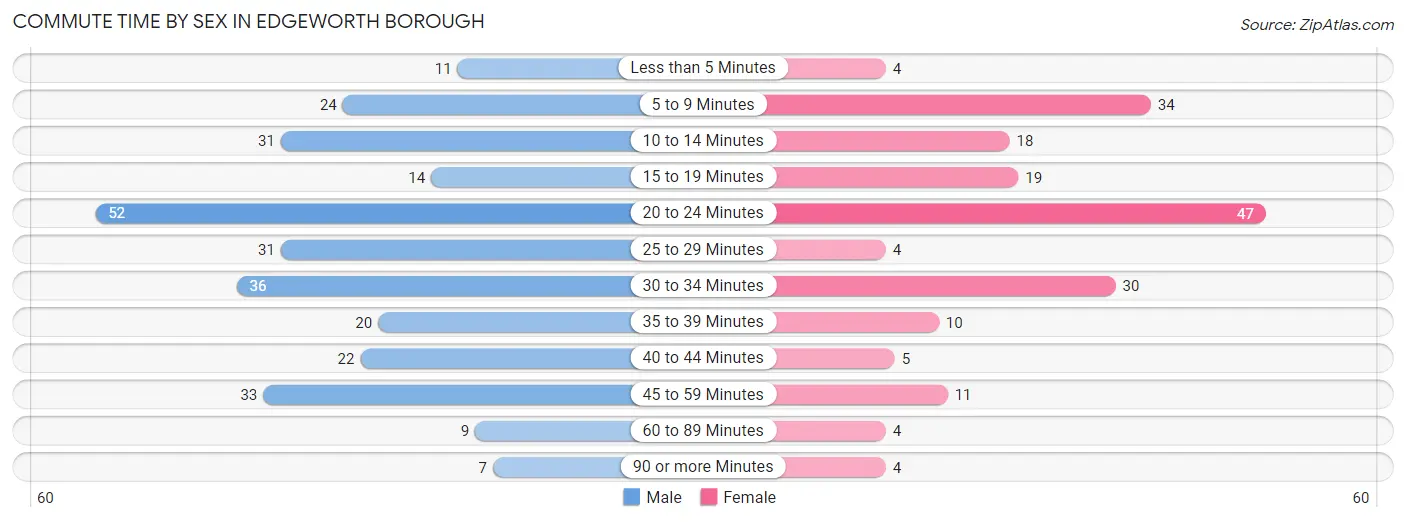
| Commute Time | Male | Female |
| Less than 5 Minutes | 11 (3.8%) | 4 (2.1%) |
| 5 to 9 Minutes | 24 (8.3%) | 34 (17.9%) |
| 10 to 14 Minutes | 31 (10.7%) | 18 (9.5%) |
| 15 to 19 Minutes | 14 (4.8%) | 19 (10.0%) |
| 20 to 24 Minutes | 52 (17.9%) | 47 (24.7%) |
| 25 to 29 Minutes | 31 (10.7%) | 4 (2.1%) |
| 30 to 34 Minutes | 36 (12.4%) | 30 (15.8%) |
| 35 to 39 Minutes | 20 (6.9%) | 10 (5.3%) |
| 40 to 44 Minutes | 22 (7.6%) | 5 (2.6%) |
| 45 to 59 Minutes | 33 (11.4%) | 11 (5.8%) |
| 60 to 89 Minutes | 9 (3.1%) | 4 (2.1%) |
| 90 or more Minutes | 7 (2.4%) | 4 (2.1%) |
Time of Departure to Work by Sex in Edgeworth borough
The most frequent times of departure to work in Edgeworth borough are 8:00 AM to 8:29 AM (60, 20.7%) for males and 8:30 AM to 8:59 AM (30, 15.8%) for females.
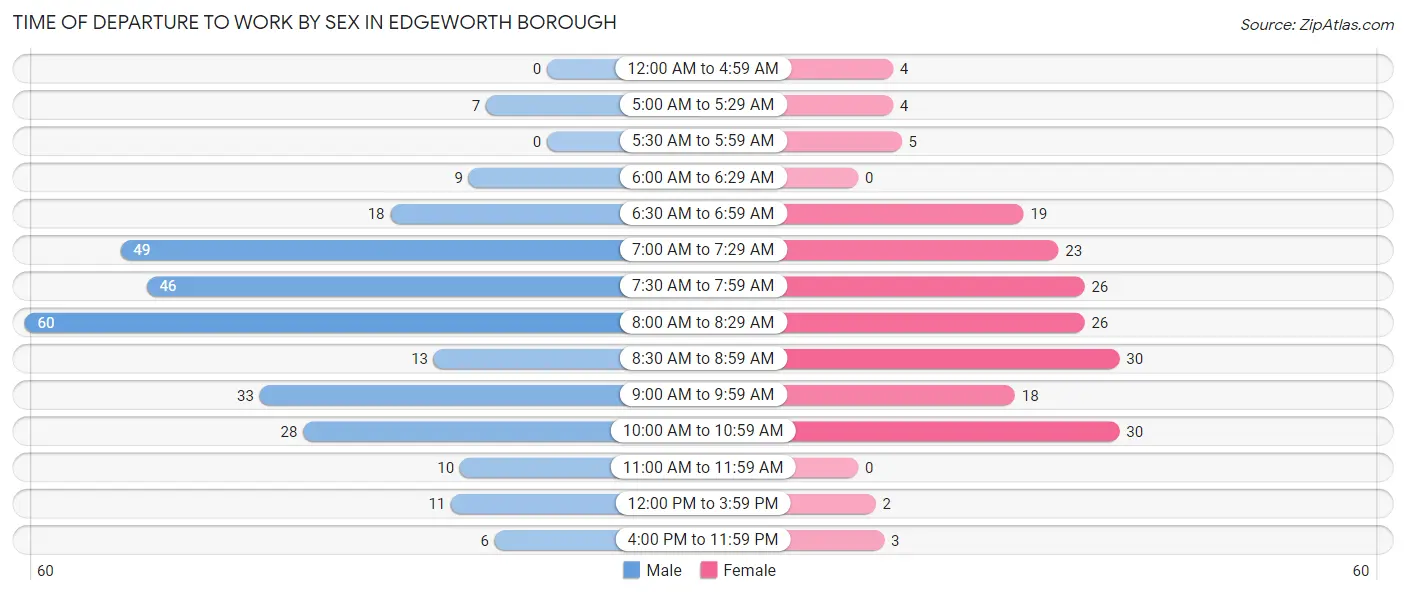
| Time of Departure | Male | Female |
| 12:00 AM to 4:59 AM | 0 (0.0%) | 4 (2.1%) |
| 5:00 AM to 5:29 AM | 7 (2.4%) | 4 (2.1%) |
| 5:30 AM to 5:59 AM | 0 (0.0%) | 5 (2.6%) |
| 6:00 AM to 6:29 AM | 9 (3.1%) | 0 (0.0%) |
| 6:30 AM to 6:59 AM | 18 (6.2%) | 19 (10.0%) |
| 7:00 AM to 7:29 AM | 49 (16.9%) | 23 (12.1%) |
| 7:30 AM to 7:59 AM | 46 (15.9%) | 26 (13.7%) |
| 8:00 AM to 8:29 AM | 60 (20.7%) | 26 (13.7%) |
| 8:30 AM to 8:59 AM | 13 (4.5%) | 30 (15.8%) |
| 9:00 AM to 9:59 AM | 33 (11.4%) | 18 (9.5%) |
| 10:00 AM to 10:59 AM | 28 (9.7%) | 30 (15.8%) |
| 11:00 AM to 11:59 AM | 10 (3.5%) | 0 (0.0%) |
| 12:00 PM to 3:59 PM | 11 (3.8%) | 2 (1.1%) |
| 4:00 PM to 11:59 PM | 6 (2.1%) | 3 (1.6%) |
| Total | 290 (100.0%) | 190 (100.0%) |
Housing Occupancy in Edgeworth borough
Occupancy by Ownership in Edgeworth borough
Of the total 574 dwellings in Edgeworth borough, owner-occupied units account for 524 (91.3%), while renter-occupied units make up 50 (8.7%).
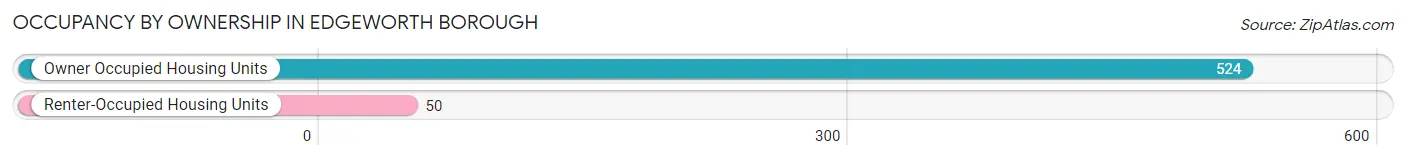
| Occupancy | # Housing Units | % Housing Units |
| Owner Occupied Housing Units | 524 | 91.3% |
| Renter-Occupied Housing Units | 50 | 8.7% |
| Total Occupied Housing Units | 574 | 100.0% |
Occupancy by Household Size in Edgeworth borough
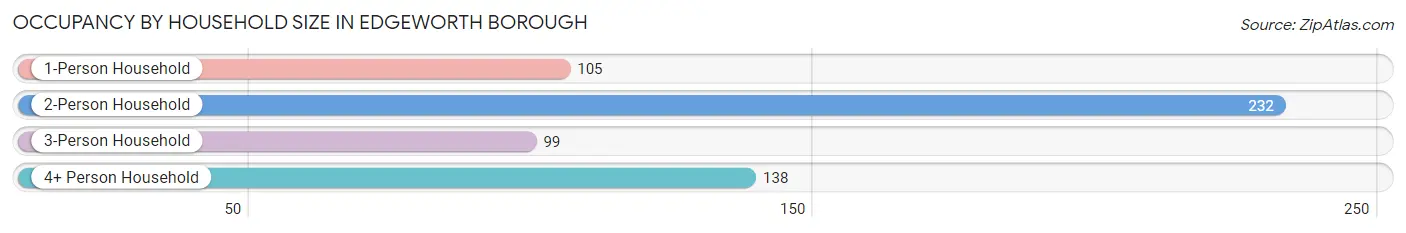
| Household Size | # Housing Units | % Housing Units |
| 1-Person Household | 105 | 18.3% |
| 2-Person Household | 232 | 40.4% |
| 3-Person Household | 99 | 17.2% |
| 4+ Person Household | 138 | 24.0% |
| Total Housing Units | 574 | 100.0% |
Occupancy by Ownership by Household Size in Edgeworth borough
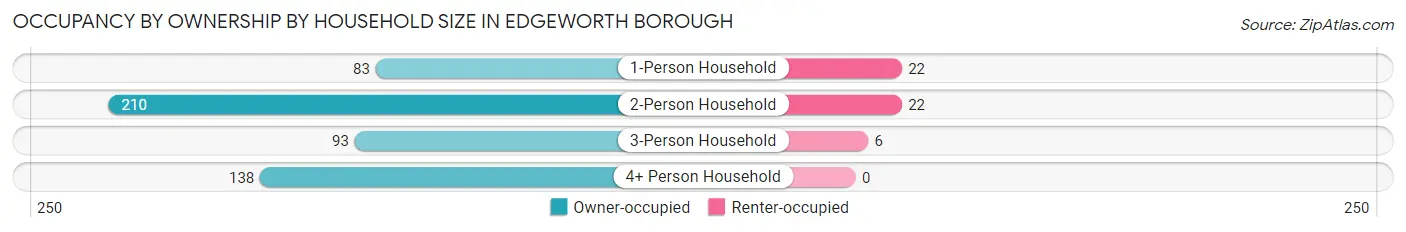
| Household Size | Owner-occupied | Renter-occupied |
| 1-Person Household | 83 (79.0%) | 22 (20.9%) |
| 2-Person Household | 210 (90.5%) | 22 (9.5%) |
| 3-Person Household | 93 (93.9%) | 6 (6.1%) |
| 4+ Person Household | 138 (100.0%) | 0 (0.0%) |
| Total Housing Units | 524 (91.3%) | 50 (8.7%) |
Occupancy by Educational Attainment in Edgeworth borough
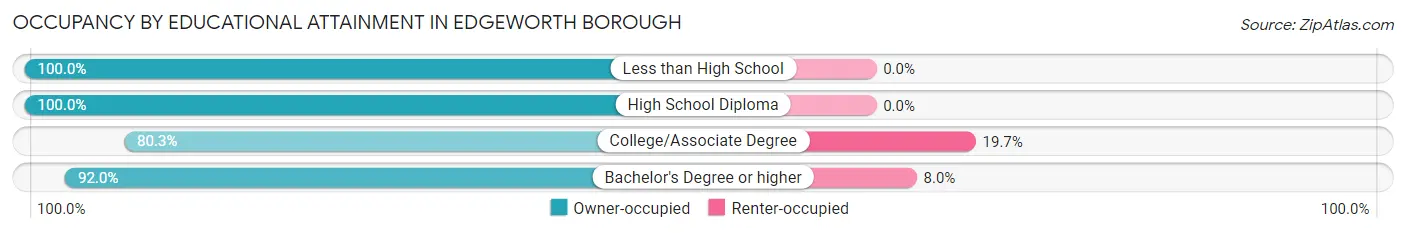
| Household Size | Owner-occupied | Renter-occupied |
| Less than High School | 4 (100.0%) | 0 (0.0%) |
| High School Diploma | 50 (100.0%) | 0 (0.0%) |
| College/Associate Degree | 57 (80.3%) | 14 (19.7%) |
| Bachelor's Degree or higher | 413 (92.0%) | 36 (8.0%) |
Occupancy by Age of Householder in Edgeworth borough
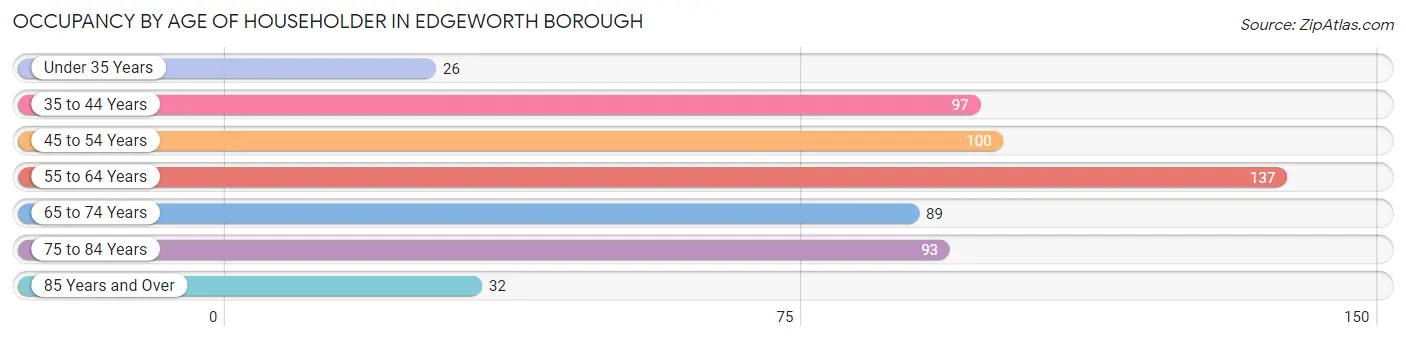
| Age Bracket | # Households | % Households |
| Under 35 Years | 26 | 4.5% |
| 35 to 44 Years | 97 | 16.9% |
| 45 to 54 Years | 100 | 17.4% |
| 55 to 64 Years | 137 | 23.9% |
| 65 to 74 Years | 89 | 15.5% |
| 75 to 84 Years | 93 | 16.2% |
| 85 Years and Over | 32 | 5.6% |
| Total | 574 | 100.0% |
Housing Finances in Edgeworth borough
Median Income by Occupancy in Edgeworth borough
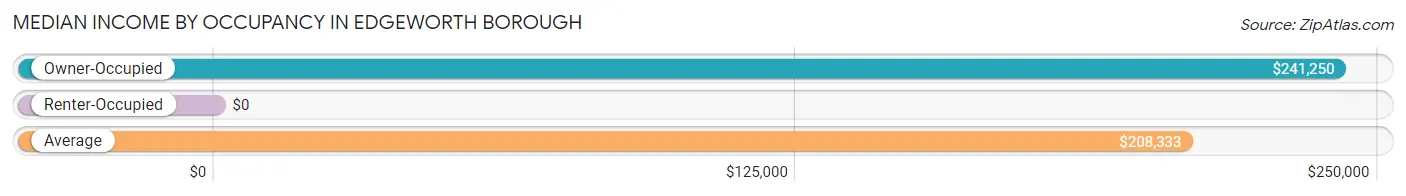
| Occupancy Type | # Households | Median Income |
| Owner-Occupied | 524 (91.3%) | $241,250 |
| Renter-Occupied | 50 (8.7%) | $0 |
| Average | 574 (100.0%) | $208,333 |
Occupancy by Householder Income Bracket in Edgeworth borough
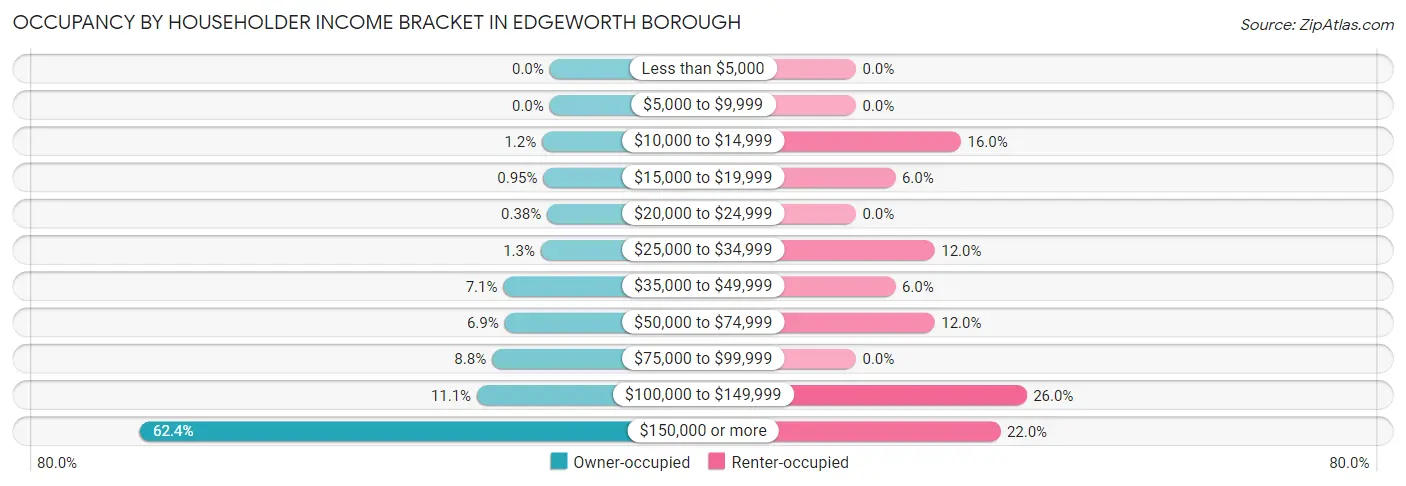
| Income Bracket | Owner-occupied | Renter-occupied |
| Less than $5,000 | 0 (0.0%) | 0 (0.0%) |
| $5,000 to $9,999 | 0 (0.0%) | 0 (0.0%) |
| $10,000 to $14,999 | 6 (1.1%) | 8 (16.0%) |
| $15,000 to $19,999 | 5 (0.9%) | 3 (6.0%) |
| $20,000 to $24,999 | 2 (0.4%) | 0 (0.0%) |
| $25,000 to $34,999 | 7 (1.3%) | 6 (12.0%) |
| $35,000 to $49,999 | 37 (7.1%) | 3 (6.0%) |
| $50,000 to $74,999 | 36 (6.9%) | 6 (12.0%) |
| $75,000 to $99,999 | 46 (8.8%) | 0 (0.0%) |
| $100,000 to $149,999 | 58 (11.1%) | 13 (26.0%) |
| $150,000 or more | 327 (62.4%) | 11 (22.0%) |
| Total | 524 (100.0%) | 50 (100.0%) |
Monthly Housing Cost Tiers in Edgeworth borough
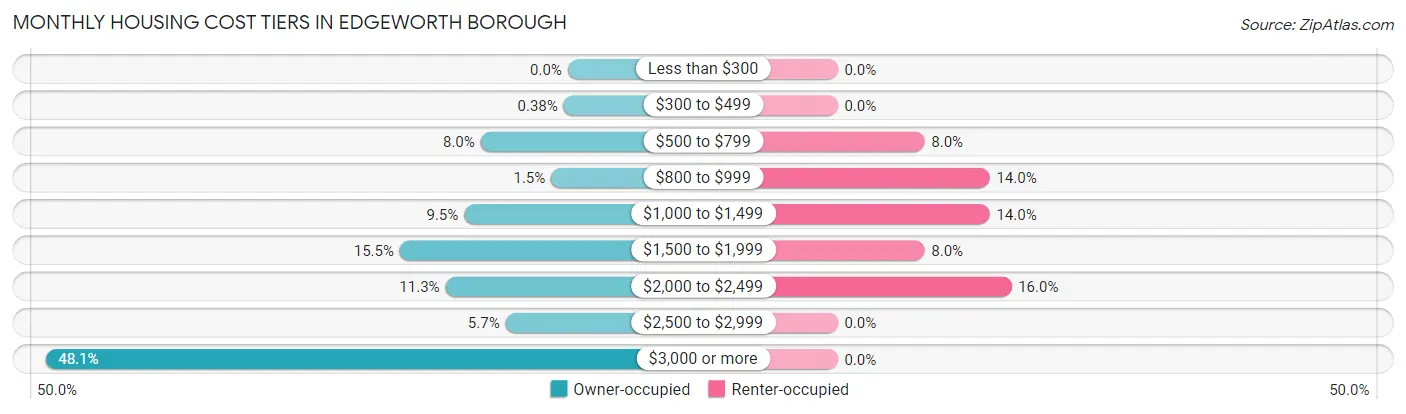
| Monthly Cost | Owner-occupied | Renter-occupied |
| Less than $300 | 0 (0.0%) | 0 (0.0%) |
| $300 to $499 | 2 (0.4%) | 0 (0.0%) |
| $500 to $799 | 42 (8.0%) | 4 (8.0%) |
| $800 to $999 | 8 (1.5%) | 7 (14.0%) |
| $1,000 to $1,499 | 50 (9.5%) | 7 (14.0%) |
| $1,500 to $1,999 | 81 (15.5%) | 4 (8.0%) |
| $2,000 to $2,499 | 59 (11.3%) | 8 (16.0%) |
| $2,500 to $2,999 | 30 (5.7%) | 0 (0.0%) |
| $3,000 or more | 252 (48.1%) | 0 (0.0%) |
| Total | 524 (100.0%) | 50 (100.0%) |
Physical Housing Characteristics in Edgeworth borough
Housing Structures in Edgeworth borough
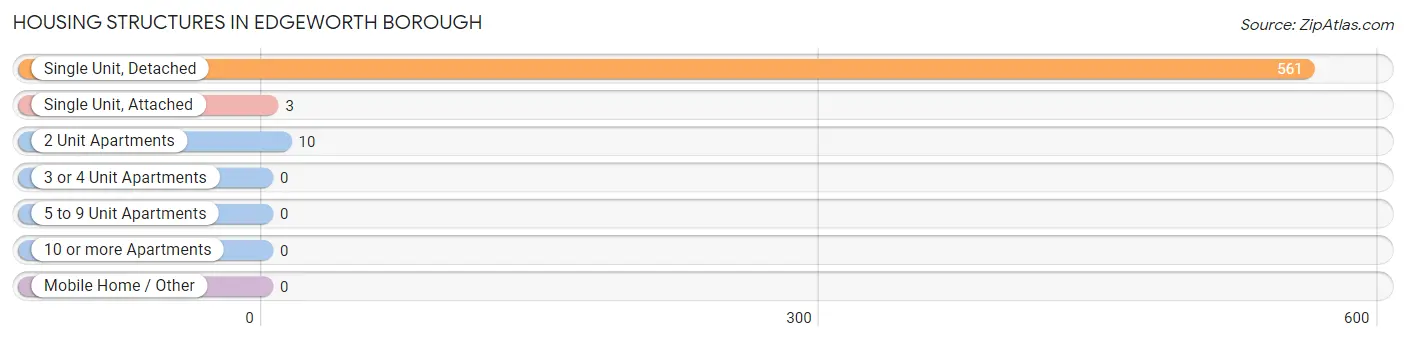
| Structure Type | # Housing Units | % Housing Units |
| Single Unit, Detached | 561 | 97.7% |
| Single Unit, Attached | 3 | 0.5% |
| 2 Unit Apartments | 10 | 1.7% |
| 3 or 4 Unit Apartments | 0 | 0.0% |
| 5 to 9 Unit Apartments | 0 | 0.0% |
| 10 or more Apartments | 0 | 0.0% |
| Mobile Home / Other | 0 | 0.0% |
| Total | 574 | 100.0% |
Housing Structures by Occupancy in Edgeworth borough
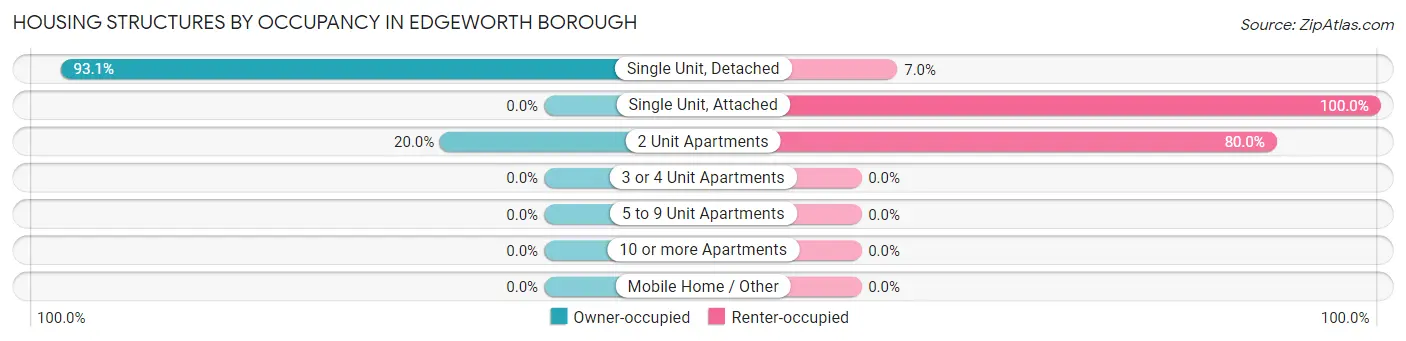
| Structure Type | Owner-occupied | Renter-occupied |
| Single Unit, Detached | 522 (93.0%) | 39 (7.0%) |
| Single Unit, Attached | 0 (0.0%) | 3 (100.0%) |
| 2 Unit Apartments | 2 (20.0%) | 8 (80.0%) |
| 3 or 4 Unit Apartments | 0 (0.0%) | 0 (0.0%) |
| 5 to 9 Unit Apartments | 0 (0.0%) | 0 (0.0%) |
| 10 or more Apartments | 0 (0.0%) | 0 (0.0%) |
| Mobile Home / Other | 0 (0.0%) | 0 (0.0%) |
| Total | 524 (91.3%) | 50 (8.7%) |
Housing Structures by Number of Rooms in Edgeworth borough
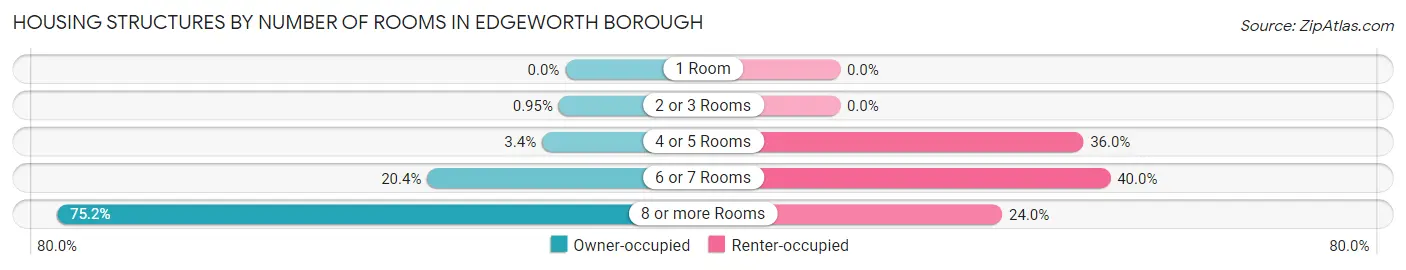
| Number of Rooms | Owner-occupied | Renter-occupied |
| 1 Room | 0 (0.0%) | 0 (0.0%) |
| 2 or 3 Rooms | 5 (0.9%) | 0 (0.0%) |
| 4 or 5 Rooms | 18 (3.4%) | 18 (36.0%) |
| 6 or 7 Rooms | 107 (20.4%) | 20 (40.0%) |
| 8 or more Rooms | 394 (75.2%) | 12 (24.0%) |
| Total | 524 (100.0%) | 50 (100.0%) |
Housing Structure by Heating Type in Edgeworth borough
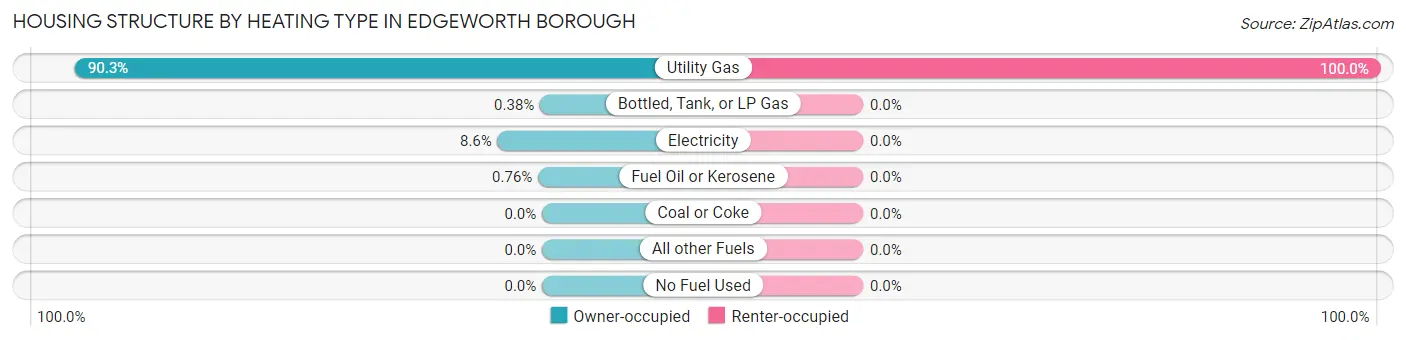
| Heating Type | Owner-occupied | Renter-occupied |
| Utility Gas | 473 (90.3%) | 50 (100.0%) |
| Bottled, Tank, or LP Gas | 2 (0.4%) | 0 (0.0%) |
| Electricity | 45 (8.6%) | 0 (0.0%) |
| Fuel Oil or Kerosene | 4 (0.8%) | 0 (0.0%) |
| Coal or Coke | 0 (0.0%) | 0 (0.0%) |
| All other Fuels | 0 (0.0%) | 0 (0.0%) |
| No Fuel Used | 0 (0.0%) | 0 (0.0%) |
| Total | 524 (100.0%) | 50 (100.0%) |
Household Vehicle Usage in Edgeworth borough
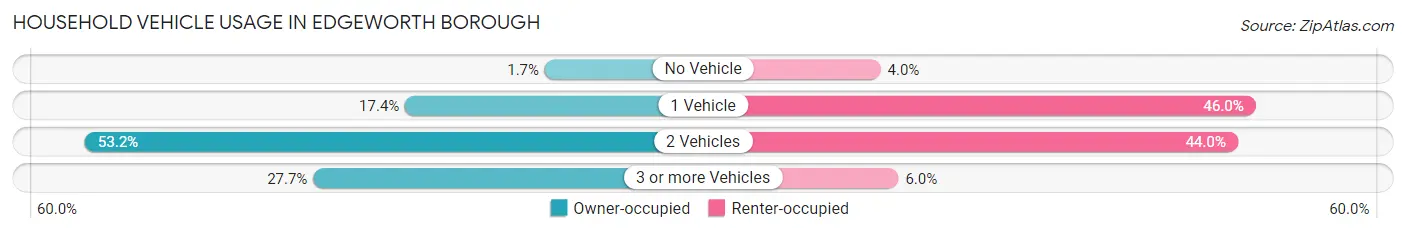
| Vehicles per Household | Owner-occupied | Renter-occupied |
| No Vehicle | 9 (1.7%) | 2 (4.0%) |
| 1 Vehicle | 91 (17.4%) | 23 (46.0%) |
| 2 Vehicles | 279 (53.2%) | 22 (44.0%) |
| 3 or more Vehicles | 145 (27.7%) | 3 (6.0%) |
| Total | 524 (100.0%) | 50 (100.0%) |
Real Estate & Mortgages in Edgeworth borough
Real Estate and Mortgage Overview in Edgeworth borough
| Characteristic | Without Mortgage | With Mortgage |
| Housing Units | 225 | 299 |
| Median Property Value | $680,600 | $766,800 |
| Median Household Income | $165,417 | $206 |
| Monthly Housing Costs | $1,501 | $223 |
| Real Estate Taxes | $10,001 | $0 |
Property Value by Mortgage Status in Edgeworth borough
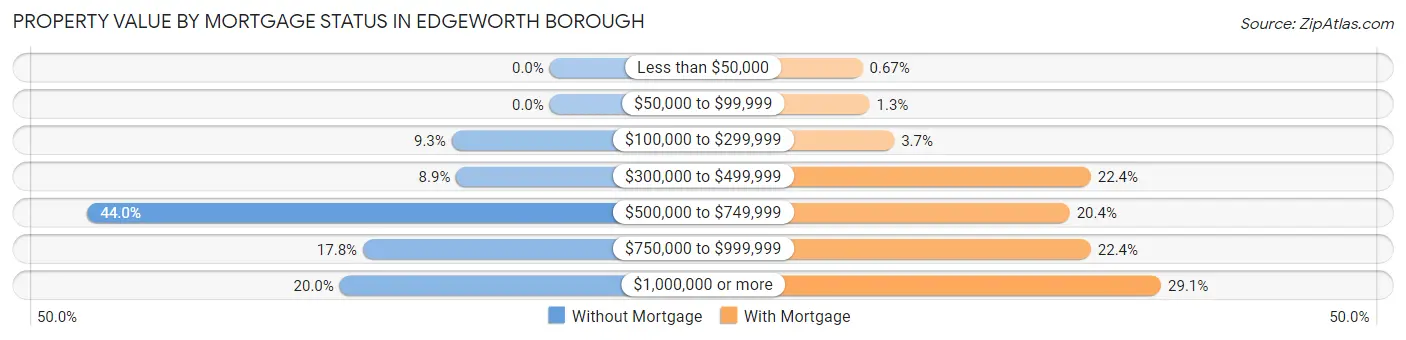
| Property Value | Without Mortgage | With Mortgage |
| Less than $50,000 | 0 (0.0%) | 2 (0.7%) |
| $50,000 to $99,999 | 0 (0.0%) | 4 (1.3%) |
| $100,000 to $299,999 | 21 (9.3%) | 11 (3.7%) |
| $300,000 to $499,999 | 20 (8.9%) | 67 (22.4%) |
| $500,000 to $749,999 | 99 (44.0%) | 61 (20.4%) |
| $750,000 to $999,999 | 40 (17.8%) | 67 (22.4%) |
| $1,000,000 or more | 45 (20.0%) | 87 (29.1%) |
| Total | 225 (100.0%) | 299 (100.0%) |
Household Income by Mortgage Status in Edgeworth borough
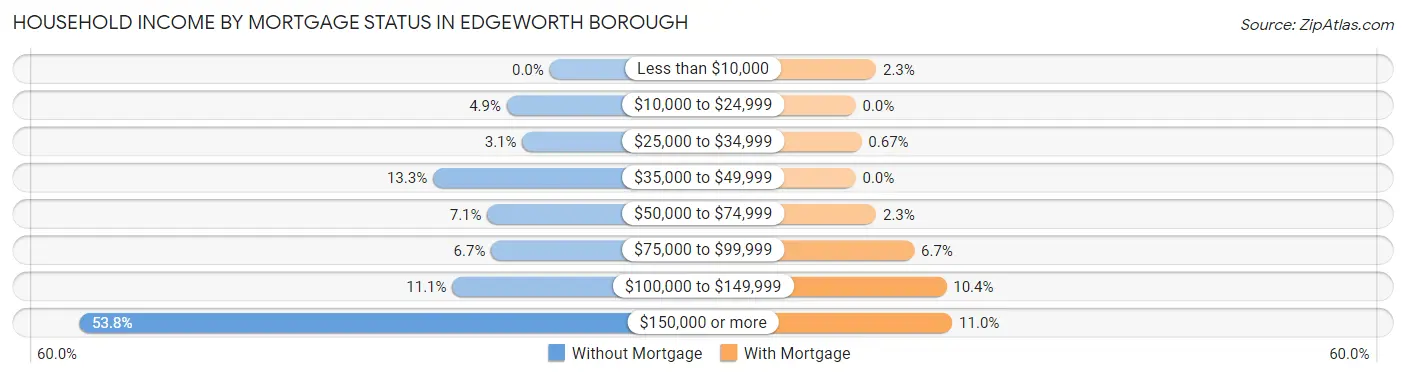
| Household Income | Without Mortgage | With Mortgage |
| Less than $10,000 | 0 (0.0%) | 7 (2.3%) |
| $10,000 to $24,999 | 11 (4.9%) | 0 (0.0%) |
| $25,000 to $34,999 | 7 (3.1%) | 2 (0.7%) |
| $35,000 to $49,999 | 30 (13.3%) | 0 (0.0%) |
| $50,000 to $74,999 | 16 (7.1%) | 7 (2.3%) |
| $75,000 to $99,999 | 15 (6.7%) | 20 (6.7%) |
| $100,000 to $149,999 | 25 (11.1%) | 31 (10.4%) |
| $150,000 or more | 121 (53.8%) | 33 (11.0%) |
| Total | 225 (100.0%) | 299 (100.0%) |
Property Value to Household Income Ratio in Edgeworth borough
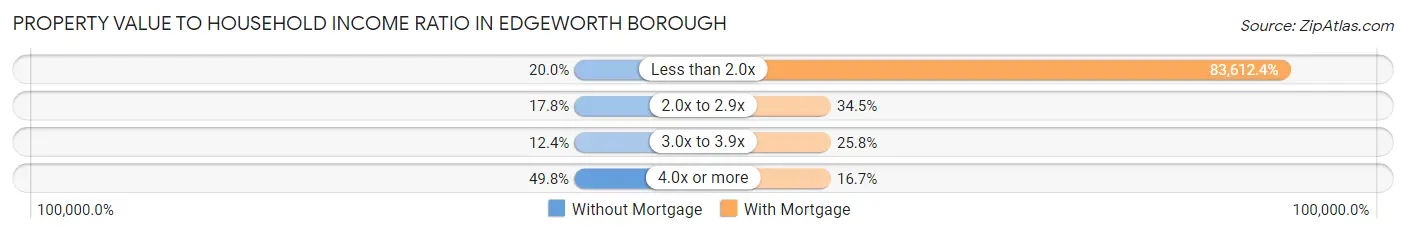
| Value-to-Income Ratio | Without Mortgage | With Mortgage |
| Less than 2.0x | 45 (20.0%) | 250,001 (83,612.4%) |
| 2.0x to 2.9x | 40 (17.8%) | 103 (34.4%) |
| 3.0x to 3.9x | 28 (12.4%) | 77 (25.8%) |
| 4.0x or more | 112 (49.8%) | 50 (16.7%) |
| Total | 225 (100.0%) | 299 (100.0%) |
Real Estate Taxes by Mortgage Status in Edgeworth borough
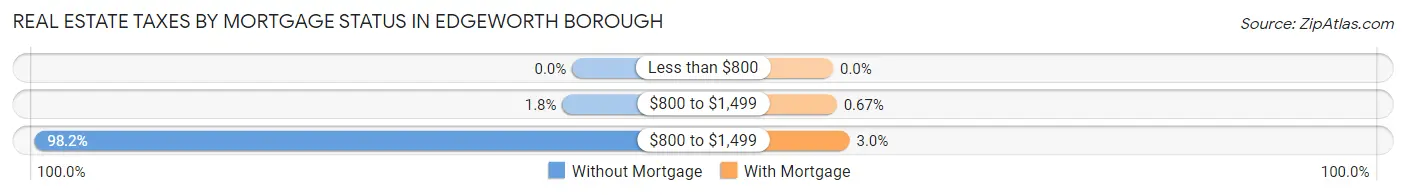
| Property Taxes | Without Mortgage | With Mortgage |
| Less than $800 | 0 (0.0%) | 0 (0.0%) |
| $800 to $1,499 | 4 (1.8%) | 2 (0.7%) |
| $800 to $1,499 | 221 (98.2%) | 9 (3.0%) |
| Total | 225 (100.0%) | 299 (100.0%) |
Health & Disability in Edgeworth borough
Health Insurance Coverage by Age in Edgeworth borough
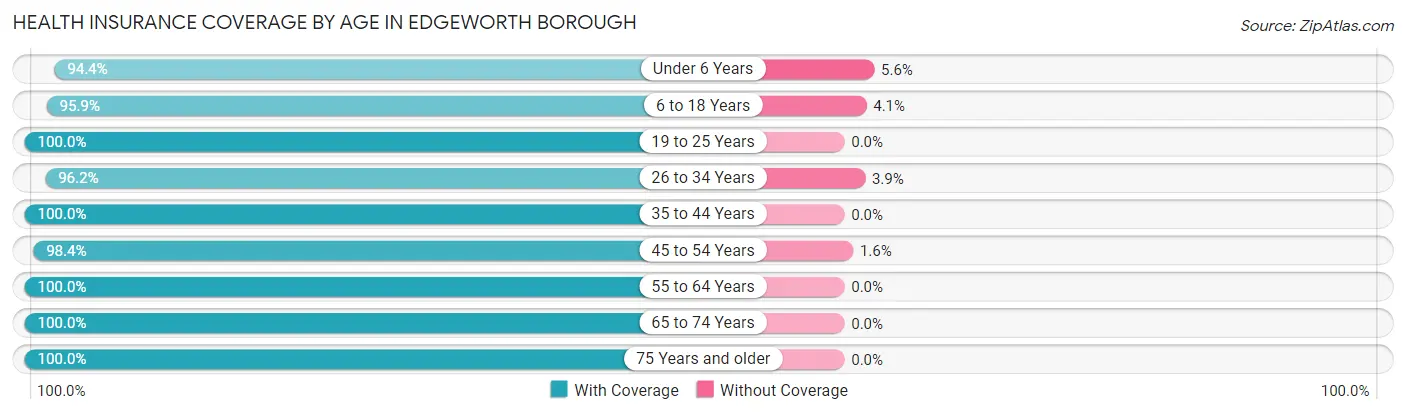
| Age Bracket | With Coverage | Without Coverage |
| Under 6 Years | 102 (94.4%) | 6 (5.6%) |
| 6 to 18 Years | 257 (95.9%) | 11 (4.1%) |
| 19 to 25 Years | 107 (100.0%) | 0 (0.0%) |
| 26 to 34 Years | 50 (96.2%) | 2 (3.8%) |
| 35 to 44 Years | 201 (100.0%) | 0 (0.0%) |
| 45 to 54 Years | 182 (98.4%) | 3 (1.6%) |
| 55 to 64 Years | 257 (100.0%) | 0 (0.0%) |
| 65 to 74 Years | 170 (100.0%) | 0 (0.0%) |
| 75 Years and older | 172 (100.0%) | 0 (0.0%) |
| Total | 1,498 (98.6%) | 22 (1.5%) |
Health Insurance Coverage by Citizenship Status in Edgeworth borough
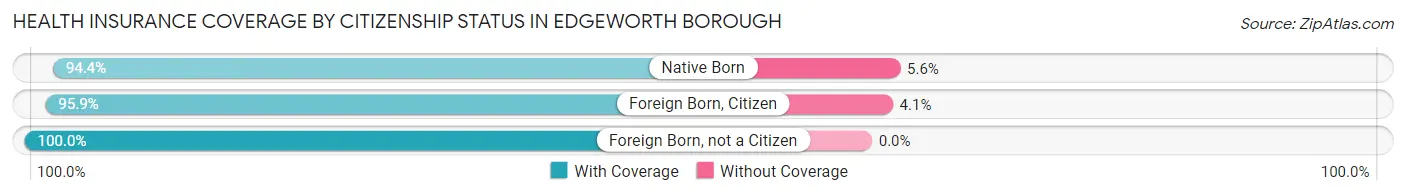
| Citizenship Status | With Coverage | Without Coverage |
| Native Born | 102 (94.4%) | 6 (5.6%) |
| Foreign Born, Citizen | 257 (95.9%) | 11 (4.1%) |
| Foreign Born, not a Citizen | 107 (100.0%) | 0 (0.0%) |
Health Insurance Coverage by Household Income in Edgeworth borough
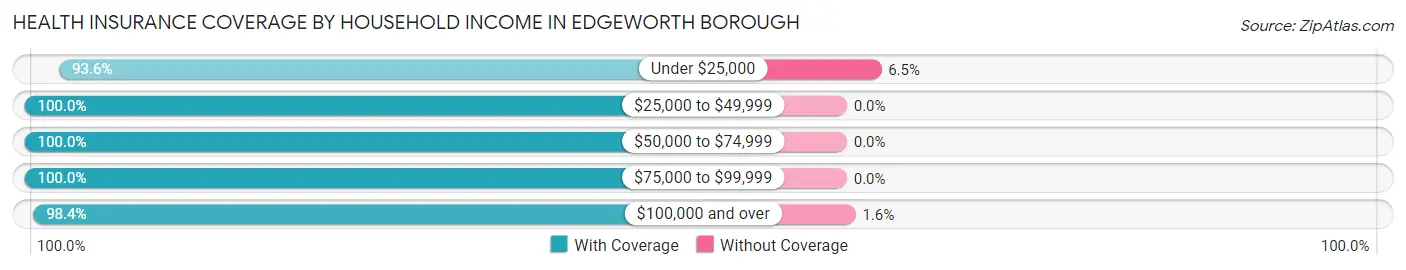
| Household Income | With Coverage | Without Coverage |
| Under $25,000 | 29 (93.5%) | 2 (6.5%) |
| $25,000 to $49,999 | 68 (100.0%) | 0 (0.0%) |
| $50,000 to $74,999 | 76 (100.0%) | 0 (0.0%) |
| $75,000 to $99,999 | 105 (100.0%) | 0 (0.0%) |
| $100,000 and over | 1,217 (98.4%) | 20 (1.6%) |
Public vs Private Health Insurance Coverage by Age in Edgeworth borough
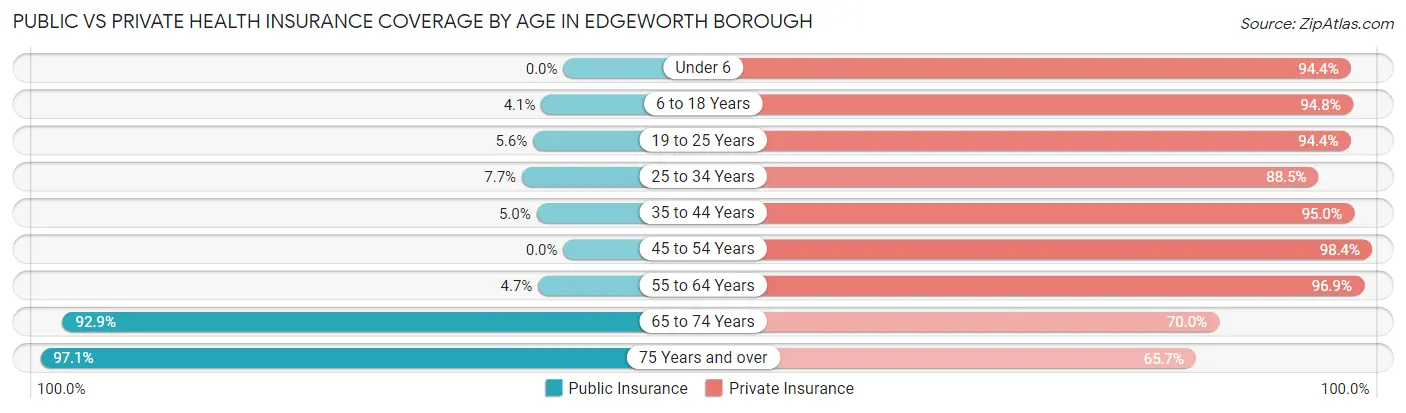
| Age Bracket | Public Insurance | Private Insurance |
| Under 6 | 0 (0.0%) | 102 (94.4%) |
| 6 to 18 Years | 11 (4.1%) | 254 (94.8%) |
| 19 to 25 Years | 6 (5.6%) | 101 (94.4%) |
| 25 to 34 Years | 4 (7.7%) | 46 (88.5%) |
| 35 to 44 Years | 10 (5.0%) | 191 (95.0%) |
| 45 to 54 Years | 0 (0.0%) | 182 (98.4%) |
| 55 to 64 Years | 12 (4.7%) | 249 (96.9%) |
| 65 to 74 Years | 158 (92.9%) | 119 (70.0%) |
| 75 Years and over | 167 (97.1%) | 113 (65.7%) |
| Total | 368 (24.2%) | 1,357 (89.3%) |
Disability Status by Sex by Age in Edgeworth borough
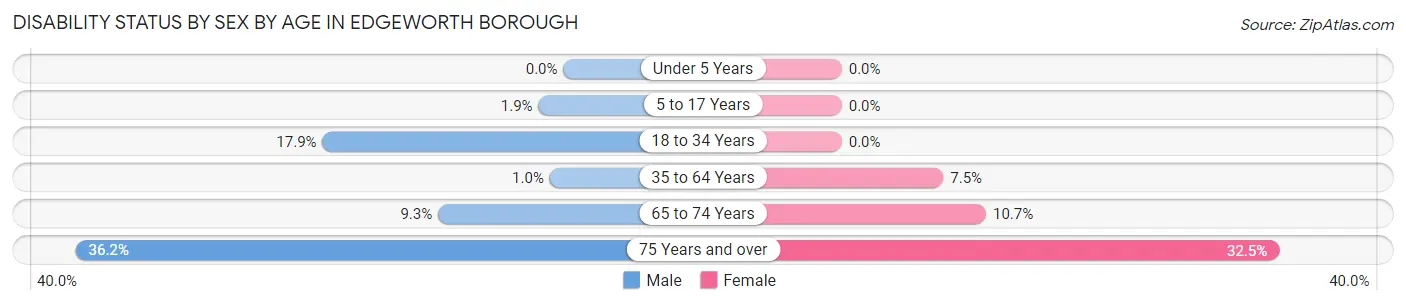
| Age Bracket | Male | Female |
| Under 5 Years | 0 (0.0%) | 0 (0.0%) |
| 5 to 17 Years | 3 (1.8%) | 0 (0.0%) |
| 18 to 34 Years | 22 (17.9%) | 0 (0.0%) |
| 35 to 64 Years | 3 (1.0%) | 26 (7.5%) |
| 65 to 74 Years | 8 (9.3%) | 9 (10.7%) |
| 75 Years and over | 21 (36.2%) | 37 (32.5%) |
Disability Class by Sex by Age in Edgeworth borough
Disability Class: Hearing Difficulty
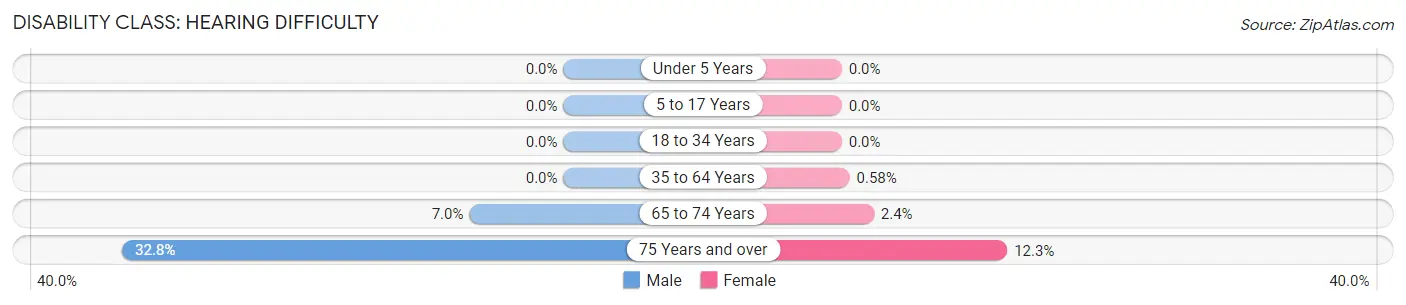
| Age Bracket | Male | Female |
| Under 5 Years | 0 (0.0%) | 0 (0.0%) |
| 5 to 17 Years | 0 (0.0%) | 0 (0.0%) |
| 18 to 34 Years | 0 (0.0%) | 0 (0.0%) |
| 35 to 64 Years | 0 (0.0%) | 2 (0.6%) |
| 65 to 74 Years | 6 (7.0%) | 2 (2.4%) |
| 75 Years and over | 19 (32.8%) | 14 (12.3%) |
Disability Class: Vision Difficulty
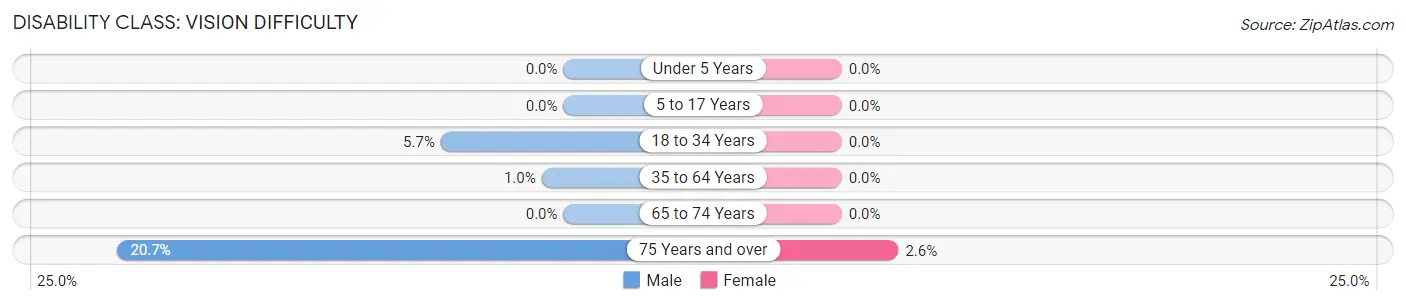
| Age Bracket | Male | Female |
| Under 5 Years | 0 (0.0%) | 0 (0.0%) |
| 5 to 17 Years | 0 (0.0%) | 0 (0.0%) |
| 18 to 34 Years | 7 (5.7%) | 0 (0.0%) |
| 35 to 64 Years | 3 (1.0%) | 0 (0.0%) |
| 65 to 74 Years | 0 (0.0%) | 0 (0.0%) |
| 75 Years and over | 12 (20.7%) | 3 (2.6%) |
Disability Class: Cognitive Difficulty
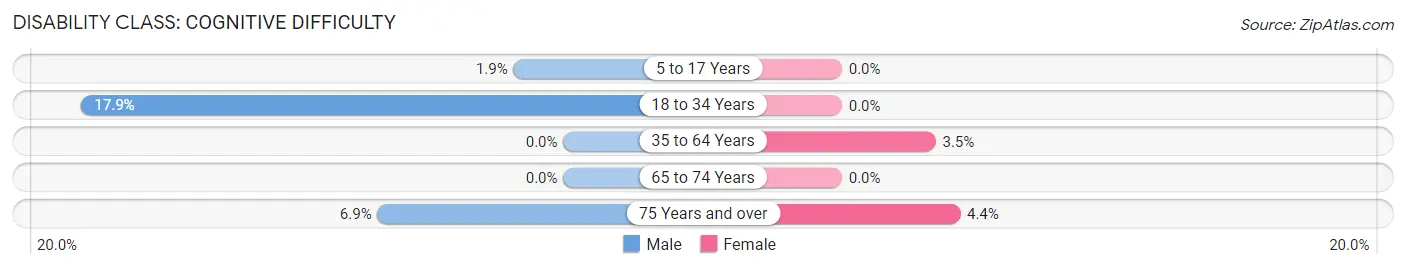
| Age Bracket | Male | Female |
| 5 to 17 Years | 3 (1.8%) | 0 (0.0%) |
| 18 to 34 Years | 22 (17.9%) | 0 (0.0%) |
| 35 to 64 Years | 0 (0.0%) | 12 (3.5%) |
| 65 to 74 Years | 0 (0.0%) | 0 (0.0%) |
| 75 Years and over | 4 (6.9%) | 5 (4.4%) |
Disability Class: Ambulatory Difficulty
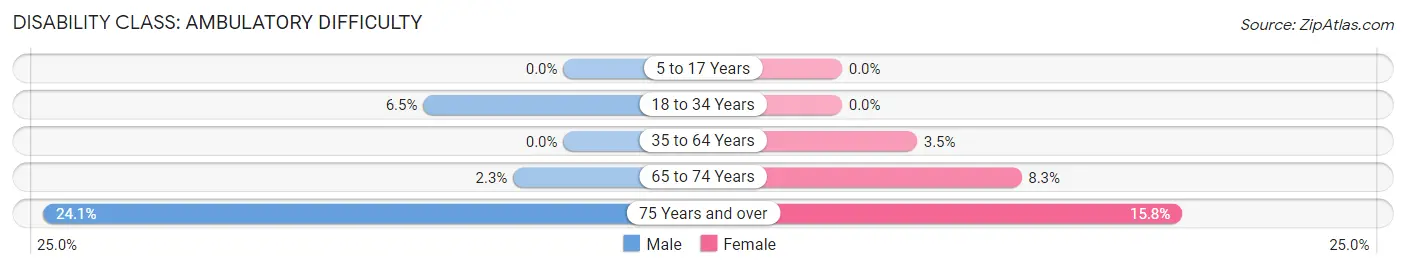
| Age Bracket | Male | Female |
| 5 to 17 Years | 0 (0.0%) | 0 (0.0%) |
| 18 to 34 Years | 8 (6.5%) | 0 (0.0%) |
| 35 to 64 Years | 0 (0.0%) | 12 (3.5%) |
| 65 to 74 Years | 2 (2.3%) | 7 (8.3%) |
| 75 Years and over | 14 (24.1%) | 18 (15.8%) |
Disability Class: Self-Care Difficulty
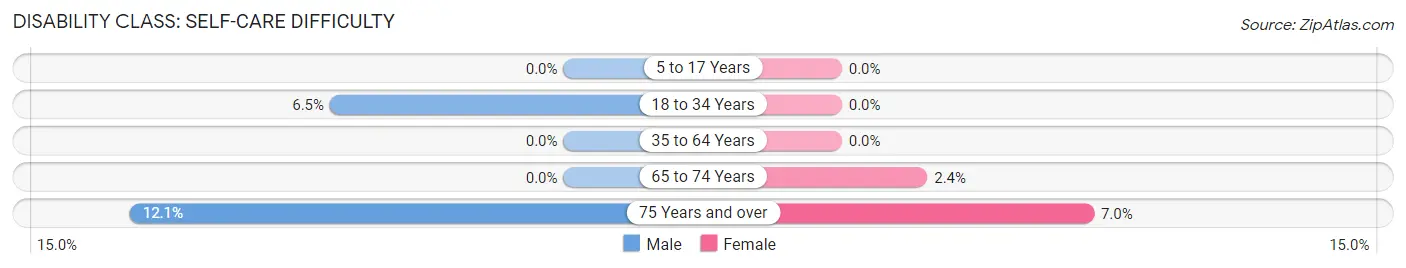
| Age Bracket | Male | Female |
| 5 to 17 Years | 0 (0.0%) | 0 (0.0%) |
| 18 to 34 Years | 8 (6.5%) | 0 (0.0%) |
| 35 to 64 Years | 0 (0.0%) | 0 (0.0%) |
| 65 to 74 Years | 0 (0.0%) | 2 (2.4%) |
| 75 Years and over | 7 (12.1%) | 8 (7.0%) |
Technology Access in Edgeworth borough
Computing Device Access in Edgeworth borough
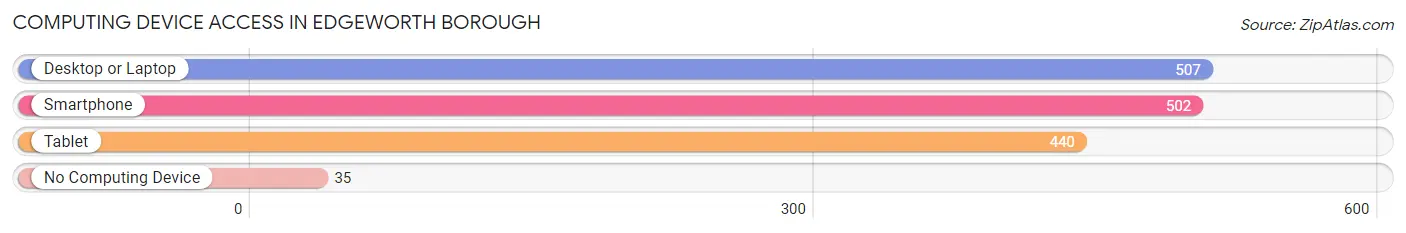
| Device Type | # Households | % Households |
| Desktop or Laptop | 507 | 88.3% |
| Smartphone | 502 | 87.5% |
| Tablet | 440 | 76.7% |
| No Computing Device | 35 | 6.1% |
| Total | 574 | 100.0% |
Internet Access in Edgeworth borough
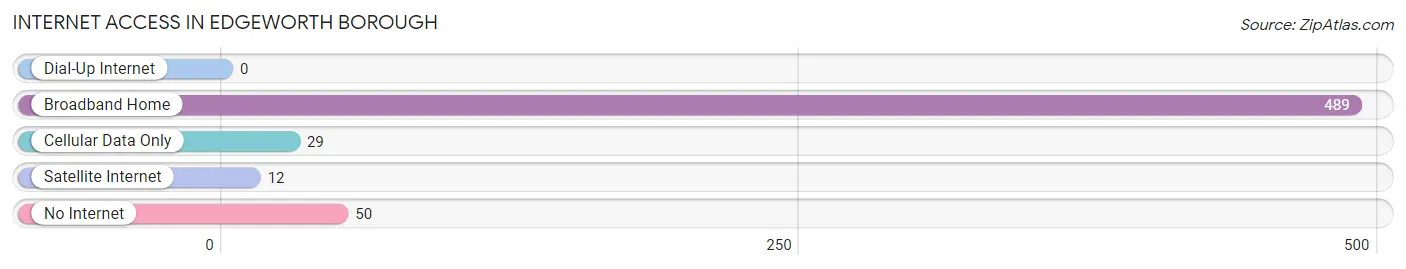
| Internet Type | # Households | % Households |
| Dial-Up Internet | 0 | 0.0% |
| Broadband Home | 489 | 85.2% |
| Cellular Data Only | 29 | 5.1% |
| Satellite Internet | 12 | 2.1% |
| No Internet | 50 | 8.7% |
| Total | 574 | 100.0% |
Edgeworth borough Summary
Edgeworth Borough is a small borough located in Allegheny County, Pennsylvania. It is situated along the Ohio River, just south of Pittsburgh. The borough was founded in 1876 and is home to approximately 2,000 people.
Geography
Edgeworth Borough is located in the southwestern corner of Allegheny County, Pennsylvania. It is situated along the Ohio River, just south of Pittsburgh. The borough is bordered by Sewickley Township to the north, Leet Township to the east, and Moon Township to the south. The total area of the borough is 0.7 square miles, all of which is land.
The terrain of Edgeworth Borough is mostly flat, with some rolling hills. The borough is located in the Allegheny Plateau region of Pennsylvania, which is characterized by its hilly terrain and lush forests. The Ohio River forms the western border of the borough, and the Sewickley Creek runs through the center of the borough.
Economy
The economy of Edgeworth Borough is largely based on the service industry. The borough is home to a variety of small businesses, including restaurants, retail stores, and professional services. The borough also has a number of manufacturing and industrial businesses, including a steel mill and a paper mill.
The borough is also home to a number of educational institutions, including the Edgeworth Elementary School, the Edgeworth Middle School, and the Edgeworth High School. The borough is also home to the Edgeworth Business Park, which is home to a variety of businesses, including a medical center, a hotel, and a shopping center.
Demographics
As of the 2010 census, the population of Edgeworth Borough was 2,039. The racial makeup of the borough was 94.3% White, 2.2% African American, 0.3% Native American, 0.7% Asian, 0.1% Pacific Islander, 0.7% from other races, and 1.7% from two or more races. Hispanic or Latino of any race were 1.7% of the population.
The median household income in Edgeworth Borough was $50,938, and the median family income was $60,938. The per capita income for the borough was $25,938. About 4.3% of families and 5.7% of the population were below the poverty line, including 8.3% of those under age 18 and 4.3% of those age 65 or over.
History
Edgeworth Borough was founded in 1876 by William Edgeworth, a local businessman. The borough was originally part of Sewickley Township, but was incorporated as its own borough in 1876. The borough was named after William Edgeworth, who was a prominent figure in the area.
The borough was originally a farming community, but it began to grow in the late 19th century as the steel and paper industries began to expand in the area. The borough was also home to a number of educational institutions, including the Edgeworth Elementary School, the Edgeworth Middle School, and the Edgeworth High School.
In the late 20th century, the borough began to experience a decline in population as many of the steel and paper mills began to close. The borough has since experienced a resurgence in population as new businesses have moved into the area. The borough is now home to a variety of businesses, including restaurants, retail stores, and professional services.
Common Questions
What is Per Capita Income in Edgeworth borough?
Per Capita income in Edgeworth borough is $122,468.
What is the Median Family Income in Edgeworth borough?
Median Family Income in Edgeworth borough is $250,001.
What is the Median Household income in Edgeworth borough?
Median Household Income in Edgeworth borough is $208,333.
What is Income or Wage Gap in Edgeworth borough?
Income or Wage Gap in Edgeworth borough is 55.4%.
Women in Edgeworth borough earn 44.6 cents for every dollar earned by a man.
What is Inequality or Gini Index in Edgeworth borough?
Inequality or Gini Index in Edgeworth borough is 0.52.
What is the Total Population of Edgeworth borough?
Total Population of Edgeworth borough is 1,520.
What is the Total Male Population of Edgeworth borough?
Total Male Population of Edgeworth borough is 767.
What is the Total Female Population of Edgeworth borough?
Total Female Population of Edgeworth borough is 753.
What is the Ratio of Males per 100 Females in Edgeworth borough?
There are 101.86 Males per 100 Females in Edgeworth borough.
What is the Ratio of Females per 100 Males in Edgeworth borough?
There are 98.17 Females per 100 Males in Edgeworth borough.
What is the Median Population Age in Edgeworth borough?
Median Population Age in Edgeworth borough is 47.2 Years.
What is the Average Family Size in Edgeworth borough
Average Family Size in Edgeworth borough is 3.0 People.
What is the Average Household Size in Edgeworth borough
Average Household Size in Edgeworth borough is 2.6 People.
How Large is the Labor Force in Edgeworth borough?
There are 698 People in the Labor Forcein in Edgeworth borough.
What is the Percentage of People in the Labor Force in Edgeworth borough?
58.4% of People are in the Labor Force in Edgeworth borough.
What is the Unemployment Rate in Edgeworth borough?
Unemployment Rate in Edgeworth borough is 4.0%.