Sewickley Heights borough, PA Map & Demographics
Sewickley Heights borough Overview
$157,017
PER CAPITA INCOME
$250,001
AVG FAMILY INCOME
$195,750
AVG HOUSEHOLD INCOME
75.7%
WAGE / INCOME GAP [ % ]
24.3¢/ $1
WAGE / INCOME GAP [ $ ]
0.58
INEQUALITY / GINI INDEX
762
TOTAL POPULATION
396
MALE POPULATION
366
FEMALE POPULATION
108.20
MALES / 100 FEMALES
92.42
FEMALES / 100 MALES
50.8
MEDIAN AGE
2.9
AVG FAMILY SIZE
2.4
AVG HOUSEHOLD SIZE
352
LABOR FORCE [ PEOPLE ]
57.1%
PERCENT IN LABOR FORCE
2.6%
UNEMPLOYMENT RATE
Income in Sewickley Heights borough
Income Overview in Sewickley Heights borough
Per Capita Income in Sewickley Heights borough is $157,017, while median incomes of families and households are $250,001 and $195,750 respectively.
| Characteristic | Number | Measure |
| Per Capita Income | 762 | $157,017 |
| Median Family Income | 214 | $250,001 |
| Mean Family Income | 214 | $447,676 |
| Median Household Income | 317 | $195,750 |
| Mean Household Income | 317 | $379,803 |
| Income Deficit | 214 | $0 |
| Wage / Income Gap (%) | 762 | 75.71% |
| Wage / Income Gap ($) | 762 | 24.29¢ per $1 |
| Gini / Inequality Index | 762 | 0.58 |
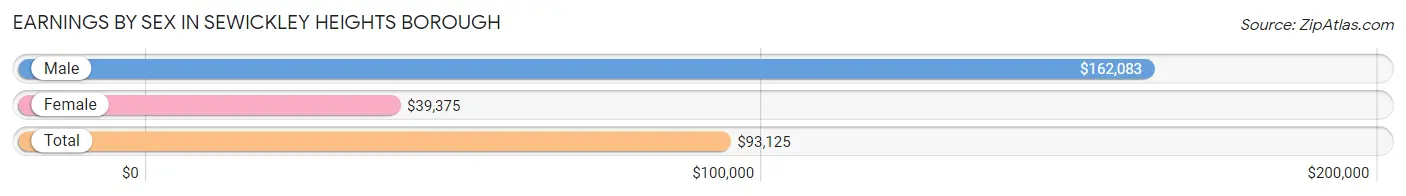
Earnings by Sex in Sewickley Heights borough
Average Earnings in Sewickley Heights borough are $93,125, $162,083 for men and $39,375 for women, a difference of 75.7%.
| Sex | Number | Average Earnings |
| Male | 228 (61.8%) | $162,083 |
| Female | 141 (38.2%) | $39,375 |
| Total | 369 (100.0%) | $93,125 |
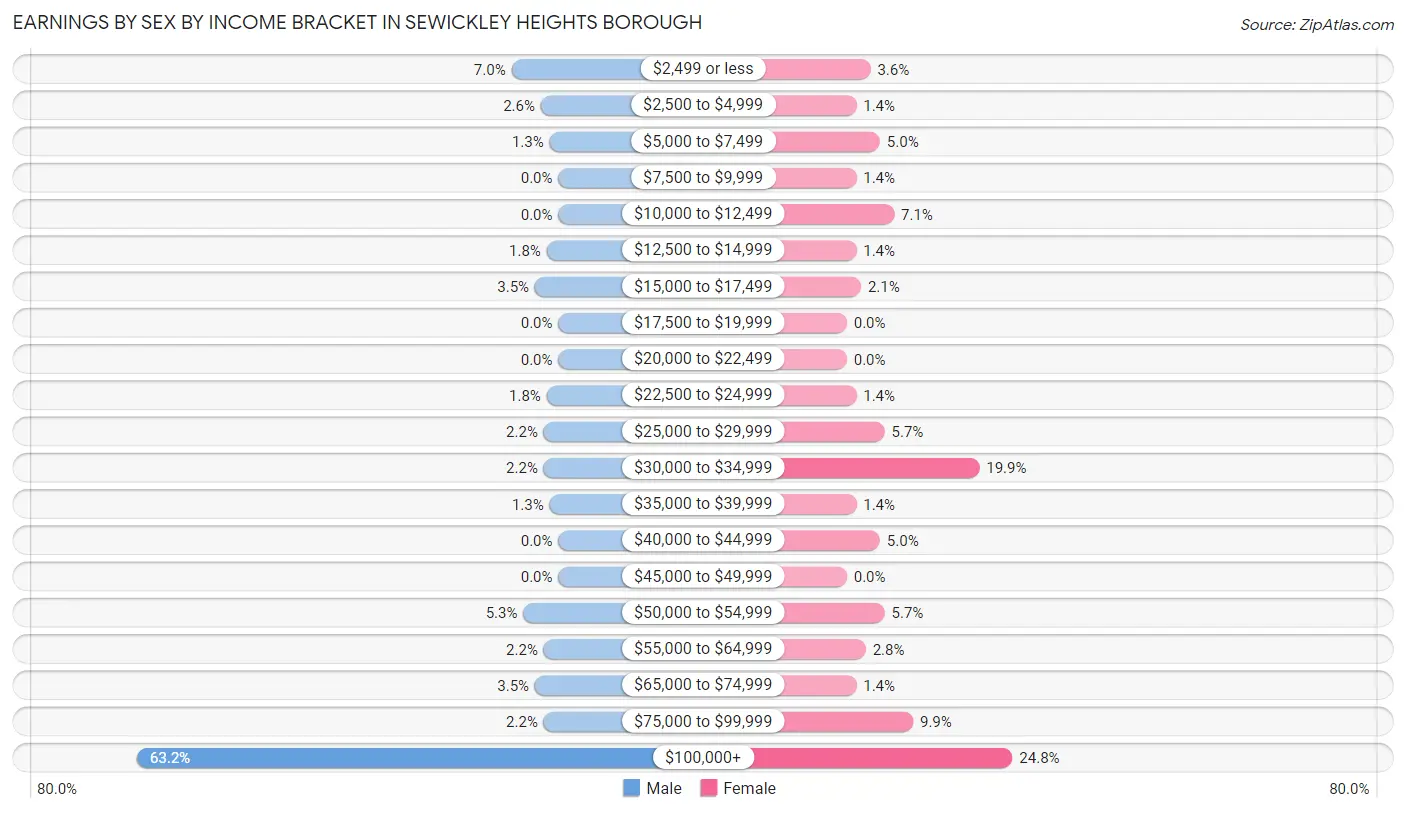
Earnings by Sex by Income Bracket in Sewickley Heights borough
The most common earnings brackets in Sewickley Heights borough are $100,000+ for men (144 | 63.2%) and $100,000+ for women (35 | 24.8%).
| Income | Male | Female |
| $2,499 or less | 16 (7.0%) | 5 (3.5%) |
| $2,500 to $4,999 | 6 (2.6%) | 2 (1.4%) |
| $5,000 to $7,499 | 3 (1.3%) | 7 (5.0%) |
| $7,500 to $9,999 | 0 (0.0%) | 2 (1.4%) |
| $10,000 to $12,499 | 0 (0.0%) | 10 (7.1%) |
| $12,500 to $14,999 | 4 (1.8%) | 2 (1.4%) |
| $15,000 to $17,499 | 8 (3.5%) | 3 (2.1%) |
| $17,500 to $19,999 | 0 (0.0%) | 0 (0.0%) |
| $20,000 to $22,499 | 0 (0.0%) | 0 (0.0%) |
| $22,500 to $24,999 | 4 (1.8%) | 2 (1.4%) |
| $25,000 to $29,999 | 5 (2.2%) | 8 (5.7%) |
| $30,000 to $34,999 | 5 (2.2%) | 28 (19.9%) |
| $35,000 to $39,999 | 3 (1.3%) | 2 (1.4%) |
| $40,000 to $44,999 | 0 (0.0%) | 7 (5.0%) |
| $45,000 to $49,999 | 0 (0.0%) | 0 (0.0%) |
| $50,000 to $54,999 | 12 (5.3%) | 8 (5.7%) |
| $55,000 to $64,999 | 5 (2.2%) | 4 (2.8%) |
| $65,000 to $74,999 | 8 (3.5%) | 2 (1.4%) |
| $75,000 to $99,999 | 5 (2.2%) | 14 (9.9%) |
| $100,000+ | 144 (63.2%) | 35 (24.8%) |
| Total | 228 (100.0%) | 141 (100.0%) |
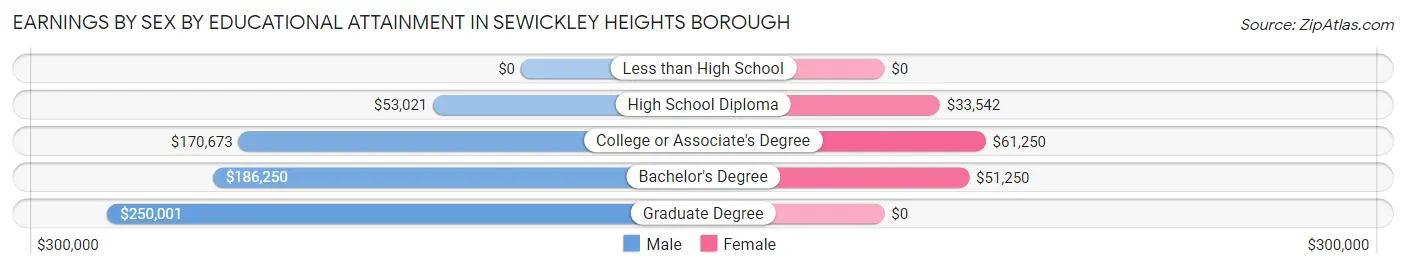
Earnings by Sex by Educational Attainment in Sewickley Heights borough
Average earnings in Sewickley Heights borough are $172,115 for men and $50,469 for women, a difference of 70.7%. Men with an educational attainment of graduate degree enjoy the highest average annual earnings of $250,001, while those with high school diploma education earn the least with $53,021. Women with an educational attainment of college or associate's degree earn the most with the average annual earnings of $61,250, while those with high school diploma education have the smallest earnings of $33,542.
| Educational Attainment | Male Income | Female Income |
| Less than High School | - | - |
| High School Diploma | $53,021 | $33,542 |
| College or Associate's Degree | $170,673 | $61,250 |
| Bachelor's Degree | $186,250 | $51,250 |
| Graduate Degree | $250,001 | $0 |
| Total | $172,115 | $50,469 |
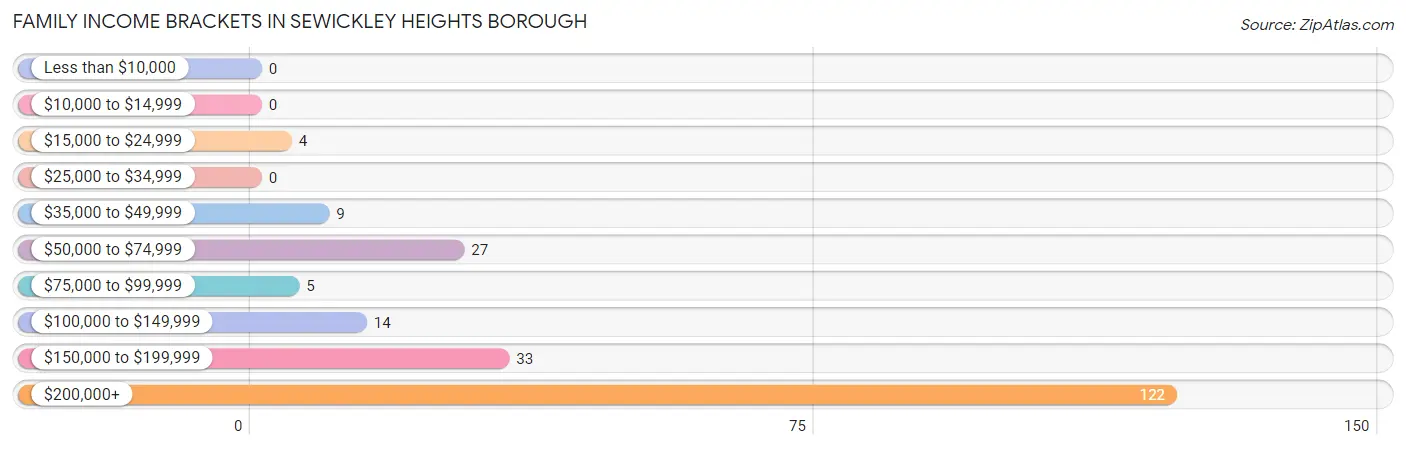
Family Income in Sewickley Heights borough
Family Income Brackets in Sewickley Heights borough
According to the Sewickley Heights borough family income data, there are 122 families falling into the $200,000+ income range, which is the most common income bracket and makes up 57.0% of all families.
| Income Bracket | # Families | % Families |
| Less than $10,000 | 0 | 0.0% |
| $10,000 to $14,999 | 0 | 0.0% |
| $15,000 to $24,999 | 4 | 1.9% |
| $25,000 to $34,999 | 0 | 0.0% |
| $35,000 to $49,999 | 9 | 4.2% |
| $50,000 to $74,999 | 27 | 12.6% |
| $75,000 to $99,999 | 5 | 2.3% |
| $100,000 to $149,999 | 14 | 6.5% |
| $150,000 to $199,999 | 33 | 15.4% |
| $200,000+ | 122 | 57.0% |
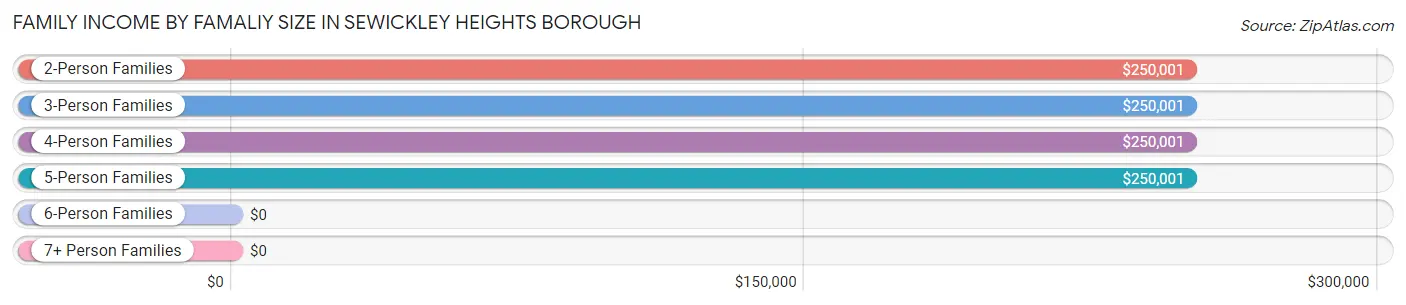
Family Income by Famaliy Size in Sewickley Heights borough
2-person families (117 | 54.7%) account for the highest median family income in Sewickley Heights borough with $250,001 per family, while 2-person families (117 | 54.7%) have the highest median income of $125,000 per family member.
| Income Bracket | # Families | Median Income |
| 2-Person Families | 117 (54.7%) | $250,001 |
| 3-Person Families | 45 (21.0%) | $250,001 |
| 4-Person Families | 28 (13.1%) | $250,001 |
| 5-Person Families | 9 (4.2%) | $250,001 |
| 6-Person Families | 4 (1.9%) | $0 |
| 7+ Person Families | 11 (5.1%) | $0 |
| Total | 214 (100.0%) | $250,001 |
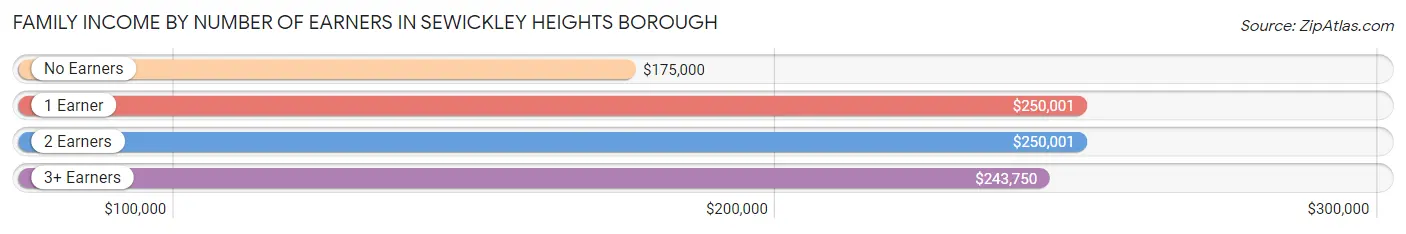
Family Income by Number of Earners in Sewickley Heights borough
The median family income in Sewickley Heights borough is $250,001, with families comprising 1 earner (81) having the highest median family income of $250,001, while families with no earners (34) have the lowest median family income of $175,000, accounting for 37.9% and 15.9% of families, respectively.
| Number of Earners | # Families | Median Income |
| No Earners | 34 (15.9%) | $175,000 |
| 1 Earner | 81 (37.9%) | $250,001 |
| 2 Earners | 85 (39.7%) | $250,001 |
| 3+ Earners | 14 (6.5%) | $243,750 |
| Total | 214 (100.0%) | $250,001 |
Household Income in Sewickley Heights borough
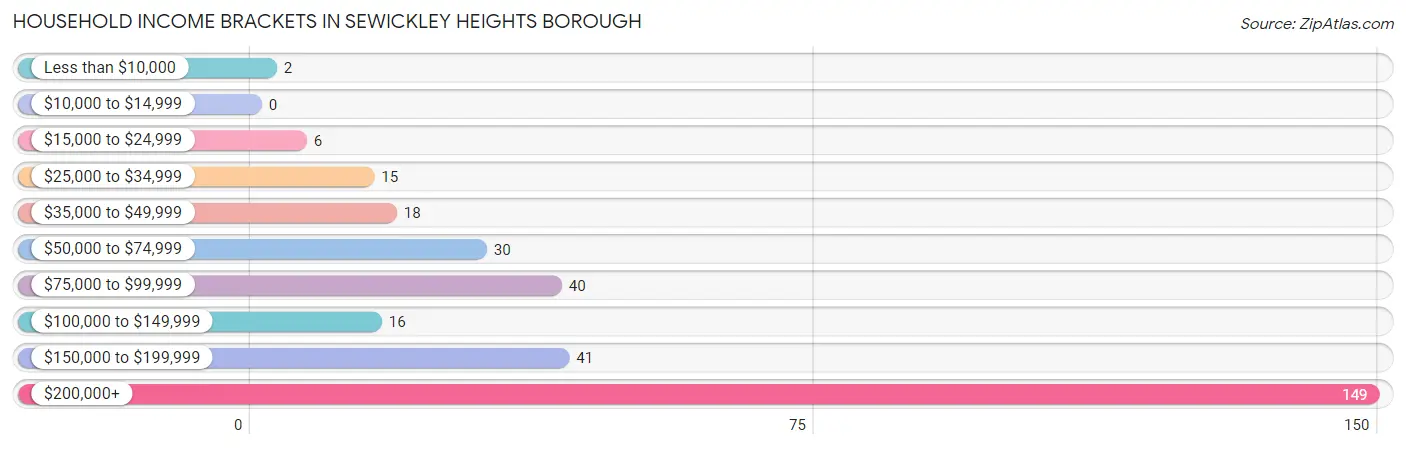
Household Income Brackets in Sewickley Heights borough
With 149 households falling in the category, the $200,000+ income range is the most frequent in Sewickley Heights borough, accounting for 47.0% of all households.
| Income Bracket | # Households | % Households |
| Less than $10,000 | 2 | 0.6% |
| $10,000 to $14,999 | 0 | 0.0% |
| $15,000 to $24,999 | 6 | 1.9% |
| $25,000 to $34,999 | 15 | 4.7% |
| $35,000 to $49,999 | 18 | 5.7% |
| $50,000 to $74,999 | 30 | 9.5% |
| $75,000 to $99,999 | 40 | 12.6% |
| $100,000 to $149,999 | 16 | 5.0% |
| $150,000 to $199,999 | 41 | 12.9% |
| $200,000+ | 149 | 47.0% |
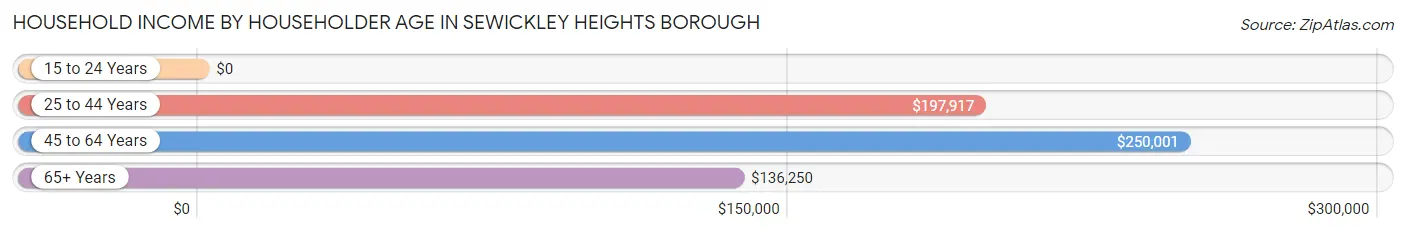
Household Income by Householder Age in Sewickley Heights borough
The median household income in Sewickley Heights borough is $195,750, with the highest median household income of $250,001 found in the 45 to 64 years age bracket for the primary householder. A total of 164 households (51.7%) fall into this category. Meanwhile, the 15 to 24 years age bracket for the primary householder has the lowest median household income of $0, with 5 households (1.6%) in this group.
| Income Bracket | # Households | Median Income |
| 15 to 24 Years | 5 (1.6%) | $0 |
| 25 to 44 Years | 44 (13.9%) | $197,917 |
| 45 to 64 Years | 164 (51.7%) | $250,001 |
| 65+ Years | 104 (32.8%) | $136,250 |
| Total | 317 (100.0%) | $195,750 |
Poverty in Sewickley Heights borough
Income Below Poverty by Sex and Age in Sewickley Heights borough
With 2.5% poverty level for males and 2.0% for females among the residents of Sewickley Heights borough, 6 to 11 year old males and under 5 year old females are the most vulnerable to poverty, with 3 males (37.5%) and 2 females (100.0%) in their respective age groups living below the poverty level.
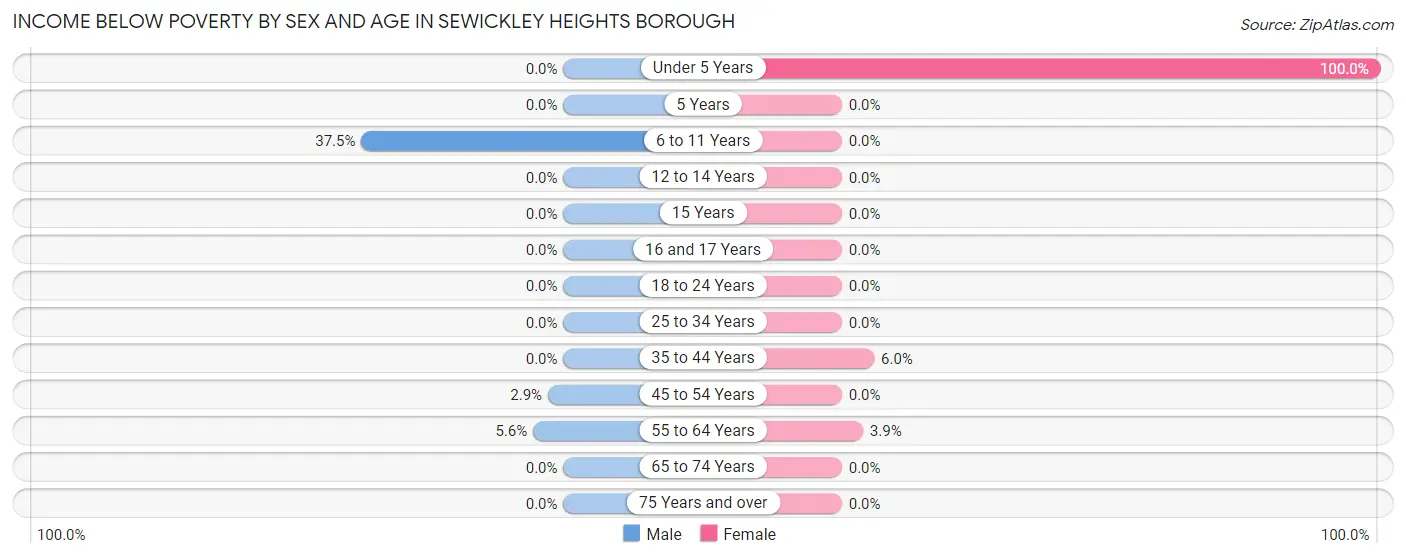
| Age Bracket | Male | Female |
| Under 5 Years | 0 (0.0%) | 2 (100.0%) |
| 5 Years | 0 (0.0%) | 0 (0.0%) |
| 6 to 11 Years | 3 (37.5%) | 0 (0.0%) |
| 12 to 14 Years | 0 (0.0%) | 0 (0.0%) |
| 15 Years | 0 (0.0%) | 0 (0.0%) |
| 16 and 17 Years | 0 (0.0%) | 0 (0.0%) |
| 18 to 24 Years | 0 (0.0%) | 0 (0.0%) |
| 25 to 34 Years | 0 (0.0%) | 0 (0.0%) |
| 35 to 44 Years | 0 (0.0%) | 3 (6.0%) |
| 45 to 54 Years | 2 (2.9%) | 0 (0.0%) |
| 55 to 64 Years | 5 (5.6%) | 2 (3.9%) |
| 65 to 74 Years | 0 (0.0%) | 0 (0.0%) |
| 75 Years and over | 0 (0.0%) | 0 (0.0%) |
| Total | 10 (2.5%) | 7 (2.0%) |
Income Above Poverty by Sex and Age in Sewickley Heights borough
According to the poverty statistics in Sewickley Heights borough, males aged under 5 years and females aged 5 years are the age groups that are most secure financially, with 100.0% of males and 100.0% of females in these age groups living above the poverty line.
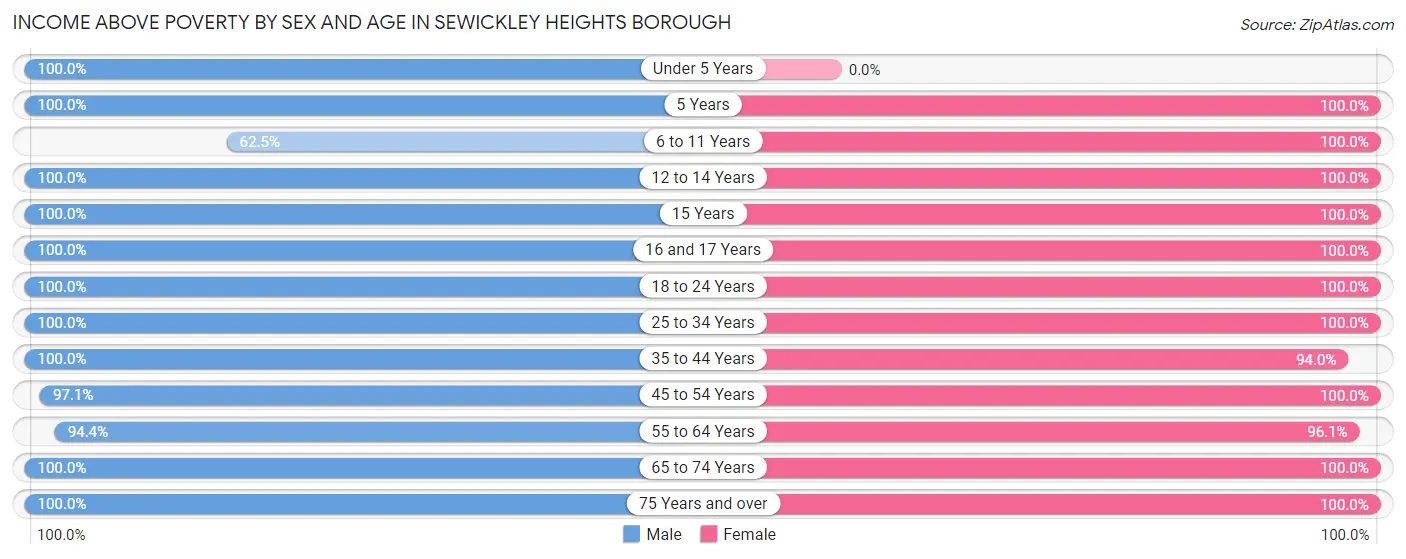
| Age Bracket | Male | Female |
| Under 5 Years | 11 (100.0%) | 0 (0.0%) |
| 5 Years | 6 (100.0%) | 2 (100.0%) |
| 6 to 11 Years | 5 (62.5%) | 23 (100.0%) |
| 12 to 14 Years | 14 (100.0%) | 26 (100.0%) |
| 15 Years | 28 (100.0%) | 11 (100.0%) |
| 16 and 17 Years | 24 (100.0%) | 9 (100.0%) |
| 18 to 24 Years | 30 (100.0%) | 24 (100.0%) |
| 25 to 34 Years | 7 (100.0%) | 5 (100.0%) |
| 35 to 44 Years | 19 (100.0%) | 47 (94.0%) |
| 45 to 54 Years | 68 (97.1%) | 74 (100.0%) |
| 55 to 64 Years | 84 (94.4%) | 49 (96.1%) |
| 65 to 74 Years | 52 (100.0%) | 44 (100.0%) |
| 75 Years and over | 38 (100.0%) | 31 (100.0%) |
| Total | 386 (97.5%) | 345 (98.0%) |
Income Below Poverty Among Married-Couple Families in Sewickley Heights borough
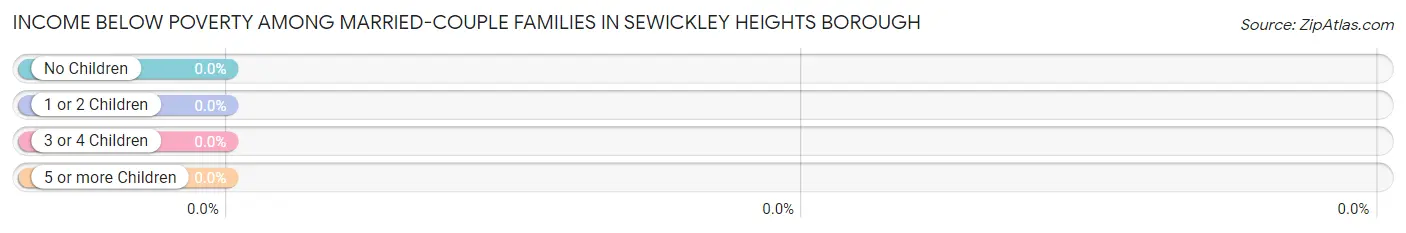
| Children | Above Poverty | Below Poverty |
| No Children | 105 (100.0%) | 0 (0.0%) |
| 1 or 2 Children | 59 (100.0%) | 0 (0.0%) |
| 3 or 4 Children | 9 (100.0%) | 0 (0.0%) |
| 5 or more Children | 6 (100.0%) | 0 (0.0%) |
| Total | 179 (100.0%) | 0 (0.0%) |
Income Below Poverty Among Single-Parent Households in Sewickley Heights borough
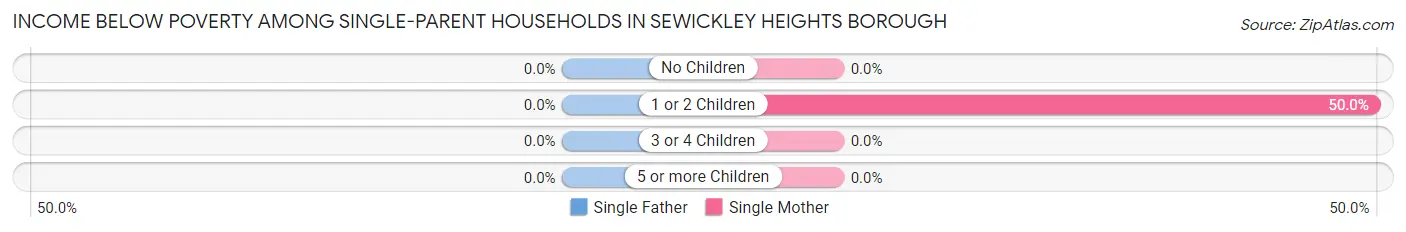
| Children | Single Father | Single Mother |
| No Children | 0 (0.0%) | 0 (0.0%) |
| 1 or 2 Children | 0 (0.0%) | 3 (50.0%) |
| 3 or 4 Children | 0 (0.0%) | 0 (0.0%) |
| 5 or more Children | 0 (0.0%) | 0 (0.0%) |
| Total | 0 (0.0%) | 3 (13.0%) |
Income Below Poverty Among Married-Couple vs Single-Parent Households in Sewickley Heights borough
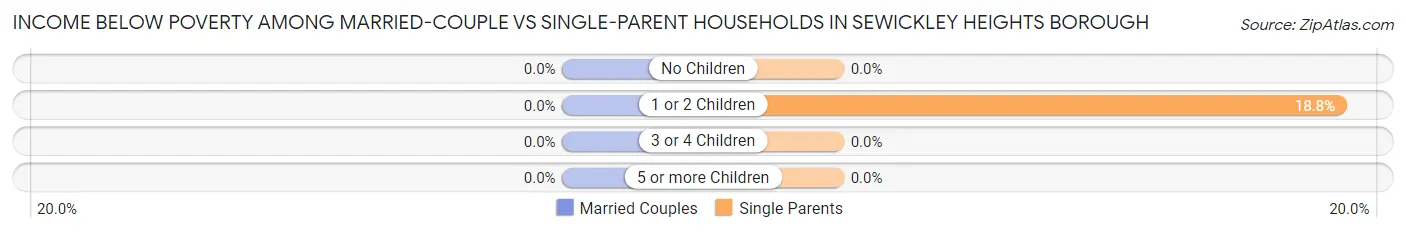
| Children | Married-Couple Families | Single-Parent Households |
| No Children | 0 (0.0%) | 0 (0.0%) |
| 1 or 2 Children | 0 (0.0%) | 3 (18.8%) |
| 3 or 4 Children | 0 (0.0%) | 0 (0.0%) |
| 5 or more Children | 0 (0.0%) | 0 (0.0%) |
| Total | 0 (0.0%) | 3 (8.6%) |
Race in Sewickley Heights borough
The most populous races in Sewickley Heights borough are White / Caucasian (722 | 94.8%), Black / African American (25 | 3.3%), and Asian (9 | 1.2%).
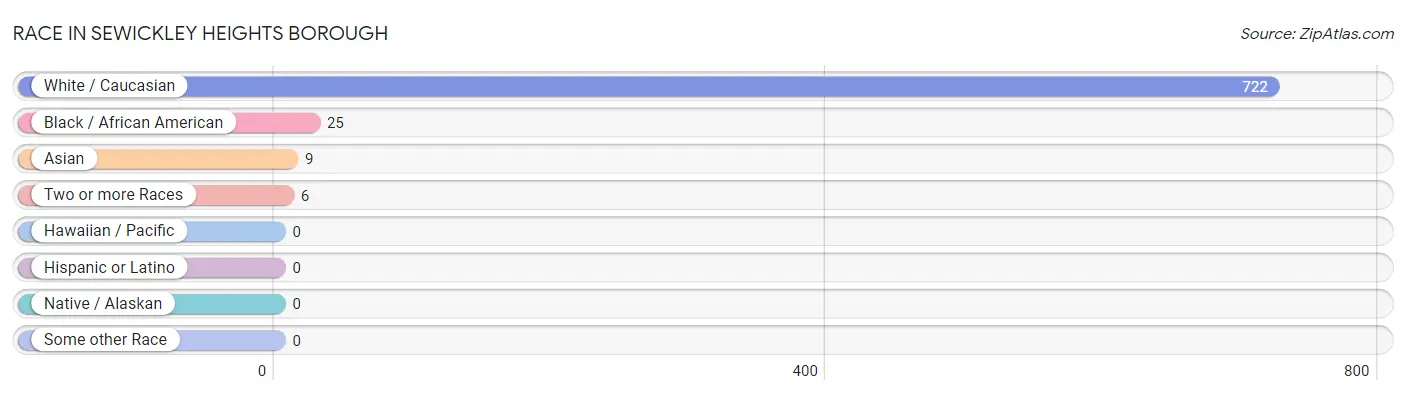
| Race | # Population | % Population |
| Asian | 9 | 1.2% |
| Black / African American | 25 | 3.3% |
| Hawaiian / Pacific | 0 | 0.0% |
| Hispanic or Latino | 0 | 0.0% |
| Native / Alaskan | 0 | 0.0% |
| White / Caucasian | 722 | 94.8% |
| Two or more Races | 6 | 0.8% |
| Some other Race | 0 | 0.0% |
| Total | 762 | 100.0% |
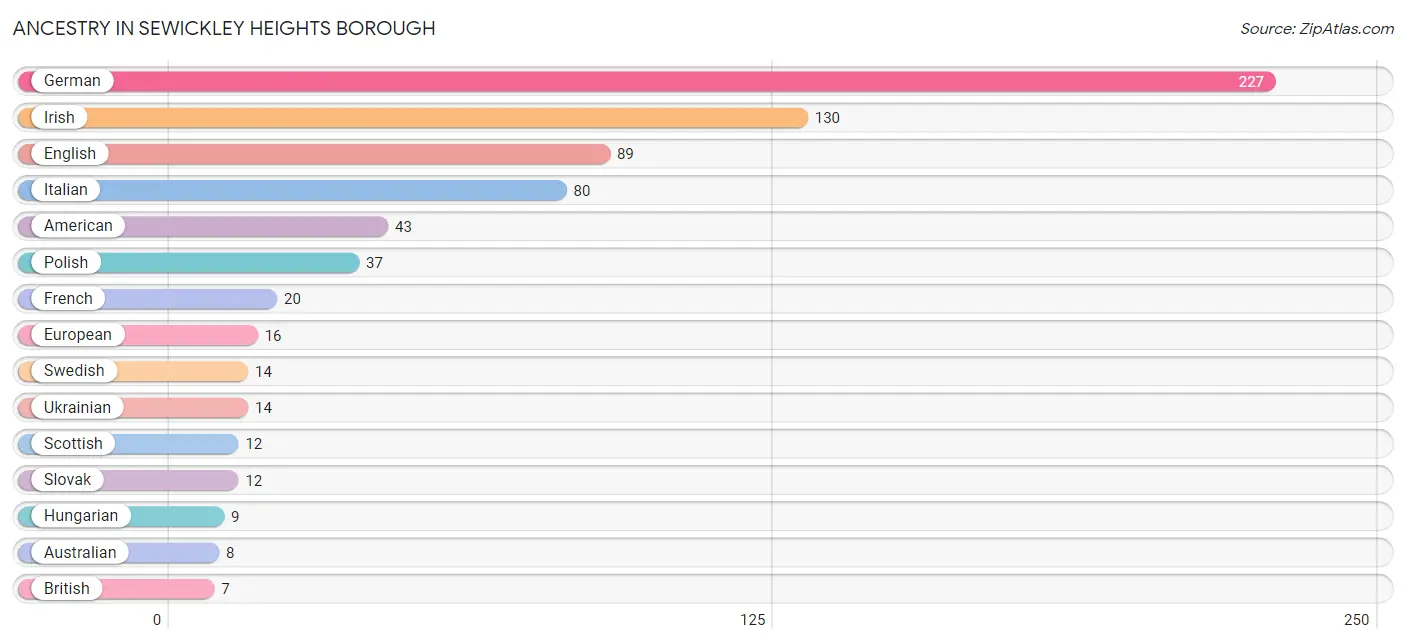
Ancestry in Sewickley Heights borough
The most populous ancestries reported in Sewickley Heights borough are German (227 | 29.8%), Irish (130 | 17.1%), English (89 | 11.7%), Italian (80 | 10.5%), and American (43 | 5.6%), together accounting for 74.7% of all Sewickley Heights borough residents.
| Ancestry | # Population | % Population |
| American | 43 | 5.6% |
| Arab | 3 | 0.4% |
| Australian | 8 | 1.1% |
| Bhutanese | 1 | 0.1% |
| British | 7 | 0.9% |
| Canadian | 2 | 0.3% |
| Croatian | 5 | 0.7% |
| Czechoslovakian | 5 | 0.7% |
| Danish | 1 | 0.1% |
| Dutch | 4 | 0.5% |
| Eastern European | 4 | 0.5% |
| English | 89 | 11.7% |
| European | 16 | 2.1% |
| French | 20 | 2.6% |
| German | 227 | 29.8% |
| Greek | 2 | 0.3% |
| Hungarian | 9 | 1.2% |
| Iranian | 4 | 0.5% |
| Irish | 130 | 17.1% |
| Italian | 80 | 10.5% |
| Jamaican | 5 | 0.7% |
| Lebanese | 3 | 0.4% |
| Lithuanian | 5 | 0.7% |
| Pakistani | 6 | 0.8% |
| Polish | 37 | 4.9% |
| Russian | 5 | 0.7% |
| Scandinavian | 2 | 0.3% |
| Scotch-Irish | 6 | 0.8% |
| Scottish | 12 | 1.6% |
| Slovak | 12 | 1.6% |
| Swedish | 14 | 1.8% |
| Swiss | 2 | 0.3% |
| Ukrainian | 14 | 1.8% |
| Welsh | 1 | 0.1% |
| Yugoslavian | 5 | 0.7% | View All 35 Rows |
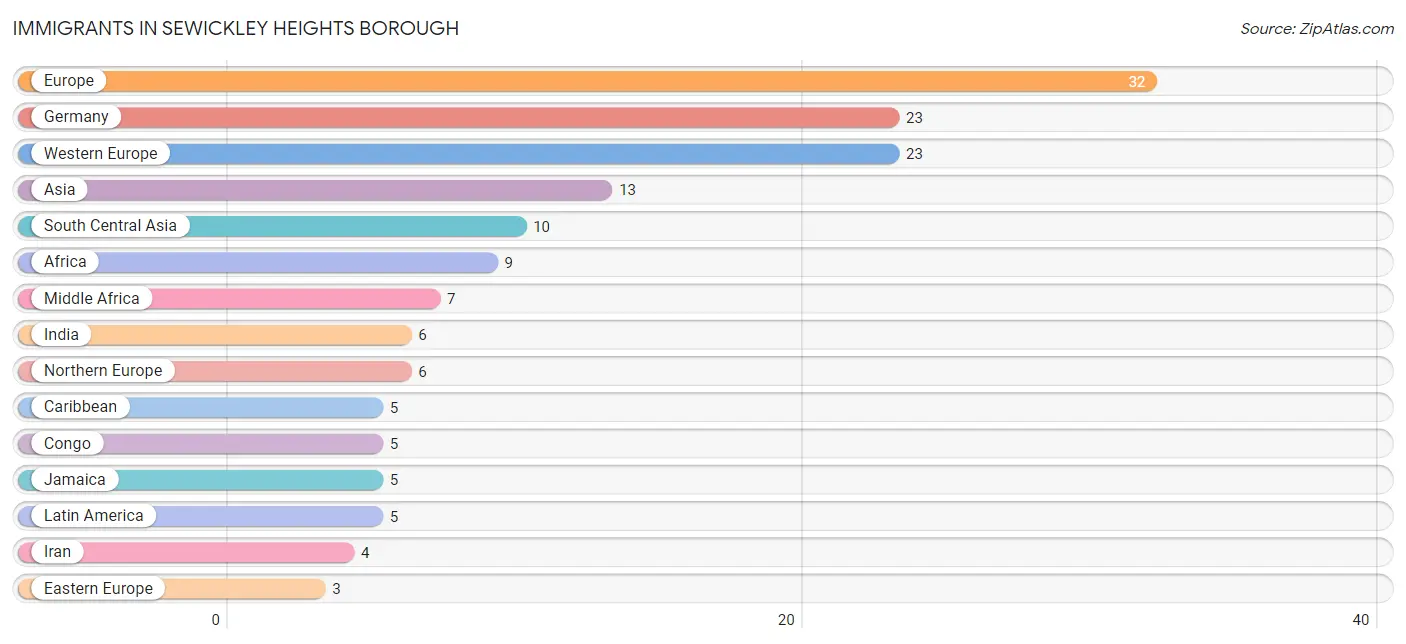
Immigrants in Sewickley Heights borough
The most numerous immigrant groups reported in Sewickley Heights borough came from Europe (32 | 4.2%), Germany (23 | 3.0%), Western Europe (23 | 3.0%), Asia (13 | 1.7%), and South Central Asia (10 | 1.3%), together accounting for 13.3% of all Sewickley Heights borough residents.
| Immigration Origin | # Population | % Population |
| Africa | 9 | 1.2% |
| Asia | 13 | 1.7% |
| Cameroon | 2 | 0.3% |
| Canada | 2 | 0.3% |
| Caribbean | 5 | 0.7% |
| Congo | 5 | 0.7% |
| Eastern Asia | 1 | 0.1% |
| Eastern Europe | 3 | 0.4% |
| England | 2 | 0.3% |
| Europe | 32 | 4.2% |
| Germany | 23 | 3.0% |
| Hungary | 3 | 0.4% |
| India | 6 | 0.8% |
| Iran | 4 | 0.5% |
| Jamaica | 5 | 0.7% |
| Japan | 1 | 0.1% |
| Latin America | 5 | 0.7% |
| Malaysia | 2 | 0.3% |
| Middle Africa | 7 | 0.9% |
| Northern Europe | 6 | 0.8% |
| South Africa | 2 | 0.3% |
| South Central Asia | 10 | 1.3% |
| South Eastern Asia | 2 | 0.3% |
| Western Europe | 23 | 3.0% | View All 24 Rows |
Sex and Age in Sewickley Heights borough
Sex and Age in Sewickley Heights borough
The most populous age groups in Sewickley Heights borough are 15 to 19 Years (68 | 17.2%) for men and 45 to 49 Years (41 | 11.2%) for women.
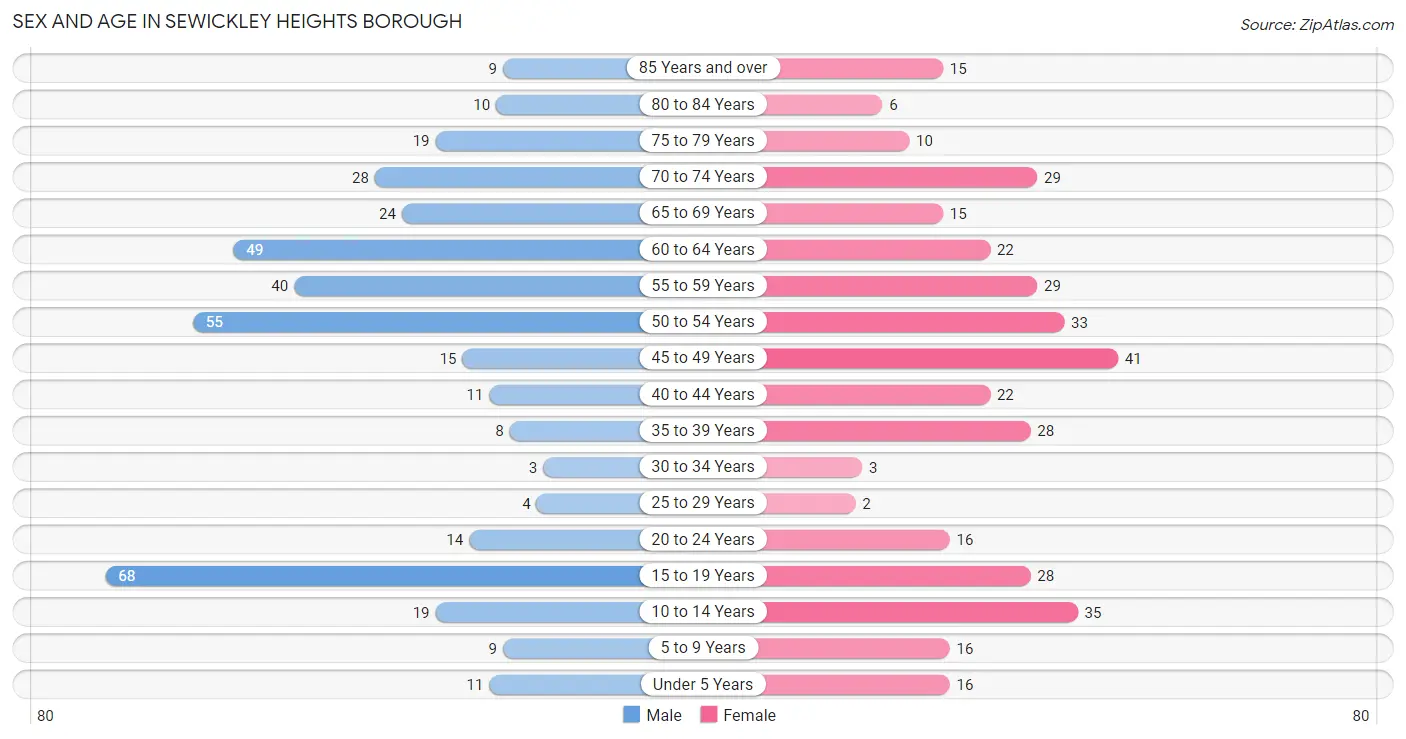
| Age Bracket | Male | Female |
| Under 5 Years | 11 (2.8%) | 16 (4.4%) |
| 5 to 9 Years | 9 (2.3%) | 16 (4.4%) |
| 10 to 14 Years | 19 (4.8%) | 35 (9.6%) |
| 15 to 19 Years | 68 (17.2%) | 28 (7.6%) |
| 20 to 24 Years | 14 (3.5%) | 16 (4.4%) |
| 25 to 29 Years | 4 (1.0%) | 2 (0.5%) |
| 30 to 34 Years | 3 (0.8%) | 3 (0.8%) |
| 35 to 39 Years | 8 (2.0%) | 28 (7.6%) |
| 40 to 44 Years | 11 (2.8%) | 22 (6.0%) |
| 45 to 49 Years | 15 (3.8%) | 41 (11.2%) |
| 50 to 54 Years | 55 (13.9%) | 33 (9.0%) |
| 55 to 59 Years | 40 (10.1%) | 29 (7.9%) |
| 60 to 64 Years | 49 (12.4%) | 22 (6.0%) |
| 65 to 69 Years | 24 (6.1%) | 15 (4.1%) |
| 70 to 74 Years | 28 (7.1%) | 29 (7.9%) |
| 75 to 79 Years | 19 (4.8%) | 10 (2.7%) |
| 80 to 84 Years | 10 (2.5%) | 6 (1.6%) |
| 85 Years and over | 9 (2.3%) | 15 (4.1%) |
| Total | 396 (100.0%) | 366 (100.0%) |
Families and Households in Sewickley Heights borough
Median Family Size in Sewickley Heights borough
The median family size in Sewickley Heights borough is 2.89 persons per family, with married-couple families (179 | 83.6%) accounting for the largest median family size of 3.01 persons per family. On the other hand, single female/mother families (23 | 10.7%) represent the smallest median family size with 2.22 persons per family.
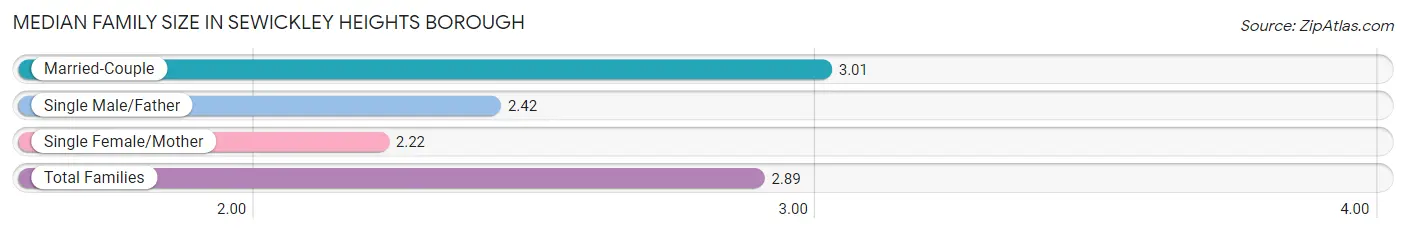
| Family Type | # Families | Family Size |
| Married-Couple | 179 (83.6%) | 3.01 |
| Single Male/Father | 12 (5.6%) | 2.42 |
| Single Female/Mother | 23 (10.7%) | 2.22 |
| Total Families | 214 (100.0%) | 2.89 |
Median Household Size in Sewickley Heights borough
The median household size in Sewickley Heights borough is 2.40 persons per household, with married-couple households (179 | 56.5%) accounting for the largest median household size of 3.01 persons per household. non-family households (103 | 32.5%) represent the smallest median household size with 1.33 persons per household.
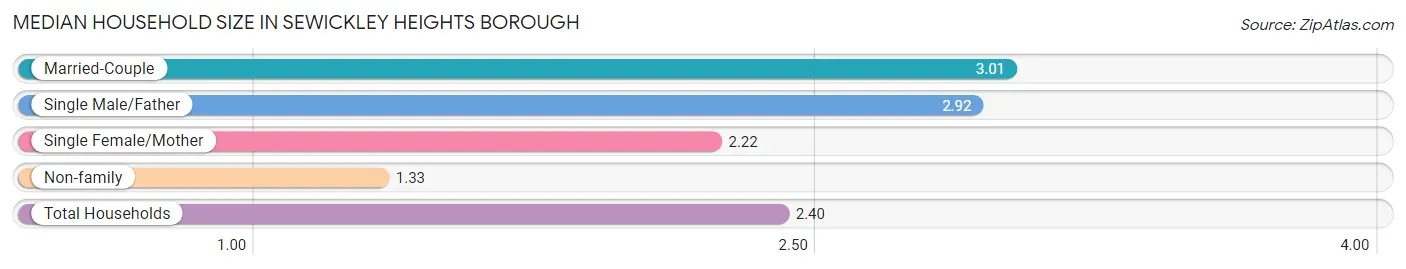
| Household Type | # Households | Household Size |
| Married-Couple | 179 (56.5%) | 3.01 |
| Single Male/Father | 12 (3.8%) | 2.92 |
| Single Female/Mother | 23 (7.3%) | 2.22 |
| Non-family | 103 (32.5%) | 1.33 |
| Total Households | 317 (100.0%) | 2.40 |
Household Size by Marriage Status in Sewickley Heights borough
Out of a total of 317 households in Sewickley Heights borough, 214 (67.5%) are family households, while 103 (32.5%) are nonfamily households. The most numerous type of family households are 2-person households, comprising 114, and the most common type of nonfamily households are 1-person households, comprising 78.
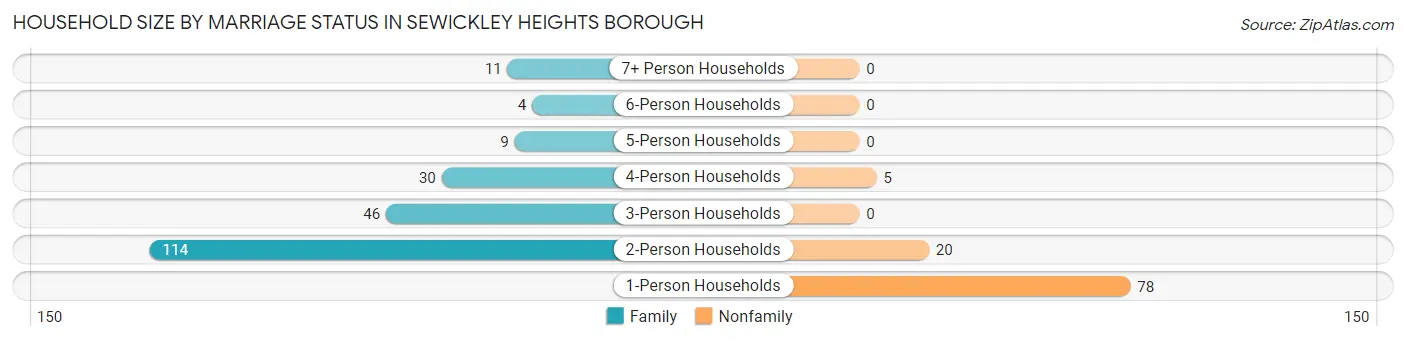
| Household Size | Family Households | Nonfamily Households |
| 1-Person Households | - | 78 (24.6%) |
| 2-Person Households | 114 (36.0%) | 20 (6.3%) |
| 3-Person Households | 46 (14.5%) | 0 (0.0%) |
| 4-Person Households | 30 (9.5%) | 5 (1.6%) |
| 5-Person Households | 9 (2.8%) | 0 (0.0%) |
| 6-Person Households | 4 (1.3%) | 0 (0.0%) |
| 7+ Person Households | 11 (3.5%) | 0 (0.0%) |
| Total | 214 (67.5%) | 103 (32.5%) |
Female Fertility in Sewickley Heights borough
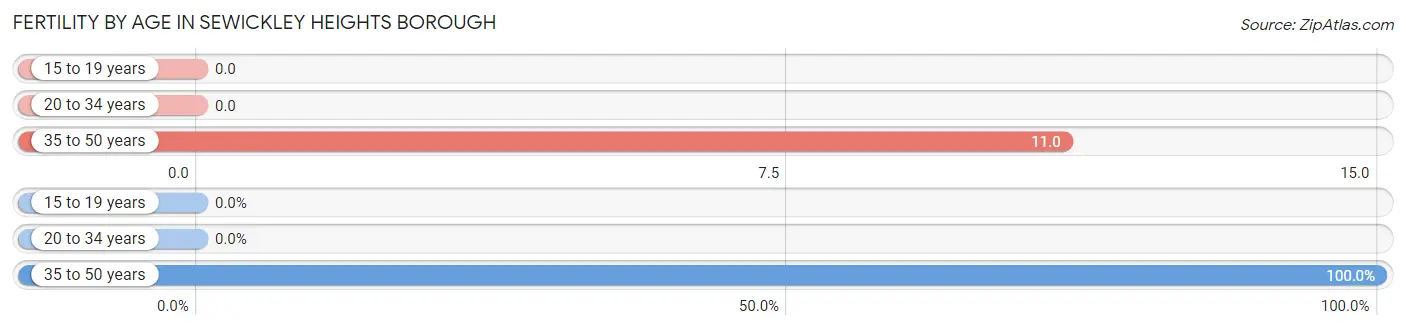
Fertility by Age in Sewickley Heights borough
Average fertility rate in Sewickley Heights borough is 7.0 births per 1,000 women. Women in the age bracket of 35 to 50 years have the highest fertility rate with 11.0 births per 1,000 women. Women in the age bracket of 35 to 50 years acount for 100.0% of all women with births.
| Age Bracket | Women with Births | Births / 1,000 Women |
| 15 to 19 years | 0 (0.0%) | 0.0 |
| 20 to 34 years | 0 (0.0%) | 0.0 |
| 35 to 50 years | 1 (100.0%) | 11.0 |
| Total | 1 (100.0%) | 7.0 |
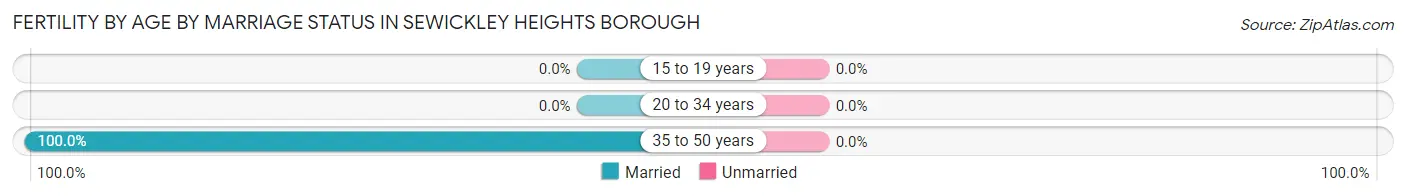
Fertility by Age by Marriage Status in Sewickley Heights borough
| Age Bracket | Married | Unmarried |
| 15 to 19 years | 0 (0.0%) | 0 (0.0%) |
| 20 to 34 years | 0 (0.0%) | 0 (0.0%) |
| 35 to 50 years | 1 (100.0%) | 0 (0.0%) |
| Total | 1 (100.0%) | 0 (0.0%) |
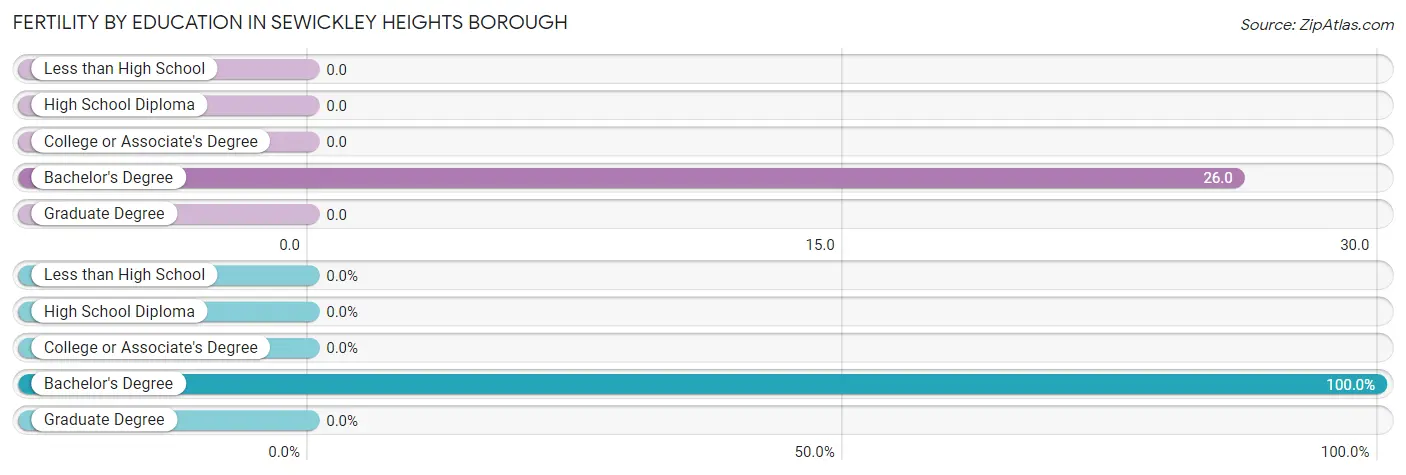
Fertility by Education in Sewickley Heights borough
| Educational Attainment | Women with Births | Births / 1,000 Women |
| Less than High School | 0 (0.0%) | 0.0 |
| High School Diploma | 0 (0.0%) | 0.0 |
| College or Associate's Degree | 0 (0.0%) | 0.0 |
| Bachelor's Degree | 1 (100.0%) | 26.0 |
| Graduate Degree | 0 (0.0%) | 0.0 |
| Total | 1 (100.0%) | 7.0 |
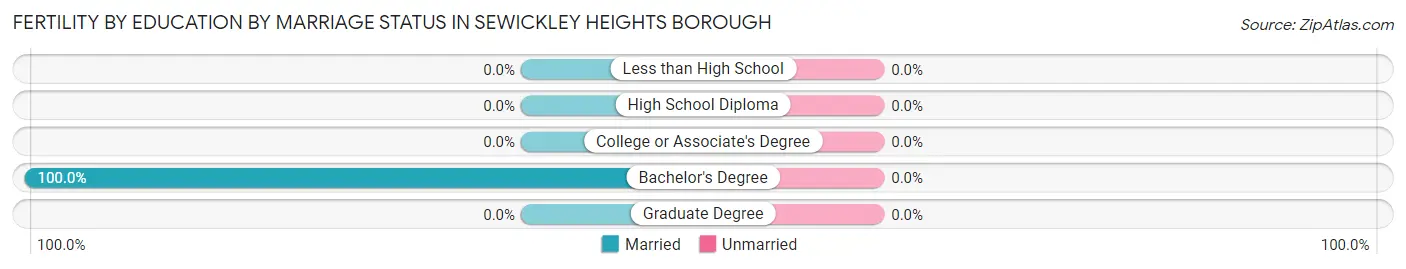
Fertility by Education by Marriage Status in Sewickley Heights borough
| Educational Attainment | Married | Unmarried |
| Less than High School | 0 (0.0%) | 0 (0.0%) |
| High School Diploma | 0 (0.0%) | 0 (0.0%) |
| College or Associate's Degree | 0 (0.0%) | 0 (0.0%) |
| Bachelor's Degree | 1 (100.0%) | 0 (0.0%) |
| Graduate Degree | 0 (0.0%) | 0 (0.0%) |
| Total | 1 (100.0%) | 0 (0.0%) |
Employment Characteristics in Sewickley Heights borough
Employment by Class of Employer in Sewickley Heights borough
Among the 343 employed individuals in Sewickley Heights borough, private company employees (207 | 60.4%), not-for-profit organizations (48 | 14.0%), and self-employed (incorporated) (47 | 13.7%) make up the most common classes of employment.
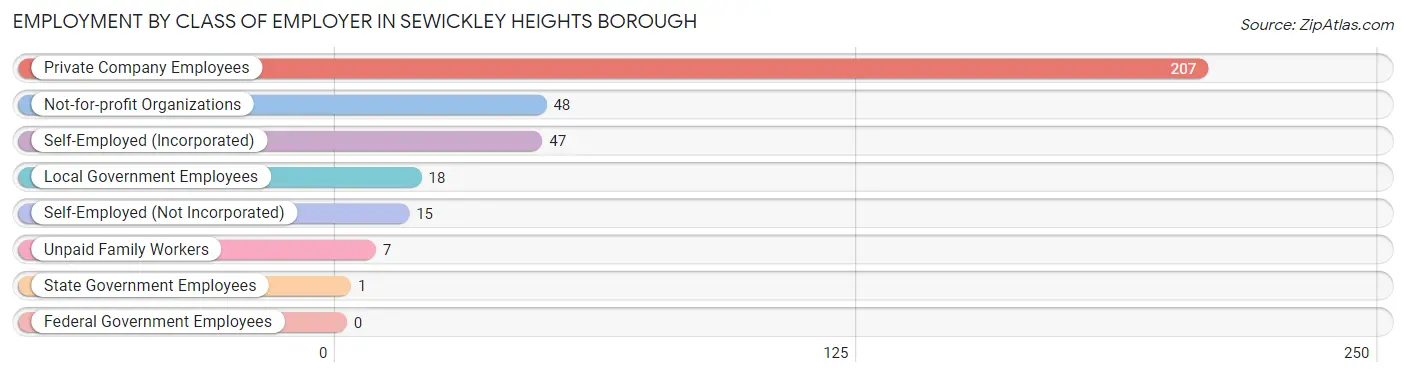
| Employer Class | # Employees | % Employees |
| Private Company Employees | 207 | 60.4% |
| Self-Employed (Incorporated) | 47 | 13.7% |
| Self-Employed (Not Incorporated) | 15 | 4.4% |
| Not-for-profit Organizations | 48 | 14.0% |
| Local Government Employees | 18 | 5.2% |
| State Government Employees | 1 | 0.3% |
| Federal Government Employees | 0 | 0.0% |
| Unpaid Family Workers | 7 | 2.0% |
| Total | 343 | 100.0% |
Employment Status by Age in Sewickley Heights borough
According to the labor force statistics for Sewickley Heights borough, out of the total population over 16 years of age (617), 57.1% or 352 individuals are in the labor force, with 2.6% or 9 of them unemployed. The age group with the highest labor force participation rate is 25 to 29 years, with 100.0% or 6 individuals in the labor force. Within the labor force, the 55 to 59 years age range has the highest percentage of unemployed individuals, with 16.4% or 9 of them being unemployed.
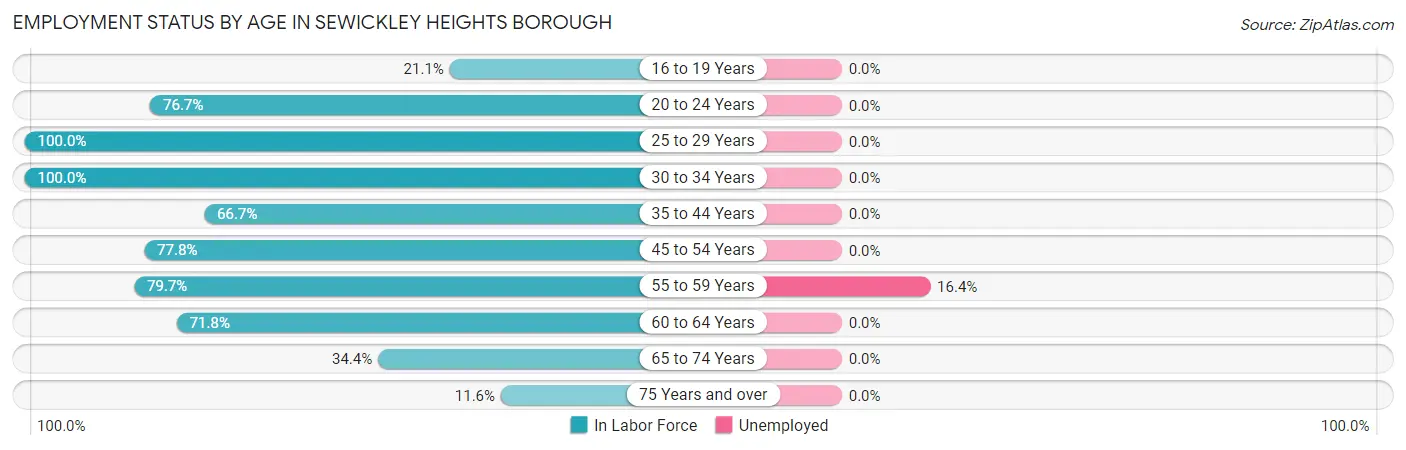
| Age Bracket | In Labor Force | Unemployed |
| 16 to 19 Years | 12 (21.1%) | 0 (0.0%) |
| 20 to 24 Years | 23 (76.7%) | 0 (0.0%) |
| 25 to 29 Years | 6 (100.0%) | 0 (0.0%) |
| 30 to 34 Years | 6 (100.0%) | 0 (0.0%) |
| 35 to 44 Years | 46 (66.7%) | 0 (0.0%) |
| 45 to 54 Years | 112 (77.8%) | 0 (0.0%) |
| 55 to 59 Years | 55 (79.7%) | 9 (16.4%) |
| 60 to 64 Years | 51 (71.8%) | 0 (0.0%) |
| 65 to 74 Years | 33 (34.4%) | 0 (0.0%) |
| 75 Years and over | 8 (11.6%) | 0 (0.0%) |
| Total | 352 (57.1%) | 9 (2.6%) |
Employment Status by Educational Attainment in Sewickley Heights borough
According to labor force statistics for Sewickley Heights borough, 75.6% of individuals (276) out of the total population between 25 and 64 years of age (365) are in the labor force, with 3.3% or 9 of them being unemployed. The group with the highest labor force participation rate are those with the educational attainment of college / associate degree, with 83.6% or 61 individuals in the labor force. Within the labor force, individuals with college / associate degree education have the highest percentage of unemployment, with 8.2% or 5 of them being unemployed.
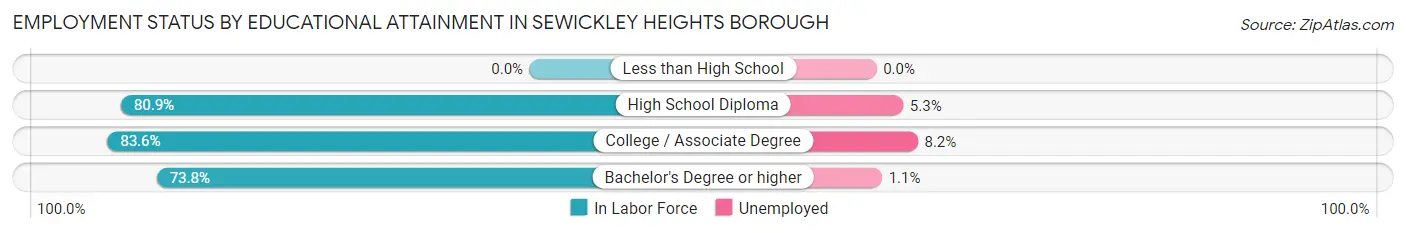
| Educational Attainment | In Labor Force | Unemployed |
| Less than High School | 0 (0.0%) | 0 (0.0%) |
| High School Diploma | 38 (80.9%) | 2 (5.3%) |
| College / Associate Degree | 61 (83.6%) | 6 (8.2%) |
| Bachelor's Degree or higher | 177 (73.8%) | 3 (1.1%) |
| Total | 276 (75.6%) | 12 (3.3%) |
Employment Occupations by Sex in Sewickley Heights borough
Management, Business, Science and Arts Occupations
The most common Management, Business, Science and Arts occupations in Sewickley Heights borough are Management (96 | 28.0%), Community & Social Service (60 | 17.5%), Health Diagnosing & Treating (31 | 9.0%), Health Technologists (31 | 9.0%), and Legal Services & Support (30 | 8.7%).
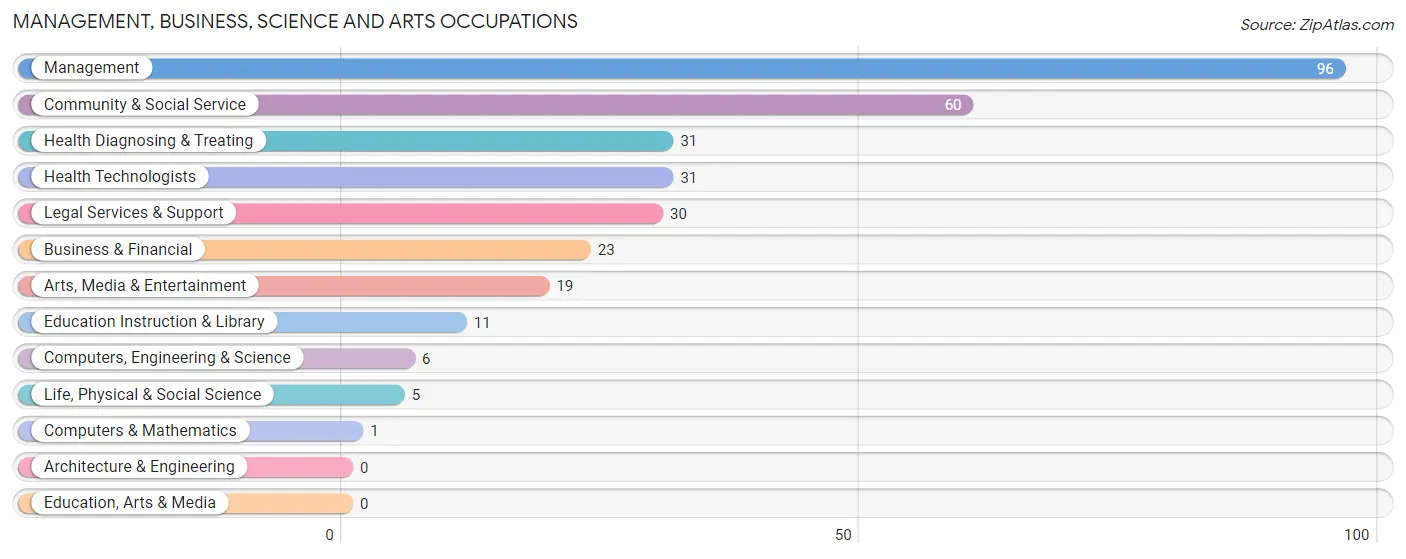
Management, Business, Science and Arts Occupations by Sex
Within the Management, Business, Science and Arts occupations in Sewickley Heights borough, the most male-oriented occupations are Life, Physical & Social Science (100.0%), Legal Services & Support (86.7%), and Computers, Engineering & Science (83.3%), while the most female-oriented occupations are Computers & Mathematics (100.0%), Education Instruction & Library (54.5%), and Health Diagnosing & Treating (48.4%).
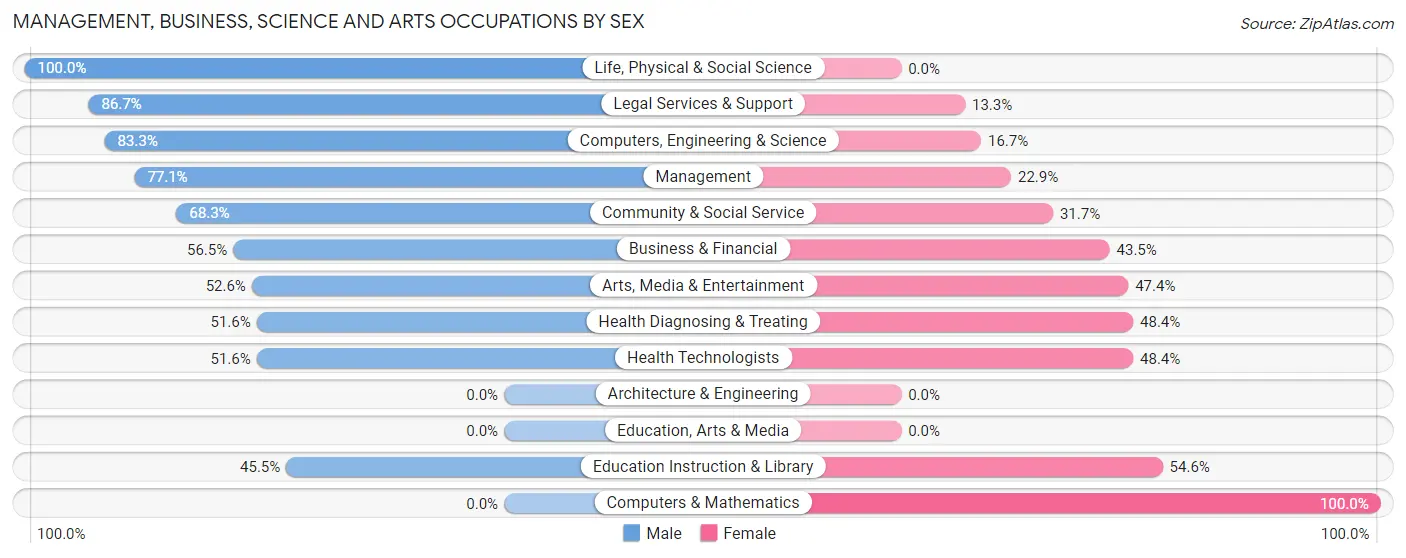
| Occupation | Male | Female |
| Management | 74 (77.1%) | 22 (22.9%) |
| Business & Financial | 13 (56.5%) | 10 (43.5%) |
| Computers, Engineering & Science | 5 (83.3%) | 1 (16.7%) |
| Computers & Mathematics | 0 (0.0%) | 1 (100.0%) |
| Architecture & Engineering | 0 (0.0%) | 0 (0.0%) |
| Life, Physical & Social Science | 5 (100.0%) | 0 (0.0%) |
| Community & Social Service | 41 (68.3%) | 19 (31.7%) |
| Education, Arts & Media | 0 (0.0%) | 0 (0.0%) |
| Legal Services & Support | 26 (86.7%) | 4 (13.3%) |
| Education Instruction & Library | 5 (45.5%) | 6 (54.5%) |
| Arts, Media & Entertainment | 10 (52.6%) | 9 (47.4%) |
| Health Diagnosing & Treating | 16 (51.6%) | 15 (48.4%) |
| Health Technologists | 16 (51.6%) | 15 (48.4%) |
| Total (Category) | 149 (69.0%) | 67 (31.0%) |
| Total (Overall) | 214 (62.4%) | 129 (37.6%) |
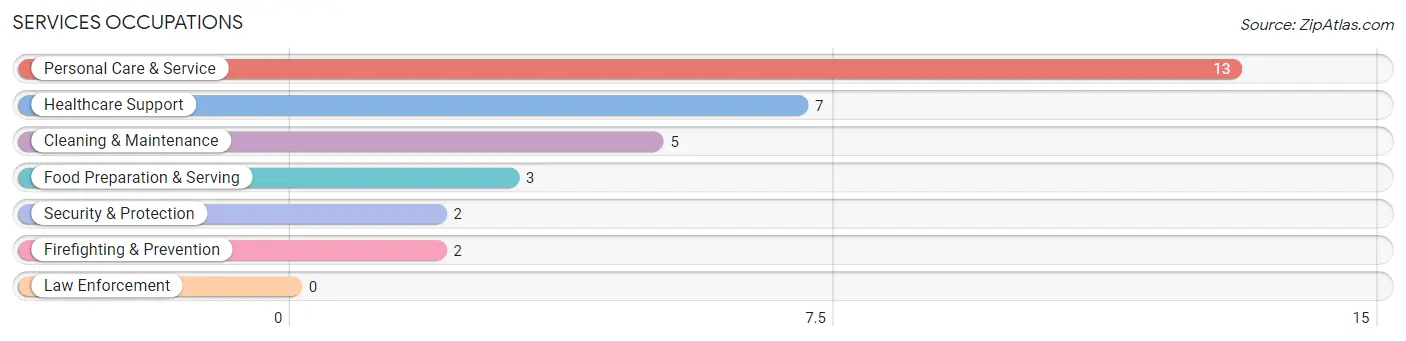
Services Occupations
The most common Services occupations in Sewickley Heights borough are Personal Care & Service (13 | 3.8%), Healthcare Support (7 | 2.0%), Cleaning & Maintenance (5 | 1.5%), Food Preparation & Serving (3 | 0.9%), and Security & Protection (2 | 0.6%).
Services Occupations by Sex
Within the Services occupations in Sewickley Heights borough, the most male-oriented occupations are Cleaning & Maintenance (60.0%), and Personal Care & Service (15.4%), while the most female-oriented occupations are Healthcare Support (100.0%), Security & Protection (100.0%), and Firefighting & Prevention (100.0%).
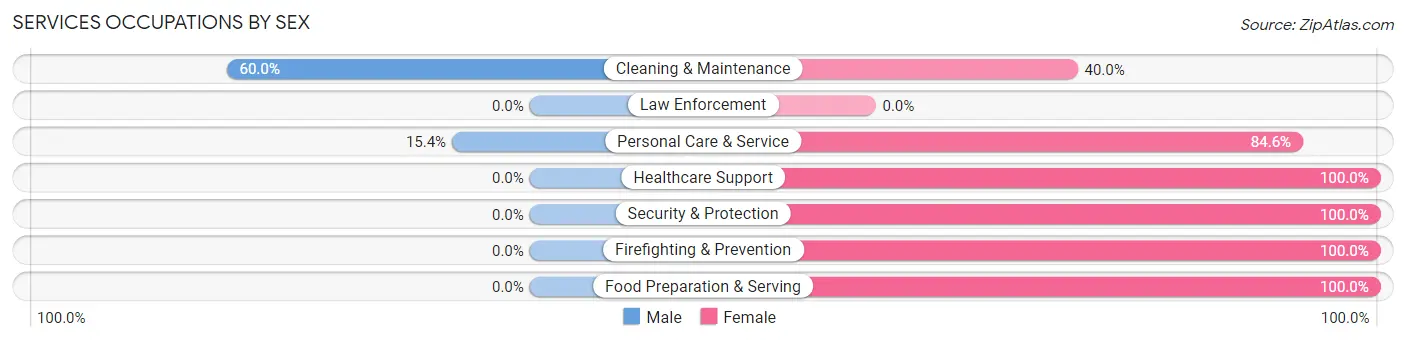
| Occupation | Male | Female |
| Healthcare Support | 0 (0.0%) | 7 (100.0%) |
| Security & Protection | 0 (0.0%) | 2 (100.0%) |
| Firefighting & Prevention | 0 (0.0%) | 2 (100.0%) |
| Law Enforcement | 0 (0.0%) | 0 (0.0%) |
| Food Preparation & Serving | 0 (0.0%) | 3 (100.0%) |
| Cleaning & Maintenance | 3 (60.0%) | 2 (40.0%) |
| Personal Care & Service | 2 (15.4%) | 11 (84.6%) |
| Total (Category) | 5 (16.7%) | 25 (83.3%) |
| Total (Overall) | 214 (62.4%) | 129 (37.6%) |
Sales and Office Occupations
The most common Sales and Office occupations in Sewickley Heights borough are Sales & Related (44 | 12.8%), and Office & Administration (15 | 4.4%).
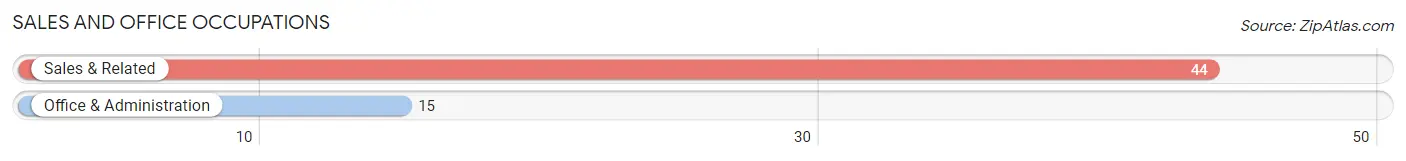
Sales and Office Occupations by Sex
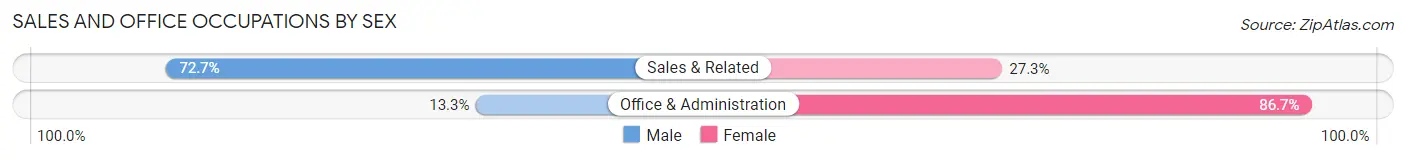
| Occupation | Male | Female |
| Sales & Related | 32 (72.7%) | 12 (27.3%) |
| Office & Administration | 2 (13.3%) | 13 (86.7%) |
| Total (Category) | 34 (57.6%) | 25 (42.4%) |
| Total (Overall) | 214 (62.4%) | 129 (37.6%) |
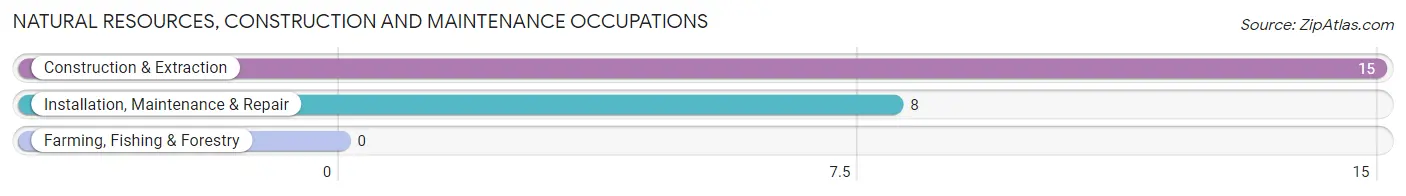
Natural Resources, Construction and Maintenance Occupations
The most common Natural Resources, Construction and Maintenance occupations in Sewickley Heights borough are Construction & Extraction (15 | 4.4%), and Installation, Maintenance & Repair (8 | 2.3%).
Natural Resources, Construction and Maintenance Occupations by Sex
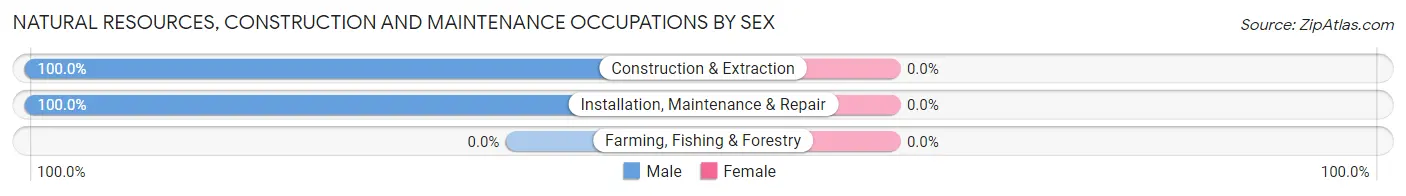
| Occupation | Male | Female |
| Farming, Fishing & Forestry | 0 (0.0%) | 0 (0.0%) |
| Construction & Extraction | 15 (100.0%) | 0 (0.0%) |
| Installation, Maintenance & Repair | 8 (100.0%) | 0 (0.0%) |
| Total (Category) | 23 (100.0%) | 0 (0.0%) |
| Total (Overall) | 214 (62.4%) | 129 (37.6%) |
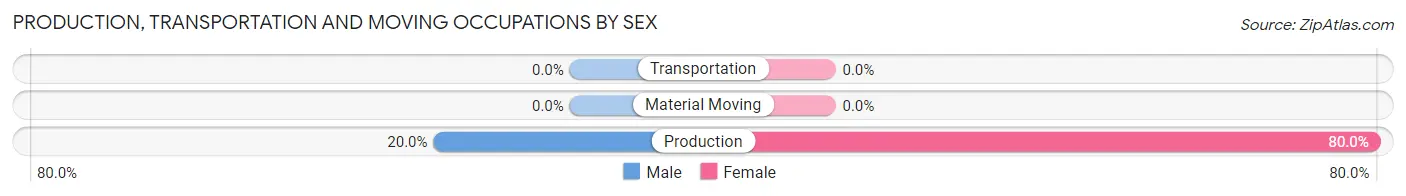
Production, Transportation and Moving Occupations
The most common Production, Transportation and Moving occupations in Sewickley Heights borough are , and Production (15 | 4.4%).
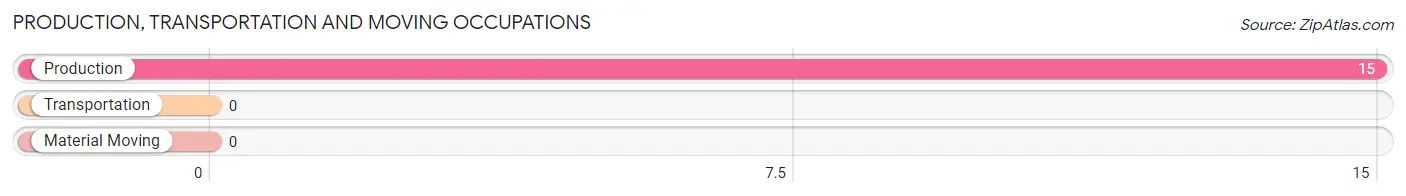
Production, Transportation and Moving Occupations by Sex
| Occupation | Male | Female |
| Production | 3 (20.0%) | 12 (80.0%) |
| Transportation | 0 (0.0%) | 0 (0.0%) |
| Material Moving | 0 (0.0%) | 0 (0.0%) |
| Total (Category) | 3 (20.0%) | 12 (80.0%) |
| Total (Overall) | 214 (62.4%) | 129 (37.6%) |
Employment Industries by Sex in Sewickley Heights borough
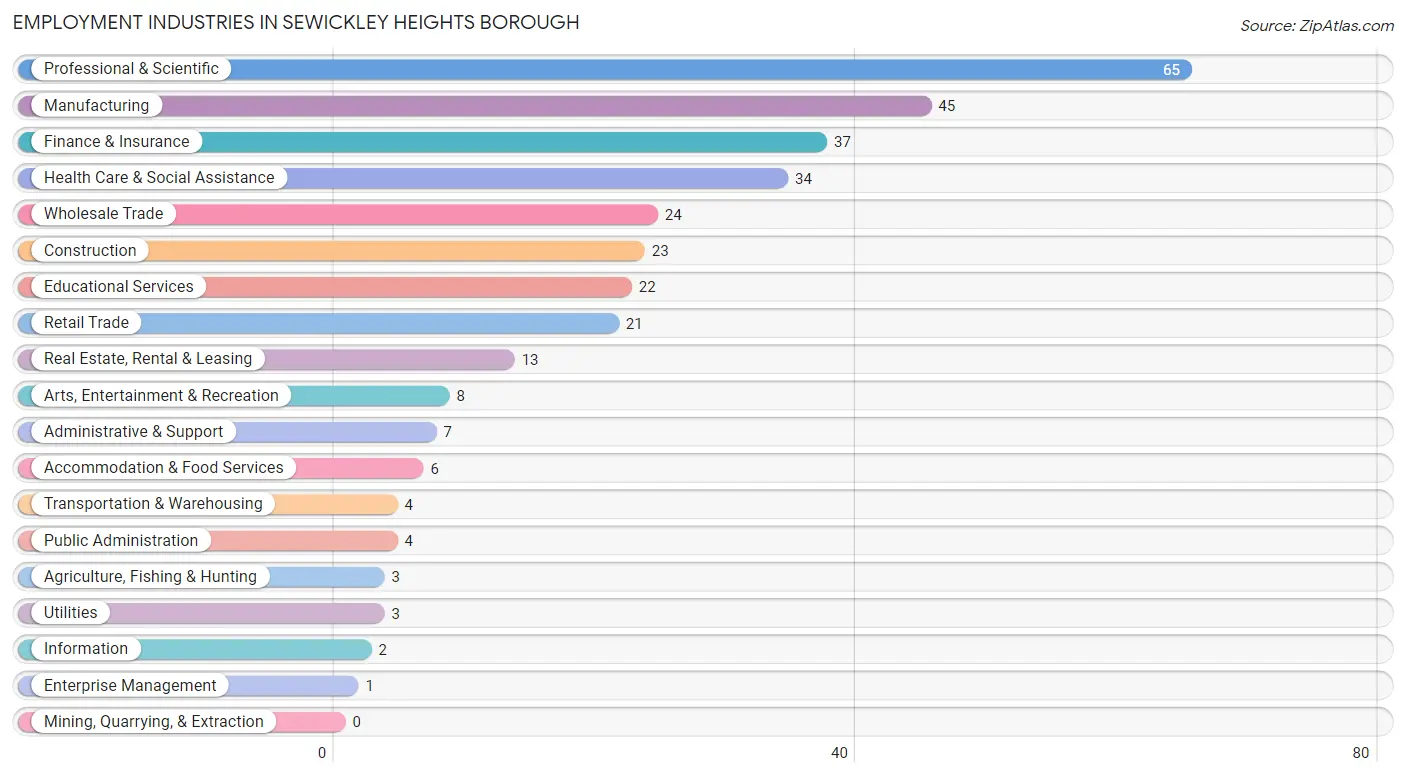
Employment Industries in Sewickley Heights borough
The major employment industries in Sewickley Heights borough include Professional & Scientific (65 | 19.0%), Manufacturing (45 | 13.1%), Finance & Insurance (37 | 10.8%), Health Care & Social Assistance (34 | 9.9%), and Wholesale Trade (24 | 7.0%).
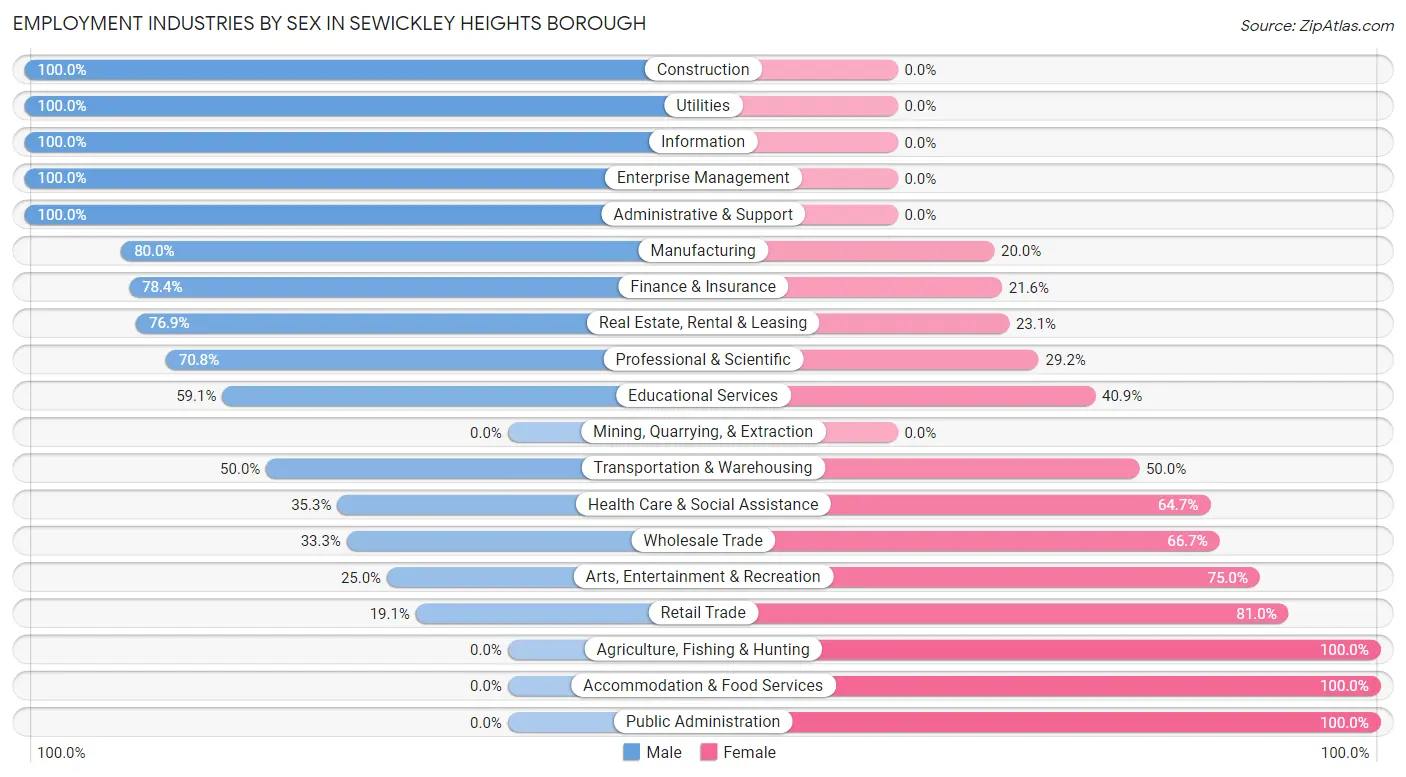
Employment Industries by Sex in Sewickley Heights borough
The Sewickley Heights borough industries that see more men than women are Construction (100.0%), Utilities (100.0%), and Information (100.0%), whereas the industries that tend to have a higher number of women are Agriculture, Fishing & Hunting (100.0%), Accommodation & Food Services (100.0%), and Public Administration (100.0%).
| Industry | Male | Female |
| Agriculture, Fishing & Hunting | 0 (0.0%) | 3 (100.0%) |
| Mining, Quarrying, & Extraction | 0 (0.0%) | 0 (0.0%) |
| Construction | 23 (100.0%) | 0 (0.0%) |
| Manufacturing | 36 (80.0%) | 9 (20.0%) |
| Wholesale Trade | 8 (33.3%) | 16 (66.7%) |
| Retail Trade | 4 (19.1%) | 17 (80.9%) |
| Transportation & Warehousing | 2 (50.0%) | 2 (50.0%) |
| Utilities | 3 (100.0%) | 0 (0.0%) |
| Information | 2 (100.0%) | 0 (0.0%) |
| Finance & Insurance | 29 (78.4%) | 8 (21.6%) |
| Real Estate, Rental & Leasing | 10 (76.9%) | 3 (23.1%) |
| Professional & Scientific | 46 (70.8%) | 19 (29.2%) |
| Enterprise Management | 1 (100.0%) | 0 (0.0%) |
| Administrative & Support | 7 (100.0%) | 0 (0.0%) |
| Educational Services | 13 (59.1%) | 9 (40.9%) |
| Health Care & Social Assistance | 12 (35.3%) | 22 (64.7%) |
| Arts, Entertainment & Recreation | 2 (25.0%) | 6 (75.0%) |
| Accommodation & Food Services | 0 (0.0%) | 6 (100.0%) |
| Public Administration | 0 (0.0%) | 4 (100.0%) |
| Total | 214 (62.4%) | 129 (37.6%) |
Education in Sewickley Heights borough
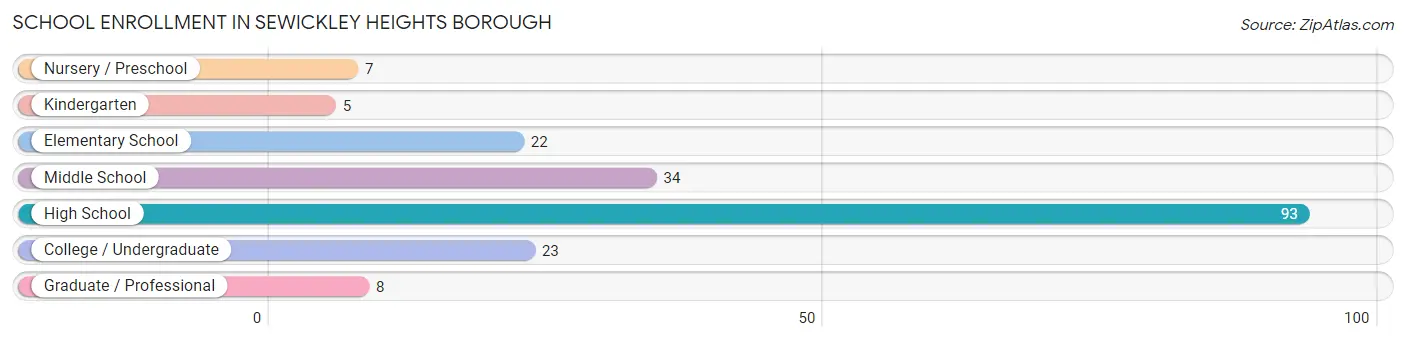
School Enrollment in Sewickley Heights borough
The most common levels of schooling among the 192 students in Sewickley Heights borough are high school (93 | 48.4%), middle school (34 | 17.7%), and college / undergraduate (23 | 12.0%).
| School Level | # Students | % Students |
| Nursery / Preschool | 7 | 3.6% |
| Kindergarten | 5 | 2.6% |
| Elementary School | 22 | 11.5% |
| Middle School | 34 | 17.7% |
| High School | 93 | 48.4% |
| College / Undergraduate | 23 | 12.0% |
| Graduate / Professional | 8 | 4.2% |
| Total | 192 | 100.0% |
School Enrollment by Age by Funding Source in Sewickley Heights borough
Out of a total of 192 students who are enrolled in schools in Sewickley Heights borough, 77 (40.1%) attend a private institution, while the remaining 115 (59.9%) are enrolled in public schools. The age group of 3 to 4 year olds has the highest likelihood of being enrolled in private schools, with 4 (100.0% in the age bracket) enrolled. Conversely, the age group of 18 to 19 year olds has the lowest likelihood of being enrolled in a private school, with 19 (86.4% in the age bracket) attending a public institution.
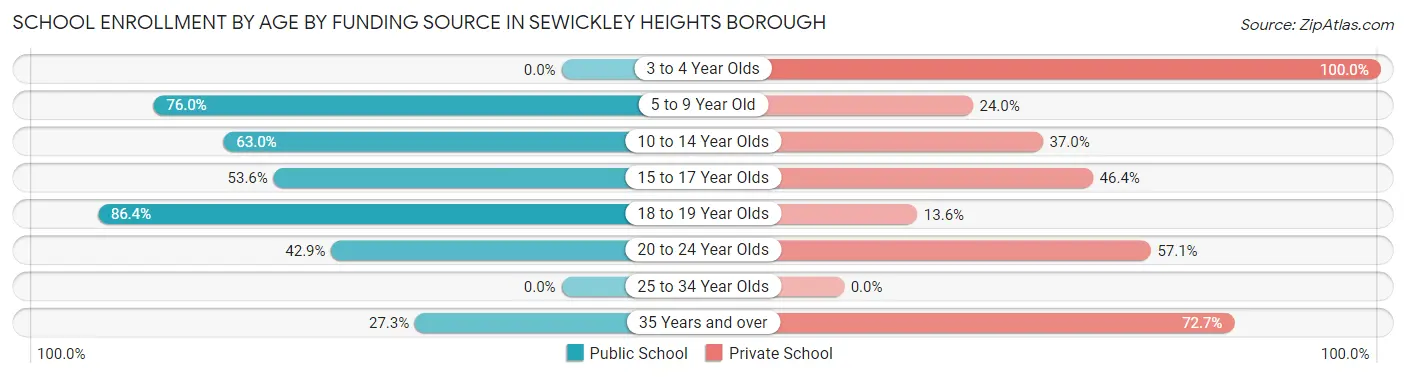
| Age Bracket | Public School | Private School |
| 3 to 4 Year Olds | 0 (0.0%) | 4 (100.0%) |
| 5 to 9 Year Old | 19 (76.0%) | 6 (24.0%) |
| 10 to 14 Year Olds | 34 (63.0%) | 20 (37.0%) |
| 15 to 17 Year Olds | 37 (53.6%) | 32 (46.4%) |
| 18 to 19 Year Olds | 19 (86.4%) | 3 (13.6%) |
| 20 to 24 Year Olds | 3 (42.9%) | 4 (57.1%) |
| 25 to 34 Year Olds | 0 (0.0%) | 0 (0.0%) |
| 35 Years and over | 3 (27.3%) | 8 (72.7%) |
| Total | 115 (59.9%) | 77 (40.1%) |
Educational Attainment by Field of Study in Sewickley Heights borough
Social sciences (93 | 22.7%), business (49 | 11.9%), literature & languages (43 | 10.5%), science & technology (31 | 7.6%), and liberal arts & history (31 | 7.6%) are the most common fields of study among 410 individuals in Sewickley Heights borough who have obtained a bachelor's degree or higher.
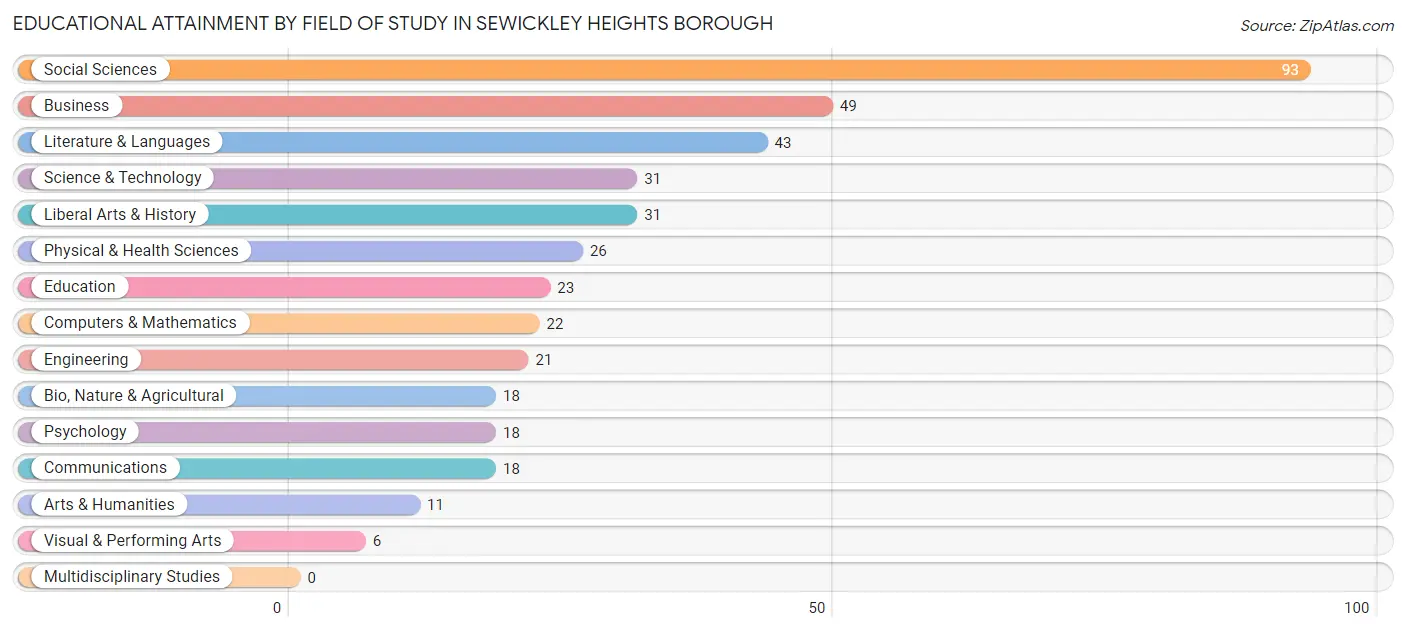
| Field of Study | # Graduates | % Graduates |
| Computers & Mathematics | 22 | 5.4% |
| Bio, Nature & Agricultural | 18 | 4.4% |
| Physical & Health Sciences | 26 | 6.3% |
| Psychology | 18 | 4.4% |
| Social Sciences | 93 | 22.7% |
| Engineering | 21 | 5.1% |
| Multidisciplinary Studies | 0 | 0.0% |
| Science & Technology | 31 | 7.6% |
| Business | 49 | 11.9% |
| Education | 23 | 5.6% |
| Literature & Languages | 43 | 10.5% |
| Liberal Arts & History | 31 | 7.6% |
| Visual & Performing Arts | 6 | 1.5% |
| Communications | 18 | 4.4% |
| Arts & Humanities | 11 | 2.7% |
| Total | 410 | 100.0% |
Transportation & Commute in Sewickley Heights borough
Vehicle Availability by Sex in Sewickley Heights borough
The most prevalent vehicle ownership categories in Sewickley Heights borough are males with 3 vehicles (73, accounting for 34.1%) and females with 3 vehicles (26, making up 56.6%).
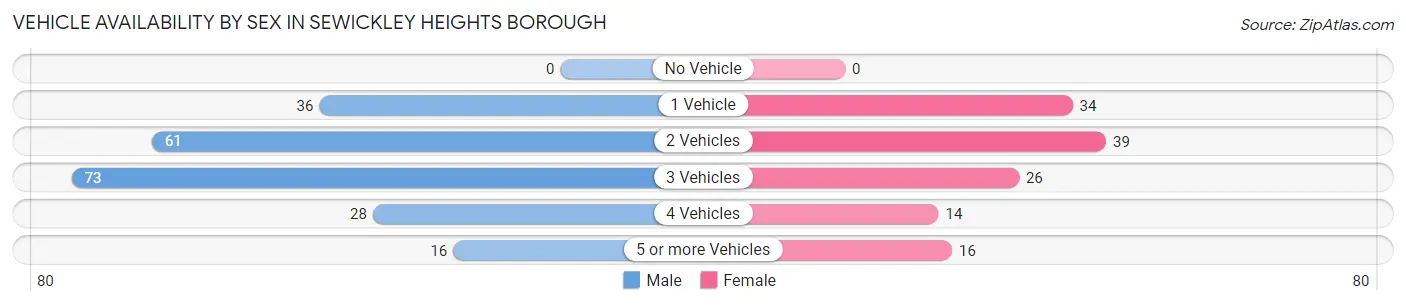
| Vehicles Available | Male | Female |
| No Vehicle | 0 (0.0%) | 0 (0.0%) |
| 1 Vehicle | 36 (16.8%) | 34 (26.4%) |
| 2 Vehicles | 61 (28.5%) | 39 (30.2%) |
| 3 Vehicles | 73 (34.1%) | 26 (20.2%) |
| 4 Vehicles | 28 (13.1%) | 14 (10.8%) |
| 5 or more Vehicles | 16 (7.5%) | 16 (12.4%) |
| Total | 214 (100.0%) | 129 (100.0%) |
Commute Time in Sewickley Heights borough
The most frequently occuring commute durations in Sewickley Heights borough are 30 to 34 minutes (50 commuters, 20.7%), 20 to 24 minutes (41 commuters, 16.9%), and 5 to 9 minutes (38 commuters, 15.7%).
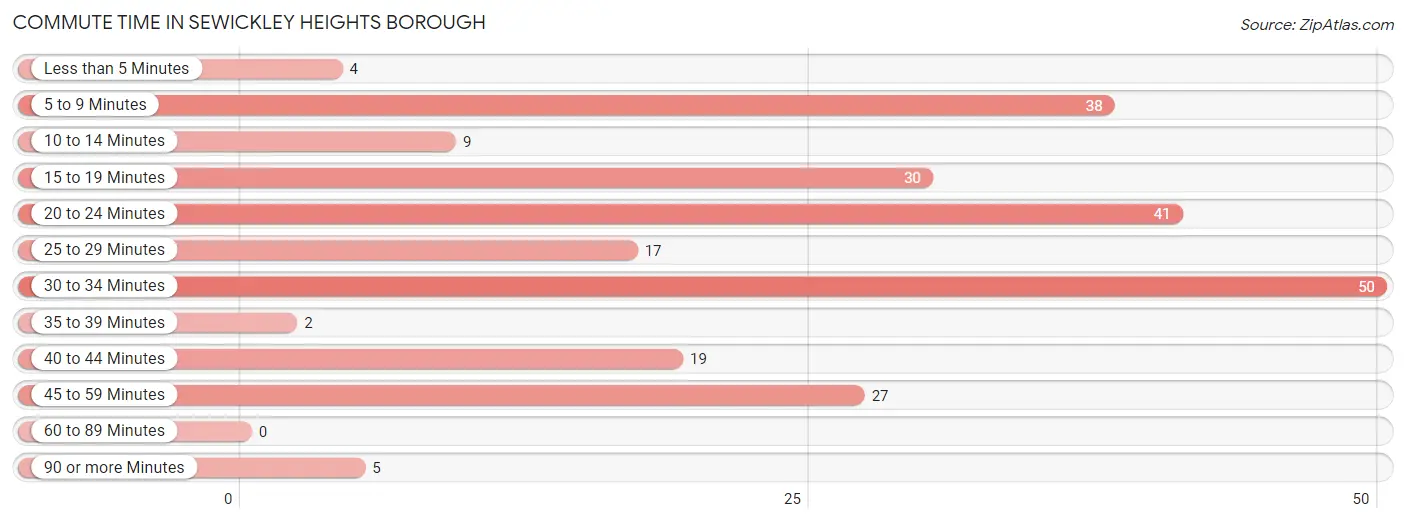
| Commute Time | # Commuters | % Commuters |
| Less than 5 Minutes | 4 | 1.7% |
| 5 to 9 Minutes | 38 | 15.7% |
| 10 to 14 Minutes | 9 | 3.7% |
| 15 to 19 Minutes | 30 | 12.4% |
| 20 to 24 Minutes | 41 | 16.9% |
| 25 to 29 Minutes | 17 | 7.0% |
| 30 to 34 Minutes | 50 | 20.7% |
| 35 to 39 Minutes | 2 | 0.8% |
| 40 to 44 Minutes | 19 | 7.9% |
| 45 to 59 Minutes | 27 | 11.2% |
| 60 to 89 Minutes | 0 | 0.0% |
| 90 or more Minutes | 5 | 2.1% |
Commute Time by Sex in Sewickley Heights borough
The most common commute times in Sewickley Heights borough are 30 to 34 minutes (32 commuters, 20.0%) for males and 30 to 34 minutes (18 commuters, 22.0%) for females.
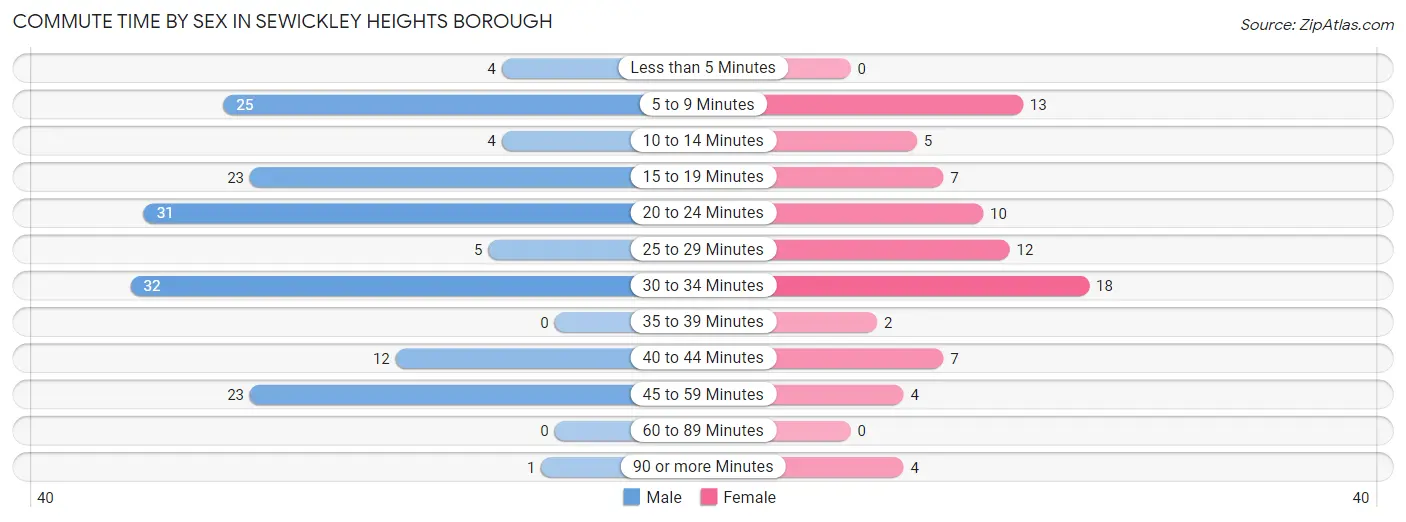
| Commute Time | Male | Female |
| Less than 5 Minutes | 4 (2.5%) | 0 (0.0%) |
| 5 to 9 Minutes | 25 (15.6%) | 13 (15.9%) |
| 10 to 14 Minutes | 4 (2.5%) | 5 (6.1%) |
| 15 to 19 Minutes | 23 (14.4%) | 7 (8.5%) |
| 20 to 24 Minutes | 31 (19.4%) | 10 (12.2%) |
| 25 to 29 Minutes | 5 (3.1%) | 12 (14.6%) |
| 30 to 34 Minutes | 32 (20.0%) | 18 (22.0%) |
| 35 to 39 Minutes | 0 (0.0%) | 2 (2.4%) |
| 40 to 44 Minutes | 12 (7.5%) | 7 (8.5%) |
| 45 to 59 Minutes | 23 (14.4%) | 4 (4.9%) |
| 60 to 89 Minutes | 0 (0.0%) | 0 (0.0%) |
| 90 or more Minutes | 1 (0.6%) | 4 (4.9%) |
Time of Departure to Work by Sex in Sewickley Heights borough
The most frequent times of departure to work in Sewickley Heights borough are 8:00 AM to 8:29 AM (42, 26.3%) for males and 8:00 AM to 8:29 AM (22, 26.8%) for females.
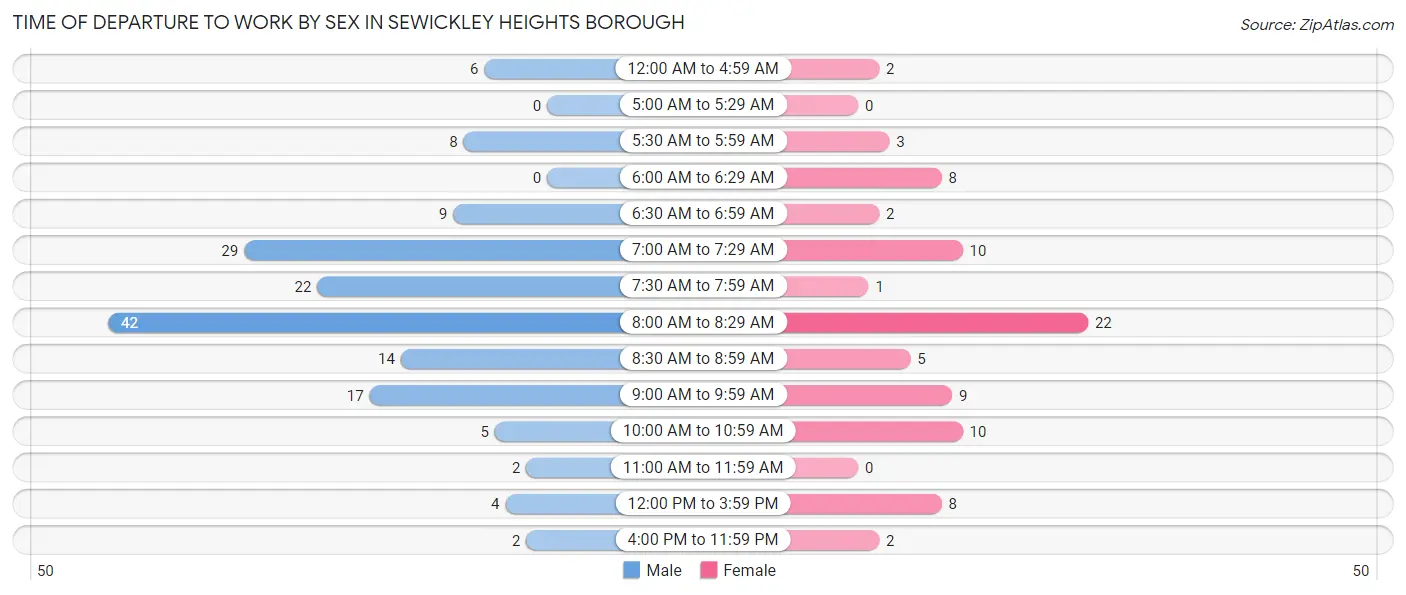
| Time of Departure | Male | Female |
| 12:00 AM to 4:59 AM | 6 (3.7%) | 2 (2.4%) |
| 5:00 AM to 5:29 AM | 0 (0.0%) | 0 (0.0%) |
| 5:30 AM to 5:59 AM | 8 (5.0%) | 3 (3.7%) |
| 6:00 AM to 6:29 AM | 0 (0.0%) | 8 (9.8%) |
| 6:30 AM to 6:59 AM | 9 (5.6%) | 2 (2.4%) |
| 7:00 AM to 7:29 AM | 29 (18.1%) | 10 (12.2%) |
| 7:30 AM to 7:59 AM | 22 (13.8%) | 1 (1.2%) |
| 8:00 AM to 8:29 AM | 42 (26.3%) | 22 (26.8%) |
| 8:30 AM to 8:59 AM | 14 (8.7%) | 5 (6.1%) |
| 9:00 AM to 9:59 AM | 17 (10.6%) | 9 (11.0%) |
| 10:00 AM to 10:59 AM | 5 (3.1%) | 10 (12.2%) |
| 11:00 AM to 11:59 AM | 2 (1.3%) | 0 (0.0%) |
| 12:00 PM to 3:59 PM | 4 (2.5%) | 8 (9.8%) |
| 4:00 PM to 11:59 PM | 2 (1.3%) | 2 (2.4%) |
| Total | 160 (100.0%) | 82 (100.0%) |
Housing Occupancy in Sewickley Heights borough
Occupancy by Ownership in Sewickley Heights borough
Of the total 317 dwellings in Sewickley Heights borough, owner-occupied units account for 275 (86.8%), while renter-occupied units make up 42 (13.3%).
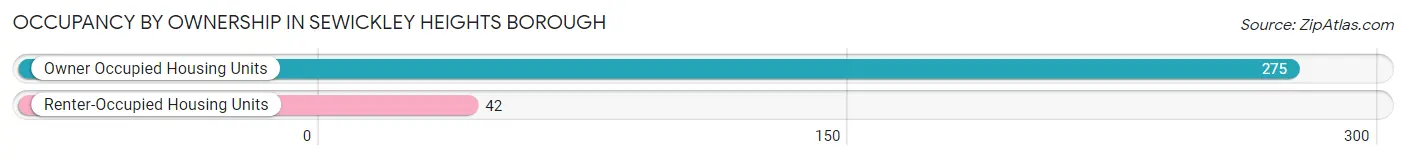
| Occupancy | # Housing Units | % Housing Units |
| Owner Occupied Housing Units | 275 | 86.8% |
| Renter-Occupied Housing Units | 42 | 13.3% |
| Total Occupied Housing Units | 317 | 100.0% |
Occupancy by Household Size in Sewickley Heights borough
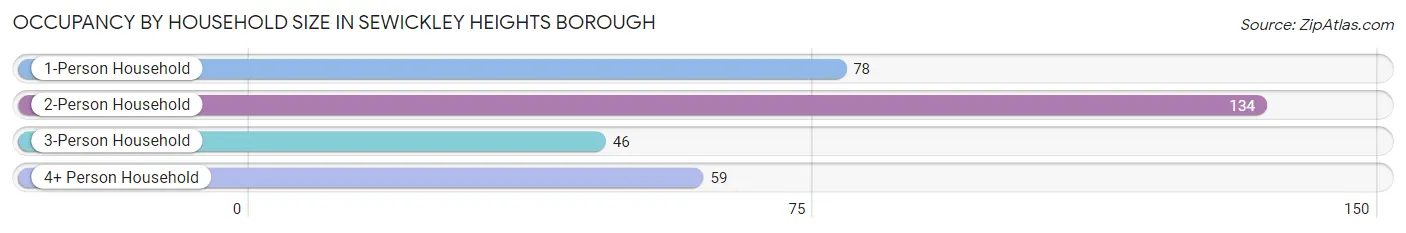
| Household Size | # Housing Units | % Housing Units |
| 1-Person Household | 78 | 24.6% |
| 2-Person Household | 134 | 42.3% |
| 3-Person Household | 46 | 14.5% |
| 4+ Person Household | 59 | 18.6% |
| Total Housing Units | 317 | 100.0% |
Occupancy by Ownership by Household Size in Sewickley Heights borough
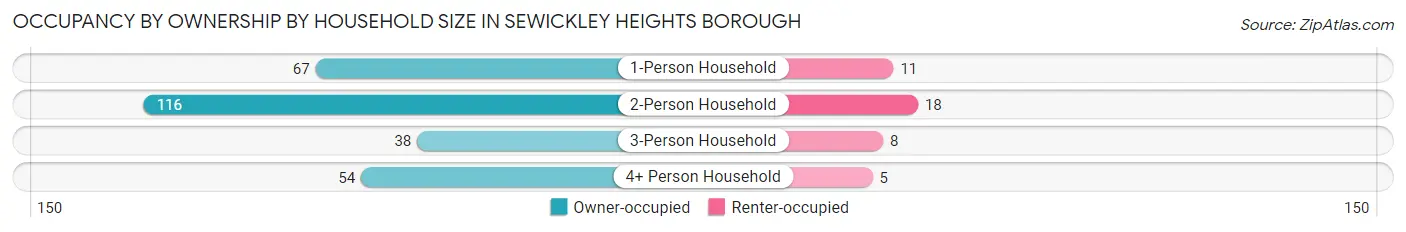
| Household Size | Owner-occupied | Renter-occupied |
| 1-Person Household | 67 (85.9%) | 11 (14.1%) |
| 2-Person Household | 116 (86.6%) | 18 (13.4%) |
| 3-Person Household | 38 (82.6%) | 8 (17.4%) |
| 4+ Person Household | 54 (91.5%) | 5 (8.5%) |
| Total Housing Units | 275 (86.8%) | 42 (13.3%) |
Occupancy by Educational Attainment in Sewickley Heights borough
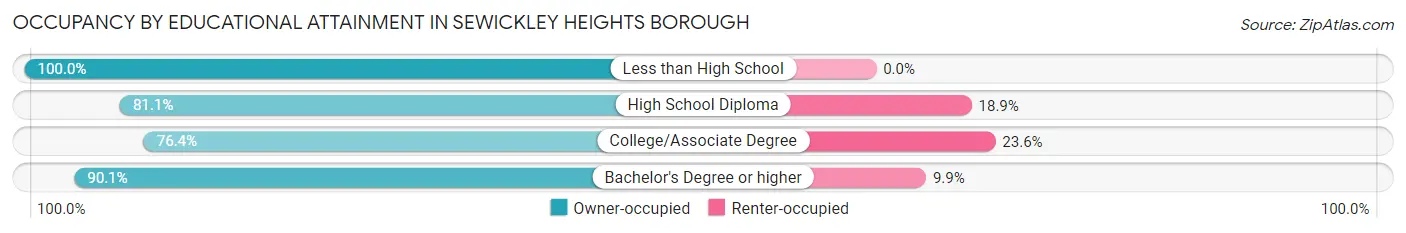
| Household Size | Owner-occupied | Renter-occupied |
| Less than High School | 2 (100.0%) | 0 (0.0%) |
| High School Diploma | 30 (81.1%) | 7 (18.9%) |
| College/Associate Degree | 42 (76.4%) | 13 (23.6%) |
| Bachelor's Degree or higher | 201 (90.1%) | 22 (9.9%) |
Occupancy by Age of Householder in Sewickley Heights borough
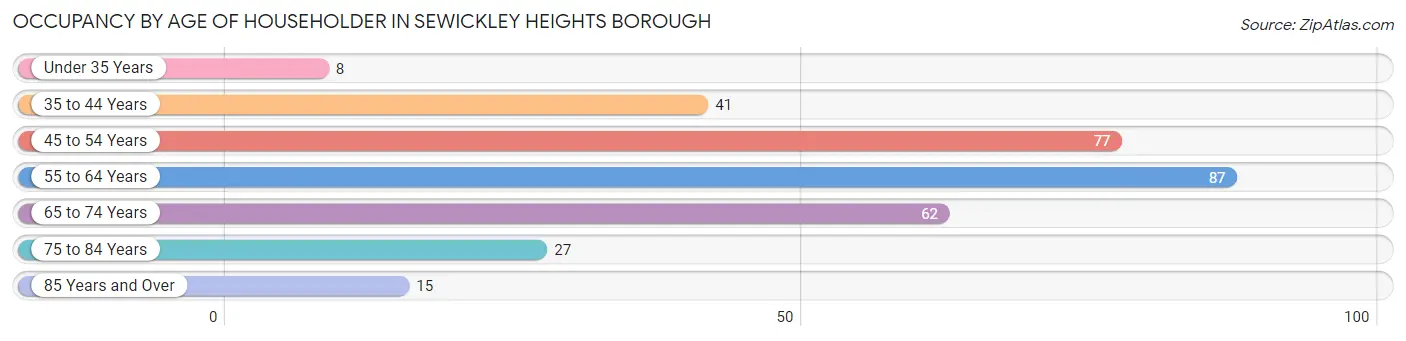
| Age Bracket | # Households | % Households |
| Under 35 Years | 8 | 2.5% |
| 35 to 44 Years | 41 | 12.9% |
| 45 to 54 Years | 77 | 24.3% |
| 55 to 64 Years | 87 | 27.4% |
| 65 to 74 Years | 62 | 19.6% |
| 75 to 84 Years | 27 | 8.5% |
| 85 Years and Over | 15 | 4.7% |
| Total | 317 | 100.0% |
Housing Finances in Sewickley Heights borough
Median Income by Occupancy in Sewickley Heights borough
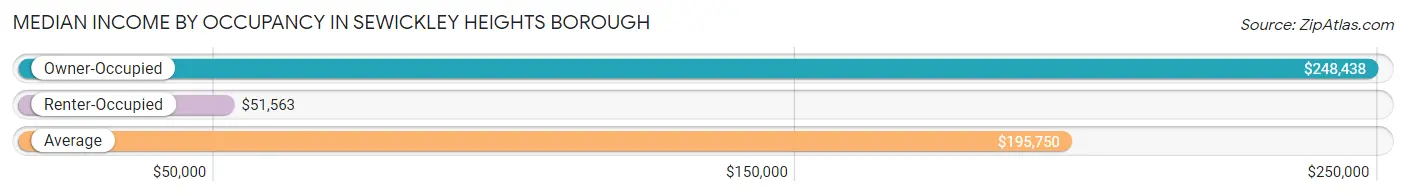
| Occupancy Type | # Households | Median Income |
| Owner-Occupied | 275 (86.8%) | $248,438 |
| Renter-Occupied | 42 (13.3%) | $51,563 |
| Average | 317 (100.0%) | $195,750 |
Occupancy by Householder Income Bracket in Sewickley Heights borough
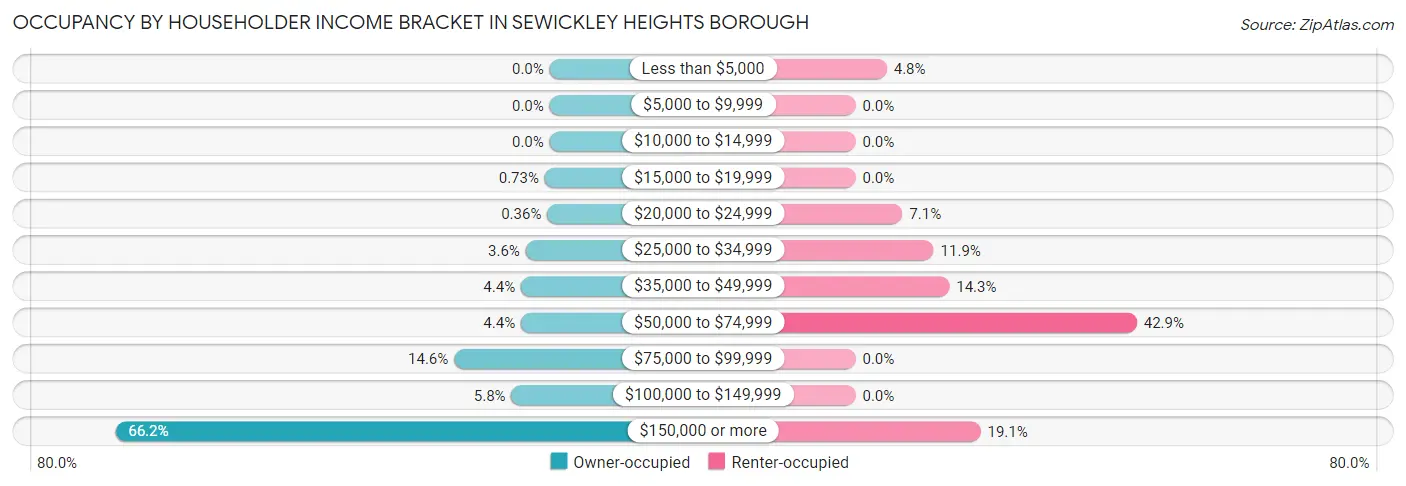
| Income Bracket | Owner-occupied | Renter-occupied |
| Less than $5,000 | 0 (0.0%) | 2 (4.8%) |
| $5,000 to $9,999 | 0 (0.0%) | 0 (0.0%) |
| $10,000 to $14,999 | 0 (0.0%) | 0 (0.0%) |
| $15,000 to $19,999 | 2 (0.7%) | 0 (0.0%) |
| $20,000 to $24,999 | 1 (0.4%) | 3 (7.1%) |
| $25,000 to $34,999 | 10 (3.6%) | 5 (11.9%) |
| $35,000 to $49,999 | 12 (4.4%) | 6 (14.3%) |
| $50,000 to $74,999 | 12 (4.4%) | 18 (42.9%) |
| $75,000 to $99,999 | 40 (14.5%) | 0 (0.0%) |
| $100,000 to $149,999 | 16 (5.8%) | 0 (0.0%) |
| $150,000 or more | 182 (66.2%) | 8 (19.1%) |
| Total | 275 (100.0%) | 42 (100.0%) |
Monthly Housing Cost Tiers in Sewickley Heights borough
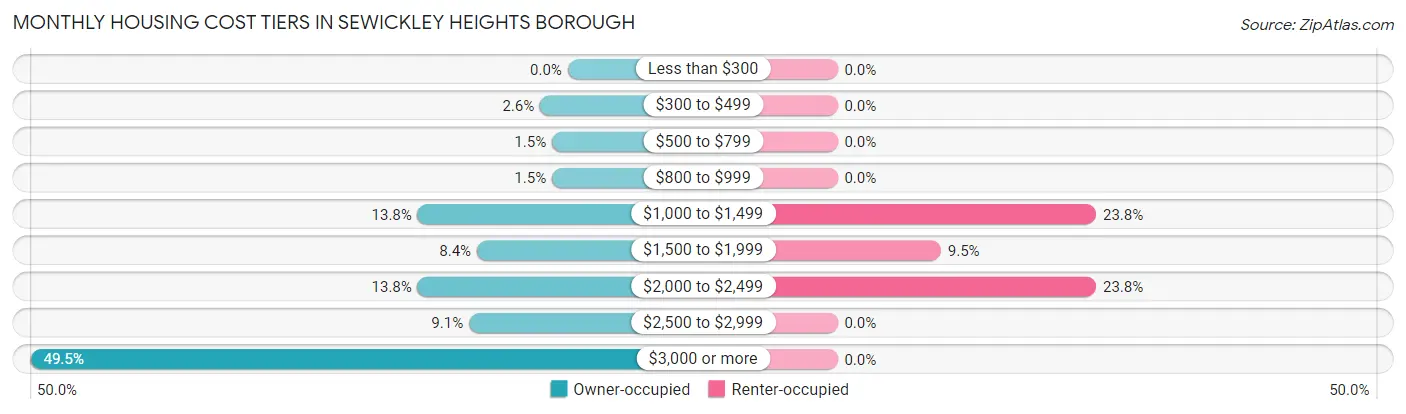
| Monthly Cost | Owner-occupied | Renter-occupied |
| Less than $300 | 0 (0.0%) | 0 (0.0%) |
| $300 to $499 | 7 (2.5%) | 0 (0.0%) |
| $500 to $799 | 4 (1.5%) | 0 (0.0%) |
| $800 to $999 | 4 (1.5%) | 0 (0.0%) |
| $1,000 to $1,499 | 38 (13.8%) | 10 (23.8%) |
| $1,500 to $1,999 | 23 (8.4%) | 4 (9.5%) |
| $2,000 to $2,499 | 38 (13.8%) | 10 (23.8%) |
| $2,500 to $2,999 | 25 (9.1%) | 0 (0.0%) |
| $3,000 or more | 136 (49.4%) | 0 (0.0%) |
| Total | 275 (100.0%) | 42 (100.0%) |
Physical Housing Characteristics in Sewickley Heights borough
Housing Structures in Sewickley Heights borough
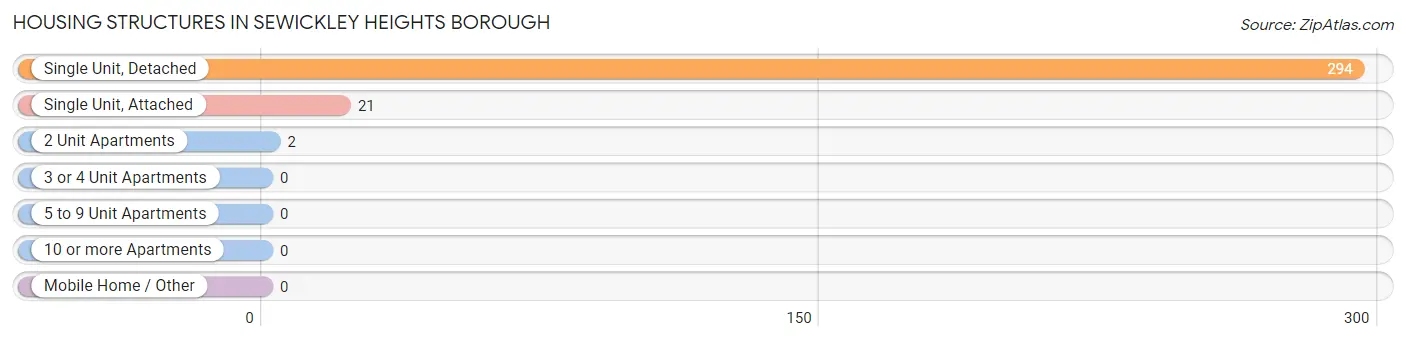
| Structure Type | # Housing Units | % Housing Units |
| Single Unit, Detached | 294 | 92.7% |
| Single Unit, Attached | 21 | 6.6% |
| 2 Unit Apartments | 2 | 0.6% |
| 3 or 4 Unit Apartments | 0 | 0.0% |
| 5 to 9 Unit Apartments | 0 | 0.0% |
| 10 or more Apartments | 0 | 0.0% |
| Mobile Home / Other | 0 | 0.0% |
| Total | 317 | 100.0% |
Housing Structures by Occupancy in Sewickley Heights borough
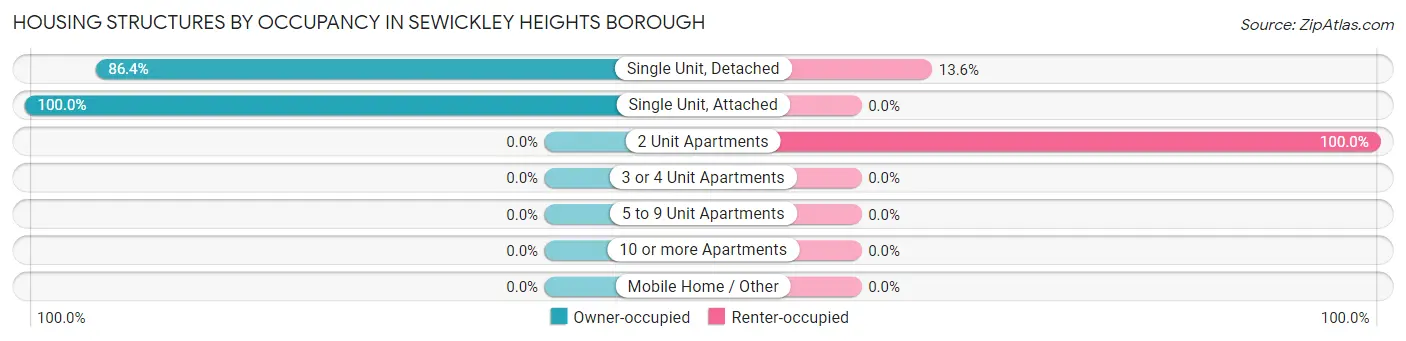
| Structure Type | Owner-occupied | Renter-occupied |
| Single Unit, Detached | 254 (86.4%) | 40 (13.6%) |
| Single Unit, Attached | 21 (100.0%) | 0 (0.0%) |
| 2 Unit Apartments | 0 (0.0%) | 2 (100.0%) |
| 3 or 4 Unit Apartments | 0 (0.0%) | 0 (0.0%) |
| 5 to 9 Unit Apartments | 0 (0.0%) | 0 (0.0%) |
| 10 or more Apartments | 0 (0.0%) | 0 (0.0%) |
| Mobile Home / Other | 0 (0.0%) | 0 (0.0%) |
| Total | 275 (86.8%) | 42 (13.3%) |
Housing Structures by Number of Rooms in Sewickley Heights borough
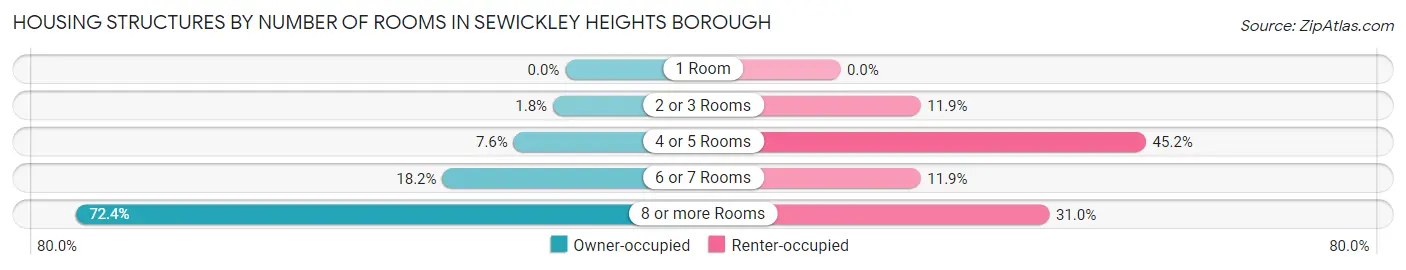
| Number of Rooms | Owner-occupied | Renter-occupied |
| 1 Room | 0 (0.0%) | 0 (0.0%) |
| 2 or 3 Rooms | 5 (1.8%) | 5 (11.9%) |
| 4 or 5 Rooms | 21 (7.6%) | 19 (45.2%) |
| 6 or 7 Rooms | 50 (18.2%) | 5 (11.9%) |
| 8 or more Rooms | 199 (72.4%) | 13 (30.9%) |
| Total | 275 (100.0%) | 42 (100.0%) |
Housing Structure by Heating Type in Sewickley Heights borough
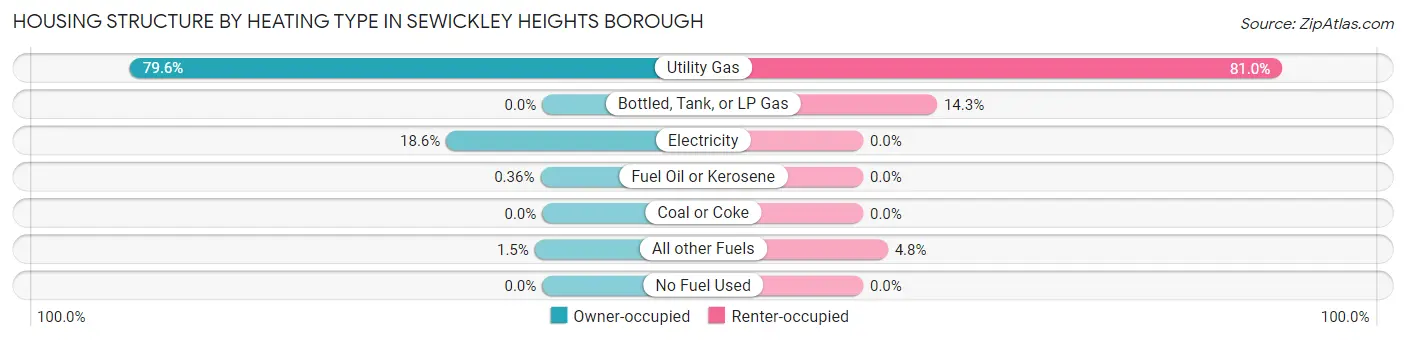
| Heating Type | Owner-occupied | Renter-occupied |
| Utility Gas | 219 (79.6%) | 34 (80.9%) |
| Bottled, Tank, or LP Gas | 0 (0.0%) | 6 (14.3%) |
| Electricity | 51 (18.5%) | 0 (0.0%) |
| Fuel Oil or Kerosene | 1 (0.4%) | 0 (0.0%) |
| Coal or Coke | 0 (0.0%) | 0 (0.0%) |
| All other Fuels | 4 (1.5%) | 2 (4.8%) |
| No Fuel Used | 0 (0.0%) | 0 (0.0%) |
| Total | 275 (100.0%) | 42 (100.0%) |
Household Vehicle Usage in Sewickley Heights borough
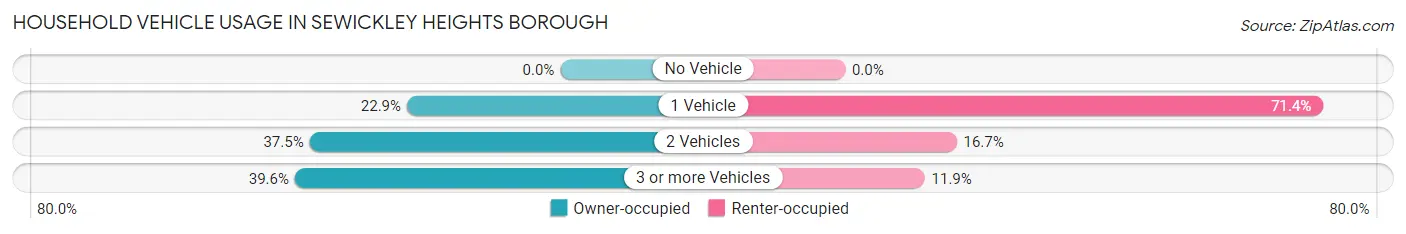
| Vehicles per Household | Owner-occupied | Renter-occupied |
| No Vehicle | 0 (0.0%) | 0 (0.0%) |
| 1 Vehicle | 63 (22.9%) | 30 (71.4%) |
| 2 Vehicles | 103 (37.4%) | 7 (16.7%) |
| 3 or more Vehicles | 109 (39.6%) | 5 (11.9%) |
| Total | 275 (100.0%) | 42 (100.0%) |
Real Estate & Mortgages in Sewickley Heights borough
Real Estate and Mortgage Overview in Sewickley Heights borough
| Characteristic | Without Mortgage | With Mortgage |
| Housing Units | 128 | 147 |
| Median Property Value | $1,000,000 | $1,032,100 |
| Median Household Income | $189,688 | $110 |
| Monthly Housing Costs | $1,501 | $93 |
| Real Estate Taxes | $10,001 | $0 |
Property Value by Mortgage Status in Sewickley Heights borough
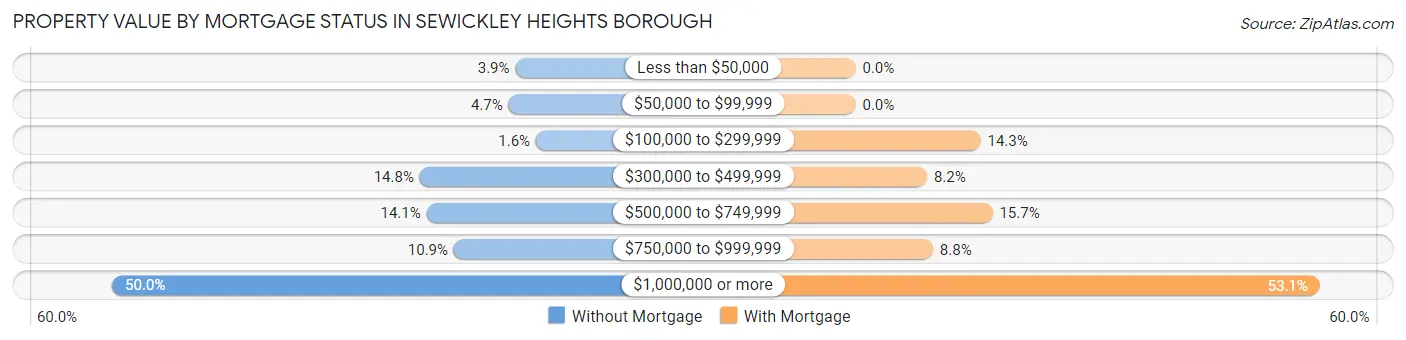
| Property Value | Without Mortgage | With Mortgage |
| Less than $50,000 | 5 (3.9%) | 0 (0.0%) |
| $50,000 to $99,999 | 6 (4.7%) | 0 (0.0%) |
| $100,000 to $299,999 | 2 (1.6%) | 21 (14.3%) |
| $300,000 to $499,999 | 19 (14.8%) | 12 (8.2%) |
| $500,000 to $749,999 | 18 (14.1%) | 23 (15.7%) |
| $750,000 to $999,999 | 14 (10.9%) | 13 (8.8%) |
| $1,000,000 or more | 64 (50.0%) | 78 (53.1%) |
| Total | 128 (100.0%) | 147 (100.0%) |
Household Income by Mortgage Status in Sewickley Heights borough
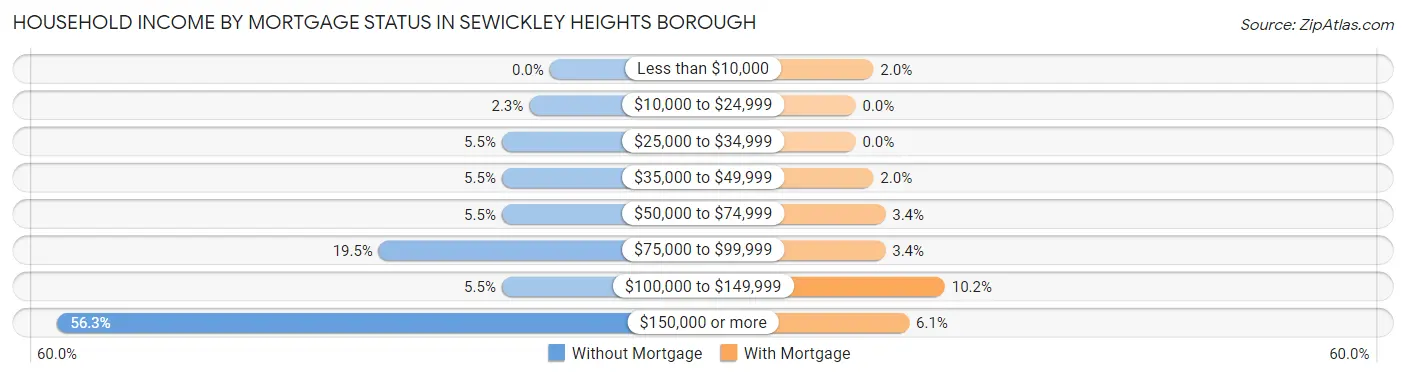
| Household Income | Without Mortgage | With Mortgage |
| Less than $10,000 | 0 (0.0%) | 3 (2.0%) |
| $10,000 to $24,999 | 3 (2.3%) | 0 (0.0%) |
| $25,000 to $34,999 | 7 (5.5%) | 0 (0.0%) |
| $35,000 to $49,999 | 7 (5.5%) | 3 (2.0%) |
| $50,000 to $74,999 | 7 (5.5%) | 5 (3.4%) |
| $75,000 to $99,999 | 25 (19.5%) | 5 (3.4%) |
| $100,000 to $149,999 | 7 (5.5%) | 15 (10.2%) |
| $150,000 or more | 72 (56.2%) | 9 (6.1%) |
| Total | 128 (100.0%) | 147 (100.0%) |
Property Value to Household Income Ratio in Sewickley Heights borough
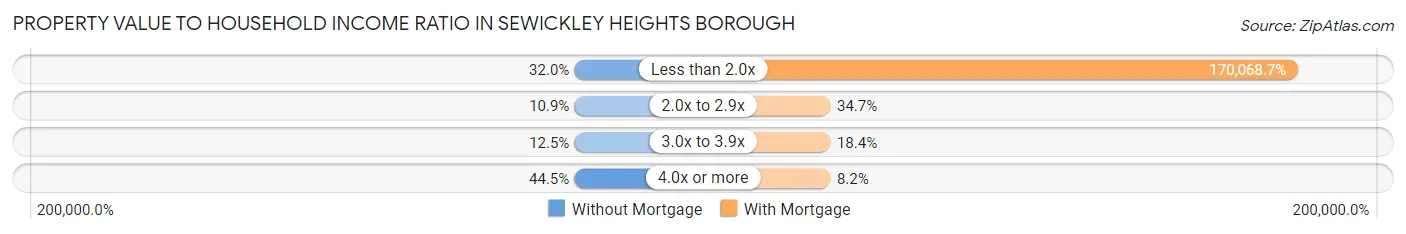
| Value-to-Income Ratio | Without Mortgage | With Mortgage |
| Less than 2.0x | 41 (32.0%) | 250,001 (170,068.7%) |
| 2.0x to 2.9x | 14 (10.9%) | 51 (34.7%) |
| 3.0x to 3.9x | 16 (12.5%) | 27 (18.4%) |
| 4.0x or more | 57 (44.5%) | 12 (8.2%) |
| Total | 128 (100.0%) | 147 (100.0%) |
Real Estate Taxes by Mortgage Status in Sewickley Heights borough
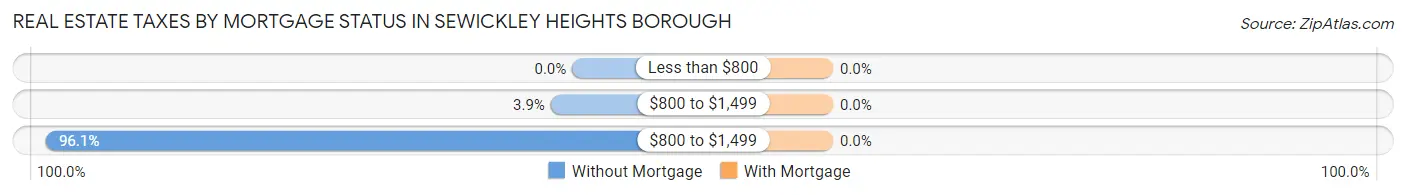
| Property Taxes | Without Mortgage | With Mortgage |
| Less than $800 | 0 (0.0%) | 0 (0.0%) |
| $800 to $1,499 | 5 (3.9%) | 0 (0.0%) |
| $800 to $1,499 | 123 (96.1%) | 0 (0.0%) |
| Total | 128 (100.0%) | 147 (100.0%) |
Health & Disability in Sewickley Heights borough
Health Insurance Coverage by Age in Sewickley Heights borough
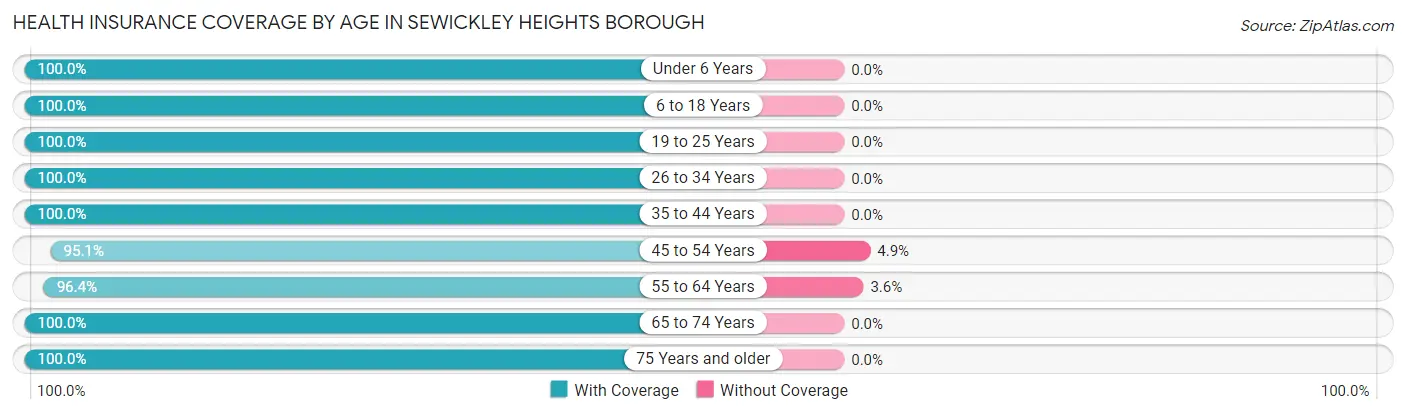
| Age Bracket | With Coverage | Without Coverage |
| Under 6 Years | 35 (100.0%) | 0 (0.0%) |
| 6 to 18 Years | 161 (100.0%) | 0 (0.0%) |
| 19 to 25 Years | 36 (100.0%) | 0 (0.0%) |
| 26 to 34 Years | 12 (100.0%) | 0 (0.0%) |
| 35 to 44 Years | 69 (100.0%) | 0 (0.0%) |
| 45 to 54 Years | 137 (95.1%) | 7 (4.9%) |
| 55 to 64 Years | 135 (96.4%) | 5 (3.6%) |
| 65 to 74 Years | 96 (100.0%) | 0 (0.0%) |
| 75 Years and older | 69 (100.0%) | 0 (0.0%) |
| Total | 750 (98.4%) | 12 (1.6%) |
Health Insurance Coverage by Citizenship Status in Sewickley Heights borough
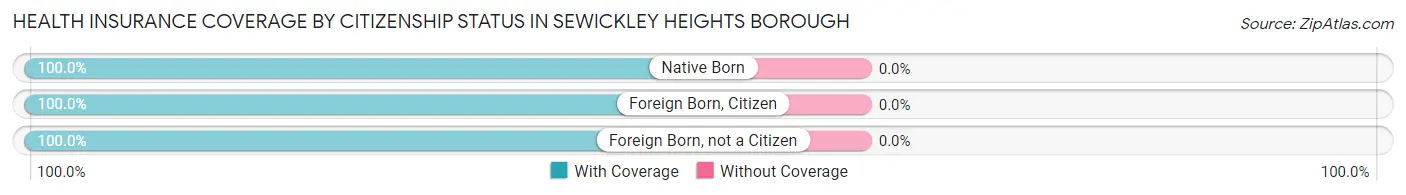
| Citizenship Status | With Coverage | Without Coverage |
| Native Born | 35 (100.0%) | 0 (0.0%) |
| Foreign Born, Citizen | 161 (100.0%) | 0 (0.0%) |
| Foreign Born, not a Citizen | 36 (100.0%) | 0 (0.0%) |
Health Insurance Coverage by Household Income in Sewickley Heights borough
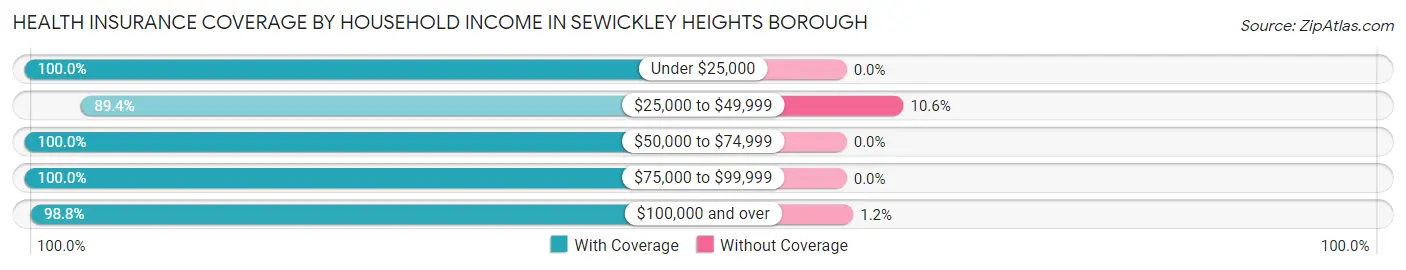
| Household Income | With Coverage | Without Coverage |
| Under $25,000 | 15 (100.0%) | 0 (0.0%) |
| $25,000 to $49,999 | 42 (89.4%) | 5 (10.6%) |
| $50,000 to $74,999 | 66 (100.0%) | 0 (0.0%) |
| $75,000 to $99,999 | 62 (100.0%) | 0 (0.0%) |
| $100,000 and over | 565 (98.8%) | 7 (1.2%) |
Public vs Private Health Insurance Coverage by Age in Sewickley Heights borough
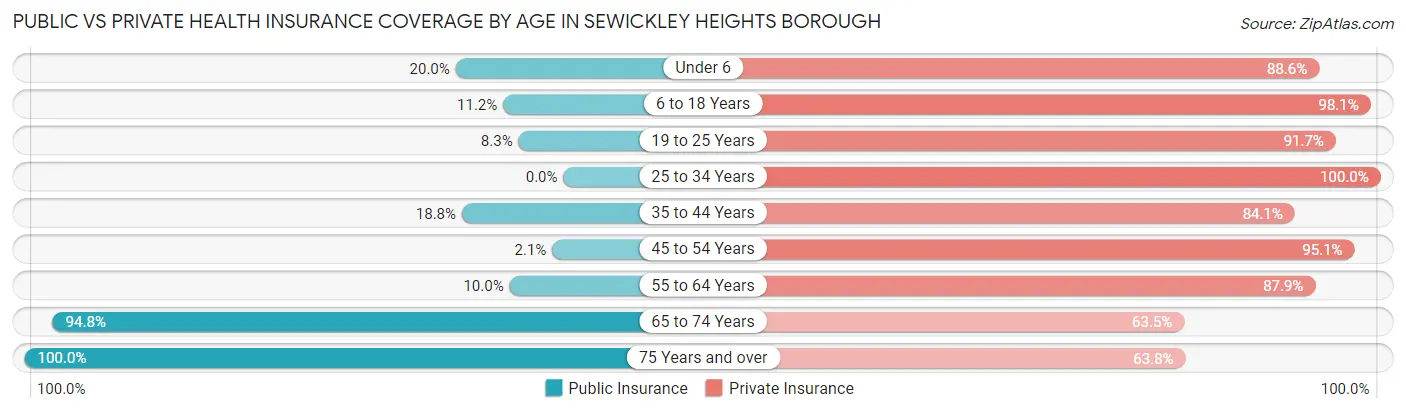
| Age Bracket | Public Insurance | Private Insurance |
| Under 6 | 7 (20.0%) | 31 (88.6%) |
| 6 to 18 Years | 18 (11.2%) | 158 (98.1%) |
| 19 to 25 Years | 3 (8.3%) | 33 (91.7%) |
| 25 to 34 Years | 0 (0.0%) | 12 (100.0%) |
| 35 to 44 Years | 13 (18.8%) | 58 (84.1%) |
| 45 to 54 Years | 3 (2.1%) | 137 (95.1%) |
| 55 to 64 Years | 14 (10.0%) | 123 (87.9%) |
| 65 to 74 Years | 91 (94.8%) | 61 (63.5%) |
| 75 Years and over | 69 (100.0%) | 44 (63.8%) |
| Total | 218 (28.6%) | 657 (86.2%) |
Disability Status by Sex by Age in Sewickley Heights borough
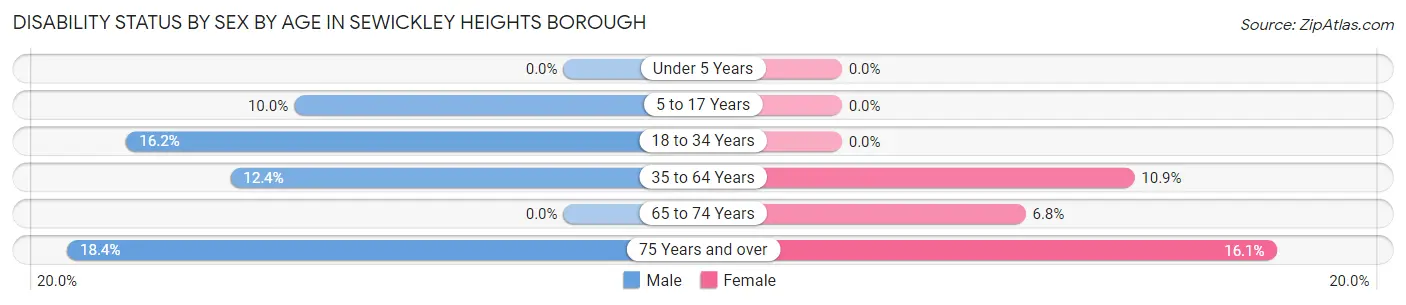
| Age Bracket | Male | Female |
| Under 5 Years | 0 (0.0%) | 0 (0.0%) |
| 5 to 17 Years | 8 (10.0%) | 0 (0.0%) |
| 18 to 34 Years | 6 (16.2%) | 0 (0.0%) |
| 35 to 64 Years | 22 (12.4%) | 19 (10.9%) |
| 65 to 74 Years | 0 (0.0%) | 3 (6.8%) |
| 75 Years and over | 7 (18.4%) | 5 (16.1%) |
Disability Class by Sex by Age in Sewickley Heights borough
Disability Class: Hearing Difficulty
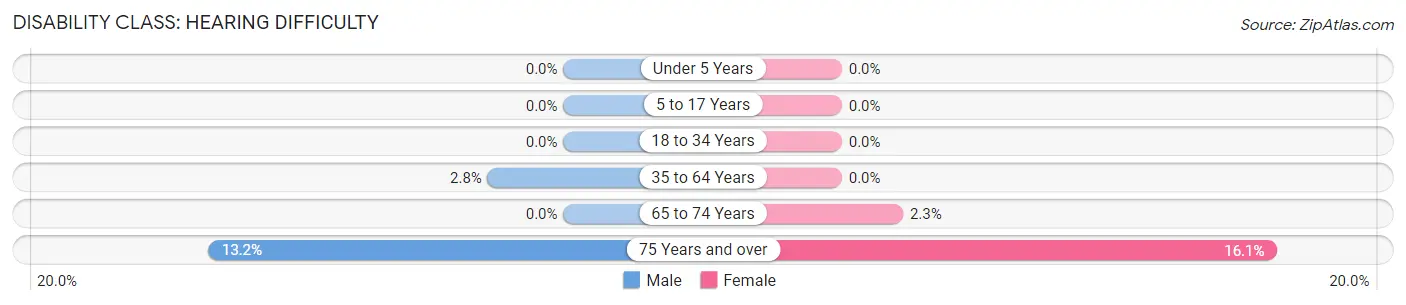
| Age Bracket | Male | Female |
| Under 5 Years | 0 (0.0%) | 0 (0.0%) |
| 5 to 17 Years | 0 (0.0%) | 0 (0.0%) |
| 18 to 34 Years | 0 (0.0%) | 0 (0.0%) |
| 35 to 64 Years | 5 (2.8%) | 0 (0.0%) |
| 65 to 74 Years | 0 (0.0%) | 1 (2.3%) |
| 75 Years and over | 5 (13.2%) | 5 (16.1%) |
Disability Class: Vision Difficulty
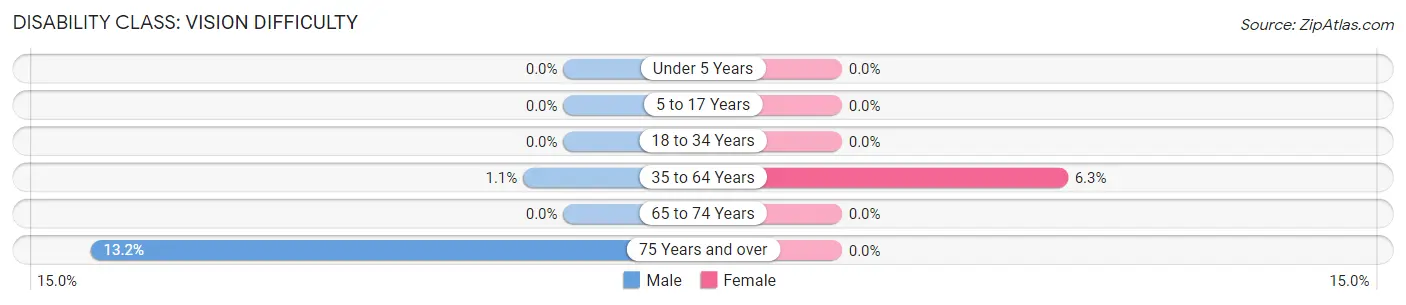
| Age Bracket | Male | Female |
| Under 5 Years | 0 (0.0%) | 0 (0.0%) |
| 5 to 17 Years | 0 (0.0%) | 0 (0.0%) |
| 18 to 34 Years | 0 (0.0%) | 0 (0.0%) |
| 35 to 64 Years | 2 (1.1%) | 11 (6.3%) |
| 65 to 74 Years | 0 (0.0%) | 0 (0.0%) |
| 75 Years and over | 5 (13.2%) | 0 (0.0%) |
Disability Class: Cognitive Difficulty
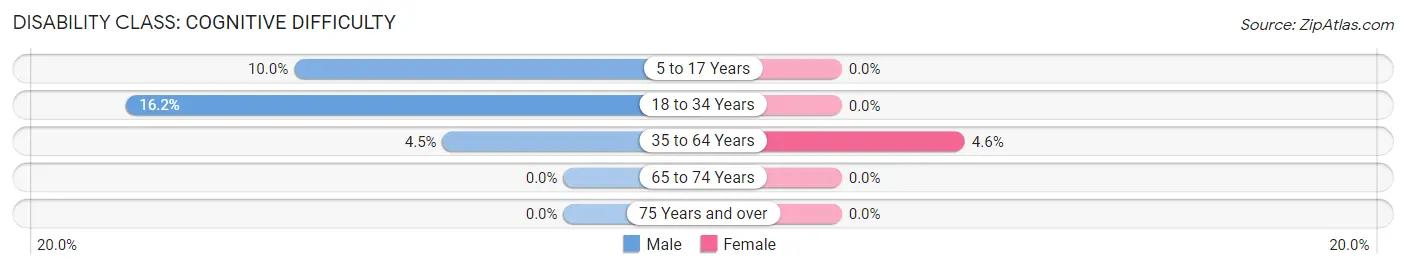
| Age Bracket | Male | Female |
| 5 to 17 Years | 8 (10.0%) | 0 (0.0%) |
| 18 to 34 Years | 6 (16.2%) | 0 (0.0%) |
| 35 to 64 Years | 8 (4.5%) | 8 (4.6%) |
| 65 to 74 Years | 0 (0.0%) | 0 (0.0%) |
| 75 Years and over | 0 (0.0%) | 0 (0.0%) |
Disability Class: Ambulatory Difficulty
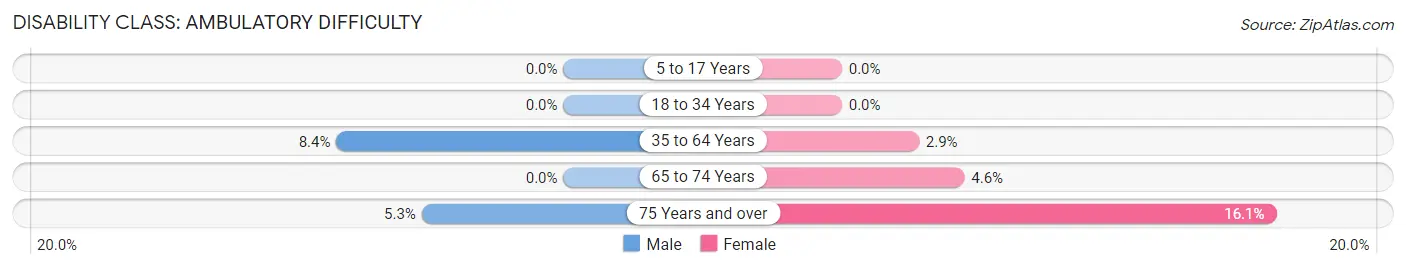
| Age Bracket | Male | Female |
| 5 to 17 Years | 0 (0.0%) | 0 (0.0%) |
| 18 to 34 Years | 0 (0.0%) | 0 (0.0%) |
| 35 to 64 Years | 15 (8.4%) | 5 (2.9%) |
| 65 to 74 Years | 0 (0.0%) | 2 (4.5%) |
| 75 Years and over | 2 (5.3%) | 5 (16.1%) |
Disability Class: Self-Care Difficulty
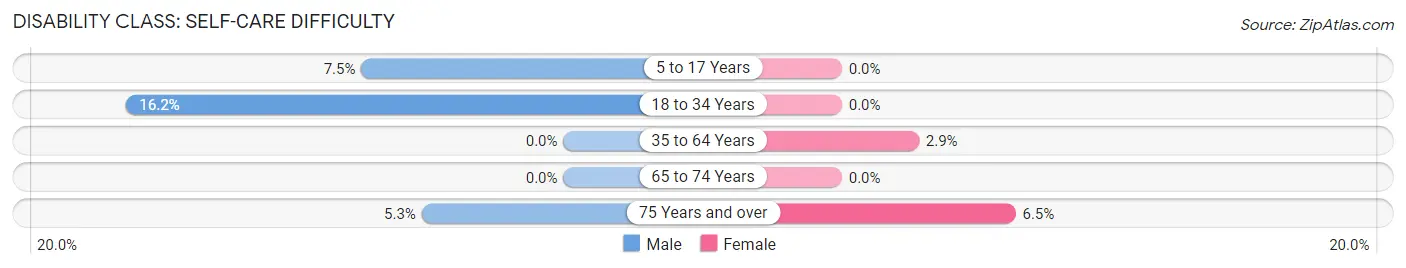
| Age Bracket | Male | Female |
| 5 to 17 Years | 6 (7.5%) | 0 (0.0%) |
| 18 to 34 Years | 6 (16.2%) | 0 (0.0%) |
| 35 to 64 Years | 0 (0.0%) | 5 (2.9%) |
| 65 to 74 Years | 0 (0.0%) | 0 (0.0%) |
| 75 Years and over | 2 (5.3%) | 2 (6.5%) |
Technology Access in Sewickley Heights borough
Computing Device Access in Sewickley Heights borough
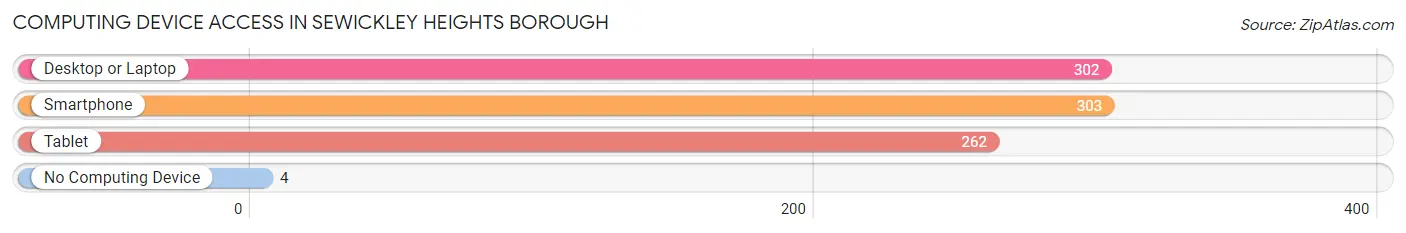
| Device Type | # Households | % Households |
| Desktop or Laptop | 302 | 95.3% |
| Smartphone | 303 | 95.6% |
| Tablet | 262 | 82.7% |
| No Computing Device | 4 | 1.3% |
| Total | 317 | 100.0% |
Internet Access in Sewickley Heights borough
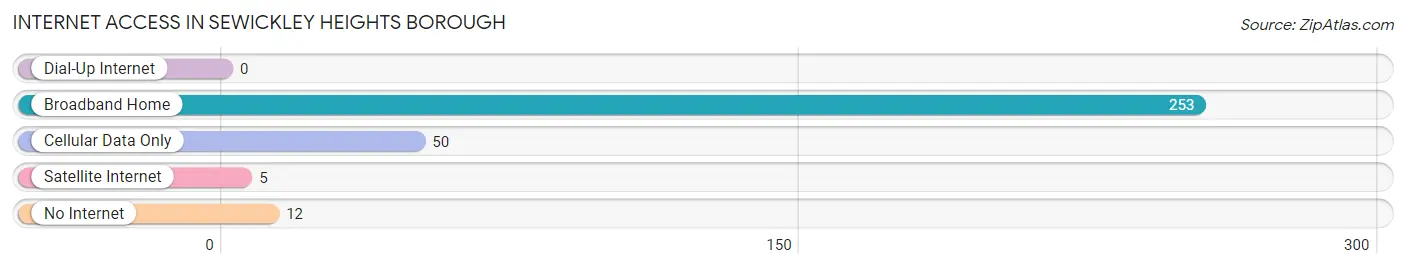
| Internet Type | # Households | % Households |
| Dial-Up Internet | 0 | 0.0% |
| Broadband Home | 253 | 79.8% |
| Cellular Data Only | 50 | 15.8% |
| Satellite Internet | 5 | 1.6% |
| No Internet | 12 | 3.8% |
| Total | 317 | 100.0% |
Sewickley Heights borough Summary
Sewickley Heights Borough is a small borough located in Allegheny County, Pennsylvania. It is situated approximately 15 miles northwest of Pittsburgh and is part of the Pittsburgh Metropolitan Statistical Area. The borough is bordered by the boroughs of Sewickley and Edgeworth, and the townships of Aleppo, Bell Acres, and Leet. As of the 2010 census, the population of Sewickley Heights Borough was 1,827.
History
Sewickley Heights Borough was founded in 1902 by a group of wealthy Pittsburgh businessmen who wanted to create a rural retreat from the hustle and bustle of the city. The founders purchased a large tract of land and divided it into lots, which were then sold to the public. The borough was incorporated in 1903 and was named after the nearby Sewickley Creek.
The borough was originally a summer resort community, with many of the original homes being built as vacation homes. As the years passed, more and more people began to move to the borough permanently, and the population began to grow. By the 1950s, the borough had become a full-time residential community.
Geography
Sewickley Heights Borough is located at 40°31'17" North, 80°7'17" West (40.5214, -80.1214). According to the United States Census Bureau, the borough has a total area of 1.2 square miles, all of which is land.
The borough is located in the Allegheny Plateau region of Pennsylvania. The terrain is mostly hilly, with some flat areas. The borough is located in the Sewickley Creek watershed.
Economy
The economy of Sewickley Heights Borough is largely based on the service industry. The borough is home to a variety of businesses, including restaurants, retail stores, and professional services. The borough is also home to a number of small businesses, such as landscaping companies, home improvement contractors, and auto repair shops.
Demographics
As of the 2010 census, there were 1,827 people, 745 households, and 545 families residing in the borough. The population density was 1,521.7 people per square mile. The racial makeup of the borough was 94.2% White, 2.2% African American, 0.2% Native American, 1.7% Asian, 0.1% Pacific Islander, 0.7% from other races, and 1.0% from two or more races. Hispanic or Latino of any race were 1.7% of the population.
The median age in the borough was 45.2 years. 22.2% of residents were under the age of 18; 5.3% were between the ages of 18 and 24; 20.3% were from 25 to 44; 33.2% were from 45 to 64; and 19.0% were 65 years of age or older. The gender makeup of the borough was 48.2% male and 51.8% female.
The median income for a household in the borough was $107,917, and the median income for a family was $125,917. The per capita income for the borough was $63,917. About 1.7% of families and 2.3% of the population were below the poverty line, including 2.3% of those under age 18 and 0.0% of those age 65 or over.
Common Questions
What is Per Capita Income in Sewickley Heights borough?
Per Capita income in Sewickley Heights borough is $157,017.
What is the Median Family Income in Sewickley Heights borough?
Median Family Income in Sewickley Heights borough is $250,001.
What is the Median Household income in Sewickley Heights borough?
Median Household Income in Sewickley Heights borough is $195,750.
What is Income or Wage Gap in Sewickley Heights borough?
Income or Wage Gap in Sewickley Heights borough is 75.7%.
Women in Sewickley Heights borough earn 24.3 cents for every dollar earned by a man.
What is Inequality or Gini Index in Sewickley Heights borough?
Inequality or Gini Index in Sewickley Heights borough is 0.58.
What is the Total Population of Sewickley Heights borough?
Total Population of Sewickley Heights borough is 762.
What is the Total Male Population of Sewickley Heights borough?
Total Male Population of Sewickley Heights borough is 396.
What is the Total Female Population of Sewickley Heights borough?
Total Female Population of Sewickley Heights borough is 366.
What is the Ratio of Males per 100 Females in Sewickley Heights borough?
There are 108.20 Males per 100 Females in Sewickley Heights borough.
What is the Ratio of Females per 100 Males in Sewickley Heights borough?
There are 92.42 Females per 100 Males in Sewickley Heights borough.
What is the Median Population Age in Sewickley Heights borough?
Median Population Age in Sewickley Heights borough is 50.8 Years.
What is the Average Family Size in Sewickley Heights borough
Average Family Size in Sewickley Heights borough is 2.9 People.
What is the Average Household Size in Sewickley Heights borough
Average Household Size in Sewickley Heights borough is 2.4 People.
How Large is the Labor Force in Sewickley Heights borough?
There are 352 People in the Labor Forcein in Sewickley Heights borough.
What is the Percentage of People in the Labor Force in Sewickley Heights borough?
57.1% of People are in the Labor Force in Sewickley Heights borough.
What is the Unemployment Rate in Sewickley Heights borough?
Unemployment Rate in Sewickley Heights borough is 2.6%.