Zip Codes with the Highest Percentage of Families with Income Above $200,000 in Pittsburgh, PA
RELATED REPORTS & OPTIONS
Family Income | $200k+
Pittsburgh
Compare Zip Codes
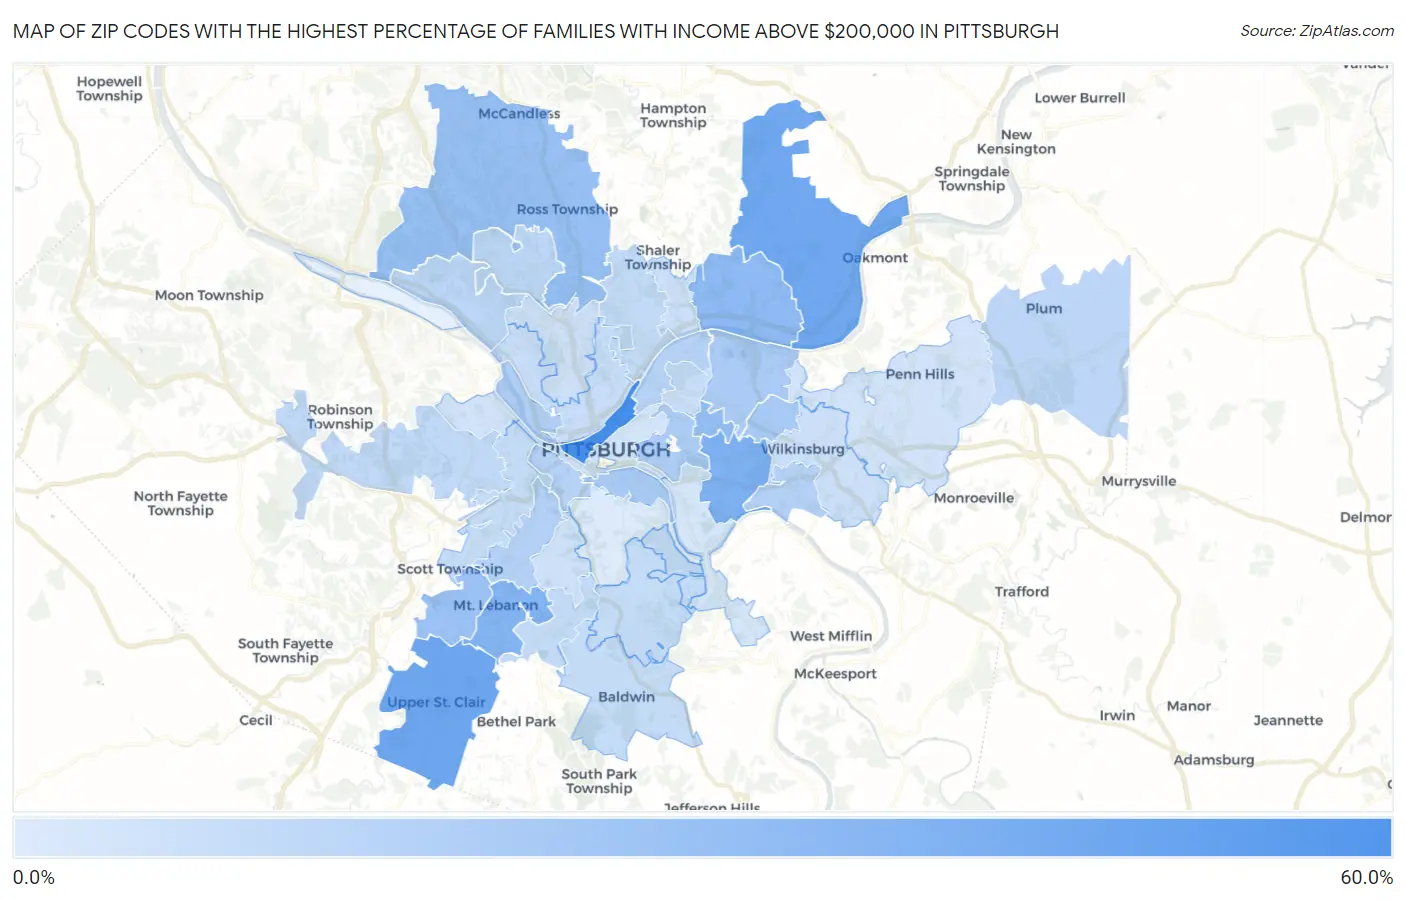
Map of Zip Codes with the Highest Percentage of Families with Income Above $200,000 in Pittsburgh
2.4%
59.0%
Zip Codes with the Highest Percentage of Families with Income Above $200,000 in Pittsburgh, PA
| Zip Code | Families with Income > $200k | vs State | vs National | |
| 1. | 15222 | 59.0% | 14.0%(+45.0)#23 | 14.8%(+44.2)#323 |
| 2. | 15241 | 41.9% | 14.0%(+27.9)#62 | 14.8%(+27.1)#1,148 |
| 3. | 15238 | 41.2% | 14.0%(+27.2)#65 | 14.8%(+26.4)#1,206 |
| 4. | 15217 | 35.6% | 14.0%(+21.6)#85 | 14.8%(+20.8)#1,770 |
| 5. | 15228 | 33.2% | 14.0%(+19.2)#102 | 14.8%(+18.4)#2,083 |
| 6. | 15215 | 28.6% | 14.0%(+14.6)#129 | 14.8%(+13.8)#2,755 |
| 7. | 15232 | 27.5% | 14.0%(+13.5)#140 | 14.8%(+12.7)#2,955 |
| 8. | 15237 | 25.4% | 14.0%(+11.4)#153 | 14.8%(+10.6)#3,360 |
| 9. | 15243 | 25.0% | 14.0%(+11.0)#156 | 14.8%(+10.2)#3,466 |
| 10. | 15203 | 20.0% | 14.0%(+6.00)#213 | 14.8%(+5.20)#4,819 |
| 11. | 15208 | 19.6% | 14.0%(+5.60)#222 | 14.8%(+4.80)#4,950 |
| 12. | 15206 | 19.0% | 14.0%(+5.00)#227 | 14.8%(+4.20)#5,141 |
| 13. | 15213 | 18.2% | 14.0%(+4.20)#239 | 14.8%(+3.40)#5,486 |
| 14. | 15233 | 16.1% | 14.0%(+2.10)#273 | 14.8%(+1.30)#6,419 |
| 15. | 15216 | 15.7% | 14.0%(+1.70)#285 | 14.8%(+0.900)#6,586 |
| 16. | 15218 | 15.6% | 14.0%(+1.60)#289 | 14.8%(+0.800)#6,640 |
| 17. | 15211 | 15.2% | 14.0%(+1.20)#304 | 14.8%(+0.400)#6,862 |
| 18. | 15201 | 15.1% | 14.0%(+1.10)#310 | 14.8%(+0.300)#6,929 |
| 19. | 15239 | 12.4% | 14.0%(-1.60)#409 | 14.8%(-2.40)#8,653 |
| 20. | 15202 | 12.4% | 14.0%(-1.60)#410 | 14.8%(-2.40)#8,655 |
| 21. | 15229 | 12.4% | 14.0%(-1.60)#411 | 14.8%(-2.40)#8,662 |
| 22. | 15205 | 11.3% | 14.0%(-2.70)#450 | 14.8%(-3.50)#9,538 |
| 23. | 15209 | 10.2% | 14.0%(-3.80)#507 | 14.8%(-4.60)#10,606 |
| 24. | 15234 | 10.1% | 14.0%(-3.90)#517 | 14.8%(-4.70)#10,706 |
| 25. | 15236 | 9.6% | 14.0%(-4.40)#551 | 14.8%(-5.20)#11,202 |
| 26. | 15220 | 9.6% | 14.0%(-4.40)#552 | 14.8%(-5.20)#11,220 |
| 27. | 15227 | 9.3% | 14.0%(-4.70)#564 | 14.8%(-5.50)#11,532 |
| 28. | 15224 | 8.6% | 14.0%(-5.40)#608 | 14.8%(-6.20)#12,417 |
| 29. | 15212 | 8.5% | 14.0%(-5.50)#616 | 14.8%(-6.30)#12,508 |
| 30. | 15221 | 7.6% | 14.0%(-6.40)#679 | 14.8%(-7.20)#13,725 |
| 31. | 15223 | 7.3% | 14.0%(-6.70)#695 | 14.8%(-7.50)#14,220 |
| 32. | 15226 | 6.9% | 14.0%(-7.10)#734 | 14.8%(-7.90)#14,891 |
| 33. | 15214 | 6.3% | 14.0%(-7.70)#783 | 14.8%(-8.50)#15,909 |
| 34. | 15235 | 5.9% | 14.0%(-8.10)#820 | 14.8%(-8.90)#16,615 |
| 35. | 15204 | 5.9% | 14.0%(-8.10)#825 | 14.8%(-8.90)#16,672 |
| 36. | 15219 | 5.4% | 14.0%(-8.60)#892 | 14.8%(-9.40)#17,620 |
| 37. | 15207 | 4.3% | 14.0%(-9.70)#1,016 | 14.8%(-10.5)#19,805 |
| 38. | 15210 | 2.4% | 14.0%(-11.6)#1,244 | 14.8%(-12.4)#23,700 |
1
Common Questions
What are the Top 10 Zip Codes with the Highest Percentage of Families with Income Above $200,000 in Pittsburgh, PA?
Top 10 Zip Codes with the Highest Percentage of Families with Income Above $200,000 in Pittsburgh, PA are:
What zip code has the Highest Percentage of Families with Income Above $200,000 in Pittsburgh, PA?
15222 has the Highest Percentage of Families with Income Above $200,000 in Pittsburgh, PA with 59.0%.
What is the Percentage of Families with Income Above $200,000 in Pittsburgh, PA?
Percentage of Families with Income Above $200,000 in Pittsburgh is 13.7%.
What is the Percentage of Families with Income Above $200,000 in Pennsylvania?
Percentage of Families with Income Above $200,000 in Pennsylvania is 14.0%.
What is the Percentage of Families with Income Above $200,000 in the United States?
Percentage of Families with Income Above $200,000 in the United States is 14.8%.