Schnecksville, PA Map & Demographics
Schnecksville Map
Schnecksville Overview
$62,757
PER CAPITA INCOME
$160,742
AVG FAMILY INCOME
$119,083
AVG HOUSEHOLD INCOME
27.5%
WAGE / INCOME GAP [ % ]
72.5¢/ $1
WAGE / INCOME GAP [ $ ]
0.44
INEQUALITY / GINI INDEX
3,893
TOTAL POPULATION
1,729
MALE POPULATION
2,164
FEMALE POPULATION
79.90
MALES / 100 FEMALES
125.16
FEMALES / 100 MALES
37.9
MEDIAN AGE
3.2
AVG FAMILY SIZE
2.7
AVG HOUSEHOLD SIZE
2,018
LABOR FORCE [ PEOPLE ]
69.9%
PERCENT IN LABOR FORCE
5.6%
UNEMPLOYMENT RATE
Schnecksville Zip Codes
Schnecksville Area Codes
Income in Schnecksville
Income Overview in Schnecksville
Per Capita Income in Schnecksville is $62,757, while median incomes of families and households are $160,742 and $119,083 respectively.
| Characteristic | Number | Measure |
| Per Capita Income | 3,893 | $62,757 |
| Median Family Income | 1,071 | $160,742 |
| Mean Family Income | 1,071 | $184,503 |
| Median Household Income | 1,451 | $119,083 |
| Mean Household Income | 1,451 | $155,772 |
| Income Deficit | 1,071 | $0 |
| Wage / Income Gap (%) | 3,893 | 27.54% |
| Wage / Income Gap ($) | 3,893 | 72.46¢ per $1 |
| Gini / Inequality Index | 3,893 | 0.44 |
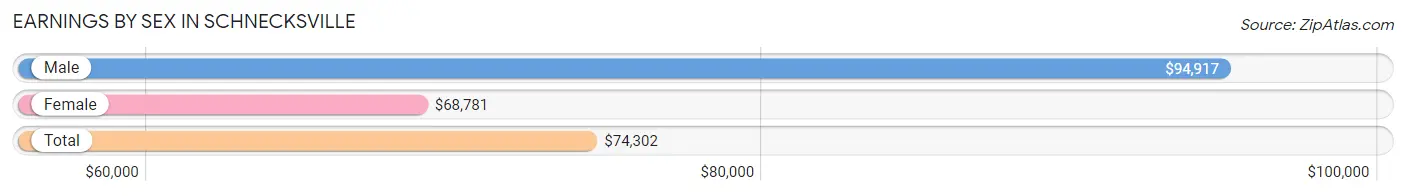
Earnings by Sex in Schnecksville
Average Earnings in Schnecksville are $74,302, $94,917 for men and $68,781 for women, a difference of 27.5%.
| Sex | Number | Average Earnings |
| Male | 1,009 (48.2%) | $94,917 |
| Female | 1,085 (51.8%) | $68,781 |
| Total | 2,094 (100.0%) | $74,302 |
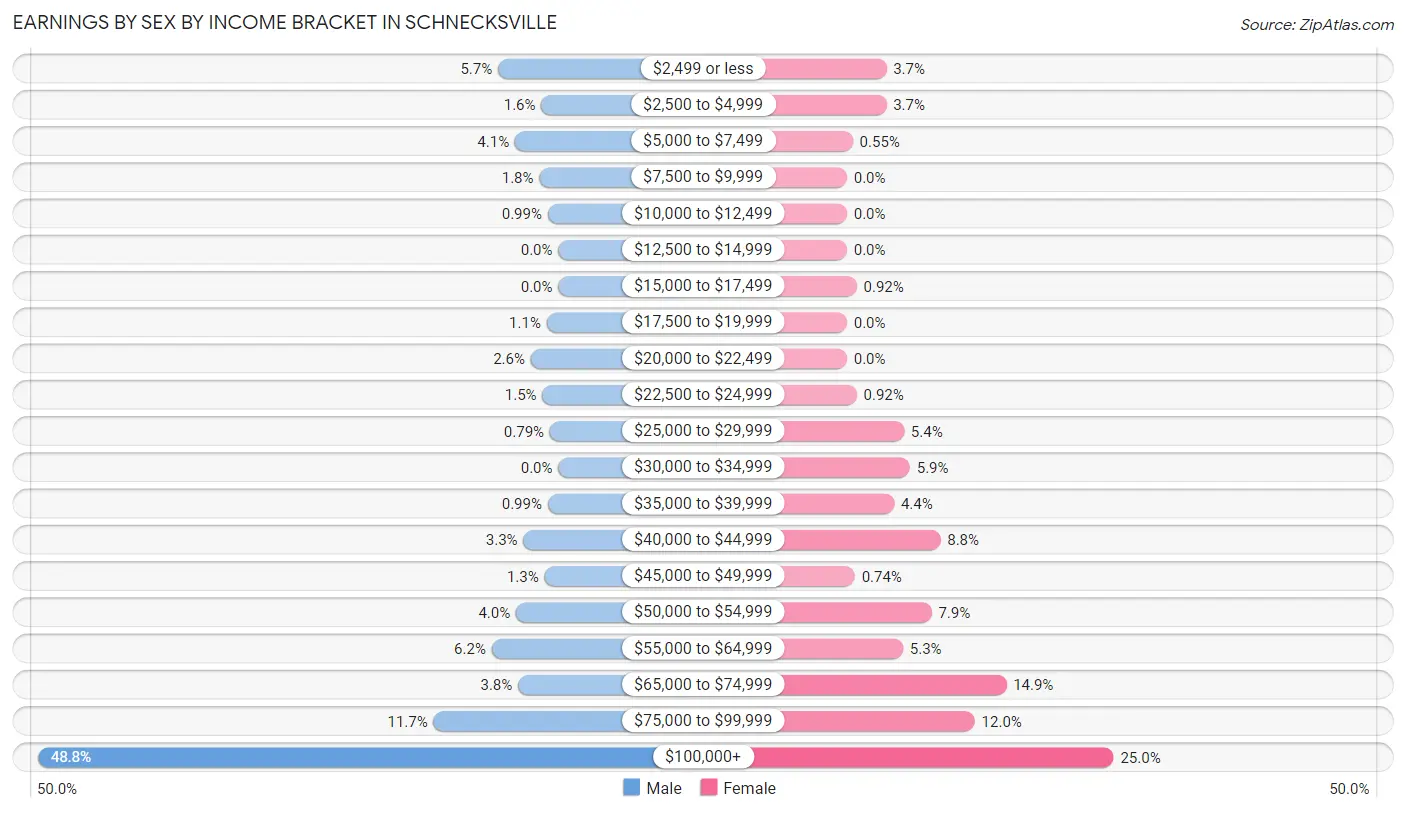
Earnings by Sex by Income Bracket in Schnecksville
The most common earnings brackets in Schnecksville are $100,000+ for men (492 | 48.8%) and $100,000+ for women (271 | 25.0%).
| Income | Male | Female |
| $2,499 or less | 57 (5.7%) | 40 (3.7%) |
| $2,500 to $4,999 | 16 (1.6%) | 40 (3.7%) |
| $5,000 to $7,499 | 41 (4.1%) | 6 (0.5%) |
| $7,500 to $9,999 | 18 (1.8%) | 0 (0.0%) |
| $10,000 to $12,499 | 10 (1.0%) | 0 (0.0%) |
| $12,500 to $14,999 | 0 (0.0%) | 0 (0.0%) |
| $15,000 to $17,499 | 0 (0.0%) | 10 (0.9%) |
| $17,500 to $19,999 | 11 (1.1%) | 0 (0.0%) |
| $20,000 to $22,499 | 26 (2.6%) | 0 (0.0%) |
| $22,500 to $24,999 | 15 (1.5%) | 10 (0.9%) |
| $25,000 to $29,999 | 8 (0.8%) | 58 (5.3%) |
| $30,000 to $34,999 | 0 (0.0%) | 64 (5.9%) |
| $35,000 to $39,999 | 10 (1.0%) | 48 (4.4%) |
| $40,000 to $44,999 | 33 (3.3%) | 95 (8.8%) |
| $45,000 to $49,999 | 13 (1.3%) | 8 (0.7%) |
| $50,000 to $54,999 | 40 (4.0%) | 86 (7.9%) |
| $55,000 to $64,999 | 63 (6.2%) | 57 (5.2%) |
| $65,000 to $74,999 | 38 (3.8%) | 162 (14.9%) |
| $75,000 to $99,999 | 118 (11.7%) | 130 (12.0%) |
| $100,000+ | 492 (48.8%) | 271 (25.0%) |
| Total | 1,009 (100.0%) | 1,085 (100.0%) |
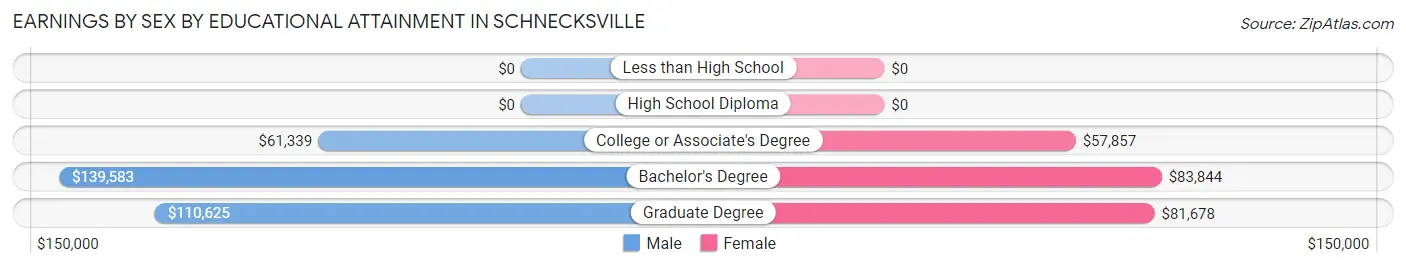
Earnings by Sex by Educational Attainment in Schnecksville
Average earnings in Schnecksville are $104,063 for men and $72,680 for women, a difference of 30.2%. Men with an educational attainment of bachelor's degree enjoy the highest average annual earnings of $139,583, while those with college or associate's degree education earn the least with $61,339. Women with an educational attainment of bachelor's degree earn the most with the average annual earnings of $83,844, while those with college or associate's degree education have the smallest earnings of $57,857.
| Educational Attainment | Male Income | Female Income |
| Less than High School | - | - |
| High School Diploma | - | - |
| College or Associate's Degree | $61,339 | $57,857 |
| Bachelor's Degree | $139,583 | $83,844 |
| Graduate Degree | $110,625 | $81,678 |
| Total | $104,063 | $72,680 |
Family Income in Schnecksville
Family Income Brackets in Schnecksville
According to the Schnecksville family income data, there are 429 families falling into the $200,000+ income range, which is the most common income bracket and makes up 40.1% of all families. Conversely, the $10,000 to $14,999 income bracket is the least frequent group with only 4 families (0.4%) belonging to this category.
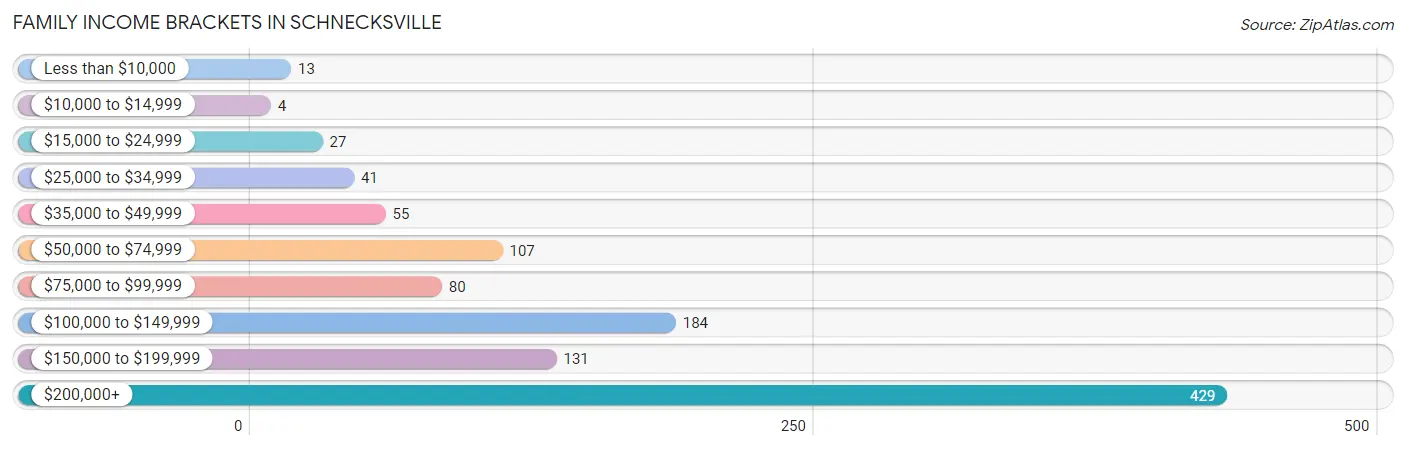
| Income Bracket | # Families | % Families |
| Less than $10,000 | 13 | 1.2% |
| $10,000 to $14,999 | 4 | 0.4% |
| $15,000 to $24,999 | 27 | 2.5% |
| $25,000 to $34,999 | 41 | 3.8% |
| $35,000 to $49,999 | 55 | 5.1% |
| $50,000 to $74,999 | 107 | 10.0% |
| $75,000 to $99,999 | 80 | 7.5% |
| $100,000 to $149,999 | 184 | 17.2% |
| $150,000 to $199,999 | 131 | 12.2% |
| $200,000+ | 429 | 40.1% |
Family Income by Famaliy Size in Schnecksville
5-person families (179 | 16.7%) account for the highest median family income in Schnecksville with $221,298 per family, while 4-person families (238 | 22.2%) have the highest median income of $51,591 per family member.
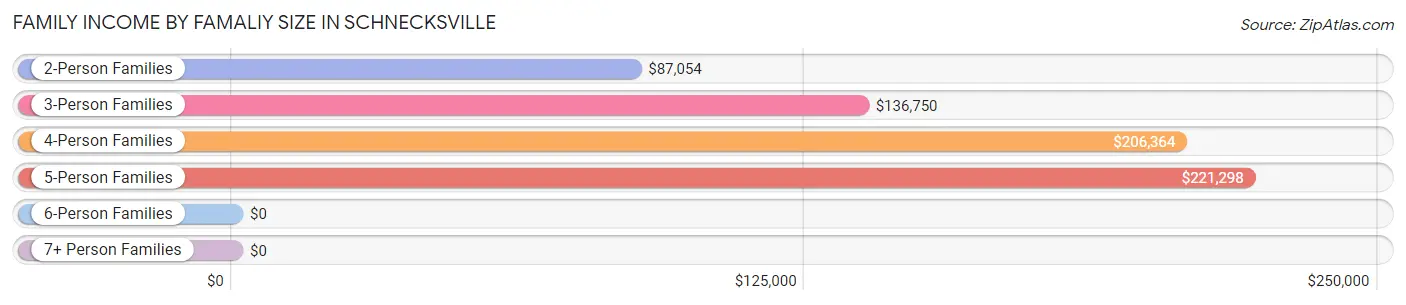
| Income Bracket | # Families | Median Income |
| 2-Person Families | 418 (39.0%) | $87,054 |
| 3-Person Families | 236 (22.0%) | $136,750 |
| 4-Person Families | 238 (22.2%) | $206,364 |
| 5-Person Families | 179 (16.7%) | $221,298 |
| 6-Person Families | 0 (0.0%) | $0 |
| 7+ Person Families | 0 (0.0%) | $0 |
| Total | 1,071 (100.0%) | $160,742 |
Family Income by Number of Earners in Schnecksville
The median family income in Schnecksville is $160,742, with families comprising 3+ earners (161) having the highest median family income of $227,792, while families with 1 earner (249) have the lowest median family income of $54,281, accounting for 15.0% and 23.3% of families, respectively.
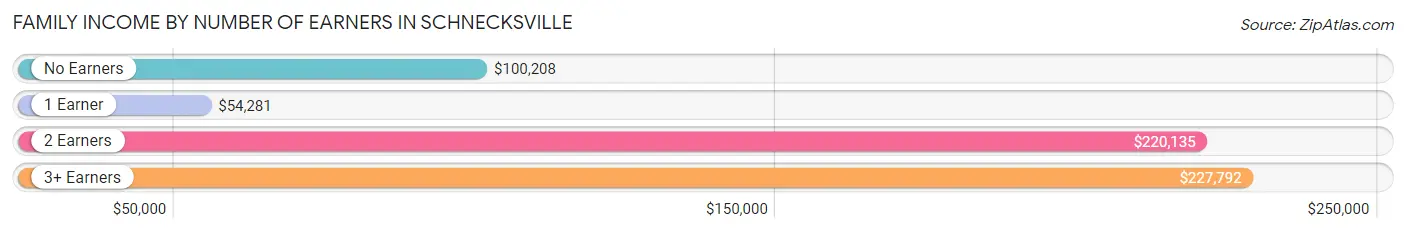
| Number of Earners | # Families | Median Income |
| No Earners | 151 (14.1%) | $100,208 |
| 1 Earner | 249 (23.3%) | $54,281 |
| 2 Earners | 510 (47.6%) | $220,135 |
| 3+ Earners | 161 (15.0%) | $227,792 |
| Total | 1,071 (100.0%) | $160,742 |
Household Income in Schnecksville
Household Income Brackets in Schnecksville
With 437 households falling in the category, the $200,000+ income range is the most frequent in Schnecksville, accounting for 30.1% of all households. In contrast, only 4 households (0.3%) fall into the $10,000 to $14,999 income bracket, making it the least populous group.
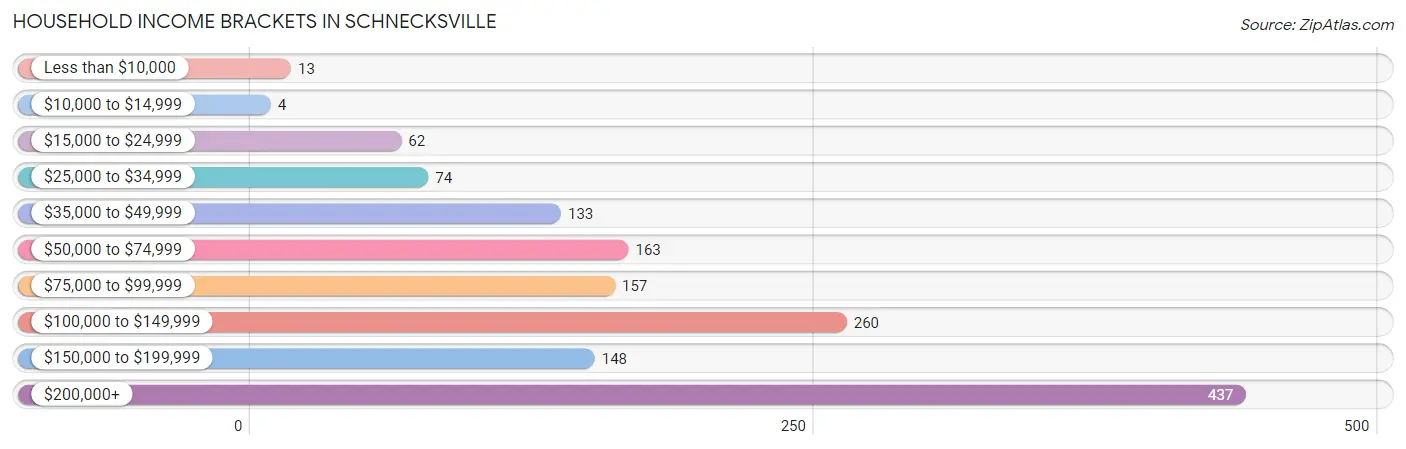
| Income Bracket | # Households | % Households |
| Less than $10,000 | 13 | 0.9% |
| $10,000 to $14,999 | 4 | 0.3% |
| $15,000 to $24,999 | 62 | 4.3% |
| $25,000 to $34,999 | 74 | 5.1% |
| $35,000 to $49,999 | 133 | 9.2% |
| $50,000 to $74,999 | 163 | 11.2% |
| $75,000 to $99,999 | 157 | 10.8% |
| $100,000 to $149,999 | 260 | 17.9% |
| $150,000 to $199,999 | 148 | 10.2% |
| $200,000+ | 437 | 30.1% |
Household Income by Householder Age in Schnecksville
The median household income in Schnecksville is $119,083, with the highest median household income of $194,808 found in the 45 to 64 years age bracket for the primary householder. A total of 496 households (34.2%) fall into this category. Meanwhile, the 15 to 24 years age bracket for the primary householder has the lowest median household income of $0, with 8 households (0.5%) in this group.
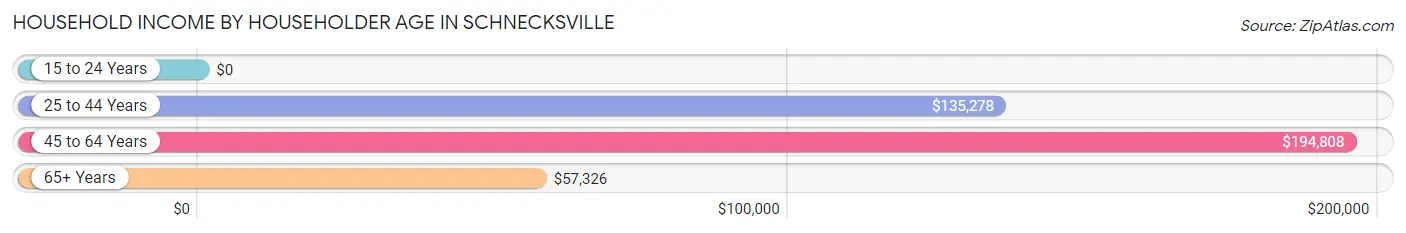
| Income Bracket | # Households | Median Income |
| 15 to 24 Years | 8 (0.5%) | $0 |
| 25 to 44 Years | 536 (36.9%) | $135,278 |
| 45 to 64 Years | 496 (34.2%) | $194,808 |
| 65+ Years | 411 (28.3%) | $57,326 |
| Total | 1,451 (100.0%) | $119,083 |
Poverty in Schnecksville
Income Below Poverty by Sex and Age in Schnecksville
With 3.9% poverty level for males and 7.0% for females among the residents of Schnecksville, 18 to 24 year old males and 15 year old females are the most vulnerable to poverty, with 35 males (41.2%) and 29 females (70.7%) in their respective age groups living below the poverty level.
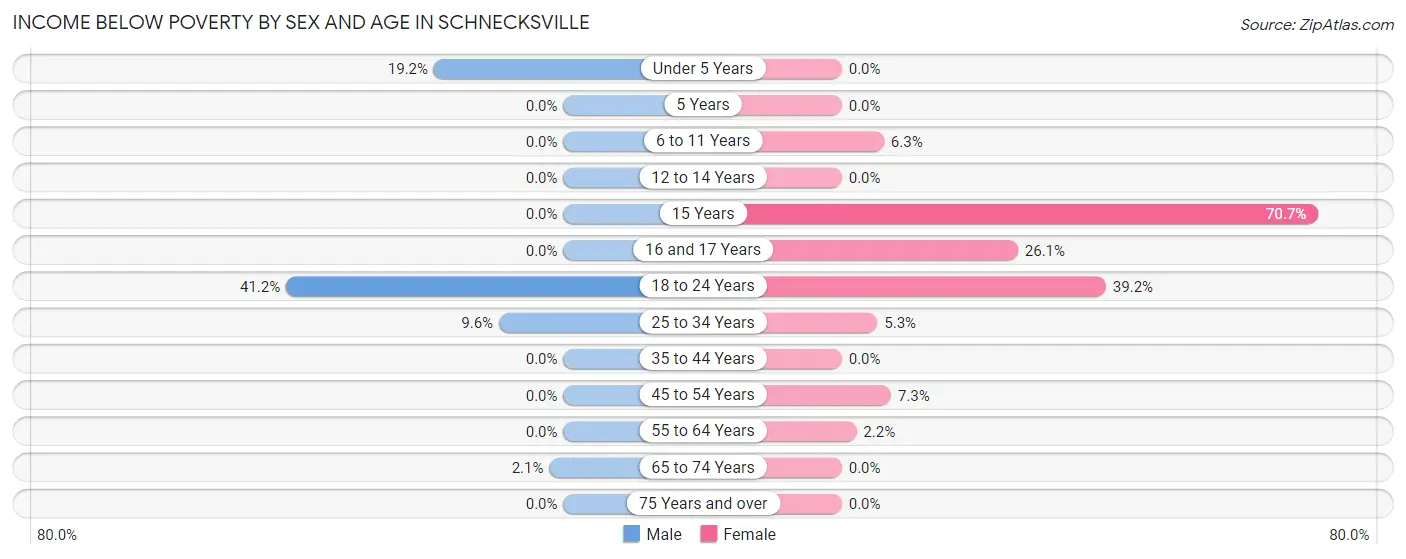
| Age Bracket | Male | Female |
| Under 5 Years | 15 (19.2%) | 0 (0.0%) |
| 5 Years | 0 (0.0%) | 0 (0.0%) |
| 6 to 11 Years | 0 (0.0%) | 16 (6.2%) |
| 12 to 14 Years | 0 (0.0%) | 0 (0.0%) |
| 15 Years | 0 (0.0%) | 29 (70.7%) |
| 16 and 17 Years | 0 (0.0%) | 23 (26.1%) |
| 18 to 24 Years | 35 (41.2%) | 40 (39.2%) |
| 25 to 34 Years | 13 (9.6%) | 13 (5.3%) |
| 35 to 44 Years | 0 (0.0%) | 0 (0.0%) |
| 45 to 54 Years | 0 (0.0%) | 26 (7.3%) |
| 55 to 64 Years | 0 (0.0%) | 4 (2.2%) |
| 65 to 74 Years | 4 (2.1%) | 0 (0.0%) |
| 75 Years and over | 0 (0.0%) | 0 (0.0%) |
| Total | 67 (3.9%) | 151 (7.0%) |
Income Above Poverty by Sex and Age in Schnecksville
According to the poverty statistics in Schnecksville, males aged 6 to 11 years and females aged under 5 years are the age groups that are most secure financially, with 100.0% of males and 100.0% of females in these age groups living above the poverty line.
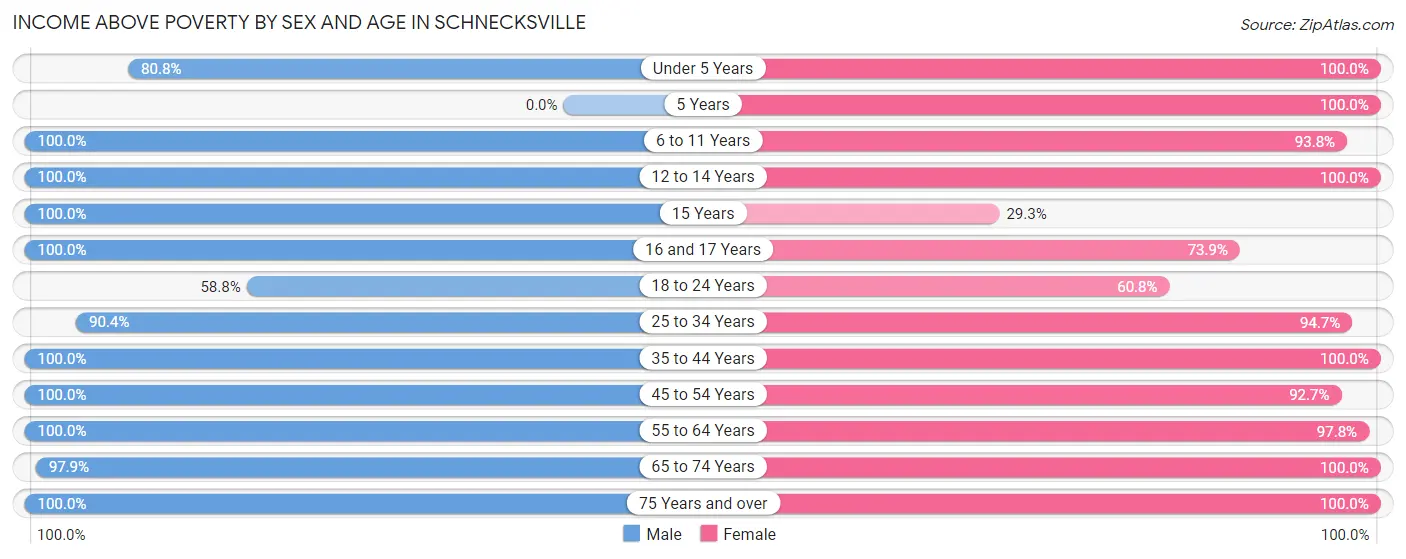
| Age Bracket | Male | Female |
| Under 5 Years | 63 (80.8%) | 156 (100.0%) |
| 5 Years | 0 (0.0%) | 10 (100.0%) |
| 6 to 11 Years | 59 (100.0%) | 240 (93.8%) |
| 12 to 14 Years | 267 (100.0%) | 102 (100.0%) |
| 15 Years | 37 (100.0%) | 12 (29.3%) |
| 16 and 17 Years | 30 (100.0%) | 65 (73.9%) |
| 18 to 24 Years | 50 (58.8%) | 62 (60.8%) |
| 25 to 34 Years | 123 (90.4%) | 233 (94.7%) |
| 35 to 44 Years | 329 (100.0%) | 290 (100.0%) |
| 45 to 54 Years | 260 (100.0%) | 330 (92.7%) |
| 55 to 64 Years | 167 (100.0%) | 180 (97.8%) |
| 65 to 74 Years | 187 (97.9%) | 184 (100.0%) |
| 75 Years and over | 90 (100.0%) | 149 (100.0%) |
| Total | 1,662 (96.1%) | 2,013 (93.0%) |
Income Below Poverty Among Married-Couple Families in Schnecksville
The poverty statistics for married-couple families in Schnecksville show that 1.9% or 17 of the total 882 families live below the poverty line. Families with 1 or 2 children have the highest poverty rate of 6.0%, comprising of 13 families. On the other hand, families with 3 or 4 children have the lowest poverty rate of 0.0%, which includes 0 families.
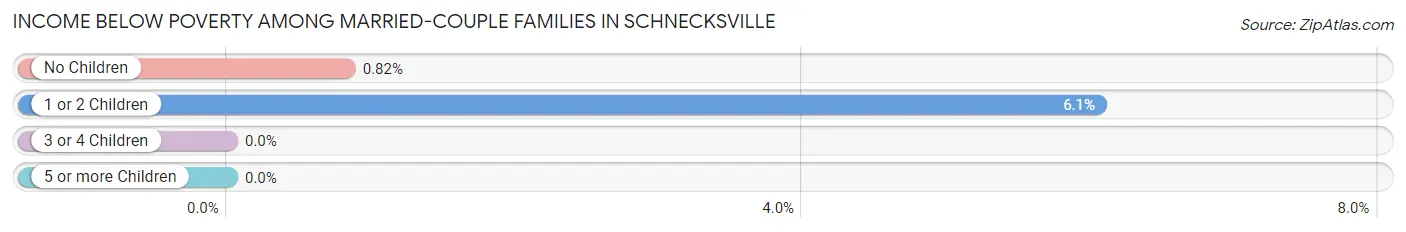
| Children | Above Poverty | Below Poverty |
| No Children | 484 (99.2%) | 4 (0.8%) |
| 1 or 2 Children | 202 (94.0%) | 13 (6.0%) |
| 3 or 4 Children | 179 (100.0%) | 0 (0.0%) |
| 5 or more Children | 0 (0.0%) | 0 (0.0%) |
| Total | 865 (98.1%) | 17 (1.9%) |
Income Below Poverty Among Single-Parent Households in Schnecksville
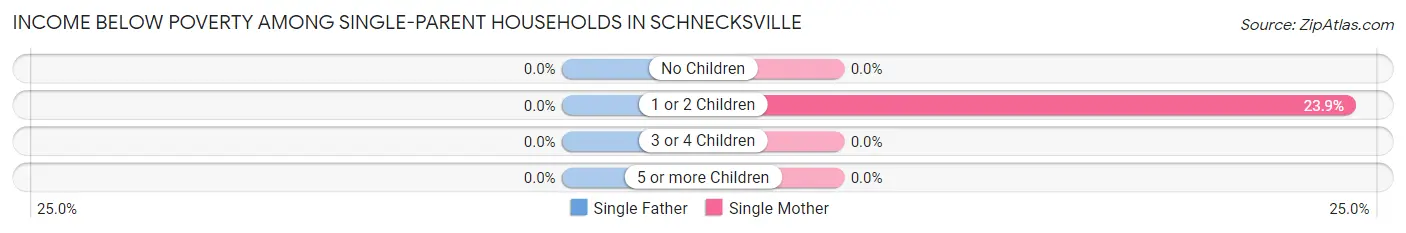
| Children | Single Father | Single Mother |
| No Children | 0 (0.0%) | 0 (0.0%) |
| 1 or 2 Children | 0 (0.0%) | 26 (23.8%) |
| 3 or 4 Children | 0 (0.0%) | 0 (0.0%) |
| 5 or more Children | 0 (0.0%) | 0 (0.0%) |
| Total | 0 (0.0%) | 26 (19.1%) |
Income Below Poverty Among Married-Couple vs Single-Parent Households in Schnecksville
The poverty data for Schnecksville shows that 17 of the married-couple family households (1.9%) and 26 of the single-parent households (13.8%) are living below the poverty level. Within the married-couple family households, those with 1 or 2 children have the highest poverty rate, with 13 households (6.0%) falling below the poverty line. Among the single-parent households, those with 1 or 2 children have the highest poverty rate, with 26 household (16.1%) living below poverty.
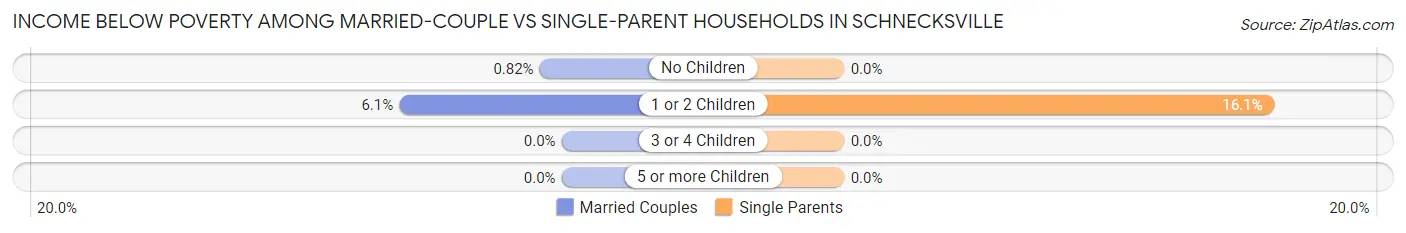
| Children | Married-Couple Families | Single-Parent Households |
| No Children | 4 (0.8%) | 0 (0.0%) |
| 1 or 2 Children | 13 (6.0%) | 26 (16.1%) |
| 3 or 4 Children | 0 (0.0%) | 0 (0.0%) |
| 5 or more Children | 0 (0.0%) | 0 (0.0%) |
| Total | 17 (1.9%) | 26 (13.8%) |
Race in Schnecksville
The most populous races in Schnecksville are White / Caucasian (3,597 | 92.4%), Hispanic or Latino (391 | 10.0%), and Two or more Races (205 | 5.3%).
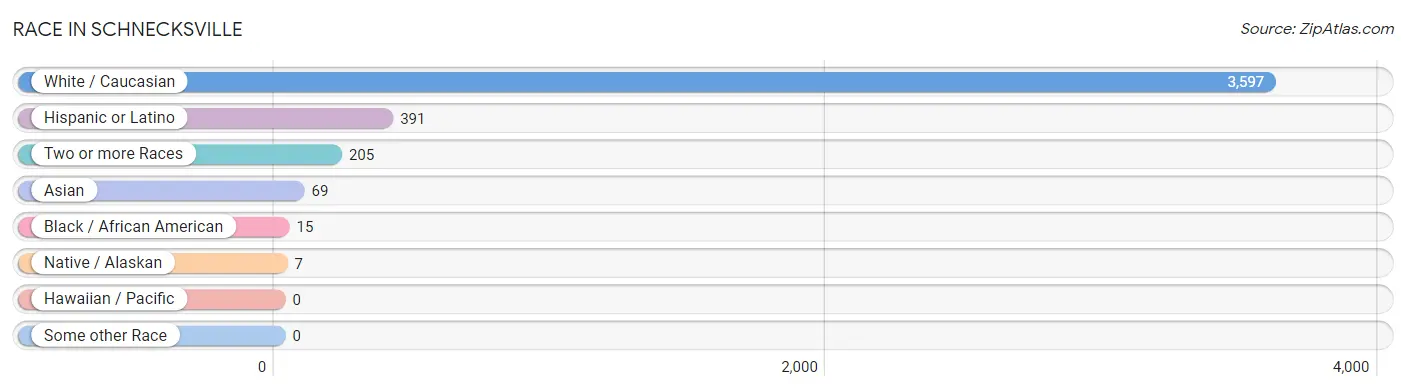
| Race | # Population | % Population |
| Asian | 69 | 1.8% |
| Black / African American | 15 | 0.4% |
| Hawaiian / Pacific | 0 | 0.0% |
| Hispanic or Latino | 391 | 10.0% |
| Native / Alaskan | 7 | 0.2% |
| White / Caucasian | 3,597 | 92.4% |
| Two or more Races | 205 | 5.3% |
| Some other Race | 0 | 0.0% |
| Total | 3,893 | 100.0% |
Ancestry in Schnecksville
The most populous ancestries reported in Schnecksville are German (1,116 | 28.7%), English (687 | 17.6%), Irish (422 | 10.8%), Puerto Rican (348 | 8.9%), and Italian (321 | 8.3%), together accounting for 74.4% of all Schnecksville residents.
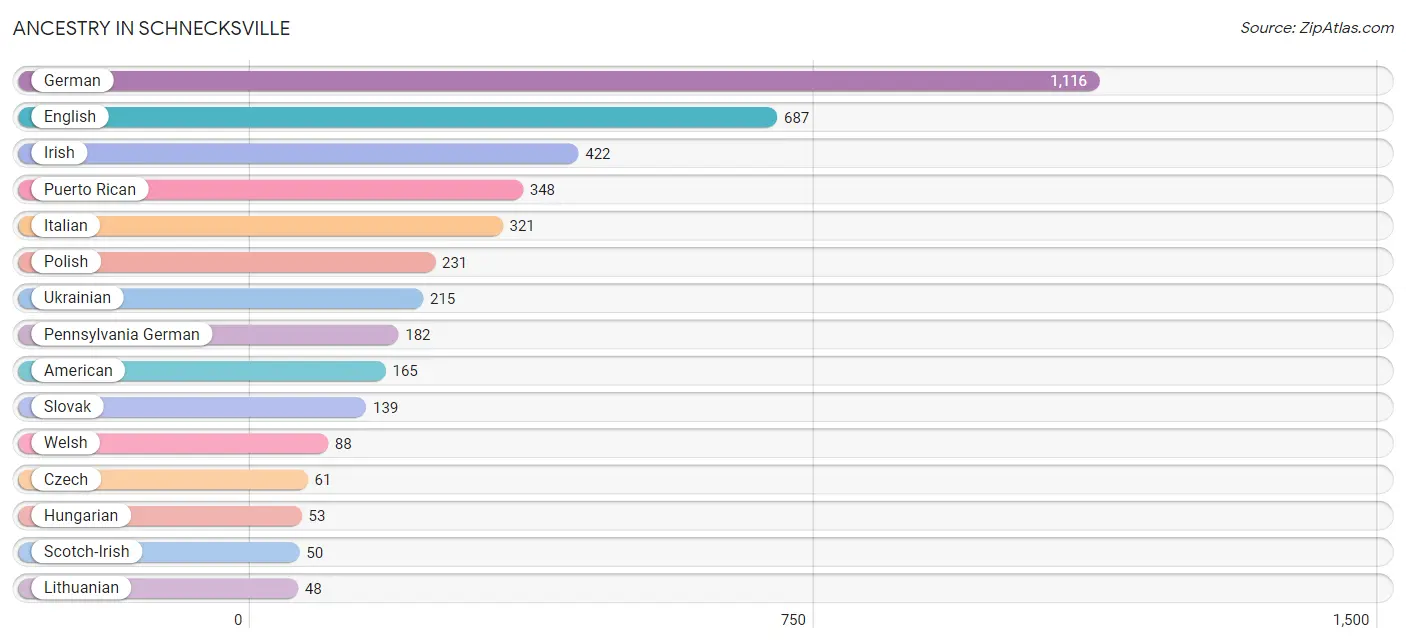
| Ancestry | # Population | % Population |
| Alsatian | 7 | 0.2% |
| American | 165 | 4.2% |
| Austrian | 13 | 0.3% |
| British | 10 | 0.3% |
| Burmese | 34 | 0.9% |
| Chippewa | 7 | 0.2% |
| Croatian | 11 | 0.3% |
| Czech | 61 | 1.6% |
| Czechoslovakian | 38 | 1.0% |
| Dutch | 26 | 0.7% |
| English | 687 | 17.6% |
| European | 26 | 0.7% |
| French | 25 | 0.6% |
| German | 1,116 | 28.7% |
| Greek | 31 | 0.8% |
| Hungarian | 53 | 1.4% |
| Indian (Asian) | 23 | 0.6% |
| Irish | 422 | 10.8% |
| Italian | 321 | 8.3% |
| Jamaican | 13 | 0.3% |
| Lithuanian | 48 | 1.2% |
| Mexican | 9 | 0.2% |
| Norwegian | 8 | 0.2% |
| Pennsylvania German | 182 | 4.7% |
| Polish | 231 | 5.9% |
| Puerto Rican | 348 | 8.9% |
| Russian | 22 | 0.6% |
| Scandinavian | 6 | 0.2% |
| Scotch-Irish | 50 | 1.3% |
| Scottish | 38 | 1.0% |
| Slovak | 139 | 3.6% |
| Spaniard | 26 | 0.7% |
| Sri Lankan | 12 | 0.3% |
| Swiss | 1 | 0.0% |
| Ukrainian | 215 | 5.5% |
| Welsh | 88 | 2.3% | View All 36 Rows |
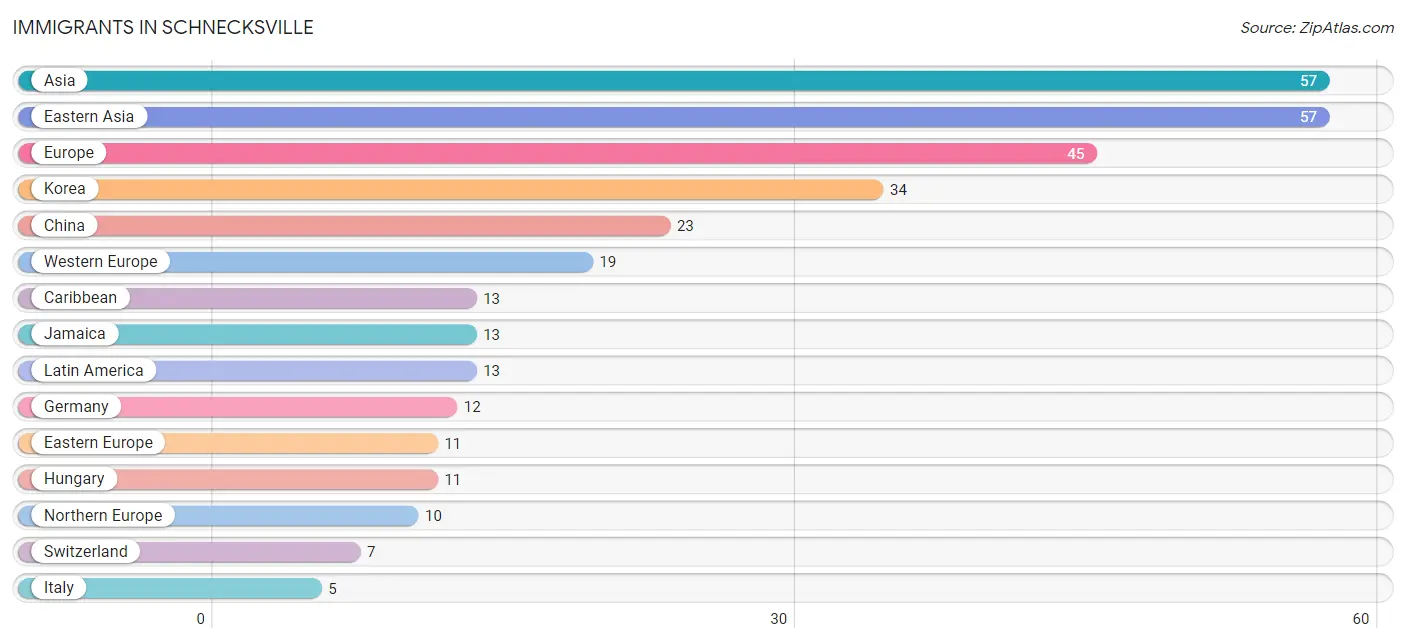
Immigrants in Schnecksville
The most numerous immigrant groups reported in Schnecksville came from Asia (57 | 1.5%), Eastern Asia (57 | 1.5%), Europe (45 | 1.2%), Korea (34 | 0.9%), and China (23 | 0.6%), together accounting for 5.5% of all Schnecksville residents.
| Immigration Origin | # Population | % Population |
| Asia | 57 | 1.5% |
| Caribbean | 13 | 0.3% |
| China | 23 | 0.6% |
| Eastern Asia | 57 | 1.5% |
| Eastern Europe | 11 | 0.3% |
| Europe | 45 | 1.2% |
| Germany | 12 | 0.3% |
| Hungary | 11 | 0.3% |
| Italy | 5 | 0.1% |
| Jamaica | 13 | 0.3% |
| Korea | 34 | 0.9% |
| Latin America | 13 | 0.3% |
| Northern Europe | 10 | 0.3% |
| Southern Europe | 5 | 0.1% |
| Switzerland | 7 | 0.2% |
| Western Europe | 19 | 0.5% | View All 16 Rows |
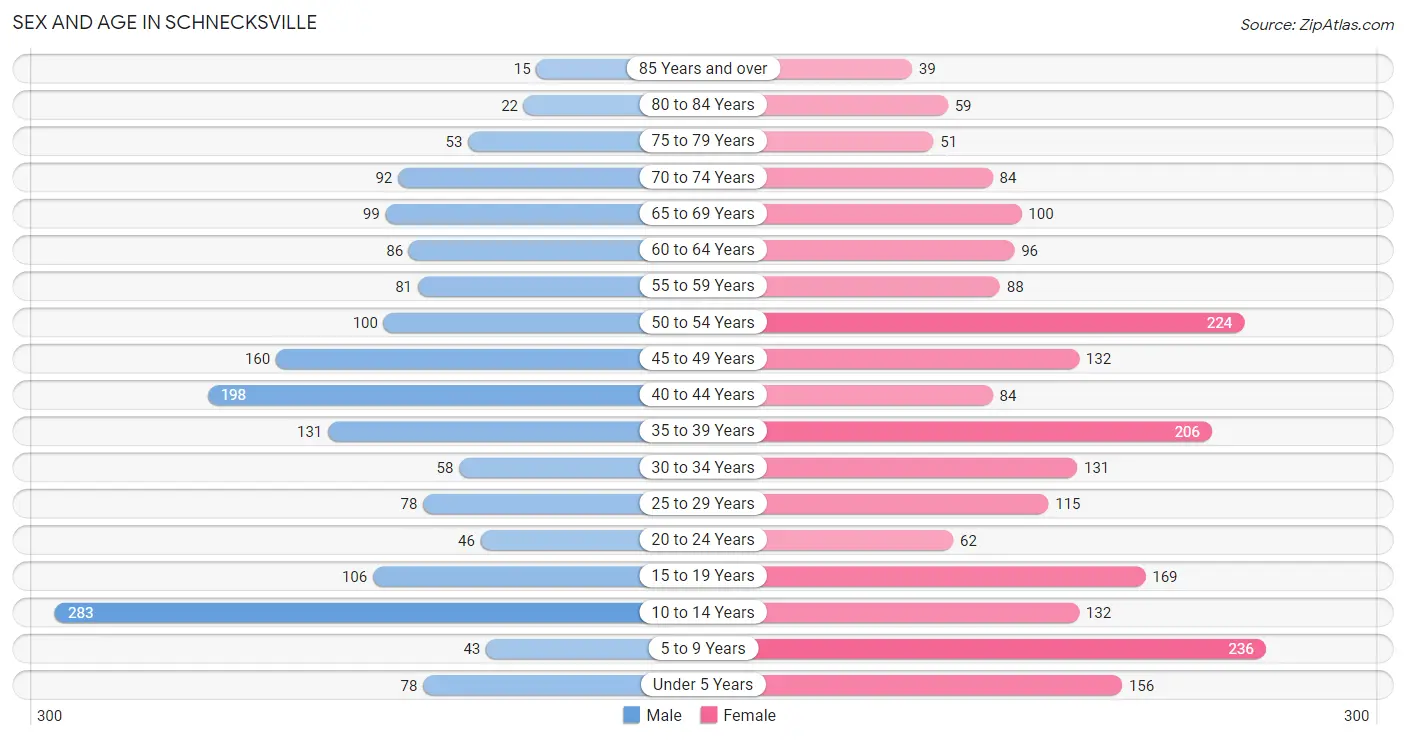
Sex and Age in Schnecksville
Sex and Age in Schnecksville
The most populous age groups in Schnecksville are 10 to 14 Years (283 | 16.4%) for men and 5 to 9 Years (236 | 10.9%) for women.
| Age Bracket | Male | Female |
| Under 5 Years | 78 (4.5%) | 156 (7.2%) |
| 5 to 9 Years | 43 (2.5%) | 236 (10.9%) |
| 10 to 14 Years | 283 (16.4%) | 132 (6.1%) |
| 15 to 19 Years | 106 (6.1%) | 169 (7.8%) |
| 20 to 24 Years | 46 (2.7%) | 62 (2.9%) |
| 25 to 29 Years | 78 (4.5%) | 115 (5.3%) |
| 30 to 34 Years | 58 (3.4%) | 131 (6.0%) |
| 35 to 39 Years | 131 (7.6%) | 206 (9.5%) |
| 40 to 44 Years | 198 (11.5%) | 84 (3.9%) |
| 45 to 49 Years | 160 (9.2%) | 132 (6.1%) |
| 50 to 54 Years | 100 (5.8%) | 224 (10.3%) |
| 55 to 59 Years | 81 (4.7%) | 88 (4.1%) |
| 60 to 64 Years | 86 (5.0%) | 96 (4.4%) |
| 65 to 69 Years | 99 (5.7%) | 100 (4.6%) |
| 70 to 74 Years | 92 (5.3%) | 84 (3.9%) |
| 75 to 79 Years | 53 (3.1%) | 51 (2.4%) |
| 80 to 84 Years | 22 (1.3%) | 59 (2.7%) |
| 85 Years and over | 15 (0.9%) | 39 (1.8%) |
| Total | 1,729 (100.0%) | 2,164 (100.0%) |
Families and Households in Schnecksville
Median Family Size in Schnecksville
The median family size in Schnecksville is 3.22 persons per family, with single male/father families (53 | 5.0%) accounting for the largest median family size of 5.08 persons per family. On the other hand, single female/mother families (136 | 12.7%) represent the smallest median family size with 2.89 persons per family.

| Family Type | # Families | Family Size |
| Married-Couple | 882 (82.4%) | 3.16 |
| Single Male/Father | 53 (5.0%) | 5.08 |
| Single Female/Mother | 136 (12.7%) | 2.89 |
| Total Families | 1,071 (100.0%) | 3.22 |
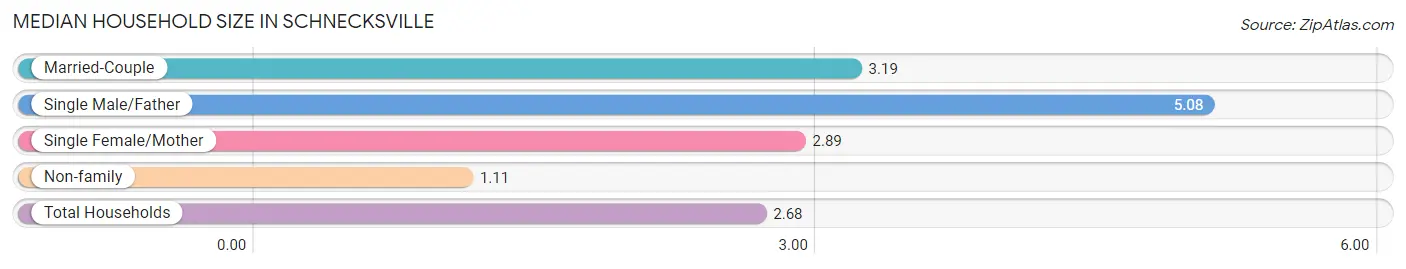
Median Household Size in Schnecksville
The median household size in Schnecksville is 2.68 persons per household, with single male/father households (53 | 3.6%) accounting for the largest median household size of 5.08 persons per household. non-family households (380 | 26.2%) represent the smallest median household size with 1.11 persons per household.
| Household Type | # Households | Household Size |
| Married-Couple | 882 (60.8%) | 3.19 |
| Single Male/Father | 53 (3.6%) | 5.08 |
| Single Female/Mother | 136 (9.4%) | 2.89 |
| Non-family | 380 (26.2%) | 1.11 |
| Total Households | 1,451 (100.0%) | 2.68 |
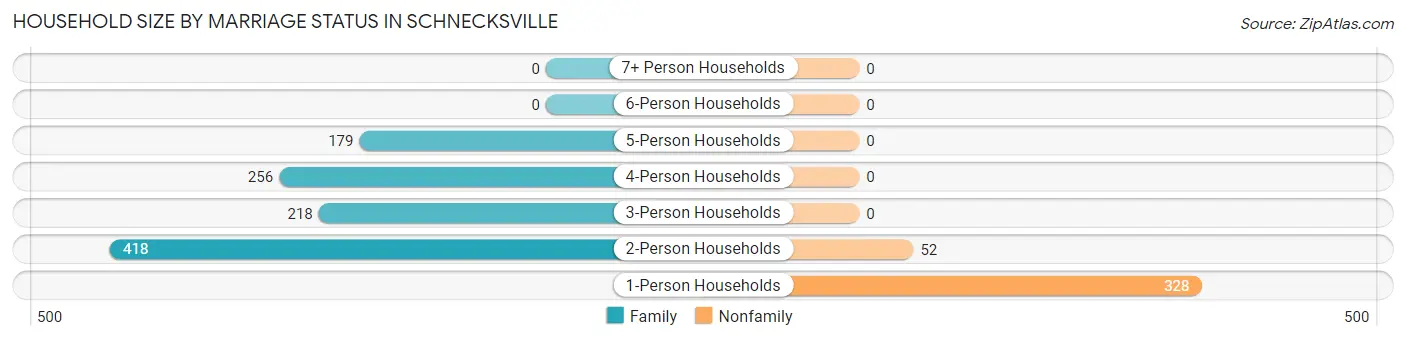
Household Size by Marriage Status in Schnecksville
Out of a total of 1,451 households in Schnecksville, 1,071 (73.8%) are family households, while 380 (26.2%) are nonfamily households. The most numerous type of family households are 2-person households, comprising 418, and the most common type of nonfamily households are 1-person households, comprising 328.
| Household Size | Family Households | Nonfamily Households |
| 1-Person Households | - | 328 (22.6%) |
| 2-Person Households | 418 (28.8%) | 52 (3.6%) |
| 3-Person Households | 218 (15.0%) | 0 (0.0%) |
| 4-Person Households | 256 (17.6%) | 0 (0.0%) |
| 5-Person Households | 179 (12.3%) | 0 (0.0%) |
| 6-Person Households | 0 (0.0%) | 0 (0.0%) |
| 7+ Person Households | 0 (0.0%) | 0 (0.0%) |
| Total | 1,071 (73.8%) | 380 (26.2%) |
Female Fertility in Schnecksville
Fertility by Age in Schnecksville
Average fertility rate in Schnecksville is 40.0 births per 1,000 women. Women in the age bracket of 20 to 34 years have the highest fertility rate with 136.0 births per 1,000 women. Women in the age bracket of 20 to 34 years acount for 100.0% of all women with births.
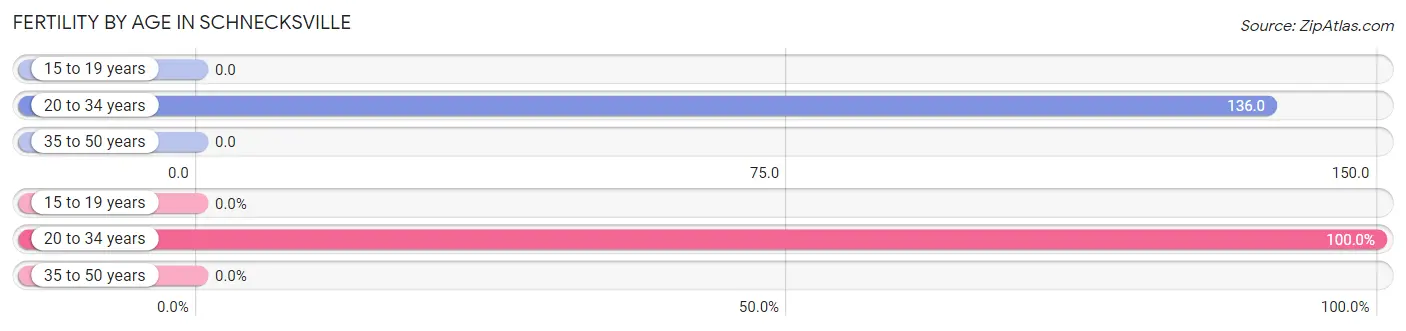
| Age Bracket | Women with Births | Births / 1,000 Women |
| 15 to 19 years | 0 (0.0%) | 0.0 |
| 20 to 34 years | 42 (100.0%) | 136.0 |
| 35 to 50 years | 0 (0.0%) | 0.0 |
| Total | 42 (100.0%) | 40.0 |
Fertility by Age by Marriage Status in Schnecksville
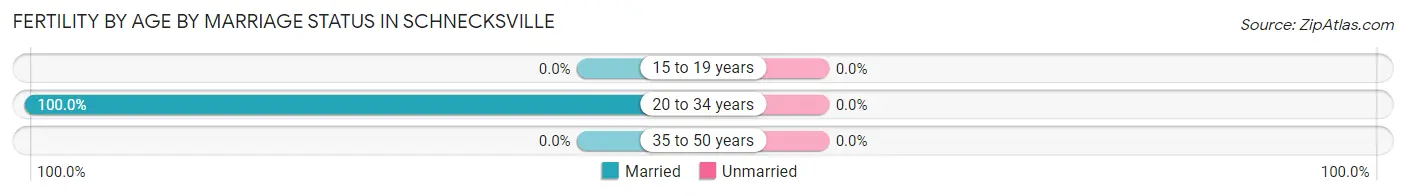
| Age Bracket | Married | Unmarried |
| 15 to 19 years | 0 (0.0%) | 0 (0.0%) |
| 20 to 34 years | 42 (100.0%) | 0 (0.0%) |
| 35 to 50 years | 0 (0.0%) | 0 (0.0%) |
| Total | 42 (100.0%) | 0 (0.0%) |
Fertility by Education in Schnecksville
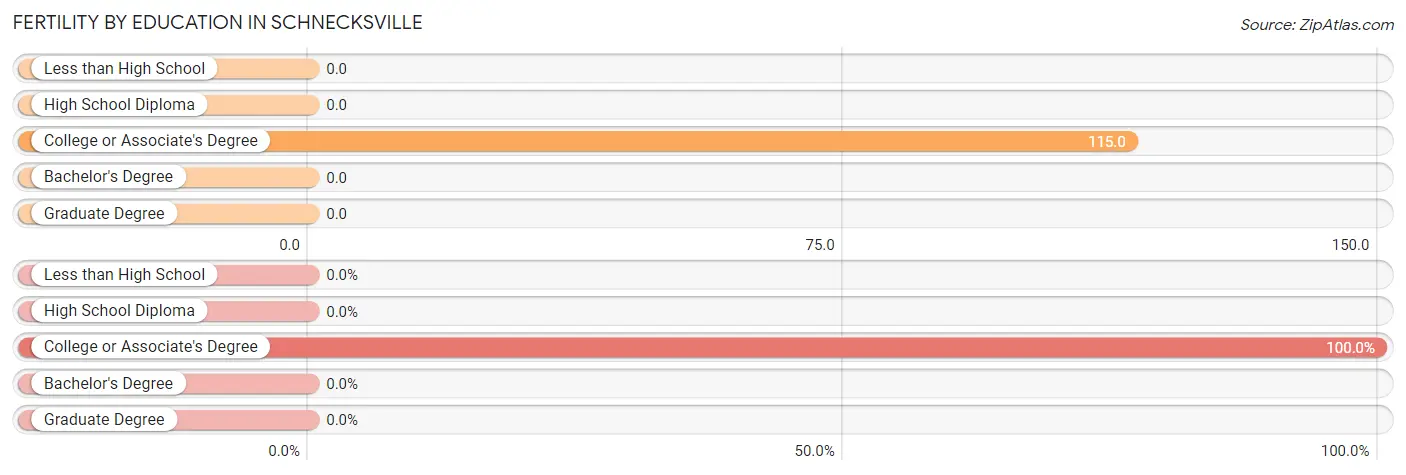
| Educational Attainment | Women with Births | Births / 1,000 Women |
| Less than High School | 0 (0.0%) | 0.0 |
| High School Diploma | 0 (0.0%) | 0.0 |
| College or Associate's Degree | 42 (100.0%) | 115.0 |
| Bachelor's Degree | 0 (0.0%) | 0.0 |
| Graduate Degree | 0 (0.0%) | 0.0 |
| Total | 42 (100.0%) | 40.0 |
Fertility by Education by Marriage Status in Schnecksville
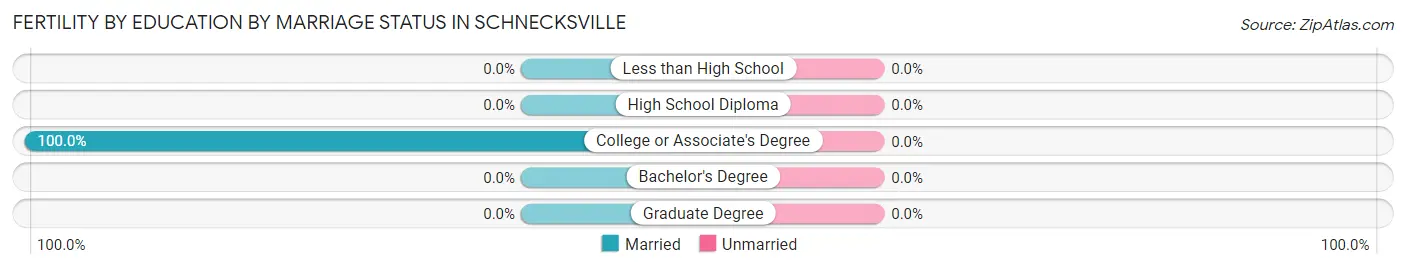
| Educational Attainment | Married | Unmarried |
| Less than High School | 0 (0.0%) | 0 (0.0%) |
| High School Diploma | 0 (0.0%) | 0 (0.0%) |
| College or Associate's Degree | 42 (100.0%) | 0 (0.0%) |
| Bachelor's Degree | 0 (0.0%) | 0 (0.0%) |
| Graduate Degree | 0 (0.0%) | 0 (0.0%) |
| Total | 42 (100.0%) | 0 (0.0%) |
Employment Characteristics in Schnecksville
Employment by Class of Employer in Schnecksville
Among the 1,849 employed individuals in Schnecksville, private company employees (1,353 | 73.2%), not-for-profit organizations (237 | 12.8%), and local government employees (148 | 8.0%) make up the most common classes of employment.
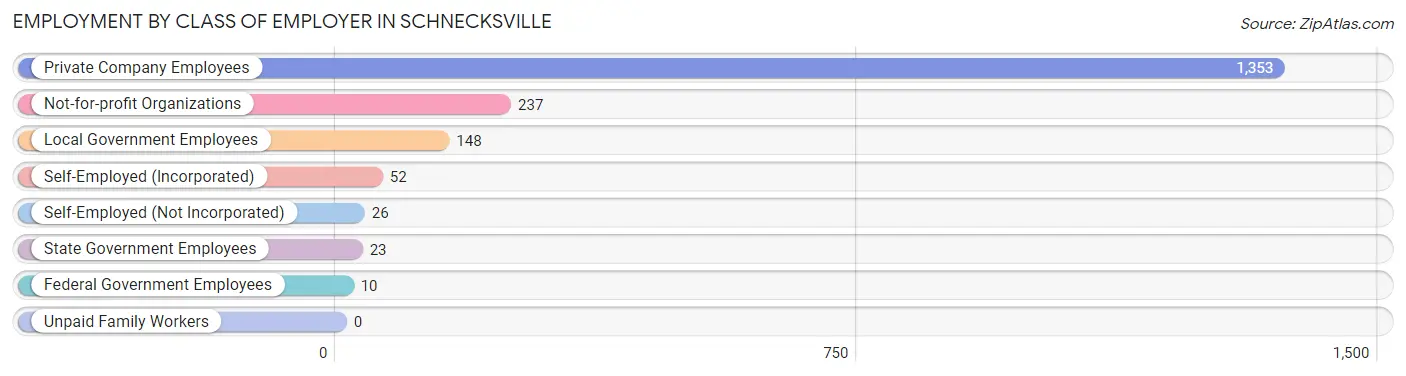
| Employer Class | # Employees | % Employees |
| Private Company Employees | 1,353 | 73.2% |
| Self-Employed (Incorporated) | 52 | 2.8% |
| Self-Employed (Not Incorporated) | 26 | 1.4% |
| Not-for-profit Organizations | 237 | 12.8% |
| Local Government Employees | 148 | 8.0% |
| State Government Employees | 23 | 1.2% |
| Federal Government Employees | 10 | 0.5% |
| Unpaid Family Workers | 0 | 0.0% |
| Total | 1,849 | 100.0% |
Employment Status by Age in Schnecksville
According to the labor force statistics for Schnecksville, out of the total population over 16 years of age (2,887), 69.9% or 2,018 individuals are in the labor force, with 5.6% or 113 of them unemployed. The age group with the highest labor force participation rate is 35 to 44 years, with 98.7% or 611 individuals in the labor force. Within the labor force, the 45 to 54 years age range has the highest percentage of unemployed individuals, with 18.0% or 104 of them being unemployed.
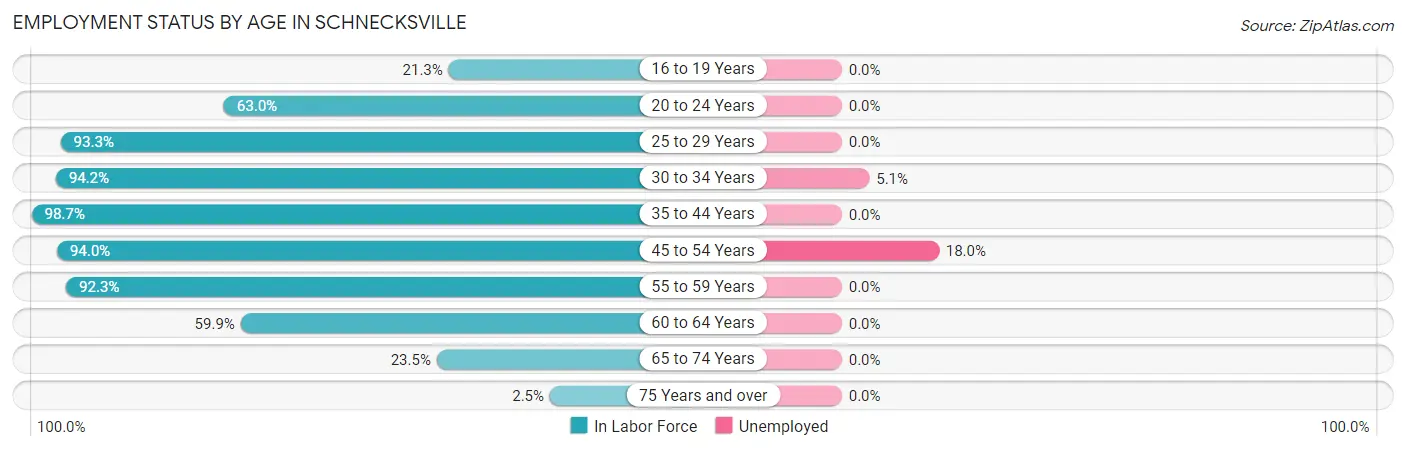
| Age Bracket | In Labor Force | Unemployed |
| 16 to 19 Years | 42 (21.3%) | 0 (0.0%) |
| 20 to 24 Years | 68 (63.0%) | 0 (0.0%) |
| 25 to 29 Years | 180 (93.3%) | 0 (0.0%) |
| 30 to 34 Years | 178 (94.2%) | 9 (5.1%) |
| 35 to 44 Years | 611 (98.7%) | 0 (0.0%) |
| 45 to 54 Years | 579 (94.0%) | 104 (18.0%) |
| 55 to 59 Years | 156 (92.3%) | 0 (0.0%) |
| 60 to 64 Years | 109 (59.9%) | 0 (0.0%) |
| 65 to 74 Years | 88 (23.5%) | 0 (0.0%) |
| 75 Years and over | 6 (2.5%) | 0 (0.0%) |
| Total | 2,018 (69.9%) | 113 (5.6%) |
Employment Status by Educational Attainment in Schnecksville
According to labor force statistics for Schnecksville, 92.1% of individuals (1,813) out of the total population between 25 and 64 years of age (1,968) are in the labor force, with 6.2% or 112 of them being unemployed. The group with the highest labor force participation rate are those with the educational attainment of college / associate degree, with 98.3% or 519 individuals in the labor force. Within the labor force, individuals with high school diploma education have the highest percentage of unemployment, with 23.4% or 104 of them being unemployed.
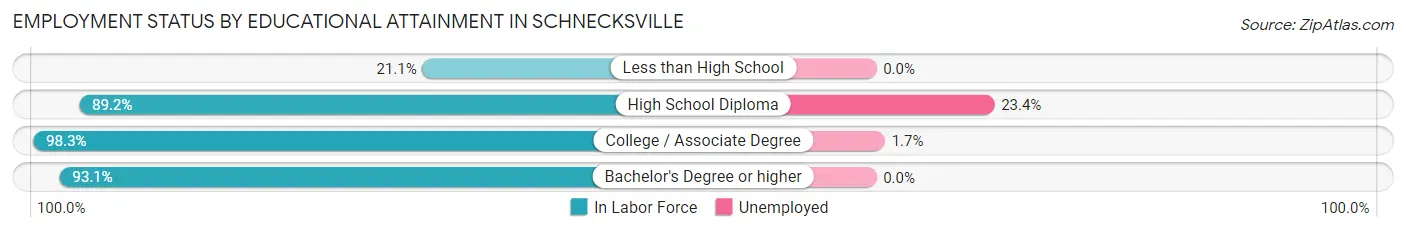
| Educational Attainment | In Labor Force | Unemployed |
| Less than High School | 8 (21.1%) | 0 (0.0%) |
| High School Diploma | 445 (89.2%) | 117 (23.4%) |
| College / Associate Degree | 519 (98.3%) | 9 (1.7%) |
| Bachelor's Degree or higher | 841 (93.1%) | 0 (0.0%) |
| Total | 1,813 (92.1%) | 122 (6.2%) |
Employment Occupations by Sex in Schnecksville
Management, Business, Science and Arts Occupations
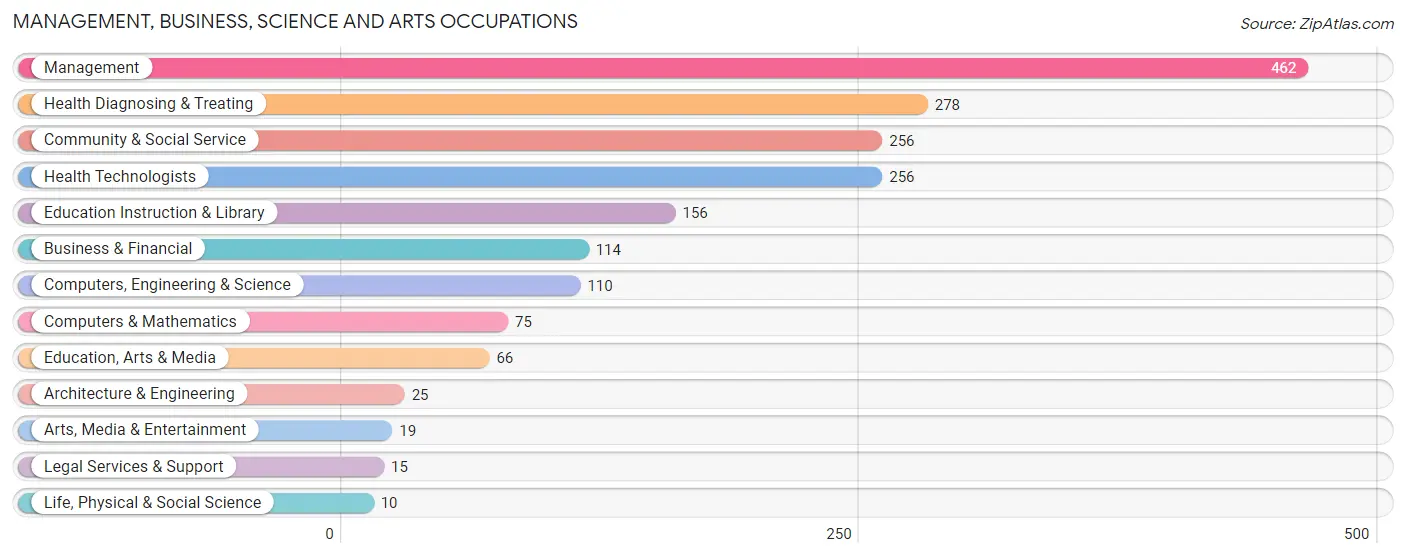
The most common Management, Business, Science and Arts occupations in Schnecksville are Management (462 | 24.3%), Health Diagnosing & Treating (278 | 14.6%), Community & Social Service (256 | 13.5%), Health Technologists (256 | 13.5%), and Education Instruction & Library (156 | 8.2%).
Management, Business, Science and Arts Occupations by Sex
Within the Management, Business, Science and Arts occupations in Schnecksville, the most male-oriented occupations are Architecture & Engineering (100.0%), Life, Physical & Social Science (100.0%), and Computers, Engineering & Science (85.5%), while the most female-oriented occupations are Legal Services & Support (100.0%), Health Diagnosing & Treating (91.0%), and Health Technologists (90.2%).
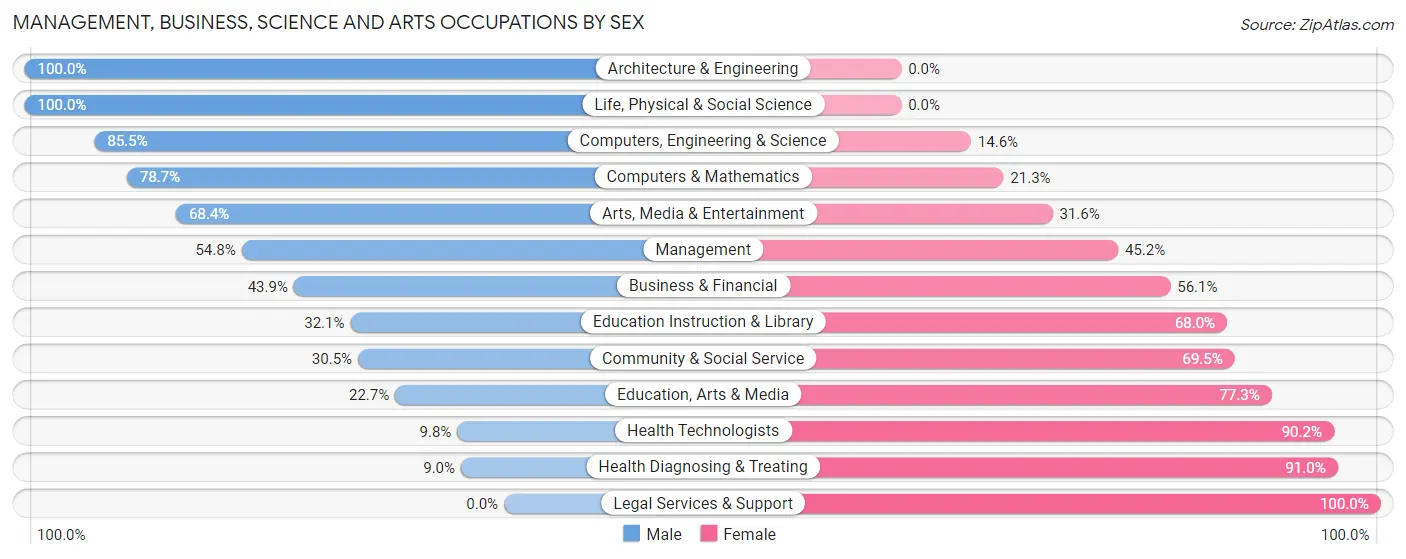
| Occupation | Male | Female |
| Management | 253 (54.8%) | 209 (45.2%) |
| Business & Financial | 50 (43.9%) | 64 (56.1%) |
| Computers, Engineering & Science | 94 (85.5%) | 16 (14.5%) |
| Computers & Mathematics | 59 (78.7%) | 16 (21.3%) |
| Architecture & Engineering | 25 (100.0%) | 0 (0.0%) |
| Life, Physical & Social Science | 10 (100.0%) | 0 (0.0%) |
| Community & Social Service | 78 (30.5%) | 178 (69.5%) |
| Education, Arts & Media | 15 (22.7%) | 51 (77.3%) |
| Legal Services & Support | 0 (0.0%) | 15 (100.0%) |
| Education Instruction & Library | 50 (32.1%) | 106 (67.9%) |
| Arts, Media & Entertainment | 13 (68.4%) | 6 (31.6%) |
| Health Diagnosing & Treating | 25 (9.0%) | 253 (91.0%) |
| Health Technologists | 25 (9.8%) | 231 (90.2%) |
| Total (Category) | 500 (41.0%) | 720 (59.0%) |
| Total (Overall) | 833 (43.8%) | 1,071 (56.2%) |
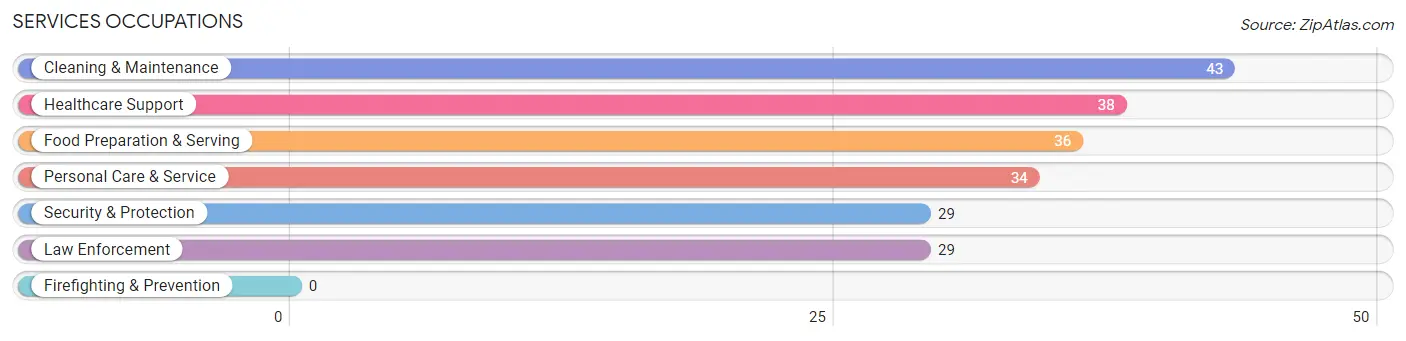
Services Occupations
The most common Services occupations in Schnecksville are Cleaning & Maintenance (43 | 2.3%), Healthcare Support (38 | 2.0%), Food Preparation & Serving (36 | 1.9%), Personal Care & Service (34 | 1.8%), and Security & Protection (29 | 1.5%).
Services Occupations by Sex
Within the Services occupations in Schnecksville, the most male-oriented occupations are Security & Protection (100.0%), Law Enforcement (100.0%), and Cleaning & Maintenance (88.4%), while the most female-oriented occupations are Healthcare Support (100.0%), Personal Care & Service (67.6%), and Food Preparation & Serving (27.8%).
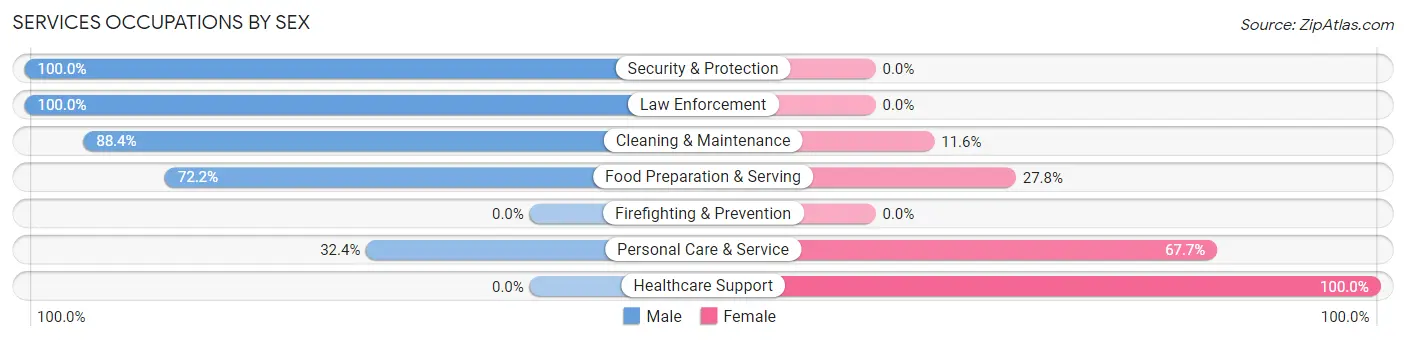
| Occupation | Male | Female |
| Healthcare Support | 0 (0.0%) | 38 (100.0%) |
| Security & Protection | 29 (100.0%) | 0 (0.0%) |
| Firefighting & Prevention | 0 (0.0%) | 0 (0.0%) |
| Law Enforcement | 29 (100.0%) | 0 (0.0%) |
| Food Preparation & Serving | 26 (72.2%) | 10 (27.8%) |
| Cleaning & Maintenance | 38 (88.4%) | 5 (11.6%) |
| Personal Care & Service | 11 (32.4%) | 23 (67.6%) |
| Total (Category) | 104 (57.8%) | 76 (42.2%) |
| Total (Overall) | 833 (43.8%) | 1,071 (56.2%) |
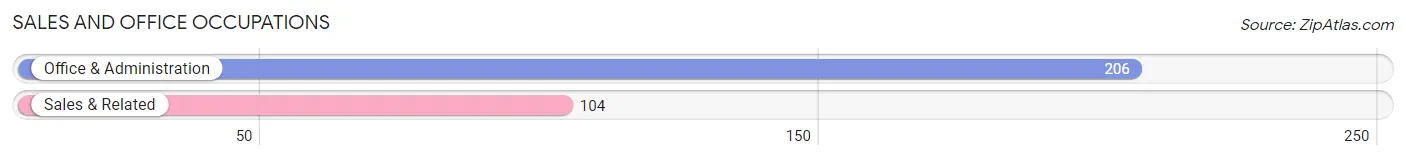
Sales and Office Occupations
The most common Sales and Office occupations in Schnecksville are Office & Administration (206 | 10.8%), and Sales & Related (104 | 5.5%).
Sales and Office Occupations by Sex
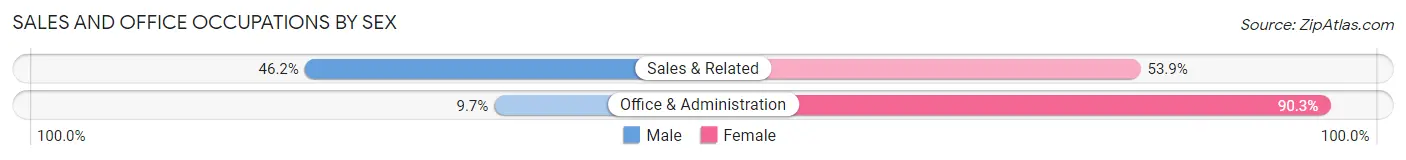
| Occupation | Male | Female |
| Sales & Related | 48 (46.2%) | 56 (53.8%) |
| Office & Administration | 20 (9.7%) | 186 (90.3%) |
| Total (Category) | 68 (21.9%) | 242 (78.1%) |
| Total (Overall) | 833 (43.8%) | 1,071 (56.2%) |
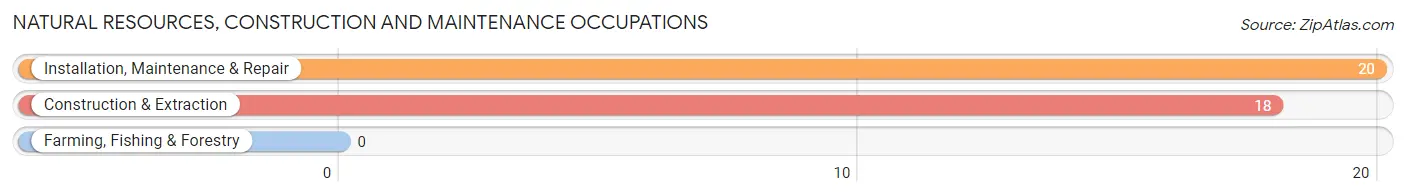
Natural Resources, Construction and Maintenance Occupations
The most common Natural Resources, Construction and Maintenance occupations in Schnecksville are Installation, Maintenance & Repair (20 | 1.1%), and Construction & Extraction (18 | 0.9%).
Natural Resources, Construction and Maintenance Occupations by Sex
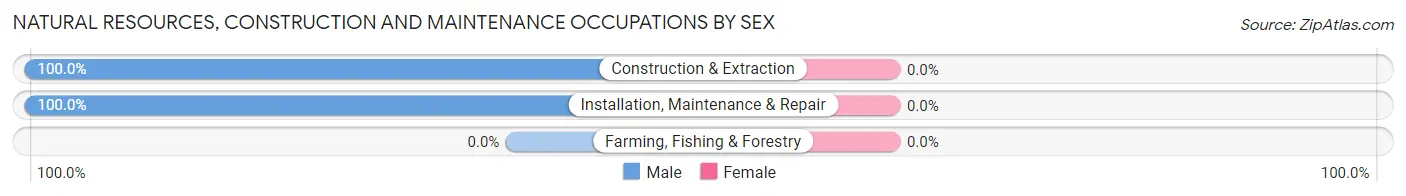
| Occupation | Male | Female |
| Farming, Fishing & Forestry | 0 (0.0%) | 0 (0.0%) |
| Construction & Extraction | 18 (100.0%) | 0 (0.0%) |
| Installation, Maintenance & Repair | 20 (100.0%) | 0 (0.0%) |
| Total (Category) | 38 (100.0%) | 0 (0.0%) |
| Total (Overall) | 833 (43.8%) | 1,071 (56.2%) |
Production, Transportation and Moving Occupations
The most common Production, Transportation and Moving occupations in Schnecksville are Production (74 | 3.9%), Transportation (54 | 2.8%), and Material Moving (28 | 1.5%).
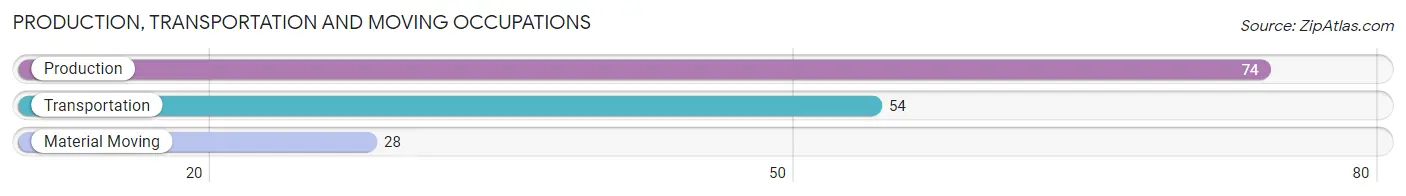
Production, Transportation and Moving Occupations by Sex
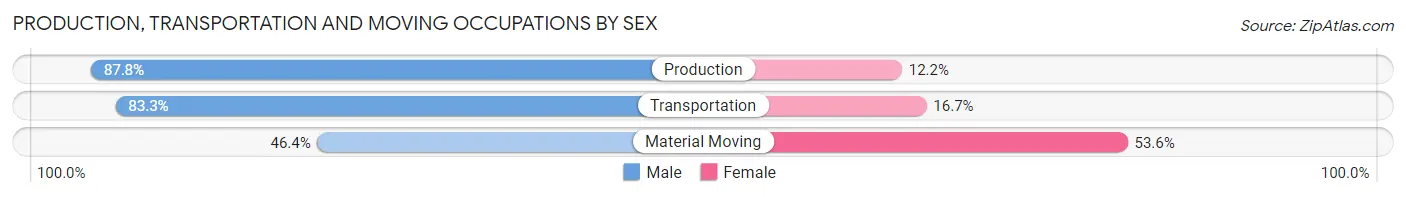
| Occupation | Male | Female |
| Production | 65 (87.8%) | 9 (12.2%) |
| Transportation | 45 (83.3%) | 9 (16.7%) |
| Material Moving | 13 (46.4%) | 15 (53.6%) |
| Total (Category) | 123 (78.8%) | 33 (21.1%) |
| Total (Overall) | 833 (43.8%) | 1,071 (56.2%) |
Employment Industries by Sex in Schnecksville
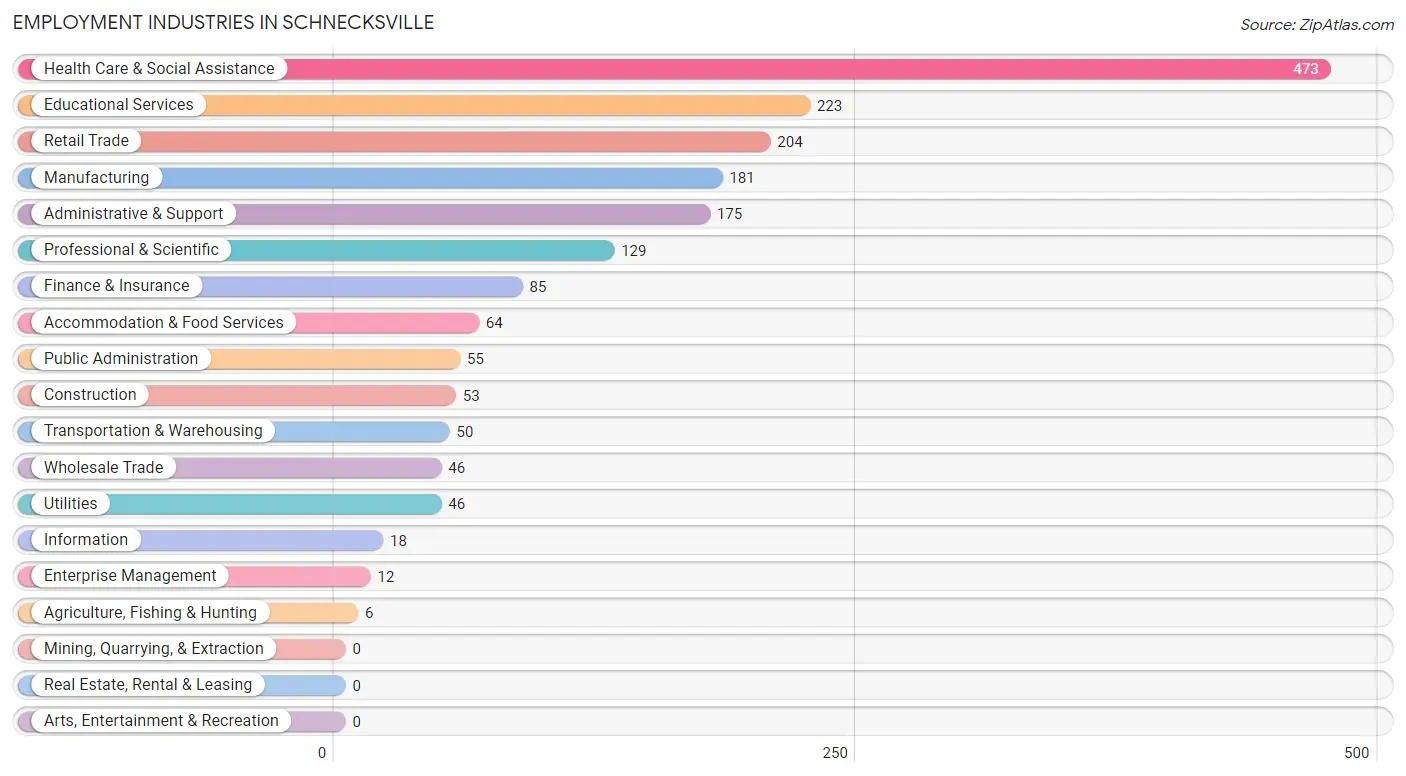
Employment Industries in Schnecksville
The major employment industries in Schnecksville include Health Care & Social Assistance (473 | 24.8%), Educational Services (223 | 11.7%), Retail Trade (204 | 10.7%), Manufacturing (181 | 9.5%), and Administrative & Support (175 | 9.2%).
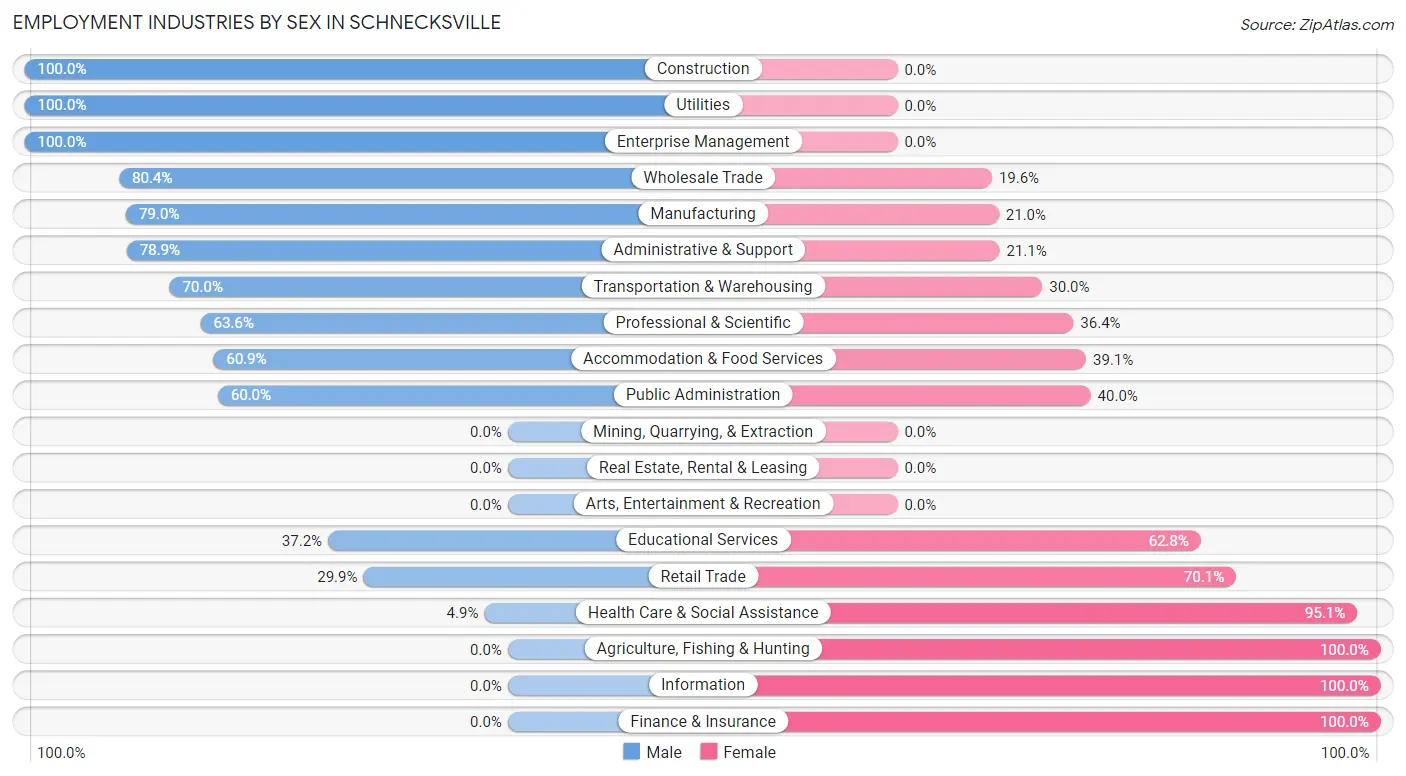
Employment Industries by Sex in Schnecksville
The Schnecksville industries that see more men than women are Construction (100.0%), Utilities (100.0%), and Enterprise Management (100.0%), whereas the industries that tend to have a higher number of women are Agriculture, Fishing & Hunting (100.0%), Information (100.0%), and Finance & Insurance (100.0%).
| Industry | Male | Female |
| Agriculture, Fishing & Hunting | 0 (0.0%) | 6 (100.0%) |
| Mining, Quarrying, & Extraction | 0 (0.0%) | 0 (0.0%) |
| Construction | 53 (100.0%) | 0 (0.0%) |
| Manufacturing | 143 (79.0%) | 38 (21.0%) |
| Wholesale Trade | 37 (80.4%) | 9 (19.6%) |
| Retail Trade | 61 (29.9%) | 143 (70.1%) |
| Transportation & Warehousing | 35 (70.0%) | 15 (30.0%) |
| Utilities | 46 (100.0%) | 0 (0.0%) |
| Information | 0 (0.0%) | 18 (100.0%) |
| Finance & Insurance | 0 (0.0%) | 85 (100.0%) |
| Real Estate, Rental & Leasing | 0 (0.0%) | 0 (0.0%) |
| Professional & Scientific | 82 (63.6%) | 47 (36.4%) |
| Enterprise Management | 12 (100.0%) | 0 (0.0%) |
| Administrative & Support | 138 (78.9%) | 37 (21.1%) |
| Educational Services | 83 (37.2%) | 140 (62.8%) |
| Health Care & Social Assistance | 23 (4.9%) | 450 (95.1%) |
| Arts, Entertainment & Recreation | 0 (0.0%) | 0 (0.0%) |
| Accommodation & Food Services | 39 (60.9%) | 25 (39.1%) |
| Public Administration | 33 (60.0%) | 22 (40.0%) |
| Total | 833 (43.8%) | 1,071 (56.2%) |
Education in Schnecksville
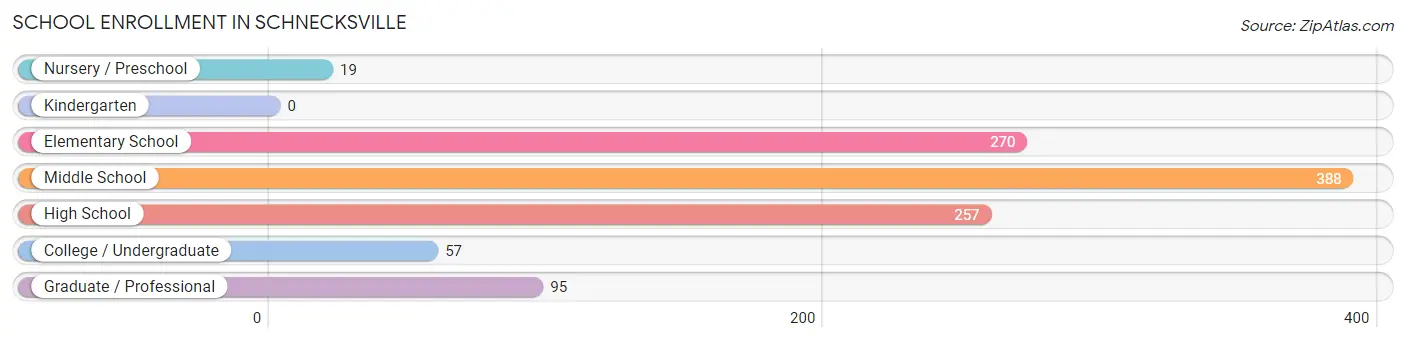
School Enrollment in Schnecksville
The most common levels of schooling among the 1,086 students in Schnecksville are middle school (388 | 35.7%), elementary school (270 | 24.9%), and high school (257 | 23.7%).
| School Level | # Students | % Students |
| Nursery / Preschool | 19 | 1.8% |
| Kindergarten | 0 | 0.0% |
| Elementary School | 270 | 24.9% |
| Middle School | 388 | 35.7% |
| High School | 257 | 23.7% |
| College / Undergraduate | 57 | 5.2% |
| Graduate / Professional | 95 | 8.7% |
| Total | 1,086 | 100.0% |
School Enrollment by Age by Funding Source in Schnecksville
Out of a total of 1,086 students who are enrolled in schools in Schnecksville, 162 (14.9%) attend a private institution, while the remaining 924 (85.1%) are enrolled in public schools. The age group of 20 to 24 year olds has the highest likelihood of being enrolled in private schools, with 22 (100.0% in the age bracket) enrolled. Conversely, the age group of 3 to 4 year olds has the lowest likelihood of being enrolled in a private school, with 9 (100.0% in the age bracket) attending a public institution.
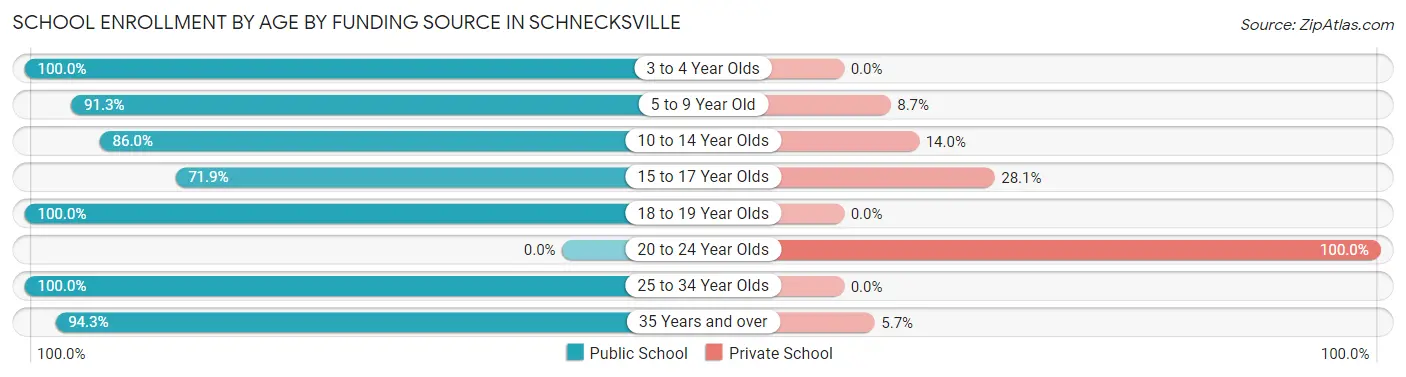
| Age Bracket | Public School | Private School |
| 3 to 4 Year Olds | 9 (100.0%) | 0 (0.0%) |
| 5 to 9 Year Old | 242 (91.3%) | 23 (8.7%) |
| 10 to 14 Year Olds | 357 (86.0%) | 58 (14.0%) |
| 15 to 17 Year Olds | 141 (71.9%) | 55 (28.1%) |
| 18 to 19 Year Olds | 79 (100.0%) | 0 (0.0%) |
| 20 to 24 Year Olds | 0 (0.0%) | 22 (100.0%) |
| 25 to 34 Year Olds | 30 (100.0%) | 0 (0.0%) |
| 35 Years and over | 66 (94.3%) | 4 (5.7%) |
| Total | 924 (85.1%) | 162 (14.9%) |
Educational Attainment by Field of Study in Schnecksville
Education (344 | 31.2%), business (215 | 19.5%), psychology (114 | 10.3%), science & technology (112 | 10.2%), and engineering (107 | 9.7%) are the most common fields of study among 1,101 individuals in Schnecksville who have obtained a bachelor's degree or higher.
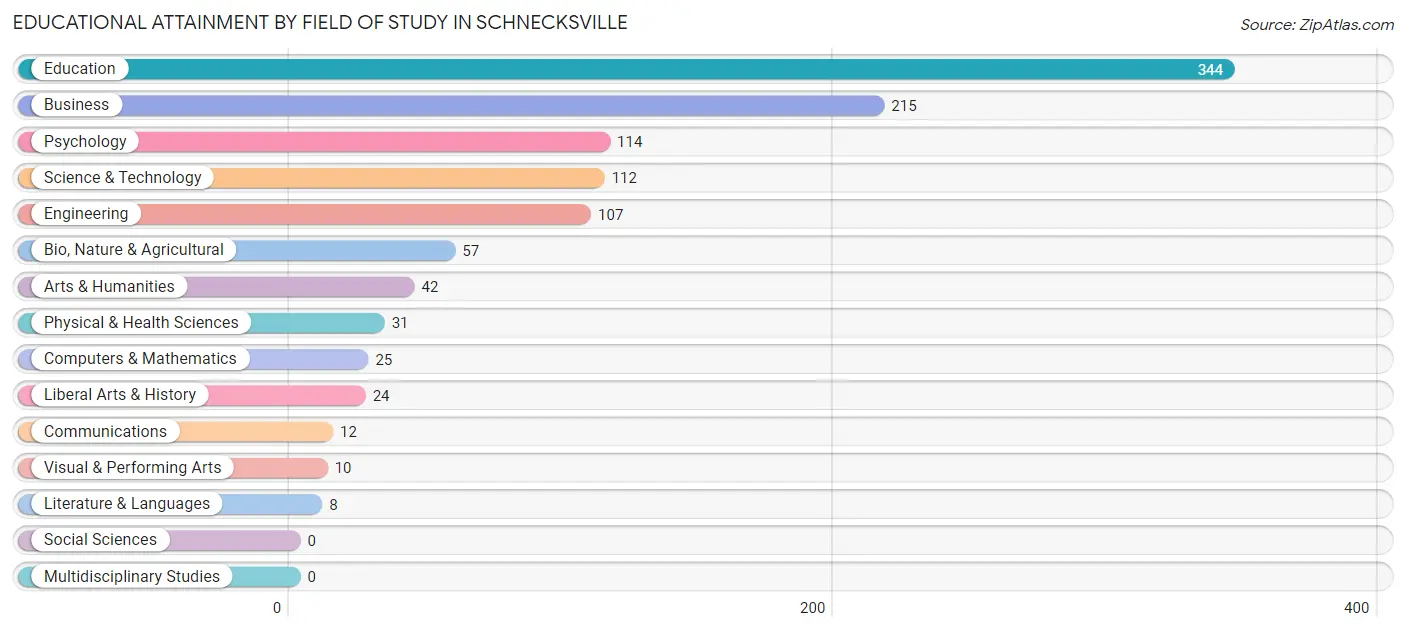
| Field of Study | # Graduates | % Graduates |
| Computers & Mathematics | 25 | 2.3% |
| Bio, Nature & Agricultural | 57 | 5.2% |
| Physical & Health Sciences | 31 | 2.8% |
| Psychology | 114 | 10.3% |
| Social Sciences | 0 | 0.0% |
| Engineering | 107 | 9.7% |
| Multidisciplinary Studies | 0 | 0.0% |
| Science & Technology | 112 | 10.2% |
| Business | 215 | 19.5% |
| Education | 344 | 31.2% |
| Literature & Languages | 8 | 0.7% |
| Liberal Arts & History | 24 | 2.2% |
| Visual & Performing Arts | 10 | 0.9% |
| Communications | 12 | 1.1% |
| Arts & Humanities | 42 | 3.8% |
| Total | 1,101 | 100.0% |
Transportation & Commute in Schnecksville
Vehicle Availability by Sex in Schnecksville
The most prevalent vehicle ownership categories in Schnecksville are males with 2 vehicles (406, accounting for 48.7%) and females with 2 vehicles (452, making up 40.0%).
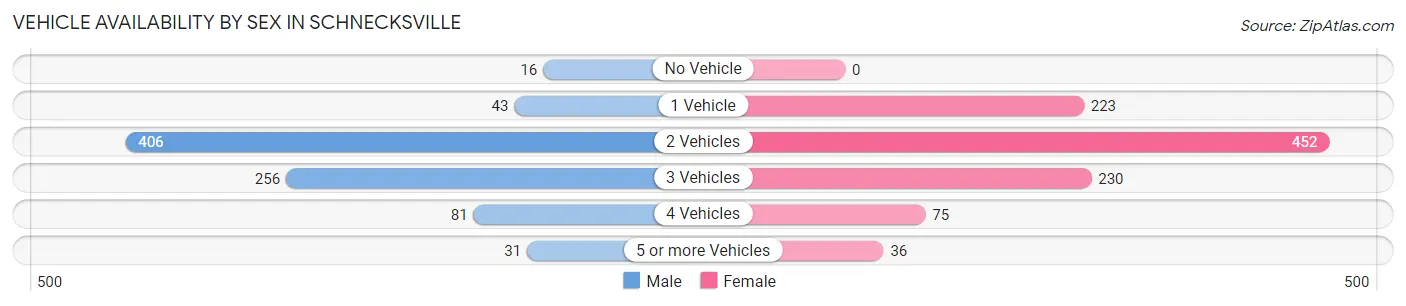
| Vehicles Available | Male | Female |
| No Vehicle | 16 (1.9%) | 0 (0.0%) |
| 1 Vehicle | 43 (5.2%) | 223 (22.0%) |
| 2 Vehicles | 406 (48.7%) | 452 (44.5%) |
| 3 Vehicles | 256 (30.7%) | 230 (22.6%) |
| 4 Vehicles | 81 (9.7%) | 75 (7.4%) |
| 5 or more Vehicles | 31 (3.7%) | 36 (3.5%) |
| Total | 833 (100.0%) | 1,016 (100.0%) |
Commute Time in Schnecksville
The most frequently occuring commute durations in Schnecksville are 20 to 24 minutes (328 commuters, 21.2%), 15 to 19 minutes (260 commuters, 16.8%), and 30 to 34 minutes (248 commuters, 16.0%).
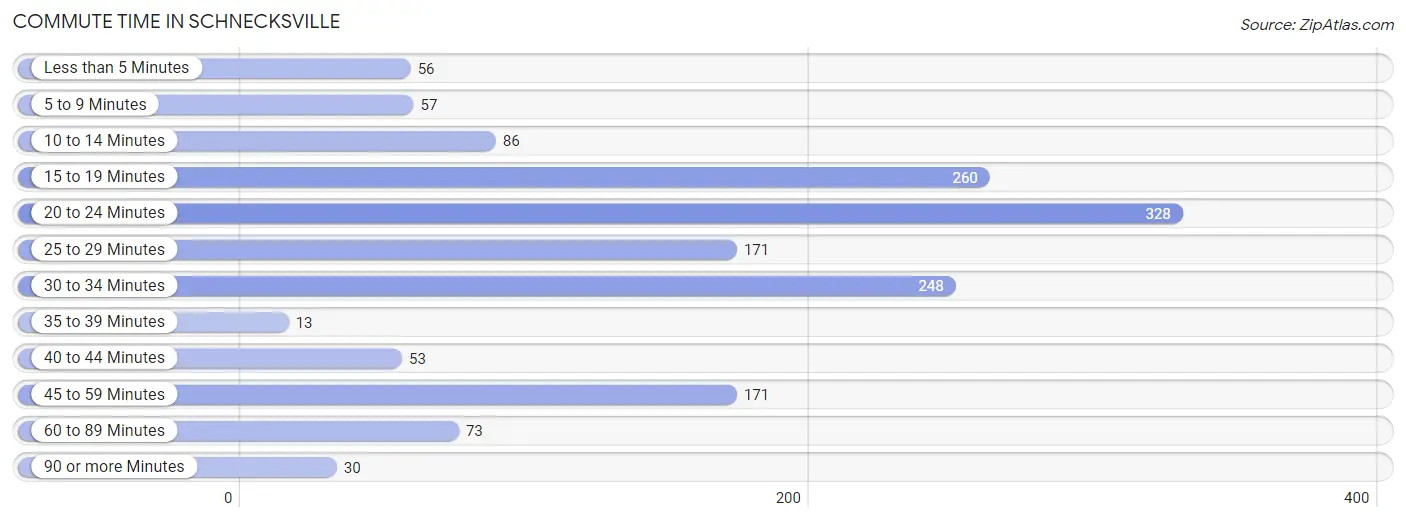
| Commute Time | # Commuters | % Commuters |
| Less than 5 Minutes | 56 | 3.6% |
| 5 to 9 Minutes | 57 | 3.7% |
| 10 to 14 Minutes | 86 | 5.6% |
| 15 to 19 Minutes | 260 | 16.8% |
| 20 to 24 Minutes | 328 | 21.2% |
| 25 to 29 Minutes | 171 | 11.1% |
| 30 to 34 Minutes | 248 | 16.0% |
| 35 to 39 Minutes | 13 | 0.8% |
| 40 to 44 Minutes | 53 | 3.4% |
| 45 to 59 Minutes | 171 | 11.1% |
| 60 to 89 Minutes | 73 | 4.7% |
| 90 or more Minutes | 30 | 1.9% |
Commute Time by Sex in Schnecksville
The most common commute times in Schnecksville are 30 to 34 minutes (141 commuters, 22.7%) for males and 20 to 24 minutes (271 commuters, 29.3%) for females.
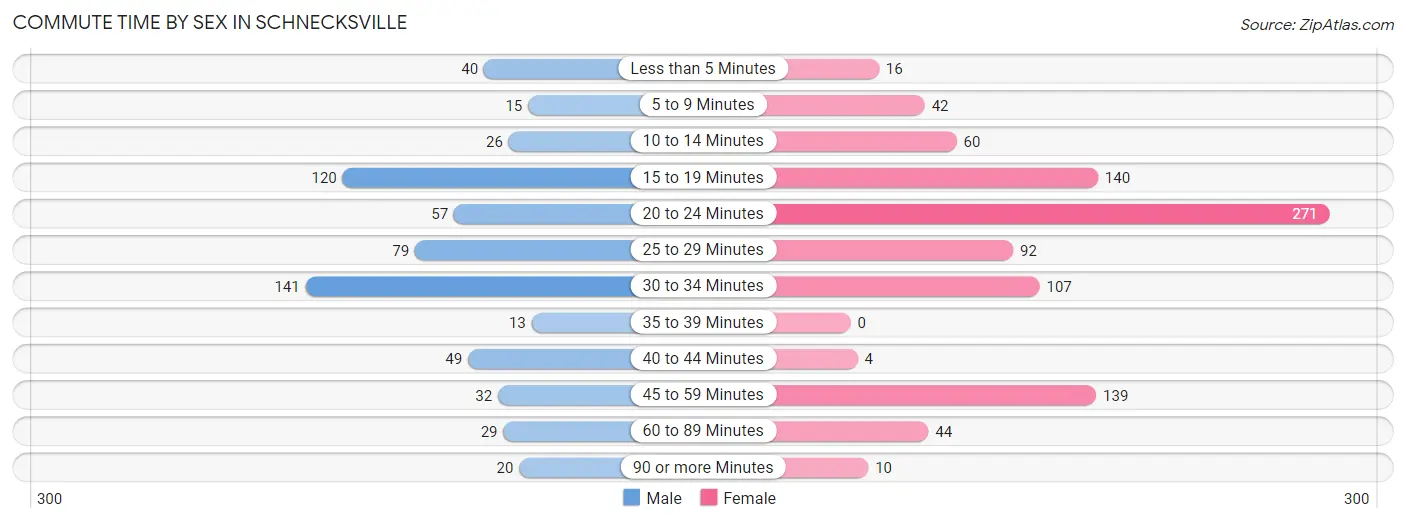
| Commute Time | Male | Female |
| Less than 5 Minutes | 40 (6.4%) | 16 (1.7%) |
| 5 to 9 Minutes | 15 (2.4%) | 42 (4.5%) |
| 10 to 14 Minutes | 26 (4.2%) | 60 (6.5%) |
| 15 to 19 Minutes | 120 (19.3%) | 140 (15.1%) |
| 20 to 24 Minutes | 57 (9.2%) | 271 (29.3%) |
| 25 to 29 Minutes | 79 (12.7%) | 92 (10.0%) |
| 30 to 34 Minutes | 141 (22.7%) | 107 (11.6%) |
| 35 to 39 Minutes | 13 (2.1%) | 0 (0.0%) |
| 40 to 44 Minutes | 49 (7.9%) | 4 (0.4%) |
| 45 to 59 Minutes | 32 (5.1%) | 139 (15.0%) |
| 60 to 89 Minutes | 29 (4.7%) | 44 (4.8%) |
| 90 or more Minutes | 20 (3.2%) | 10 (1.1%) |
Time of Departure to Work by Sex in Schnecksville
The most frequent times of departure to work in Schnecksville are 7:00 AM to 7:29 AM (144, 23.2%) for males and 7:00 AM to 7:29 AM (165, 17.8%) for females.
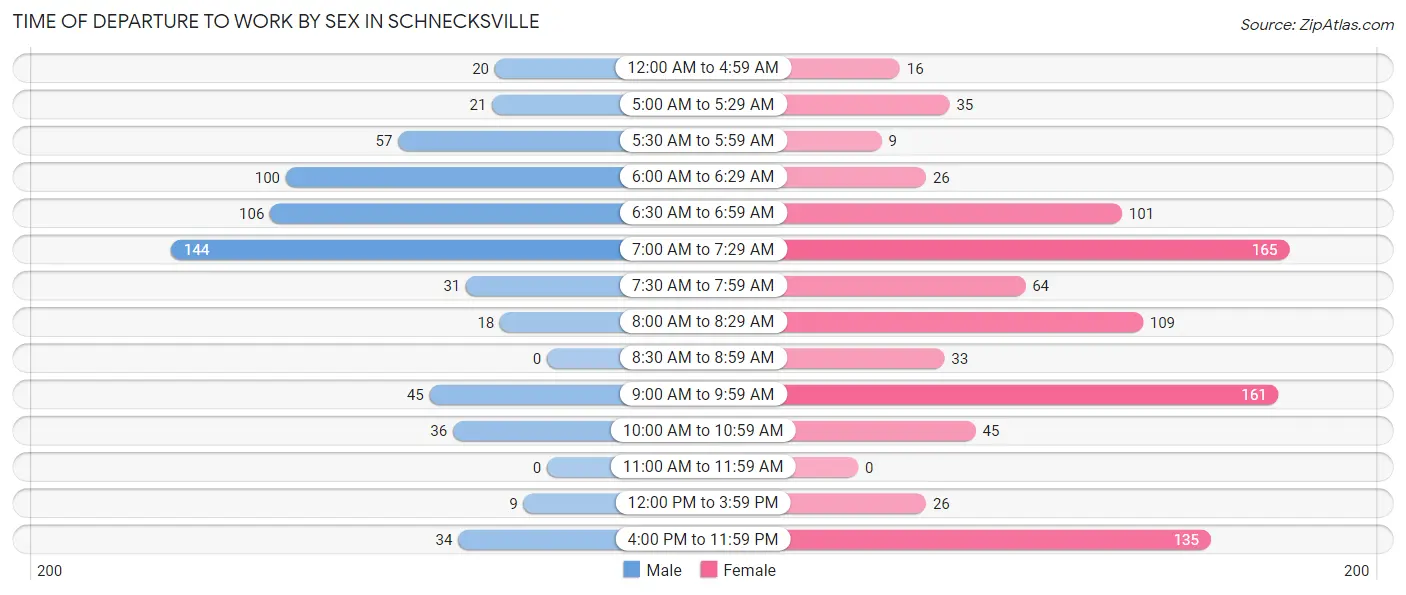
| Time of Departure | Male | Female |
| 12:00 AM to 4:59 AM | 20 (3.2%) | 16 (1.7%) |
| 5:00 AM to 5:29 AM | 21 (3.4%) | 35 (3.8%) |
| 5:30 AM to 5:59 AM | 57 (9.2%) | 9 (1.0%) |
| 6:00 AM to 6:29 AM | 100 (16.1%) | 26 (2.8%) |
| 6:30 AM to 6:59 AM | 106 (17.1%) | 101 (10.9%) |
| 7:00 AM to 7:29 AM | 144 (23.2%) | 165 (17.8%) |
| 7:30 AM to 7:59 AM | 31 (5.0%) | 64 (6.9%) |
| 8:00 AM to 8:29 AM | 18 (2.9%) | 109 (11.8%) |
| 8:30 AM to 8:59 AM | 0 (0.0%) | 33 (3.6%) |
| 9:00 AM to 9:59 AM | 45 (7.2%) | 161 (17.4%) |
| 10:00 AM to 10:59 AM | 36 (5.8%) | 45 (4.9%) |
| 11:00 AM to 11:59 AM | 0 (0.0%) | 0 (0.0%) |
| 12:00 PM to 3:59 PM | 9 (1.5%) | 26 (2.8%) |
| 4:00 PM to 11:59 PM | 34 (5.5%) | 135 (14.6%) |
| Total | 621 (100.0%) | 925 (100.0%) |
Housing Occupancy in Schnecksville
Occupancy by Ownership in Schnecksville
Of the total 1,451 dwellings in Schnecksville, owner-occupied units account for 1,125 (77.5%), while renter-occupied units make up 326 (22.5%).
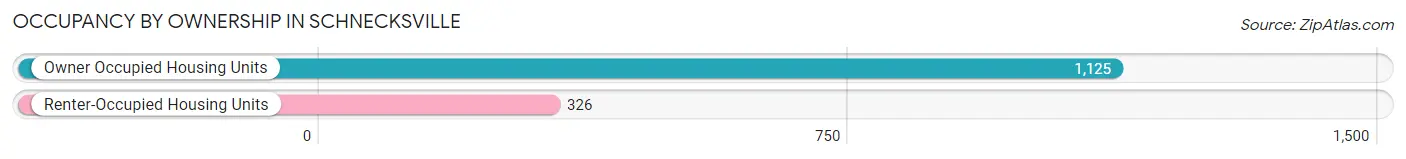
| Occupancy | # Housing Units | % Housing Units |
| Owner Occupied Housing Units | 1,125 | 77.5% |
| Renter-Occupied Housing Units | 326 | 22.5% |
| Total Occupied Housing Units | 1,451 | 100.0% |
Occupancy by Household Size in Schnecksville
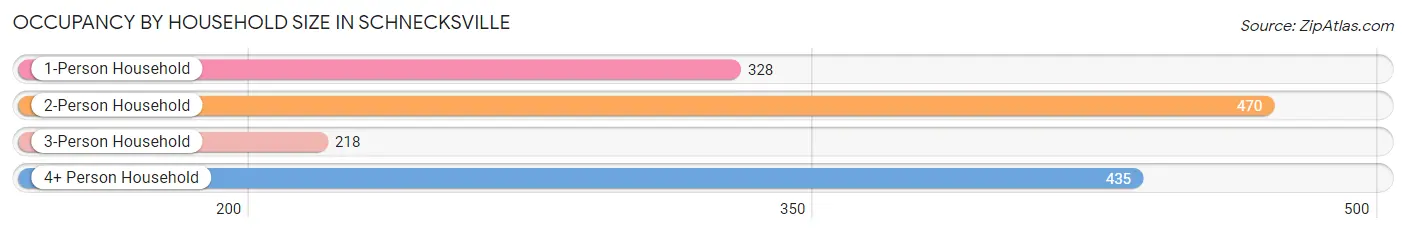
| Household Size | # Housing Units | % Housing Units |
| 1-Person Household | 328 | 22.6% |
| 2-Person Household | 470 | 32.4% |
| 3-Person Household | 218 | 15.0% |
| 4+ Person Household | 435 | 30.0% |
| Total Housing Units | 1,451 | 100.0% |
Occupancy by Ownership by Household Size in Schnecksville
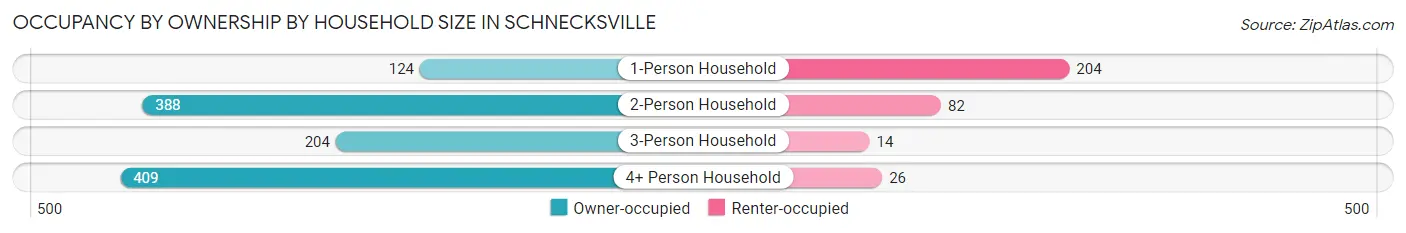
| Household Size | Owner-occupied | Renter-occupied |
| 1-Person Household | 124 (37.8%) | 204 (62.2%) |
| 2-Person Household | 388 (82.6%) | 82 (17.4%) |
| 3-Person Household | 204 (93.6%) | 14 (6.4%) |
| 4+ Person Household | 409 (94.0%) | 26 (6.0%) |
| Total Housing Units | 1,125 (77.5%) | 326 (22.5%) |
Occupancy by Educational Attainment in Schnecksville
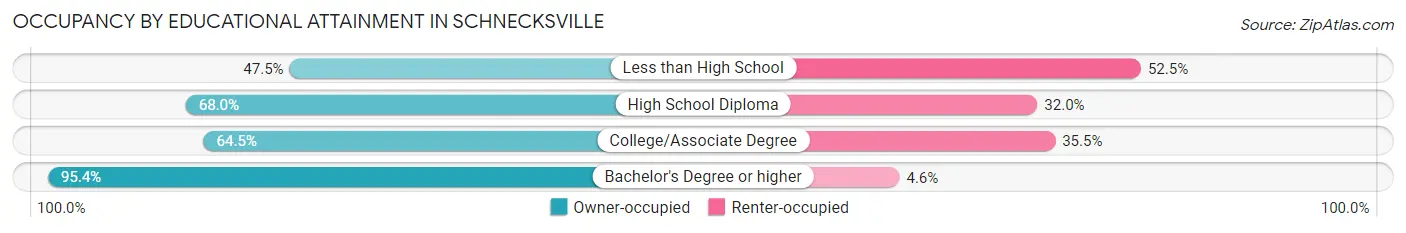
| Household Size | Owner-occupied | Renter-occupied |
| Less than High School | 38 (47.5%) | 42 (52.5%) |
| High School Diploma | 183 (68.0%) | 86 (32.0%) |
| College/Associate Degree | 307 (64.5%) | 169 (35.5%) |
| Bachelor's Degree or higher | 597 (95.4%) | 29 (4.6%) |
Occupancy by Age of Householder in Schnecksville
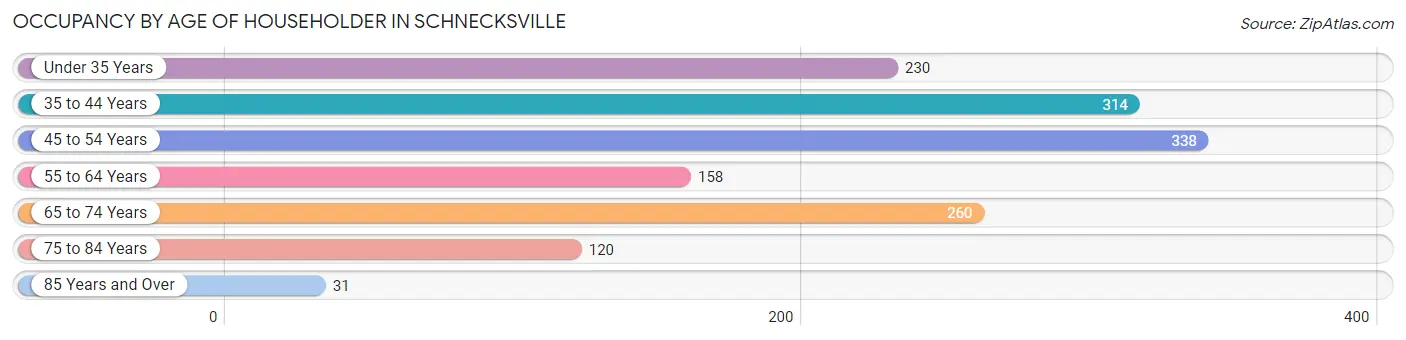
| Age Bracket | # Households | % Households |
| Under 35 Years | 230 | 15.9% |
| 35 to 44 Years | 314 | 21.6% |
| 45 to 54 Years | 338 | 23.3% |
| 55 to 64 Years | 158 | 10.9% |
| 65 to 74 Years | 260 | 17.9% |
| 75 to 84 Years | 120 | 8.3% |
| 85 Years and Over | 31 | 2.1% |
| Total | 1,451 | 100.0% |
Housing Finances in Schnecksville
Median Income by Occupancy in Schnecksville
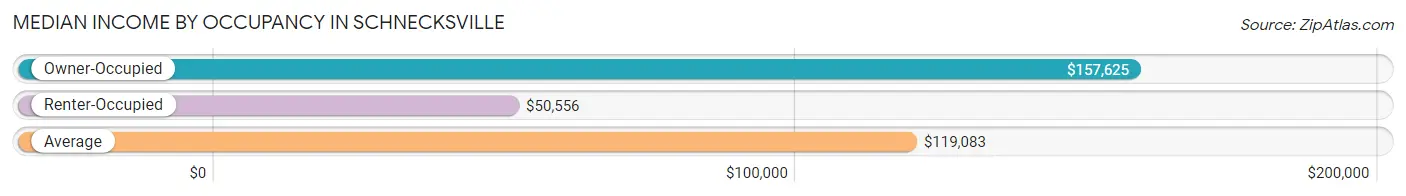
| Occupancy Type | # Households | Median Income |
| Owner-Occupied | 1,125 (77.5%) | $157,625 |
| Renter-Occupied | 326 (22.5%) | $50,556 |
| Average | 1,451 (100.0%) | $119,083 |
Occupancy by Householder Income Bracket in Schnecksville
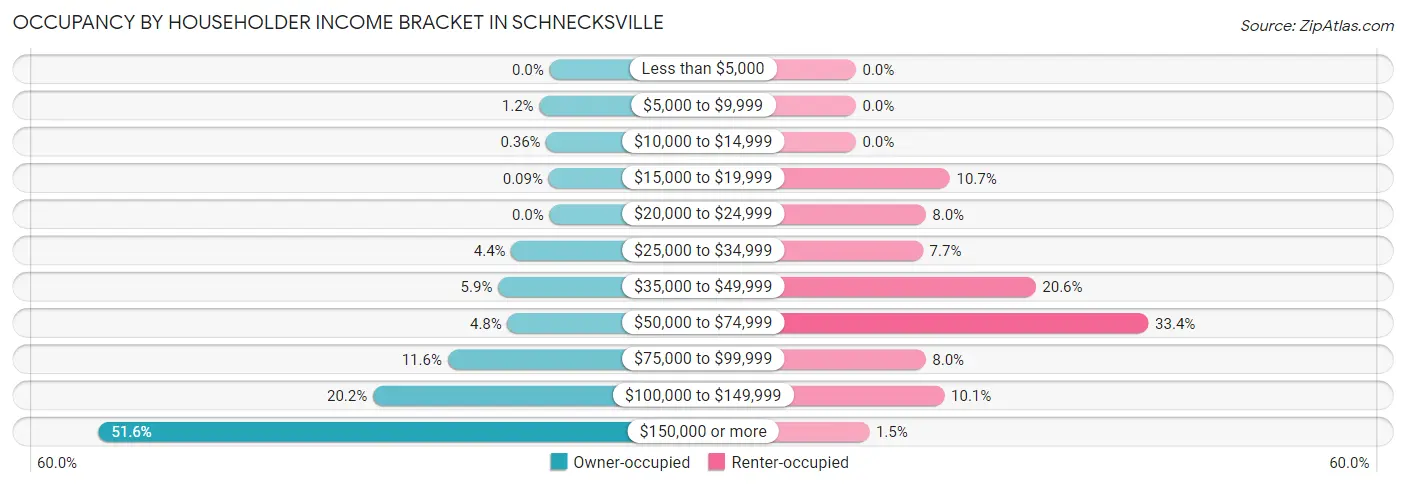
| Income Bracket | Owner-occupied | Renter-occupied |
| Less than $5,000 | 0 (0.0%) | 0 (0.0%) |
| $5,000 to $9,999 | 13 (1.2%) | 0 (0.0%) |
| $10,000 to $14,999 | 4 (0.4%) | 0 (0.0%) |
| $15,000 to $19,999 | 1 (0.1%) | 35 (10.7%) |
| $20,000 to $24,999 | 0 (0.0%) | 26 (8.0%) |
| $25,000 to $34,999 | 49 (4.4%) | 25 (7.7%) |
| $35,000 to $49,999 | 66 (5.9%) | 67 (20.5%) |
| $50,000 to $74,999 | 54 (4.8%) | 109 (33.4%) |
| $75,000 to $99,999 | 131 (11.6%) | 26 (8.0%) |
| $100,000 to $149,999 | 227 (20.2%) | 33 (10.1%) |
| $150,000 or more | 580 (51.6%) | 5 (1.5%) |
| Total | 1,125 (100.0%) | 326 (100.0%) |
Monthly Housing Cost Tiers in Schnecksville
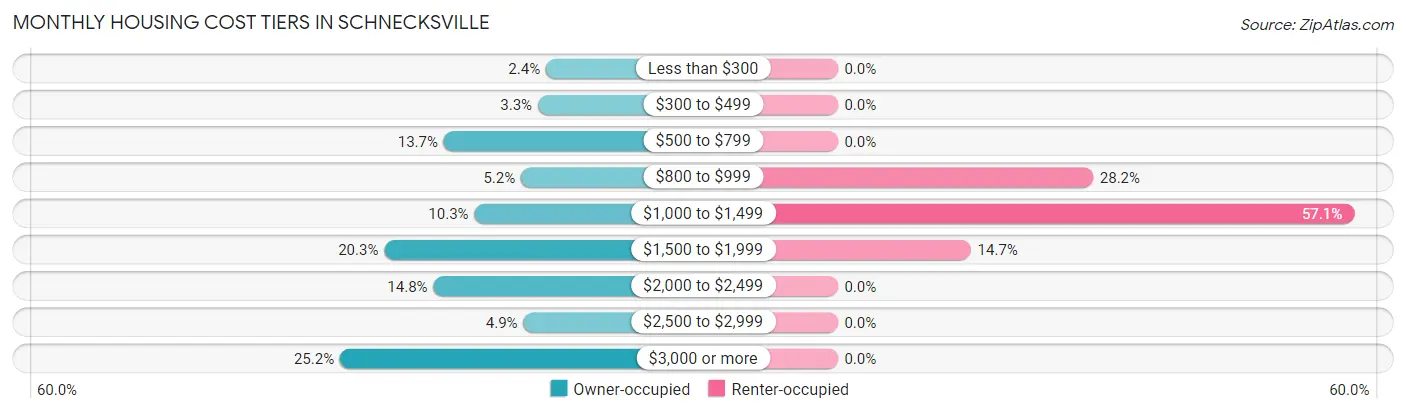
| Monthly Cost | Owner-occupied | Renter-occupied |
| Less than $300 | 27 (2.4%) | 0 (0.0%) |
| $300 to $499 | 37 (3.3%) | 0 (0.0%) |
| $500 to $799 | 154 (13.7%) | 0 (0.0%) |
| $800 to $999 | 58 (5.2%) | 92 (28.2%) |
| $1,000 to $1,499 | 116 (10.3%) | 186 (57.1%) |
| $1,500 to $1,999 | 228 (20.3%) | 48 (14.7%) |
| $2,000 to $2,499 | 167 (14.8%) | 0 (0.0%) |
| $2,500 to $2,999 | 55 (4.9%) | 0 (0.0%) |
| $3,000 or more | 283 (25.2%) | 0 (0.0%) |
| Total | 1,125 (100.0%) | 326 (100.0%) |
Physical Housing Characteristics in Schnecksville
Housing Structures in Schnecksville
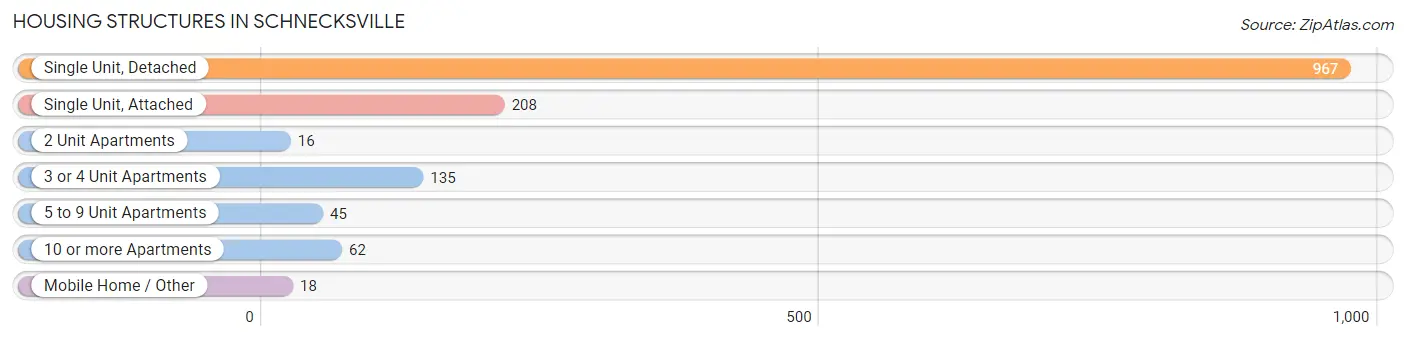
| Structure Type | # Housing Units | % Housing Units |
| Single Unit, Detached | 967 | 66.6% |
| Single Unit, Attached | 208 | 14.3% |
| 2 Unit Apartments | 16 | 1.1% |
| 3 or 4 Unit Apartments | 135 | 9.3% |
| 5 to 9 Unit Apartments | 45 | 3.1% |
| 10 or more Apartments | 62 | 4.3% |
| Mobile Home / Other | 18 | 1.2% |
| Total | 1,451 | 100.0% |
Housing Structures by Occupancy in Schnecksville
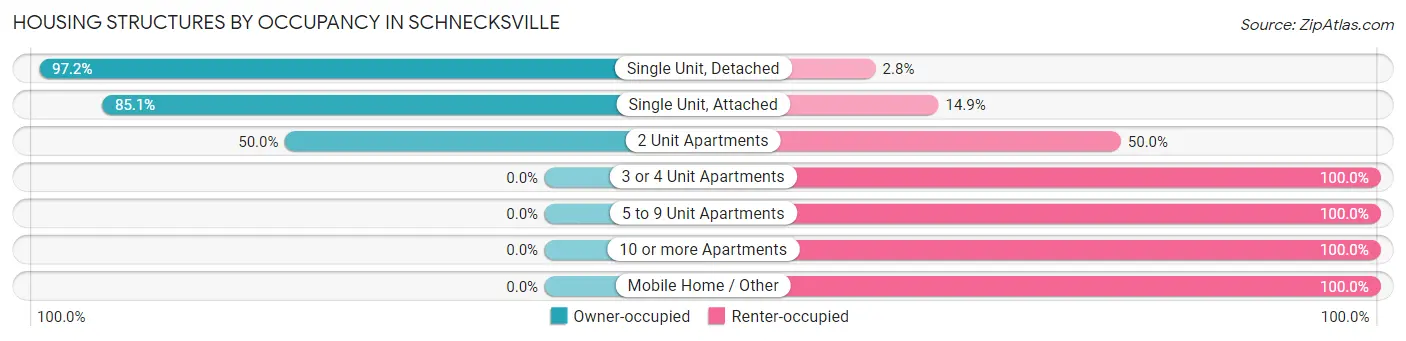
| Structure Type | Owner-occupied | Renter-occupied |
| Single Unit, Detached | 940 (97.2%) | 27 (2.8%) |
| Single Unit, Attached | 177 (85.1%) | 31 (14.9%) |
| 2 Unit Apartments | 8 (50.0%) | 8 (50.0%) |
| 3 or 4 Unit Apartments | 0 (0.0%) | 135 (100.0%) |
| 5 to 9 Unit Apartments | 0 (0.0%) | 45 (100.0%) |
| 10 or more Apartments | 0 (0.0%) | 62 (100.0%) |
| Mobile Home / Other | 0 (0.0%) | 18 (100.0%) |
| Total | 1,125 (77.5%) | 326 (22.5%) |
Housing Structures by Number of Rooms in Schnecksville
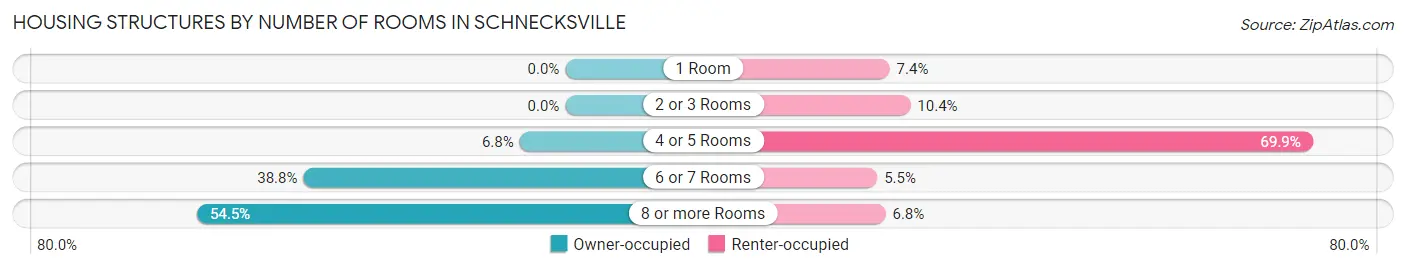
| Number of Rooms | Owner-occupied | Renter-occupied |
| 1 Room | 0 (0.0%) | 24 (7.4%) |
| 2 or 3 Rooms | 0 (0.0%) | 34 (10.4%) |
| 4 or 5 Rooms | 76 (6.8%) | 228 (69.9%) |
| 6 or 7 Rooms | 436 (38.8%) | 18 (5.5%) |
| 8 or more Rooms | 613 (54.5%) | 22 (6.8%) |
| Total | 1,125 (100.0%) | 326 (100.0%) |
Housing Structure by Heating Type in Schnecksville
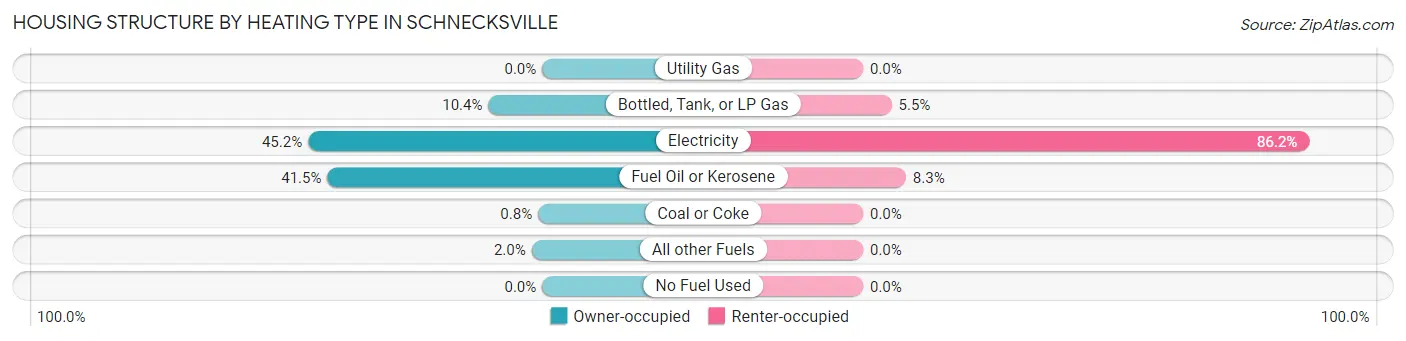
| Heating Type | Owner-occupied | Renter-occupied |
| Utility Gas | 0 (0.0%) | 0 (0.0%) |
| Bottled, Tank, or LP Gas | 117 (10.4%) | 18 (5.5%) |
| Electricity | 509 (45.2%) | 281 (86.2%) |
| Fuel Oil or Kerosene | 467 (41.5%) | 27 (8.3%) |
| Coal or Coke | 9 (0.8%) | 0 (0.0%) |
| All other Fuels | 23 (2.0%) | 0 (0.0%) |
| No Fuel Used | 0 (0.0%) | 0 (0.0%) |
| Total | 1,125 (100.0%) | 326 (100.0%) |
Household Vehicle Usage in Schnecksville
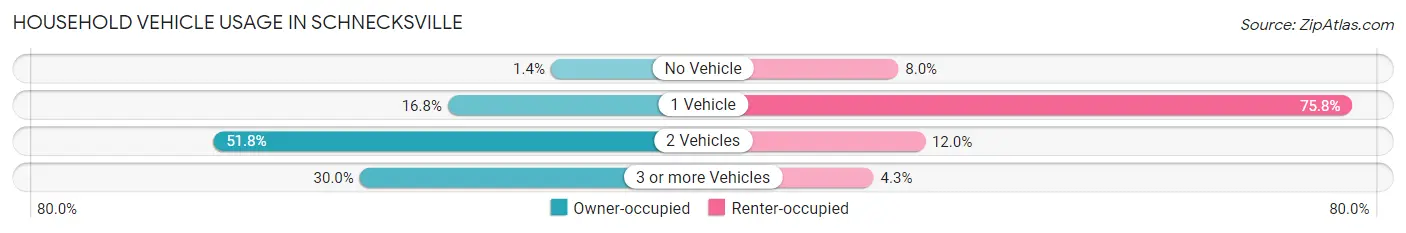
| Vehicles per Household | Owner-occupied | Renter-occupied |
| No Vehicle | 16 (1.4%) | 26 (8.0%) |
| 1 Vehicle | 189 (16.8%) | 247 (75.8%) |
| 2 Vehicles | 583 (51.8%) | 39 (12.0%) |
| 3 or more Vehicles | 337 (30.0%) | 14 (4.3%) |
| Total | 1,125 (100.0%) | 326 (100.0%) |
Real Estate & Mortgages in Schnecksville
Real Estate and Mortgage Overview in Schnecksville
| Characteristic | Without Mortgage | With Mortgage |
| Housing Units | 262 | 863 |
| Median Property Value | $262,400 | $347,900 |
| Median Household Income | $94,167 | $497 |
| Monthly Housing Costs | $708 | $283 |
| Real Estate Taxes | $4,303 | $7 |
Property Value by Mortgage Status in Schnecksville
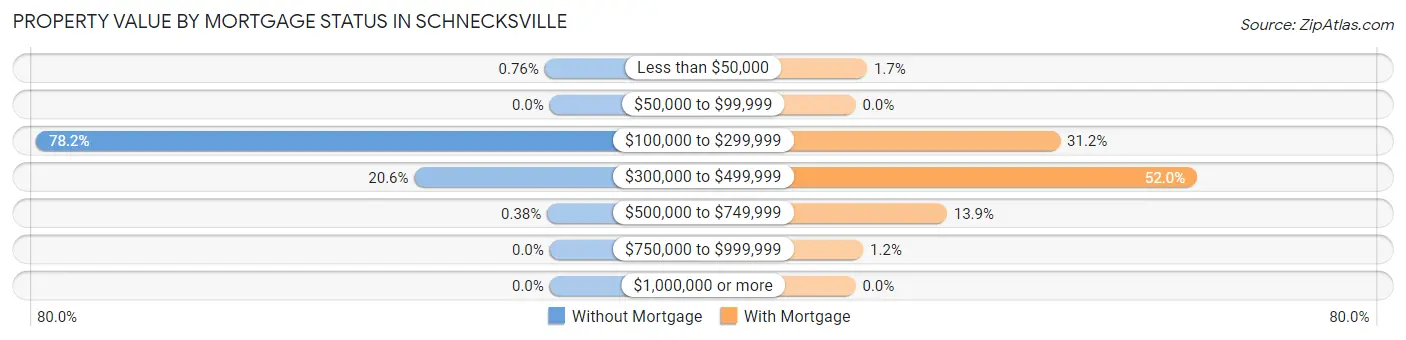
| Property Value | Without Mortgage | With Mortgage |
| Less than $50,000 | 2 (0.8%) | 15 (1.7%) |
| $50,000 to $99,999 | 0 (0.0%) | 0 (0.0%) |
| $100,000 to $299,999 | 205 (78.2%) | 269 (31.2%) |
| $300,000 to $499,999 | 54 (20.6%) | 449 (52.0%) |
| $500,000 to $749,999 | 1 (0.4%) | 120 (13.9%) |
| $750,000 to $999,999 | 0 (0.0%) | 10 (1.2%) |
| $1,000,000 or more | 0 (0.0%) | 0 (0.0%) |
| Total | 262 (100.0%) | 863 (100.0%) |
Household Income by Mortgage Status in Schnecksville
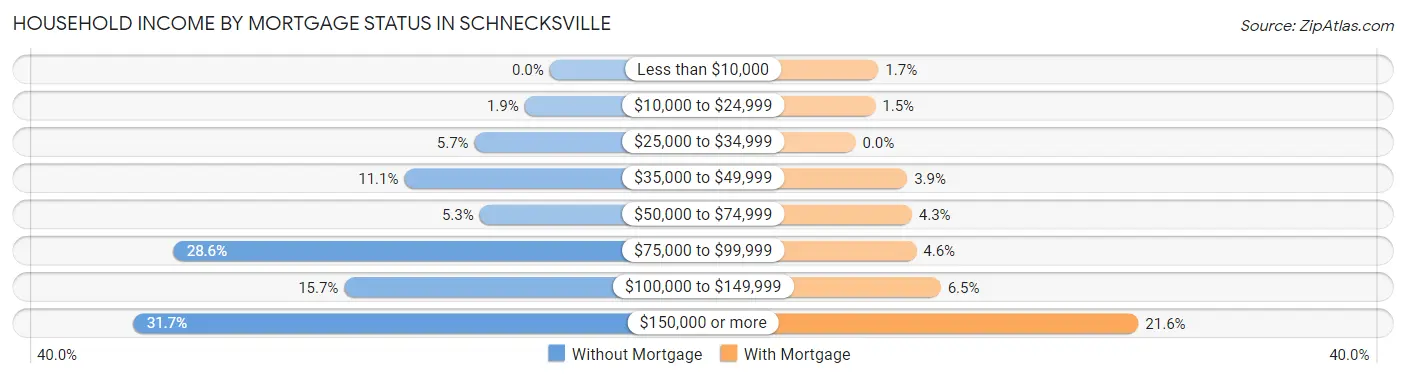
| Household Income | Without Mortgage | With Mortgage |
| Less than $10,000 | 0 (0.0%) | 15 (1.7%) |
| $10,000 to $24,999 | 5 (1.9%) | 13 (1.5%) |
| $25,000 to $34,999 | 15 (5.7%) | 0 (0.0%) |
| $35,000 to $49,999 | 29 (11.1%) | 34 (3.9%) |
| $50,000 to $74,999 | 14 (5.3%) | 37 (4.3%) |
| $75,000 to $99,999 | 75 (28.6%) | 40 (4.6%) |
| $100,000 to $149,999 | 41 (15.7%) | 56 (6.5%) |
| $150,000 or more | 83 (31.7%) | 186 (21.5%) |
| Total | 262 (100.0%) | 863 (100.0%) |
Property Value to Household Income Ratio in Schnecksville
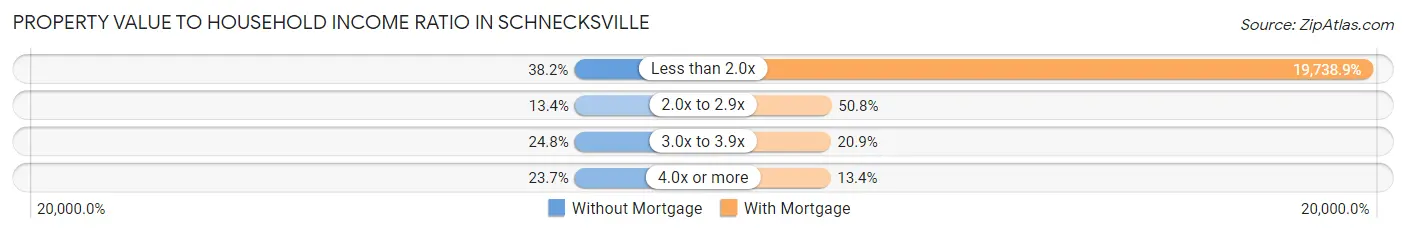
| Value-to-Income Ratio | Without Mortgage | With Mortgage |
| Less than 2.0x | 100 (38.2%) | 170,347 (19,738.9%) |
| 2.0x to 2.9x | 35 (13.4%) | 438 (50.7%) |
| 3.0x to 3.9x | 65 (24.8%) | 180 (20.9%) |
| 4.0x or more | 62 (23.7%) | 116 (13.4%) |
| Total | 262 (100.0%) | 863 (100.0%) |
Real Estate Taxes by Mortgage Status in Schnecksville
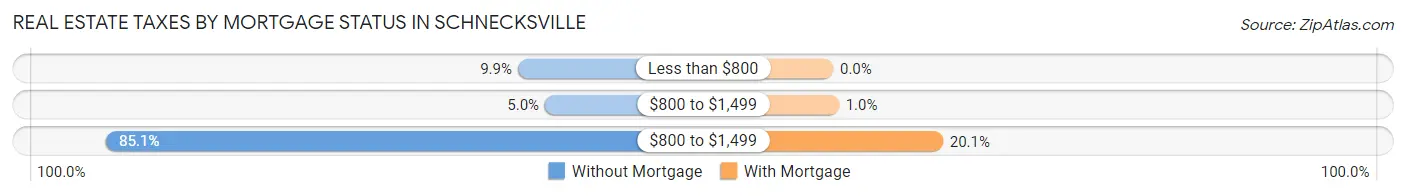
| Property Taxes | Without Mortgage | With Mortgage |
| Less than $800 | 26 (9.9%) | 0 (0.0%) |
| $800 to $1,499 | 13 (5.0%) | 9 (1.0%) |
| $800 to $1,499 | 223 (85.1%) | 173 (20.1%) |
| Total | 262 (100.0%) | 863 (100.0%) |
Health & Disability in Schnecksville
Health Insurance Coverage by Age in Schnecksville
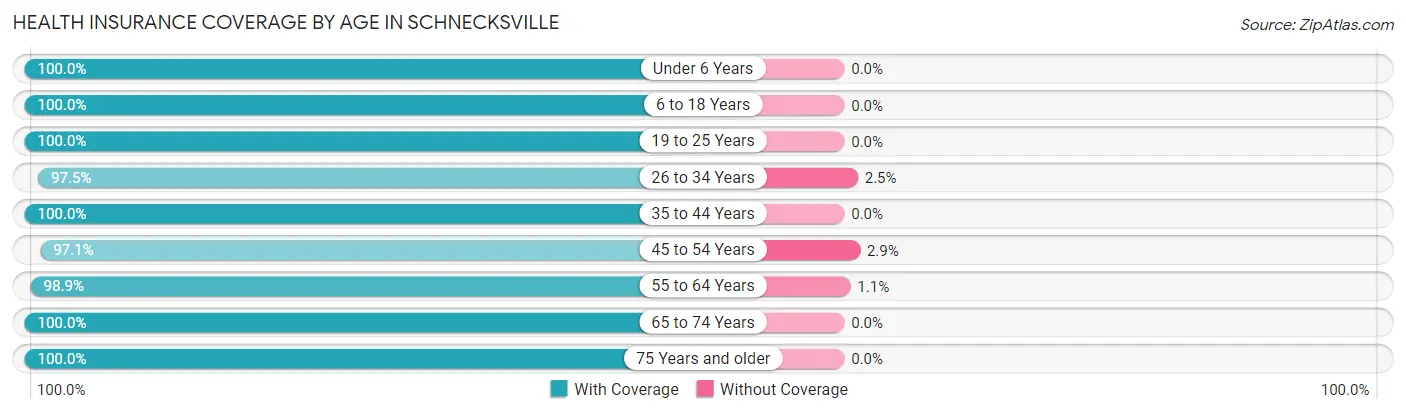
| Age Bracket | With Coverage | Without Coverage |
| Under 6 Years | 244 (100.0%) | 0 (0.0%) |
| 6 to 18 Years | 886 (100.0%) | 0 (0.0%) |
| 19 to 25 Years | 204 (100.0%) | 0 (0.0%) |
| 26 to 34 Years | 350 (97.5%) | 9 (2.5%) |
| 35 to 44 Years | 619 (100.0%) | 0 (0.0%) |
| 45 to 54 Years | 598 (97.1%) | 18 (2.9%) |
| 55 to 64 Years | 347 (98.9%) | 4 (1.1%) |
| 65 to 74 Years | 375 (100.0%) | 0 (0.0%) |
| 75 Years and older | 239 (100.0%) | 0 (0.0%) |
| Total | 3,862 (99.2%) | 31 (0.8%) |
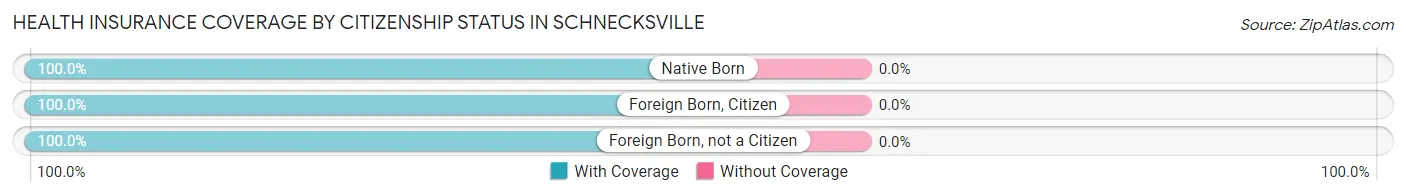
Health Insurance Coverage by Citizenship Status in Schnecksville
| Citizenship Status | With Coverage | Without Coverage |
| Native Born | 244 (100.0%) | 0 (0.0%) |
| Foreign Born, Citizen | 886 (100.0%) | 0 (0.0%) |
| Foreign Born, not a Citizen | 204 (100.0%) | 0 (0.0%) |
Health Insurance Coverage by Household Income in Schnecksville
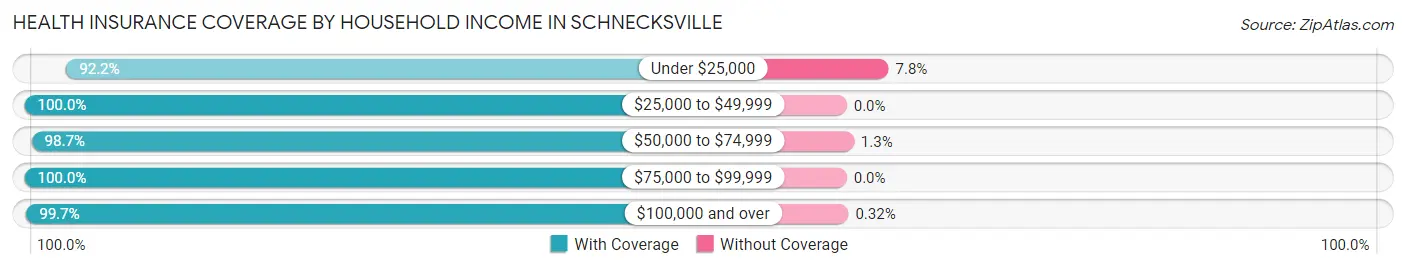
| Household Income | With Coverage | Without Coverage |
| Under $25,000 | 212 (92.2%) | 18 (7.8%) |
| $25,000 to $49,999 | 312 (100.0%) | 0 (0.0%) |
| $50,000 to $74,999 | 296 (98.7%) | 4 (1.3%) |
| $75,000 to $99,999 | 250 (100.0%) | 0 (0.0%) |
| $100,000 and over | 2,792 (99.7%) | 9 (0.3%) |
Public vs Private Health Insurance Coverage by Age in Schnecksville
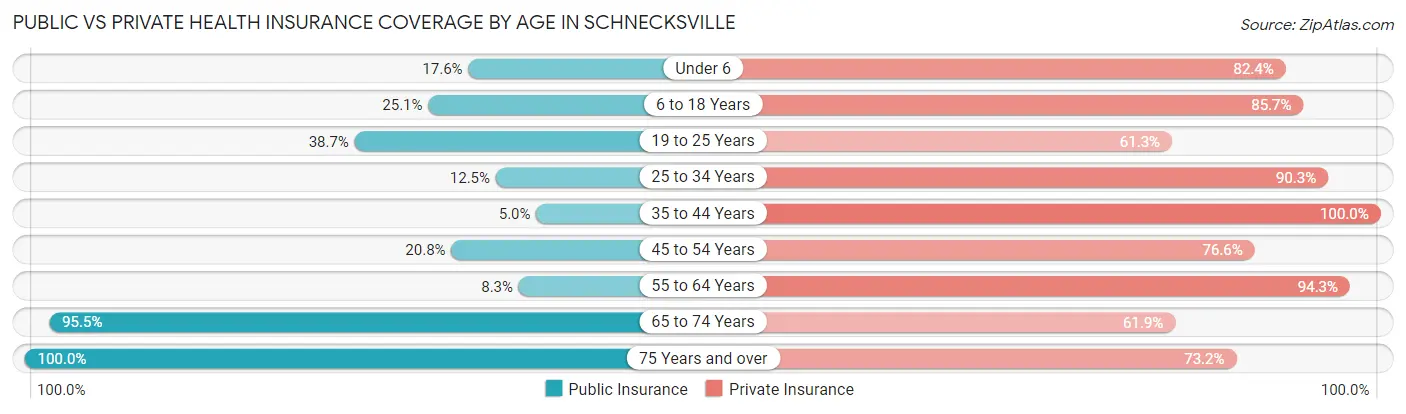
| Age Bracket | Public Insurance | Private Insurance |
| Under 6 | 43 (17.6%) | 201 (82.4%) |
| 6 to 18 Years | 222 (25.1%) | 759 (85.7%) |
| 19 to 25 Years | 79 (38.7%) | 125 (61.3%) |
| 25 to 34 Years | 45 (12.5%) | 324 (90.2%) |
| 35 to 44 Years | 31 (5.0%) | 619 (100.0%) |
| 45 to 54 Years | 128 (20.8%) | 472 (76.6%) |
| 55 to 64 Years | 29 (8.3%) | 331 (94.3%) |
| 65 to 74 Years | 358 (95.5%) | 232 (61.9%) |
| 75 Years and over | 239 (100.0%) | 175 (73.2%) |
| Total | 1,174 (30.2%) | 3,238 (83.2%) |
Disability Status by Sex by Age in Schnecksville
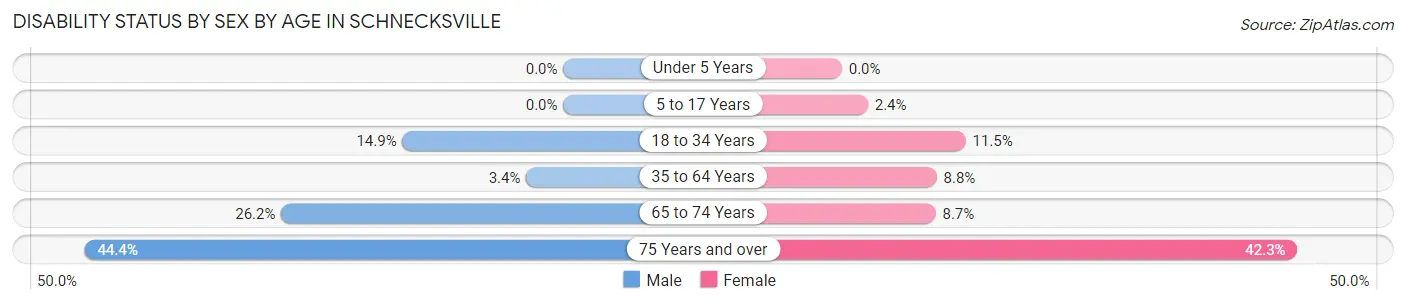
| Age Bracket | Male | Female |
| Under 5 Years | 0 (0.0%) | 0 (0.0%) |
| 5 to 17 Years | 0 (0.0%) | 12 (2.4%) |
| 18 to 34 Years | 33 (14.9%) | 40 (11.5%) |
| 35 to 64 Years | 26 (3.4%) | 73 (8.8%) |
| 65 to 74 Years | 50 (26.2%) | 16 (8.7%) |
| 75 Years and over | 40 (44.4%) | 63 (42.3%) |
Disability Class by Sex by Age in Schnecksville
Disability Class: Hearing Difficulty
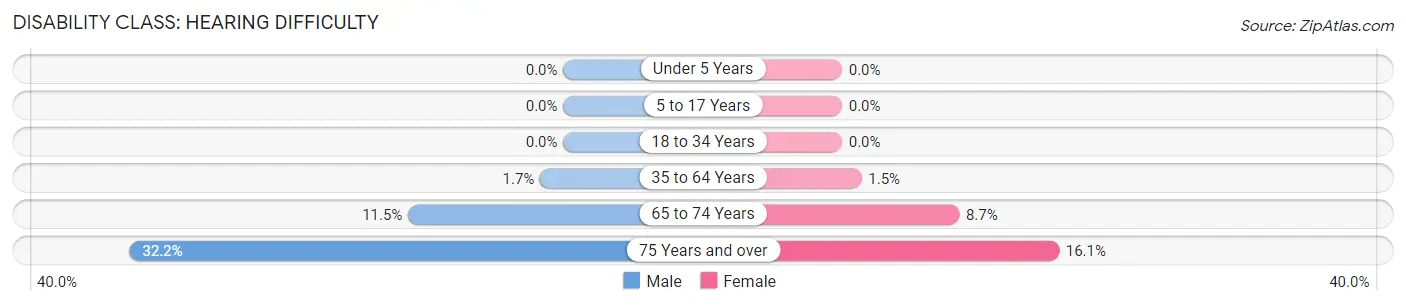
| Age Bracket | Male | Female |
| Under 5 Years | 0 (0.0%) | 0 (0.0%) |
| 5 to 17 Years | 0 (0.0%) | 0 (0.0%) |
| 18 to 34 Years | 0 (0.0%) | 0 (0.0%) |
| 35 to 64 Years | 13 (1.7%) | 12 (1.5%) |
| 65 to 74 Years | 22 (11.5%) | 16 (8.7%) |
| 75 Years and over | 29 (32.2%) | 24 (16.1%) |
Disability Class: Vision Difficulty
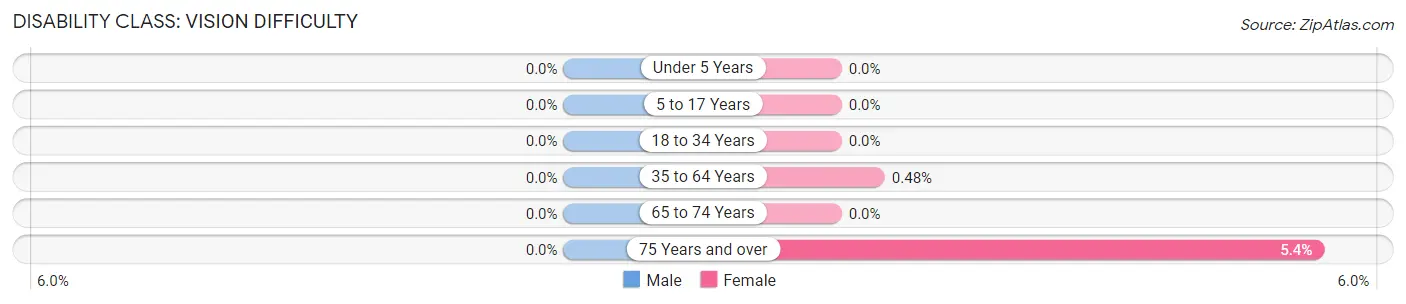
| Age Bracket | Male | Female |
| Under 5 Years | 0 (0.0%) | 0 (0.0%) |
| 5 to 17 Years | 0 (0.0%) | 0 (0.0%) |
| 18 to 34 Years | 0 (0.0%) | 0 (0.0%) |
| 35 to 64 Years | 0 (0.0%) | 4 (0.5%) |
| 65 to 74 Years | 0 (0.0%) | 0 (0.0%) |
| 75 Years and over | 0 (0.0%) | 8 (5.4%) |
Disability Class: Cognitive Difficulty
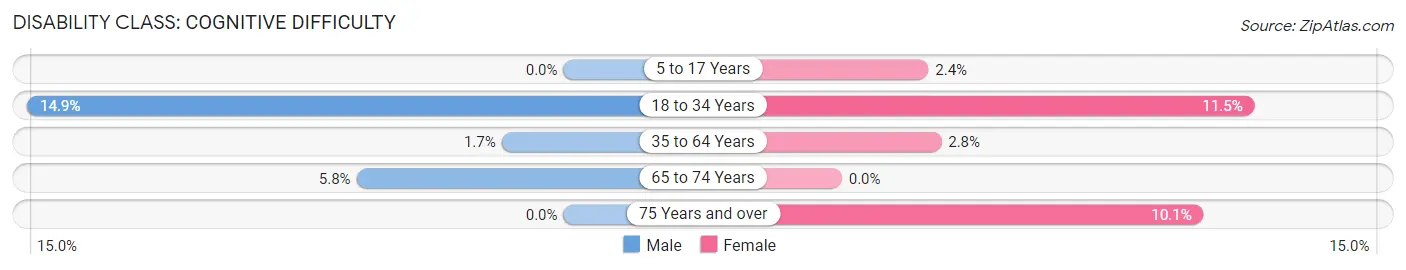
| Age Bracket | Male | Female |
| 5 to 17 Years | 0 (0.0%) | 12 (2.4%) |
| 18 to 34 Years | 33 (14.9%) | 40 (11.5%) |
| 35 to 64 Years | 13 (1.7%) | 23 (2.8%) |
| 65 to 74 Years | 11 (5.8%) | 0 (0.0%) |
| 75 Years and over | 0 (0.0%) | 15 (10.1%) |
Disability Class: Ambulatory Difficulty
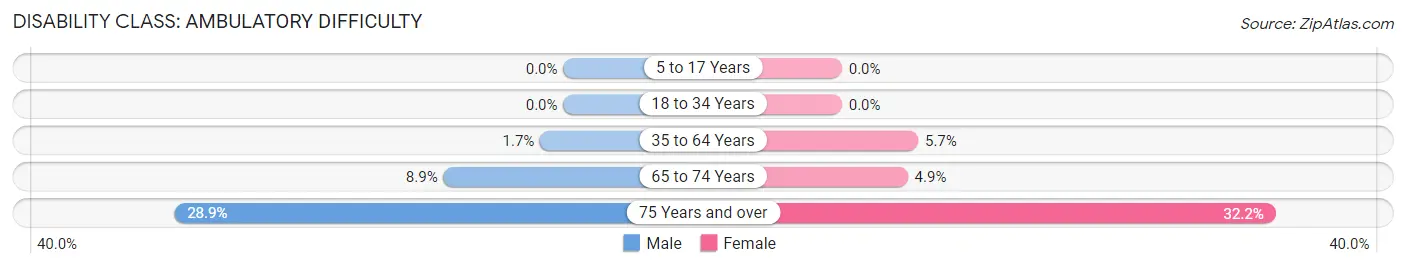
| Age Bracket | Male | Female |
| 5 to 17 Years | 0 (0.0%) | 0 (0.0%) |
| 18 to 34 Years | 0 (0.0%) | 0 (0.0%) |
| 35 to 64 Years | 13 (1.7%) | 47 (5.7%) |
| 65 to 74 Years | 17 (8.9%) | 9 (4.9%) |
| 75 Years and over | 26 (28.9%) | 48 (32.2%) |
Disability Class: Self-Care Difficulty
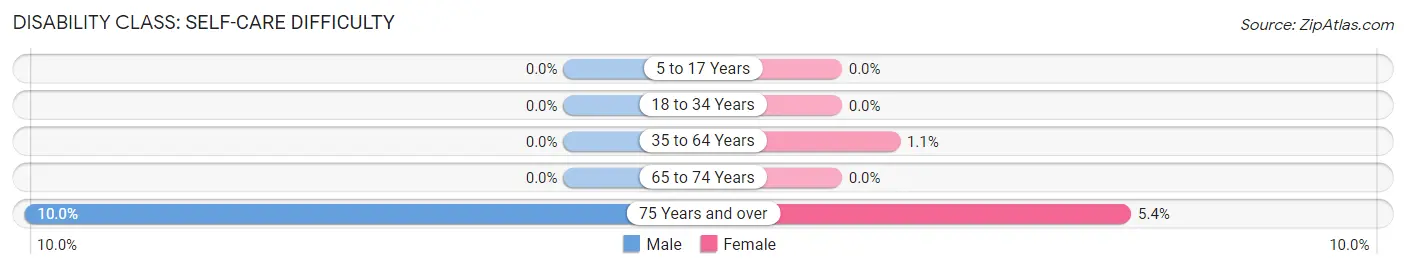
| Age Bracket | Male | Female |
| 5 to 17 Years | 0 (0.0%) | 0 (0.0%) |
| 18 to 34 Years | 0 (0.0%) | 0 (0.0%) |
| 35 to 64 Years | 0 (0.0%) | 9 (1.1%) |
| 65 to 74 Years | 0 (0.0%) | 0 (0.0%) |
| 75 Years and over | 9 (10.0%) | 8 (5.4%) |
Technology Access in Schnecksville
Computing Device Access in Schnecksville
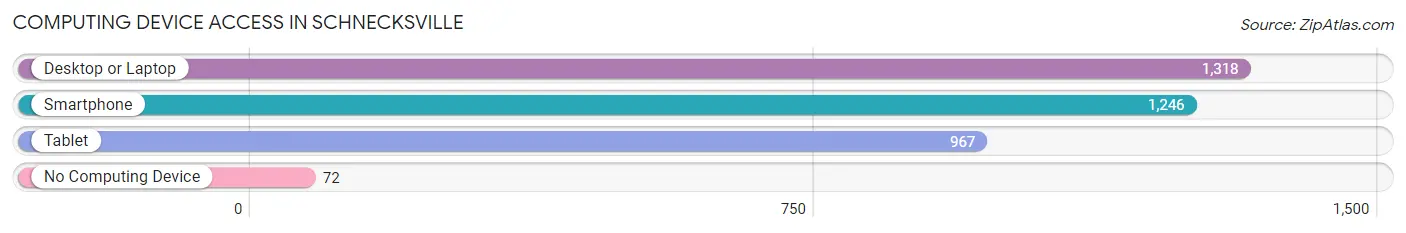
| Device Type | # Households | % Households |
| Desktop or Laptop | 1,318 | 90.8% |
| Smartphone | 1,246 | 85.9% |
| Tablet | 967 | 66.6% |
| No Computing Device | 72 | 5.0% |
| Total | 1,451 | 100.0% |
Internet Access in Schnecksville
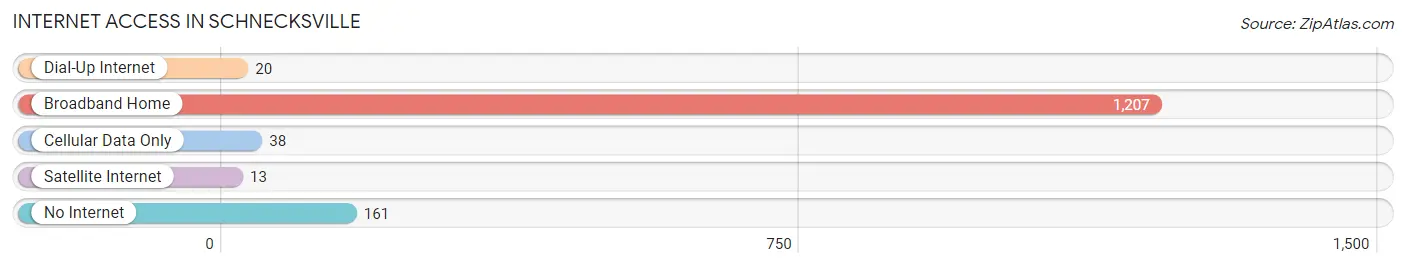
| Internet Type | # Households | % Households |
| Dial-Up Internet | 20 | 1.4% |
| Broadband Home | 1,207 | 83.2% |
| Cellular Data Only | 38 | 2.6% |
| Satellite Internet | 13 | 0.9% |
| No Internet | 161 | 11.1% |
| Total | 1,451 | 100.0% |
Schnecksville Summary
Schnecksville is a small borough located in Lehigh County, Pennsylvania. It is situated in the Lehigh Valley region of the state, approximately 10 miles north of Allentown. The borough is home to a population of approximately 2,500 people, and is part of the larger North Whitehall Township.
History
Schnecksville was founded in 1845 by John Schneck, a German immigrant who had settled in the area in 1832. He purchased a tract of land from the local Native American tribe, the Lenni Lenape, and began to develop the area. The town was originally known as Schneck's Settlement, and was later renamed Schnecksville.
The town grew slowly over the years, and by the early 1900s, it had become a thriving community. The town was home to a variety of businesses, including a hotel, a general store, a blacksmith shop, and a sawmill. The town also had a post office, a school, and a church.
In the 1950s, the town began to experience a period of growth and development. The population increased, and new businesses and homes were built. The town was also connected to the larger Lehigh Valley region by the Lehigh Valley Railroad.
Geography
Schnecksville is located in the Lehigh Valley region of Pennsylvania. It is situated in the northern part of Lehigh County, approximately 10 miles north of Allentown. The borough is bordered by North Whitehall Township to the east, South Whitehall Township to the south, and Heidelberg Township to the west.
The borough is situated in a rural area, and is surrounded by rolling hills and farmland. The Lehigh River runs through the borough, and there are several small creeks and streams in the area. The borough is also home to several parks, including the Schnecksville Community Park and the Lehigh Valley Zoo.
Economy
The economy of Schnecksville is largely based on agriculture and tourism. The town is home to several farms, which produce a variety of crops, including corn, soybeans, and hay. The town is also home to several tourist attractions, including the Lehigh Valley Zoo and the Schnecksville Community Park.
The town is also home to several small businesses, including restaurants, retail stores, and service providers. The town is also home to several manufacturing companies, including a plastics manufacturer and a metal fabrication company.
Demographics
As of the 2010 census, the population of Schnecksville was 2,521. The racial makeup of the borough was 97.3% White, 0.7% African American, 0.2% Native American, 0.7% Asian, 0.1% Pacific Islander, 0.3% from other races, and 0.9% from two or more races. Hispanic or Latino of any race were 1.3% of the population.
The median household income in Schnecksville was $50,938, and the median family income was $60,938. The per capita income for the borough was $25,938. About 4.3% of families and 5.7% of the population were below the poverty line, including 8.3% of those under age 18 and 4.3% of those age 65 or over.
Common Questions
What is Per Capita Income in Schnecksville?
Per Capita income in Schnecksville is $62,757.
What is the Median Family Income in Schnecksville?
Median Family Income in Schnecksville is $160,742.
What is the Median Household income in Schnecksville?
Median Household Income in Schnecksville is $119,083.
What is Income or Wage Gap in Schnecksville?
Income or Wage Gap in Schnecksville is 27.5%.
Women in Schnecksville earn 72.5 cents for every dollar earned by a man.
What is Inequality or Gini Index in Schnecksville?
Inequality or Gini Index in Schnecksville is 0.44.
What is the Total Population of Schnecksville?
Total Population of Schnecksville is 3,893.
What is the Total Male Population of Schnecksville?
Total Male Population of Schnecksville is 1,729.
What is the Total Female Population of Schnecksville?
Total Female Population of Schnecksville is 2,164.
What is the Ratio of Males per 100 Females in Schnecksville?
There are 79.90 Males per 100 Females in Schnecksville.
What is the Ratio of Females per 100 Males in Schnecksville?
There are 125.16 Females per 100 Males in Schnecksville.
What is the Median Population Age in Schnecksville?
Median Population Age in Schnecksville is 37.9 Years.
What is the Average Family Size in Schnecksville
Average Family Size in Schnecksville is 3.2 People.
What is the Average Household Size in Schnecksville
Average Household Size in Schnecksville is 2.7 People.
How Large is the Labor Force in Schnecksville?
There are 2,018 People in the Labor Forcein in Schnecksville.
What is the Percentage of People in the Labor Force in Schnecksville?
69.9% of People are in the Labor Force in Schnecksville.
What is the Unemployment Rate in Schnecksville?
Unemployment Rate in Schnecksville is 5.6%.