Little Britain, PA Map & Demographics
Little Britain Map
Little Britain Overview
$38,885
PER CAPITA INCOME
$76,080
AVG HOUSEHOLD INCOME
33.9%
WAGE / INCOME GAP [ % ]
66.1¢/ $1
WAGE / INCOME GAP [ $ ]
0.39
INEQUALITY / GINI INDEX
287
TOTAL POPULATION
174
MALE POPULATION
113
FEMALE POPULATION
153.98
MALES / 100 FEMALES
64.94
FEMALES / 100 MALES
55.1
MEDIAN AGE
2.8
AVG FAMILY SIZE
2.8
AVG HOUSEHOLD SIZE
190
LABOR FORCE [ PEOPLE ]
66.2%
PERCENT IN LABOR FORCE
15.3%
UNEMPLOYMENT RATE
Income in Little Britain
Income Overview in Little Britain
| Characteristic | Number | Measure |
| Per Capita Income | 287 | $38,885 |
| Median Family Income | 73 | $0 |
| Mean Family Income | 73 | $123,492 |
| Median Household Income | 103 | $76,080 |
| Mean Household Income | 103 | $104,013 |
| Income Deficit | 73 | $0 |
| Wage / Income Gap (%) | 287 | 33.87% |
| Wage / Income Gap ($) | 287 | 66.13¢ per $1 |
| Gini / Inequality Index | 287 | 0.39 |
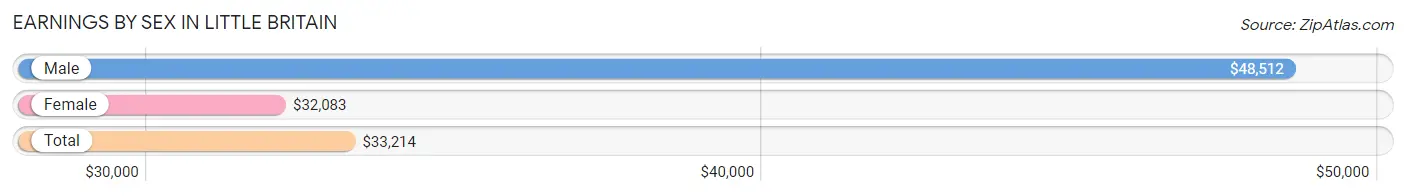
Earnings by Sex in Little Britain
Average Earnings in Little Britain are $33,214, $48,512 for men and $32,083 for women, a difference of 33.9%.
| Sex | Number | Average Earnings |
| Male | 105 (55.3%) | $48,512 |
| Female | 85 (44.7%) | $32,083 |
| Total | 190 (100.0%) | $33,214 |
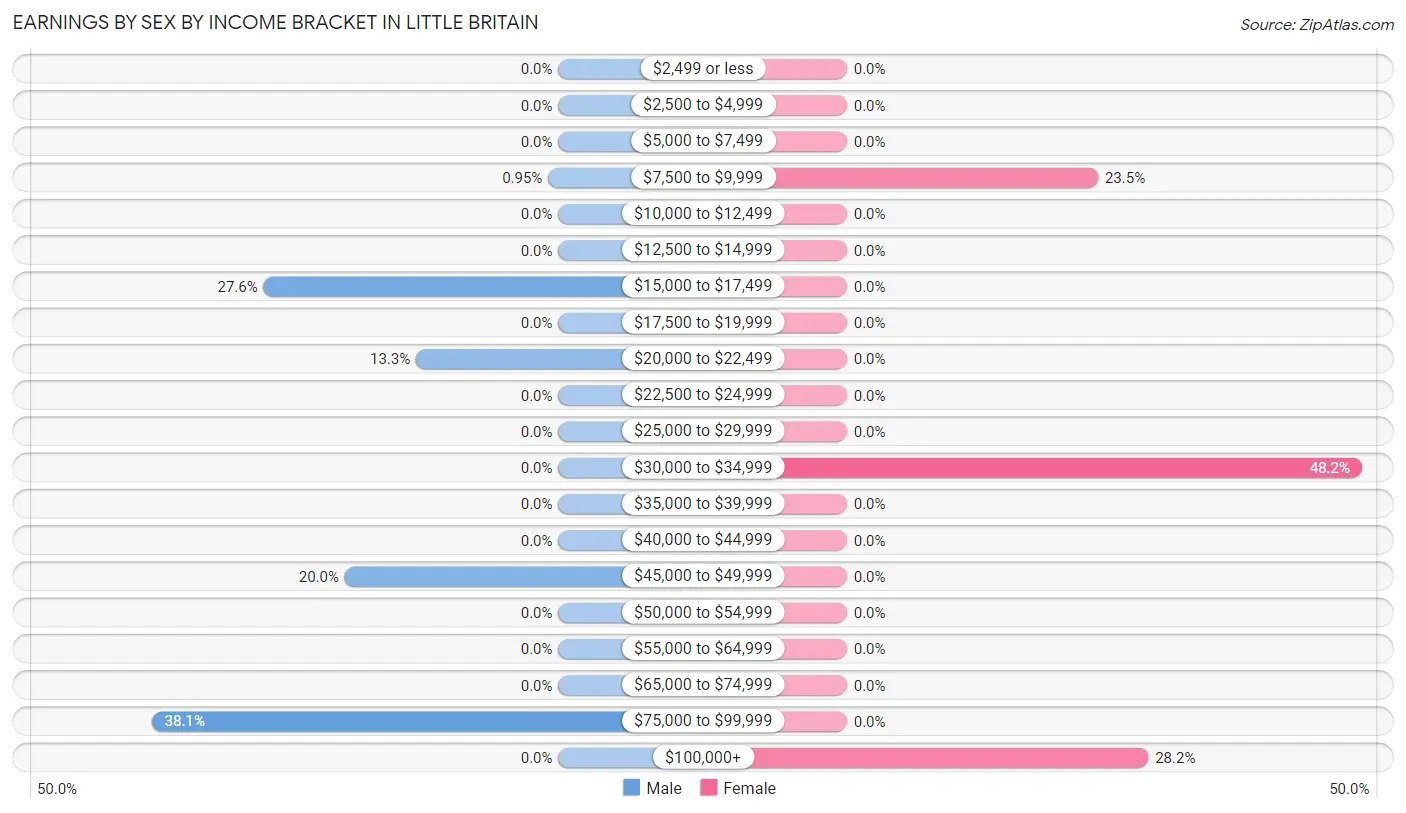
Earnings by Sex by Income Bracket in Little Britain
The most common earnings brackets in Little Britain are $75,000 to $99,999 for men (40 | 38.1%) and $30,000 to $34,999 for women (41 | 48.2%).
| Income | Male | Female |
| $2,499 or less | 0 (0.0%) | 0 (0.0%) |
| $2,500 to $4,999 | 0 (0.0%) | 0 (0.0%) |
| $5,000 to $7,499 | 0 (0.0%) | 0 (0.0%) |
| $7,500 to $9,999 | 1 (0.9%) | 20 (23.5%) |
| $10,000 to $12,499 | 0 (0.0%) | 0 (0.0%) |
| $12,500 to $14,999 | 0 (0.0%) | 0 (0.0%) |
| $15,000 to $17,499 | 29 (27.6%) | 0 (0.0%) |
| $17,500 to $19,999 | 0 (0.0%) | 0 (0.0%) |
| $20,000 to $22,499 | 14 (13.3%) | 0 (0.0%) |
| $22,500 to $24,999 | 0 (0.0%) | 0 (0.0%) |
| $25,000 to $29,999 | 0 (0.0%) | 0 (0.0%) |
| $30,000 to $34,999 | 0 (0.0%) | 41 (48.2%) |
| $35,000 to $39,999 | 0 (0.0%) | 0 (0.0%) |
| $40,000 to $44,999 | 0 (0.0%) | 0 (0.0%) |
| $45,000 to $49,999 | 21 (20.0%) | 0 (0.0%) |
| $50,000 to $54,999 | 0 (0.0%) | 0 (0.0%) |
| $55,000 to $64,999 | 0 (0.0%) | 0 (0.0%) |
| $65,000 to $74,999 | 0 (0.0%) | 0 (0.0%) |
| $75,000 to $99,999 | 40 (38.1%) | 0 (0.0%) |
| $100,000+ | 0 (0.0%) | 24 (28.2%) |
| Total | 105 (100.0%) | 85 (100.0%) |
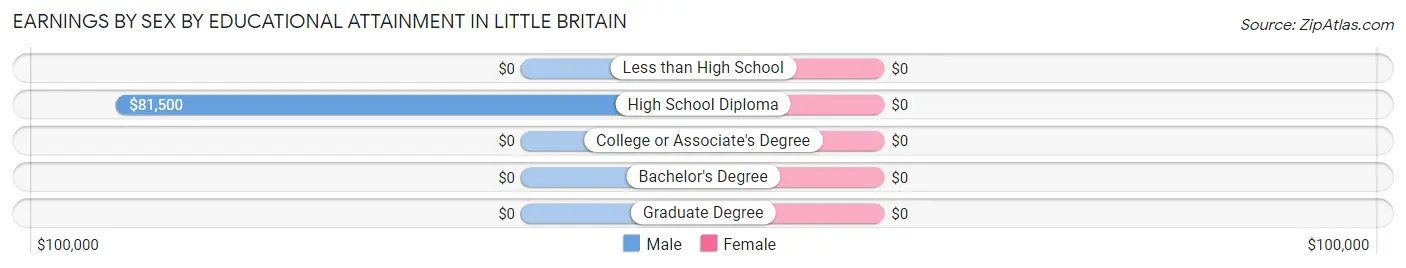
Earnings by Sex by Educational Attainment in Little Britain
| Educational Attainment | Male Income | Female Income |
| Less than High School | - | - |
| High School Diploma | $81,500 | $0 |
| College or Associate's Degree | - | - |
| Bachelor's Degree | - | - |
| Graduate Degree | - | - |
| Total | $80,333 | $0 |
Family Income in Little Britain
Family Income Brackets in Little Britain
According to the Little Britain family income data, there are 24 families falling into the $200,000+ income range, which is the most common income bracket and makes up 32.9% of all families.
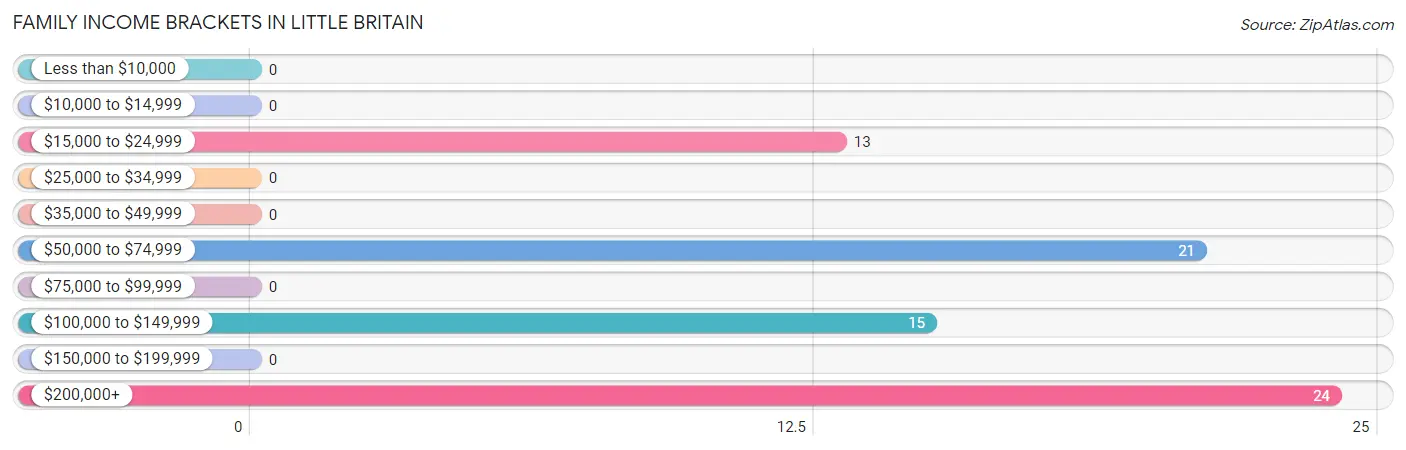
| Income Bracket | # Families | % Families |
| Less than $10,000 | 0 | 0.0% |
| $10,000 to $14,999 | 0 | 0.0% |
| $15,000 to $24,999 | 13 | 17.8% |
| $25,000 to $34,999 | 0 | 0.0% |
| $35,000 to $49,999 | 0 | 0.0% |
| $50,000 to $74,999 | 21 | 28.8% |
| $75,000 to $99,999 | 0 | 0.0% |
| $100,000 to $149,999 | 15 | 20.5% |
| $150,000 to $199,999 | 0 | 0.0% |
| $200,000+ | 24 | 32.9% |
Family Income by Famaliy Size in Little Britain
2-person families (49 | 67.1%) account for the highest median family income in Little Britain with $61,369 per family, while 2-person families (49 | 67.1%) have the highest median income of $30,684 per family member.
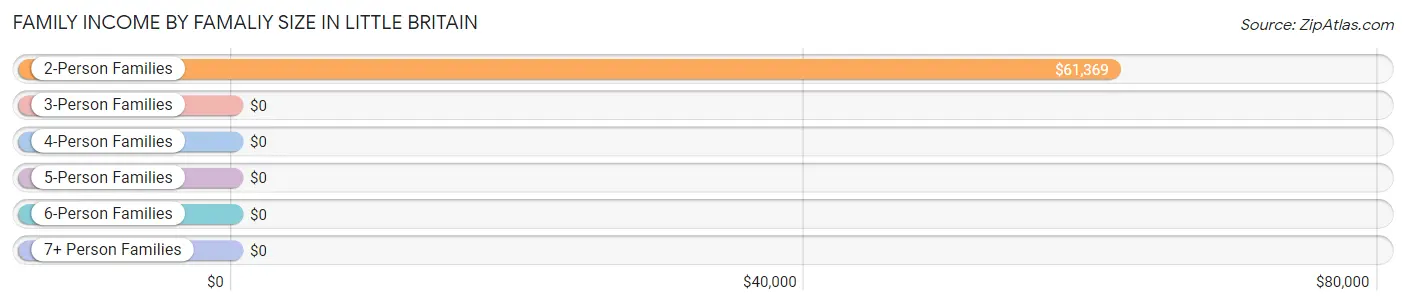
| Income Bracket | # Families | Median Income |
| 2-Person Families | 49 (67.1%) | $61,369 |
| 3-Person Families | 0 (0.0%) | $0 |
| 4-Person Families | 24 (32.9%) | $0 |
| 5-Person Families | 0 (0.0%) | $0 |
| 6-Person Families | 0 (0.0%) | $0 |
| 7+ Person Families | 0 (0.0%) | $0 |
| Total | 73 (100.0%) | $0 |
Family Income by Number of Earners in Little Britain
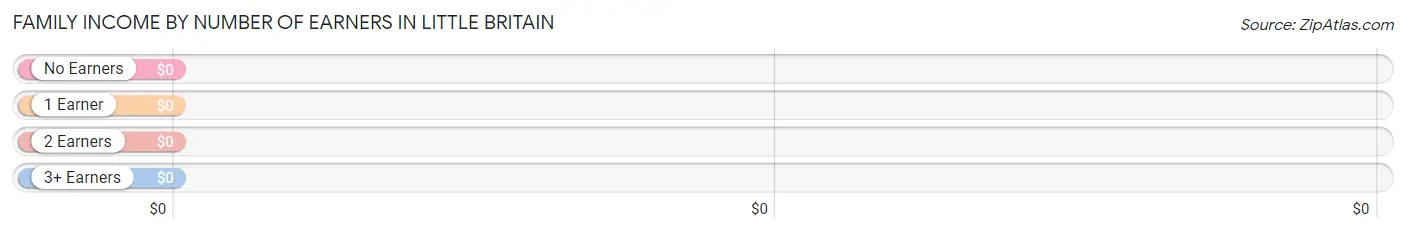
| Number of Earners | # Families | Median Income |
| No Earners | 0 (0.0%) | $0 |
| 1 Earner | 13 (17.8%) | $0 |
| 2 Earners | 36 (49.3%) | $0 |
| 3+ Earners | 24 (32.9%) | $0 |
| Total | 73 (100.0%) | $0 |
Household Income in Little Britain
Household Income Brackets in Little Britain
With 29 households falling in the category, the $35,000 to $49,999 income range is the most frequent in Little Britain, accounting for 28.2% of all households.
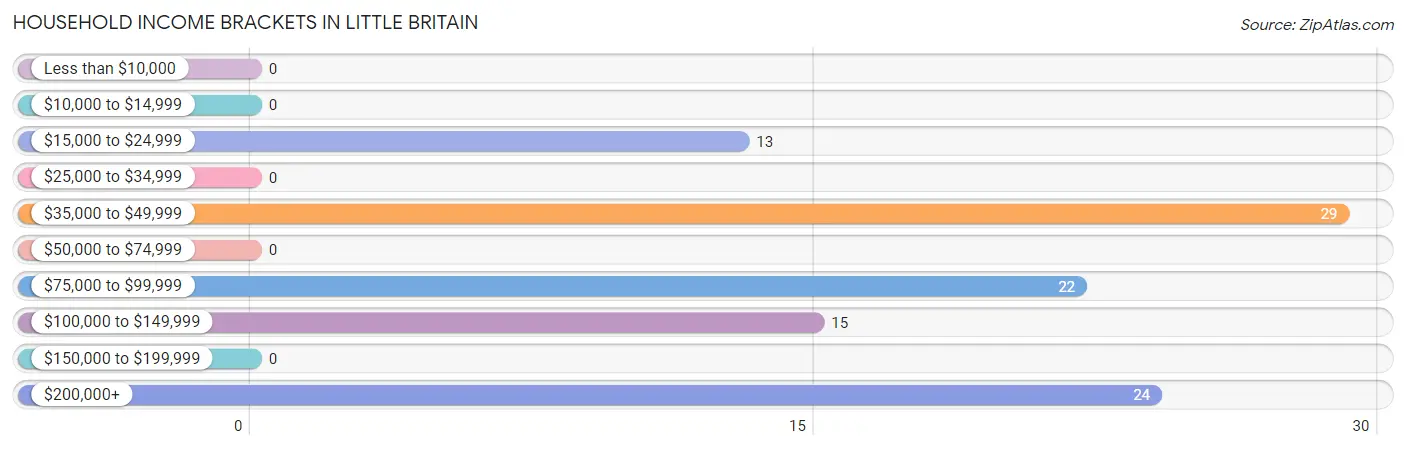
| Income Bracket | # Households | % Households |
| Less than $10,000 | 0 | 0.0% |
| $10,000 to $14,999 | 0 | 0.0% |
| $15,000 to $24,999 | 13 | 12.6% |
| $25,000 to $34,999 | 0 | 0.0% |
| $35,000 to $49,999 | 29 | 28.2% |
| $50,000 to $74,999 | 0 | 0.0% |
| $75,000 to $99,999 | 22 | 21.4% |
| $100,000 to $149,999 | 15 | 14.6% |
| $150,000 to $199,999 | 0 | 0.0% |
| $200,000+ | 24 | 23.3% |
Household Income by Householder Age in Little Britain
The median household income in Little Britain is $76,080, with the highest median household income of $45,733 found in the 65+ years age bracket for the primary householder. A total of 43 households (41.7%) fall into this category.
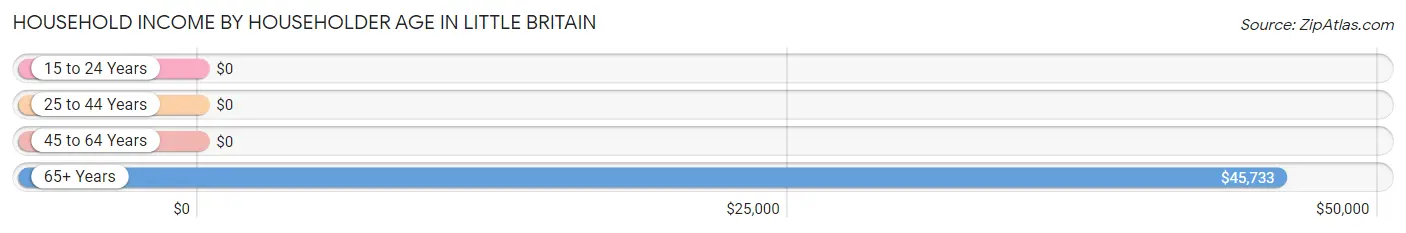
| Income Bracket | # Households | Median Income |
| 15 to 24 Years | 0 (0.0%) | $0 |
| 25 to 44 Years | 0 (0.0%) | $0 |
| 45 to 64 Years | 60 (58.3%) | $0 |
| 65+ Years | 43 (41.7%) | $45,733 |
| Total | 103 (100.0%) | $76,080 |
Poverty in Little Britain
Income Below Poverty by Sex and Age in Little Britain
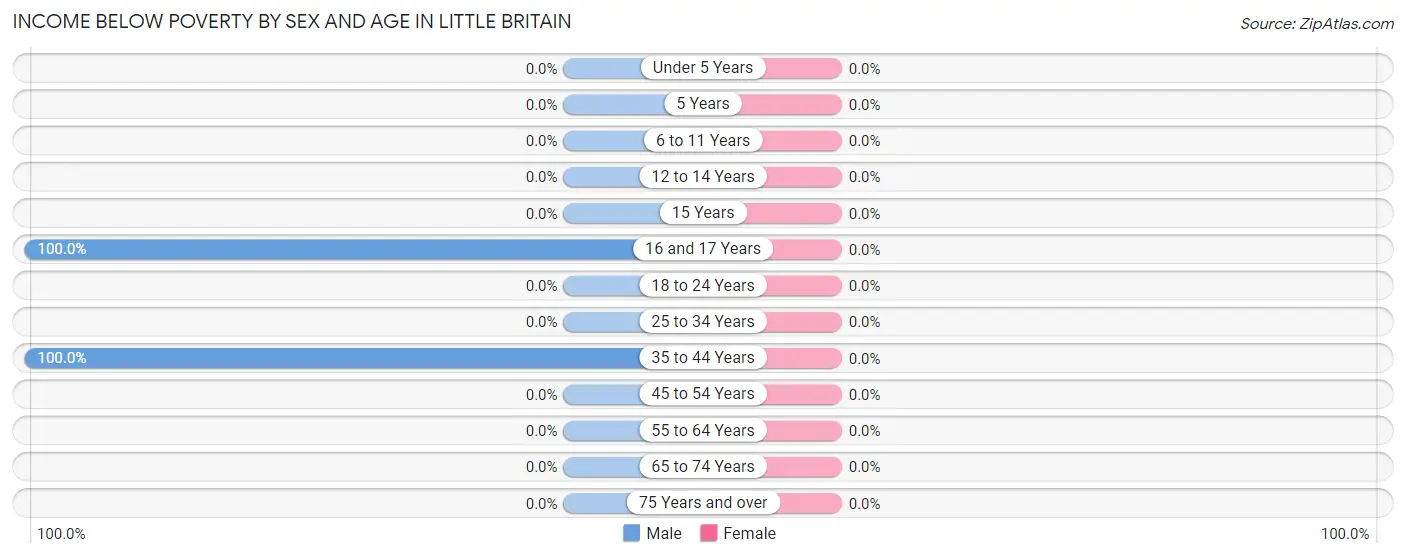
| Age Bracket | Male | Female |
| Under 5 Years | 0 (0.0%) | 0 (0.0%) |
| 5 Years | 0 (0.0%) | 0 (0.0%) |
| 6 to 11 Years | 0 (0.0%) | 0 (0.0%) |
| 12 to 14 Years | 0 (0.0%) | 0 (0.0%) |
| 15 Years | 0 (0.0%) | 0 (0.0%) |
| 16 and 17 Years | 20 (100.0%) | 0 (0.0%) |
| 18 to 24 Years | 0 (0.0%) | 0 (0.0%) |
| 25 to 34 Years | 0 (0.0%) | 0 (0.0%) |
| 35 to 44 Years | 20 (100.0%) | 0 (0.0%) |
| 45 to 54 Years | 0 (0.0%) | 0 (0.0%) |
| 55 to 64 Years | 0 (0.0%) | 0 (0.0%) |
| 65 to 74 Years | 0 (0.0%) | 0 (0.0%) |
| 75 Years and over | 0 (0.0%) | 0 (0.0%) |
| Total | 40 (23.0%) | 0 (0.0%) |
Income Above Poverty by Sex and Age in Little Britain
According to the poverty statistics in Little Britain, males aged 18 to 24 years and females aged 18 to 24 years are the age groups that are most secure financially, with 100.0% of males and 100.0% of females in these age groups living above the poverty line.
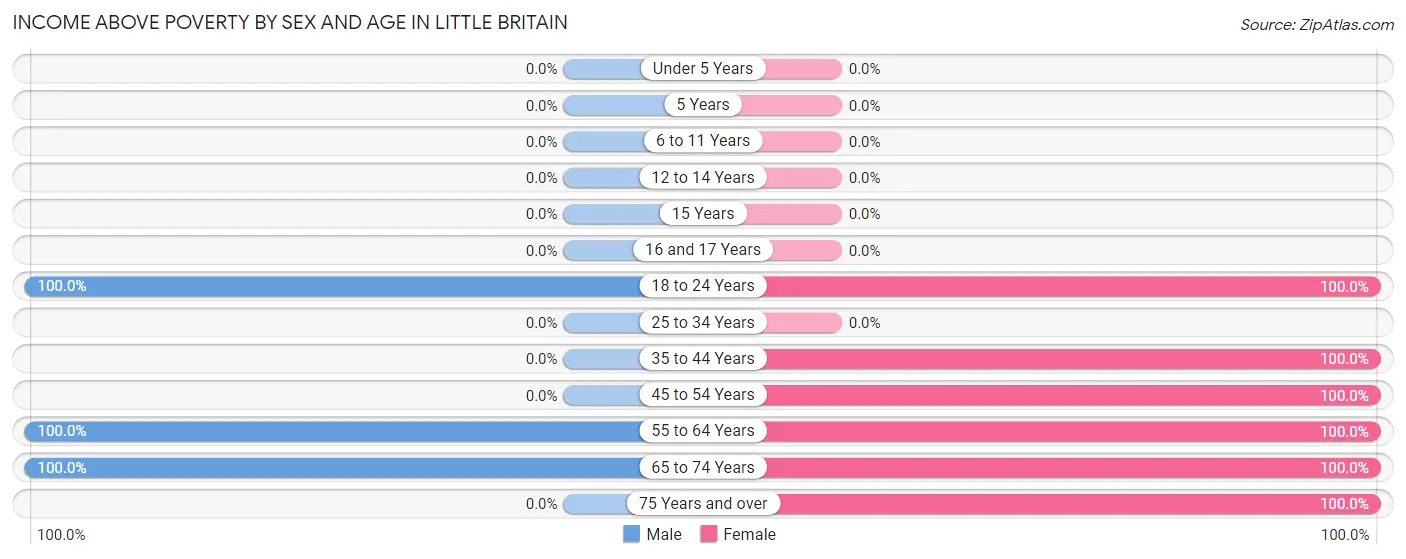
| Age Bracket | Male | Female |
| Under 5 Years | 0 (0.0%) | 0 (0.0%) |
| 5 Years | 0 (0.0%) | 0 (0.0%) |
| 6 to 11 Years | 0 (0.0%) | 0 (0.0%) |
| 12 to 14 Years | 0 (0.0%) | 0 (0.0%) |
| 15 Years | 0 (0.0%) | 0 (0.0%) |
| 16 and 17 Years | 0 (0.0%) | 0 (0.0%) |
| 18 to 24 Years | 29 (100.0%) | 27 (100.0%) |
| 25 to 34 Years | 0 (0.0%) | 0 (0.0%) |
| 35 to 44 Years | 0 (0.0%) | 20 (100.0%) |
| 45 to 54 Years | 0 (0.0%) | 24 (100.0%) |
| 55 to 64 Years | 75 (100.0%) | 14 (100.0%) |
| 65 to 74 Years | 30 (100.0%) | 15 (100.0%) |
| 75 Years and over | 0 (0.0%) | 13 (100.0%) |
| Total | 134 (77.0%) | 113 (100.0%) |
Income Below Poverty Among Married-Couple Families in Little Britain
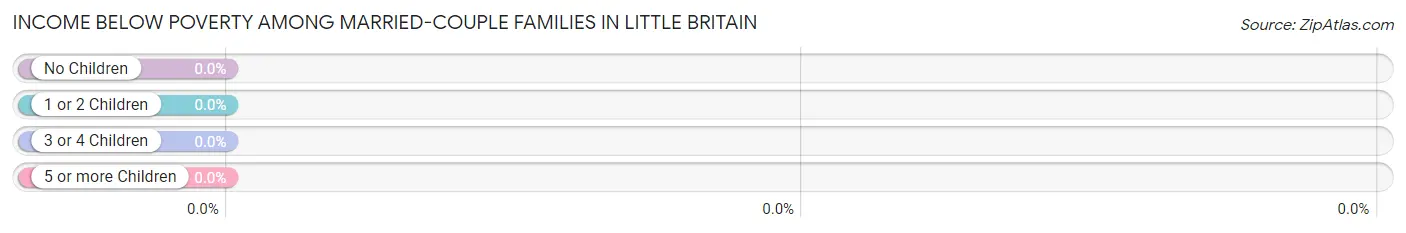
| Children | Above Poverty | Below Poverty |
| No Children | 39 (100.0%) | 0 (0.0%) |
| 1 or 2 Children | 0 (0.0%) | 0 (0.0%) |
| 3 or 4 Children | 0 (0.0%) | 0 (0.0%) |
| 5 or more Children | 0 (0.0%) | 0 (0.0%) |
| Total | 39 (100.0%) | 0 (0.0%) |
Income Below Poverty Among Single-Parent Households in Little Britain
| Children | Single Father | Single Mother |
| No Children | 0 (0.0%) | 0 (0.0%) |
| 1 or 2 Children | 0 (0.0%) | 0 (0.0%) |
| 3 or 4 Children | 0 (0.0%) | 0 (0.0%) |
| 5 or more Children | 0 (0.0%) | 0 (0.0%) |
| Total | 0 (0.0%) | 0 (0.0%) |
Income Below Poverty Among Married-Couple vs Single-Parent Households in Little Britain
| Children | Married-Couple Families | Single-Parent Households |
| No Children | 0 (0.0%) | 0 (0.0%) |
| 1 or 2 Children | 0 (0.0%) | 0 (0.0%) |
| 3 or 4 Children | 0 (0.0%) | 0 (0.0%) |
| 5 or more Children | 0 (0.0%) | 0 (0.0%) |
| Total | 0 (0.0%) | 0 (0.0%) |
Race in Little Britain
The most populous races in Little Britain are White / Caucasian (286 | 99.7%), and Two or more Races (1 | 0.4%).
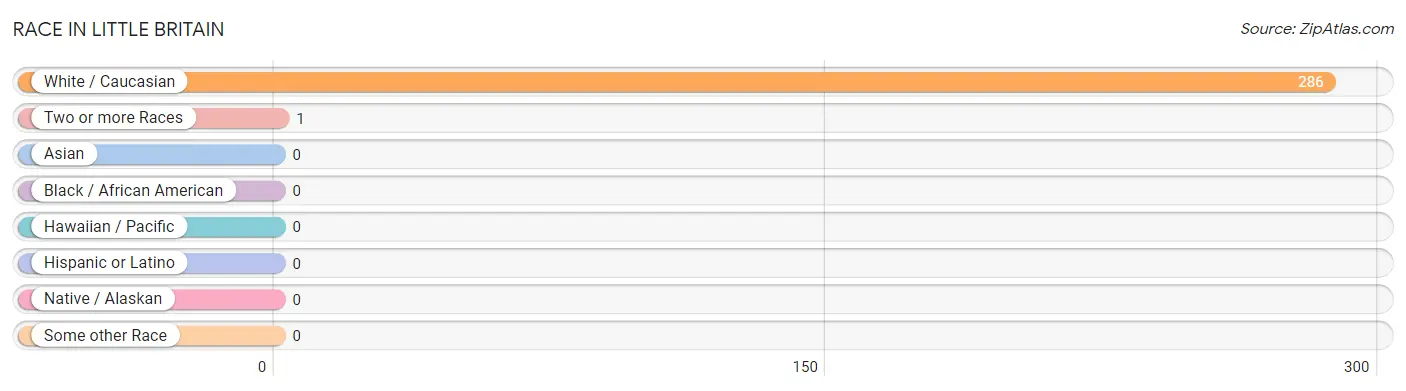
| Race | # Population | % Population |
| Asian | 0 | 0.0% |
| Black / African American | 0 | 0.0% |
| Hawaiian / Pacific | 0 | 0.0% |
| Hispanic or Latino | 0 | 0.0% |
| Native / Alaskan | 0 | 0.0% |
| White / Caucasian | 286 | 99.7% |
| Two or more Races | 1 | 0.4% |
| Some other Race | 0 | 0.0% |
| Total | 287 | 100.0% |
Ancestry in Little Britain
The most populous ancestries reported in Little Britain are Irish (44 | 15.3%), Italian (29 | 10.1%), Slovak (21 | 7.3%), Polish (15 | 5.2%), and Lithuanian (14 | 4.9%), together accounting for 42.9% of all Little Britain residents.
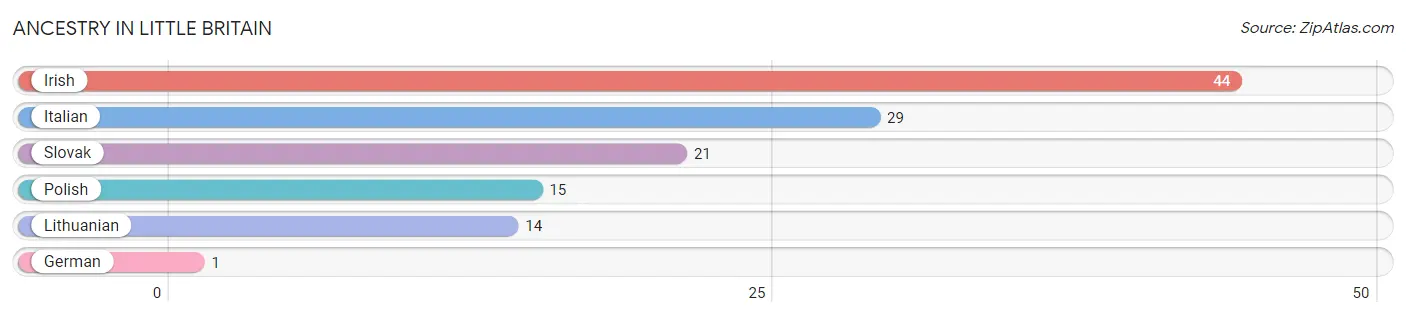
| Ancestry | # Population | % Population |
| German | 1 | 0.4% |
| Irish | 44 | 15.3% |
| Italian | 29 | 10.1% |
| Lithuanian | 14 | 4.9% |
| Polish | 15 | 5.2% |
| Slovak | 21 | 7.3% | View All 6 Rows |
Immigrants in Little Britain

| Immigration Origin | # Population | % Population | View All 0 Rows |
Sex and Age in Little Britain
Sex and Age in Little Britain
The most populous age groups in Little Britain are 55 to 59 Years (46 | 26.4%) for men and 20 to 24 Years (27 | 23.9%) for women.
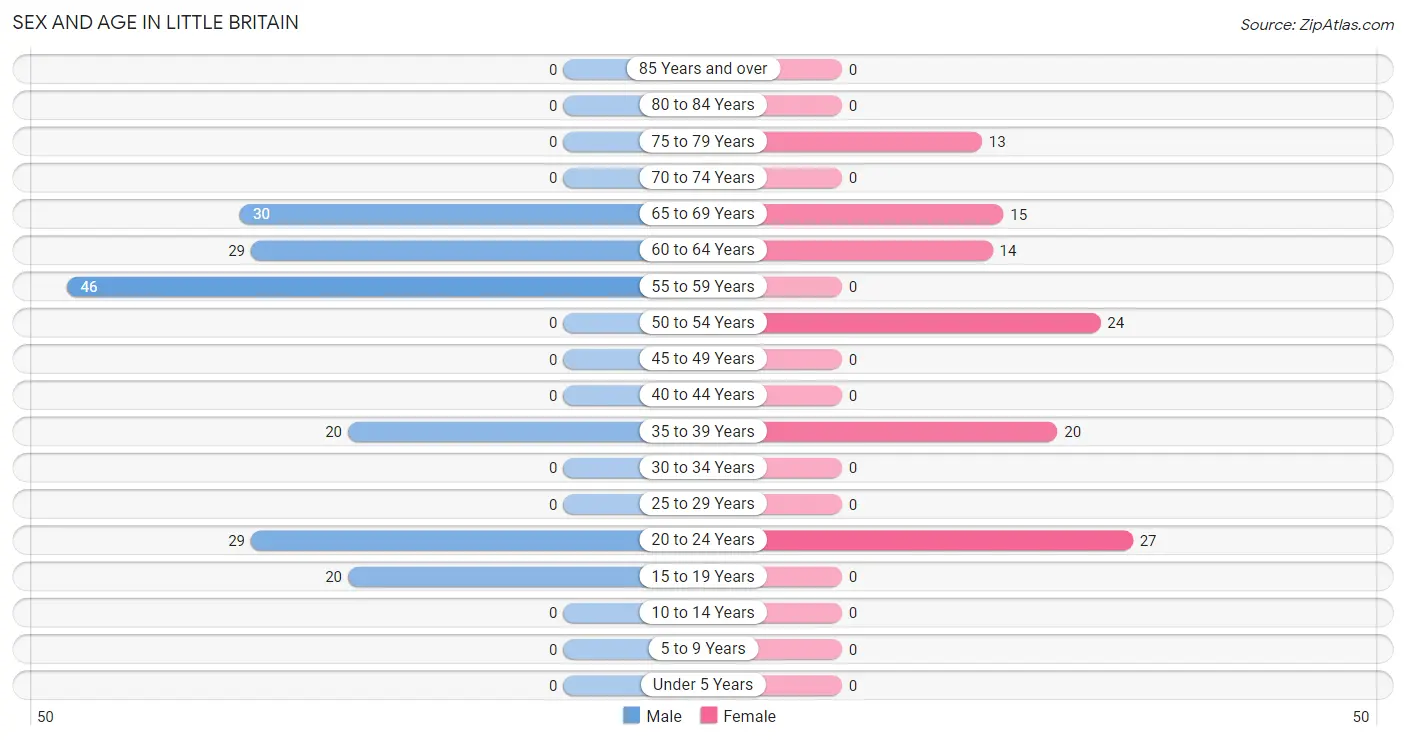
| Age Bracket | Male | Female |
| Under 5 Years | 0 (0.0%) | 0 (0.0%) |
| 5 to 9 Years | 0 (0.0%) | 0 (0.0%) |
| 10 to 14 Years | 0 (0.0%) | 0 (0.0%) |
| 15 to 19 Years | 20 (11.5%) | 0 (0.0%) |
| 20 to 24 Years | 29 (16.7%) | 27 (23.9%) |
| 25 to 29 Years | 0 (0.0%) | 0 (0.0%) |
| 30 to 34 Years | 0 (0.0%) | 0 (0.0%) |
| 35 to 39 Years | 20 (11.5%) | 20 (17.7%) |
| 40 to 44 Years | 0 (0.0%) | 0 (0.0%) |
| 45 to 49 Years | 0 (0.0%) | 0 (0.0%) |
| 50 to 54 Years | 0 (0.0%) | 24 (21.2%) |
| 55 to 59 Years | 46 (26.4%) | 0 (0.0%) |
| 60 to 64 Years | 29 (16.7%) | 14 (12.4%) |
| 65 to 69 Years | 30 (17.2%) | 15 (13.3%) |
| 70 to 74 Years | 0 (0.0%) | 0 (0.0%) |
| 75 to 79 Years | 0 (0.0%) | 13 (11.5%) |
| 80 to 84 Years | 0 (0.0%) | 0 (0.0%) |
| 85 Years and over | 0 (0.0%) | 0 (0.0%) |
| Total | 174 (100.0%) | 113 (100.0%) |
Families and Households in Little Britain
Median Family Size in Little Britain
The median family size in Little Britain is 2.77 persons per family, with married-couple families (39 | 53.4%) accounting for the largest median family size of 3.44 persons per family. On the other hand, single male/father families (21 | 28.8%) represent the smallest median family size with 1.95 persons per family.
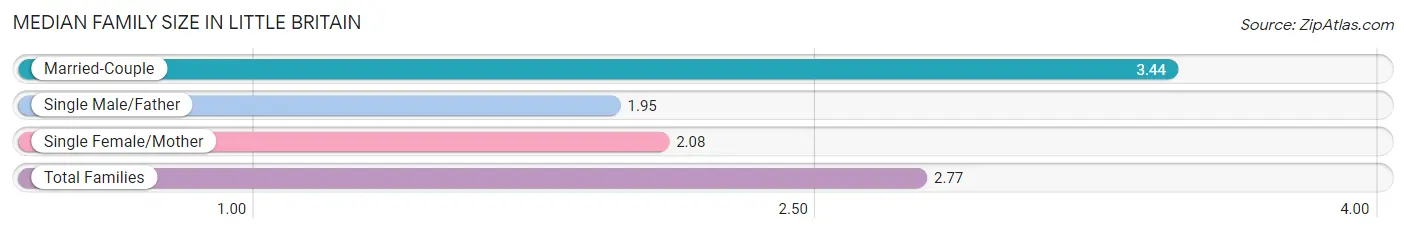
| Family Type | # Families | Family Size |
| Married-Couple | 39 (53.4%) | 3.44 |
| Single Male/Father | 21 (28.8%) | 1.95 |
| Single Female/Mother | 13 (17.8%) | 2.08 |
| Total Families | 73 (100.0%) | 2.77 |
Median Household Size in Little Britain
The median household size in Little Britain is 2.79 persons per household, with single male/father households (21 | 20.4%) accounting for the largest median household size of 3.86 persons per household. non-family households (30 | 29.1%) represent the smallest median household size with 1.50 persons per household.
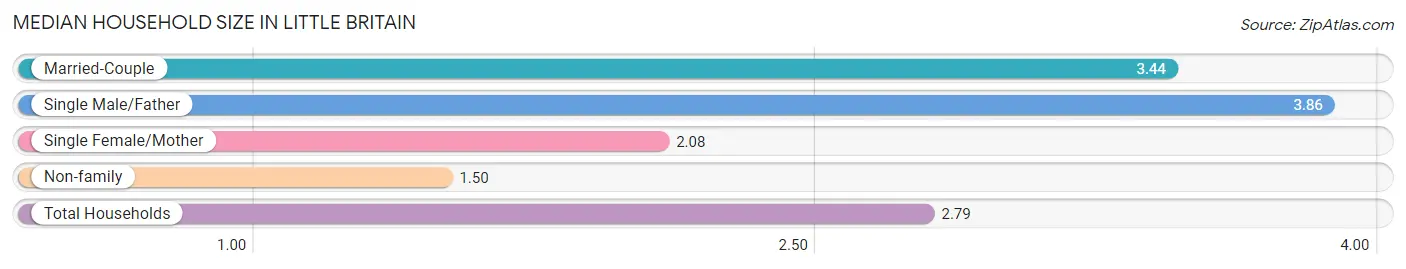
| Household Type | # Households | Household Size |
| Married-Couple | 39 (37.9%) | 3.44 |
| Single Male/Father | 21 (20.4%) | 3.86 |
| Single Female/Mother | 13 (12.6%) | 2.08 |
| Non-family | 30 (29.1%) | 1.50 |
| Total Households | 103 (100.0%) | 2.79 |
Household Size by Marriage Status in Little Britain
Out of a total of 103 households in Little Britain, 73 (70.9%) are family households, while 30 (29.1%) are nonfamily households. The most numerous type of family households are 4-person households, comprising 45, and the most common type of nonfamily households are 1-person households, comprising 29.
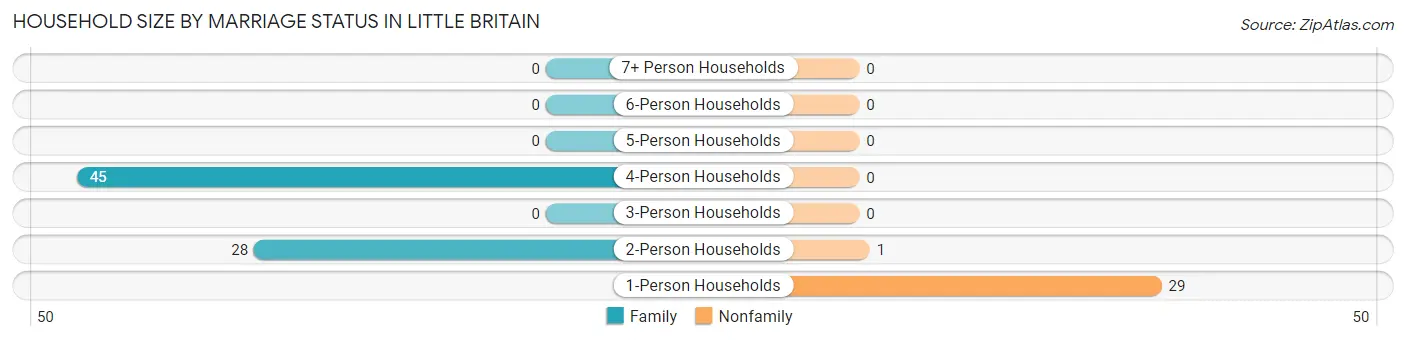
| Household Size | Family Households | Nonfamily Households |
| 1-Person Households | - | 29 (28.2%) |
| 2-Person Households | 28 (27.2%) | 1 (1.0%) |
| 3-Person Households | 0 (0.0%) | 0 (0.0%) |
| 4-Person Households | 45 (43.7%) | 0 (0.0%) |
| 5-Person Households | 0 (0.0%) | 0 (0.0%) |
| 6-Person Households | 0 (0.0%) | 0 (0.0%) |
| 7+ Person Households | 0 (0.0%) | 0 (0.0%) |
| Total | 73 (70.9%) | 30 (29.1%) |
Female Fertility in Little Britain
Fertility by Age in Little Britain
| Age Bracket | Women with Births | Births / 1,000 Women |
| 15 to 19 years | 0 (0.0%) | 0.0 |
| 20 to 34 years | 0 (0.0%) | 0.0 |
| 35 to 50 years | 0 (0.0%) | 0.0 |
| Total | 0 (0.0%) | 0.0 |
Fertility by Age by Marriage Status in Little Britain
| Age Bracket | Married | Unmarried |
| 15 to 19 years | 0 (0.0%) | 0 (0.0%) |
| 20 to 34 years | 0 (0.0%) | 0 (0.0%) |
| 35 to 50 years | 0 (0.0%) | 0 (0.0%) |
| Total | 0 (0.0%) | 0 (0.0%) |
Fertility by Education in Little Britain
| Educational Attainment | Women with Births | Births / 1,000 Women |
| Less than High School | 0 (0.0%) | 0.0 |
| High School Diploma | 0 (0.0%) | 0.0 |
| College or Associate's Degree | 0 (0.0%) | 0.0 |
| Bachelor's Degree | 0 (0.0%) | 0.0 |
| Graduate Degree | 0 (0.0%) | 0.0 |
| Total | 0 (0.0%) | 0.0 |
Fertility by Education by Marriage Status in Little Britain
| Educational Attainment | Married | Unmarried |
| Less than High School | 0 (0.0%) | 0 (0.0%) |
| High School Diploma | 0 (0.0%) | 0 (0.0%) |
| College or Associate's Degree | 0 (0.0%) | 0 (0.0%) |
| Bachelor's Degree | 0 (0.0%) | 0 (0.0%) |
| Graduate Degree | 0 (0.0%) | 0 (0.0%) |
| Total | 0 (0.0%) | 0 (0.0%) |
Employment Characteristics in Little Britain
Employment by Class of Employer in Little Britain
Among the 141 employed individuals in Little Britain, private company employees (85 | 60.3%), local government employees (28 | 19.9%), and self-employed (not incorporated) (14 | 9.9%) make up the most common classes of employment.
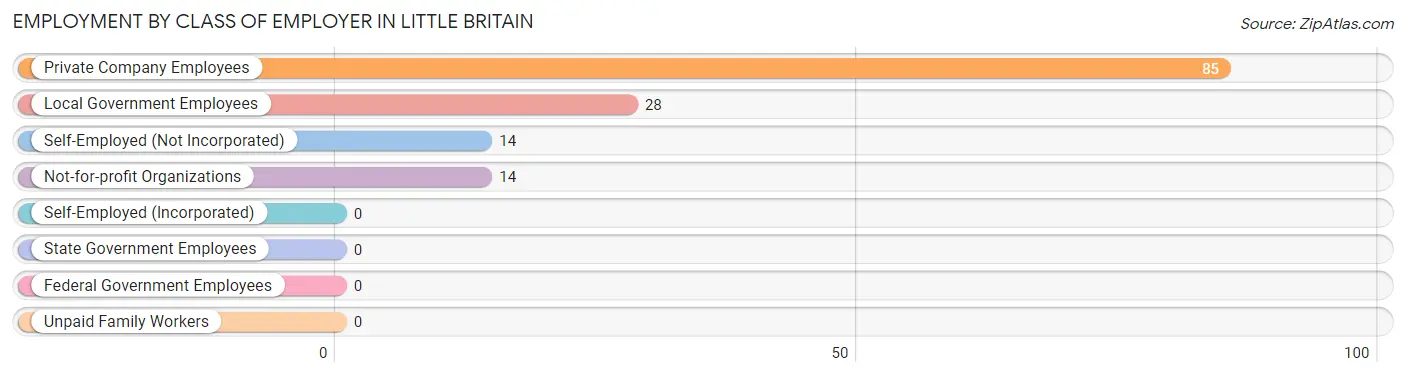
| Employer Class | # Employees | % Employees |
| Private Company Employees | 85 | 60.3% |
| Self-Employed (Incorporated) | 0 | 0.0% |
| Self-Employed (Not Incorporated) | 14 | 9.9% |
| Not-for-profit Organizations | 14 | 9.9% |
| Local Government Employees | 28 | 19.9% |
| State Government Employees | 0 | 0.0% |
| Federal Government Employees | 0 | 0.0% |
| Unpaid Family Workers | 0 | 0.0% |
| Total | 141 | 100.0% |
Employment Status by Age in Little Britain
According to the labor force statistics for Little Britain, out of the total population over 16 years of age (287), 66.2% or 190 individuals are in the labor force, with 15.3% or 29 of them unemployed. The age group with the highest labor force participation rate is 20 to 24 years, with 100.0% or 56 individuals in the labor force. Within the labor force, the 20 to 24 years age range has the highest percentage of unemployed individuals, with 51.8% or 29 of them being unemployed.
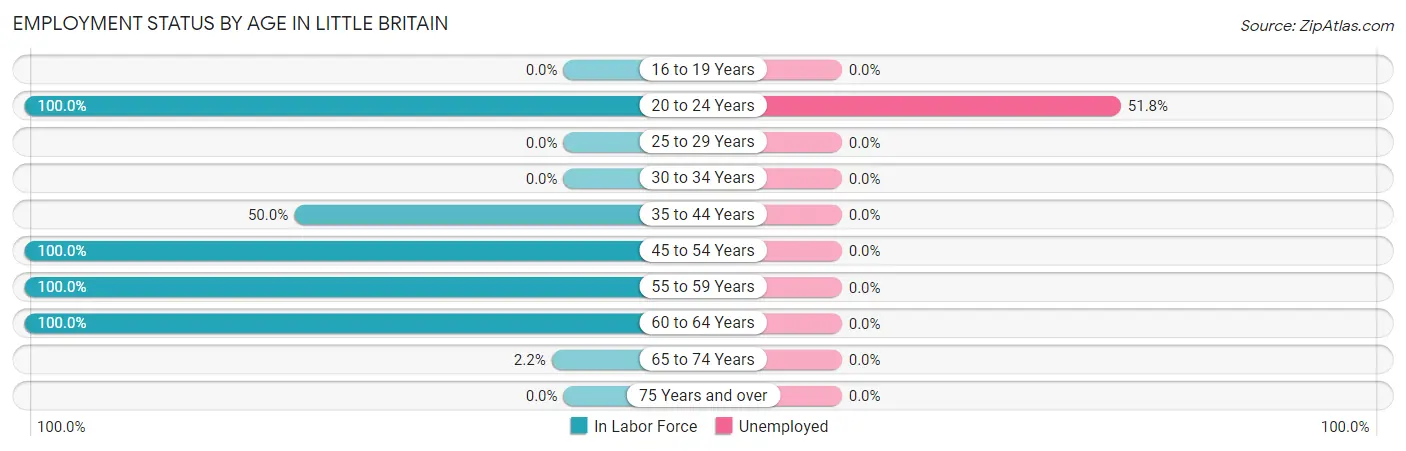
| Age Bracket | In Labor Force | Unemployed |
| 16 to 19 Years | 0 (0.0%) | 0 (0.0%) |
| 20 to 24 Years | 56 (100.0%) | 29 (51.8%) |
| 25 to 29 Years | 0 (0.0%) | 0 (0.0%) |
| 30 to 34 Years | 0 (0.0%) | 0 (0.0%) |
| 35 to 44 Years | 20 (50.0%) | 0 (0.0%) |
| 45 to 54 Years | 24 (100.0%) | 0 (0.0%) |
| 55 to 59 Years | 46 (100.0%) | 0 (0.0%) |
| 60 to 64 Years | 43 (100.0%) | 0 (0.0%) |
| 65 to 74 Years | 1 (2.2%) | 0 (0.0%) |
| 75 Years and over | 0 (0.0%) | 0 (0.0%) |
| Total | 190 (66.2%) | 29 (15.3%) |
Employment Status by Educational Attainment in Little Britain
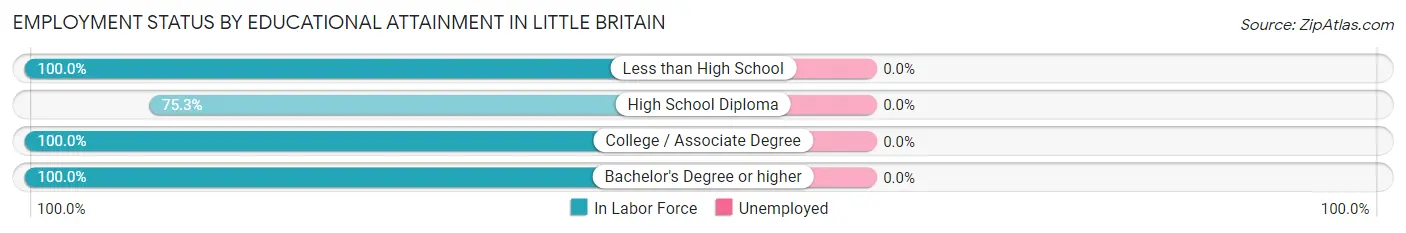
| Educational Attainment | In Labor Force | Unemployed |
| Less than High School | 14 (100.0%) | 0 (0.0%) |
| High School Diploma | 61 (75.3%) | 0 (0.0%) |
| College / Associate Degree | 20 (100.0%) | 0 (0.0%) |
| Bachelor's Degree or higher | 38 (100.0%) | 0 (0.0%) |
| Total | 133 (86.9%) | 0 (0.0%) |
Employment Occupations by Sex in Little Britain
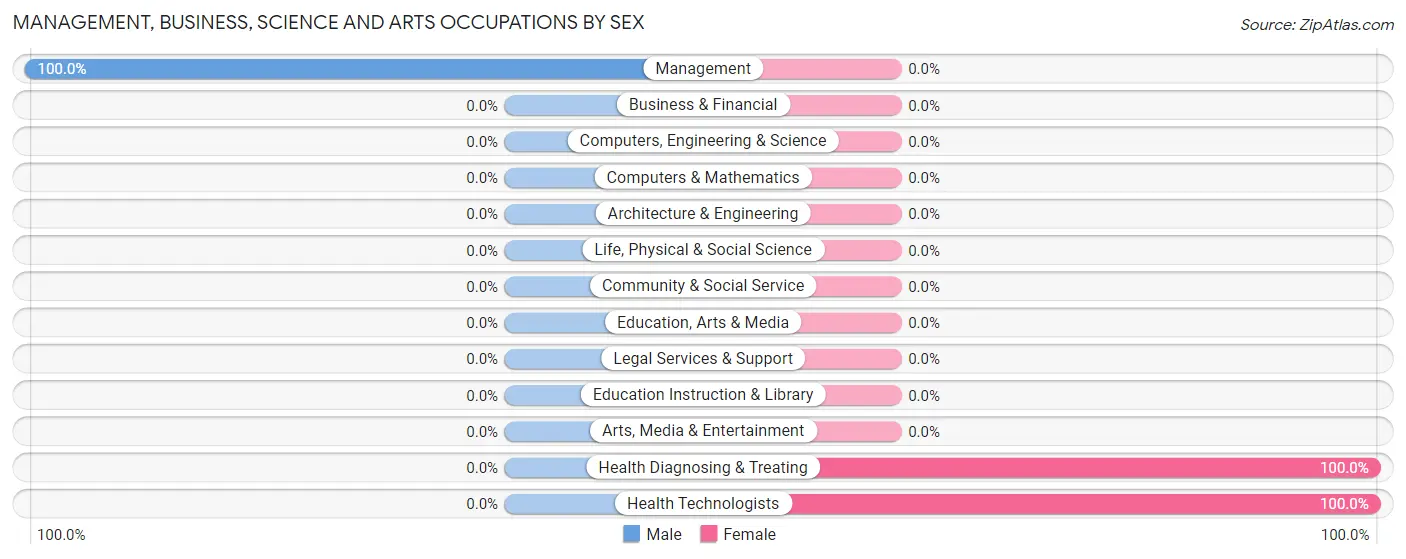
Management, Business, Science and Arts Occupations
The most common Management, Business, Science and Arts occupations in Little Britain are Health Diagnosing & Treating (51 | 31.7%), Health Technologists (51 | 31.7%), and Management (15 | 9.3%).
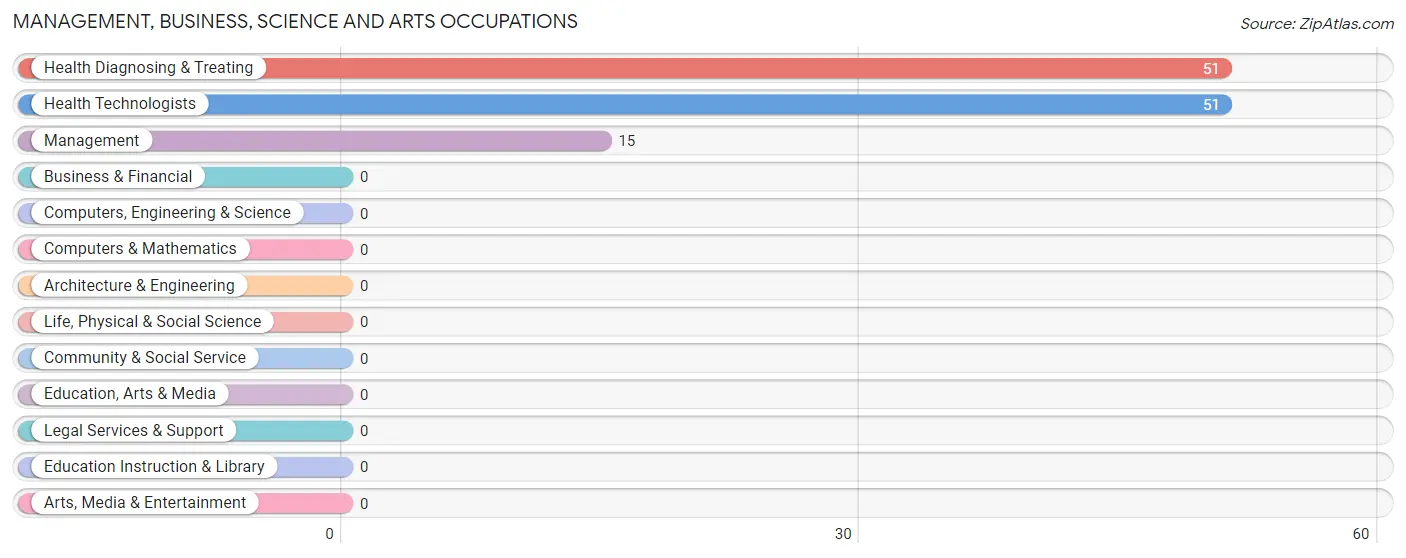
Management, Business, Science and Arts Occupations by Sex
| Occupation | Male | Female |
| Management | 15 (100.0%) | 0 (0.0%) |
| Business & Financial | 0 (0.0%) | 0 (0.0%) |
| Computers, Engineering & Science | 0 (0.0%) | 0 (0.0%) |
| Computers & Mathematics | 0 (0.0%) | 0 (0.0%) |
| Architecture & Engineering | 0 (0.0%) | 0 (0.0%) |
| Life, Physical & Social Science | 0 (0.0%) | 0 (0.0%) |
| Community & Social Service | 0 (0.0%) | 0 (0.0%) |
| Education, Arts & Media | 0 (0.0%) | 0 (0.0%) |
| Legal Services & Support | 0 (0.0%) | 0 (0.0%) |
| Education Instruction & Library | 0 (0.0%) | 0 (0.0%) |
| Arts, Media & Entertainment | 0 (0.0%) | 0 (0.0%) |
| Health Diagnosing & Treating | 0 (0.0%) | 51 (100.0%) |
| Health Technologists | 0 (0.0%) | 51 (100.0%) |
| Total (Category) | 15 (22.7%) | 51 (77.3%) |
| Total (Overall) | 76 (47.2%) | 85 (52.8%) |
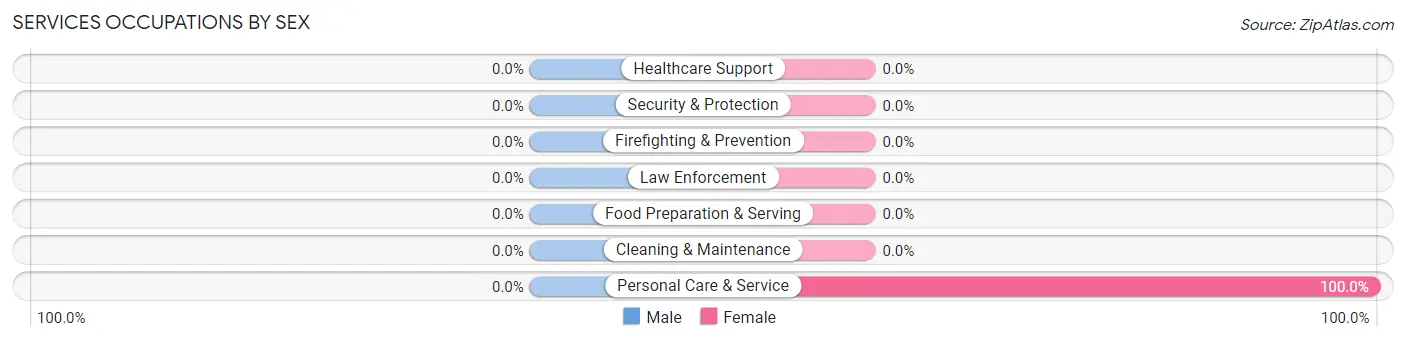
Services Occupations
The most common Services occupations in Little Britain are , and Personal Care & Service (20 | 12.4%).
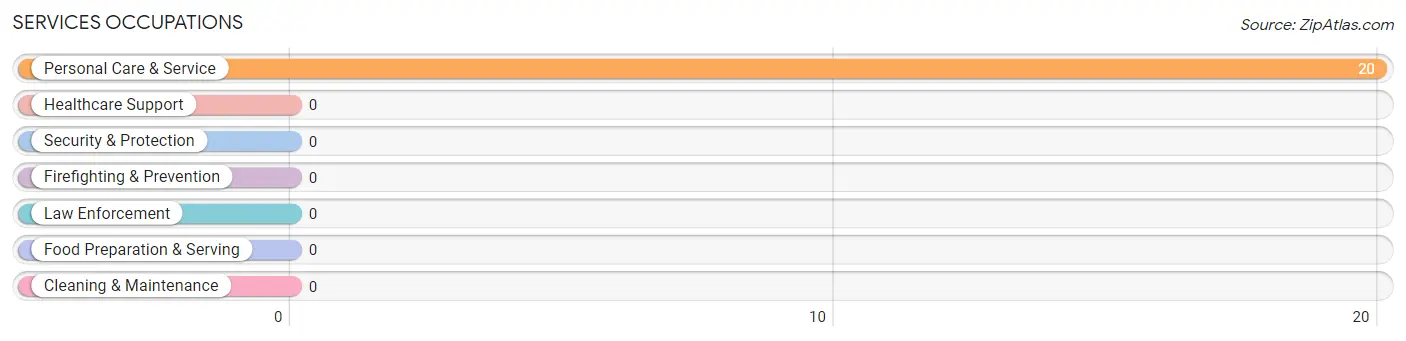
Services Occupations by Sex
| Occupation | Male | Female |
| Healthcare Support | 0 (0.0%) | 0 (0.0%) |
| Security & Protection | 0 (0.0%) | 0 (0.0%) |
| Firefighting & Prevention | 0 (0.0%) | 0 (0.0%) |
| Law Enforcement | 0 (0.0%) | 0 (0.0%) |
| Food Preparation & Serving | 0 (0.0%) | 0 (0.0%) |
| Cleaning & Maintenance | 0 (0.0%) | 0 (0.0%) |
| Personal Care & Service | 0 (0.0%) | 20 (100.0%) |
| Total (Category) | 0 (0.0%) | 20 (100.0%) |
| Total (Overall) | 76 (47.2%) | 85 (52.8%) |
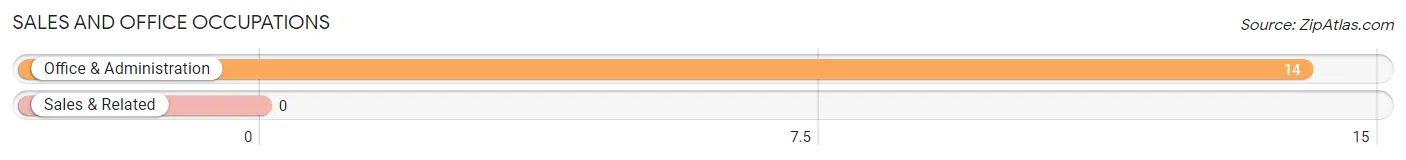
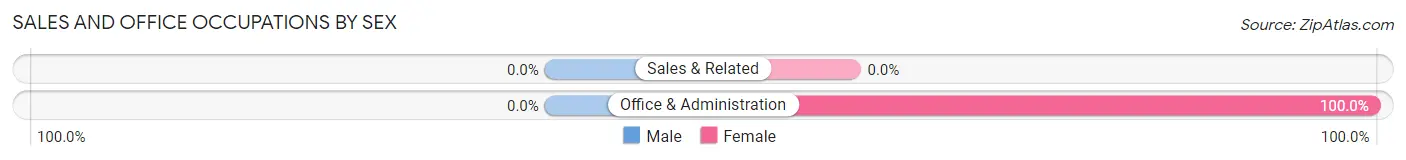
Sales and Office Occupations
The most common Sales and Office occupations in Little Britain are , and Office & Administration (14 | 8.7%).
Sales and Office Occupations by Sex
| Occupation | Male | Female |
| Sales & Related | 0 (0.0%) | 0 (0.0%) |
| Office & Administration | 0 (0.0%) | 14 (100.0%) |
| Total (Category) | 0 (0.0%) | 14 (100.0%) |
| Total (Overall) | 76 (47.2%) | 85 (52.8%) |
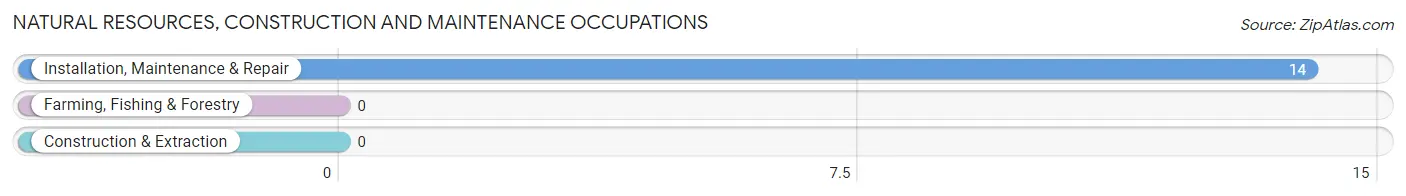
Natural Resources, Construction and Maintenance Occupations
The most common Natural Resources, Construction and Maintenance occupations in Little Britain are , and Installation, Maintenance & Repair (14 | 8.7%).
Natural Resources, Construction and Maintenance Occupations by Sex
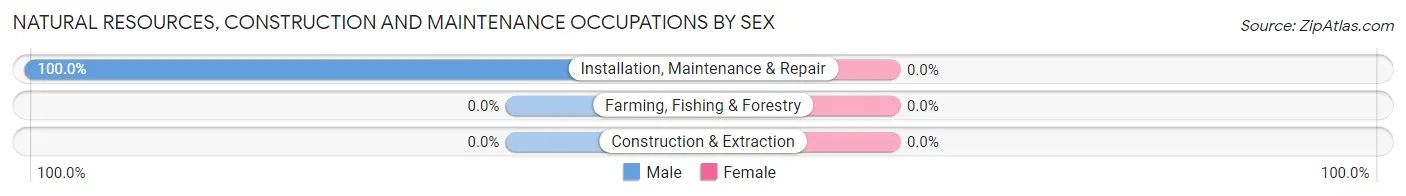
| Occupation | Male | Female |
| Farming, Fishing & Forestry | 0 (0.0%) | 0 (0.0%) |
| Construction & Extraction | 0 (0.0%) | 0 (0.0%) |
| Installation, Maintenance & Repair | 14 (100.0%) | 0 (0.0%) |
| Total (Category) | 14 (100.0%) | 0 (0.0%) |
| Total (Overall) | 76 (47.2%) | 85 (52.8%) |
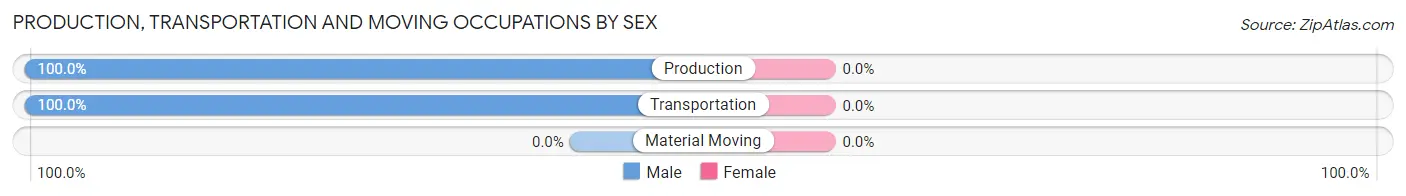
Production, Transportation and Moving Occupations
The most common Production, Transportation and Moving occupations in Little Britain are Transportation (26 | 16.2%), and Production (21 | 13.0%).
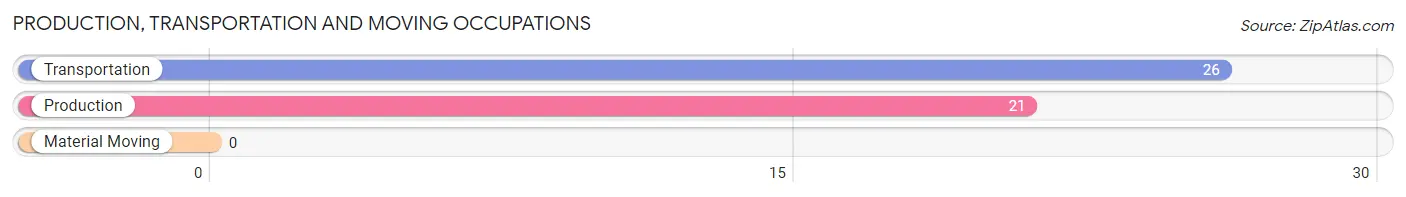
Production, Transportation and Moving Occupations by Sex
| Occupation | Male | Female |
| Production | 21 (100.0%) | 0 (0.0%) |
| Transportation | 26 (100.0%) | 0 (0.0%) |
| Material Moving | 0 (0.0%) | 0 (0.0%) |
| Total (Category) | 47 (100.0%) | 0 (0.0%) |
| Total (Overall) | 76 (47.2%) | 85 (52.8%) |
Employment Industries by Sex in Little Britain
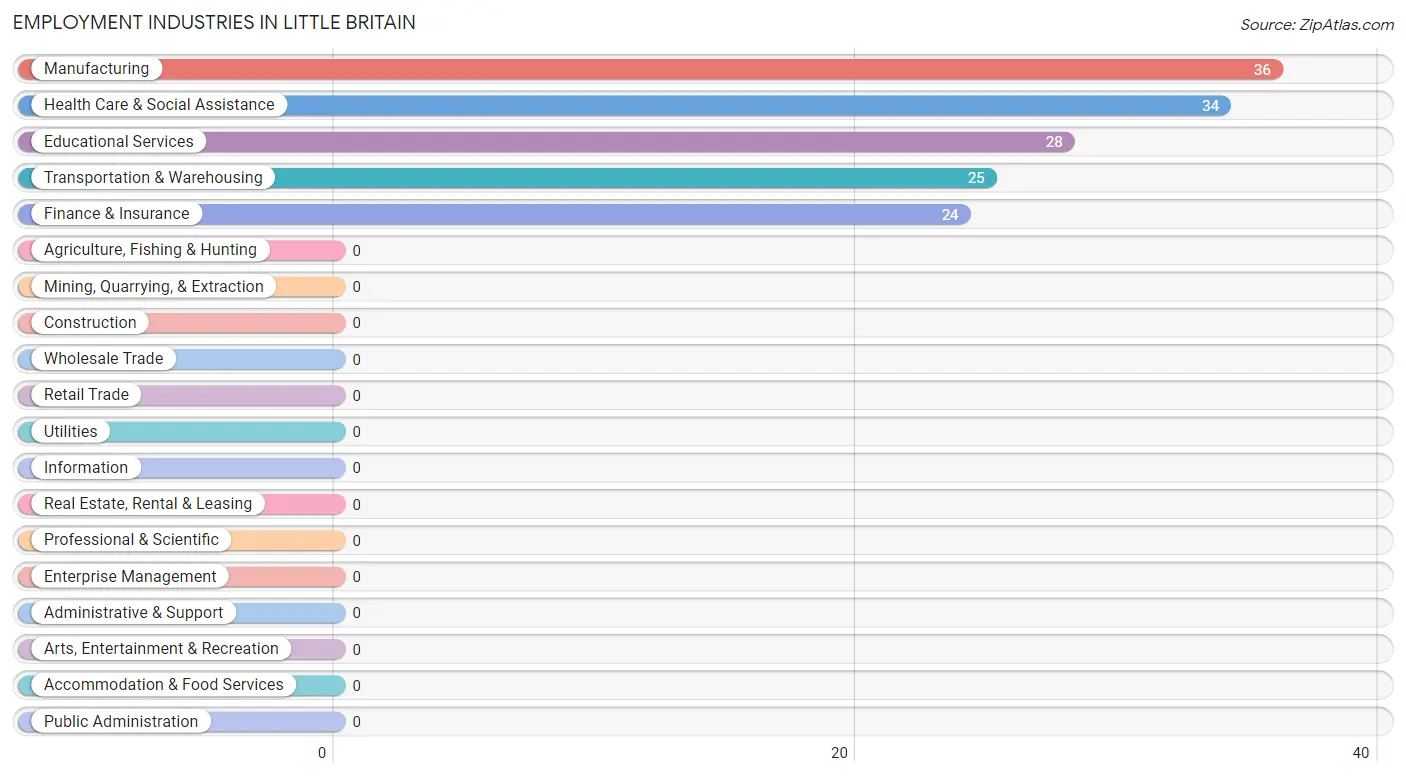
Employment Industries in Little Britain
The major employment industries in Little Britain include Manufacturing (36 | 22.4%), Health Care & Social Assistance (34 | 21.1%), Educational Services (28 | 17.4%), Transportation & Warehousing (25 | 15.5%), and Finance & Insurance (24 | 14.9%).
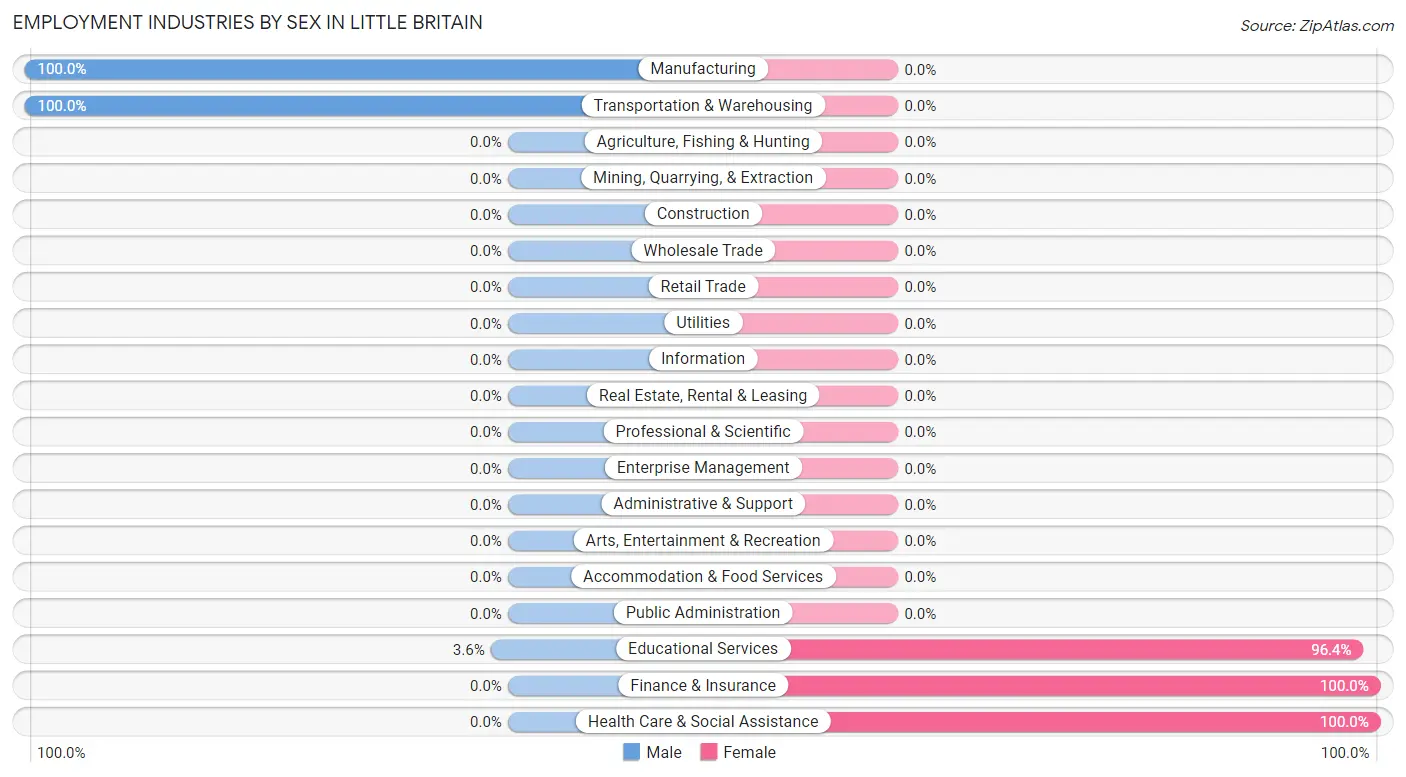
Employment Industries by Sex in Little Britain
The Little Britain industries that see more men than women are Manufacturing (100.0%), Transportation & Warehousing (100.0%), and Educational Services (3.6%), whereas the industries that tend to have a higher number of women are Finance & Insurance (100.0%), Health Care & Social Assistance (100.0%), and Educational Services (96.4%).
| Industry | Male | Female |
| Agriculture, Fishing & Hunting | 0 (0.0%) | 0 (0.0%) |
| Mining, Quarrying, & Extraction | 0 (0.0%) | 0 (0.0%) |
| Construction | 0 (0.0%) | 0 (0.0%) |
| Manufacturing | 36 (100.0%) | 0 (0.0%) |
| Wholesale Trade | 0 (0.0%) | 0 (0.0%) |
| Retail Trade | 0 (0.0%) | 0 (0.0%) |
| Transportation & Warehousing | 25 (100.0%) | 0 (0.0%) |
| Utilities | 0 (0.0%) | 0 (0.0%) |
| Information | 0 (0.0%) | 0 (0.0%) |
| Finance & Insurance | 0 (0.0%) | 24 (100.0%) |
| Real Estate, Rental & Leasing | 0 (0.0%) | 0 (0.0%) |
| Professional & Scientific | 0 (0.0%) | 0 (0.0%) |
| Enterprise Management | 0 (0.0%) | 0 (0.0%) |
| Administrative & Support | 0 (0.0%) | 0 (0.0%) |
| Educational Services | 1 (3.6%) | 27 (96.4%) |
| Health Care & Social Assistance | 0 (0.0%) | 34 (100.0%) |
| Arts, Entertainment & Recreation | 0 (0.0%) | 0 (0.0%) |
| Accommodation & Food Services | 0 (0.0%) | 0 (0.0%) |
| Public Administration | 0 (0.0%) | 0 (0.0%) |
| Total | 76 (47.2%) | 85 (52.8%) |
Education in Little Britain
School Enrollment in Little Britain
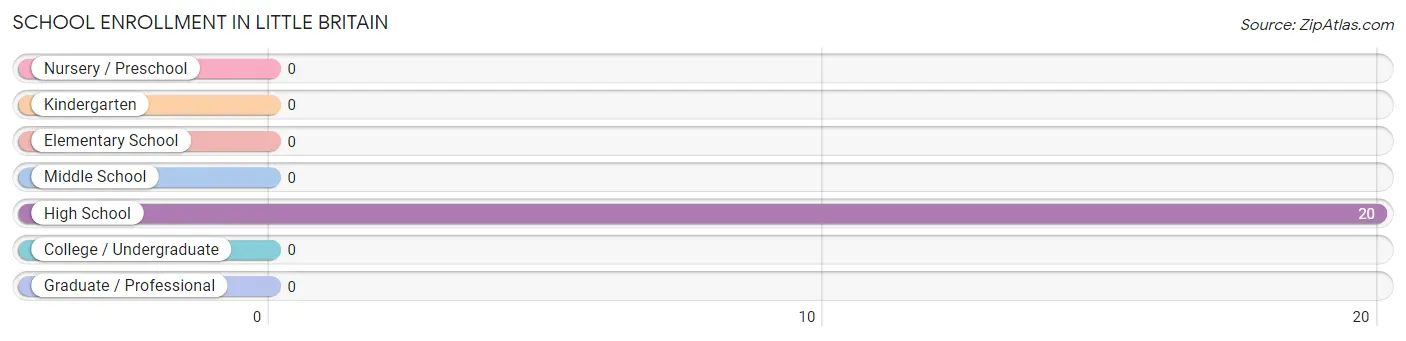
| School Level | # Students | % Students |
| Nursery / Preschool | 0 | 0.0% |
| Kindergarten | 0 | 0.0% |
| Elementary School | 0 | 0.0% |
| Middle School | 0 | 0.0% |
| High School | 20 | 100.0% |
| College / Undergraduate | 0 | 0.0% |
| Graduate / Professional | 0 | 0.0% |
| Total | 20 | 100.0% |
School Enrollment by Age by Funding Source in Little Britain
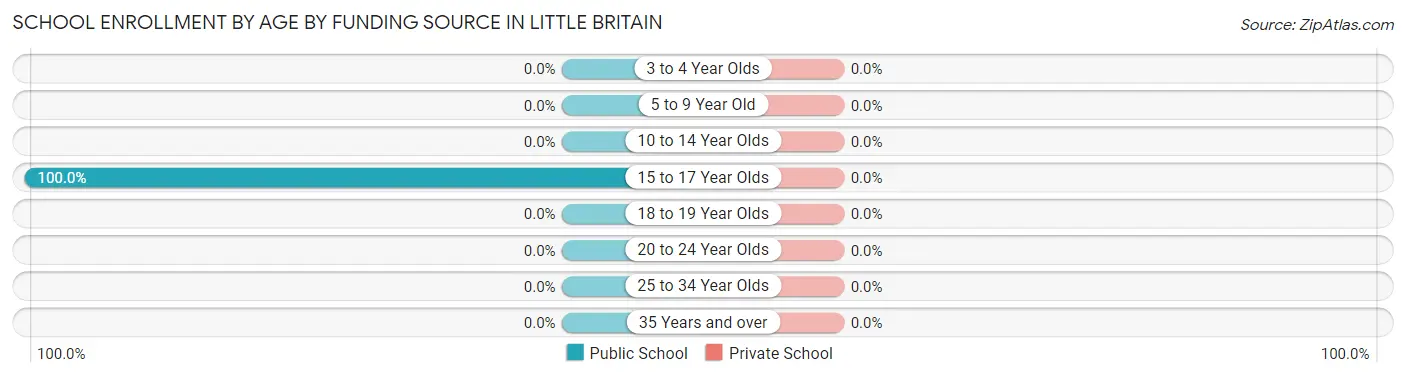
| Age Bracket | Public School | Private School |
| 3 to 4 Year Olds | 0 (0.0%) | 0 (0.0%) |
| 5 to 9 Year Old | 0 (0.0%) | 0 (0.0%) |
| 10 to 14 Year Olds | 0 (0.0%) | 0 (0.0%) |
| 15 to 17 Year Olds | 20 (100.0%) | 0 (0.0%) |
| 18 to 19 Year Olds | 0 (0.0%) | 0 (0.0%) |
| 20 to 24 Year Olds | 0 (0.0%) | 0 (0.0%) |
| 25 to 34 Year Olds | 0 (0.0%) | 0 (0.0%) |
| 35 Years and over | 0 (0.0%) | 0 (0.0%) |
| Total | 20 (100.0%) | 0 (0.0%) |
Educational Attainment by Field of Study in Little Britain
Science & technology (24 | 63.2%), and business (14 | 36.8%) are the most common fields of study among 38 individuals in Little Britain who have obtained a bachelor's degree or higher.
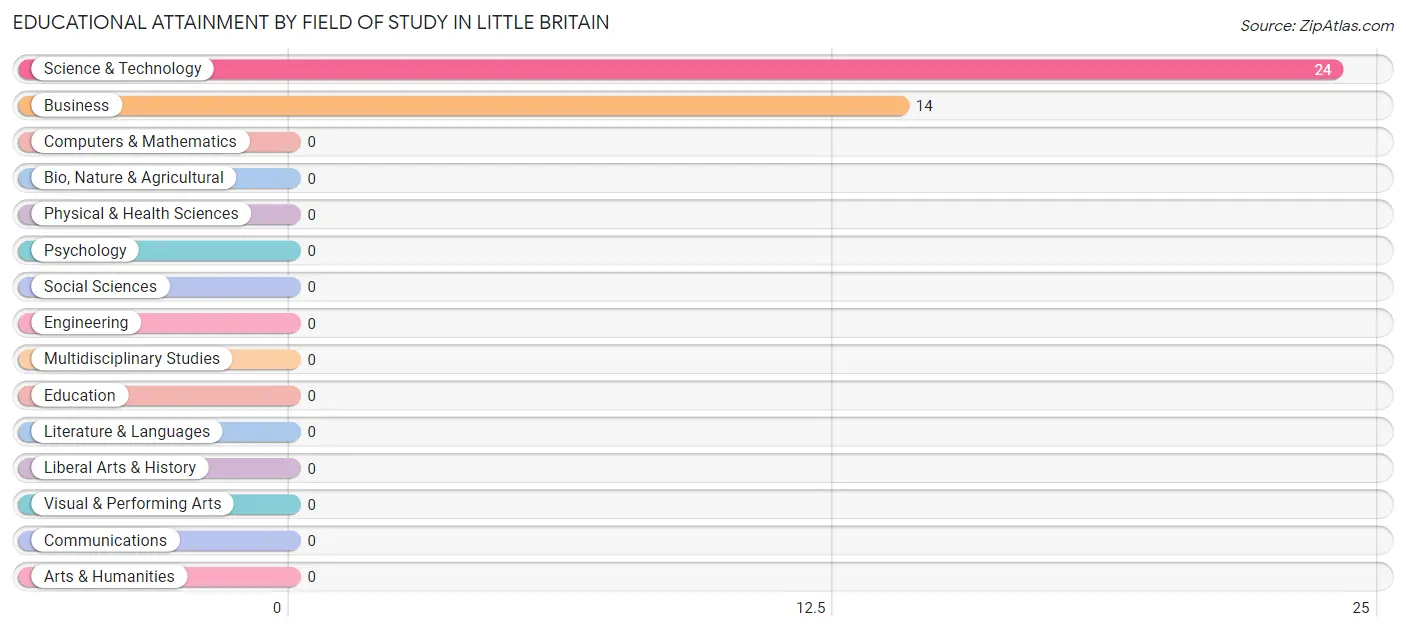
| Field of Study | # Graduates | % Graduates |
| Computers & Mathematics | 0 | 0.0% |
| Bio, Nature & Agricultural | 0 | 0.0% |
| Physical & Health Sciences | 0 | 0.0% |
| Psychology | 0 | 0.0% |
| Social Sciences | 0 | 0.0% |
| Engineering | 0 | 0.0% |
| Multidisciplinary Studies | 0 | 0.0% |
| Science & Technology | 24 | 63.2% |
| Business | 14 | 36.8% |
| Education | 0 | 0.0% |
| Literature & Languages | 0 | 0.0% |
| Liberal Arts & History | 0 | 0.0% |
| Visual & Performing Arts | 0 | 0.0% |
| Communications | 0 | 0.0% |
| Arts & Humanities | 0 | 0.0% |
| Total | 38 | 100.0% |
Transportation & Commute in Little Britain
Vehicle Availability by Sex in Little Britain
The most prevalent vehicle ownership categories in Little Britain are males with 2 vehicles (51, accounting for 67.1%) and females with 2 vehicles (14, making up 78.5%).
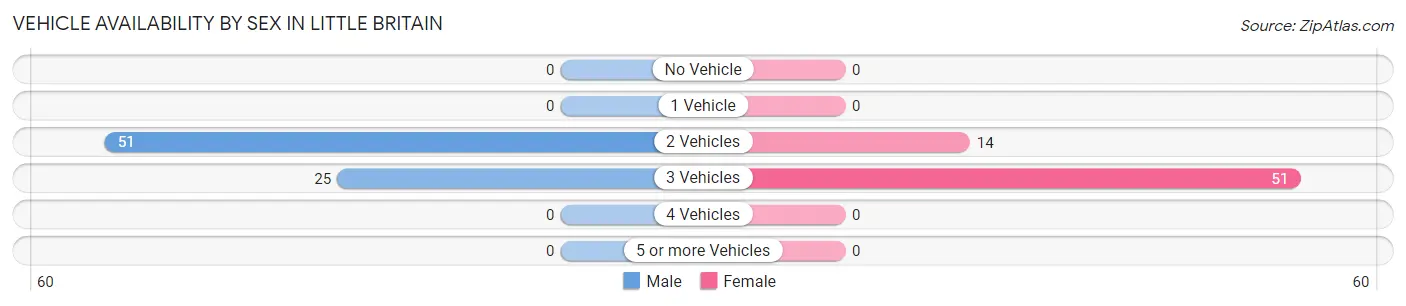
| Vehicles Available | Male | Female |
| No Vehicle | 0 (0.0%) | 0 (0.0%) |
| 1 Vehicle | 0 (0.0%) | 0 (0.0%) |
| 2 Vehicles | 51 (67.1%) | 14 (21.5%) |
| 3 Vehicles | 25 (32.9%) | 51 (78.5%) |
| 4 Vehicles | 0 (0.0%) | 0 (0.0%) |
| 5 or more Vehicles | 0 (0.0%) | 0 (0.0%) |
| Total | 76 (100.0%) | 65 (100.0%) |
Commute Time in Little Britain
The most frequently occuring commute durations in Little Britain are 15 to 19 minutes (46 commuters, 39.3%), 45 to 59 minutes (27 commuters, 23.1%), and 30 to 34 minutes (15 commuters, 12.8%).
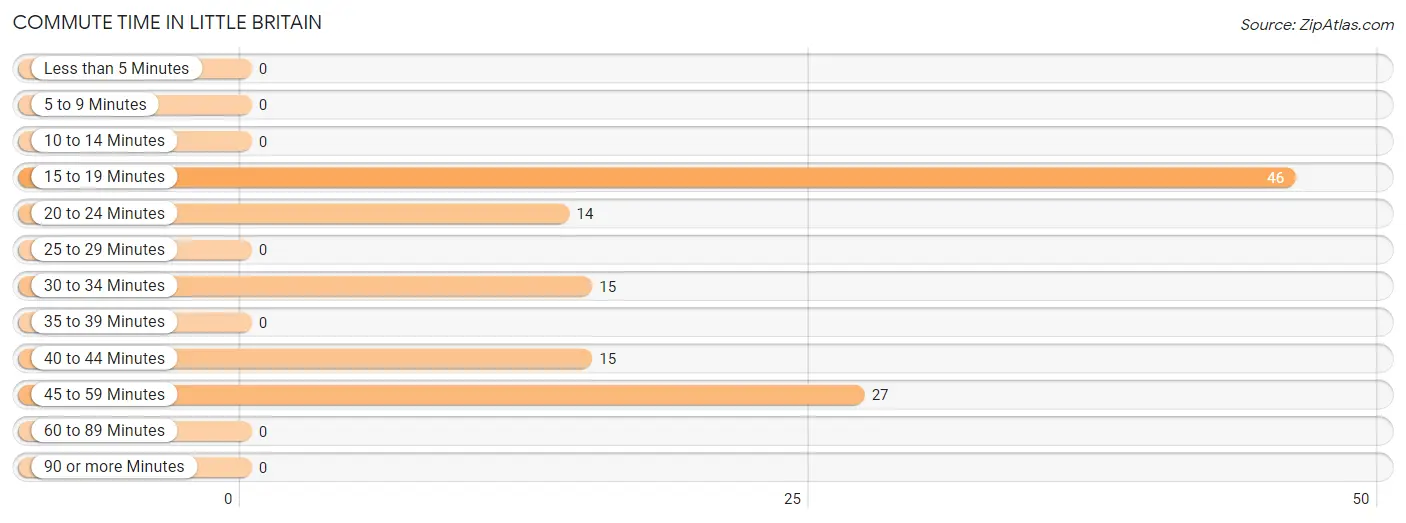
| Commute Time | # Commuters | % Commuters |
| Less than 5 Minutes | 0 | 0.0% |
| 5 to 9 Minutes | 0 | 0.0% |
| 10 to 14 Minutes | 0 | 0.0% |
| 15 to 19 Minutes | 46 | 39.3% |
| 20 to 24 Minutes | 14 | 12.0% |
| 25 to 29 Minutes | 0 | 0.0% |
| 30 to 34 Minutes | 15 | 12.8% |
| 35 to 39 Minutes | 0 | 0.0% |
| 40 to 44 Minutes | 15 | 12.8% |
| 45 to 59 Minutes | 27 | 23.1% |
| 60 to 89 Minutes | 0 | 0.0% |
| 90 or more Minutes | 0 | 0.0% |
Commute Time by Sex in Little Britain
The most common commute times in Little Britain are 15 to 19 minutes (46 commuters, 60.5%) for males and 45 to 59 minutes (27 commuters, 65.8%) for females.
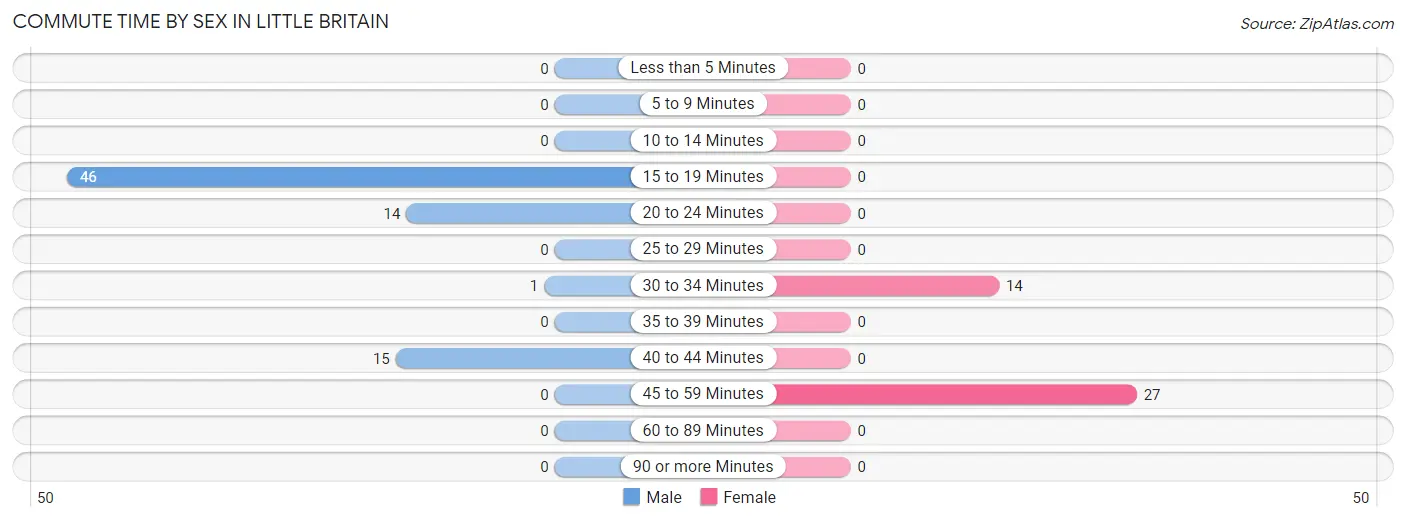
| Commute Time | Male | Female |
| Less than 5 Minutes | 0 (0.0%) | 0 (0.0%) |
| 5 to 9 Minutes | 0 (0.0%) | 0 (0.0%) |
| 10 to 14 Minutes | 0 (0.0%) | 0 (0.0%) |
| 15 to 19 Minutes | 46 (60.5%) | 0 (0.0%) |
| 20 to 24 Minutes | 14 (18.4%) | 0 (0.0%) |
| 25 to 29 Minutes | 0 (0.0%) | 0 (0.0%) |
| 30 to 34 Minutes | 1 (1.3%) | 14 (34.2%) |
| 35 to 39 Minutes | 0 (0.0%) | 0 (0.0%) |
| 40 to 44 Minutes | 15 (19.7%) | 0 (0.0%) |
| 45 to 59 Minutes | 0 (0.0%) | 27 (65.8%) |
| 60 to 89 Minutes | 0 (0.0%) | 0 (0.0%) |
| 90 or more Minutes | 0 (0.0%) | 0 (0.0%) |
Time of Departure to Work by Sex in Little Britain
The most frequent times of departure to work in Little Britain are 5:00 AM to 5:29 AM (25, 32.9%) for males and 7:30 AM to 7:59 AM (27, 65.8%) for females.
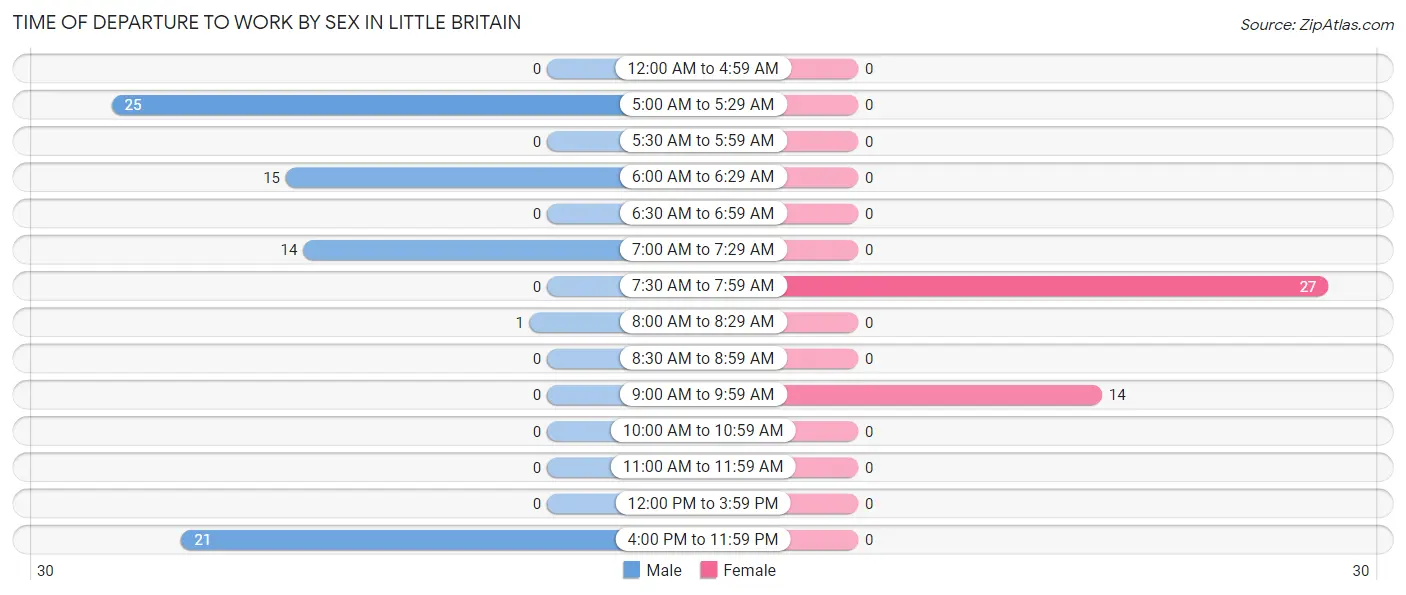
| Time of Departure | Male | Female |
| 12:00 AM to 4:59 AM | 0 (0.0%) | 0 (0.0%) |
| 5:00 AM to 5:29 AM | 25 (32.9%) | 0 (0.0%) |
| 5:30 AM to 5:59 AM | 0 (0.0%) | 0 (0.0%) |
| 6:00 AM to 6:29 AM | 15 (19.7%) | 0 (0.0%) |
| 6:30 AM to 6:59 AM | 0 (0.0%) | 0 (0.0%) |
| 7:00 AM to 7:29 AM | 14 (18.4%) | 0 (0.0%) |
| 7:30 AM to 7:59 AM | 0 (0.0%) | 27 (65.8%) |
| 8:00 AM to 8:29 AM | 1 (1.3%) | 0 (0.0%) |
| 8:30 AM to 8:59 AM | 0 (0.0%) | 0 (0.0%) |
| 9:00 AM to 9:59 AM | 0 (0.0%) | 14 (34.2%) |
| 10:00 AM to 10:59 AM | 0 (0.0%) | 0 (0.0%) |
| 11:00 AM to 11:59 AM | 0 (0.0%) | 0 (0.0%) |
| 12:00 PM to 3:59 PM | 0 (0.0%) | 0 (0.0%) |
| 4:00 PM to 11:59 PM | 21 (27.6%) | 0 (0.0%) |
| Total | 76 (100.0%) | 41 (100.0%) |
Housing Occupancy in Little Britain
Occupancy by Ownership in Little Britain
Of the total 103 dwellings in Little Britain, owner-occupied units account for 103 (100.0%), while renter-occupied units make up 0 (0.0%).
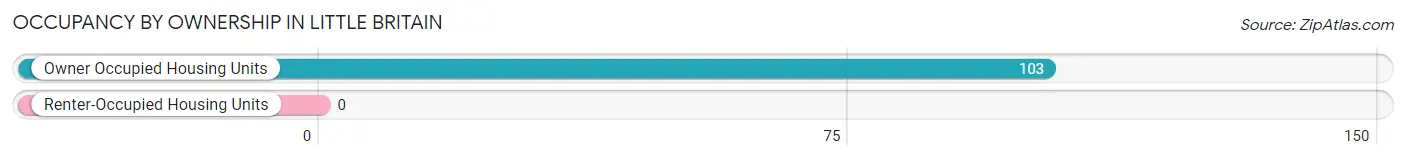
| Occupancy | # Housing Units | % Housing Units |
| Owner Occupied Housing Units | 103 | 100.0% |
| Renter-Occupied Housing Units | 0 | 0.0% |
| Total Occupied Housing Units | 103 | 100.0% |
Occupancy by Household Size in Little Britain
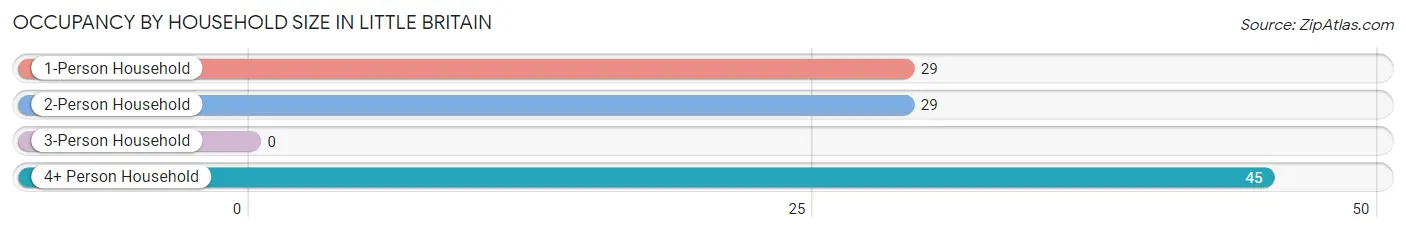
| Household Size | # Housing Units | % Housing Units |
| 1-Person Household | 29 | 28.2% |
| 2-Person Household | 29 | 28.2% |
| 3-Person Household | 0 | 0.0% |
| 4+ Person Household | 45 | 43.7% |
| Total Housing Units | 103 | 100.0% |
Occupancy by Ownership by Household Size in Little Britain
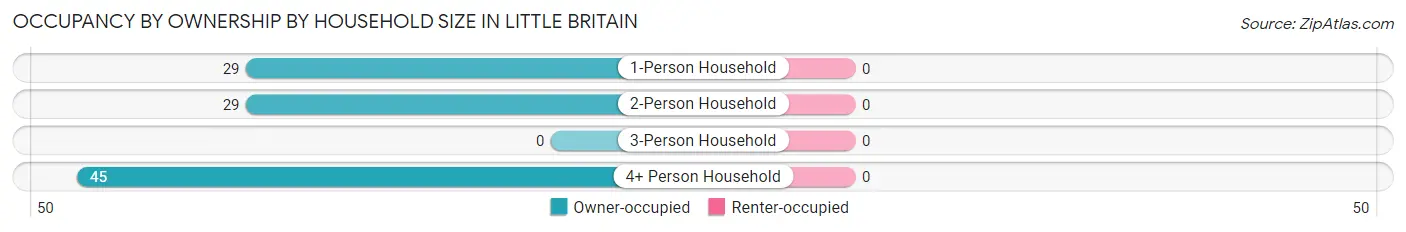
| Household Size | Owner-occupied | Renter-occupied |
| 1-Person Household | 29 (100.0%) | 0 (0.0%) |
| 2-Person Household | 29 (100.0%) | 0 (0.0%) |
| 3-Person Household | 0 (0.0%) | 0 (0.0%) |
| 4+ Person Household | 45 (100.0%) | 0 (0.0%) |
| Total Housing Units | 103 (100.0%) | 0 (0.0%) |
Occupancy by Educational Attainment in Little Britain
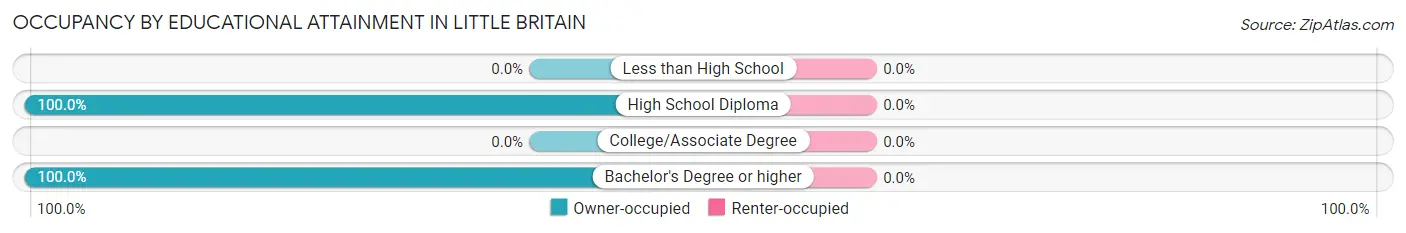
| Household Size | Owner-occupied | Renter-occupied |
| Less than High School | 0 (0.0%) | 0 (0.0%) |
| High School Diploma | 79 (100.0%) | 0 (0.0%) |
| College/Associate Degree | 0 (0.0%) | 0 (0.0%) |
| Bachelor's Degree or higher | 24 (100.0%) | 0 (0.0%) |
Occupancy by Age of Householder in Little Britain
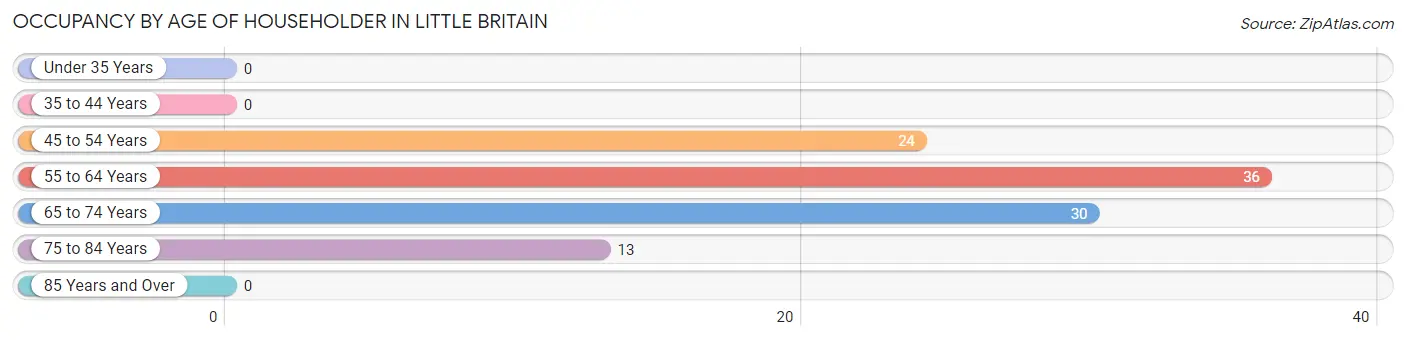
| Age Bracket | # Households | % Households |
| Under 35 Years | 0 | 0.0% |
| 35 to 44 Years | 0 | 0.0% |
| 45 to 54 Years | 24 | 23.3% |
| 55 to 64 Years | 36 | 34.9% |
| 65 to 74 Years | 30 | 29.1% |
| 75 to 84 Years | 13 | 12.6% |
| 85 Years and Over | 0 | 0.0% |
| Total | 103 | 100.0% |
Housing Finances in Little Britain
Median Income by Occupancy in Little Britain
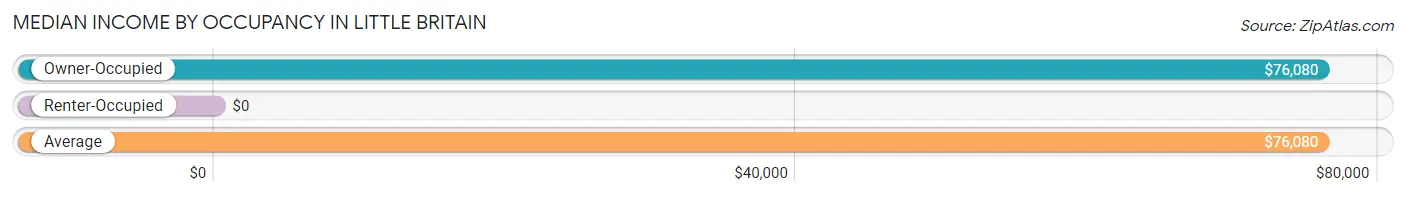
| Occupancy Type | # Households | Median Income |
| Owner-Occupied | 103 (100.0%) | $76,080 |
| Renter-Occupied | 0 (0.0%) | $0 |
| Average | 103 (100.0%) | $76,080 |
Occupancy by Householder Income Bracket in Little Britain
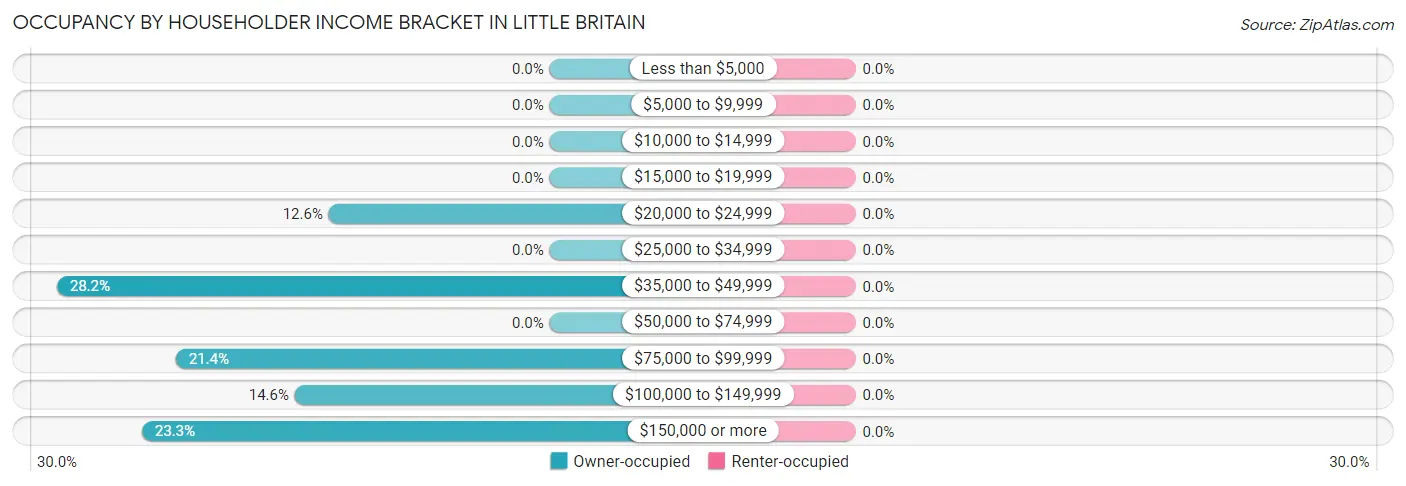
| Income Bracket | Owner-occupied | Renter-occupied |
| Less than $5,000 | 0 (0.0%) | 0 (0.0%) |
| $5,000 to $9,999 | 0 (0.0%) | 0 (0.0%) |
| $10,000 to $14,999 | 0 (0.0%) | 0 (0.0%) |
| $15,000 to $19,999 | 0 (0.0%) | 0 (0.0%) |
| $20,000 to $24,999 | 13 (12.6%) | 0 (0.0%) |
| $25,000 to $34,999 | 0 (0.0%) | 0 (0.0%) |
| $35,000 to $49,999 | 29 (28.2%) | 0 (0.0%) |
| $50,000 to $74,999 | 0 (0.0%) | 0 (0.0%) |
| $75,000 to $99,999 | 22 (21.4%) | 0 (0.0%) |
| $100,000 to $149,999 | 15 (14.6%) | 0 (0.0%) |
| $150,000 or more | 24 (23.3%) | 0 (0.0%) |
| Total | 103 (100.0%) | 0 (0.0%) |
Monthly Housing Cost Tiers in Little Britain
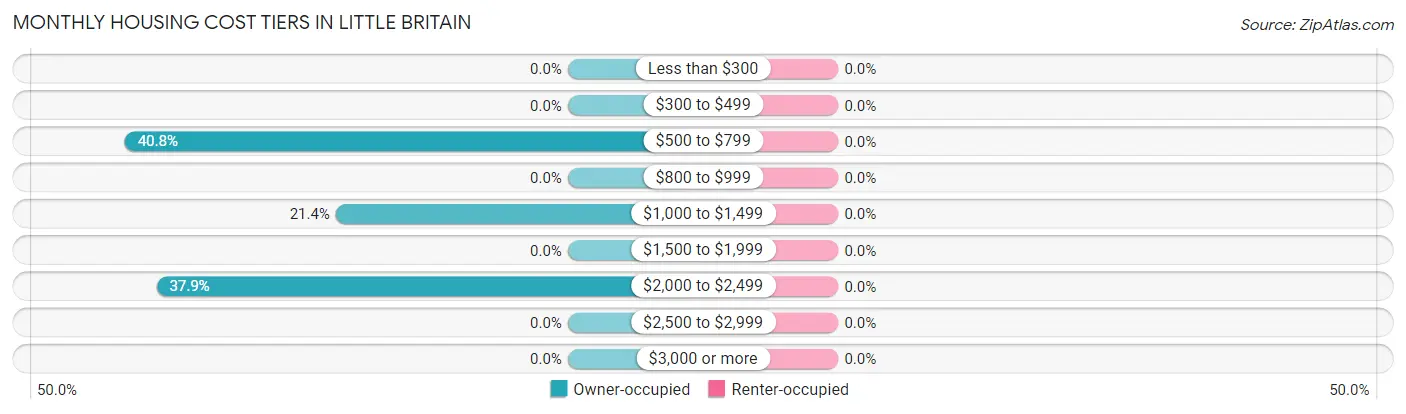
| Monthly Cost | Owner-occupied | Renter-occupied |
| Less than $300 | 0 (0.0%) | 0 (0.0%) |
| $300 to $499 | 0 (0.0%) | 0 (0.0%) |
| $500 to $799 | 42 (40.8%) | 0 (0.0%) |
| $800 to $999 | 0 (0.0%) | 0 (0.0%) |
| $1,000 to $1,499 | 22 (21.4%) | 0 (0.0%) |
| $1,500 to $1,999 | 0 (0.0%) | 0 (0.0%) |
| $2,000 to $2,499 | 39 (37.9%) | 0 (0.0%) |
| $2,500 to $2,999 | 0 (0.0%) | 0 (0.0%) |
| $3,000 or more | 0 (0.0%) | 0 (0.0%) |
| Total | 103 (100.0%) | 0 (0.0%) |
Physical Housing Characteristics in Little Britain
Housing Structures in Little Britain
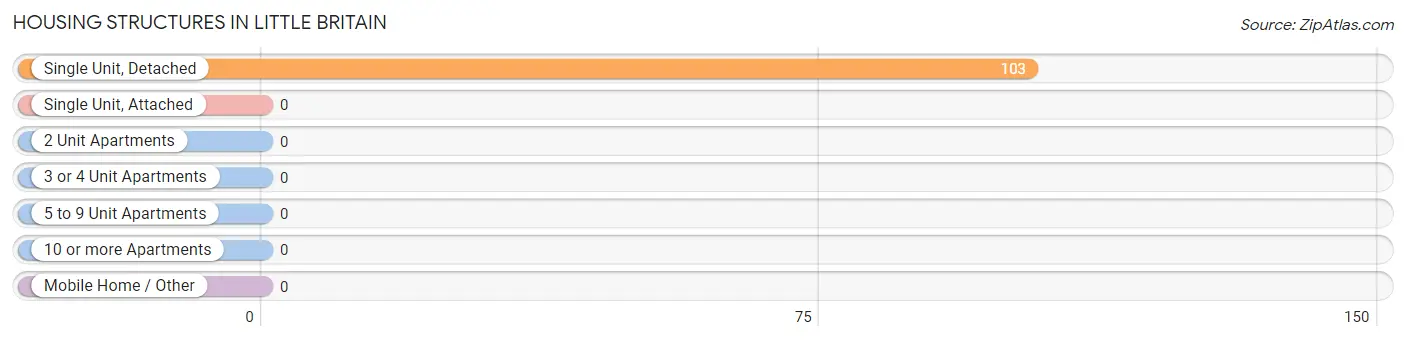
| Structure Type | # Housing Units | % Housing Units |
| Single Unit, Detached | 103 | 100.0% |
| Single Unit, Attached | 0 | 0.0% |
| 2 Unit Apartments | 0 | 0.0% |
| 3 or 4 Unit Apartments | 0 | 0.0% |
| 5 to 9 Unit Apartments | 0 | 0.0% |
| 10 or more Apartments | 0 | 0.0% |
| Mobile Home / Other | 0 | 0.0% |
| Total | 103 | 100.0% |
Housing Structures by Occupancy in Little Britain
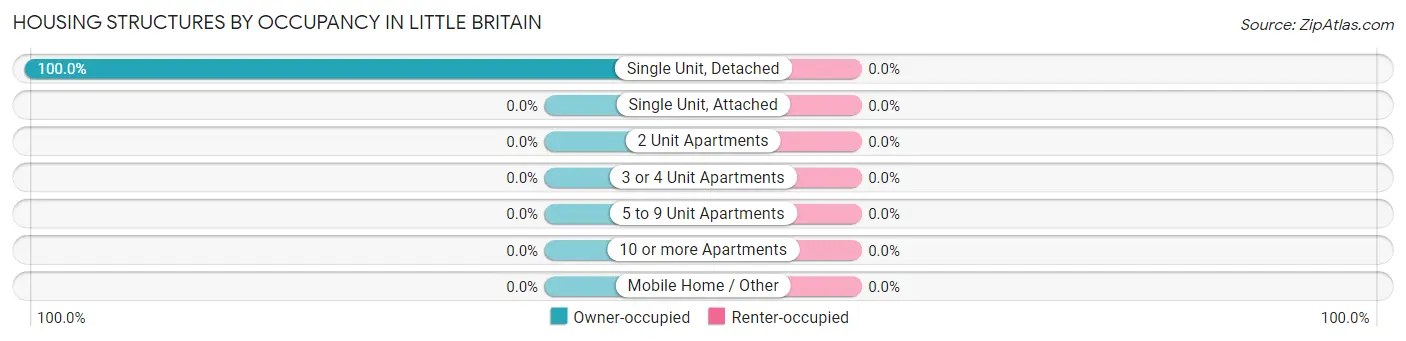
| Structure Type | Owner-occupied | Renter-occupied |
| Single Unit, Detached | 103 (100.0%) | 0 (0.0%) |
| Single Unit, Attached | 0 (0.0%) | 0 (0.0%) |
| 2 Unit Apartments | 0 (0.0%) | 0 (0.0%) |
| 3 or 4 Unit Apartments | 0 (0.0%) | 0 (0.0%) |
| 5 to 9 Unit Apartments | 0 (0.0%) | 0 (0.0%) |
| 10 or more Apartments | 0 (0.0%) | 0 (0.0%) |
| Mobile Home / Other | 0 (0.0%) | 0 (0.0%) |
| Total | 103 (100.0%) | 0 (0.0%) |
Housing Structures by Number of Rooms in Little Britain
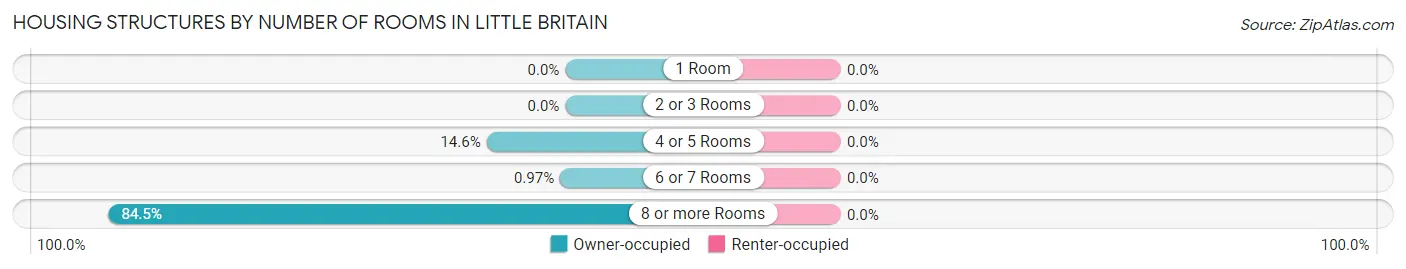
| Number of Rooms | Owner-occupied | Renter-occupied |
| 1 Room | 0 (0.0%) | 0 (0.0%) |
| 2 or 3 Rooms | 0 (0.0%) | 0 (0.0%) |
| 4 or 5 Rooms | 15 (14.6%) | 0 (0.0%) |
| 6 or 7 Rooms | 1 (1.0%) | 0 (0.0%) |
| 8 or more Rooms | 87 (84.5%) | 0 (0.0%) |
| Total | 103 (100.0%) | 0 (0.0%) |
Housing Structure by Heating Type in Little Britain
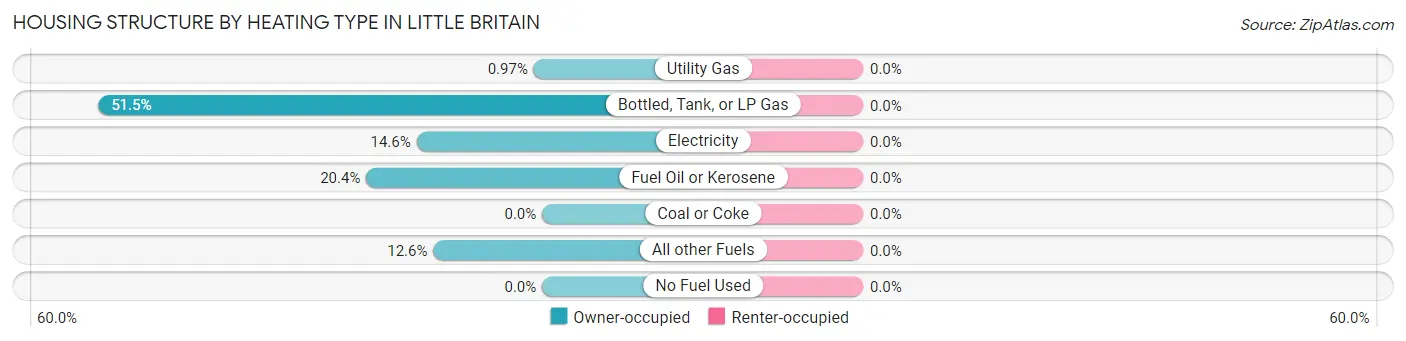
| Heating Type | Owner-occupied | Renter-occupied |
| Utility Gas | 1 (1.0%) | 0 (0.0%) |
| Bottled, Tank, or LP Gas | 53 (51.5%) | 0 (0.0%) |
| Electricity | 15 (14.6%) | 0 (0.0%) |
| Fuel Oil or Kerosene | 21 (20.4%) | 0 (0.0%) |
| Coal or Coke | 0 (0.0%) | 0 (0.0%) |
| All other Fuels | 13 (12.6%) | 0 (0.0%) |
| No Fuel Used | 0 (0.0%) | 0 (0.0%) |
| Total | 103 (100.0%) | 0 (0.0%) |
Household Vehicle Usage in Little Britain
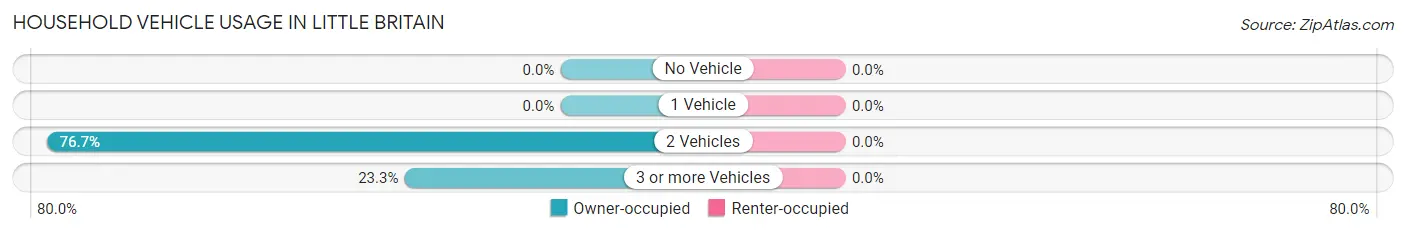
| Vehicles per Household | Owner-occupied | Renter-occupied |
| No Vehicle | 0 (0.0%) | 0 (0.0%) |
| 1 Vehicle | 0 (0.0%) | 0 (0.0%) |
| 2 Vehicles | 79 (76.7%) | 0 (0.0%) |
| 3 or more Vehicles | 24 (23.3%) | 0 (0.0%) |
| Total | 103 (100.0%) | 0 (0.0%) |
Real Estate & Mortgages in Little Britain
Real Estate and Mortgage Overview in Little Britain
| Characteristic | Without Mortgage | With Mortgage |
| Housing Units | 42 | 61 |
| Median Property Value | - | - |
| Median Household Income | - | - |
| Monthly Housing Costs | - | - |
| Real Estate Taxes | - | - |
Property Value by Mortgage Status in Little Britain
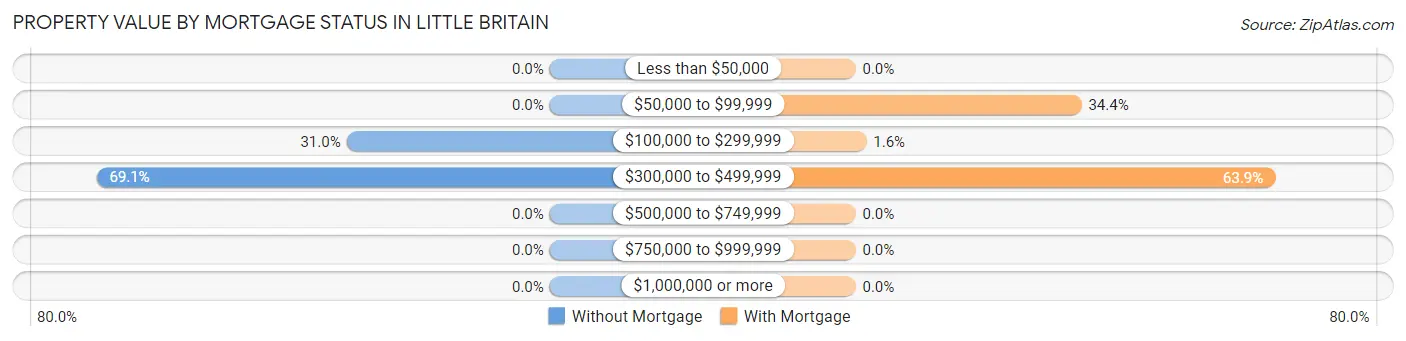
| Property Value | Without Mortgage | With Mortgage |
| Less than $50,000 | 0 (0.0%) | 0 (0.0%) |
| $50,000 to $99,999 | 0 (0.0%) | 21 (34.4%) |
| $100,000 to $299,999 | 13 (30.9%) | 1 (1.6%) |
| $300,000 to $499,999 | 29 (69.1%) | 39 (63.9%) |
| $500,000 to $749,999 | 0 (0.0%) | 0 (0.0%) |
| $750,000 to $999,999 | 0 (0.0%) | 0 (0.0%) |
| $1,000,000 or more | 0 (0.0%) | 0 (0.0%) |
| Total | 42 (100.0%) | 61 (100.0%) |
Household Income by Mortgage Status in Little Britain
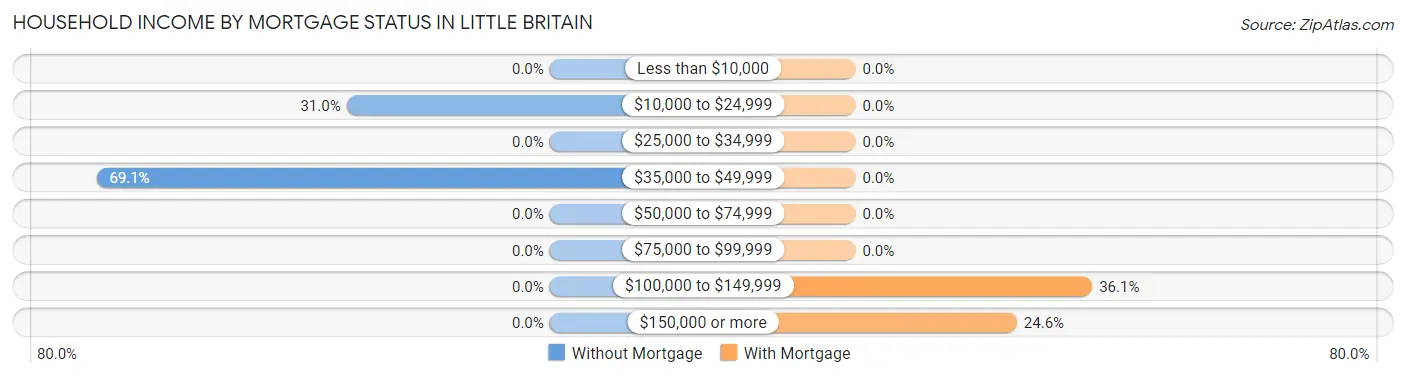
| Household Income | Without Mortgage | With Mortgage |
| Less than $10,000 | 0 (0.0%) | 0 (0.0%) |
| $10,000 to $24,999 | 13 (30.9%) | 0 (0.0%) |
| $25,000 to $34,999 | 0 (0.0%) | 0 (0.0%) |
| $35,000 to $49,999 | 29 (69.1%) | 0 (0.0%) |
| $50,000 to $74,999 | 0 (0.0%) | 0 (0.0%) |
| $75,000 to $99,999 | 0 (0.0%) | 0 (0.0%) |
| $100,000 to $149,999 | 0 (0.0%) | 22 (36.1%) |
| $150,000 or more | 0 (0.0%) | 15 (24.6%) |
| Total | 42 (100.0%) | 61 (100.0%) |
Property Value to Household Income Ratio in Little Britain

| Value-to-Income Ratio | Without Mortgage | With Mortgage |
| Less than 2.0x | 0 (0.0%) | 0 (0.0%) |
| 2.0x to 2.9x | 0 (0.0%) | 45 (73.8%) |
| 3.0x to 3.9x | 0 (0.0%) | 1 (1.6%) |
| 4.0x or more | 42 (100.0%) | 0 (0.0%) |
| Total | 42 (100.0%) | 61 (100.0%) |
Real Estate Taxes by Mortgage Status in Little Britain
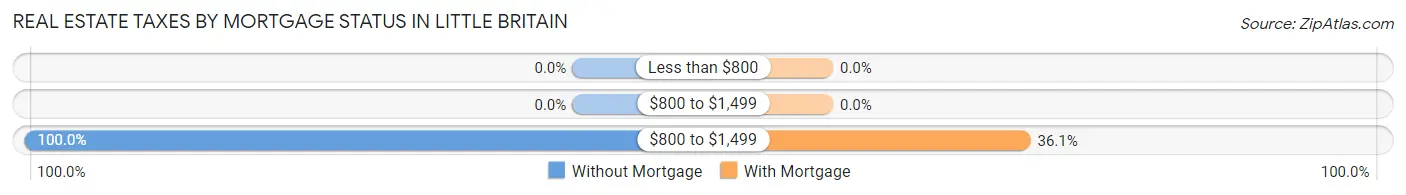
| Property Taxes | Without Mortgage | With Mortgage |
| Less than $800 | 0 (0.0%) | 0 (0.0%) |
| $800 to $1,499 | 0 (0.0%) | 0 (0.0%) |
| $800 to $1,499 | 42 (100.0%) | 22 (36.1%) |
| Total | 42 (100.0%) | 61 (100.0%) |
Health & Disability in Little Britain
Health Insurance Coverage by Age in Little Britain
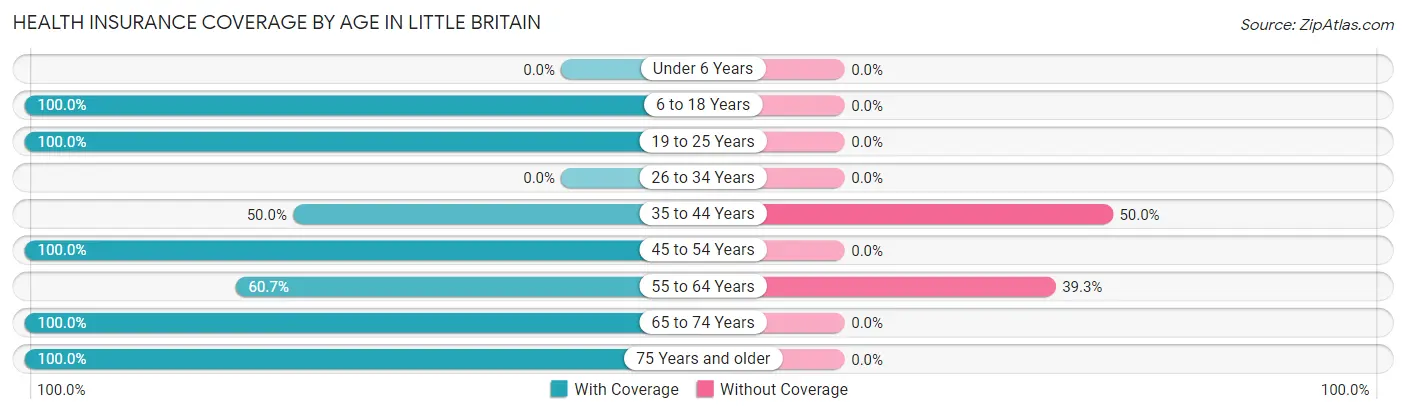
| Age Bracket | With Coverage | Without Coverage |
| Under 6 Years | 0 (0.0%) | 0 (0.0%) |
| 6 to 18 Years | 20 (100.0%) | 0 (0.0%) |
| 19 to 25 Years | 56 (100.0%) | 0 (0.0%) |
| 26 to 34 Years | 0 (0.0%) | 0 (0.0%) |
| 35 to 44 Years | 20 (50.0%) | 20 (50.0%) |
| 45 to 54 Years | 24 (100.0%) | 0 (0.0%) |
| 55 to 64 Years | 54 (60.7%) | 35 (39.3%) |
| 65 to 74 Years | 45 (100.0%) | 0 (0.0%) |
| 75 Years and older | 13 (100.0%) | 0 (0.0%) |
| Total | 232 (80.8%) | 55 (19.2%) |
Health Insurance Coverage by Citizenship Status in Little Britain
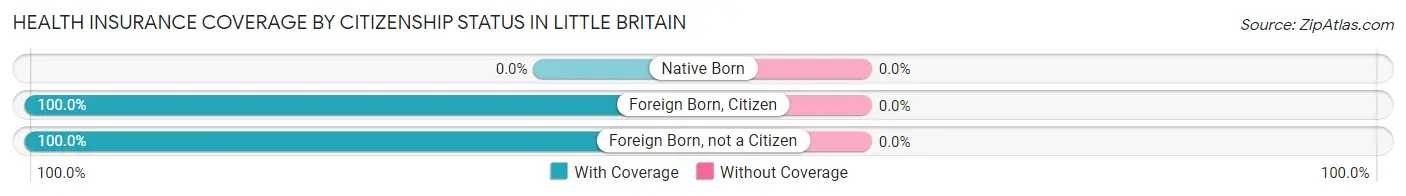
| Citizenship Status | With Coverage | Without Coverage |
| Native Born | 0 (0.0%) | 0 (0.0%) |
| Foreign Born, Citizen | 20 (100.0%) | 0 (0.0%) |
| Foreign Born, not a Citizen | 56 (100.0%) | 0 (0.0%) |
Health Insurance Coverage by Household Income in Little Britain
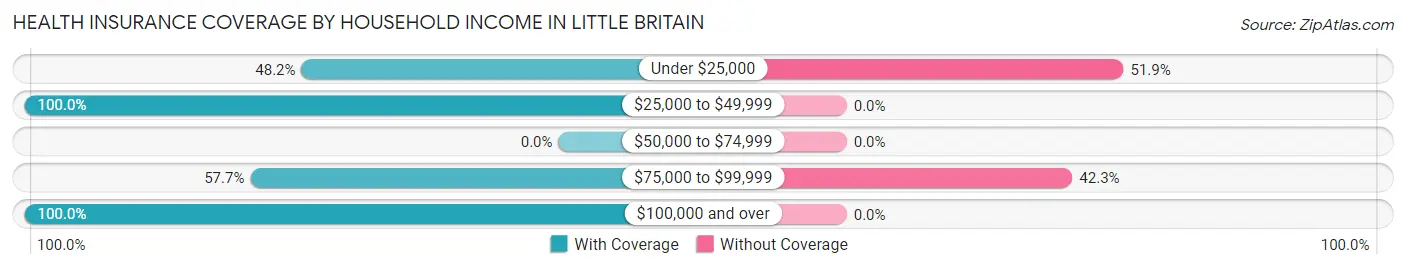
| Household Income | With Coverage | Without Coverage |
| Under $25,000 | 13 (48.1%) | 14 (51.8%) |
| $25,000 to $49,999 | 29 (100.0%) | 0 (0.0%) |
| $50,000 to $74,999 | 0 (0.0%) | 0 (0.0%) |
| $75,000 to $99,999 | 56 (57.7%) | 41 (42.3%) |
| $100,000 and over | 134 (100.0%) | 0 (0.0%) |
Public vs Private Health Insurance Coverage by Age in Little Britain
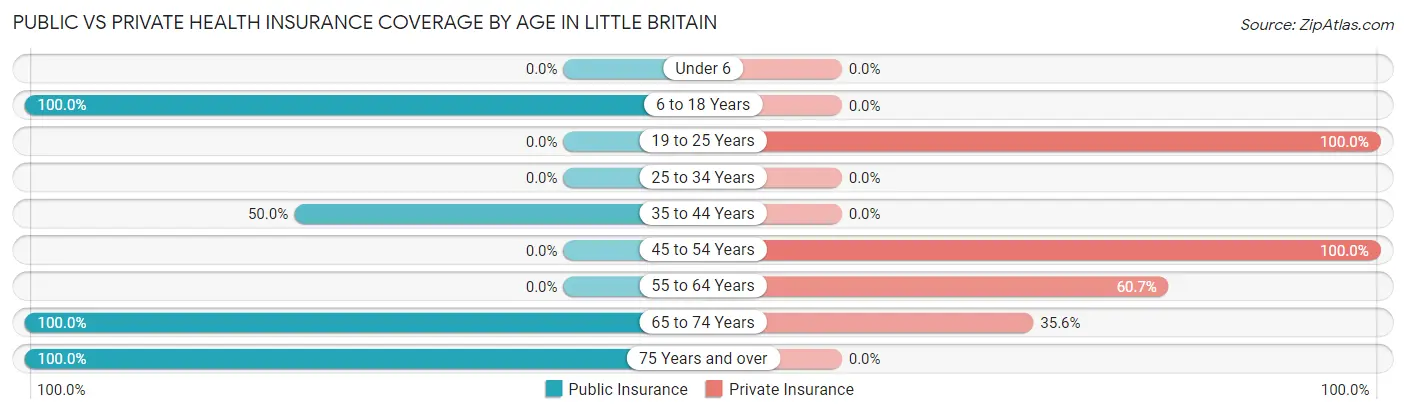
| Age Bracket | Public Insurance | Private Insurance |
| Under 6 | 0 (0.0%) | 0 (0.0%) |
| 6 to 18 Years | 20 (100.0%) | 0 (0.0%) |
| 19 to 25 Years | 0 (0.0%) | 56 (100.0%) |
| 25 to 34 Years | 0 (0.0%) | 0 (0.0%) |
| 35 to 44 Years | 20 (50.0%) | 0 (0.0%) |
| 45 to 54 Years | 0 (0.0%) | 24 (100.0%) |
| 55 to 64 Years | 0 (0.0%) | 54 (60.7%) |
| 65 to 74 Years | 45 (100.0%) | 16 (35.6%) |
| 75 Years and over | 13 (100.0%) | 0 (0.0%) |
| Total | 98 (34.2%) | 150 (52.3%) |
Disability Status by Sex by Age in Little Britain
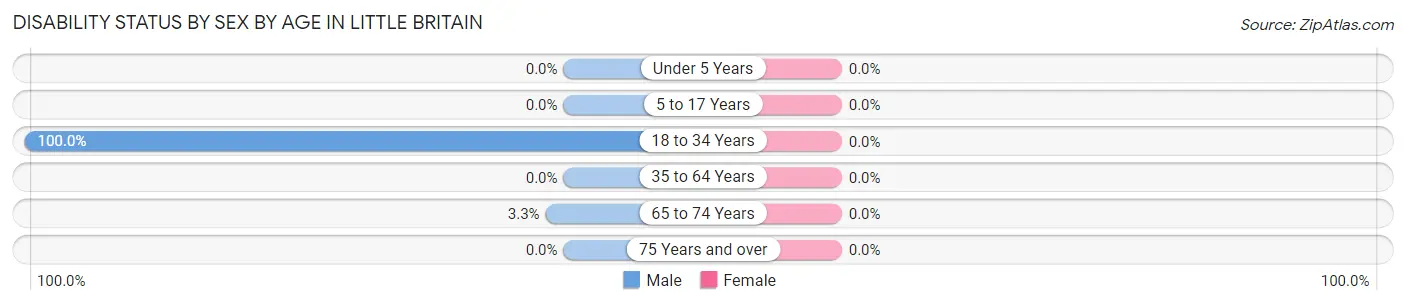
| Age Bracket | Male | Female |
| Under 5 Years | 0 (0.0%) | 0 (0.0%) |
| 5 to 17 Years | 0 (0.0%) | 0 (0.0%) |
| 18 to 34 Years | 29 (100.0%) | 0 (0.0%) |
| 35 to 64 Years | 0 (0.0%) | 0 (0.0%) |
| 65 to 74 Years | 1 (3.3%) | 0 (0.0%) |
| 75 Years and over | 0 (0.0%) | 0 (0.0%) |
Disability Class by Sex by Age in Little Britain
Disability Class: Hearing Difficulty
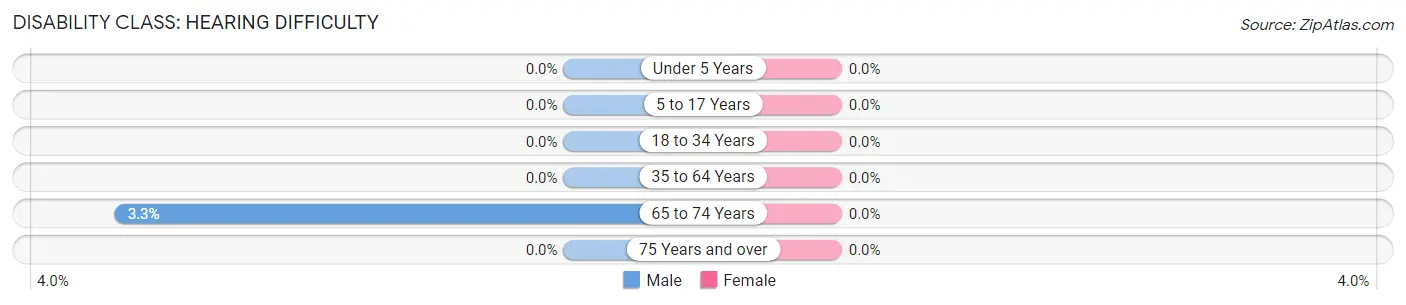
| Age Bracket | Male | Female |
| Under 5 Years | 0 (0.0%) | 0 (0.0%) |
| 5 to 17 Years | 0 (0.0%) | 0 (0.0%) |
| 18 to 34 Years | 0 (0.0%) | 0 (0.0%) |
| 35 to 64 Years | 0 (0.0%) | 0 (0.0%) |
| 65 to 74 Years | 1 (3.3%) | 0 (0.0%) |
| 75 Years and over | 0 (0.0%) | 0 (0.0%) |
Disability Class: Vision Difficulty
| Age Bracket | Male | Female |
| Under 5 Years | 0 (0.0%) | 0 (0.0%) |
| 5 to 17 Years | 0 (0.0%) | 0 (0.0%) |
| 18 to 34 Years | 0 (0.0%) | 0 (0.0%) |
| 35 to 64 Years | 0 (0.0%) | 0 (0.0%) |
| 65 to 74 Years | 0 (0.0%) | 0 (0.0%) |
| 75 Years and over | 0 (0.0%) | 0 (0.0%) |
Disability Class: Cognitive Difficulty
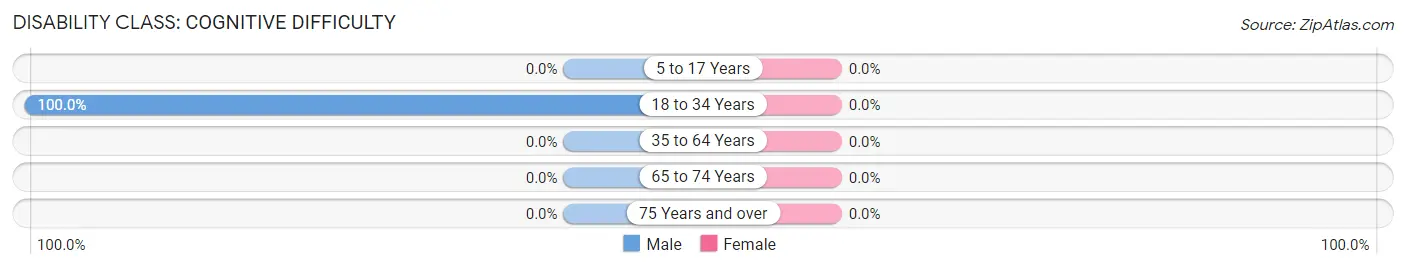
| Age Bracket | Male | Female |
| 5 to 17 Years | 0 (0.0%) | 0 (0.0%) |
| 18 to 34 Years | 29 (100.0%) | 0 (0.0%) |
| 35 to 64 Years | 0 (0.0%) | 0 (0.0%) |
| 65 to 74 Years | 0 (0.0%) | 0 (0.0%) |
| 75 Years and over | 0 (0.0%) | 0 (0.0%) |
Disability Class: Ambulatory Difficulty
| Age Bracket | Male | Female |
| 5 to 17 Years | 0 (0.0%) | 0 (0.0%) |
| 18 to 34 Years | 0 (0.0%) | 0 (0.0%) |
| 35 to 64 Years | 0 (0.0%) | 0 (0.0%) |
| 65 to 74 Years | 0 (0.0%) | 0 (0.0%) |
| 75 Years and over | 0 (0.0%) | 0 (0.0%) |
Disability Class: Self-Care Difficulty
| Age Bracket | Male | Female |
| 5 to 17 Years | 0 (0.0%) | 0 (0.0%) |
| 18 to 34 Years | 0 (0.0%) | 0 (0.0%) |
| 35 to 64 Years | 0 (0.0%) | 0 (0.0%) |
| 65 to 74 Years | 0 (0.0%) | 0 (0.0%) |
| 75 Years and over | 0 (0.0%) | 0 (0.0%) |
Technology Access in Little Britain
Computing Device Access in Little Britain
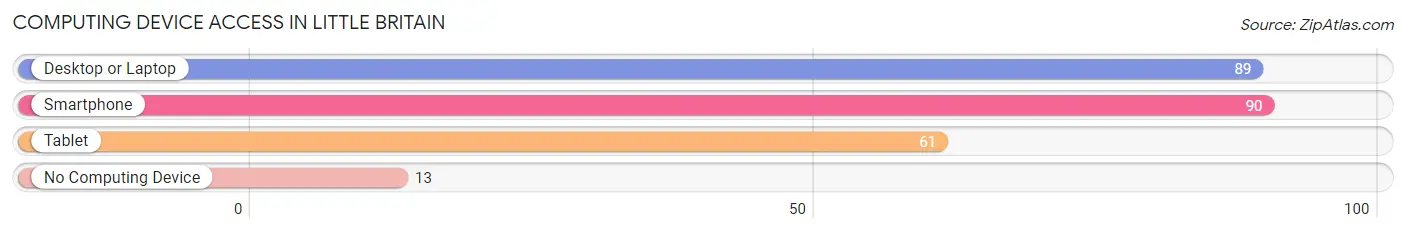
| Device Type | # Households | % Households |
| Desktop or Laptop | 89 | 86.4% |
| Smartphone | 90 | 87.4% |
| Tablet | 61 | 59.2% |
| No Computing Device | 13 | 12.6% |
| Total | 103 | 100.0% |
Internet Access in Little Britain
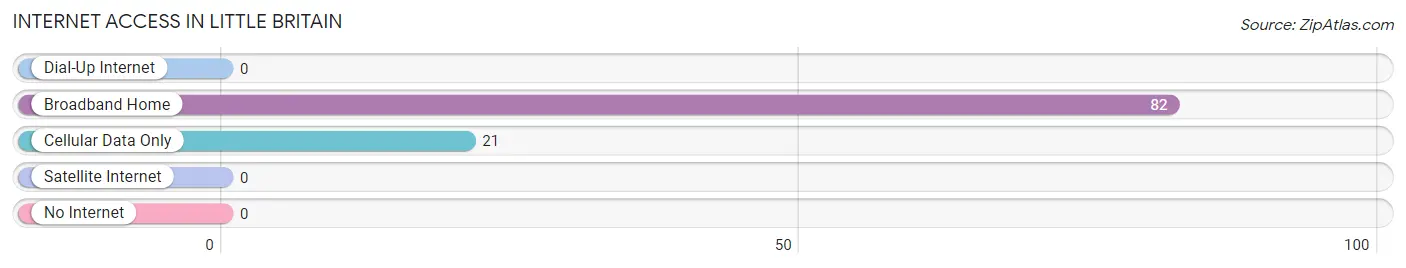
| Internet Type | # Households | % Households |
| Dial-Up Internet | 0 | 0.0% |
| Broadband Home | 82 | 79.6% |
| Cellular Data Only | 21 | 20.4% |
| Satellite Internet | 0 | 0.0% |
| No Internet | 0 | 0.0% |
| Total | 103 | 100.0% |
Little Britain Summary
Britain, Pennsylvania is a small borough located in Lancaster County, Pennsylvania. It is situated in the southeastern corner of the county, approximately 8 miles east of the city of Lancaster. The borough was founded in 1729 and is named after the British Isles. As of the 2010 census, the population of Britain was 1,845.
Geography
Britain is located at 39°59'N, 76°14'W (39.983, -76.233). According to the United States Census Bureau, the borough has a total area of 0.7 square miles (1.8 km2), all of it land.
The borough is located in the southeastern corner of Lancaster County, approximately 8 miles east of the city of Lancaster. It is bordered by East Lampeter Township to the north, West Lampeter Township to the east, and Strasburg Township to the south and west.
Climate
Britain has a humid continental climate (Köppen climate classification Dfa). Summers are hot and humid, with average high temperatures in the mid-80s Fahrenheit (29-32°C). Winters are cold and snowy, with average low temperatures in the mid-20s Fahrenheit (-4 to -7°C). The average annual precipitation is approximately 40 inches (101 cm).
Demographics
As of the 2010 census, there were 1,845 people, 717 households, and 486 families residing in the borough. The population density was 2,621.4 people per square mile (1,011.2/km2). There were 767 housing units at an average density of 1,093.3 per square mile (422.3/km2). The racial makeup of the borough was 97.2% White, 0.7% African American, 0.2% Native American, 0.4% Asian, 0.2% from other races, and 1.3% from two or more races. Hispanic or Latino of any race were 1.3% of the population.
There were 717 households, out of which 32.2% had children under the age of 18 living with them, 51.2% were married couples living together, 10.2% had a female householder with no husband present, and 33.7% were non-families. 28.7% of all households were made up of individuals, and 13.2% had someone living alone who was 65 years of age or older. The average household size was 2.56 and the average family size was 3.17.
The median age in the borough was 38.2 years. 24.7% of residents were under the age of 18; 7.2% were between the ages of 18 and 24; 25.7% were from 25 to 44; 26.2% were from 45 to 64; and 16.2% were 65 years of age or older. The gender makeup of the borough was 48.2% male and 51.8% female.
Economy
The economy of Britain is largely based on agriculture and tourism. The borough is home to several small businesses, including a grocery store, a hardware store, a pharmacy, and a variety of restaurants. The borough is also home to a number of small farms, which produce a variety of crops, including corn, soybeans, wheat, and hay.
The borough is also home to a number of tourist attractions, including the Strasburg Rail Road, the National Toy Train Museum, and the Choo Choo Barn. These attractions draw thousands of visitors to the borough each year.
In addition to agriculture and tourism, the borough is home to a number of manufacturing companies, including a furniture manufacturer, a plastics manufacturer, and a printing company.
Education
The borough is served by the Lampeter-Strasburg School District. The district operates three elementary schools, one middle school, and one high school. The district also operates a number of special education programs.
In addition to the public schools, the borough is home to a number of private schools, including a Catholic school, a Mennonite school, and a Christian school.
Transportation
The borough is served by the Strasburg Rail Road, which runs from Lancaster to Paradise. The rail line is operated by the Strasburg Rail Road Company and is a popular tourist attraction.
The borough is also served by a number of bus routes operated by the Red Rose Transit Authority. These routes connect the borough to Lancaster, Philadelphia, and other nearby cities.
The borough is located approximately 8 miles east of the city of Lancaster, which is served by the Lancaster Airport. The airport offers flights to a number of major cities, including Philadelphia, New York City, and Washington, D.C.
Common Questions
What is Per Capita Income in Little Britain?
Per Capita income in Little Britain is $38,885.
What is the Median Household income in Little Britain?
Median Household Income in Little Britain is $76,080.
What is Income or Wage Gap in Little Britain?
Income or Wage Gap in Little Britain is 33.9%.
Women in Little Britain earn 66.1 cents for every dollar earned by a man.
What is Inequality or Gini Index in Little Britain?
Inequality or Gini Index in Little Britain is 0.39.
What is the Total Population of Little Britain?
Total Population of Little Britain is 287.
What is the Total Male Population of Little Britain?
Total Male Population of Little Britain is 174.
What is the Total Female Population of Little Britain?
Total Female Population of Little Britain is 113.
What is the Ratio of Males per 100 Females in Little Britain?
There are 153.98 Males per 100 Females in Little Britain.
What is the Ratio of Females per 100 Males in Little Britain?
There are 64.94 Females per 100 Males in Little Britain.
What is the Median Population Age in Little Britain?
Median Population Age in Little Britain is 55.1 Years.
What is the Average Family Size in Little Britain
Average Family Size in Little Britain is 2.8 People.
What is the Average Household Size in Little Britain
Average Household Size in Little Britain is 2.8 People.
How Large is the Labor Force in Little Britain?
There are 190 People in the Labor Forcein in Little Britain.
What is the Percentage of People in the Labor Force in Little Britain?
66.2% of People are in the Labor Force in Little Britain.
What is the Unemployment Rate in Little Britain?
Unemployment Rate in Little Britain is 15.3%.