Churchville, PA Map & Demographics
Churchville Map
Churchville Overview
$71,733
PER CAPITA INCOME
$198,103
AVG FAMILY INCOME
$181,306
AVG HOUSEHOLD INCOME
51.7%
WAGE / INCOME GAP [ % ]
48.3¢/ $1
WAGE / INCOME GAP [ $ ]
0.42
INEQUALITY / GINI INDEX
6,041
TOTAL POPULATION
2,923
MALE POPULATION
3,118
FEMALE POPULATION
93.75
MALES / 100 FEMALES
106.67
FEMALES / 100 MALES
42.4
MEDIAN AGE
3.5
AVG FAMILY SIZE
3.2
AVG HOUSEHOLD SIZE
3,160
LABOR FORCE [ PEOPLE ]
65.8%
PERCENT IN LABOR FORCE
2.8%
UNEMPLOYMENT RATE
Income in Churchville
Income Overview in Churchville
Per Capita Income in Churchville is $71,733, while median incomes of families and households are $198,103 and $181,306 respectively.
| Characteristic | Number | Measure |
| Per Capita Income | 6,041 | $71,733 |
| Median Family Income | 1,676 | $198,103 |
| Mean Family Income | 1,676 | $239,874 |
| Median Household Income | 1,890 | $181,306 |
| Mean Household Income | 1,890 | $219,217 |
| Income Deficit | 1,676 | $0 |
| Wage / Income Gap (%) | 6,041 | 51.73% |
| Wage / Income Gap ($) | 6,041 | 48.27¢ per $1 |
| Gini / Inequality Index | 6,041 | 0.42 |
Earnings by Sex in Churchville
Average Earnings in Churchville are $70,605, $104,583 for men and $50,477 for women, a difference of 51.7%.
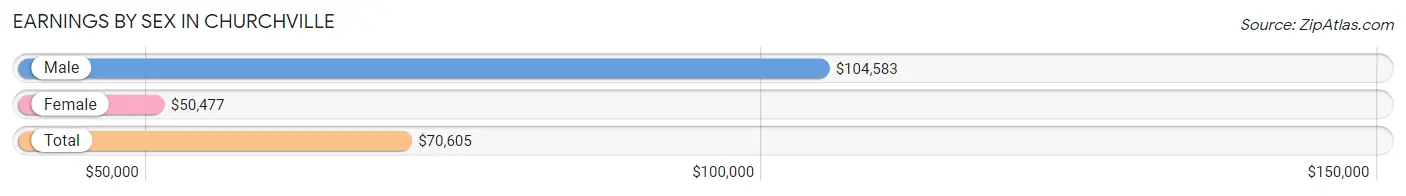
| Sex | Number | Average Earnings |
| Male | 1,794 (52.6%) | $104,583 |
| Female | 1,615 (47.4%) | $50,477 |
| Total | 3,409 (100.0%) | $70,605 |
Earnings by Sex by Income Bracket in Churchville
The most common earnings brackets in Churchville are $100,000+ for men (943 | 52.6%) and $100,000+ for women (438 | 27.1%).
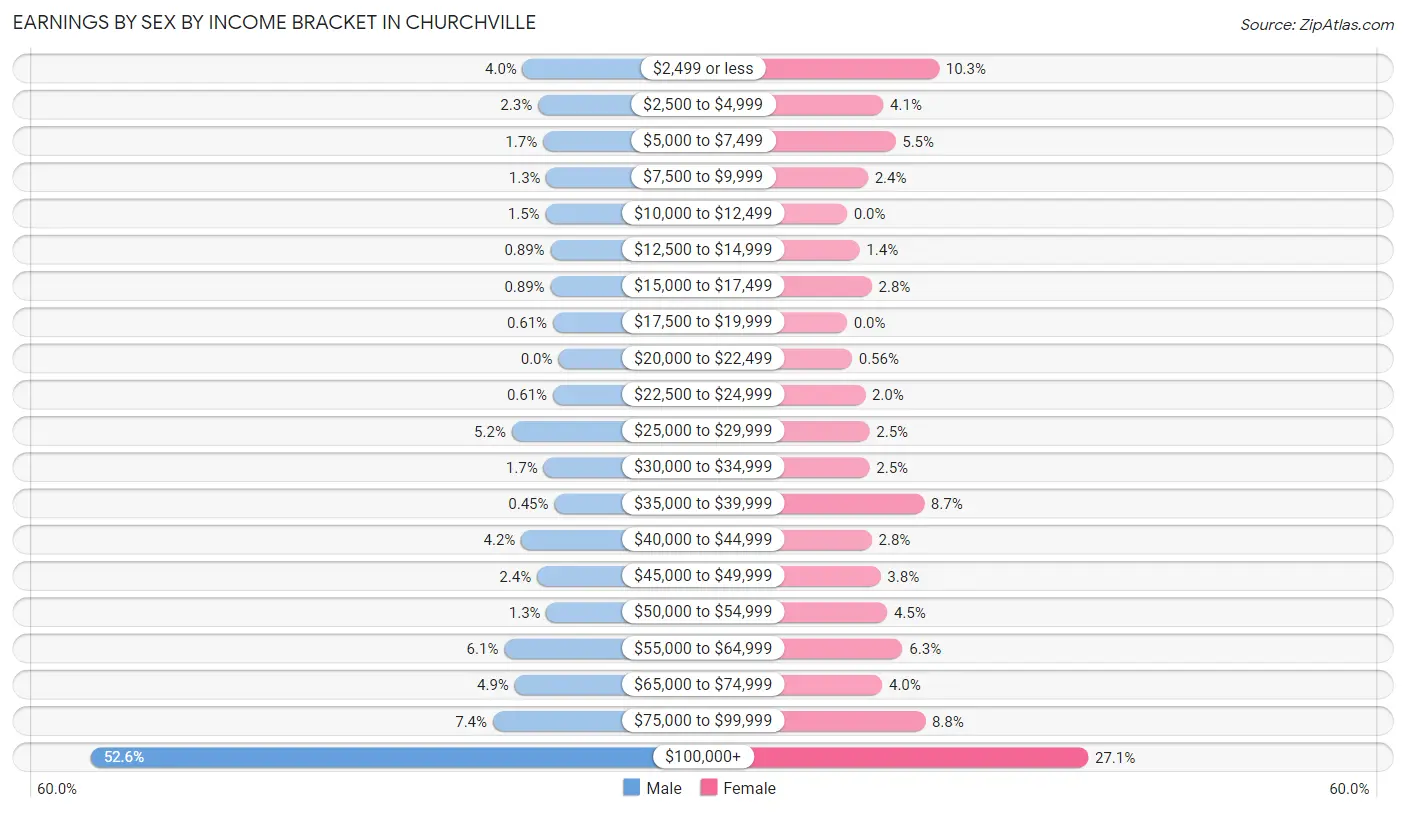
| Income | Male | Female |
| $2,499 or less | 72 (4.0%) | 167 (10.3%) |
| $2,500 to $4,999 | 41 (2.3%) | 66 (4.1%) |
| $5,000 to $7,499 | 31 (1.7%) | 88 (5.4%) |
| $7,500 to $9,999 | 24 (1.3%) | 38 (2.4%) |
| $10,000 to $12,499 | 26 (1.5%) | 0 (0.0%) |
| $12,500 to $14,999 | 16 (0.9%) | 23 (1.4%) |
| $15,000 to $17,499 | 16 (0.9%) | 45 (2.8%) |
| $17,500 to $19,999 | 11 (0.6%) | 0 (0.0%) |
| $20,000 to $22,499 | 0 (0.0%) | 9 (0.6%) |
| $22,500 to $24,999 | 11 (0.6%) | 33 (2.0%) |
| $25,000 to $29,999 | 94 (5.2%) | 41 (2.5%) |
| $30,000 to $34,999 | 30 (1.7%) | 41 (2.5%) |
| $35,000 to $39,999 | 8 (0.4%) | 140 (8.7%) |
| $40,000 to $44,999 | 75 (4.2%) | 45 (2.8%) |
| $45,000 to $49,999 | 43 (2.4%) | 61 (3.8%) |
| $50,000 to $54,999 | 24 (1.3%) | 73 (4.5%) |
| $55,000 to $64,999 | 109 (6.1%) | 101 (6.2%) |
| $65,000 to $74,999 | 88 (4.9%) | 64 (4.0%) |
| $75,000 to $99,999 | 132 (7.4%) | 142 (8.8%) |
| $100,000+ | 943 (52.6%) | 438 (27.1%) |
| Total | 1,794 (100.0%) | 1,615 (100.0%) |
Earnings by Sex by Educational Attainment in Churchville
Average earnings in Churchville are $112,902 for men and $62,418 for women, a difference of 44.7%. Men with an educational attainment of graduate degree enjoy the highest average annual earnings of $150,293, while those with less than high school education earn the least with $28,750. Women with an educational attainment of graduate degree earn the most with the average annual earnings of $114,808, while those with college or associate's degree education have the smallest earnings of $38,229.
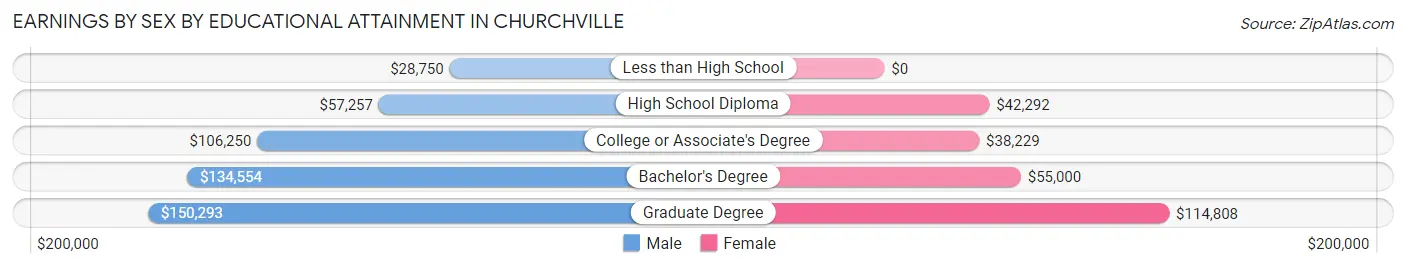
| Educational Attainment | Male Income | Female Income |
| Less than High School | $28,750 | $0 |
| High School Diploma | $57,257 | $42,292 |
| College or Associate's Degree | $106,250 | $38,229 |
| Bachelor's Degree | $134,554 | $55,000 |
| Graduate Degree | $150,293 | $114,808 |
| Total | $112,902 | $62,418 |
Family Income in Churchville
Family Income Brackets in Churchville
According to the Churchville family income data, there are 816 families falling into the $200,000+ income range, which is the most common income bracket and makes up 48.7% of all families.
| Income Bracket | # Families | % Families |
| Less than $10,000 | 27 | 1.6% |
| $10,000 to $14,999 | 0 | 0.0% |
| $15,000 to $24,999 | 0 | 0.0% |
| $25,000 to $34,999 | 8 | 0.5% |
| $35,000 to $49,999 | 18 | 1.1% |
| $50,000 to $74,999 | 127 | 7.6% |
| $75,000 to $99,999 | 34 | 2.0% |
| $100,000 to $149,999 | 340 | 20.3% |
| $150,000 to $199,999 | 307 | 18.3% |
| $200,000+ | 816 | 48.7% |
Family Income by Famaliy Size in Churchville
6-person families (88 | 5.2%) account for the highest median family income in Churchville with $250,001 per family, while 2-person families (587 | 35.0%) have the highest median income of $78,425 per family member.
| Income Bracket | # Families | Median Income |
| 2-Person Families | 587 (35.0%) | $156,850 |
| 3-Person Families | 342 (20.4%) | $218,269 |
| 4-Person Families | 456 (27.2%) | $241,000 |
| 5-Person Families | 124 (7.4%) | $241,750 |
| 6-Person Families | 88 (5.2%) | $250,001 |
| 7+ Person Families | 79 (4.7%) | $250,001 |
| Total | 1,676 (100.0%) | $198,103 |
Family Income by Number of Earners in Churchville
The median family income in Churchville is $198,103, with families comprising 2 earners (885) having the highest median family income of $233,398, while families with no earners (89) have the lowest median family income of $73,625, accounting for 52.8% and 5.3% of families, respectively.
| Number of Earners | # Families | Median Income |
| No Earners | 89 (5.3%) | $73,625 |
| 1 Earner | 385 (23.0%) | $137,604 |
| 2 Earners | 885 (52.8%) | $233,398 |
| 3+ Earners | 317 (18.9%) | $225,363 |
| Total | 1,676 (100.0%) | $198,103 |
Household Income in Churchville
Household Income Brackets in Churchville
With 816 households falling in the category, the $200,000+ income range is the most frequent in Churchville, accounting for 43.2% of all households.
| Income Bracket | # Households | % Households |
| Less than $10,000 | 59 | 3.1% |
| $10,000 to $14,999 | 0 | 0.0% |
| $15,000 to $24,999 | 45 | 2.4% |
| $25,000 to $34,999 | 28 | 1.5% |
| $35,000 to $49,999 | 28 | 1.5% |
| $50,000 to $74,999 | 178 | 9.4% |
| $75,000 to $99,999 | 53 | 2.8% |
| $100,000 to $149,999 | 380 | 20.1% |
| $150,000 to $199,999 | 306 | 16.2% |
| $200,000+ | 816 | 43.2% |
Household Income by Householder Age in Churchville
The median household income in Churchville is $181,306, with the highest median household income of $201,898 found in the 45 to 64 years age bracket for the primary householder. A total of 969 households (51.3%) fall into this category.
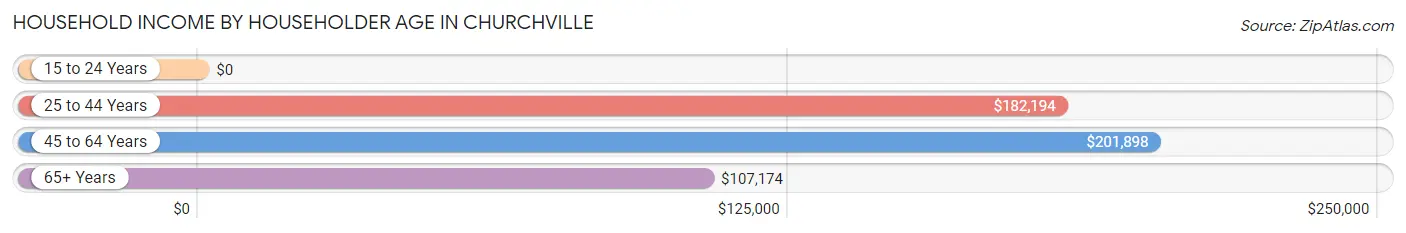
| Income Bracket | # Households | Median Income |
| 15 to 24 Years | 0 (0.0%) | $0 |
| 25 to 44 Years | 429 (22.7%) | $182,194 |
| 45 to 64 Years | 969 (51.3%) | $201,898 |
| 65+ Years | 492 (26.0%) | $107,174 |
| Total | 1,890 (100.0%) | $181,306 |
Poverty in Churchville
Income Below Poverty by Sex and Age in Churchville
With 1.3% poverty level for males and 5.0% for females among the residents of Churchville, 75 year old and over males and 12 to 14 year old females are the most vulnerable to poverty, with 13 males (11.8%) and 47 females (29.7%) in their respective age groups living below the poverty level.
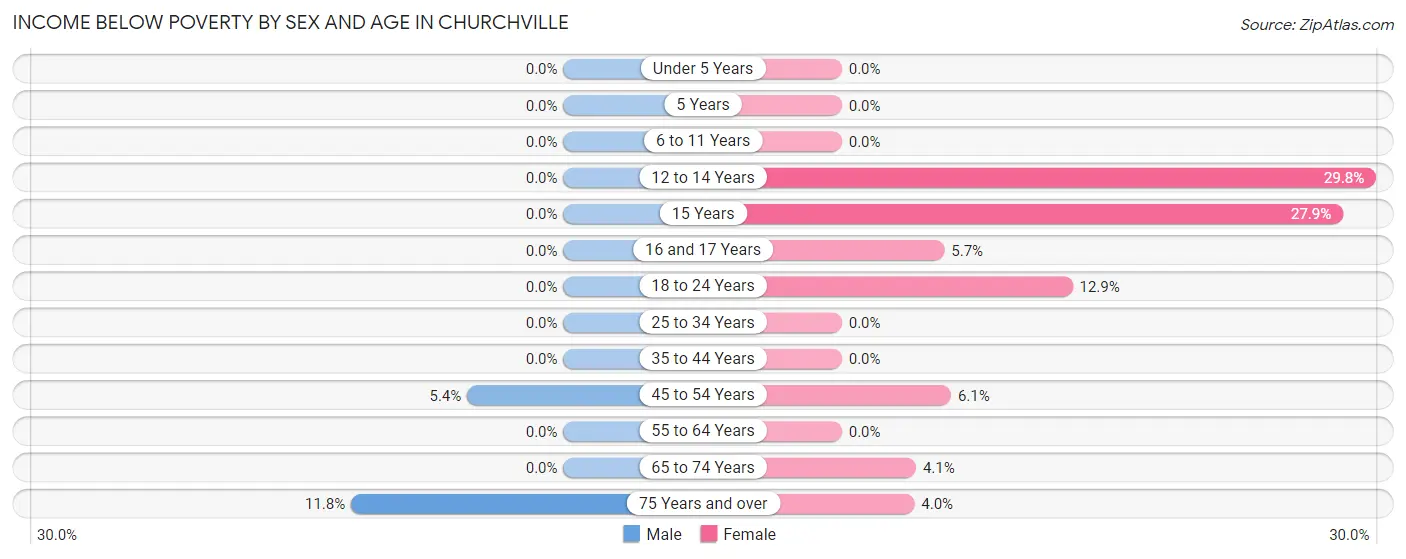
| Age Bracket | Male | Female |
| Under 5 Years | 0 (0.0%) | 0 (0.0%) |
| 5 Years | 0 (0.0%) | 0 (0.0%) |
| 6 to 11 Years | 0 (0.0%) | 0 (0.0%) |
| 12 to 14 Years | 0 (0.0%) | 47 (29.7%) |
| 15 Years | 0 (0.0%) | 24 (27.9%) |
| 16 and 17 Years | 0 (0.0%) | 10 (5.7%) |
| 18 to 24 Years | 0 (0.0%) | 32 (12.9%) |
| 25 to 34 Years | 0 (0.0%) | 0 (0.0%) |
| 35 to 44 Years | 0 (0.0%) | 0 (0.0%) |
| 45 to 54 Years | 26 (5.4%) | 23 (6.1%) |
| 55 to 64 Years | 0 (0.0%) | 0 (0.0%) |
| 65 to 74 Years | 0 (0.0%) | 10 (4.1%) |
| 75 Years and over | 13 (11.8%) | 9 (4.0%) |
| Total | 39 (1.3%) | 155 (5.0%) |
Income Above Poverty by Sex and Age in Churchville
According to the poverty statistics in Churchville, males aged under 5 years and females aged under 5 years are the age groups that are most secure financially, with 100.0% of males and 100.0% of females in these age groups living above the poverty line.
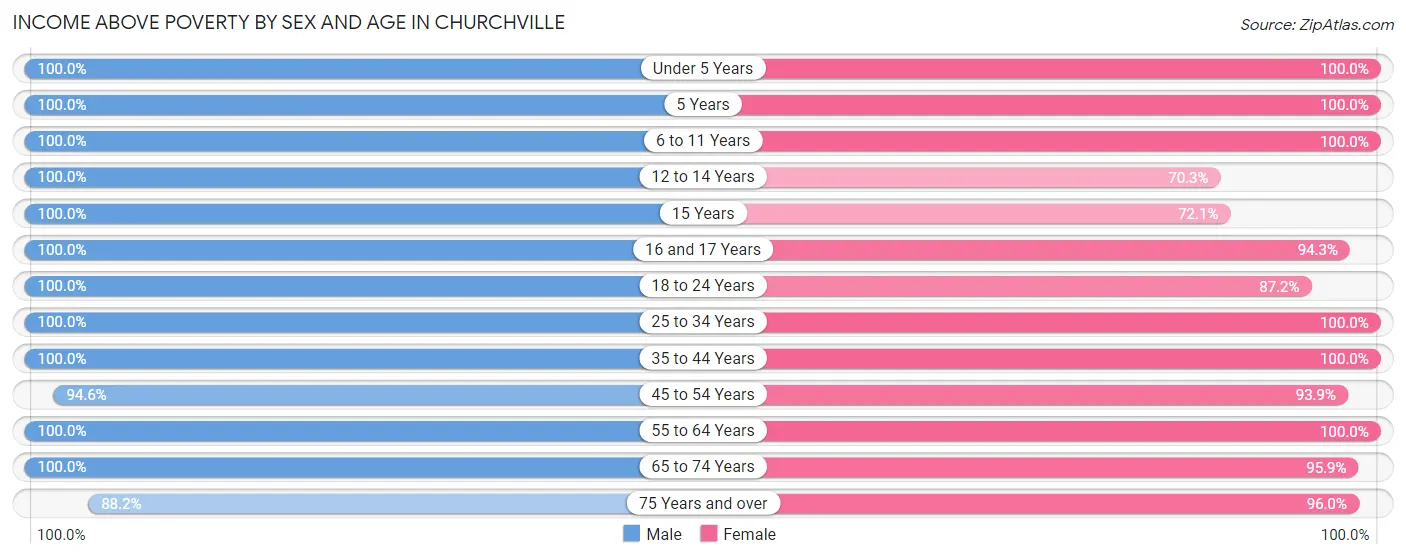
| Age Bracket | Male | Female |
| Under 5 Years | 92 (100.0%) | 113 (100.0%) |
| 5 Years | 46 (100.0%) | 87 (100.0%) |
| 6 to 11 Years | 300 (100.0%) | 261 (100.0%) |
| 12 to 14 Years | 77 (100.0%) | 111 (70.3%) |
| 15 Years | 18 (100.0%) | 62 (72.1%) |
| 16 and 17 Years | 61 (100.0%) | 165 (94.3%) |
| 18 to 24 Years | 331 (100.0%) | 217 (87.2%) |
| 25 to 34 Years | 218 (100.0%) | 244 (100.0%) |
| 35 to 44 Years | 293 (100.0%) | 397 (100.0%) |
| 45 to 54 Years | 459 (94.6%) | 355 (93.9%) |
| 55 to 64 Years | 549 (100.0%) | 505 (100.0%) |
| 65 to 74 Years | 343 (100.0%) | 232 (95.9%) |
| 75 Years and over | 97 (88.2%) | 214 (96.0%) |
| Total | 2,884 (98.7%) | 2,963 (95.0%) |
Income Below Poverty Among Married-Couple Families in Churchville
The poverty statistics for married-couple families in Churchville show that 1.7% or 26 of the total 1,516 families live below the poverty line. Families with 3 or 4 children have the highest poverty rate of 14.8%, comprising of 26 families. On the other hand, families with no children have the lowest poverty rate of 0.0%, which includes 0 families.
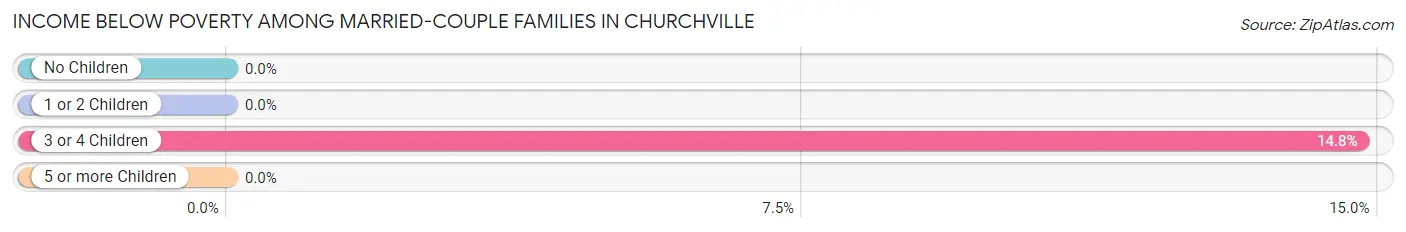
| Children | Above Poverty | Below Poverty |
| No Children | 799 (100.0%) | 0 (0.0%) |
| 1 or 2 Children | 532 (100.0%) | 0 (0.0%) |
| 3 or 4 Children | 150 (85.2%) | 26 (14.8%) |
| 5 or more Children | 9 (100.0%) | 0 (0.0%) |
| Total | 1,490 (98.3%) | 26 (1.7%) |
Income Below Poverty Among Single-Parent Households in Churchville
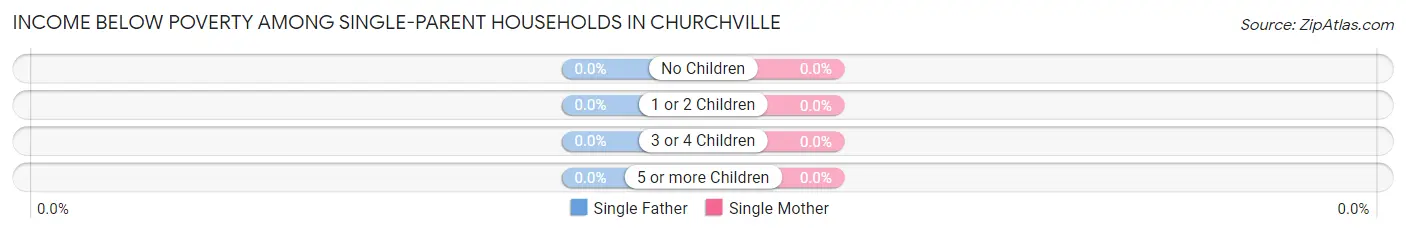
| Children | Single Father | Single Mother |
| No Children | 0 (0.0%) | 0 (0.0%) |
| 1 or 2 Children | 0 (0.0%) | 0 (0.0%) |
| 3 or 4 Children | 0 (0.0%) | 0 (0.0%) |
| 5 or more Children | 0 (0.0%) | 0 (0.0%) |
| Total | 0 (0.0%) | 0 (0.0%) |
Income Below Poverty Among Married-Couple vs Single-Parent Households in Churchville
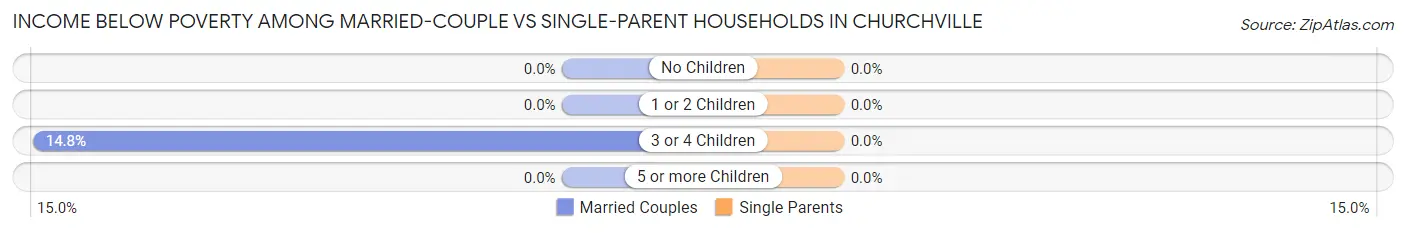
| Children | Married-Couple Families | Single-Parent Households |
| No Children | 0 (0.0%) | 0 (0.0%) |
| 1 or 2 Children | 0 (0.0%) | 0 (0.0%) |
| 3 or 4 Children | 26 (14.8%) | 0 (0.0%) |
| 5 or more Children | 0 (0.0%) | 0 (0.0%) |
| Total | 26 (1.7%) | 0 (0.0%) |
Race in Churchville
The most populous races in Churchville are White / Caucasian (5,655 | 93.6%), Black / African American (176 | 2.9%), and Two or more Races (109 | 1.8%).
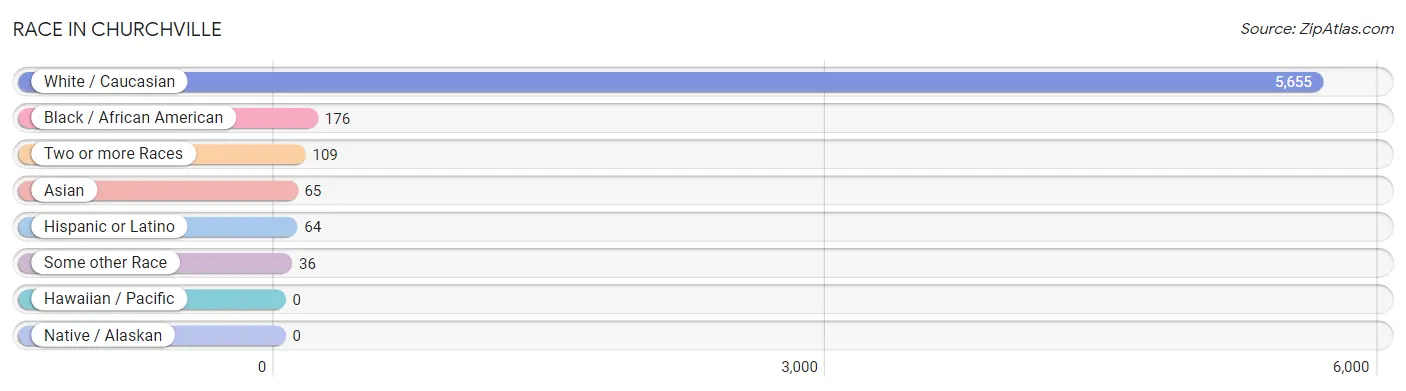
| Race | # Population | % Population |
| Asian | 65 | 1.1% |
| Black / African American | 176 | 2.9% |
| Hawaiian / Pacific | 0 | 0.0% |
| Hispanic or Latino | 64 | 1.1% |
| Native / Alaskan | 0 | 0.0% |
| White / Caucasian | 5,655 | 93.6% |
| Two or more Races | 109 | 1.8% |
| Some other Race | 36 | 0.6% |
| Total | 6,041 | 100.0% |
Ancestry in Churchville
The most populous ancestries reported in Churchville are Irish (1,682 | 27.8%), German (1,490 | 24.7%), Italian (923 | 15.3%), English (519 | 8.6%), and Russian (387 | 6.4%), together accounting for 82.8% of all Churchville residents.
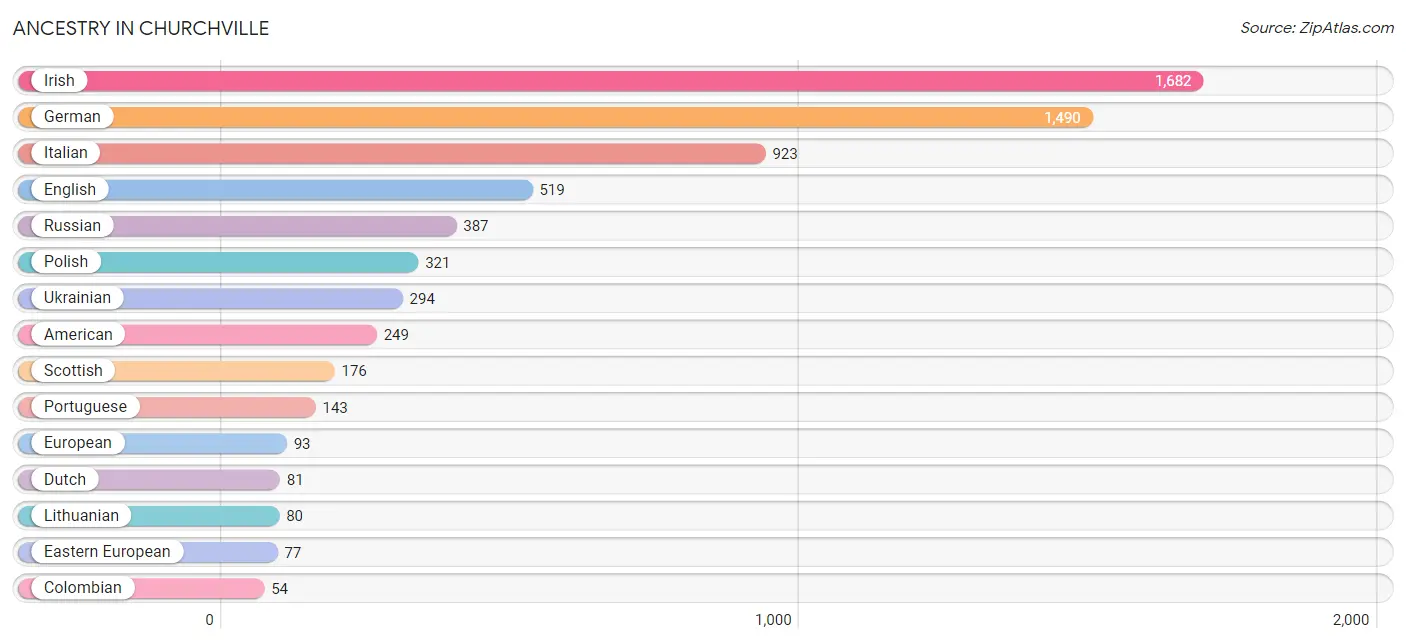
| Ancestry | # Population | % Population |
| American | 249 | 4.1% |
| Armenian | 49 | 0.8% |
| Austrian | 22 | 0.4% |
| Burmese | 30 | 0.5% |
| Colombian | 54 | 0.9% |
| Czech | 10 | 0.2% |
| Dutch | 81 | 1.3% |
| Eastern European | 77 | 1.3% |
| English | 519 | 8.6% |
| European | 93 | 1.5% |
| French | 10 | 0.2% |
| French Canadian | 32 | 0.5% |
| German | 1,490 | 24.7% |
| Greek | 12 | 0.2% |
| Hungarian | 24 | 0.4% |
| Irish | 1,682 | 27.8% |
| Israeli | 22 | 0.4% |
| Italian | 923 | 15.3% |
| Lithuanian | 80 | 1.3% |
| Nigerian | 36 | 0.6% |
| Norwegian | 24 | 0.4% |
| Pennsylvania German | 9 | 0.2% |
| Polish | 321 | 5.3% |
| Portuguese | 143 | 2.4% |
| Puerto Rican | 10 | 0.2% |
| Romanian | 44 | 0.7% |
| Russian | 387 | 6.4% |
| Scotch-Irish | 24 | 0.4% |
| Scottish | 176 | 2.9% |
| South American | 54 | 0.9% |
| Subsaharan African | 36 | 0.6% |
| Swiss | 11 | 0.2% |
| Thai | 35 | 0.6% |
| Ukrainian | 294 | 4.9% |
| Welsh | 30 | 0.5% | View All 35 Rows |
Immigrants in Churchville
The most numerous immigrant groups reported in Churchville came from Europe (664 | 11.0%), Eastern Europe (465 | 7.7%), Russia (223 | 3.7%), Ukraine (168 | 2.8%), and Southern Europe (112 | 1.8%), together accounting for 27.0% of all Churchville residents.
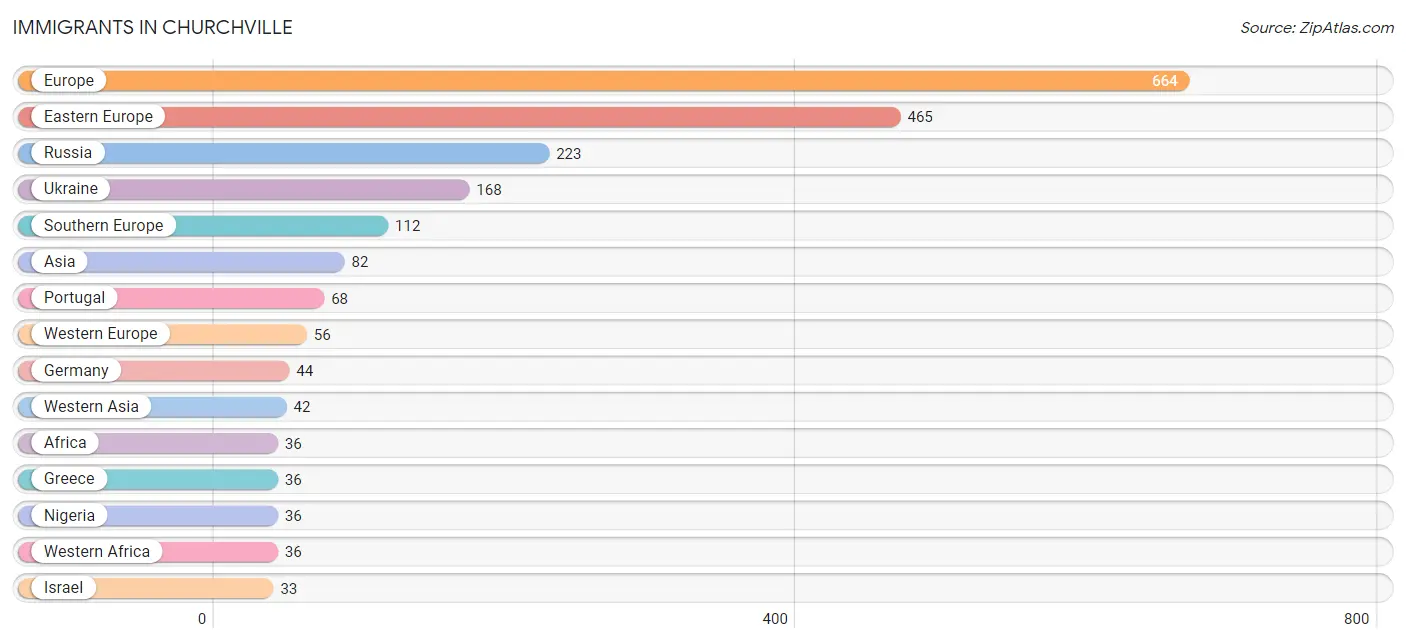
| Immigration Origin | # Population | % Population |
| Africa | 36 | 0.6% |
| Asia | 82 | 1.4% |
| Austria | 12 | 0.2% |
| Caribbean | 10 | 0.2% |
| Eastern Asia | 21 | 0.4% |
| Eastern Europe | 465 | 7.7% |
| Europe | 664 | 11.0% |
| Germany | 44 | 0.7% |
| Greece | 36 | 0.6% |
| India | 19 | 0.3% |
| Ireland | 22 | 0.4% |
| Israel | 33 | 0.5% |
| Italy | 8 | 0.1% |
| Korea | 21 | 0.4% |
| Latin America | 10 | 0.2% |
| Moldova | 9 | 0.2% |
| Nigeria | 36 | 0.6% |
| Northern Europe | 31 | 0.5% |
| Portugal | 68 | 1.1% |
| Romania | 9 | 0.2% |
| Russia | 223 | 3.7% |
| South Central Asia | 19 | 0.3% |
| Southern Europe | 112 | 1.8% |
| Trinidad and Tobago | 10 | 0.2% |
| Ukraine | 168 | 2.8% |
| Western Africa | 36 | 0.6% |
| Western Asia | 42 | 0.7% |
| Western Europe | 56 | 0.9% | View All 28 Rows |
Sex and Age in Churchville
Sex and Age in Churchville
The most populous age groups in Churchville are 60 to 64 Years (308 | 10.5%) for men and 15 to 19 Years (355 | 11.4%) for women.
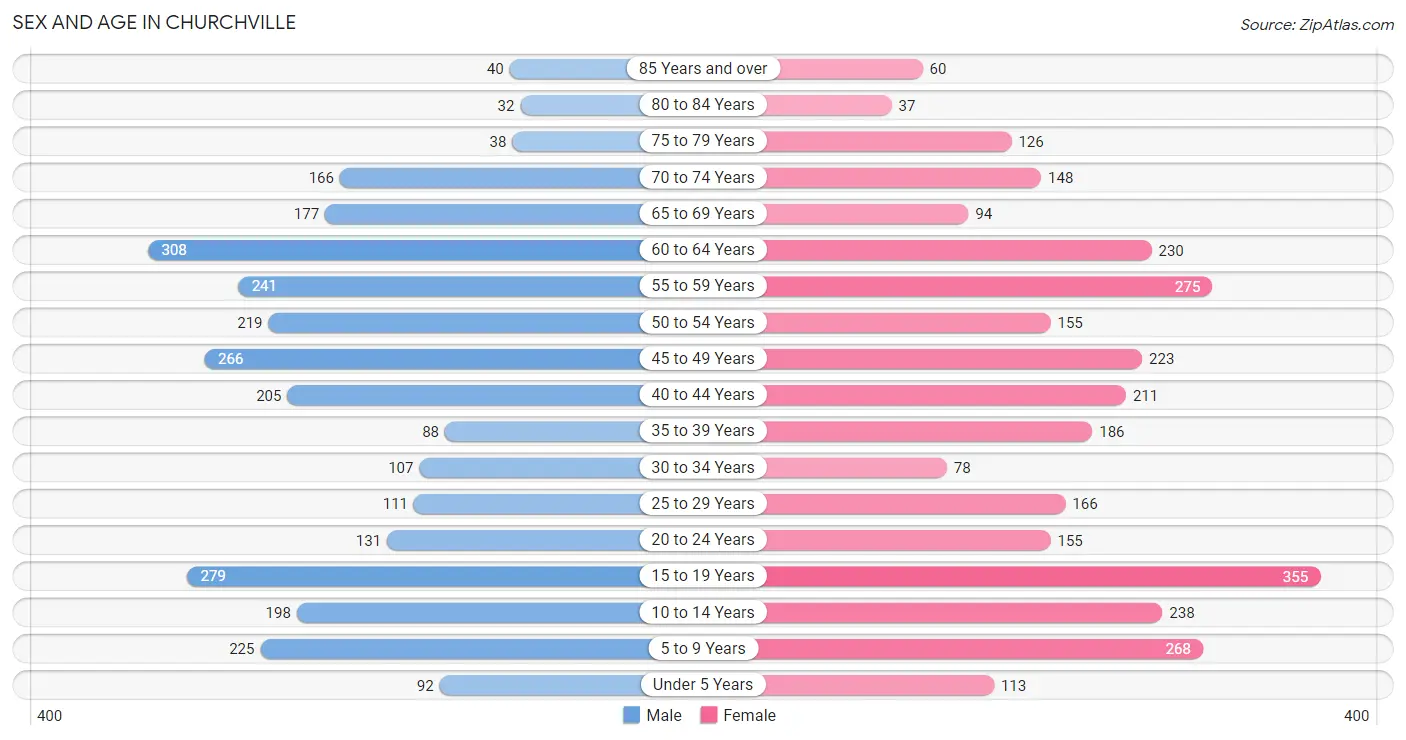
| Age Bracket | Male | Female |
| Under 5 Years | 92 (3.2%) | 113 (3.6%) |
| 5 to 9 Years | 225 (7.7%) | 268 (8.6%) |
| 10 to 14 Years | 198 (6.8%) | 238 (7.6%) |
| 15 to 19 Years | 279 (9.5%) | 355 (11.4%) |
| 20 to 24 Years | 131 (4.5%) | 155 (5.0%) |
| 25 to 29 Years | 111 (3.8%) | 166 (5.3%) |
| 30 to 34 Years | 107 (3.7%) | 78 (2.5%) |
| 35 to 39 Years | 88 (3.0%) | 186 (6.0%) |
| 40 to 44 Years | 205 (7.0%) | 211 (6.8%) |
| 45 to 49 Years | 266 (9.1%) | 223 (7.1%) |
| 50 to 54 Years | 219 (7.5%) | 155 (5.0%) |
| 55 to 59 Years | 241 (8.2%) | 275 (8.8%) |
| 60 to 64 Years | 308 (10.5%) | 230 (7.4%) |
| 65 to 69 Years | 177 (6.1%) | 94 (3.0%) |
| 70 to 74 Years | 166 (5.7%) | 148 (4.8%) |
| 75 to 79 Years | 38 (1.3%) | 126 (4.0%) |
| 80 to 84 Years | 32 (1.1%) | 37 (1.2%) |
| 85 Years and over | 40 (1.4%) | 60 (1.9%) |
| Total | 2,923 (100.0%) | 3,118 (100.0%) |
Families and Households in Churchville
Median Family Size in Churchville
The median family size in Churchville is 3.45 persons per family, with married-couple families (1,516 | 90.4%) accounting for the largest median family size of 3.49 persons per family. On the other hand, single female/mother families (60 | 3.6%) represent the smallest median family size with 2.60 persons per family.
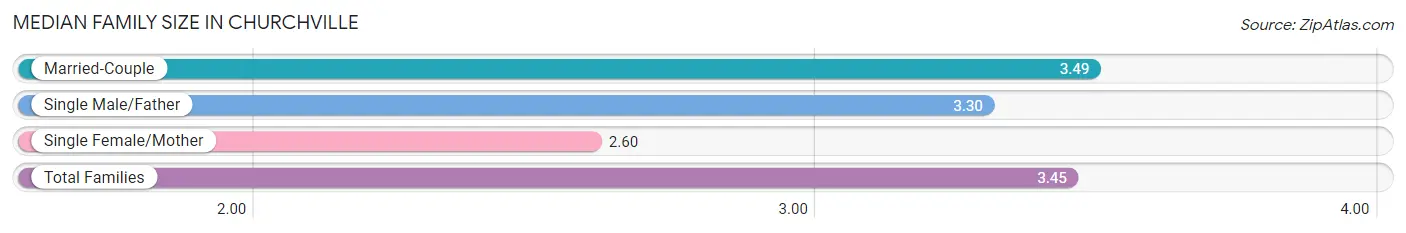
| Family Type | # Families | Family Size |
| Married-Couple | 1,516 (90.4%) | 3.49 |
| Single Male/Father | 100 (6.0%) | 3.30 |
| Single Female/Mother | 60 (3.6%) | 2.60 |
| Total Families | 1,676 (100.0%) | 3.45 |
Median Household Size in Churchville
The median household size in Churchville is 3.20 persons per household, with married-couple households (1,516 | 80.2%) accounting for the largest median household size of 3.5 persons per household. non-family households (214 | 11.3%) represent the smallest median household size with 1.14 persons per household.
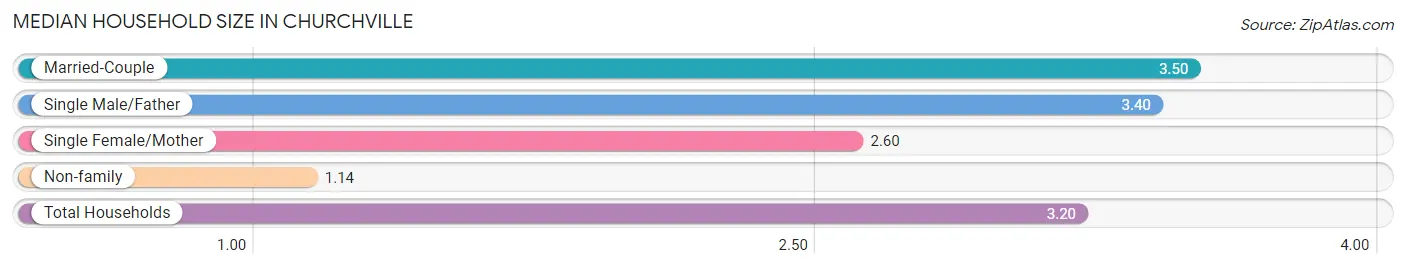
| Household Type | # Households | Household Size |
| Married-Couple | 1,516 (80.2%) | 3.50 |
| Single Male/Father | 100 (5.3%) | 3.40 |
| Single Female/Mother | 60 (3.2%) | 2.60 |
| Non-family | 214 (11.3%) | 1.14 |
| Total Households | 1,890 (100.0%) | 3.20 |
Household Size by Marriage Status in Churchville
Out of a total of 1,890 households in Churchville, 1,676 (88.7%) are family households, while 214 (11.3%) are nonfamily households. The most numerous type of family households are 2-person households, comprising 587, and the most common type of nonfamily households are 1-person households, comprising 184.
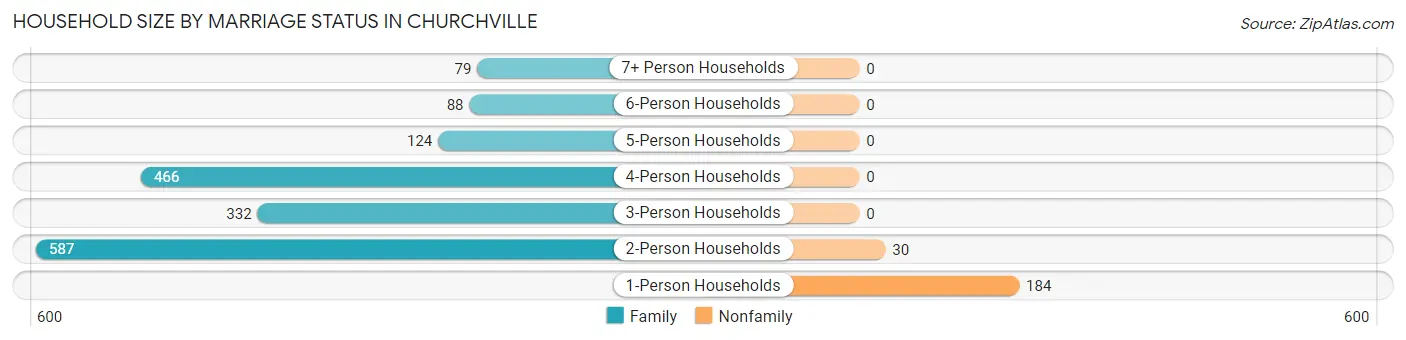
| Household Size | Family Households | Nonfamily Households |
| 1-Person Households | - | 184 (9.7%) |
| 2-Person Households | 587 (31.1%) | 30 (1.6%) |
| 3-Person Households | 332 (17.6%) | 0 (0.0%) |
| 4-Person Households | 466 (24.7%) | 0 (0.0%) |
| 5-Person Households | 124 (6.6%) | 0 (0.0%) |
| 6-Person Households | 88 (4.7%) | 0 (0.0%) |
| 7+ Person Households | 79 (4.2%) | 0 (0.0%) |
| Total | 1,676 (88.7%) | 214 (11.3%) |
Female Fertility in Churchville
Fertility by Age in Churchville
Average fertility rate in Churchville is 33.0 births per 1,000 women. Women in the age bracket of 20 to 34 years have the highest fertility rate with 53.0 births per 1,000 women. Women in the age bracket of 35 to 50 years acount for 55.3% of all women with births.
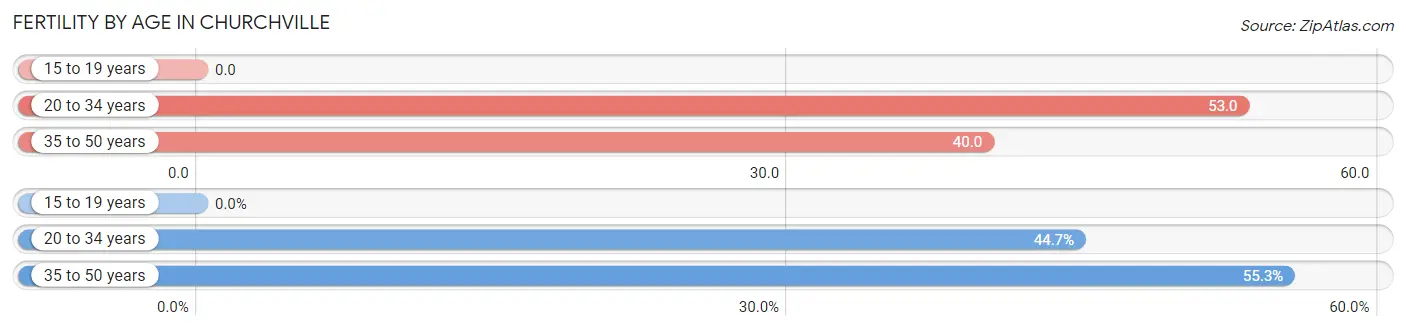
| Age Bracket | Women with Births | Births / 1,000 Women |
| 15 to 19 years | 0 (0.0%) | 0.0 |
| 20 to 34 years | 21 (44.7%) | 53.0 |
| 35 to 50 years | 26 (55.3%) | 40.0 |
| Total | 47 (100.0%) | 33.0 |
Fertility by Age by Marriage Status in Churchville
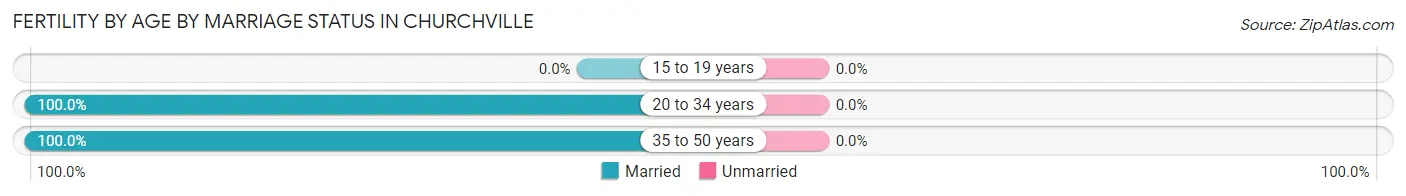
| Age Bracket | Married | Unmarried |
| 15 to 19 years | 0 (0.0%) | 0 (0.0%) |
| 20 to 34 years | 21 (100.0%) | 0 (0.0%) |
| 35 to 50 years | 26 (100.0%) | 0 (0.0%) |
| Total | 47 (100.0%) | 0 (0.0%) |
Fertility by Education in Churchville

| Educational Attainment | Women with Births | Births / 1,000 Women |
| Less than High School | 0 (0.0%) | 0.0 |
| High School Diploma | 0 (0.0%) | 0.0 |
| College or Associate's Degree | 0 (0.0%) | 0.0 |
| Bachelor's Degree | 28 (59.6%) | 73.0 |
| Graduate Degree | 19 (40.4%) | 66.0 |
| Total | 47 (100.0%) | 33.0 |
Fertility by Education by Marriage Status in Churchville
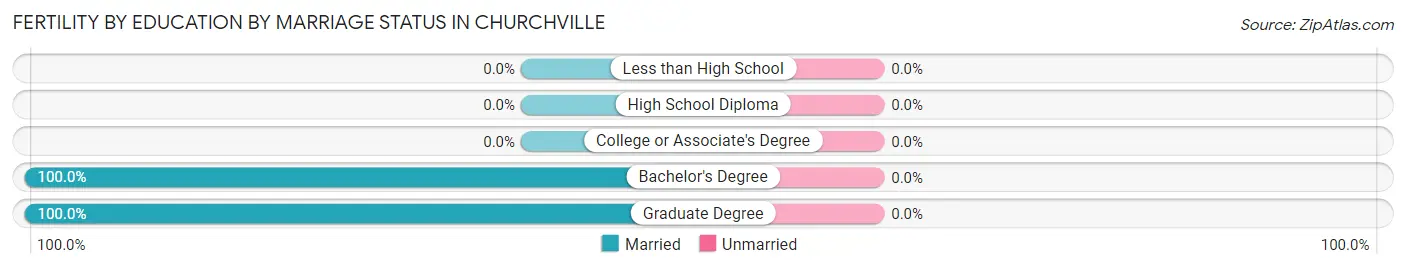
| Educational Attainment | Married | Unmarried |
| Less than High School | 0 (0.0%) | 0 (0.0%) |
| High School Diploma | 0 (0.0%) | 0 (0.0%) |
| College or Associate's Degree | 0 (0.0%) | 0 (0.0%) |
| Bachelor's Degree | 28 (100.0%) | 0 (0.0%) |
| Graduate Degree | 19 (100.0%) | 0 (0.0%) |
| Total | 47 (100.0%) | 0 (0.0%) |
Employment Characteristics in Churchville
Employment by Class of Employer in Churchville
Among the 3,071 employed individuals in Churchville, private company employees (2,007 | 65.3%), not-for-profit organizations (320 | 10.4%), and self-employed (not incorporated) (240 | 7.8%) make up the most common classes of employment.
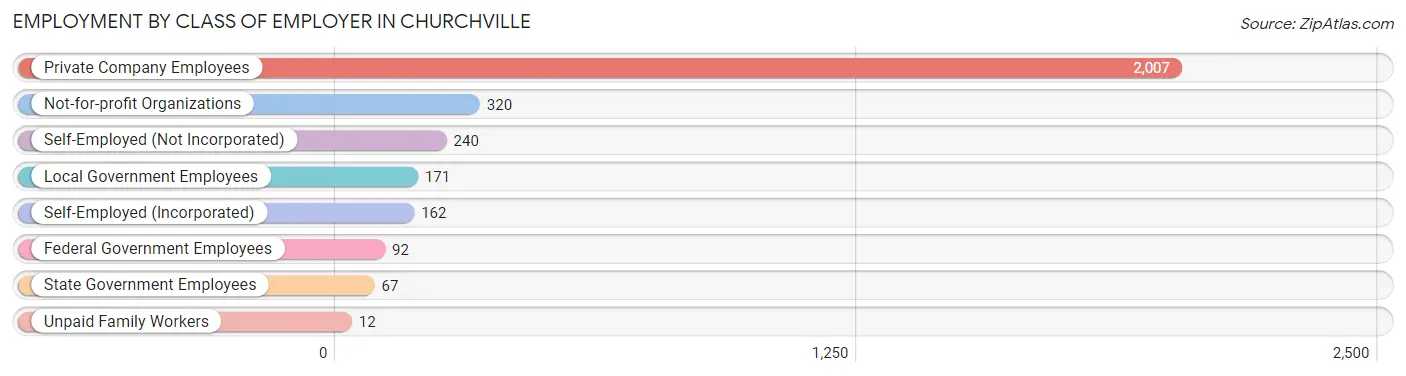
| Employer Class | # Employees | % Employees |
| Private Company Employees | 2,007 | 65.3% |
| Self-Employed (Incorporated) | 162 | 5.3% |
| Self-Employed (Not Incorporated) | 240 | 7.8% |
| Not-for-profit Organizations | 320 | 10.4% |
| Local Government Employees | 171 | 5.6% |
| State Government Employees | 67 | 2.2% |
| Federal Government Employees | 92 | 3.0% |
| Unpaid Family Workers | 12 | 0.4% |
| Total | 3,071 | 100.0% |
Employment Status by Age in Churchville
According to the labor force statistics for Churchville, out of the total population over 16 years of age (4,803), 65.8% or 3,160 individuals are in the labor force, with 2.8% or 88 of them unemployed. The age group with the highest labor force participation rate is 35 to 44 years, with 94.1% or 649 individuals in the labor force. Within the labor force, the 16 to 19 years age range has the highest percentage of unemployed individuals, with 19.4% or 20 of them being unemployed.
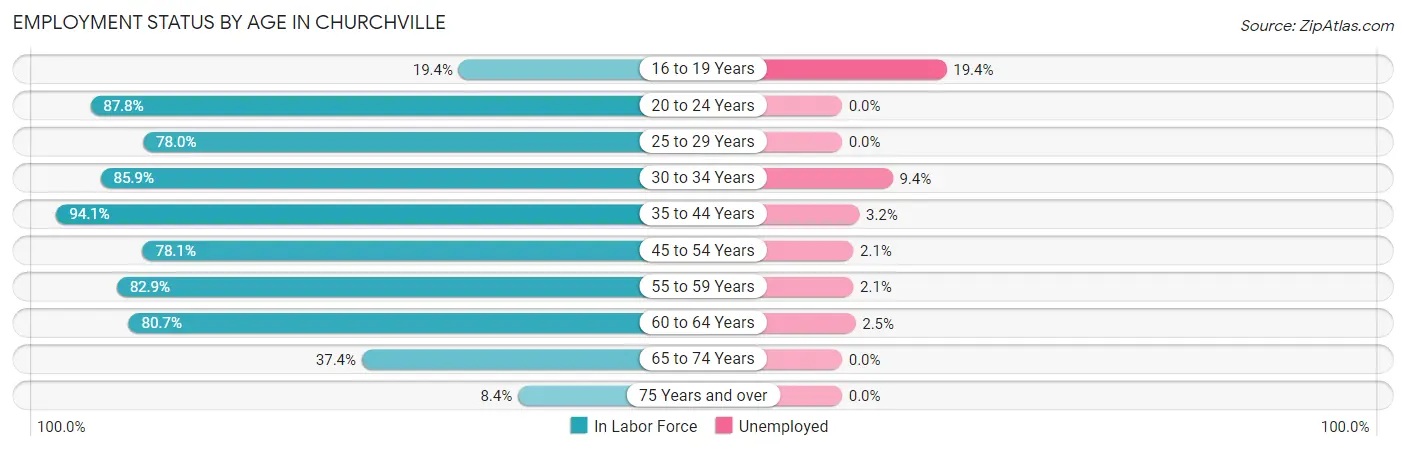
| Age Bracket | In Labor Force | Unemployed |
| 16 to 19 Years | 103 (19.4%) | 20 (19.4%) |
| 20 to 24 Years | 251 (87.8%) | 0 (0.0%) |
| 25 to 29 Years | 216 (78.0%) | 0 (0.0%) |
| 30 to 34 Years | 159 (85.9%) | 15 (9.4%) |
| 35 to 44 Years | 649 (94.1%) | 21 (3.2%) |
| 45 to 54 Years | 674 (78.1%) | 14 (2.1%) |
| 55 to 59 Years | 428 (82.9%) | 9 (2.1%) |
| 60 to 64 Years | 434 (80.7%) | 11 (2.5%) |
| 65 to 74 Years | 219 (37.4%) | 0 (0.0%) |
| 75 Years and over | 28 (8.4%) | 0 (0.0%) |
| Total | 3,160 (65.8%) | 88 (2.8%) |
Employment Status by Educational Attainment in Churchville
According to labor force statistics for Churchville, 83.4% of individuals (2,560) out of the total population between 25 and 64 years of age (3,069) are in the labor force, with 2.7% or 69 of them being unemployed. The group with the highest labor force participation rate are those with the educational attainment of less than high school, with 100.0% or 22 individuals in the labor force. Within the labor force, individuals with high school diploma education have the highest percentage of unemployment, with 13.4% or 49 of them being unemployed.
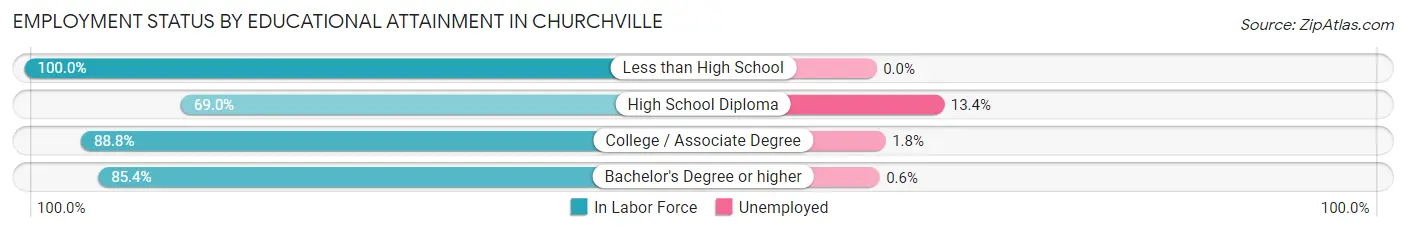
| Educational Attainment | In Labor Force | Unemployed |
| Less than High School | 22 (100.0%) | 0 (0.0%) |
| High School Diploma | 367 (69.0%) | 71 (13.4%) |
| College / Associate Degree | 602 (88.8%) | 12 (1.8%) |
| Bachelor's Degree or higher | 1,569 (85.4%) | 11 (0.6%) |
| Total | 2,560 (83.4%) | 83 (2.7%) |
Employment Occupations by Sex in Churchville
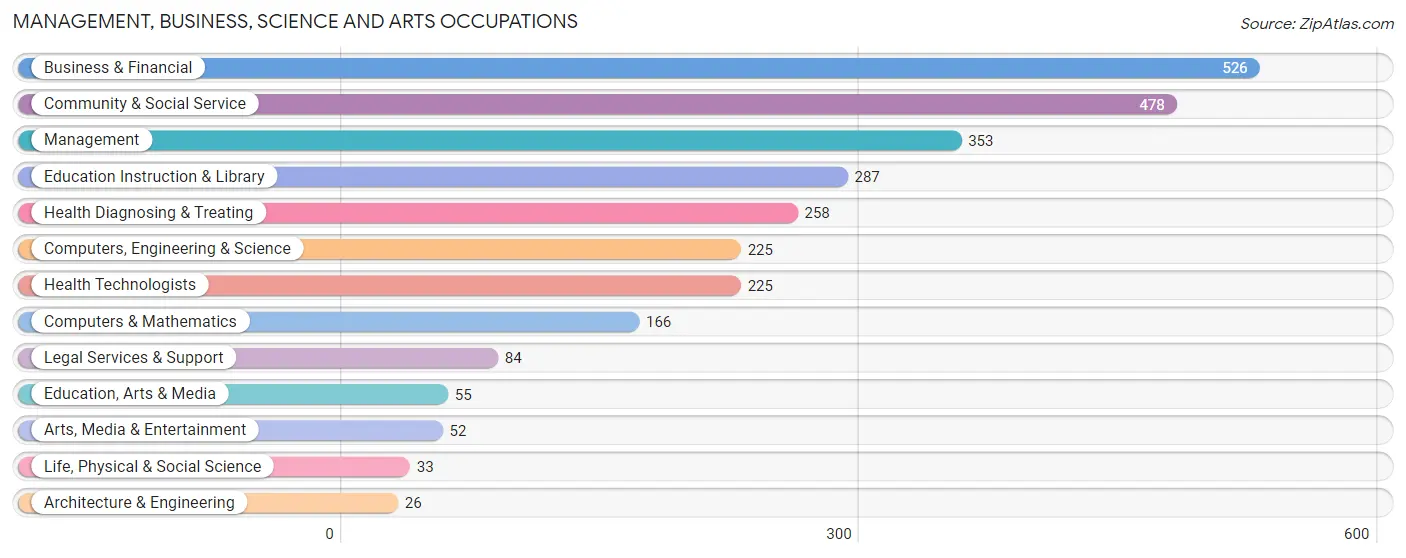
Management, Business, Science and Arts Occupations
The most common Management, Business, Science and Arts occupations in Churchville are Business & Financial (526 | 17.1%), Community & Social Service (478 | 15.6%), Management (353 | 11.5%), Education Instruction & Library (287 | 9.3%), and Health Diagnosing & Treating (258 | 8.4%).
Management, Business, Science and Arts Occupations by Sex
Within the Management, Business, Science and Arts occupations in Churchville, the most male-oriented occupations are Architecture & Engineering (100.0%), Computers & Mathematics (77.7%), and Computers, Engineering & Science (77.3%), while the most female-oriented occupations are Education, Arts & Media (81.8%), Health Diagnosing & Treating (81.0%), and Health Technologists (78.2%).
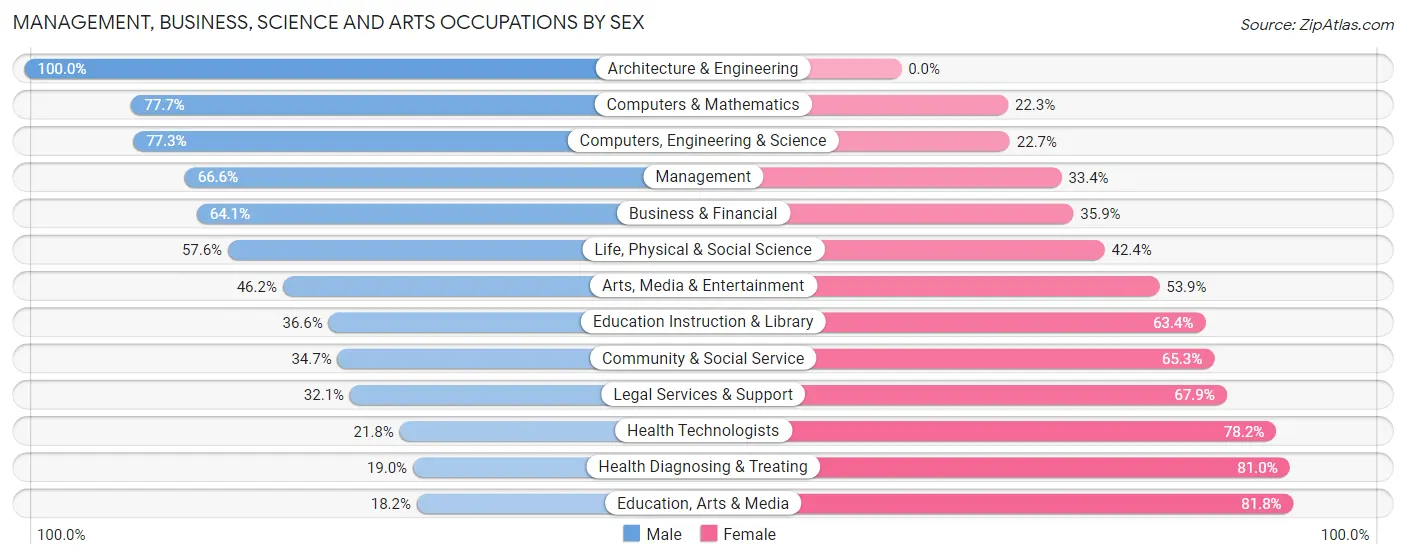
| Occupation | Male | Female |
| Management | 235 (66.6%) | 118 (33.4%) |
| Business & Financial | 337 (64.1%) | 189 (35.9%) |
| Computers, Engineering & Science | 174 (77.3%) | 51 (22.7%) |
| Computers & Mathematics | 129 (77.7%) | 37 (22.3%) |
| Architecture & Engineering | 26 (100.0%) | 0 (0.0%) |
| Life, Physical & Social Science | 19 (57.6%) | 14 (42.4%) |
| Community & Social Service | 166 (34.7%) | 312 (65.3%) |
| Education, Arts & Media | 10 (18.2%) | 45 (81.8%) |
| Legal Services & Support | 27 (32.1%) | 57 (67.9%) |
| Education Instruction & Library | 105 (36.6%) | 182 (63.4%) |
| Arts, Media & Entertainment | 24 (46.2%) | 28 (53.8%) |
| Health Diagnosing & Treating | 49 (19.0%) | 209 (81.0%) |
| Health Technologists | 49 (21.8%) | 176 (78.2%) |
| Total (Category) | 961 (52.2%) | 879 (47.8%) |
| Total (Overall) | 1,691 (55.1%) | 1,380 (44.9%) |
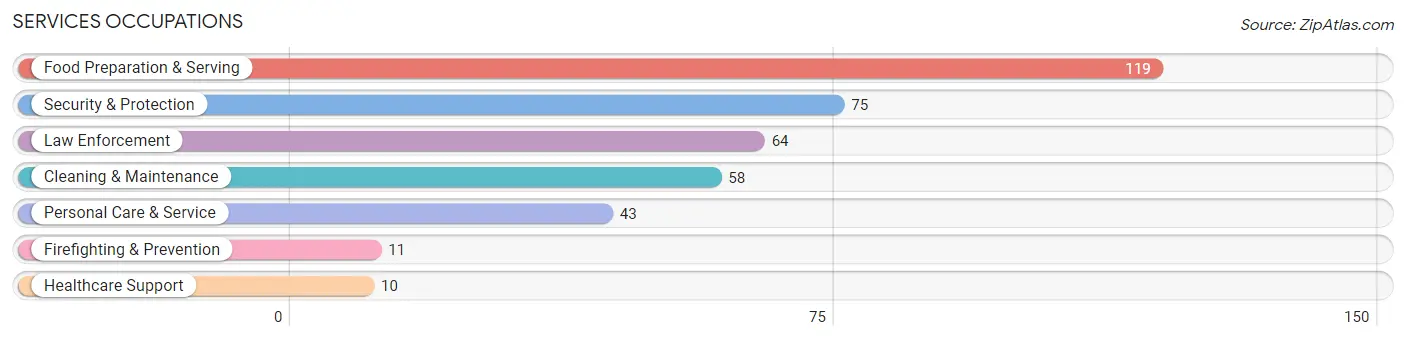
Services Occupations
The most common Services occupations in Churchville are Food Preparation & Serving (119 | 3.9%), Security & Protection (75 | 2.4%), Law Enforcement (64 | 2.1%), Cleaning & Maintenance (58 | 1.9%), and Personal Care & Service (43 | 1.4%).
Services Occupations by Sex
Within the Services occupations in Churchville, the most male-oriented occupations are Law Enforcement (100.0%), Cleaning & Maintenance (100.0%), and Security & Protection (85.3%), while the most female-oriented occupations are Healthcare Support (100.0%), Firefighting & Prevention (100.0%), and Personal Care & Service (100.0%).
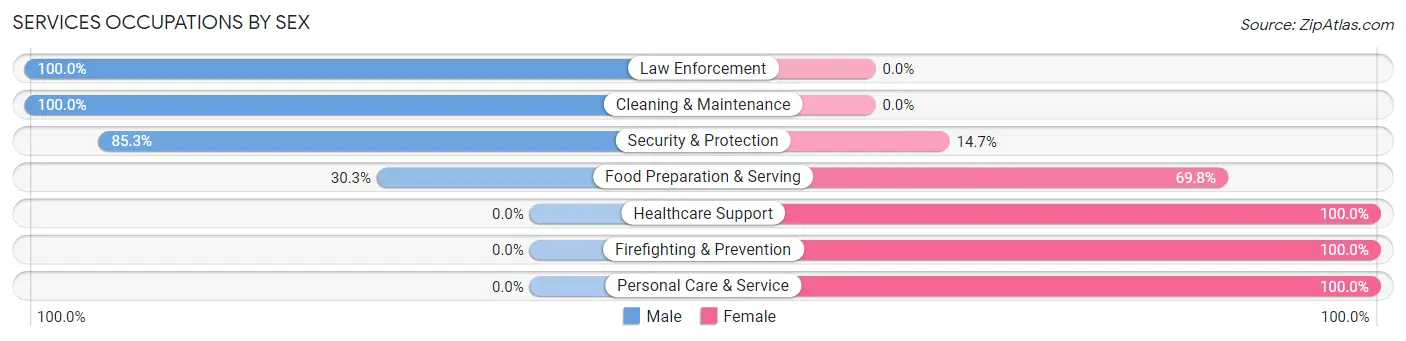
| Occupation | Male | Female |
| Healthcare Support | 0 (0.0%) | 10 (100.0%) |
| Security & Protection | 64 (85.3%) | 11 (14.7%) |
| Firefighting & Prevention | 0 (0.0%) | 11 (100.0%) |
| Law Enforcement | 64 (100.0%) | 0 (0.0%) |
| Food Preparation & Serving | 36 (30.2%) | 83 (69.8%) |
| Cleaning & Maintenance | 58 (100.0%) | 0 (0.0%) |
| Personal Care & Service | 0 (0.0%) | 43 (100.0%) |
| Total (Category) | 158 (51.8%) | 147 (48.2%) |
| Total (Overall) | 1,691 (55.1%) | 1,380 (44.9%) |
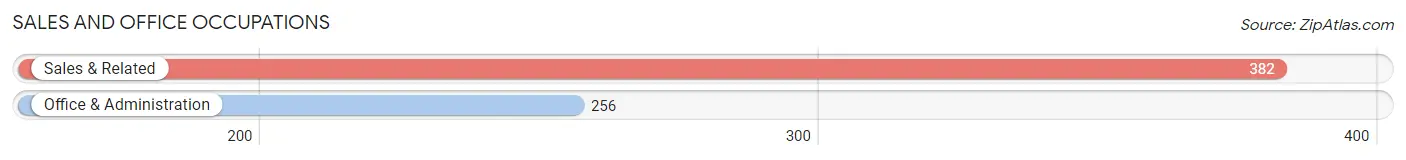
Sales and Office Occupations
The most common Sales and Office occupations in Churchville are Sales & Related (382 | 12.4%), and Office & Administration (256 | 8.3%).
Sales and Office Occupations by Sex

| Occupation | Male | Female |
| Sales & Related | 237 (62.0%) | 145 (38.0%) |
| Office & Administration | 47 (18.4%) | 209 (81.6%) |
| Total (Category) | 284 (44.5%) | 354 (55.5%) |
| Total (Overall) | 1,691 (55.1%) | 1,380 (44.9%) |
Natural Resources, Construction and Maintenance Occupations
The most common Natural Resources, Construction and Maintenance occupations in Churchville are Construction & Extraction (155 | 5.1%), and Installation, Maintenance & Repair (25 | 0.8%).

Natural Resources, Construction and Maintenance Occupations by Sex
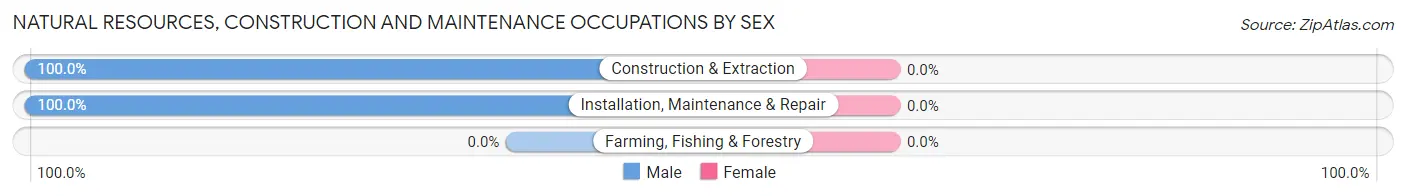
| Occupation | Male | Female |
| Farming, Fishing & Forestry | 0 (0.0%) | 0 (0.0%) |
| Construction & Extraction | 155 (100.0%) | 0 (0.0%) |
| Installation, Maintenance & Repair | 25 (100.0%) | 0 (0.0%) |
| Total (Category) | 180 (100.0%) | 0 (0.0%) |
| Total (Overall) | 1,691 (55.1%) | 1,380 (44.9%) |
Production, Transportation and Moving Occupations
The most common Production, Transportation and Moving occupations in Churchville are Production (51 | 1.7%), Transportation (37 | 1.2%), and Material Moving (20 | 0.6%).
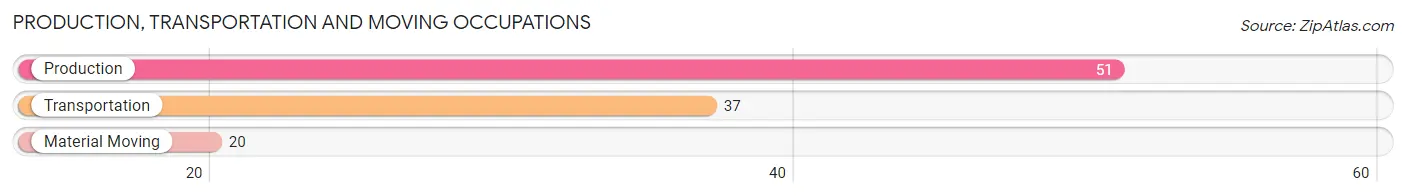
Production, Transportation and Moving Occupations by Sex
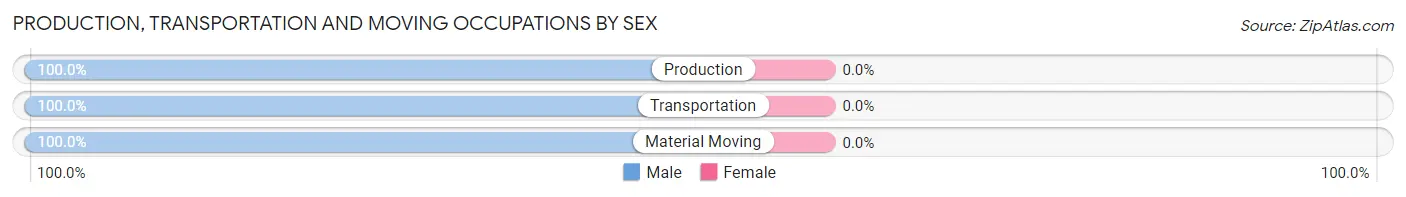
| Occupation | Male | Female |
| Production | 51 (100.0%) | 0 (0.0%) |
| Transportation | 37 (100.0%) | 0 (0.0%) |
| Material Moving | 20 (100.0%) | 0 (0.0%) |
| Total (Category) | 108 (100.0%) | 0 (0.0%) |
| Total (Overall) | 1,691 (55.1%) | 1,380 (44.9%) |
Employment Industries by Sex in Churchville
Employment Industries in Churchville
The major employment industries in Churchville include Professional & Scientific (419 | 13.6%), Health Care & Social Assistance (417 | 13.6%), Educational Services (343 | 11.2%), Manufacturing (337 | 11.0%), and Retail Trade (269 | 8.8%).
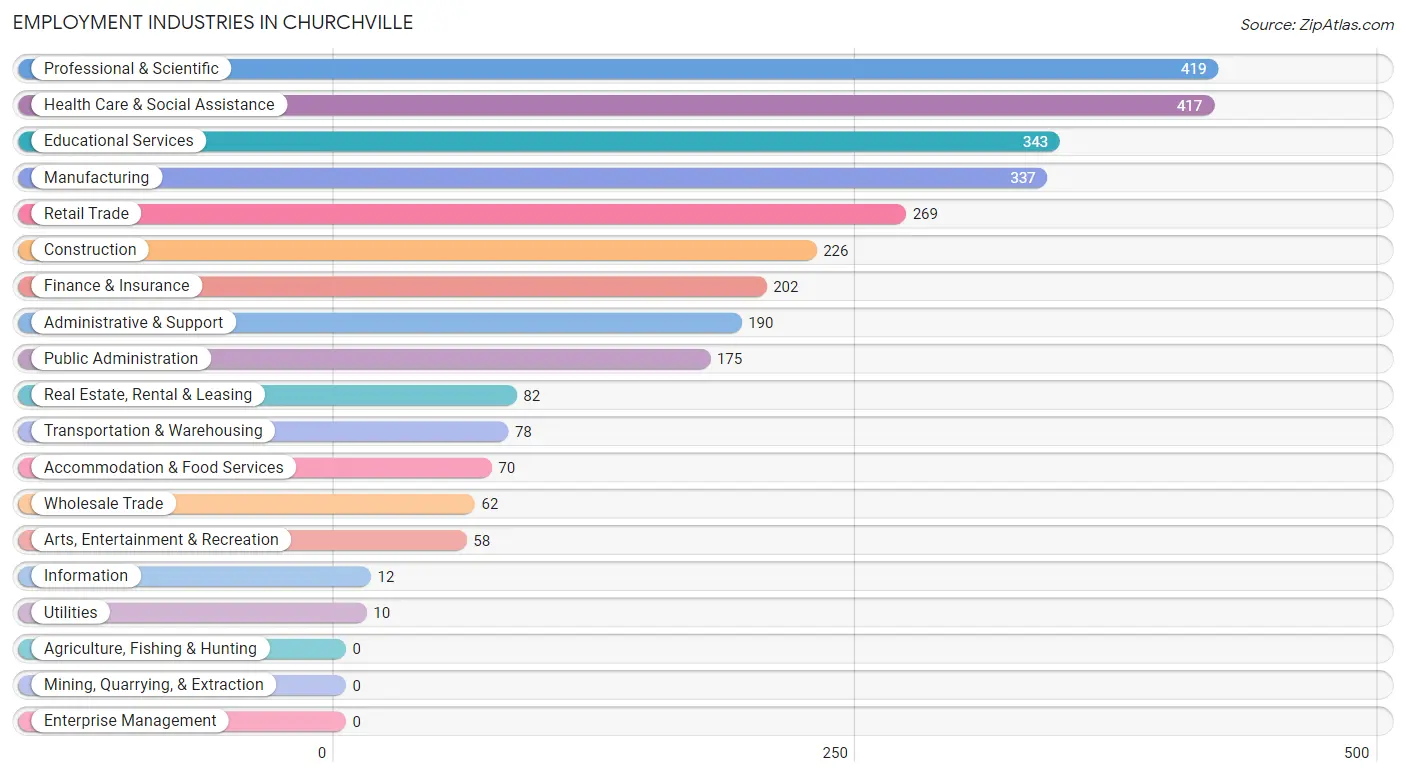
Employment Industries by Sex in Churchville
The Churchville industries that see more men than women are Transportation & Warehousing (100.0%), Utilities (100.0%), and Information (100.0%), whereas the industries that tend to have a higher number of women are Health Care & Social Assistance (92.8%), Arts, Entertainment & Recreation (84.5%), and Educational Services (63.8%).
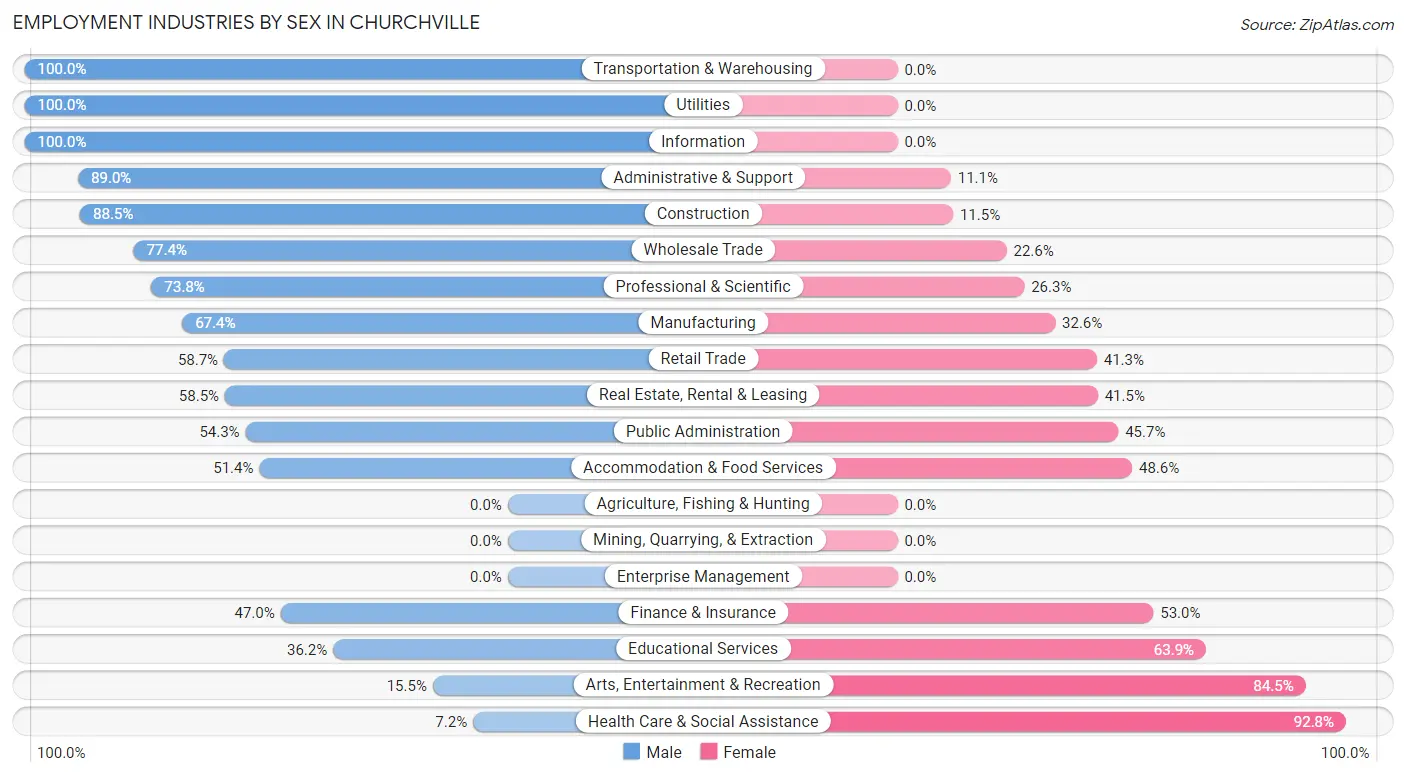
| Industry | Male | Female |
| Agriculture, Fishing & Hunting | 0 (0.0%) | 0 (0.0%) |
| Mining, Quarrying, & Extraction | 0 (0.0%) | 0 (0.0%) |
| Construction | 200 (88.5%) | 26 (11.5%) |
| Manufacturing | 227 (67.4%) | 110 (32.6%) |
| Wholesale Trade | 48 (77.4%) | 14 (22.6%) |
| Retail Trade | 158 (58.7%) | 111 (41.3%) |
| Transportation & Warehousing | 78 (100.0%) | 0 (0.0%) |
| Utilities | 10 (100.0%) | 0 (0.0%) |
| Information | 12 (100.0%) | 0 (0.0%) |
| Finance & Insurance | 95 (47.0%) | 107 (53.0%) |
| Real Estate, Rental & Leasing | 48 (58.5%) | 34 (41.5%) |
| Professional & Scientific | 309 (73.8%) | 110 (26.3%) |
| Enterprise Management | 0 (0.0%) | 0 (0.0%) |
| Administrative & Support | 169 (88.9%) | 21 (11.1%) |
| Educational Services | 124 (36.1%) | 219 (63.8%) |
| Health Care & Social Assistance | 30 (7.2%) | 387 (92.8%) |
| Arts, Entertainment & Recreation | 9 (15.5%) | 49 (84.5%) |
| Accommodation & Food Services | 36 (51.4%) | 34 (48.6%) |
| Public Administration | 95 (54.3%) | 80 (45.7%) |
| Total | 1,691 (55.1%) | 1,380 (44.9%) |
Education in Churchville
School Enrollment in Churchville
The most common levels of schooling among the 1,723 students in Churchville are high school (636 | 36.9%), elementary school (378 | 21.9%), and middle school (323 | 18.8%).
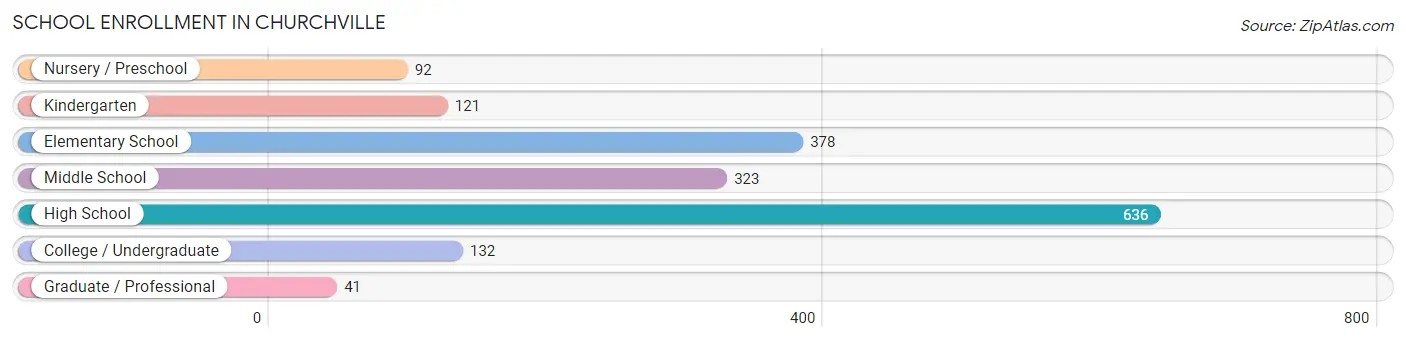
| School Level | # Students | % Students |
| Nursery / Preschool | 92 | 5.3% |
| Kindergarten | 121 | 7.0% |
| Elementary School | 378 | 21.9% |
| Middle School | 323 | 18.8% |
| High School | 636 | 36.9% |
| College / Undergraduate | 132 | 7.7% |
| Graduate / Professional | 41 | 2.4% |
| Total | 1,723 | 100.0% |
School Enrollment by Age by Funding Source in Churchville
Out of a total of 1,723 students who are enrolled in schools in Churchville, 295 (17.1%) attend a private institution, while the remaining 1,428 (82.9%) are enrolled in public schools. The age group of 3 to 4 year olds has the highest likelihood of being enrolled in private schools, with 49 (84.5% in the age bracket) enrolled. Conversely, the age group of 15 to 17 year olds has the lowest likelihood of being enrolled in a private school, with 340 (100.0% in the age bracket) attending a public institution.
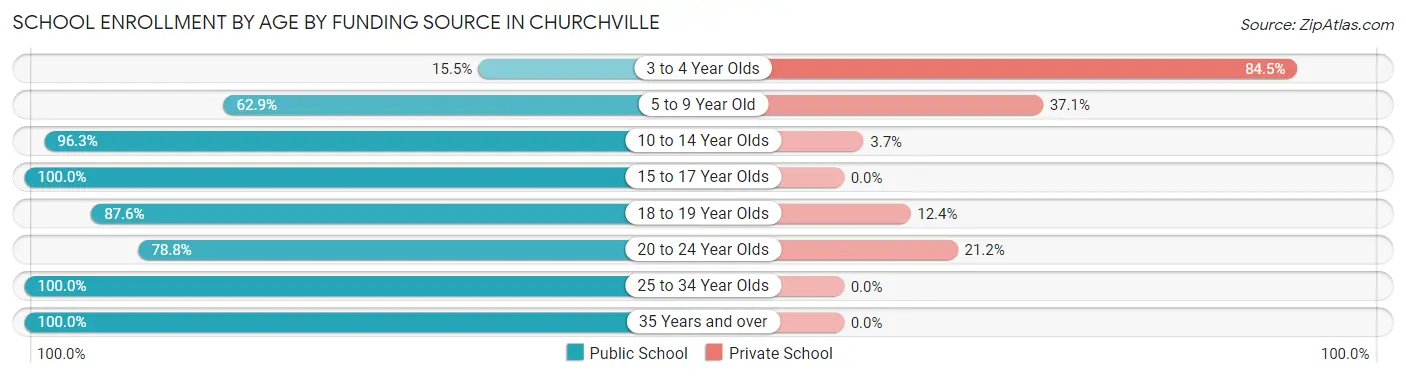
| Age Bracket | Public School | Private School |
| 3 to 4 Year Olds | 9 (15.5%) | 49 (84.5%) |
| 5 to 9 Year Old | 297 (62.9%) | 175 (37.1%) |
| 10 to 14 Year Olds | 420 (96.3%) | 16 (3.7%) |
| 15 to 17 Year Olds | 340 (100.0%) | 0 (0.0%) |
| 18 to 19 Year Olds | 240 (87.6%) | 34 (12.4%) |
| 20 to 24 Year Olds | 78 (78.8%) | 21 (21.2%) |
| 25 to 34 Year Olds | 30 (100.0%) | 0 (0.0%) |
| 35 Years and over | 14 (100.0%) | 0 (0.0%) |
| Total | 1,428 (82.9%) | 295 (17.1%) |
Educational Attainment by Field of Study in Churchville
Business (582 | 24.0%), education (322 | 13.3%), engineering (315 | 13.0%), science & technology (235 | 9.7%), and psychology (207 | 8.5%) are the most common fields of study among 2,423 individuals in Churchville who have obtained a bachelor's degree or higher.
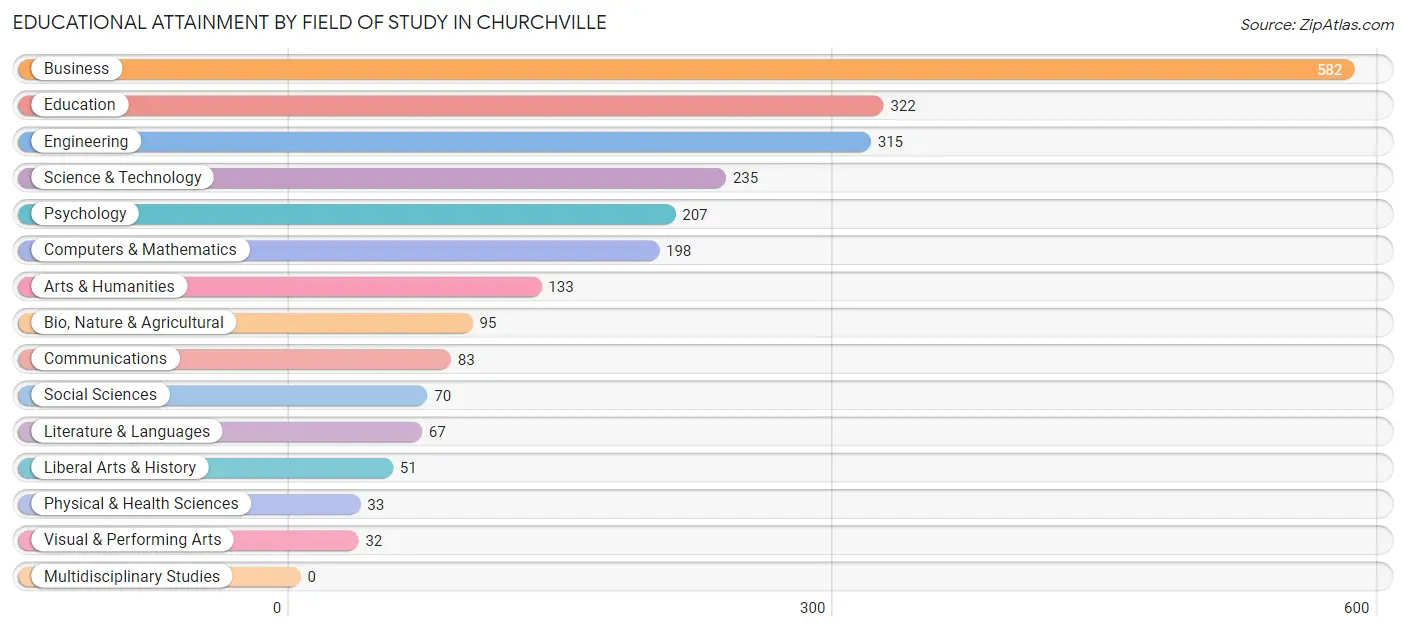
| Field of Study | # Graduates | % Graduates |
| Computers & Mathematics | 198 | 8.2% |
| Bio, Nature & Agricultural | 95 | 3.9% |
| Physical & Health Sciences | 33 | 1.4% |
| Psychology | 207 | 8.5% |
| Social Sciences | 70 | 2.9% |
| Engineering | 315 | 13.0% |
| Multidisciplinary Studies | 0 | 0.0% |
| Science & Technology | 235 | 9.7% |
| Business | 582 | 24.0% |
| Education | 322 | 13.3% |
| Literature & Languages | 67 | 2.8% |
| Liberal Arts & History | 51 | 2.1% |
| Visual & Performing Arts | 32 | 1.3% |
| Communications | 83 | 3.4% |
| Arts & Humanities | 133 | 5.5% |
| Total | 2,423 | 100.0% |
Transportation & Commute in Churchville
Vehicle Availability by Sex in Churchville
The most prevalent vehicle ownership categories in Churchville are males with 2 vehicles (702, accounting for 41.5%) and females with 2 vehicles (596, making up 50.9%).
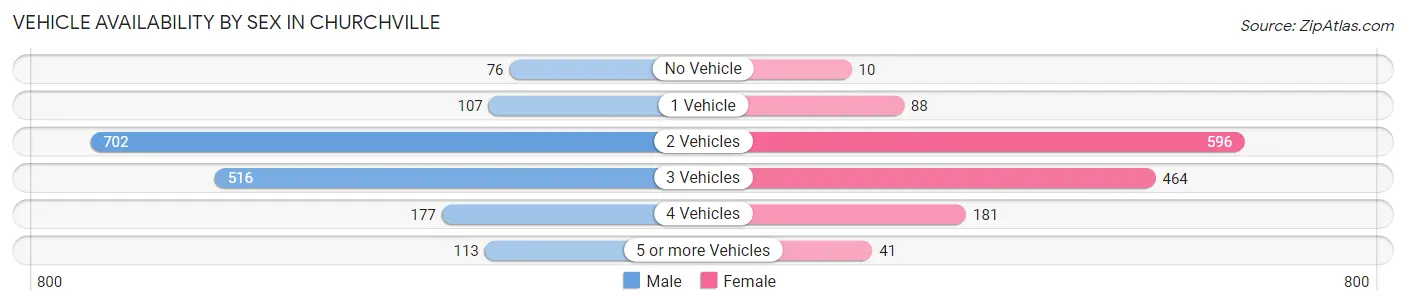
| Vehicles Available | Male | Female |
| No Vehicle | 76 (4.5%) | 10 (0.7%) |
| 1 Vehicle | 107 (6.3%) | 88 (6.4%) |
| 2 Vehicles | 702 (41.5%) | 596 (43.2%) |
| 3 Vehicles | 516 (30.5%) | 464 (33.6%) |
| 4 Vehicles | 177 (10.5%) | 181 (13.1%) |
| 5 or more Vehicles | 113 (6.7%) | 41 (3.0%) |
| Total | 1,691 (100.0%) | 1,380 (100.0%) |
Commute Time in Churchville
The most frequently occuring commute durations in Churchville are 30 to 34 minutes (470 commuters, 19.7%), 45 to 59 minutes (296 commuters, 12.4%), and 15 to 19 minutes (258 commuters, 10.8%).
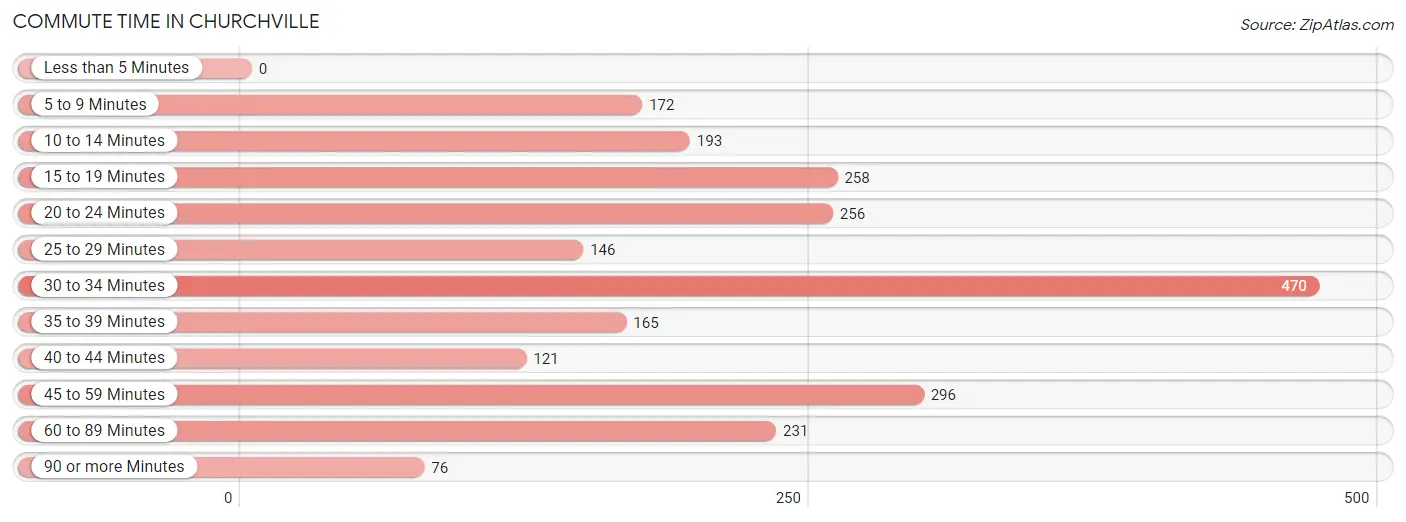
| Commute Time | # Commuters | % Commuters |
| Less than 5 Minutes | 0 | 0.0% |
| 5 to 9 Minutes | 172 | 7.2% |
| 10 to 14 Minutes | 193 | 8.1% |
| 15 to 19 Minutes | 258 | 10.8% |
| 20 to 24 Minutes | 256 | 10.7% |
| 25 to 29 Minutes | 146 | 6.1% |
| 30 to 34 Minutes | 470 | 19.7% |
| 35 to 39 Minutes | 165 | 6.9% |
| 40 to 44 Minutes | 121 | 5.1% |
| 45 to 59 Minutes | 296 | 12.4% |
| 60 to 89 Minutes | 231 | 9.7% |
| 90 or more Minutes | 76 | 3.2% |
Commute Time by Sex in Churchville
The most common commute times in Churchville are 30 to 34 minutes (200 commuters, 16.6%) for males and 30 to 34 minutes (270 commuters, 22.9%) for females.
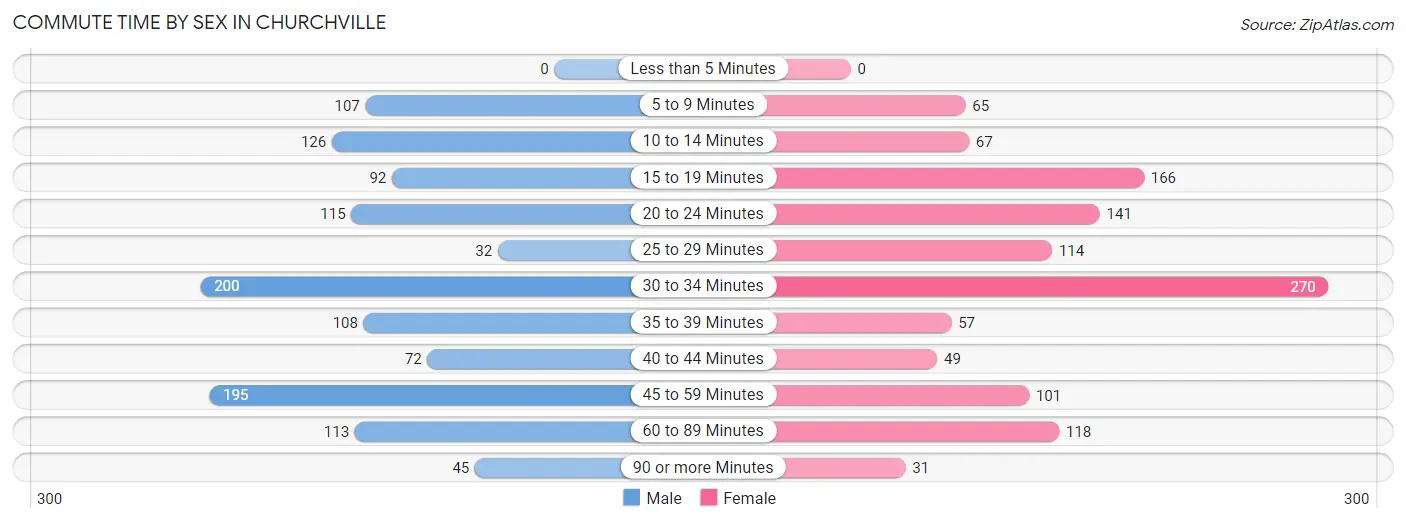
| Commute Time | Male | Female |
| Less than 5 Minutes | 0 (0.0%) | 0 (0.0%) |
| 5 to 9 Minutes | 107 (8.9%) | 65 (5.5%) |
| 10 to 14 Minutes | 126 (10.5%) | 67 (5.7%) |
| 15 to 19 Minutes | 92 (7.6%) | 166 (14.1%) |
| 20 to 24 Minutes | 115 (9.5%) | 141 (12.0%) |
| 25 to 29 Minutes | 32 (2.7%) | 114 (9.7%) |
| 30 to 34 Minutes | 200 (16.6%) | 270 (22.9%) |
| 35 to 39 Minutes | 108 (9.0%) | 57 (4.8%) |
| 40 to 44 Minutes | 72 (6.0%) | 49 (4.2%) |
| 45 to 59 Minutes | 195 (16.2%) | 101 (8.6%) |
| 60 to 89 Minutes | 113 (9.4%) | 118 (10.0%) |
| 90 or more Minutes | 45 (3.7%) | 31 (2.6%) |
Time of Departure to Work by Sex in Churchville
The most frequent times of departure to work in Churchville are 7:00 AM to 7:29 AM (206, 17.1%) for males and 7:30 AM to 7:59 AM (190, 16.1%) for females.
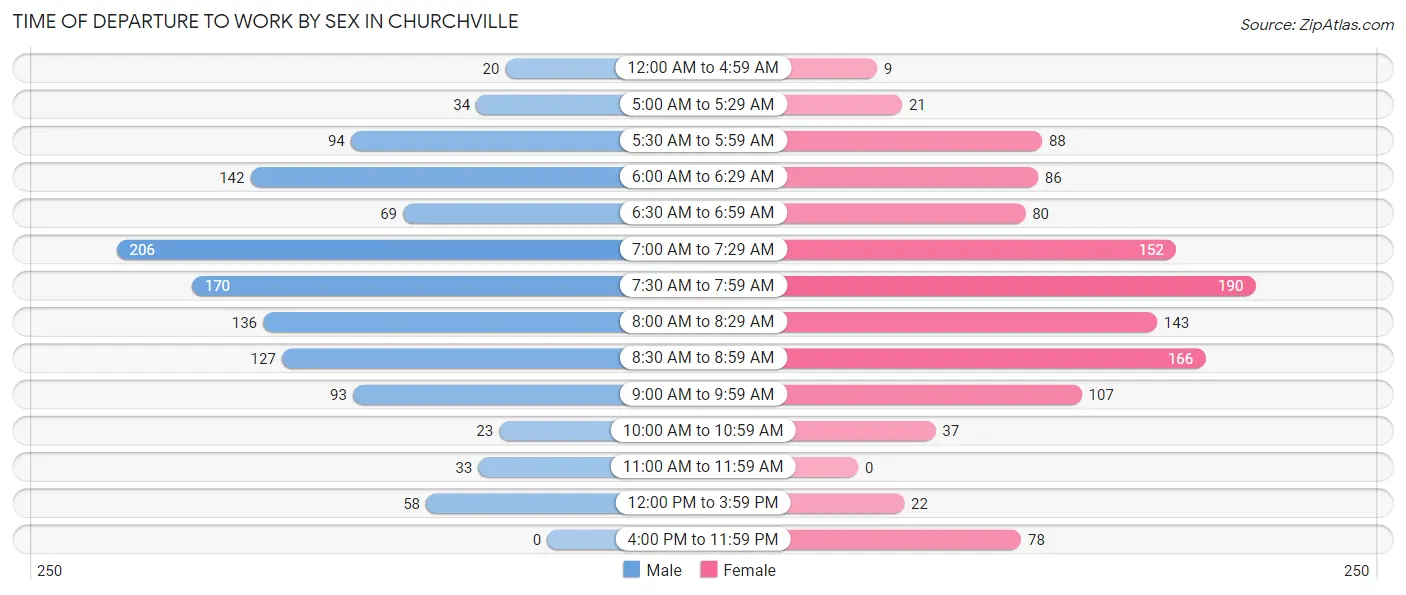
| Time of Departure | Male | Female |
| 12:00 AM to 4:59 AM | 20 (1.7%) | 9 (0.8%) |
| 5:00 AM to 5:29 AM | 34 (2.8%) | 21 (1.8%) |
| 5:30 AM to 5:59 AM | 94 (7.8%) | 88 (7.5%) |
| 6:00 AM to 6:29 AM | 142 (11.8%) | 86 (7.3%) |
| 6:30 AM to 6:59 AM | 69 (5.7%) | 80 (6.8%) |
| 7:00 AM to 7:29 AM | 206 (17.1%) | 152 (12.9%) |
| 7:30 AM to 7:59 AM | 170 (14.1%) | 190 (16.1%) |
| 8:00 AM to 8:29 AM | 136 (11.3%) | 143 (12.1%) |
| 8:30 AM to 8:59 AM | 127 (10.5%) | 166 (14.1%) |
| 9:00 AM to 9:59 AM | 93 (7.7%) | 107 (9.1%) |
| 10:00 AM to 10:59 AM | 23 (1.9%) | 37 (3.1%) |
| 11:00 AM to 11:59 AM | 33 (2.7%) | 0 (0.0%) |
| 12:00 PM to 3:59 PM | 58 (4.8%) | 22 (1.9%) |
| 4:00 PM to 11:59 PM | 0 (0.0%) | 78 (6.6%) |
| Total | 1,205 (100.0%) | 1,179 (100.0%) |
Housing Occupancy in Churchville
Occupancy by Ownership in Churchville
Of the total 1,890 dwellings in Churchville, owner-occupied units account for 1,801 (95.3%), while renter-occupied units make up 89 (4.7%).
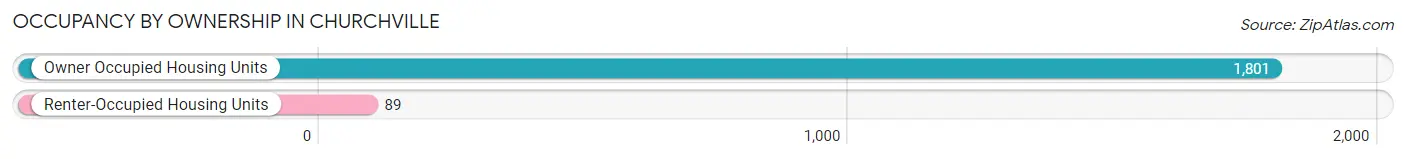
| Occupancy | # Housing Units | % Housing Units |
| Owner Occupied Housing Units | 1,801 | 95.3% |
| Renter-Occupied Housing Units | 89 | 4.7% |
| Total Occupied Housing Units | 1,890 | 100.0% |
Occupancy by Household Size in Churchville
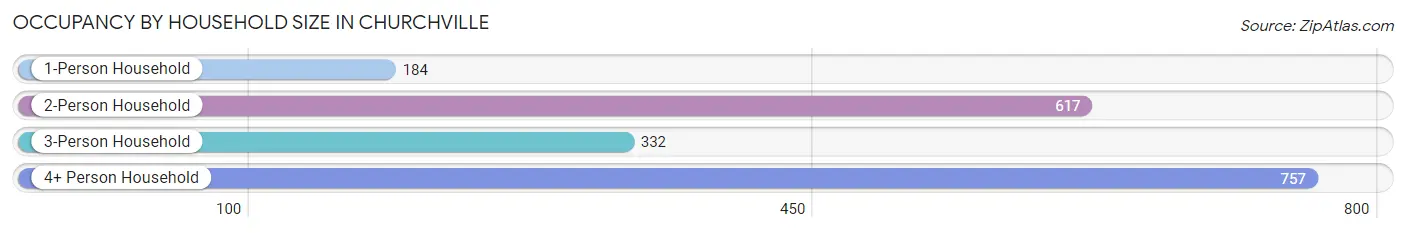
| Household Size | # Housing Units | % Housing Units |
| 1-Person Household | 184 | 9.7% |
| 2-Person Household | 617 | 32.7% |
| 3-Person Household | 332 | 17.6% |
| 4+ Person Household | 757 | 40.1% |
| Total Housing Units | 1,890 | 100.0% |
Occupancy by Ownership by Household Size in Churchville
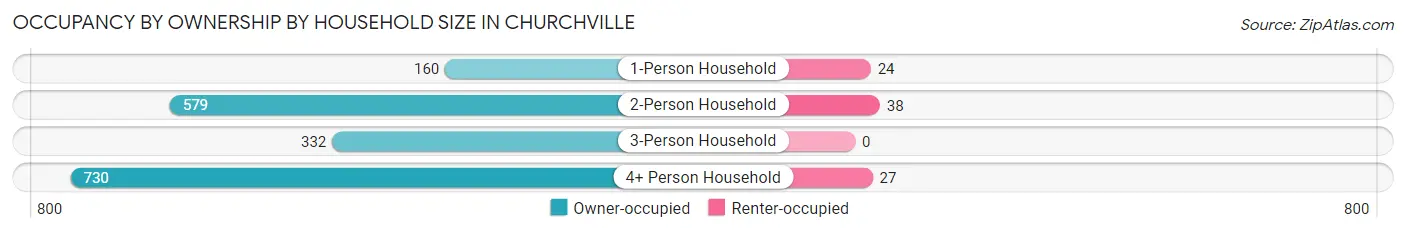
| Household Size | Owner-occupied | Renter-occupied |
| 1-Person Household | 160 (87.0%) | 24 (13.0%) |
| 2-Person Household | 579 (93.8%) | 38 (6.2%) |
| 3-Person Household | 332 (100.0%) | 0 (0.0%) |
| 4+ Person Household | 730 (96.4%) | 27 (3.6%) |
| Total Housing Units | 1,801 (95.3%) | 89 (4.7%) |
Occupancy by Educational Attainment in Churchville
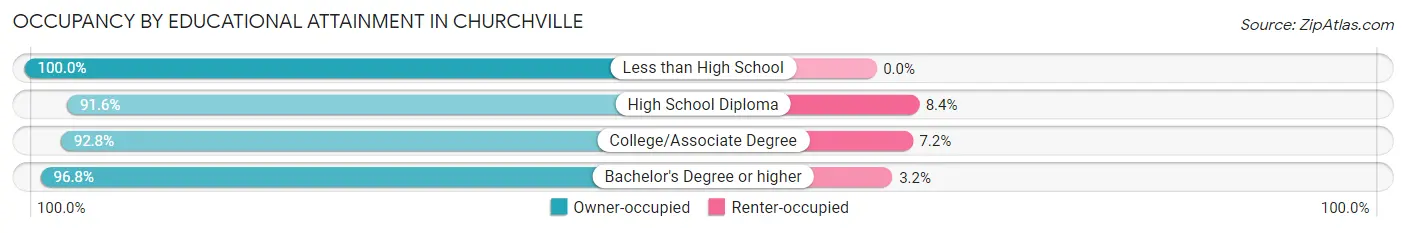
| Household Size | Owner-occupied | Renter-occupied |
| Less than High School | 42 (100.0%) | 0 (0.0%) |
| High School Diploma | 293 (91.6%) | 27 (8.4%) |
| College/Associate Degree | 310 (92.8%) | 24 (7.2%) |
| Bachelor's Degree or higher | 1,156 (96.8%) | 38 (3.2%) |
Occupancy by Age of Householder in Churchville
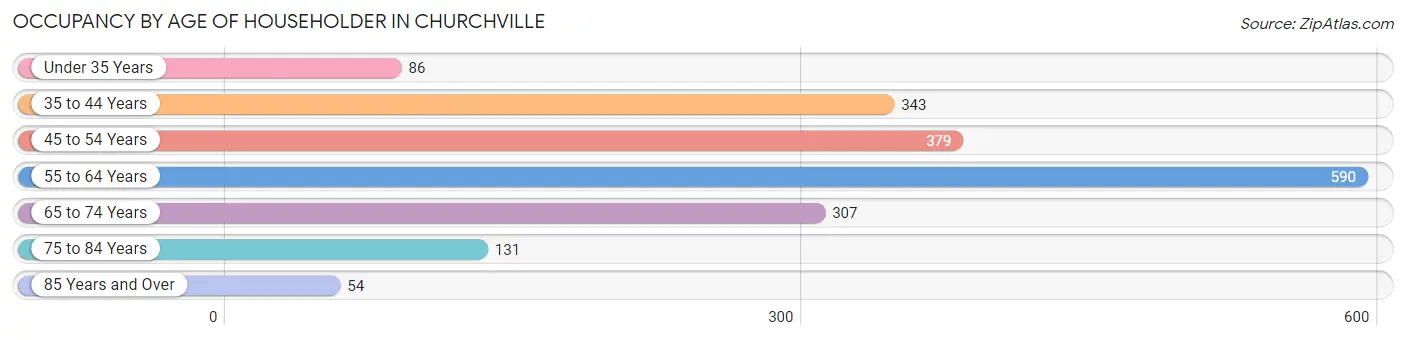
| Age Bracket | # Households | % Households |
| Under 35 Years | 86 | 4.5% |
| 35 to 44 Years | 343 | 18.1% |
| 45 to 54 Years | 379 | 20.1% |
| 55 to 64 Years | 590 | 31.2% |
| 65 to 74 Years | 307 | 16.2% |
| 75 to 84 Years | 131 | 6.9% |
| 85 Years and Over | 54 | 2.9% |
| Total | 1,890 | 100.0% |
Housing Finances in Churchville
Median Income by Occupancy in Churchville
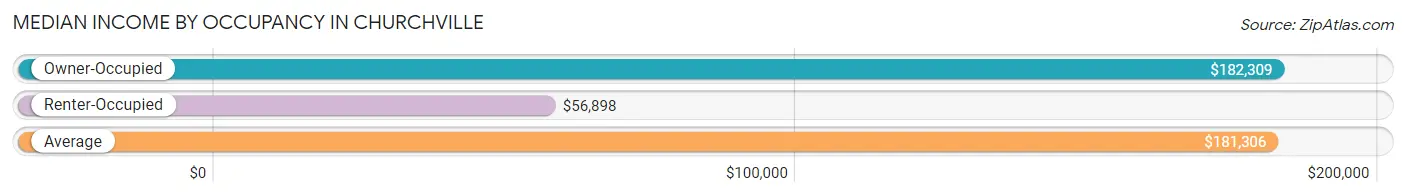
| Occupancy Type | # Households | Median Income |
| Owner-Occupied | 1,801 (95.3%) | $182,309 |
| Renter-Occupied | 89 (4.7%) | $56,898 |
| Average | 1,890 (100.0%) | $181,306 |
Occupancy by Householder Income Bracket in Churchville
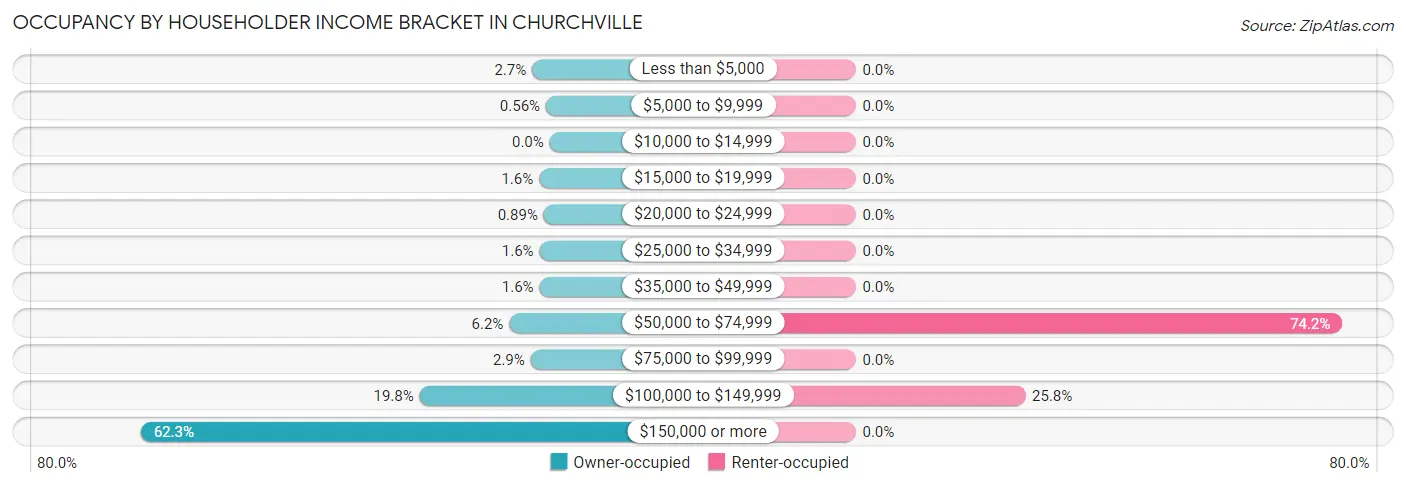
| Income Bracket | Owner-occupied | Renter-occupied |
| Less than $5,000 | 48 (2.7%) | 0 (0.0%) |
| $5,000 to $9,999 | 10 (0.6%) | 0 (0.0%) |
| $10,000 to $14,999 | 0 (0.0%) | 0 (0.0%) |
| $15,000 to $19,999 | 29 (1.6%) | 0 (0.0%) |
| $20,000 to $24,999 | 16 (0.9%) | 0 (0.0%) |
| $25,000 to $34,999 | 28 (1.5%) | 0 (0.0%) |
| $35,000 to $49,999 | 28 (1.5%) | 0 (0.0%) |
| $50,000 to $74,999 | 111 (6.2%) | 66 (74.2%) |
| $75,000 to $99,999 | 52 (2.9%) | 0 (0.0%) |
| $100,000 to $149,999 | 357 (19.8%) | 23 (25.8%) |
| $150,000 or more | 1,122 (62.3%) | 0 (0.0%) |
| Total | 1,801 (100.0%) | 89 (100.0%) |
Monthly Housing Cost Tiers in Churchville
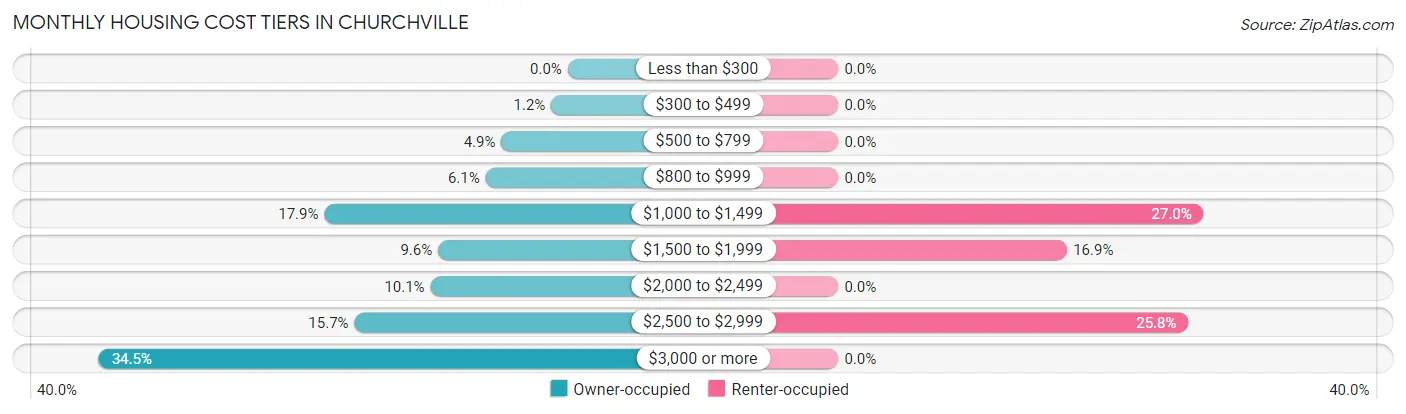
| Monthly Cost | Owner-occupied | Renter-occupied |
| Less than $300 | 0 (0.0%) | 0 (0.0%) |
| $300 to $499 | 22 (1.2%) | 0 (0.0%) |
| $500 to $799 | 88 (4.9%) | 0 (0.0%) |
| $800 to $999 | 109 (6.0%) | 0 (0.0%) |
| $1,000 to $1,499 | 323 (17.9%) | 24 (27.0%) |
| $1,500 to $1,999 | 172 (9.6%) | 15 (16.9%) |
| $2,000 to $2,499 | 182 (10.1%) | 0 (0.0%) |
| $2,500 to $2,999 | 283 (15.7%) | 23 (25.8%) |
| $3,000 or more | 622 (34.5%) | 0 (0.0%) |
| Total | 1,801 (100.0%) | 89 (100.0%) |
Physical Housing Characteristics in Churchville
Housing Structures in Churchville
| Structure Type | # Housing Units | % Housing Units |
| Single Unit, Detached | 1,856 | 98.2% |
| Single Unit, Attached | 10 | 0.5% |
| 2 Unit Apartments | 0 | 0.0% |
| 3 or 4 Unit Apartments | 24 | 1.3% |
| 5 to 9 Unit Apartments | 0 | 0.0% |
| 10 or more Apartments | 0 | 0.0% |
| Mobile Home / Other | 0 | 0.0% |
| Total | 1,890 | 100.0% |
Housing Structures by Occupancy in Churchville
| Structure Type | Owner-occupied | Renter-occupied |
| Single Unit, Detached | 1,791 (96.5%) | 65 (3.5%) |
| Single Unit, Attached | 10 (100.0%) | 0 (0.0%) |
| 2 Unit Apartments | 0 (0.0%) | 0 (0.0%) |
| 3 or 4 Unit Apartments | 0 (0.0%) | 24 (100.0%) |
| 5 to 9 Unit Apartments | 0 (0.0%) | 0 (0.0%) |
| 10 or more Apartments | 0 (0.0%) | 0 (0.0%) |
| Mobile Home / Other | 0 (0.0%) | 0 (0.0%) |
| Total | 1,801 (95.3%) | 89 (4.7%) |
Housing Structures by Number of Rooms in Churchville
| Number of Rooms | Owner-occupied | Renter-occupied |
| 1 Room | 26 (1.4%) | 0 (0.0%) |
| 2 or 3 Rooms | 12 (0.7%) | 0 (0.0%) |
| 4 or 5 Rooms | 135 (7.5%) | 62 (69.7%) |
| 6 or 7 Rooms | 274 (15.2%) | 27 (30.3%) |
| 8 or more Rooms | 1,354 (75.2%) | 0 (0.0%) |
| Total | 1,801 (100.0%) | 89 (100.0%) |
Housing Structure by Heating Type in Churchville
| Heating Type | Owner-occupied | Renter-occupied |
| Utility Gas | 380 (21.1%) | 0 (0.0%) |
| Bottled, Tank, or LP Gas | 46 (2.5%) | 15 (16.9%) |
| Electricity | 612 (34.0%) | 0 (0.0%) |
| Fuel Oil or Kerosene | 763 (42.4%) | 74 (83.2%) |
| Coal or Coke | 0 (0.0%) | 0 (0.0%) |
| All other Fuels | 0 (0.0%) | 0 (0.0%) |
| No Fuel Used | 0 (0.0%) | 0 (0.0%) |
| Total | 1,801 (100.0%) | 89 (100.0%) |
Household Vehicle Usage in Churchville
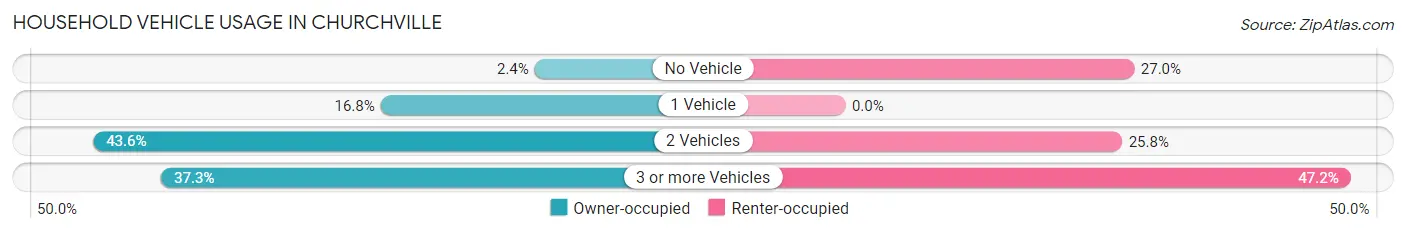
| Vehicles per Household | Owner-occupied | Renter-occupied |
| No Vehicle | 43 (2.4%) | 24 (27.0%) |
| 1 Vehicle | 302 (16.8%) | 0 (0.0%) |
| 2 Vehicles | 785 (43.6%) | 23 (25.8%) |
| 3 or more Vehicles | 671 (37.3%) | 42 (47.2%) |
| Total | 1,801 (100.0%) | 89 (100.0%) |
Real Estate & Mortgages in Churchville
Real Estate and Mortgage Overview in Churchville
| Characteristic | Without Mortgage | With Mortgage |
| Housing Units | 531 | 1,270 |
| Median Property Value | $459,200 | $580,500 |
| Median Household Income | $155,262 | $829 |
| Monthly Housing Costs | $1,124 | $622 |
| Real Estate Taxes | $6,698 | $13 |
Property Value by Mortgage Status in Churchville
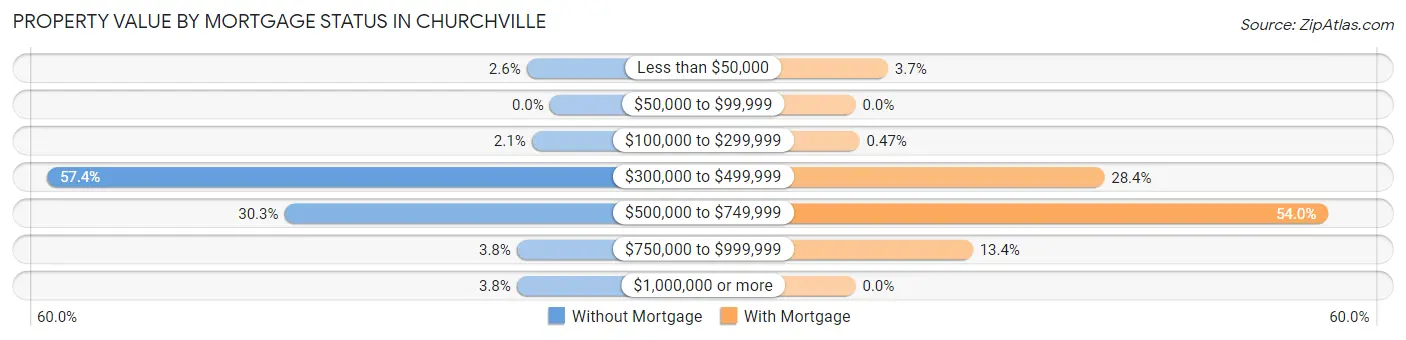
| Property Value | Without Mortgage | With Mortgage |
| Less than $50,000 | 14 (2.6%) | 47 (3.7%) |
| $50,000 to $99,999 | 0 (0.0%) | 0 (0.0%) |
| $100,000 to $299,999 | 11 (2.1%) | 6 (0.5%) |
| $300,000 to $499,999 | 305 (57.4%) | 361 (28.4%) |
| $500,000 to $749,999 | 161 (30.3%) | 686 (54.0%) |
| $750,000 to $999,999 | 20 (3.8%) | 170 (13.4%) |
| $1,000,000 or more | 20 (3.8%) | 0 (0.0%) |
| Total | 531 (100.0%) | 1,270 (100.0%) |
Household Income by Mortgage Status in Churchville
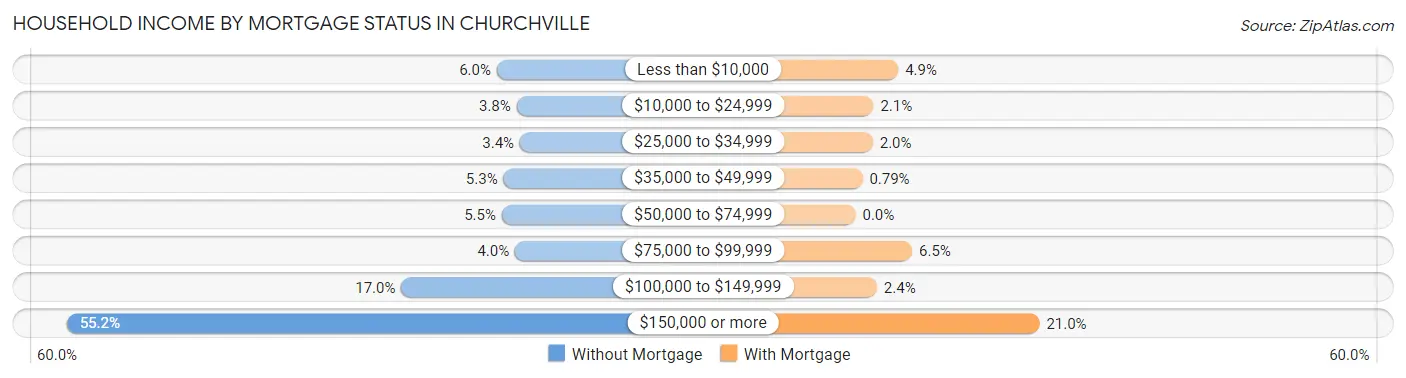
| Household Income | Without Mortgage | With Mortgage |
| Less than $10,000 | 32 (6.0%) | 62 (4.9%) |
| $10,000 to $24,999 | 20 (3.8%) | 26 (2.1%) |
| $25,000 to $34,999 | 18 (3.4%) | 25 (2.0%) |
| $35,000 to $49,999 | 28 (5.3%) | 10 (0.8%) |
| $50,000 to $74,999 | 29 (5.5%) | 0 (0.0%) |
| $75,000 to $99,999 | 21 (4.0%) | 82 (6.5%) |
| $100,000 to $149,999 | 90 (17.0%) | 31 (2.4%) |
| $150,000 or more | 293 (55.2%) | 267 (21.0%) |
| Total | 531 (100.0%) | 1,270 (100.0%) |
Property Value to Household Income Ratio in Churchville
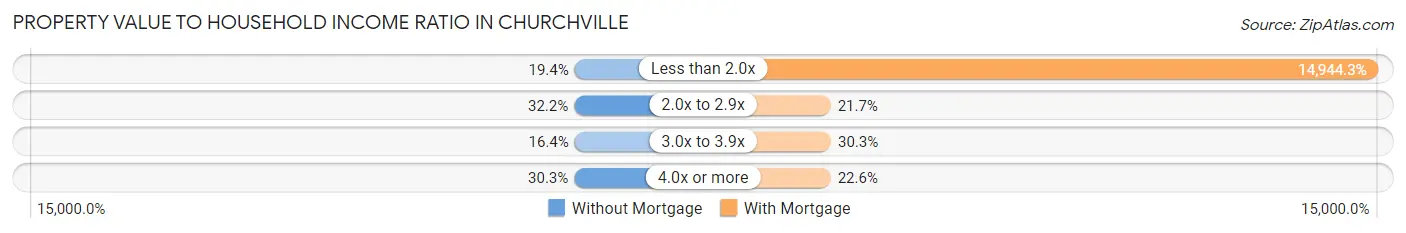
| Value-to-Income Ratio | Without Mortgage | With Mortgage |
| Less than 2.0x | 103 (19.4%) | 189,792 (14,944.2%) |
| 2.0x to 2.9x | 171 (32.2%) | 276 (21.7%) |
| 3.0x to 3.9x | 87 (16.4%) | 385 (30.3%) |
| 4.0x or more | 161 (30.3%) | 287 (22.6%) |
| Total | 531 (100.0%) | 1,270 (100.0%) |
Real Estate Taxes by Mortgage Status in Churchville
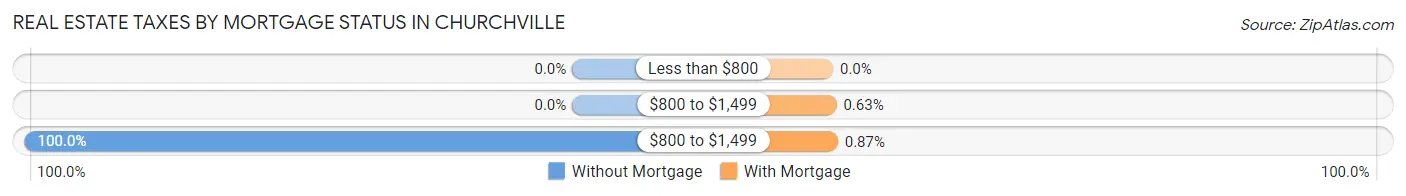
| Property Taxes | Without Mortgage | With Mortgage |
| Less than $800 | 0 (0.0%) | 0 (0.0%) |
| $800 to $1,499 | 0 (0.0%) | 8 (0.6%) |
| $800 to $1,499 | 531 (100.0%) | 11 (0.9%) |
| Total | 531 (100.0%) | 1,270 (100.0%) |
Health & Disability in Churchville
Health Insurance Coverage by Age in Churchville
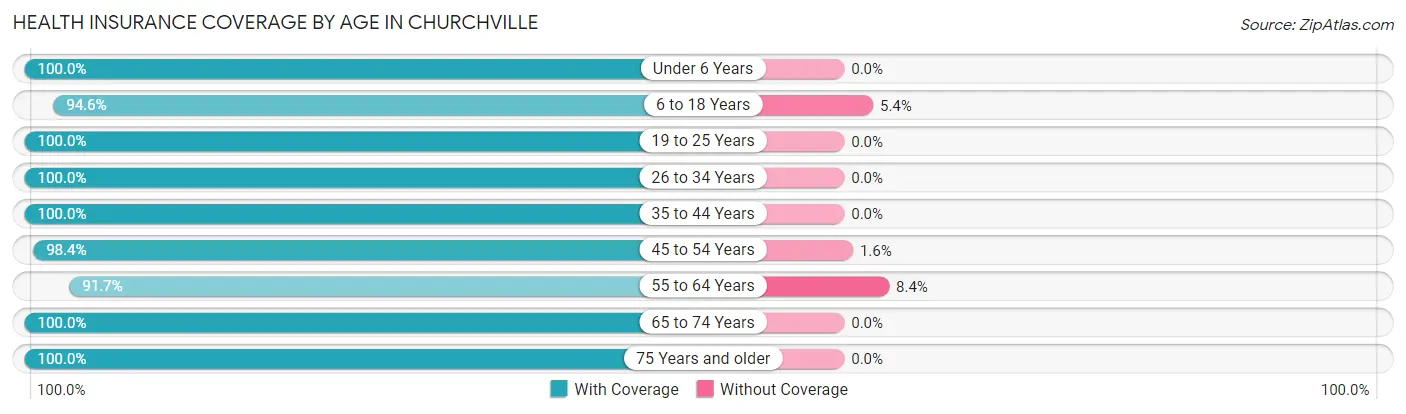
| Age Bracket | With Coverage | Without Coverage |
| Under 6 Years | 338 (100.0%) | 0 (0.0%) |
| 6 to 18 Years | 1,253 (94.6%) | 71 (5.4%) |
| 19 to 25 Years | 418 (100.0%) | 0 (0.0%) |
| 26 to 34 Years | 436 (100.0%) | 0 (0.0%) |
| 35 to 44 Years | 690 (100.0%) | 0 (0.0%) |
| 45 to 54 Years | 849 (98.4%) | 14 (1.6%) |
| 55 to 64 Years | 966 (91.6%) | 88 (8.4%) |
| 65 to 74 Years | 585 (100.0%) | 0 (0.0%) |
| 75 Years and older | 333 (100.0%) | 0 (0.0%) |
| Total | 5,868 (97.1%) | 173 (2.9%) |
Health Insurance Coverage by Citizenship Status in Churchville
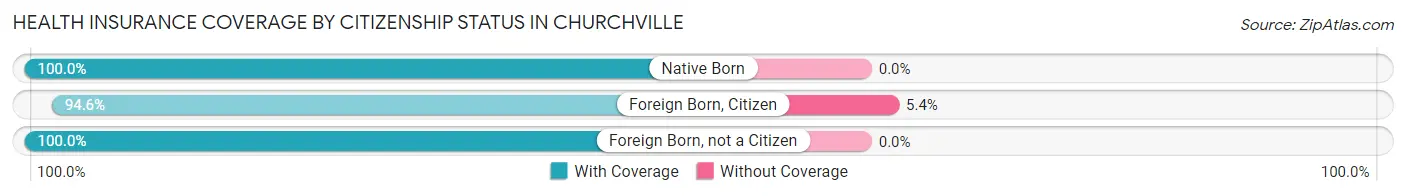
| Citizenship Status | With Coverage | Without Coverage |
| Native Born | 338 (100.0%) | 0 (0.0%) |
| Foreign Born, Citizen | 1,253 (94.6%) | 71 (5.4%) |
| Foreign Born, not a Citizen | 418 (100.0%) | 0 (0.0%) |
Health Insurance Coverage by Household Income in Churchville
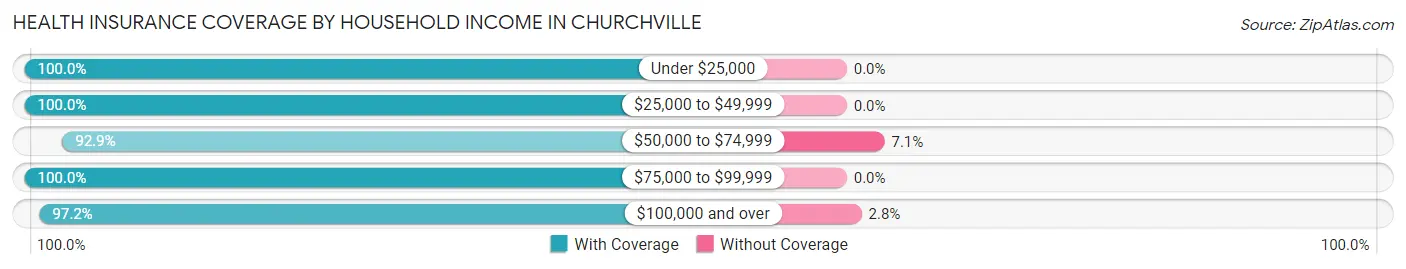
| Household Income | With Coverage | Without Coverage |
| Under $25,000 | 229 (100.0%) | 0 (0.0%) |
| $25,000 to $49,999 | 85 (100.0%) | 0 (0.0%) |
| $50,000 to $74,999 | 355 (92.9%) | 27 (7.1%) |
| $75,000 to $99,999 | 86 (100.0%) | 0 (0.0%) |
| $100,000 and over | 5,113 (97.2%) | 146 (2.8%) |
Public vs Private Health Insurance Coverage by Age in Churchville
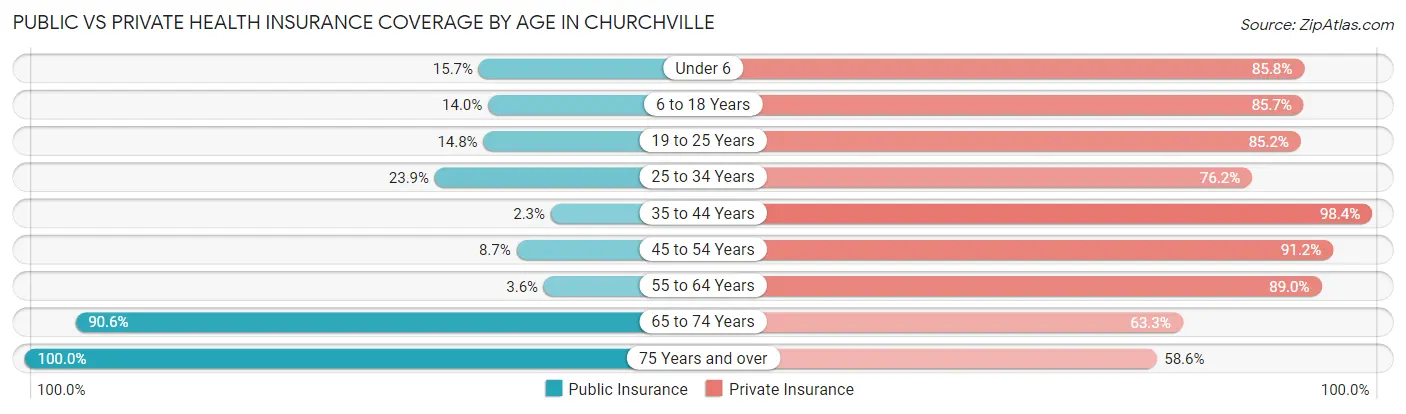
| Age Bracket | Public Insurance | Private Insurance |
| Under 6 | 53 (15.7%) | 290 (85.8%) |
| 6 to 18 Years | 185 (14.0%) | 1,135 (85.7%) |
| 19 to 25 Years | 62 (14.8%) | 356 (85.2%) |
| 25 to 34 Years | 104 (23.8%) | 332 (76.1%) |
| 35 to 44 Years | 16 (2.3%) | 679 (98.4%) |
| 45 to 54 Years | 75 (8.7%) | 787 (91.2%) |
| 55 to 64 Years | 38 (3.6%) | 938 (89.0%) |
| 65 to 74 Years | 530 (90.6%) | 370 (63.2%) |
| 75 Years and over | 333 (100.0%) | 195 (58.6%) |
| Total | 1,396 (23.1%) | 5,082 (84.1%) |
Disability Status by Sex by Age in Churchville
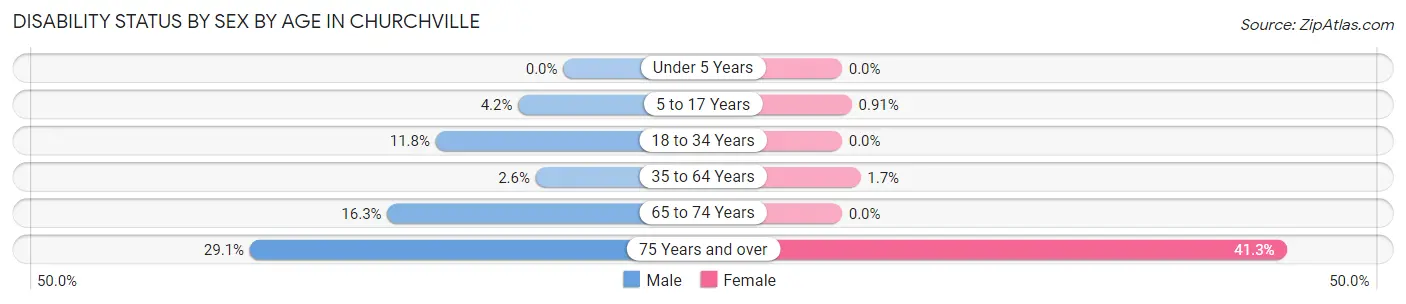
| Age Bracket | Male | Female |
| Under 5 Years | 0 (0.0%) | 0 (0.0%) |
| 5 to 17 Years | 21 (4.2%) | 7 (0.9%) |
| 18 to 34 Years | 65 (11.8%) | 0 (0.0%) |
| 35 to 64 Years | 34 (2.6%) | 22 (1.7%) |
| 65 to 74 Years | 56 (16.3%) | 0 (0.0%) |
| 75 Years and over | 32 (29.1%) | 92 (41.3%) |
Disability Class by Sex by Age in Churchville
Disability Class: Hearing Difficulty
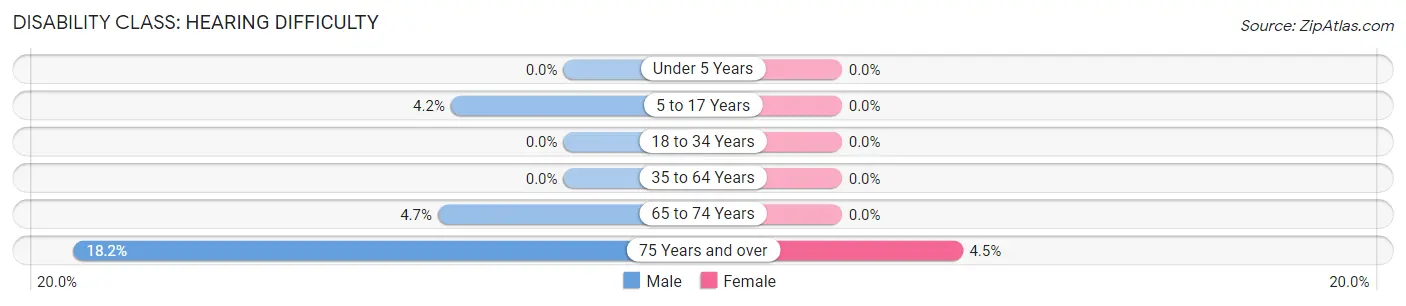
| Age Bracket | Male | Female |
| Under 5 Years | 0 (0.0%) | 0 (0.0%) |
| 5 to 17 Years | 21 (4.2%) | 0 (0.0%) |
| 18 to 34 Years | 0 (0.0%) | 0 (0.0%) |
| 35 to 64 Years | 0 (0.0%) | 0 (0.0%) |
| 65 to 74 Years | 16 (4.7%) | 0 (0.0%) |
| 75 Years and over | 20 (18.2%) | 10 (4.5%) |
Disability Class: Vision Difficulty
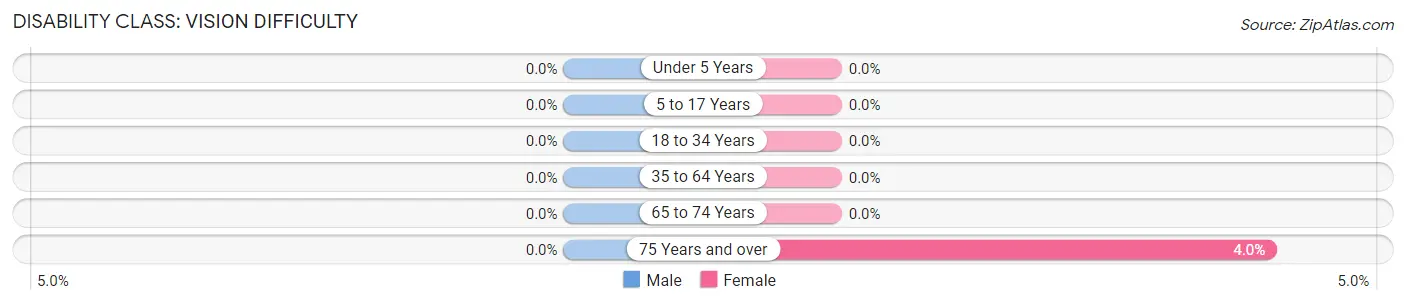
| Age Bracket | Male | Female |
| Under 5 Years | 0 (0.0%) | 0 (0.0%) |
| 5 to 17 Years | 0 (0.0%) | 0 (0.0%) |
| 18 to 34 Years | 0 (0.0%) | 0 (0.0%) |
| 35 to 64 Years | 0 (0.0%) | 0 (0.0%) |
| 65 to 74 Years | 0 (0.0%) | 0 (0.0%) |
| 75 Years and over | 0 (0.0%) | 9 (4.0%) |
Disability Class: Cognitive Difficulty
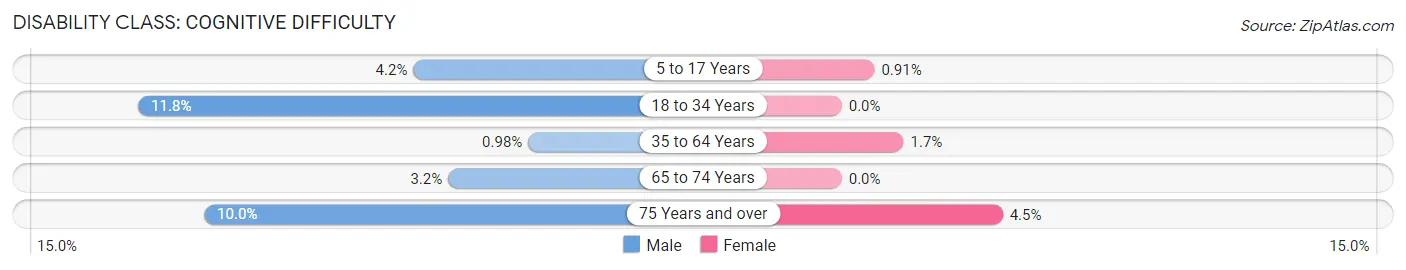
| Age Bracket | Male | Female |
| 5 to 17 Years | 21 (4.2%) | 7 (0.9%) |
| 18 to 34 Years | 65 (11.8%) | 0 (0.0%) |
| 35 to 64 Years | 13 (1.0%) | 22 (1.7%) |
| 65 to 74 Years | 11 (3.2%) | 0 (0.0%) |
| 75 Years and over | 11 (10.0%) | 10 (4.5%) |
Disability Class: Ambulatory Difficulty
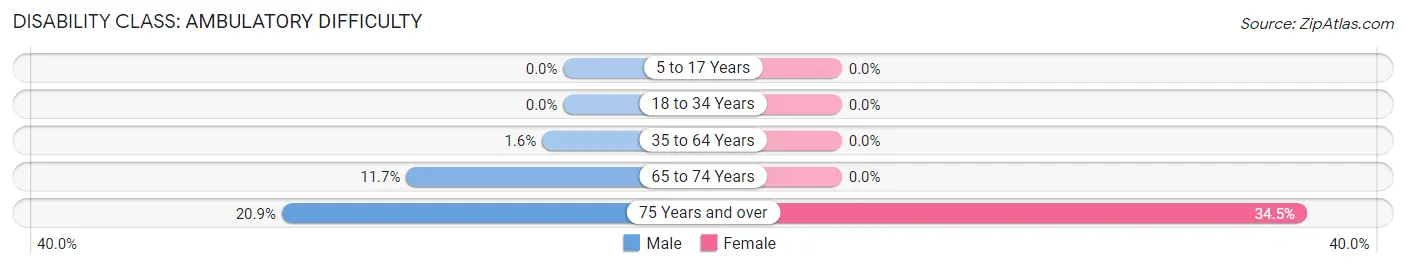
| Age Bracket | Male | Female |
| 5 to 17 Years | 0 (0.0%) | 0 (0.0%) |
| 18 to 34 Years | 0 (0.0%) | 0 (0.0%) |
| 35 to 64 Years | 21 (1.6%) | 0 (0.0%) |
| 65 to 74 Years | 40 (11.7%) | 0 (0.0%) |
| 75 Years and over | 23 (20.9%) | 77 (34.5%) |
Disability Class: Self-Care Difficulty
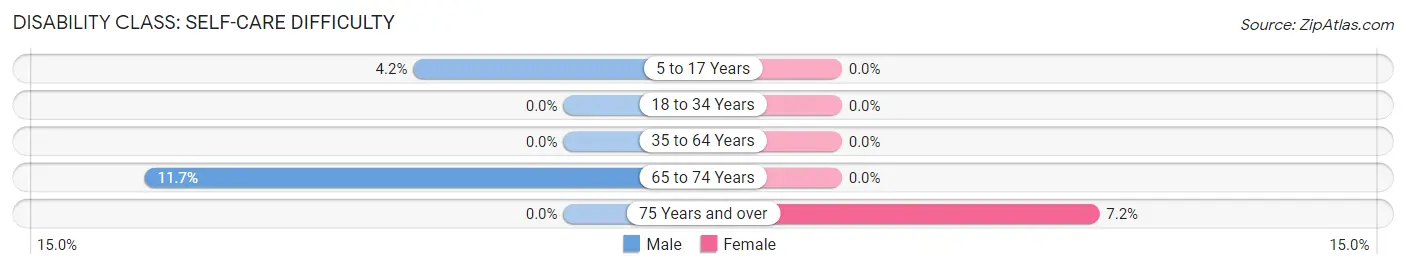
| Age Bracket | Male | Female |
| 5 to 17 Years | 21 (4.2%) | 0 (0.0%) |
| 18 to 34 Years | 0 (0.0%) | 0 (0.0%) |
| 35 to 64 Years | 0 (0.0%) | 0 (0.0%) |
| 65 to 74 Years | 40 (11.7%) | 0 (0.0%) |
| 75 Years and over | 0 (0.0%) | 16 (7.2%) |
Technology Access in Churchville
Computing Device Access in Churchville
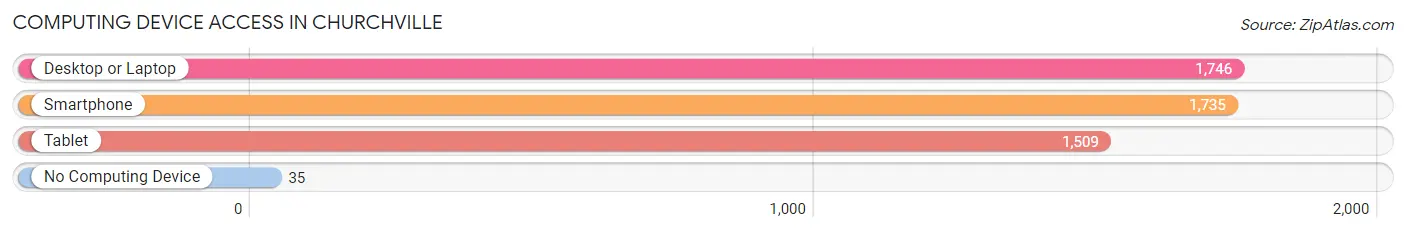
| Device Type | # Households | % Households |
| Desktop or Laptop | 1,746 | 92.4% |
| Smartphone | 1,735 | 91.8% |
| Tablet | 1,509 | 79.8% |
| No Computing Device | 35 | 1.8% |
| Total | 1,890 | 100.0% |
Internet Access in Churchville
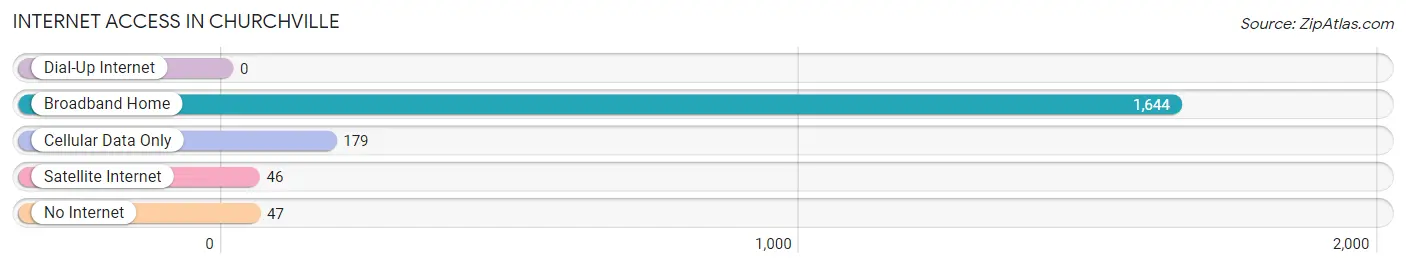
| Internet Type | # Households | % Households |
| Dial-Up Internet | 0 | 0.0% |
| Broadband Home | 1,644 | 87.0% |
| Cellular Data Only | 179 | 9.5% |
| Satellite Internet | 46 | 2.4% |
| No Internet | 47 | 2.5% |
| Total | 1,890 | 100.0% |
Churchville Summary
History
The history of Churchville, Pennsylvania dates back to the late 1700s when the area was first settled by German immigrants. The first settlers were the families of John and Jacob Schaeffer, who arrived in 1790. The Schaeffers were followed by other German families, including the Bauers, the Klines, the Kramers, and the Weavers. The area was originally known as Schaefferstown, but the name was changed to Churchville in 1845 when the first church was built.
The area was primarily agricultural, with the main crops being wheat, corn, and oats. The area was also known for its dairy farms, which produced milk, butter, and cheese. The first post office was established in 1851, and the first school was built in 1854.
The town grew slowly but steadily over the years, and by the early 1900s, it had become a thriving community. The population had grown to over 500 people, and the town had several stores, a bank, a hotel, and a variety of other businesses.
In the early 1900s, the town was also home to a number of industries, including a brickyard, a sawmill, a gristmill, and a canning factory. The town also had a trolley line that connected it to nearby towns.
The town continued to grow and prosper throughout the 20th century. In the 1950s, the population had grown to over 1,000 people, and the town had a variety of businesses, including a movie theater, a bowling alley, and a variety of restaurants.
The town has continued to grow and prosper in the 21st century. The population has grown to over 2,000 people, and the town has a variety of businesses, including a grocery store, a hardware store, and a variety of restaurants.
Geography
Churchville is located in Bucks County, Pennsylvania, about 25 miles north of Philadelphia. The town is situated in a rural area, surrounded by rolling hills and farmland. The town is located on the banks of the Neshaminy Creek, which flows through the town and provides a scenic backdrop.
The town covers an area of 1.3 square miles, and the elevation is approximately 300 feet above sea level. The climate is temperate, with hot summers and cold winters. The average annual temperature is around 50 degrees Fahrenheit.
Economy
The economy of Churchville is primarily based on agriculture and tourism. The town is home to several farms, which produce a variety of crops, including wheat, corn, and oats. The town is also home to a number of dairy farms, which produce milk, butter, and cheese.
The town is also home to a variety of businesses, including a grocery store, a hardware store, and a variety of restaurants. The town is also home to a number of small manufacturing businesses, which produce a variety of products, including furniture, clothing, and electronics.
The town is also a popular tourist destination, with a variety of attractions, including a historic district, a nature center, and a variety of outdoor activities.
Demographics
As of the 2010 census, the population of Churchville was 2,072. The population is primarily white (94.3%), with a small percentage of African Americans (2.2%) and Hispanics (2.2%). The median household income is $60,938, and the median age is 43.7 years. The town has a high rate of homeownership (83.3%), and the average commute time is 28 minutes.
Common Questions
What is Per Capita Income in Churchville?
Per Capita income in Churchville is $71,733.
What is the Median Family Income in Churchville?
Median Family Income in Churchville is $198,103.
What is the Median Household income in Churchville?
Median Household Income in Churchville is $181,306.
What is Income or Wage Gap in Churchville?
Income or Wage Gap in Churchville is 51.7%.
Women in Churchville earn 48.3 cents for every dollar earned by a man.
What is Inequality or Gini Index in Churchville?
Inequality or Gini Index in Churchville is 0.42.
What is the Total Population of Churchville?
Total Population of Churchville is 6,041.
What is the Total Male Population of Churchville?
Total Male Population of Churchville is 2,923.
What is the Total Female Population of Churchville?
Total Female Population of Churchville is 3,118.
What is the Ratio of Males per 100 Females in Churchville?
There are 93.75 Males per 100 Females in Churchville.
What is the Ratio of Females per 100 Males in Churchville?
There are 106.67 Females per 100 Males in Churchville.
What is the Median Population Age in Churchville?
Median Population Age in Churchville is 42.4 Years.
What is the Average Family Size in Churchville
Average Family Size in Churchville is 3.5 People.
What is the Average Household Size in Churchville
Average Household Size in Churchville is 3.2 People.
How Large is the Labor Force in Churchville?
There are 3,160 People in the Labor Forcein in Churchville.
What is the Percentage of People in the Labor Force in Churchville?
65.8% of People are in the Labor Force in Churchville.
What is the Unemployment Rate in Churchville?
Unemployment Rate in Churchville is 2.8%.