Ancient Oaks, PA Map & Demographics
Ancient Oaks Map
Ancient Oaks Overview
$53,029
PER CAPITA INCOME
$139,118
AVG FAMILY INCOME
$121,181
AVG HOUSEHOLD INCOME
51.7%
WAGE / INCOME GAP [ % ]
48.3¢/ $1
WAGE / INCOME GAP [ $ ]
0.39
INEQUALITY / GINI INDEX
7,363
TOTAL POPULATION
3,518
MALE POPULATION
3,845
FEMALE POPULATION
91.50
MALES / 100 FEMALES
109.30
FEMALES / 100 MALES
42.2
MEDIAN AGE
3.3
AVG FAMILY SIZE
2.9
AVG HOUSEHOLD SIZE
3,735
LABOR FORCE [ PEOPLE ]
70.2%
PERCENT IN LABOR FORCE
2.1%
UNEMPLOYMENT RATE
Income in Ancient Oaks
Income Overview in Ancient Oaks
Per Capita Income in Ancient Oaks is $53,029, while median incomes of families and households are $139,118 and $121,181 respectively.
| Characteristic | Number | Measure |
| Per Capita Income | 7,363 | $53,029 |
| Median Family Income | 2,044 | $139,118 |
| Mean Family Income | 2,044 | $157,951 |
| Median Household Income | 2,505 | $121,181 |
| Mean Household Income | 2,505 | $151,851 |
| Income Deficit | 2,044 | $0 |
| Wage / Income Gap (%) | 7,363 | 51.72% |
| Wage / Income Gap ($) | 7,363 | 48.28¢ per $1 |
| Gini / Inequality Index | 7,363 | 0.39 |
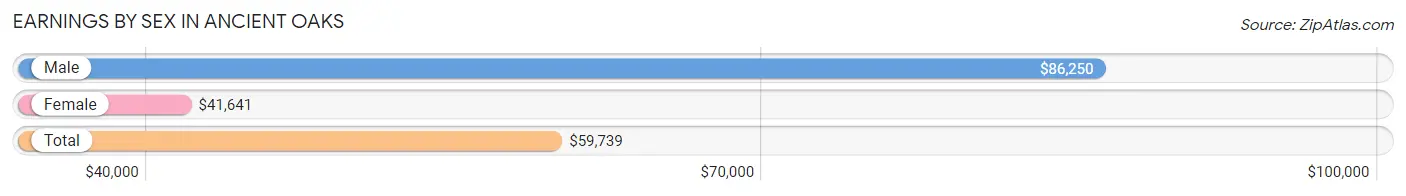
Earnings by Sex in Ancient Oaks
Average Earnings in Ancient Oaks are $59,739, $86,250 for men and $41,641 for women, a difference of 51.7%.
| Sex | Number | Average Earnings |
| Male | 2,134 (53.5%) | $86,250 |
| Female | 1,852 (46.5%) | $41,641 |
| Total | 3,986 (100.0%) | $59,739 |
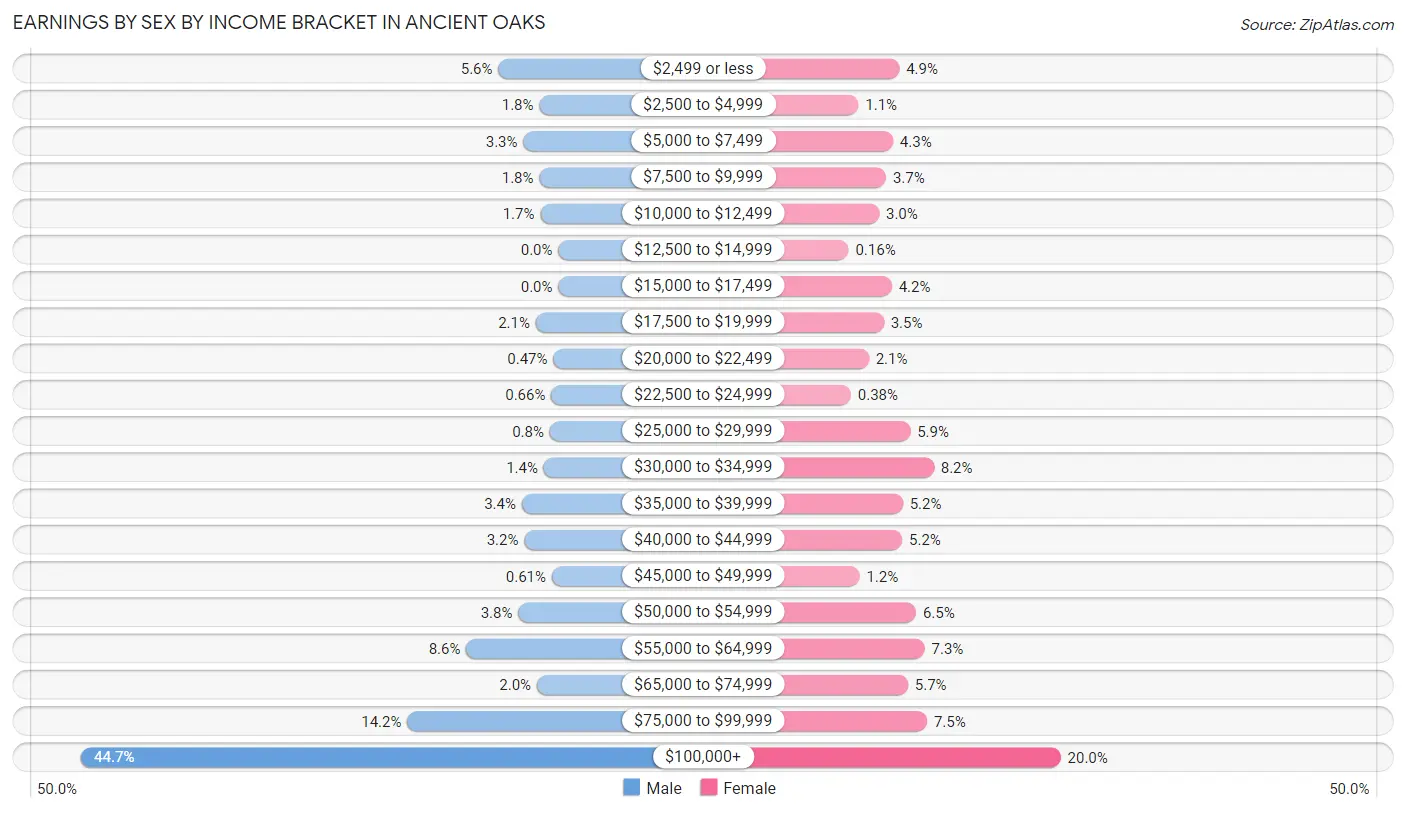
Earnings by Sex by Income Bracket in Ancient Oaks
The most common earnings brackets in Ancient Oaks are $100,000+ for men (954 | 44.7%) and $100,000+ for women (371 | 20.0%).
| Income | Male | Female |
| $2,499 or less | 120 (5.6%) | 91 (4.9%) |
| $2,500 to $4,999 | 38 (1.8%) | 20 (1.1%) |
| $5,000 to $7,499 | 70 (3.3%) | 80 (4.3%) |
| $7,500 to $9,999 | 38 (1.8%) | 68 (3.7%) |
| $10,000 to $12,499 | 36 (1.7%) | 56 (3.0%) |
| $12,500 to $14,999 | 0 (0.0%) | 3 (0.2%) |
| $15,000 to $17,499 | 0 (0.0%) | 78 (4.2%) |
| $17,500 to $19,999 | 45 (2.1%) | 64 (3.5%) |
| $20,000 to $22,499 | 10 (0.5%) | 38 (2.1%) |
| $22,500 to $24,999 | 14 (0.7%) | 7 (0.4%) |
| $25,000 to $29,999 | 17 (0.8%) | 110 (5.9%) |
| $30,000 to $34,999 | 29 (1.4%) | 151 (8.2%) |
| $35,000 to $39,999 | 73 (3.4%) | 97 (5.2%) |
| $40,000 to $44,999 | 68 (3.2%) | 96 (5.2%) |
| $45,000 to $49,999 | 13 (0.6%) | 22 (1.2%) |
| $50,000 to $54,999 | 80 (3.7%) | 120 (6.5%) |
| $55,000 to $64,999 | 184 (8.6%) | 135 (7.3%) |
| $65,000 to $74,999 | 43 (2.0%) | 106 (5.7%) |
| $75,000 to $99,999 | 302 (14.1%) | 139 (7.5%) |
| $100,000+ | 954 (44.7%) | 371 (20.0%) |
| Total | 2,134 (100.0%) | 1,852 (100.0%) |
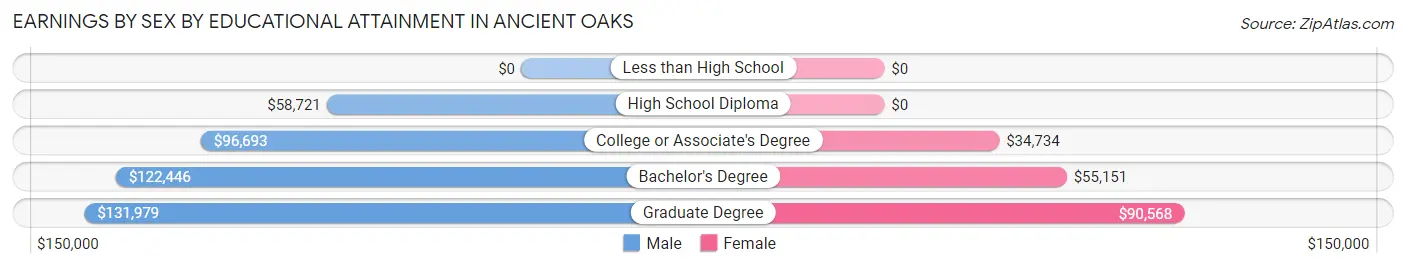
Earnings by Sex by Educational Attainment in Ancient Oaks
Average earnings in Ancient Oaks are $106,823 for men and $52,527 for women, a difference of 50.8%. Men with an educational attainment of graduate degree enjoy the highest average annual earnings of $131,979, while those with high school diploma education earn the least with $58,721. Women with an educational attainment of graduate degree earn the most with the average annual earnings of $90,568, while those with college or associate's degree education have the smallest earnings of $34,734.
| Educational Attainment | Male Income | Female Income |
| Less than High School | - | - |
| High School Diploma | $58,721 | $0 |
| College or Associate's Degree | $96,693 | $34,734 |
| Bachelor's Degree | $122,446 | $55,151 |
| Graduate Degree | $131,979 | $90,568 |
| Total | $106,823 | $52,527 |
Family Income in Ancient Oaks
Family Income Brackets in Ancient Oaks
According to the Ancient Oaks family income data, there are 707 families falling into the $200,000+ income range, which is the most common income bracket and makes up 34.6% of all families.
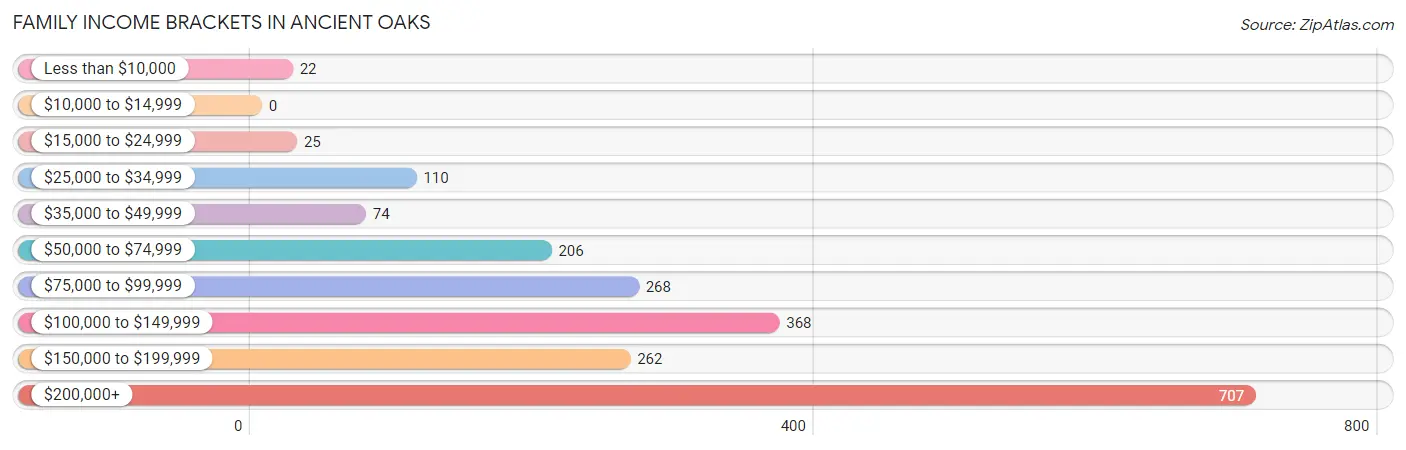
| Income Bracket | # Families | % Families |
| Less than $10,000 | 22 | 1.1% |
| $10,000 to $14,999 | 0 | 0.0% |
| $15,000 to $24,999 | 25 | 1.2% |
| $25,000 to $34,999 | 110 | 5.4% |
| $35,000 to $49,999 | 74 | 3.6% |
| $50,000 to $74,999 | 206 | 10.1% |
| $75,000 to $99,999 | 268 | 13.1% |
| $100,000 to $149,999 | 368 | 18.0% |
| $150,000 to $199,999 | 262 | 12.8% |
| $200,000+ | 707 | 34.6% |
Family Income by Famaliy Size in Ancient Oaks
5-person families (280 | 13.7%) account for the highest median family income in Ancient Oaks with $206,932 per family, while 4-person families (378 | 18.5%) have the highest median income of $49,531 per family member.
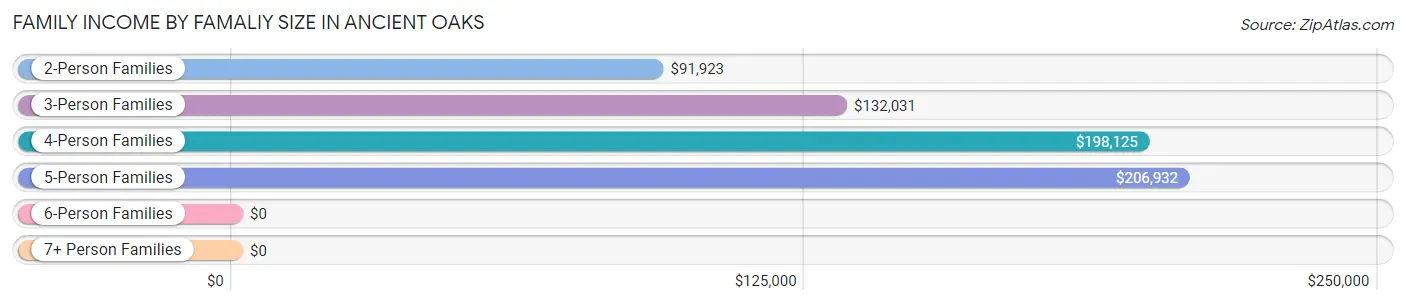
| Income Bracket | # Families | Median Income |
| 2-Person Families | 922 (45.1%) | $91,923 |
| 3-Person Families | 347 (17.0%) | $132,031 |
| 4-Person Families | 378 (18.5%) | $198,125 |
| 5-Person Families | 280 (13.7%) | $206,932 |
| 6-Person Families | 53 (2.6%) | $0 |
| 7+ Person Families | 64 (3.1%) | $0 |
| Total | 2,044 (100.0%) | $139,118 |
Family Income by Number of Earners in Ancient Oaks
The median family income in Ancient Oaks is $139,118, with families comprising 3+ earners (232) having the highest median family income of $224,583, while families with no earners (231) have the lowest median family income of $68,750, accounting for 11.4% and 11.3% of families, respectively.
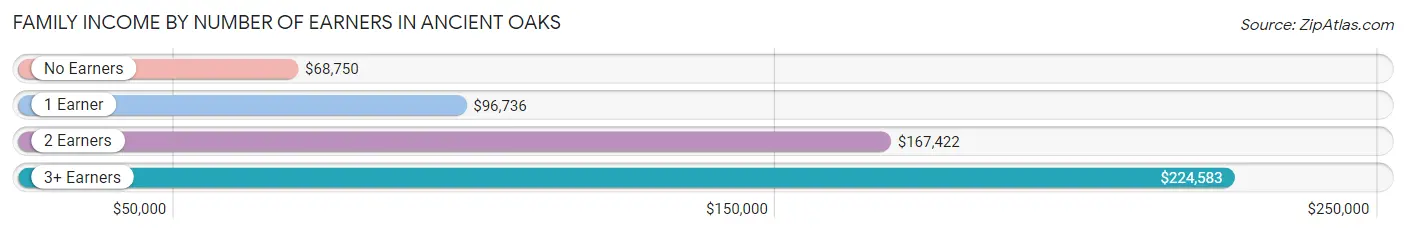
| Number of Earners | # Families | Median Income |
| No Earners | 231 (11.3%) | $68,750 |
| 1 Earner | 522 (25.5%) | $96,736 |
| 2 Earners | 1,059 (51.8%) | $167,422 |
| 3+ Earners | 232 (11.4%) | $224,583 |
| Total | 2,044 (100.0%) | $139,118 |
Household Income in Ancient Oaks
Household Income Brackets in Ancient Oaks
With 779 households falling in the category, the $200,000+ income range is the most frequent in Ancient Oaks, accounting for 31.1% of all households.
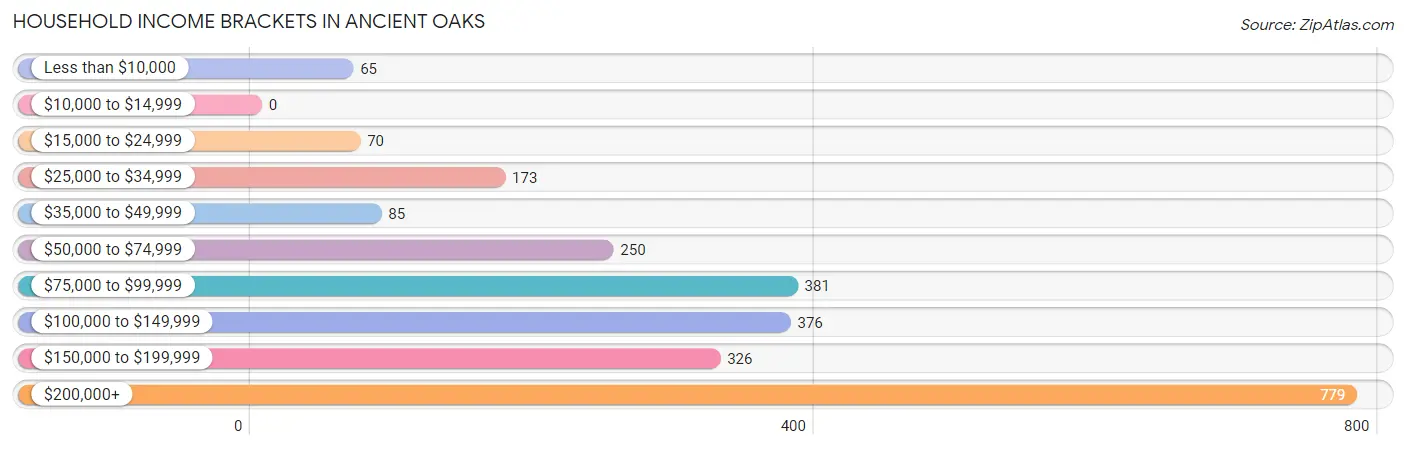
| Income Bracket | # Households | % Households |
| Less than $10,000 | 65 | 2.6% |
| $10,000 to $14,999 | 0 | 0.0% |
| $15,000 to $24,999 | 70 | 2.8% |
| $25,000 to $34,999 | 173 | 6.9% |
| $35,000 to $49,999 | 85 | 3.4% |
| $50,000 to $74,999 | 250 | 10.0% |
| $75,000 to $99,999 | 381 | 15.2% |
| $100,000 to $149,999 | 376 | 15.0% |
| $150,000 to $199,999 | 326 | 13.0% |
| $200,000+ | 779 | 31.1% |
Household Income by Householder Age in Ancient Oaks
The median household income in Ancient Oaks is $121,181, with the highest median household income of $153,229 found in the 45 to 64 years age bracket for the primary householder. A total of 1,139 households (45.5%) fall into this category.
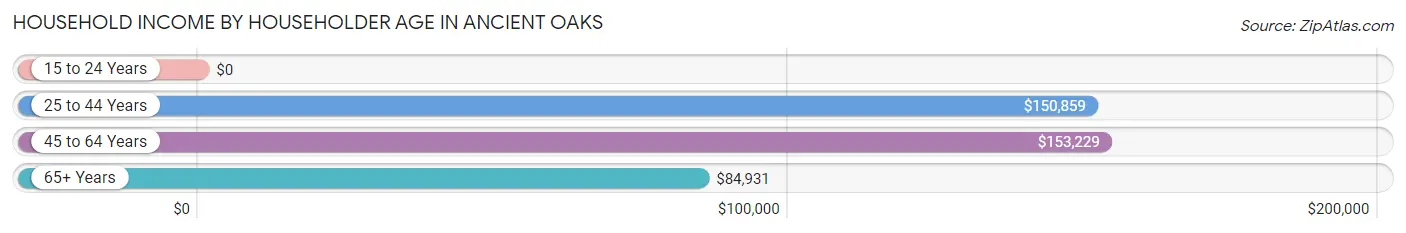
| Income Bracket | # Households | Median Income |
| 15 to 24 Years | 0 (0.0%) | $0 |
| 25 to 44 Years | 665 (26.6%) | $150,859 |
| 45 to 64 Years | 1,139 (45.5%) | $153,229 |
| 65+ Years | 701 (28.0%) | $84,931 |
| Total | 2,505 (100.0%) | $121,181 |
Poverty in Ancient Oaks
Income Below Poverty by Sex and Age in Ancient Oaks
With 0.8% poverty level for males and 2.1% for females among the residents of Ancient Oaks, 25 to 34 year old males and 75 year old and over females are the most vulnerable to poverty, with 19 males (12.8%) and 24 females (11.1%) in their respective age groups living below the poverty level.
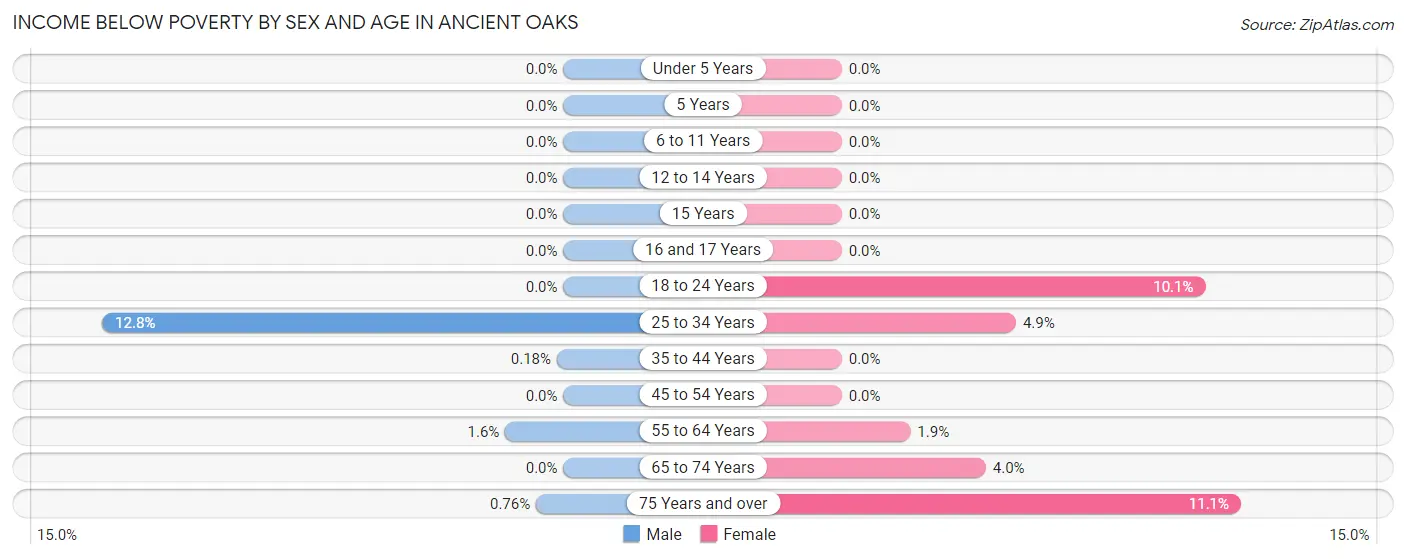
| Age Bracket | Male | Female |
| Under 5 Years | 0 (0.0%) | 0 (0.0%) |
| 5 Years | 0 (0.0%) | 0 (0.0%) |
| 6 to 11 Years | 0 (0.0%) | 0 (0.0%) |
| 12 to 14 Years | 0 (0.0%) | 0 (0.0%) |
| 15 Years | 0 (0.0%) | 0 (0.0%) |
| 16 and 17 Years | 0 (0.0%) | 0 (0.0%) |
| 18 to 24 Years | 0 (0.0%) | 17 (10.1%) |
| 25 to 34 Years | 19 (12.8%) | 13 (4.9%) |
| 35 to 44 Years | 1 (0.2%) | 0 (0.0%) |
| 45 to 54 Years | 0 (0.0%) | 0 (0.0%) |
| 55 to 64 Years | 8 (1.6%) | 7 (1.9%) |
| 65 to 74 Years | 0 (0.0%) | 17 (4.0%) |
| 75 Years and over | 1 (0.8%) | 24 (11.1%) |
| Total | 29 (0.8%) | 78 (2.1%) |
Income Above Poverty by Sex and Age in Ancient Oaks
According to the poverty statistics in Ancient Oaks, males aged under 5 years and females aged under 5 years are the age groups that are most secure financially, with 100.0% of males and 100.0% of females in these age groups living above the poverty line.
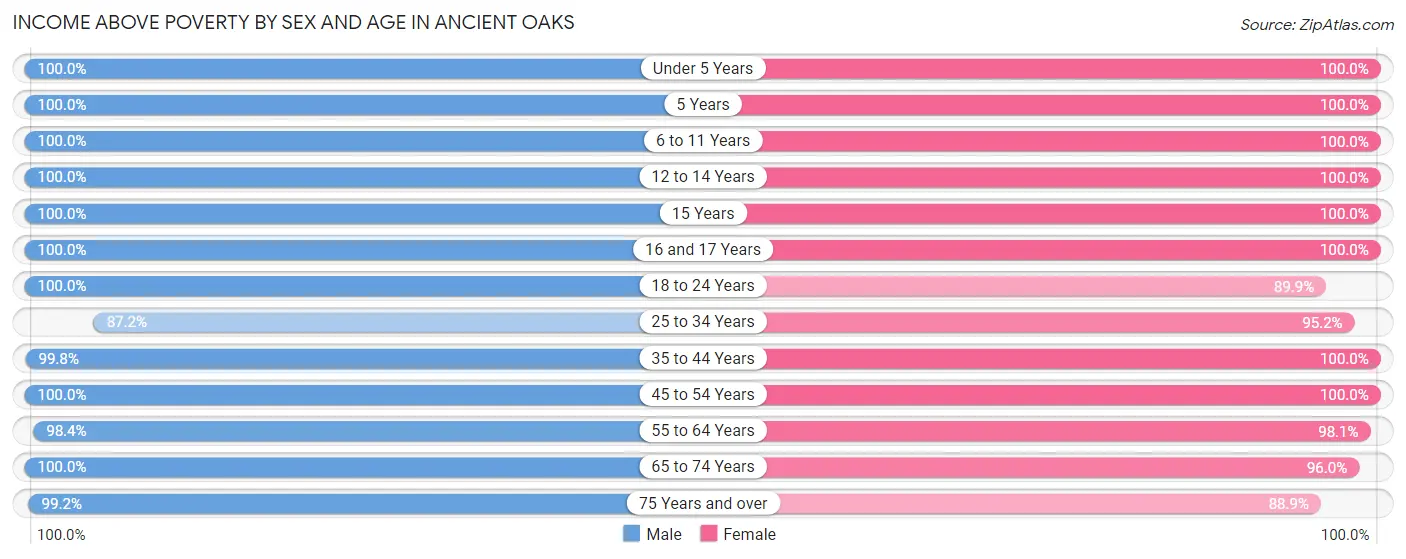
| Age Bracket | Male | Female |
| Under 5 Years | 104 (100.0%) | 178 (100.0%) |
| 5 Years | 94 (100.0%) | 106 (100.0%) |
| 6 to 11 Years | 405 (100.0%) | 572 (100.0%) |
| 12 to 14 Years | 196 (100.0%) | 238 (100.0%) |
| 15 Years | 78 (100.0%) | 30 (100.0%) |
| 16 and 17 Years | 158 (100.0%) | 34 (100.0%) |
| 18 to 24 Years | 213 (100.0%) | 151 (89.9%) |
| 25 to 34 Years | 129 (87.2%) | 255 (95.2%) |
| 35 to 44 Years | 558 (99.8%) | 666 (100.0%) |
| 45 to 54 Years | 518 (100.0%) | 545 (100.0%) |
| 55 to 64 Years | 487 (98.4%) | 359 (98.1%) |
| 65 to 74 Years | 412 (100.0%) | 407 (96.0%) |
| 75 Years and over | 130 (99.2%) | 192 (88.9%) |
| Total | 3,482 (99.2%) | 3,733 (98.0%) |
Income Below Poverty Among Married-Couple Families in Ancient Oaks
The poverty statistics for married-couple families in Ancient Oaks show that 1.3% or 23 of the total 1,796 families live below the poverty line. Families with no children have the highest poverty rate of 2.6%, comprising of 23 families. On the other hand, families with 1 or 2 children have the lowest poverty rate of 0.0%, which includes 0 families.
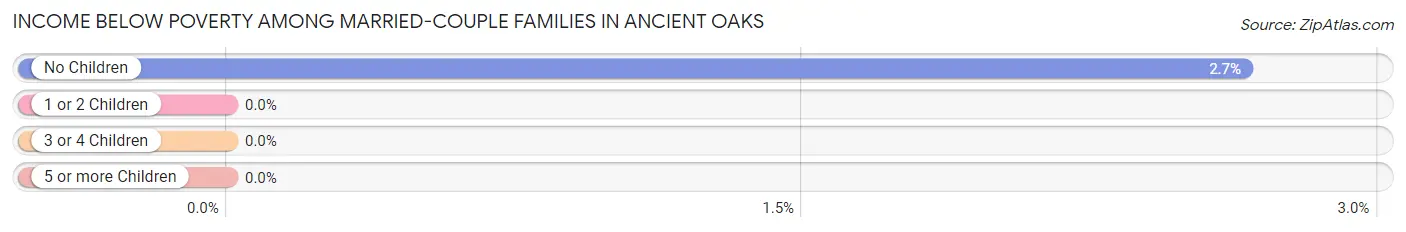
| Children | Above Poverty | Below Poverty |
| No Children | 845 (97.4%) | 23 (2.6%) |
| 1 or 2 Children | 619 (100.0%) | 0 (0.0%) |
| 3 or 4 Children | 309 (100.0%) | 0 (0.0%) |
| 5 or more Children | 0 (0.0%) | 0 (0.0%) |
| Total | 1,773 (98.7%) | 23 (1.3%) |
Income Below Poverty Among Single-Parent Households in Ancient Oaks
| Children | Single Father | Single Mother |
| No Children | 0 (0.0%) | 0 (0.0%) |
| 1 or 2 Children | 0 (0.0%) | 0 (0.0%) |
| 3 or 4 Children | 0 (0.0%) | 0 (0.0%) |
| 5 or more Children | 0 (0.0%) | 0 (0.0%) |
| Total | 0 (0.0%) | 0 (0.0%) |
Income Below Poverty Among Married-Couple vs Single-Parent Households in Ancient Oaks
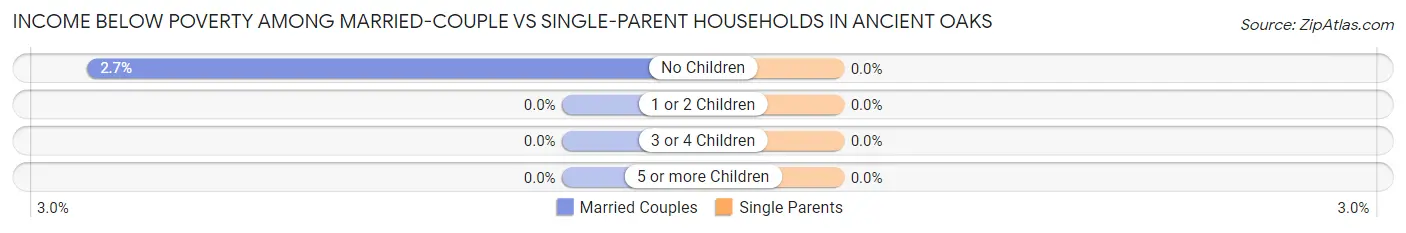
| Children | Married-Couple Families | Single-Parent Households |
| No Children | 23 (2.6%) | 0 (0.0%) |
| 1 or 2 Children | 0 (0.0%) | 0 (0.0%) |
| 3 or 4 Children | 0 (0.0%) | 0 (0.0%) |
| 5 or more Children | 0 (0.0%) | 0 (0.0%) |
| Total | 23 (1.3%) | 0 (0.0%) |
Race in Ancient Oaks
The most populous races in Ancient Oaks are White / Caucasian (6,046 | 82.1%), Asian (633 | 8.6%), and Two or more Races (487 | 6.6%).
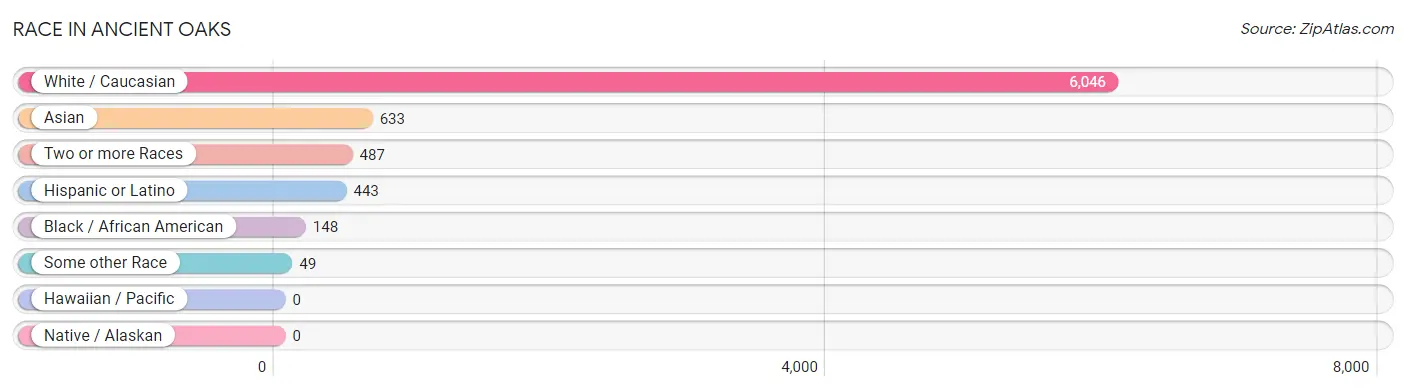
| Race | # Population | % Population |
| Asian | 633 | 8.6% |
| Black / African American | 148 | 2.0% |
| Hawaiian / Pacific | 0 | 0.0% |
| Hispanic or Latino | 443 | 6.0% |
| Native / Alaskan | 0 | 0.0% |
| White / Caucasian | 6,046 | 82.1% |
| Two or more Races | 487 | 6.6% |
| Some other Race | 49 | 0.7% |
| Total | 7,363 | 100.0% |
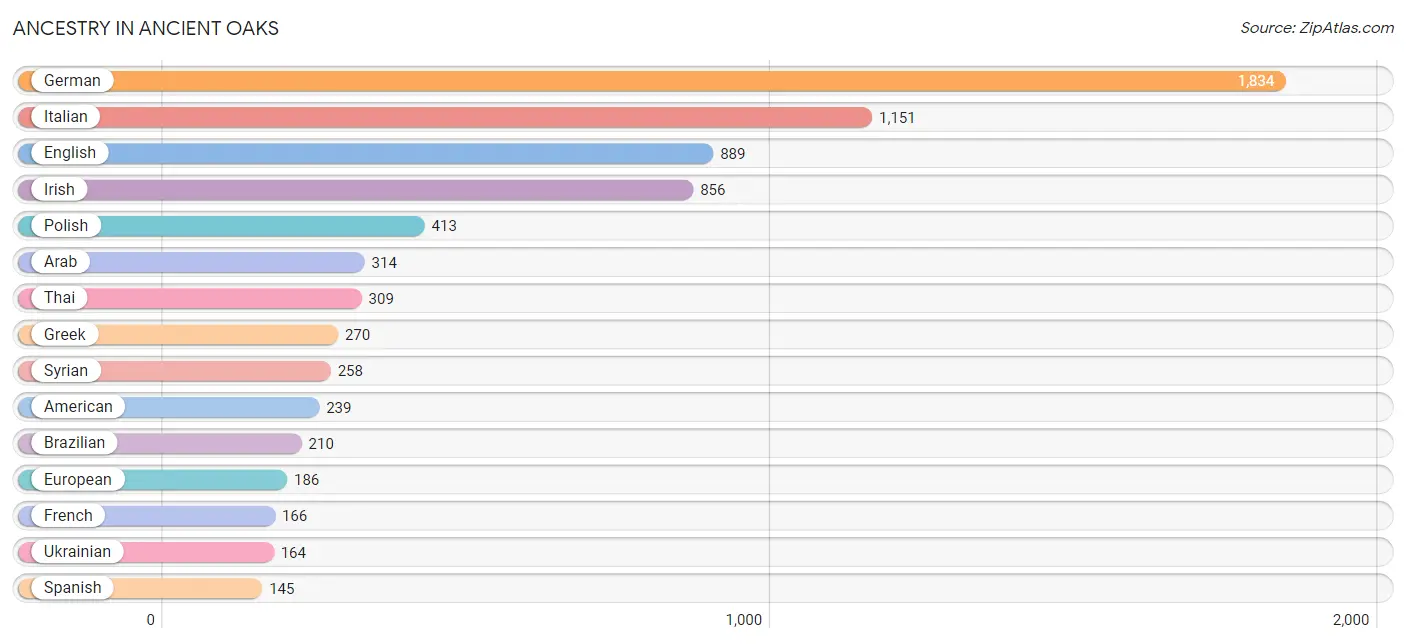
Ancestry in Ancient Oaks
The most populous ancestries reported in Ancient Oaks are German (1,834 | 24.9%), Italian (1,151 | 15.6%), English (889 | 12.1%), Irish (856 | 11.6%), and Polish (413 | 5.6%), together accounting for 69.9% of all Ancient Oaks residents.
| Ancestry | # Population | % Population |
| African | 32 | 0.4% |
| American | 239 | 3.3% |
| Arab | 314 | 4.3% |
| Argentinean | 36 | 0.5% |
| Austrian | 7 | 0.1% |
| Brazilian | 210 | 2.9% |
| Burmese | 6 | 0.1% |
| Colombian | 26 | 0.4% |
| Cuban | 11 | 0.2% |
| Czech | 9 | 0.1% |
| Danish | 13 | 0.2% |
| Dutch | 60 | 0.8% |
| Eastern European | 122 | 1.7% |
| English | 889 | 12.1% |
| European | 186 | 2.5% |
| Finnish | 16 | 0.2% |
| French | 166 | 2.2% |
| German | 1,834 | 24.9% |
| Greek | 270 | 3.7% |
| Hungarian | 18 | 0.2% |
| Indian (Asian) | 113 | 1.5% |
| Iraqi | 17 | 0.2% |
| Irish | 856 | 11.6% |
| Italian | 1,151 | 15.6% |
| Korean | 84 | 1.1% |
| Lithuanian | 9 | 0.1% |
| Mexican | 125 | 1.7% |
| Norwegian | 57 | 0.8% |
| Pennsylvania German | 119 | 1.6% |
| Polish | 413 | 5.6% |
| Portuguese | 13 | 0.2% |
| Puerto Rican | 100 | 1.4% |
| Russian | 40 | 0.5% |
| Scottish | 114 | 1.5% |
| Slavic | 25 | 0.3% |
| Slovak | 54 | 0.7% |
| Slovene | 7 | 0.1% |
| South American | 62 | 0.8% |
| Spanish | 145 | 2.0% |
| Subsaharan African | 32 | 0.4% |
| Swedish | 16 | 0.2% |
| Syrian | 258 | 3.5% |
| Thai | 309 | 4.2% |
| Ukrainian | 164 | 2.2% |
| Welsh | 64 | 0.9% |
| Yugoslavian | 8 | 0.1% | View All 46 Rows |
Immigrants in Ancient Oaks
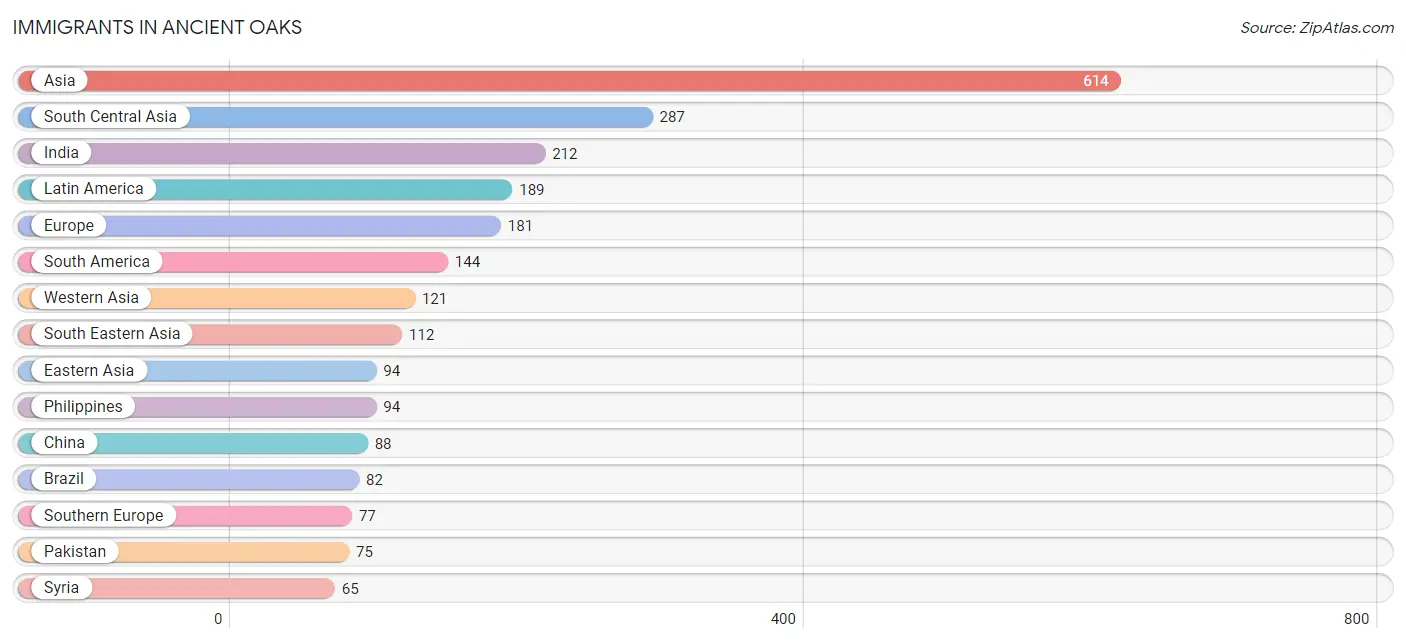
The most numerous immigrant groups reported in Ancient Oaks came from Asia (614 | 8.3%), South Central Asia (287 | 3.9%), India (212 | 2.9%), Latin America (189 | 2.6%), and Europe (181 | 2.5%), together accounting for 20.2% of all Ancient Oaks residents.
| Immigration Origin | # Population | % Population |
| Africa | 6 | 0.1% |
| Argentina | 36 | 0.5% |
| Asia | 614 | 8.3% |
| Brazil | 82 | 1.1% |
| Canada | 46 | 0.6% |
| Central America | 45 | 0.6% |
| China | 88 | 1.2% |
| Colombia | 26 | 0.4% |
| Eastern Africa | 6 | 0.1% |
| Eastern Asia | 94 | 1.3% |
| Eastern Europe | 26 | 0.4% |
| England | 24 | 0.3% |
| Europe | 181 | 2.5% |
| Germany | 25 | 0.3% |
| Greece | 50 | 0.7% |
| India | 212 | 2.9% |
| Iraq | 34 | 0.5% |
| Italy | 27 | 0.4% |
| Korea | 6 | 0.1% |
| Latin America | 189 | 2.6% |
| Malaysia | 18 | 0.2% |
| Mexico | 45 | 0.6% |
| Northern Europe | 53 | 0.7% |
| Pakistan | 75 | 1.0% |
| Philippines | 94 | 1.3% |
| Poland | 26 | 0.4% |
| Saudi Arabia | 22 | 0.3% |
| South America | 144 | 2.0% |
| South Central Asia | 287 | 3.9% |
| South Eastern Asia | 112 | 1.5% |
| Southern Europe | 77 | 1.1% |
| Syria | 65 | 0.9% |
| Taiwan | 13 | 0.2% |
| Uganda | 6 | 0.1% |
| Western Asia | 121 | 1.6% |
| Western Europe | 25 | 0.3% | View All 36 Rows |
Sex and Age in Ancient Oaks
Sex and Age in Ancient Oaks
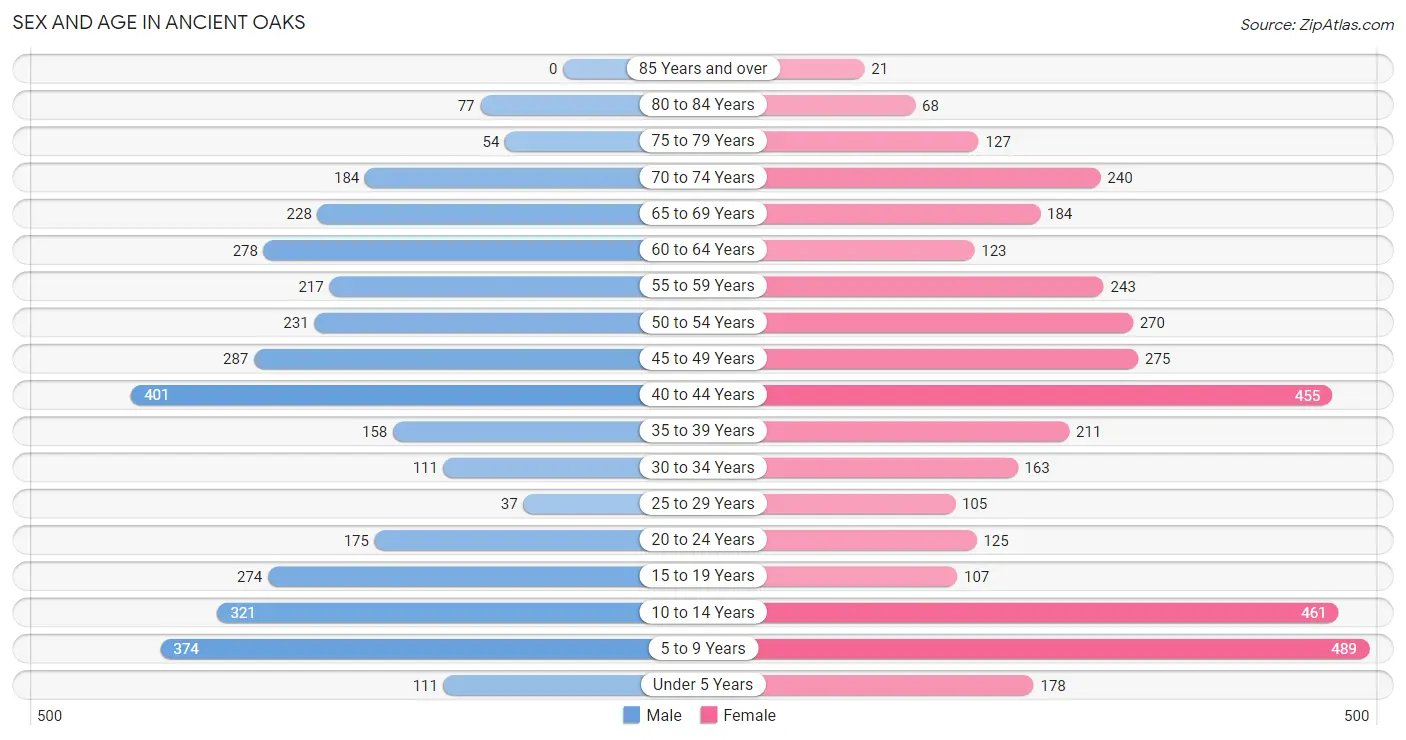
The most populous age groups in Ancient Oaks are 40 to 44 Years (401 | 11.4%) for men and 5 to 9 Years (489 | 12.7%) for women.
| Age Bracket | Male | Female |
| Under 5 Years | 111 (3.2%) | 178 (4.6%) |
| 5 to 9 Years | 374 (10.6%) | 489 (12.7%) |
| 10 to 14 Years | 321 (9.1%) | 461 (12.0%) |
| 15 to 19 Years | 274 (7.8%) | 107 (2.8%) |
| 20 to 24 Years | 175 (5.0%) | 125 (3.3%) |
| 25 to 29 Years | 37 (1.1%) | 105 (2.7%) |
| 30 to 34 Years | 111 (3.2%) | 163 (4.2%) |
| 35 to 39 Years | 158 (4.5%) | 211 (5.5%) |
| 40 to 44 Years | 401 (11.4%) | 455 (11.8%) |
| 45 to 49 Years | 287 (8.2%) | 275 (7.1%) |
| 50 to 54 Years | 231 (6.6%) | 270 (7.0%) |
| 55 to 59 Years | 217 (6.2%) | 243 (6.3%) |
| 60 to 64 Years | 278 (7.9%) | 123 (3.2%) |
| 65 to 69 Years | 228 (6.5%) | 184 (4.8%) |
| 70 to 74 Years | 184 (5.2%) | 240 (6.2%) |
| 75 to 79 Years | 54 (1.5%) | 127 (3.3%) |
| 80 to 84 Years | 77 (2.2%) | 68 (1.8%) |
| 85 Years and over | 0 (0.0%) | 21 (0.5%) |
| Total | 3,518 (100.0%) | 3,845 (100.0%) |
Families and Households in Ancient Oaks
Median Family Size in Ancient Oaks
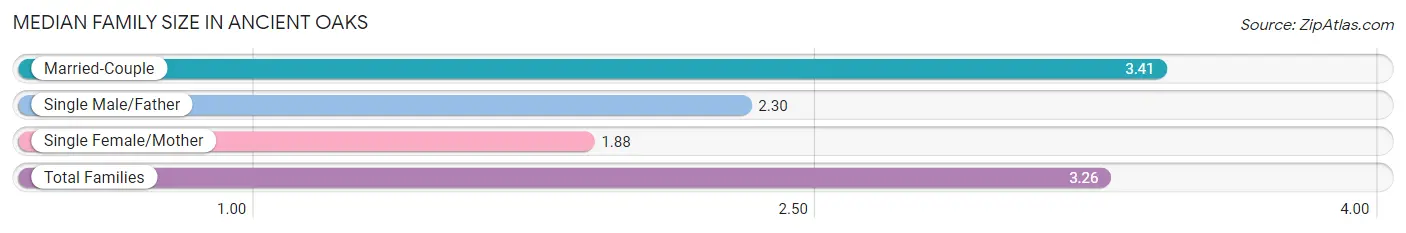
The median family size in Ancient Oaks is 3.26 persons per family, with married-couple families (1,796 | 87.9%) accounting for the largest median family size of 3.41 persons per family. On the other hand, single female/mother families (107 | 5.2%) represent the smallest median family size with 1.88 persons per family.
| Family Type | # Families | Family Size |
| Married-Couple | 1,796 (87.9%) | 3.41 |
| Single Male/Father | 141 (6.9%) | 2.30 |
| Single Female/Mother | 107 (5.2%) | 1.88 |
| Total Families | 2,044 (100.0%) | 3.26 |
Median Household Size in Ancient Oaks
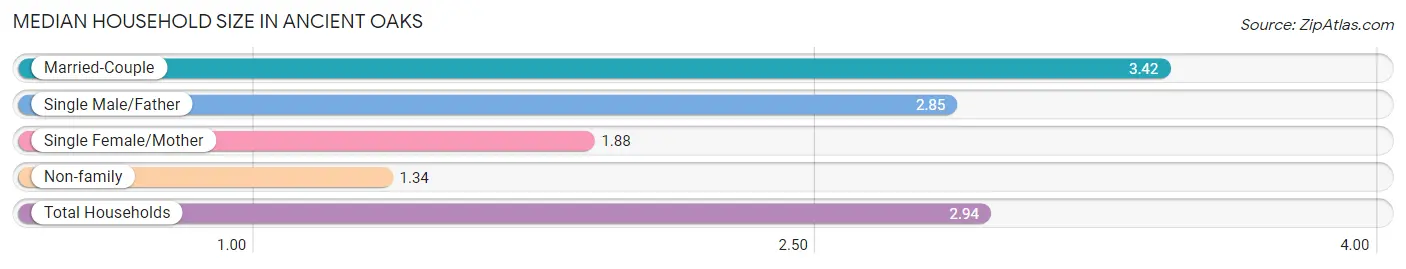
The median household size in Ancient Oaks is 2.94 persons per household, with married-couple households (1,796 | 71.7%) accounting for the largest median household size of 3.42 persons per household. non-family households (461 | 18.4%) represent the smallest median household size with 1.34 persons per household.
| Household Type | # Households | Household Size |
| Married-Couple | 1,796 (71.7%) | 3.42 |
| Single Male/Father | 141 (5.6%) | 2.85 |
| Single Female/Mother | 107 (4.3%) | 1.88 |
| Non-family | 461 (18.4%) | 1.34 |
| Total Households | 2,505 (100.0%) | 2.94 |
Household Size by Marriage Status in Ancient Oaks
Out of a total of 2,505 households in Ancient Oaks, 2,044 (81.6%) are family households, while 461 (18.4%) are nonfamily households. The most numerous type of family households are 2-person households, comprising 891, and the most common type of nonfamily households are 1-person households, comprising 380.
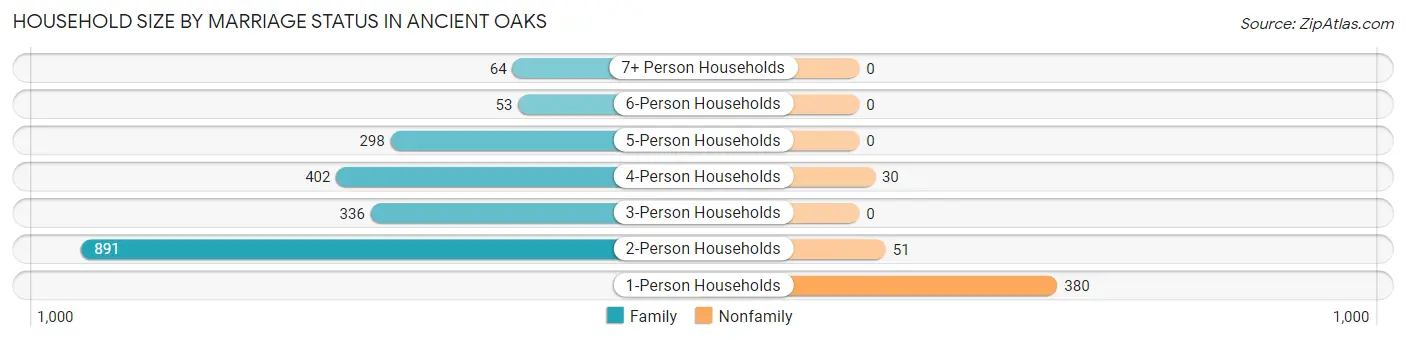
| Household Size | Family Households | Nonfamily Households |
| 1-Person Households | - | 380 (15.2%) |
| 2-Person Households | 891 (35.6%) | 51 (2.0%) |
| 3-Person Households | 336 (13.4%) | 0 (0.0%) |
| 4-Person Households | 402 (16.1%) | 30 (1.2%) |
| 5-Person Households | 298 (11.9%) | 0 (0.0%) |
| 6-Person Households | 53 (2.1%) | 0 (0.0%) |
| 7+ Person Households | 64 (2.5%) | 0 (0.0%) |
| Total | 2,044 (81.6%) | 461 (18.4%) |
Female Fertility in Ancient Oaks
Fertility by Age in Ancient Oaks
Average fertility rate in Ancient Oaks is 8.0 births per 1,000 women. Women in the age bracket of 20 to 34 years have the highest fertility rate with 33.0 births per 1,000 women. Women in the age bracket of 20 to 34 years acount for 100.0% of all women with births.
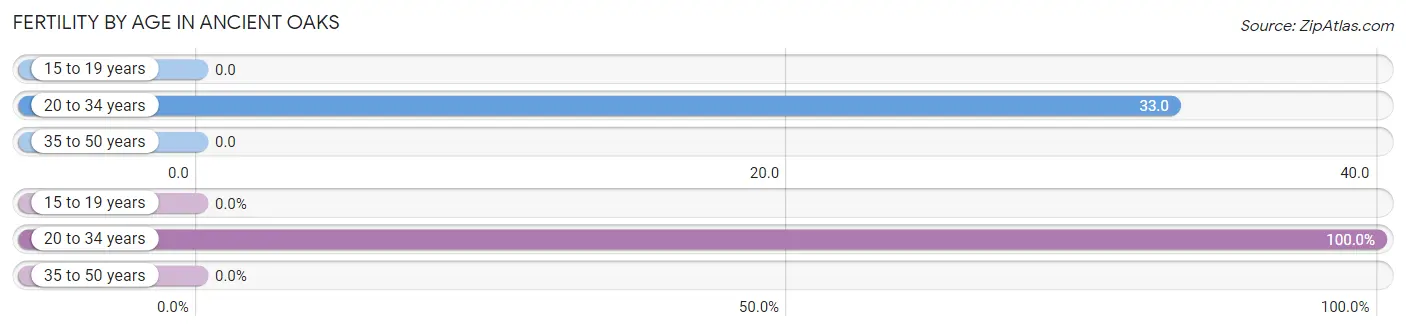
| Age Bracket | Women with Births | Births / 1,000 Women |
| 15 to 19 years | 0 (0.0%) | 0.0 |
| 20 to 34 years | 13 (100.0%) | 33.0 |
| 35 to 50 years | 0 (0.0%) | 0.0 |
| Total | 13 (100.0%) | 8.0 |
Fertility by Age by Marriage Status in Ancient Oaks
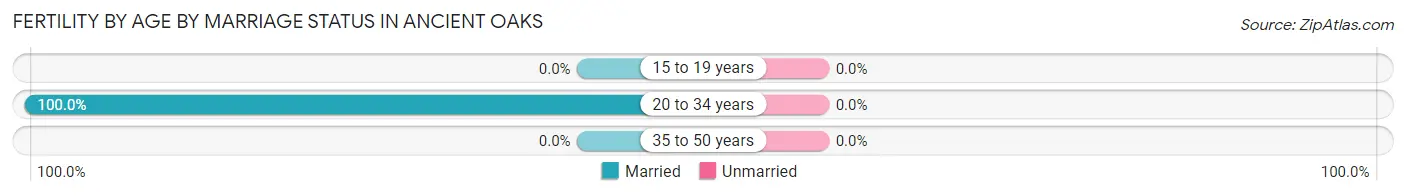
| Age Bracket | Married | Unmarried |
| 15 to 19 years | 0 (0.0%) | 0 (0.0%) |
| 20 to 34 years | 13 (100.0%) | 0 (0.0%) |
| 35 to 50 years | 0 (0.0%) | 0 (0.0%) |
| Total | 13 (100.0%) | 0 (0.0%) |
Fertility by Education in Ancient Oaks
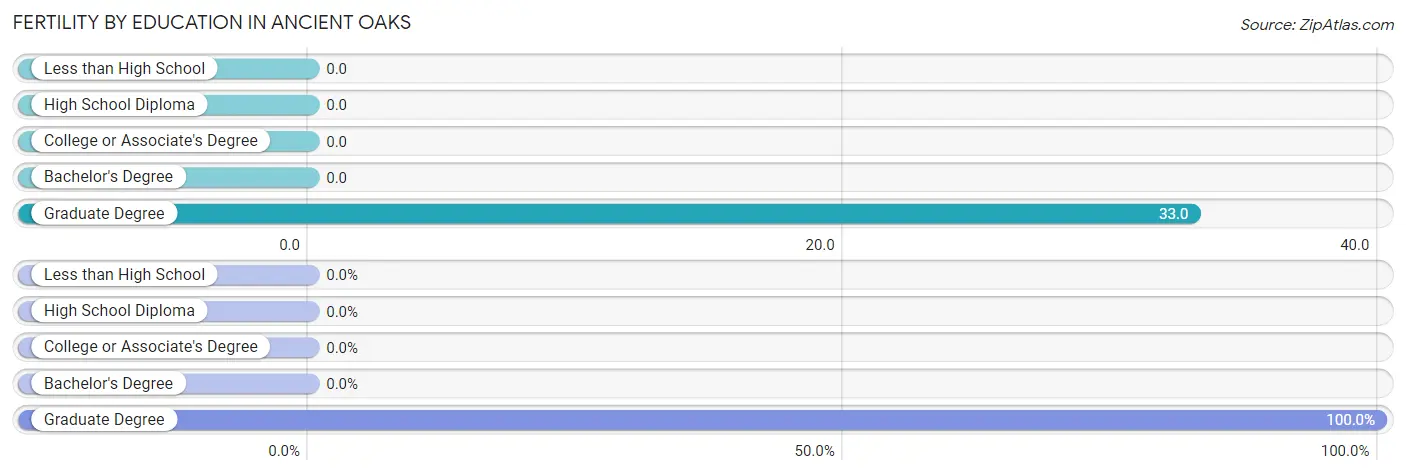
| Educational Attainment | Women with Births | Births / 1,000 Women |
| Less than High School | 0 (0.0%) | 0.0 |
| High School Diploma | 0 (0.0%) | 0.0 |
| College or Associate's Degree | 0 (0.0%) | 0.0 |
| Bachelor's Degree | 0 (0.0%) | 0.0 |
| Graduate Degree | 13 (100.0%) | 33.0 |
| Total | 13 (100.0%) | 8.0 |
Fertility by Education by Marriage Status in Ancient Oaks
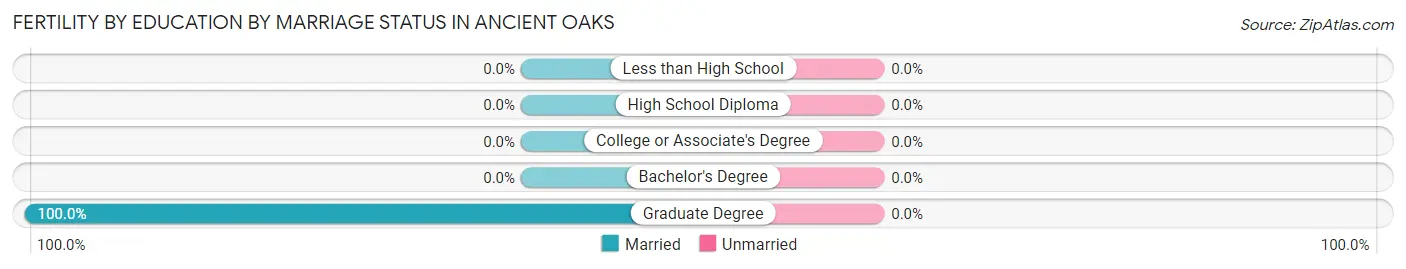
| Educational Attainment | Married | Unmarried |
| Less than High School | 0 (0.0%) | 0 (0.0%) |
| High School Diploma | 0 (0.0%) | 0 (0.0%) |
| College or Associate's Degree | 0 (0.0%) | 0 (0.0%) |
| Bachelor's Degree | 0 (0.0%) | 0 (0.0%) |
| Graduate Degree | 13 (100.0%) | 0 (0.0%) |
| Total | 13 (100.0%) | 0 (0.0%) |
Employment Characteristics in Ancient Oaks
Employment by Class of Employer in Ancient Oaks
Among the 3,600 employed individuals in Ancient Oaks, private company employees (2,611 | 72.5%), not-for-profit organizations (435 | 12.1%), and local government employees (195 | 5.4%) make up the most common classes of employment.
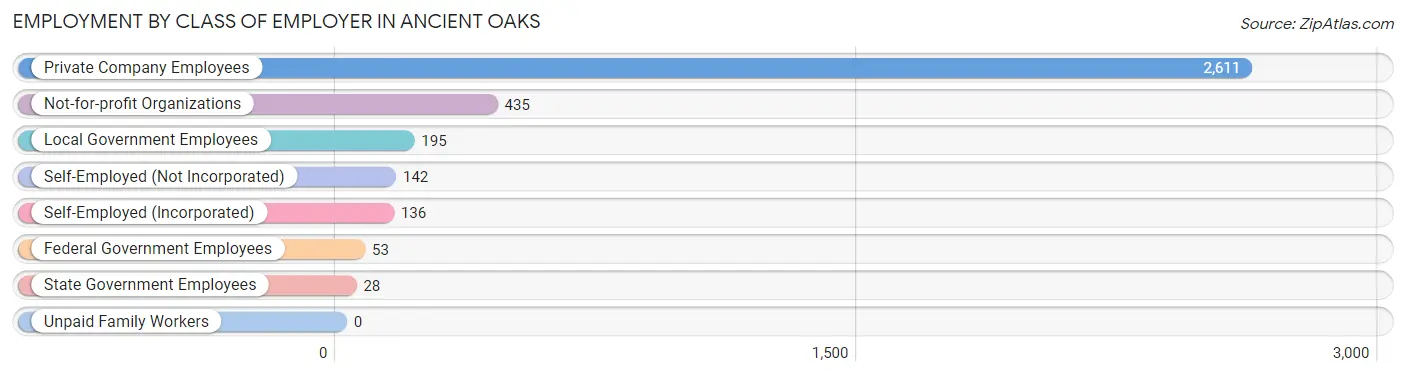
| Employer Class | # Employees | % Employees |
| Private Company Employees | 2,611 | 72.5% |
| Self-Employed (Incorporated) | 136 | 3.8% |
| Self-Employed (Not Incorporated) | 142 | 3.9% |
| Not-for-profit Organizations | 435 | 12.1% |
| Local Government Employees | 195 | 5.4% |
| State Government Employees | 28 | 0.8% |
| Federal Government Employees | 53 | 1.5% |
| Unpaid Family Workers | 0 | 0.0% |
| Total | 3,600 | 100.0% |
Employment Status by Age in Ancient Oaks
According to the labor force statistics for Ancient Oaks, out of the total population over 16 years of age (5,321), 70.2% or 3,735 individuals are in the labor force, with 2.1% or 78 of them unemployed. The age group with the highest labor force participation rate is 45 to 54 years, with 95.3% or 1,013 individuals in the labor force. Within the labor force, the 55 to 59 years age range has the highest percentage of unemployed individuals, with 12.8% or 47 of them being unemployed.
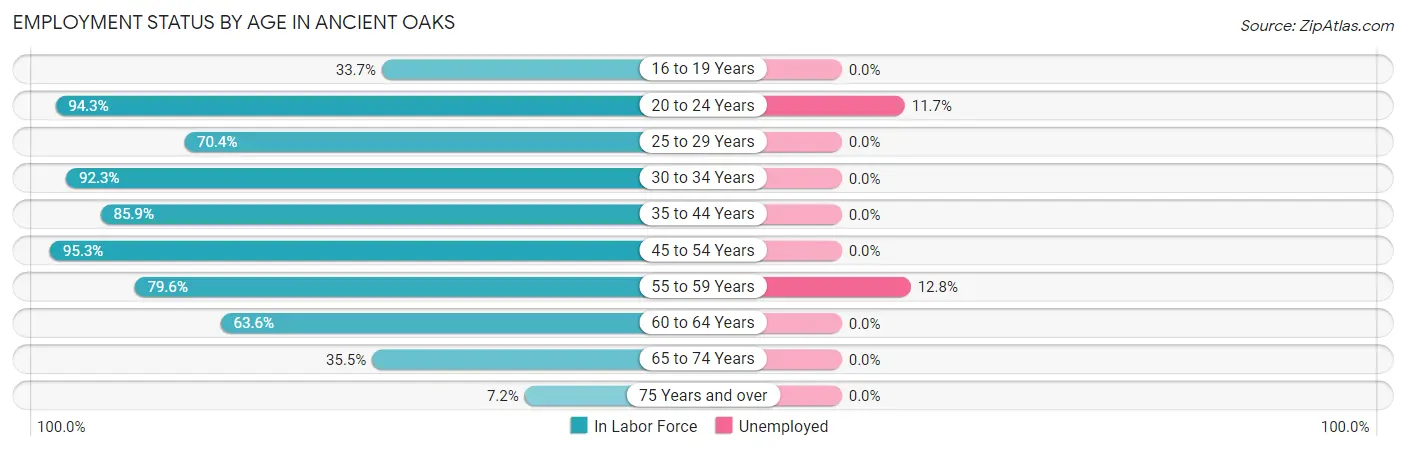
| Age Bracket | In Labor Force | Unemployed |
| 16 to 19 Years | 92 (33.7%) | 0 (0.0%) |
| 20 to 24 Years | 283 (94.3%) | 33 (11.7%) |
| 25 to 29 Years | 100 (70.4%) | 0 (0.0%) |
| 30 to 34 Years | 253 (92.3%) | 0 (0.0%) |
| 35 to 44 Years | 1,052 (85.9%) | 0 (0.0%) |
| 45 to 54 Years | 1,013 (95.3%) | 0 (0.0%) |
| 55 to 59 Years | 366 (79.6%) | 47 (12.8%) |
| 60 to 64 Years | 255 (63.6%) | 0 (0.0%) |
| 65 to 74 Years | 297 (35.5%) | 0 (0.0%) |
| 75 Years and over | 25 (7.2%) | 0 (0.0%) |
| Total | 3,735 (70.2%) | 78 (2.1%) |
Employment Status by Educational Attainment in Ancient Oaks
According to labor force statistics for Ancient Oaks, 85.2% of individuals (3,037) out of the total population between 25 and 64 years of age (3,565) are in the labor force, with 1.5% or 46 of them being unemployed. The group with the highest labor force participation rate are those with the educational attainment of high school diploma, with 93.4% or 451 individuals in the labor force. Within the labor force, individuals with high school diploma education have the highest percentage of unemployment, with 10.4% or 47 of them being unemployed.
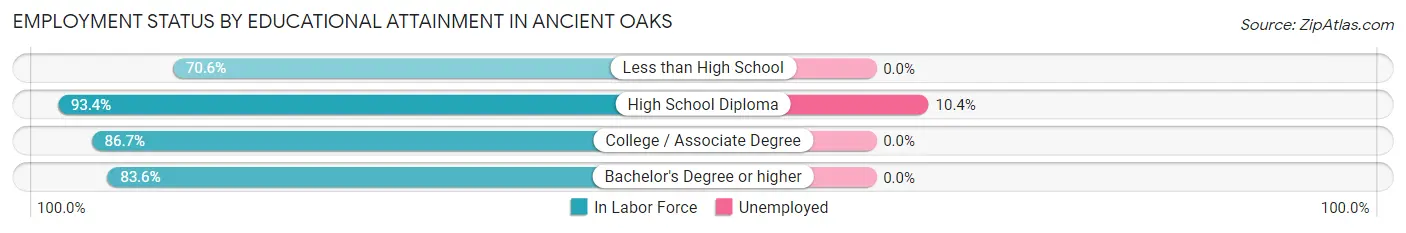
| Educational Attainment | In Labor Force | Unemployed |
| Less than High School | 72 (70.6%) | 0 (0.0%) |
| High School Diploma | 451 (93.4%) | 50 (10.4%) |
| College / Associate Degree | 709 (86.7%) | 0 (0.0%) |
| Bachelor's Degree or higher | 1,807 (83.6%) | 0 (0.0%) |
| Total | 3,037 (85.2%) | 53 (1.5%) |
Employment Occupations by Sex in Ancient Oaks
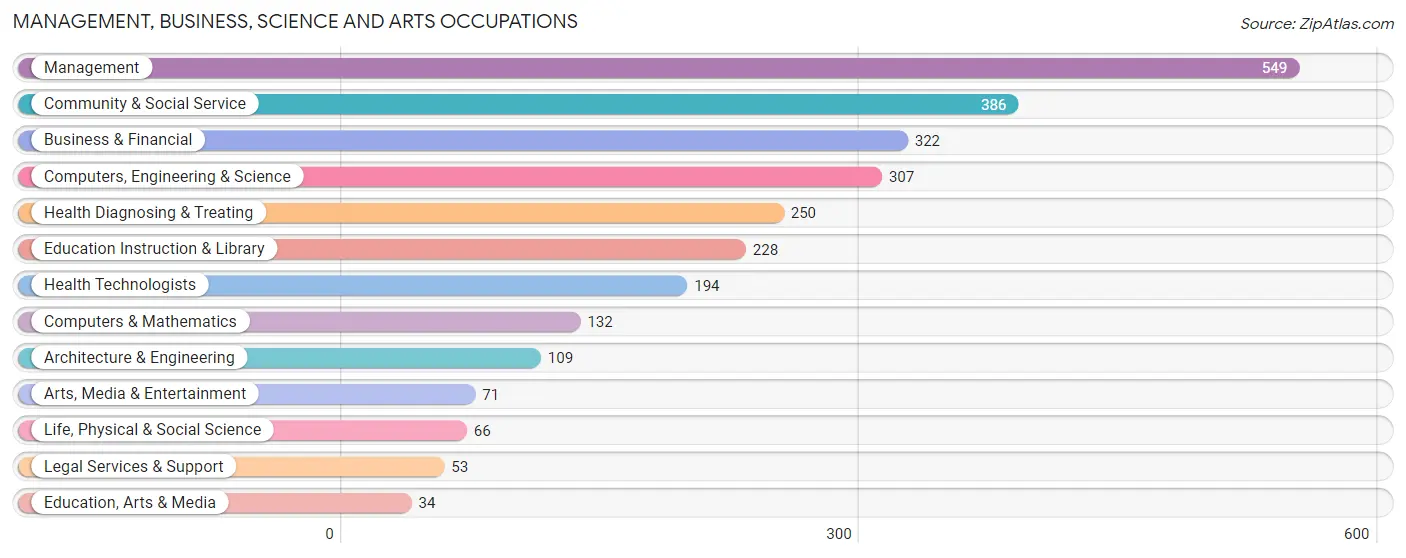
Management, Business, Science and Arts Occupations
The most common Management, Business, Science and Arts occupations in Ancient Oaks are Management (549 | 15.0%), Community & Social Service (386 | 10.6%), Business & Financial (322 | 8.8%), Computers, Engineering & Science (307 | 8.4%), and Health Diagnosing & Treating (250 | 6.8%).
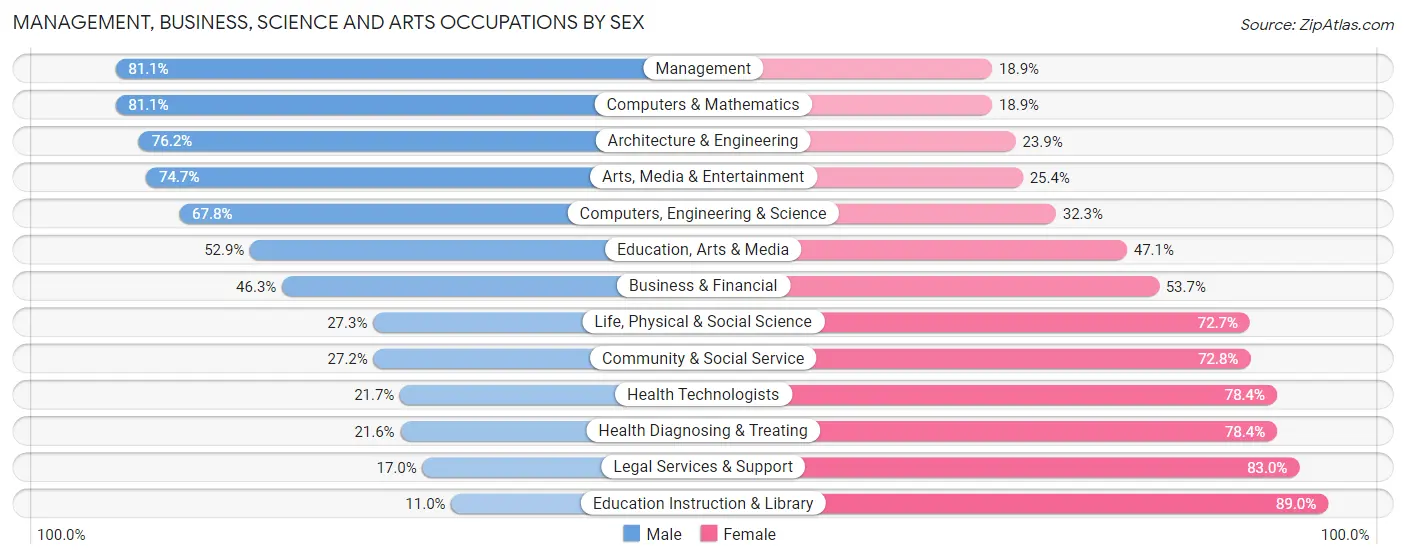
Management, Business, Science and Arts Occupations by Sex
Within the Management, Business, Science and Arts occupations in Ancient Oaks, the most male-oriented occupations are Management (81.1%), Computers & Mathematics (81.1%), and Architecture & Engineering (76.1%), while the most female-oriented occupations are Education Instruction & Library (89.0%), Legal Services & Support (83.0%), and Health Diagnosing & Treating (78.4%).
| Occupation | Male | Female |
| Management | 445 (81.1%) | 104 (18.9%) |
| Business & Financial | 149 (46.3%) | 173 (53.7%) |
| Computers, Engineering & Science | 208 (67.7%) | 99 (32.3%) |
| Computers & Mathematics | 107 (81.1%) | 25 (18.9%) |
| Architecture & Engineering | 83 (76.1%) | 26 (23.8%) |
| Life, Physical & Social Science | 18 (27.3%) | 48 (72.7%) |
| Community & Social Service | 105 (27.2%) | 281 (72.8%) |
| Education, Arts & Media | 18 (52.9%) | 16 (47.1%) |
| Legal Services & Support | 9 (17.0%) | 44 (83.0%) |
| Education Instruction & Library | 25 (11.0%) | 203 (89.0%) |
| Arts, Media & Entertainment | 53 (74.7%) | 18 (25.4%) |
| Health Diagnosing & Treating | 54 (21.6%) | 196 (78.4%) |
| Health Technologists | 42 (21.6%) | 152 (78.3%) |
| Total (Category) | 961 (53.0%) | 853 (47.0%) |
| Total (Overall) | 2,056 (56.2%) | 1,600 (43.8%) |
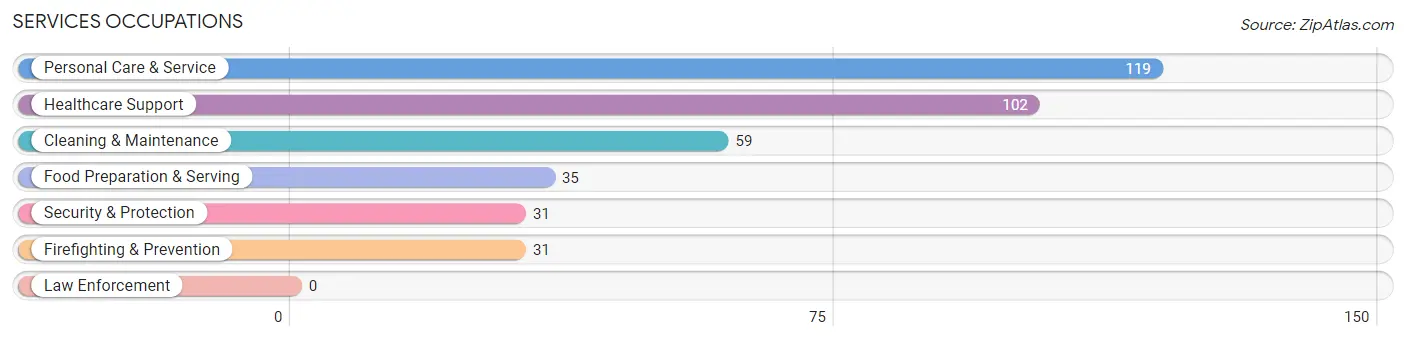
Services Occupations
The most common Services occupations in Ancient Oaks are Personal Care & Service (119 | 3.3%), Healthcare Support (102 | 2.8%), Cleaning & Maintenance (59 | 1.6%), Food Preparation & Serving (35 | 1.0%), and Security & Protection (31 | 0.9%).
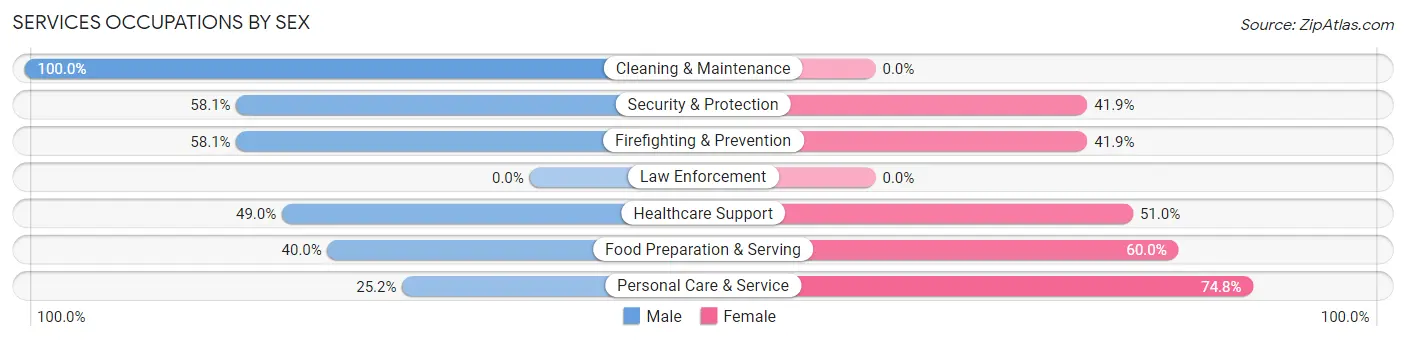
Services Occupations by Sex
Within the Services occupations in Ancient Oaks, the most male-oriented occupations are Cleaning & Maintenance (100.0%), Security & Protection (58.1%), and Firefighting & Prevention (58.1%), while the most female-oriented occupations are Personal Care & Service (74.8%), Food Preparation & Serving (60.0%), and Healthcare Support (51.0%).
| Occupation | Male | Female |
| Healthcare Support | 50 (49.0%) | 52 (51.0%) |
| Security & Protection | 18 (58.1%) | 13 (41.9%) |
| Firefighting & Prevention | 18 (58.1%) | 13 (41.9%) |
| Law Enforcement | 0 (0.0%) | 0 (0.0%) |
| Food Preparation & Serving | 14 (40.0%) | 21 (60.0%) |
| Cleaning & Maintenance | 59 (100.0%) | 0 (0.0%) |
| Personal Care & Service | 30 (25.2%) | 89 (74.8%) |
| Total (Category) | 171 (49.4%) | 175 (50.6%) |
| Total (Overall) | 2,056 (56.2%) | 1,600 (43.8%) |
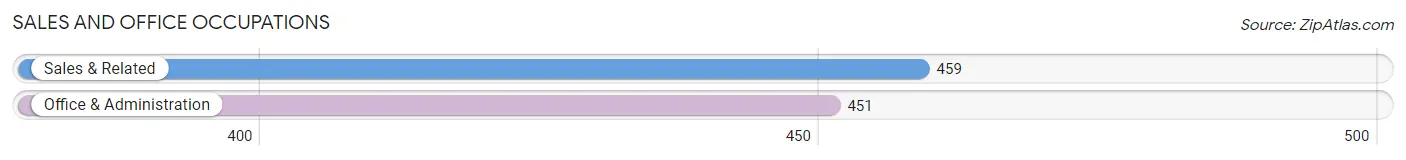
Sales and Office Occupations
The most common Sales and Office occupations in Ancient Oaks are Sales & Related (459 | 12.6%), and Office & Administration (451 | 12.3%).
Sales and Office Occupations by Sex
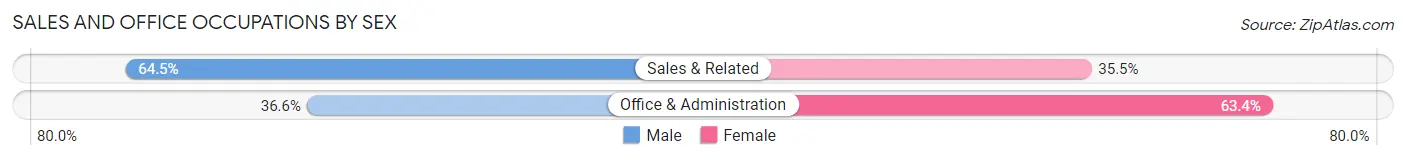
| Occupation | Male | Female |
| Sales & Related | 296 (64.5%) | 163 (35.5%) |
| Office & Administration | 165 (36.6%) | 286 (63.4%) |
| Total (Category) | 461 (50.7%) | 449 (49.3%) |
| Total (Overall) | 2,056 (56.2%) | 1,600 (43.8%) |
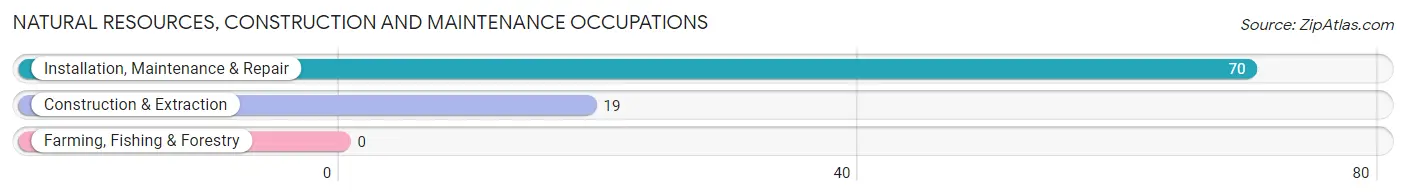
Natural Resources, Construction and Maintenance Occupations
The most common Natural Resources, Construction and Maintenance occupations in Ancient Oaks are Installation, Maintenance & Repair (70 | 1.9%), and Construction & Extraction (19 | 0.5%).
Natural Resources, Construction and Maintenance Occupations by Sex
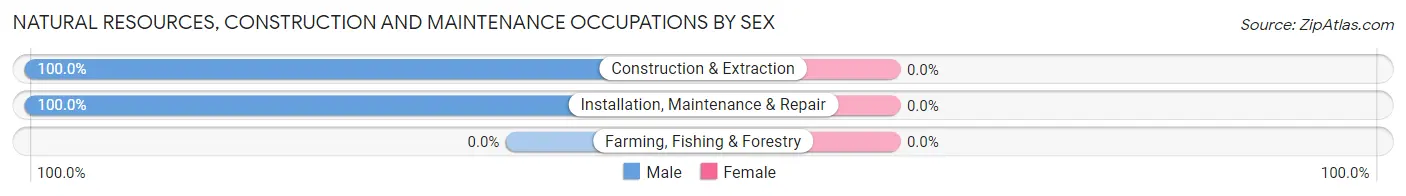
| Occupation | Male | Female |
| Farming, Fishing & Forestry | 0 (0.0%) | 0 (0.0%) |
| Construction & Extraction | 19 (100.0%) | 0 (0.0%) |
| Installation, Maintenance & Repair | 70 (100.0%) | 0 (0.0%) |
| Total (Category) | 89 (100.0%) | 0 (0.0%) |
| Total (Overall) | 2,056 (56.2%) | 1,600 (43.8%) |
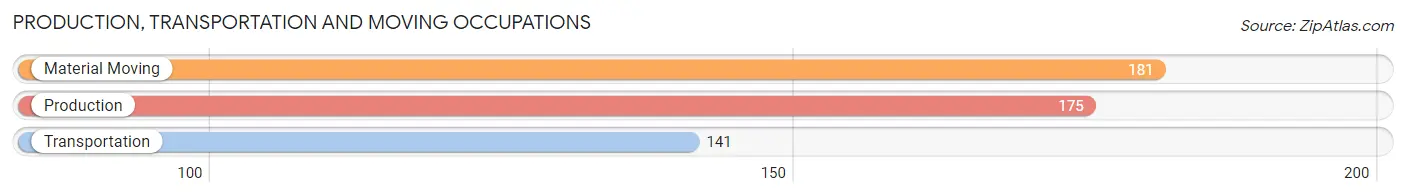
Production, Transportation and Moving Occupations
The most common Production, Transportation and Moving occupations in Ancient Oaks are Material Moving (181 | 5.0%), Production (175 | 4.8%), and Transportation (141 | 3.9%).
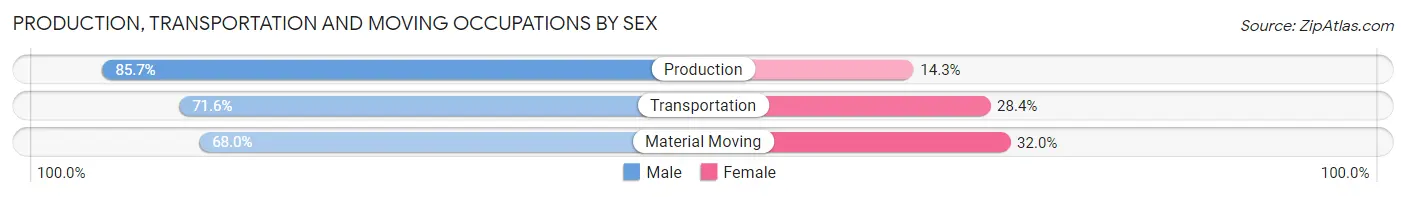
Production, Transportation and Moving Occupations by Sex
| Occupation | Male | Female |
| Production | 150 (85.7%) | 25 (14.3%) |
| Transportation | 101 (71.6%) | 40 (28.4%) |
| Material Moving | 123 (68.0%) | 58 (32.0%) |
| Total (Category) | 374 (75.2%) | 123 (24.7%) |
| Total (Overall) | 2,056 (56.2%) | 1,600 (43.8%) |
Employment Industries by Sex in Ancient Oaks
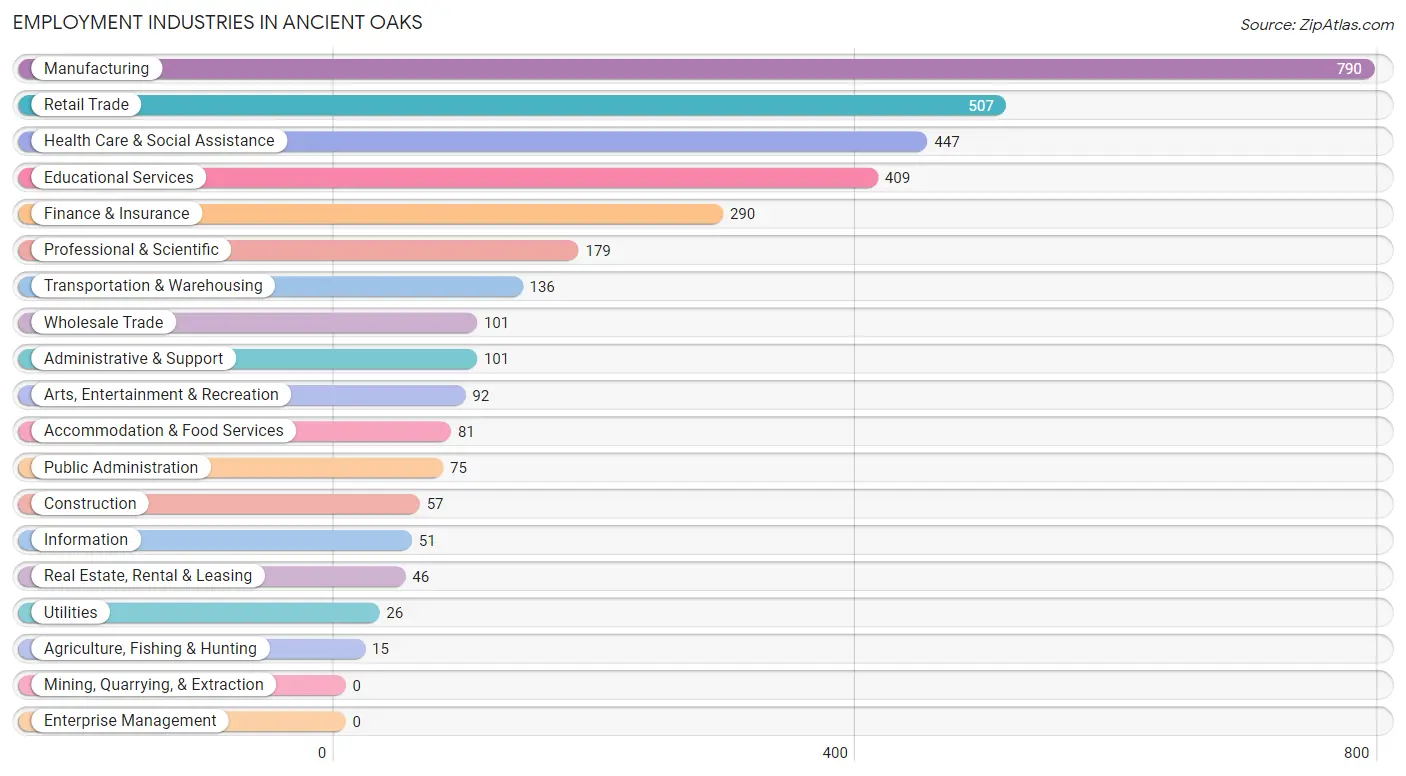
Employment Industries in Ancient Oaks
The major employment industries in Ancient Oaks include Manufacturing (790 | 21.6%), Retail Trade (507 | 13.9%), Health Care & Social Assistance (447 | 12.2%), Educational Services (409 | 11.2%), and Finance & Insurance (290 | 7.9%).
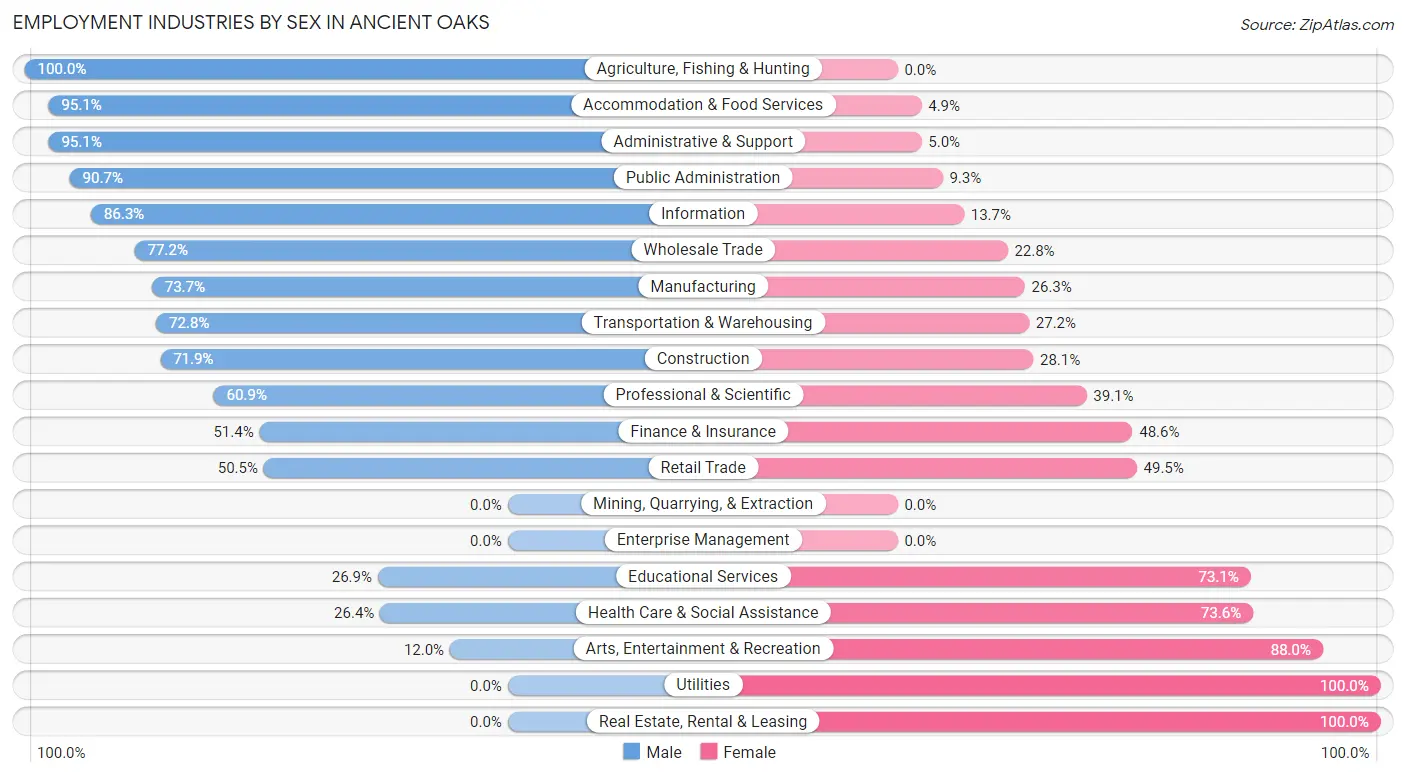
Employment Industries by Sex in Ancient Oaks
The Ancient Oaks industries that see more men than women are Agriculture, Fishing & Hunting (100.0%), Accommodation & Food Services (95.1%), and Administrative & Support (95.1%), whereas the industries that tend to have a higher number of women are Utilities (100.0%), Real Estate, Rental & Leasing (100.0%), and Arts, Entertainment & Recreation (88.0%).
| Industry | Male | Female |
| Agriculture, Fishing & Hunting | 15 (100.0%) | 0 (0.0%) |
| Mining, Quarrying, & Extraction | 0 (0.0%) | 0 (0.0%) |
| Construction | 41 (71.9%) | 16 (28.1%) |
| Manufacturing | 582 (73.7%) | 208 (26.3%) |
| Wholesale Trade | 78 (77.2%) | 23 (22.8%) |
| Retail Trade | 256 (50.5%) | 251 (49.5%) |
| Transportation & Warehousing | 99 (72.8%) | 37 (27.2%) |
| Utilities | 0 (0.0%) | 26 (100.0%) |
| Information | 44 (86.3%) | 7 (13.7%) |
| Finance & Insurance | 149 (51.4%) | 141 (48.6%) |
| Real Estate, Rental & Leasing | 0 (0.0%) | 46 (100.0%) |
| Professional & Scientific | 109 (60.9%) | 70 (39.1%) |
| Enterprise Management | 0 (0.0%) | 0 (0.0%) |
| Administrative & Support | 96 (95.1%) | 5 (5.0%) |
| Educational Services | 110 (26.9%) | 299 (73.1%) |
| Health Care & Social Assistance | 118 (26.4%) | 329 (73.6%) |
| Arts, Entertainment & Recreation | 11 (12.0%) | 81 (88.0%) |
| Accommodation & Food Services | 77 (95.1%) | 4 (4.9%) |
| Public Administration | 68 (90.7%) | 7 (9.3%) |
| Total | 2,056 (56.2%) | 1,600 (43.8%) |
Education in Ancient Oaks
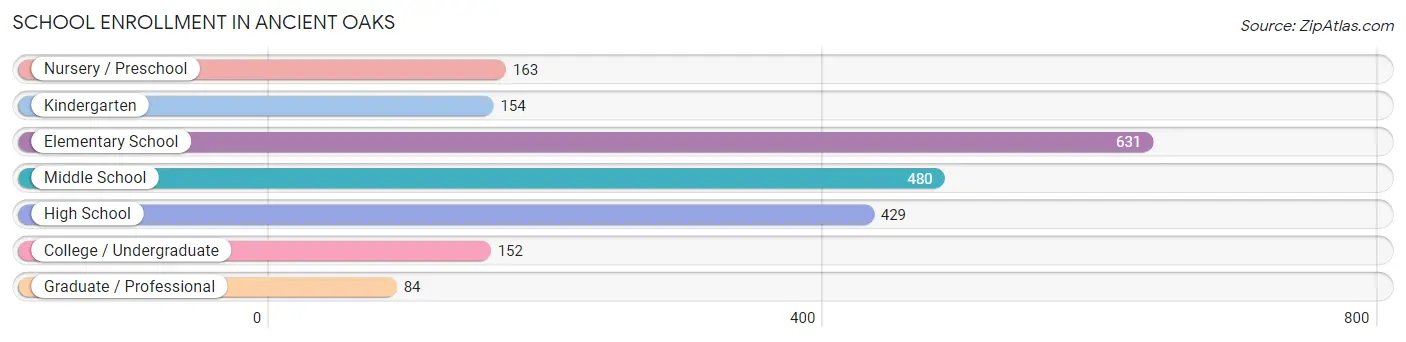
School Enrollment in Ancient Oaks
The most common levels of schooling among the 2,093 students in Ancient Oaks are elementary school (631 | 30.1%), middle school (480 | 22.9%), and high school (429 | 20.5%).
| School Level | # Students | % Students |
| Nursery / Preschool | 163 | 7.8% |
| Kindergarten | 154 | 7.4% |
| Elementary School | 631 | 30.1% |
| Middle School | 480 | 22.9% |
| High School | 429 | 20.5% |
| College / Undergraduate | 152 | 7.3% |
| Graduate / Professional | 84 | 4.0% |
| Total | 2,093 | 100.0% |
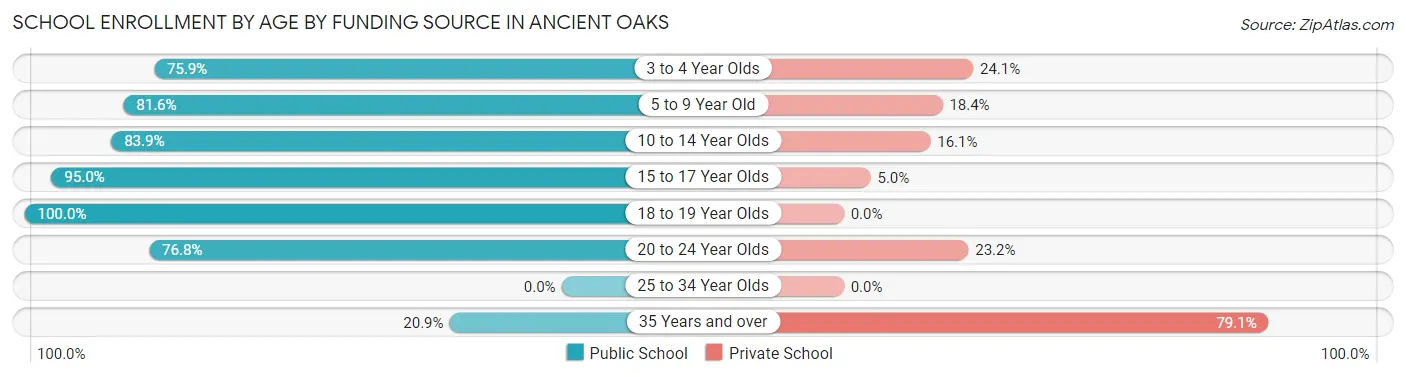
School Enrollment by Age by Funding Source in Ancient Oaks
Out of a total of 2,093 students who are enrolled in schools in Ancient Oaks, 381 (18.2%) attend a private institution, while the remaining 1,712 (81.8%) are enrolled in public schools. The age group of 35 years and over has the highest likelihood of being enrolled in private schools, with 72 (79.1% in the age bracket) enrolled. Conversely, the age group of 18 to 19 year olds has the lowest likelihood of being enrolled in a private school, with 81 (100.0% in the age bracket) attending a public institution.
| Age Bracket | Public School | Private School |
| 3 to 4 Year Olds | 63 (75.9%) | 20 (24.1%) |
| 5 to 9 Year Old | 643 (81.6%) | 145 (18.4%) |
| 10 to 14 Year Olds | 535 (83.9%) | 103 (16.1%) |
| 15 to 17 Year Olds | 285 (95.0%) | 15 (5.0%) |
| 18 to 19 Year Olds | 81 (100.0%) | 0 (0.0%) |
| 20 to 24 Year Olds | 86 (76.8%) | 26 (23.2%) |
| 25 to 34 Year Olds | 0 (0.0%) | 0 (0.0%) |
| 35 Years and over | 19 (20.9%) | 72 (79.1%) |
| Total | 1,712 (81.8%) | 381 (18.2%) |
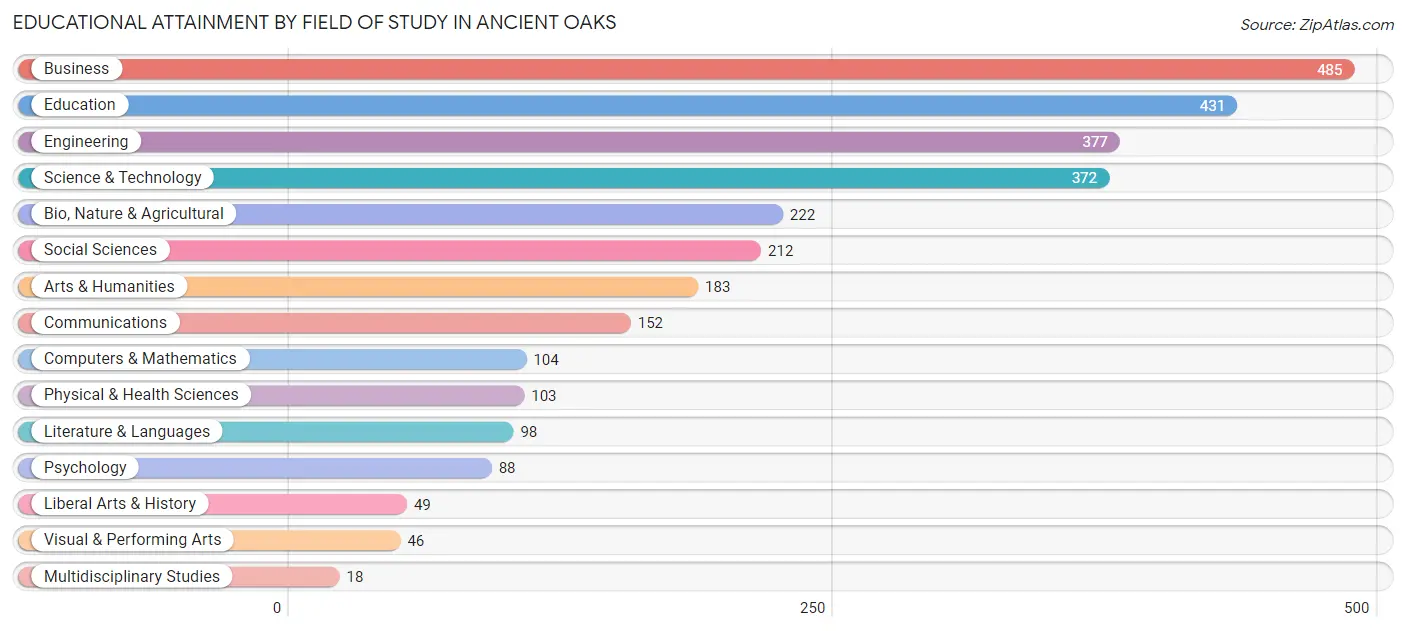
Educational Attainment by Field of Study in Ancient Oaks
Business (485 | 16.5%), education (431 | 14.7%), engineering (377 | 12.8%), science & technology (372 | 12.7%), and bio, nature & agricultural (222 | 7.5%) are the most common fields of study among 2,940 individuals in Ancient Oaks who have obtained a bachelor's degree or higher.
| Field of Study | # Graduates | % Graduates |
| Computers & Mathematics | 104 | 3.5% |
| Bio, Nature & Agricultural | 222 | 7.5% |
| Physical & Health Sciences | 103 | 3.5% |
| Psychology | 88 | 3.0% |
| Social Sciences | 212 | 7.2% |
| Engineering | 377 | 12.8% |
| Multidisciplinary Studies | 18 | 0.6% |
| Science & Technology | 372 | 12.7% |
| Business | 485 | 16.5% |
| Education | 431 | 14.7% |
| Literature & Languages | 98 | 3.3% |
| Liberal Arts & History | 49 | 1.7% |
| Visual & Performing Arts | 46 | 1.6% |
| Communications | 152 | 5.2% |
| Arts & Humanities | 183 | 6.2% |
| Total | 2,940 | 100.0% |
Transportation & Commute in Ancient Oaks
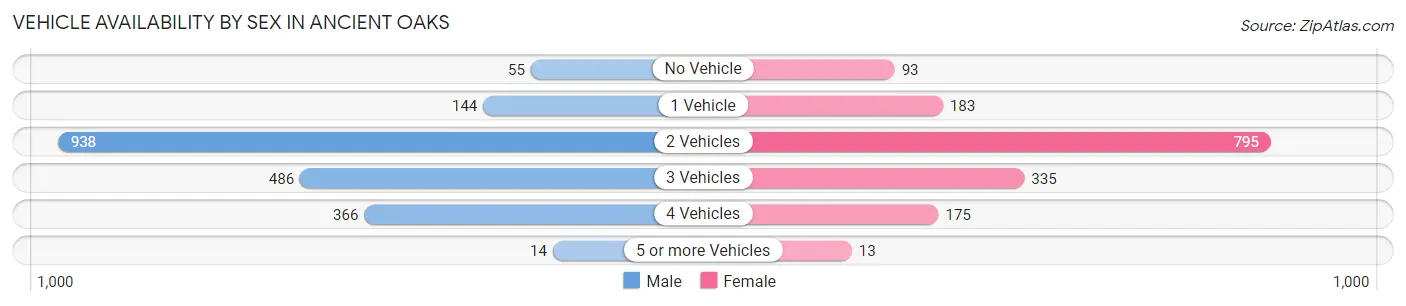
Vehicle Availability by Sex in Ancient Oaks
The most prevalent vehicle ownership categories in Ancient Oaks are males with 2 vehicles (938, accounting for 46.8%) and females with 2 vehicles (795, making up 58.9%).
| Vehicles Available | Male | Female |
| No Vehicle | 55 (2.8%) | 93 (5.8%) |
| 1 Vehicle | 144 (7.2%) | 183 (11.5%) |
| 2 Vehicles | 938 (46.8%) | 795 (49.9%) |
| 3 Vehicles | 486 (24.3%) | 335 (21.0%) |
| 4 Vehicles | 366 (18.3%) | 175 (11.0%) |
| 5 or more Vehicles | 14 (0.7%) | 13 (0.8%) |
| Total | 2,003 (100.0%) | 1,594 (100.0%) |
Commute Time in Ancient Oaks
The most frequently occuring commute durations in Ancient Oaks are 15 to 19 minutes (621 commuters, 21.6%), 20 to 24 minutes (539 commuters, 18.7%), and 10 to 14 minutes (423 commuters, 14.7%).
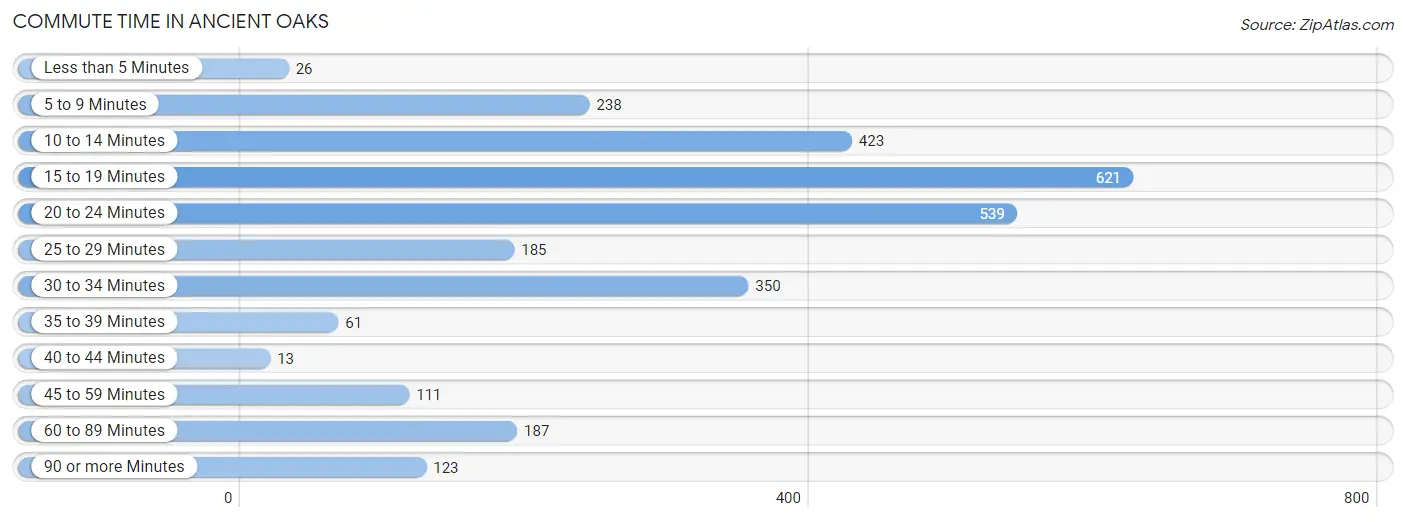
| Commute Time | # Commuters | % Commuters |
| Less than 5 Minutes | 26 | 0.9% |
| 5 to 9 Minutes | 238 | 8.3% |
| 10 to 14 Minutes | 423 | 14.7% |
| 15 to 19 Minutes | 621 | 21.6% |
| 20 to 24 Minutes | 539 | 18.7% |
| 25 to 29 Minutes | 185 | 6.4% |
| 30 to 34 Minutes | 350 | 12.2% |
| 35 to 39 Minutes | 61 | 2.1% |
| 40 to 44 Minutes | 13 | 0.4% |
| 45 to 59 Minutes | 111 | 3.9% |
| 60 to 89 Minutes | 187 | 6.5% |
| 90 or more Minutes | 123 | 4.3% |
Commute Time by Sex in Ancient Oaks
The most common commute times in Ancient Oaks are 15 to 19 minutes (453 commuters, 27.5%) for males and 10 to 14 minutes (290 commuters, 23.5%) for females.
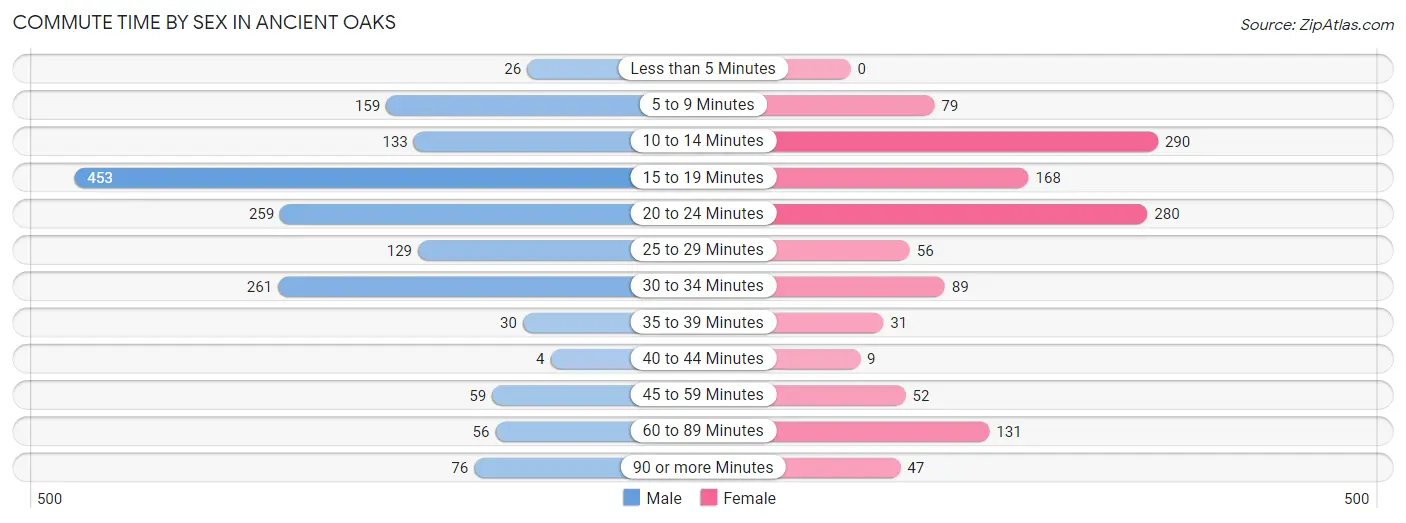
| Commute Time | Male | Female |
| Less than 5 Minutes | 26 (1.6%) | 0 (0.0%) |
| 5 to 9 Minutes | 159 (9.7%) | 79 (6.4%) |
| 10 to 14 Minutes | 133 (8.1%) | 290 (23.5%) |
| 15 to 19 Minutes | 453 (27.5%) | 168 (13.6%) |
| 20 to 24 Minutes | 259 (15.7%) | 280 (22.7%) |
| 25 to 29 Minutes | 129 (7.8%) | 56 (4.5%) |
| 30 to 34 Minutes | 261 (15.9%) | 89 (7.2%) |
| 35 to 39 Minutes | 30 (1.8%) | 31 (2.5%) |
| 40 to 44 Minutes | 4 (0.2%) | 9 (0.7%) |
| 45 to 59 Minutes | 59 (3.6%) | 52 (4.2%) |
| 60 to 89 Minutes | 56 (3.4%) | 131 (10.6%) |
| 90 or more Minutes | 76 (4.6%) | 47 (3.8%) |
Time of Departure to Work by Sex in Ancient Oaks
The most frequent times of departure to work in Ancient Oaks are 8:00 AM to 8:29 AM (324, 19.7%) for males and 7:00 AM to 7:29 AM (326, 26.5%) for females.
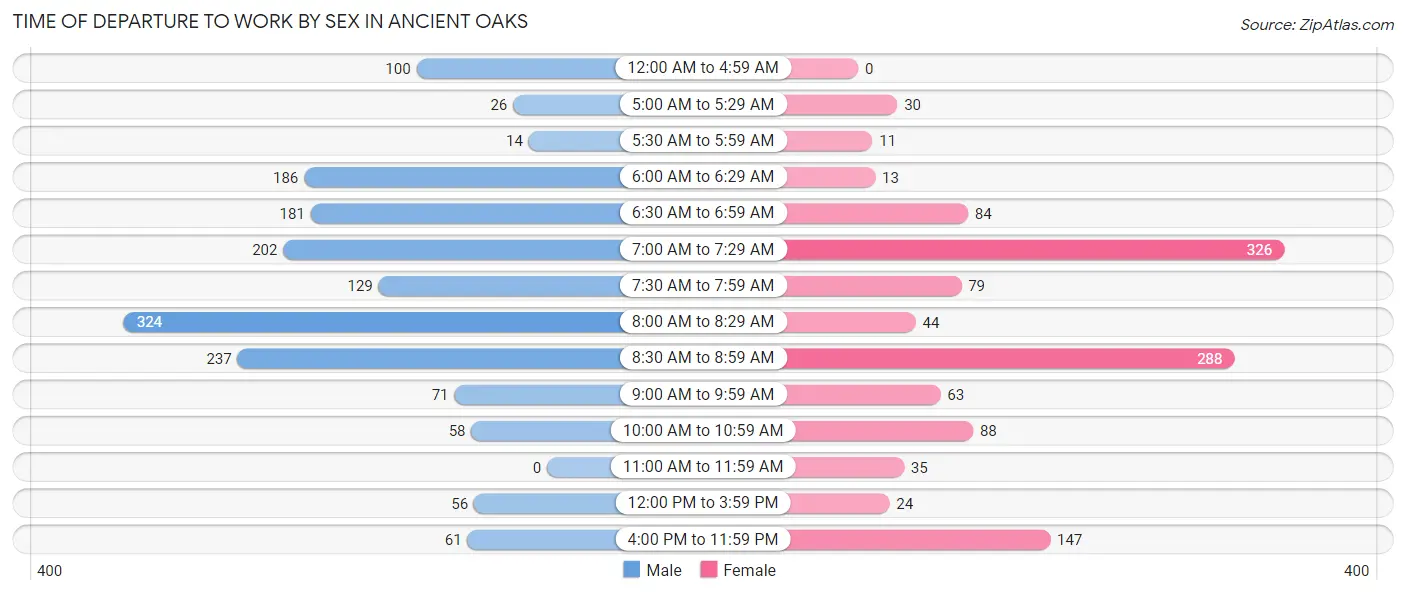
| Time of Departure | Male | Female |
| 12:00 AM to 4:59 AM | 100 (6.1%) | 0 (0.0%) |
| 5:00 AM to 5:29 AM | 26 (1.6%) | 30 (2.4%) |
| 5:30 AM to 5:59 AM | 14 (0.9%) | 11 (0.9%) |
| 6:00 AM to 6:29 AM | 186 (11.3%) | 13 (1.1%) |
| 6:30 AM to 6:59 AM | 181 (11.0%) | 84 (6.8%) |
| 7:00 AM to 7:29 AM | 202 (12.3%) | 326 (26.5%) |
| 7:30 AM to 7:59 AM | 129 (7.8%) | 79 (6.4%) |
| 8:00 AM to 8:29 AM | 324 (19.7%) | 44 (3.6%) |
| 8:30 AM to 8:59 AM | 237 (14.4%) | 288 (23.4%) |
| 9:00 AM to 9:59 AM | 71 (4.3%) | 63 (5.1%) |
| 10:00 AM to 10:59 AM | 58 (3.5%) | 88 (7.1%) |
| 11:00 AM to 11:59 AM | 0 (0.0%) | 35 (2.8%) |
| 12:00 PM to 3:59 PM | 56 (3.4%) | 24 (1.9%) |
| 4:00 PM to 11:59 PM | 61 (3.7%) | 147 (11.9%) |
| Total | 1,645 (100.0%) | 1,232 (100.0%) |
Housing Occupancy in Ancient Oaks
Occupancy by Ownership in Ancient Oaks
Of the total 2,505 dwellings in Ancient Oaks, owner-occupied units account for 2,056 (82.1%), while renter-occupied units make up 449 (17.9%).
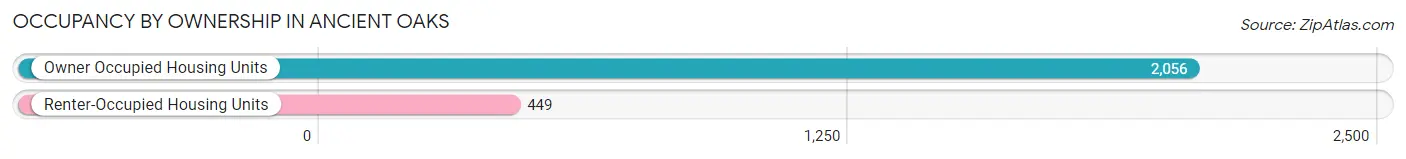
| Occupancy | # Housing Units | % Housing Units |
| Owner Occupied Housing Units | 2,056 | 82.1% |
| Renter-Occupied Housing Units | 449 | 17.9% |
| Total Occupied Housing Units | 2,505 | 100.0% |
Occupancy by Household Size in Ancient Oaks
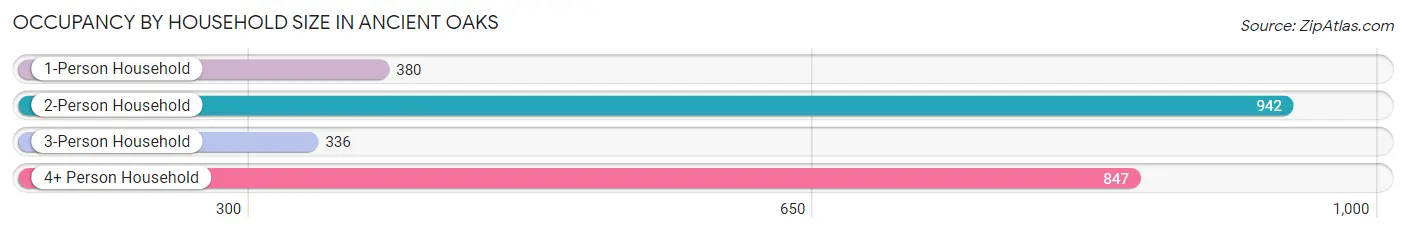
| Household Size | # Housing Units | % Housing Units |
| 1-Person Household | 380 | 15.2% |
| 2-Person Household | 942 | 37.6% |
| 3-Person Household | 336 | 13.4% |
| 4+ Person Household | 847 | 33.8% |
| Total Housing Units | 2,505 | 100.0% |
Occupancy by Ownership by Household Size in Ancient Oaks
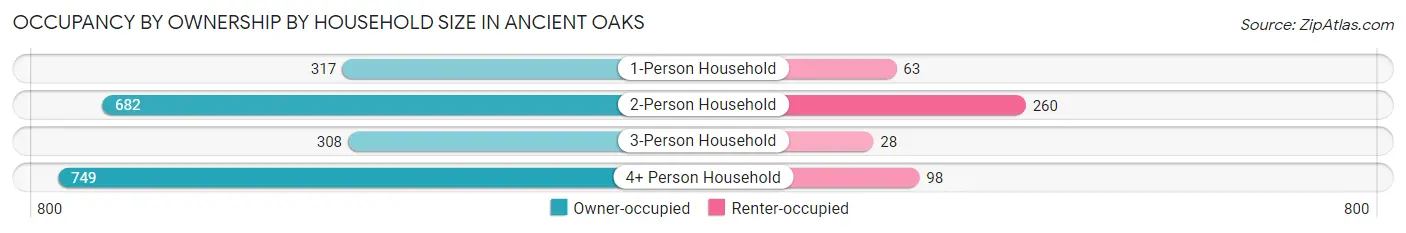
| Household Size | Owner-occupied | Renter-occupied |
| 1-Person Household | 317 (83.4%) | 63 (16.6%) |
| 2-Person Household | 682 (72.4%) | 260 (27.6%) |
| 3-Person Household | 308 (91.7%) | 28 (8.3%) |
| 4+ Person Household | 749 (88.4%) | 98 (11.6%) |
| Total Housing Units | 2,056 (82.1%) | 449 (17.9%) |
Occupancy by Educational Attainment in Ancient Oaks
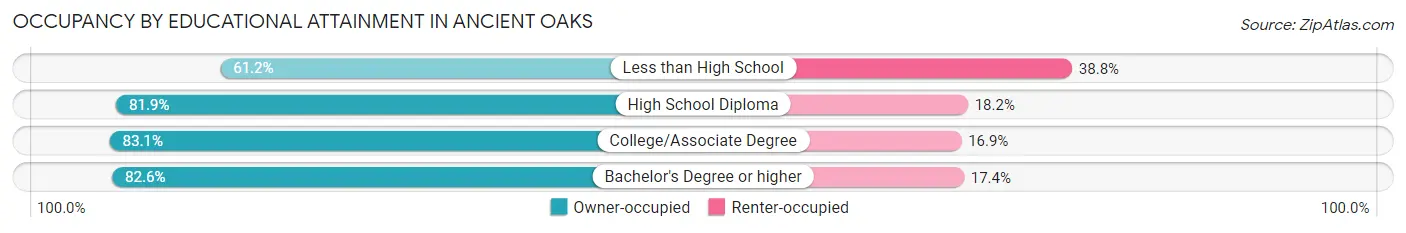
| Household Size | Owner-occupied | Renter-occupied |
| Less than High School | 41 (61.2%) | 26 (38.8%) |
| High School Diploma | 257 (81.9%) | 57 (18.1%) |
| College/Associate Degree | 493 (83.1%) | 100 (16.9%) |
| Bachelor's Degree or higher | 1,265 (82.6%) | 266 (17.4%) |
Occupancy by Age of Householder in Ancient Oaks
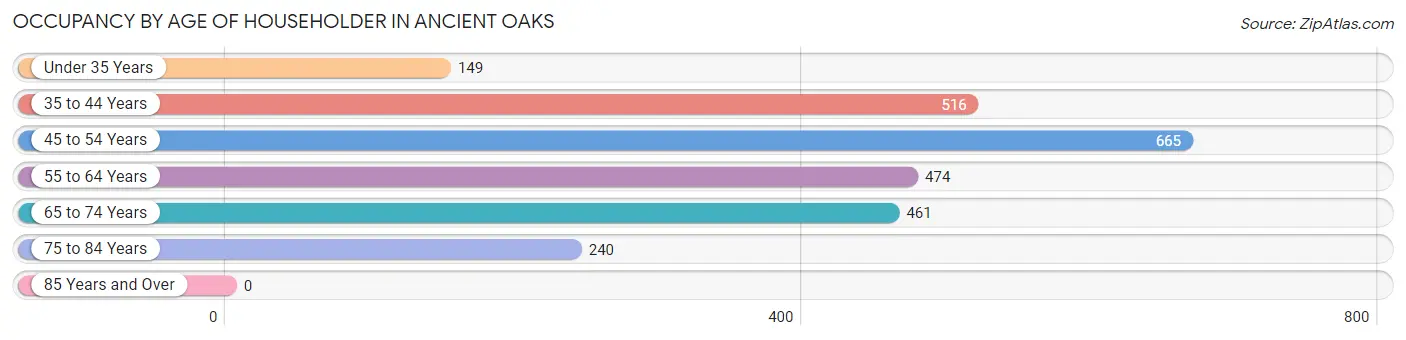
| Age Bracket | # Households | % Households |
| Under 35 Years | 149 | 5.9% |
| 35 to 44 Years | 516 | 20.6% |
| 45 to 54 Years | 665 | 26.6% |
| 55 to 64 Years | 474 | 18.9% |
| 65 to 74 Years | 461 | 18.4% |
| 75 to 84 Years | 240 | 9.6% |
| 85 Years and Over | 0 | 0.0% |
| Total | 2,505 | 100.0% |
Housing Finances in Ancient Oaks
Median Income by Occupancy in Ancient Oaks
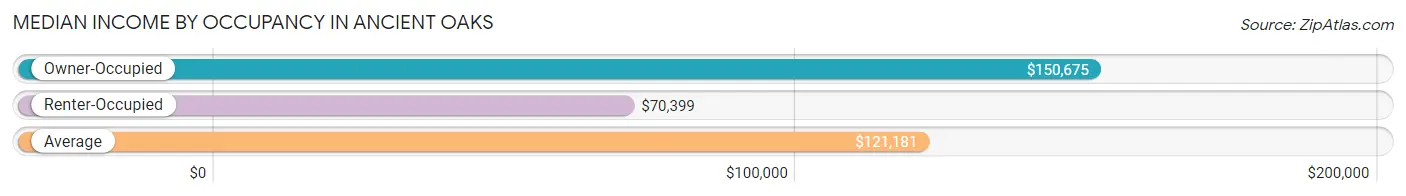
| Occupancy Type | # Households | Median Income |
| Owner-Occupied | 2,056 (82.1%) | $150,675 |
| Renter-Occupied | 449 (17.9%) | $70,399 |
| Average | 2,505 (100.0%) | $121,181 |
Occupancy by Householder Income Bracket in Ancient Oaks
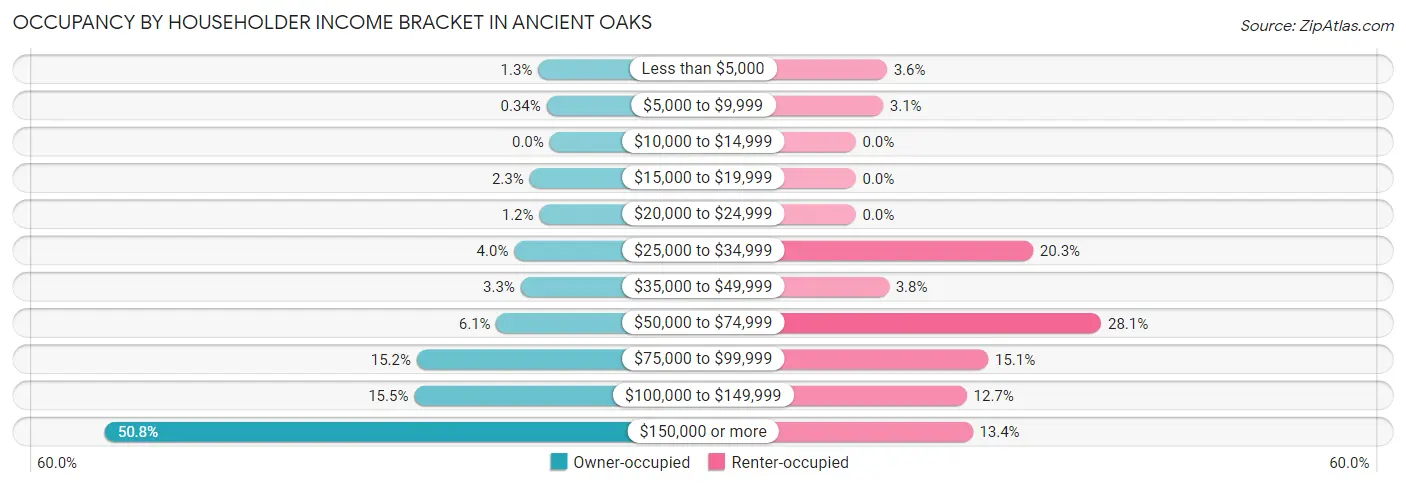
| Income Bracket | Owner-occupied | Renter-occupied |
| Less than $5,000 | 27 (1.3%) | 16 (3.6%) |
| $5,000 to $9,999 | 7 (0.3%) | 14 (3.1%) |
| $10,000 to $14,999 | 0 (0.0%) | 0 (0.0%) |
| $15,000 to $19,999 | 47 (2.3%) | 0 (0.0%) |
| $20,000 to $24,999 | 24 (1.2%) | 0 (0.0%) |
| $25,000 to $34,999 | 83 (4.0%) | 91 (20.3%) |
| $35,000 to $49,999 | 68 (3.3%) | 17 (3.8%) |
| $50,000 to $74,999 | 125 (6.1%) | 126 (28.1%) |
| $75,000 to $99,999 | 312 (15.2%) | 68 (15.1%) |
| $100,000 to $149,999 | 318 (15.5%) | 57 (12.7%) |
| $150,000 or more | 1,045 (50.8%) | 60 (13.4%) |
| Total | 2,056 (100.0%) | 449 (100.0%) |
Monthly Housing Cost Tiers in Ancient Oaks
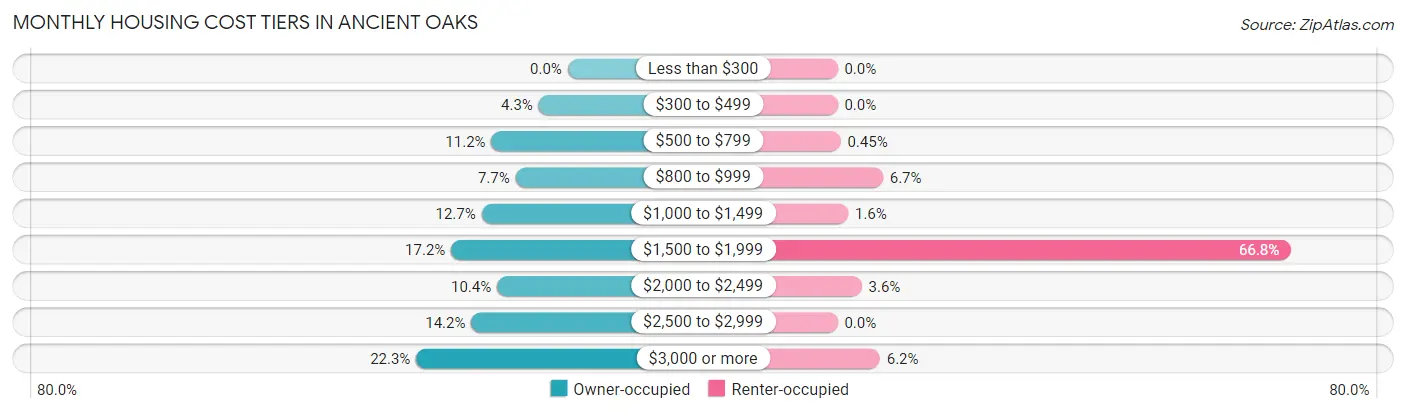
| Monthly Cost | Owner-occupied | Renter-occupied |
| Less than $300 | 0 (0.0%) | 0 (0.0%) |
| $300 to $499 | 88 (4.3%) | 0 (0.0%) |
| $500 to $799 | 231 (11.2%) | 2 (0.4%) |
| $800 to $999 | 158 (7.7%) | 30 (6.7%) |
| $1,000 to $1,499 | 261 (12.7%) | 7 (1.6%) |
| $1,500 to $1,999 | 353 (17.2%) | 300 (66.8%) |
| $2,000 to $2,499 | 214 (10.4%) | 16 (3.6%) |
| $2,500 to $2,999 | 292 (14.2%) | 0 (0.0%) |
| $3,000 or more | 459 (22.3%) | 28 (6.2%) |
| Total | 2,056 (100.0%) | 449 (100.0%) |
Physical Housing Characteristics in Ancient Oaks
Housing Structures in Ancient Oaks
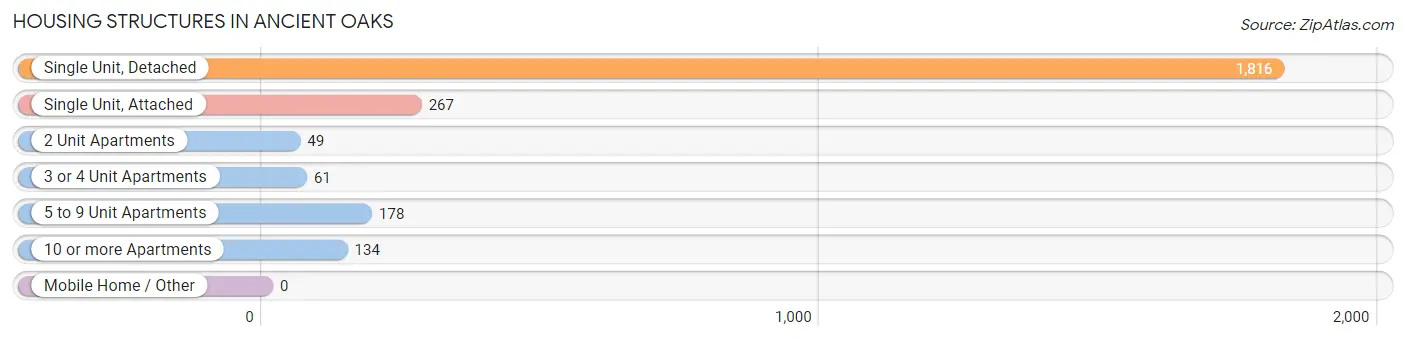
| Structure Type | # Housing Units | % Housing Units |
| Single Unit, Detached | 1,816 | 72.5% |
| Single Unit, Attached | 267 | 10.7% |
| 2 Unit Apartments | 49 | 2.0% |
| 3 or 4 Unit Apartments | 61 | 2.4% |
| 5 to 9 Unit Apartments | 178 | 7.1% |
| 10 or more Apartments | 134 | 5.3% |
| Mobile Home / Other | 0 | 0.0% |
| Total | 2,505 | 100.0% |
Housing Structures by Occupancy in Ancient Oaks
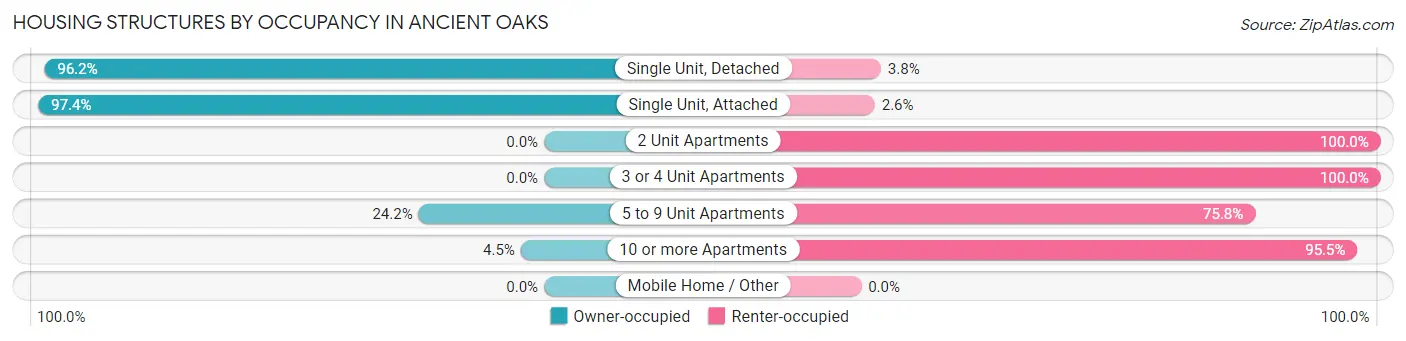
| Structure Type | Owner-occupied | Renter-occupied |
| Single Unit, Detached | 1,747 (96.2%) | 69 (3.8%) |
| Single Unit, Attached | 260 (97.4%) | 7 (2.6%) |
| 2 Unit Apartments | 0 (0.0%) | 49 (100.0%) |
| 3 or 4 Unit Apartments | 0 (0.0%) | 61 (100.0%) |
| 5 to 9 Unit Apartments | 43 (24.2%) | 135 (75.8%) |
| 10 or more Apartments | 6 (4.5%) | 128 (95.5%) |
| Mobile Home / Other | 0 (0.0%) | 0 (0.0%) |
| Total | 2,056 (82.1%) | 449 (17.9%) |
Housing Structures by Number of Rooms in Ancient Oaks
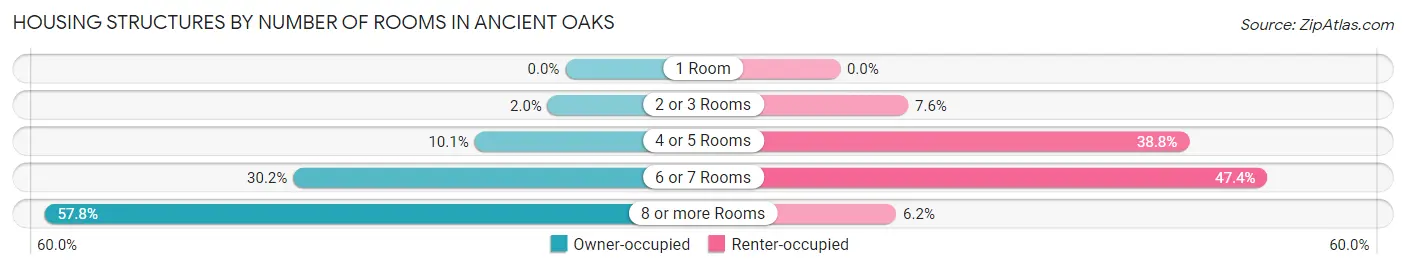
| Number of Rooms | Owner-occupied | Renter-occupied |
| 1 Room | 0 (0.0%) | 0 (0.0%) |
| 2 or 3 Rooms | 40 (1.9%) | 34 (7.6%) |
| 4 or 5 Rooms | 207 (10.1%) | 174 (38.8%) |
| 6 or 7 Rooms | 621 (30.2%) | 213 (47.4%) |
| 8 or more Rooms | 1,188 (57.8%) | 28 (6.2%) |
| Total | 2,056 (100.0%) | 449 (100.0%) |
Housing Structure by Heating Type in Ancient Oaks
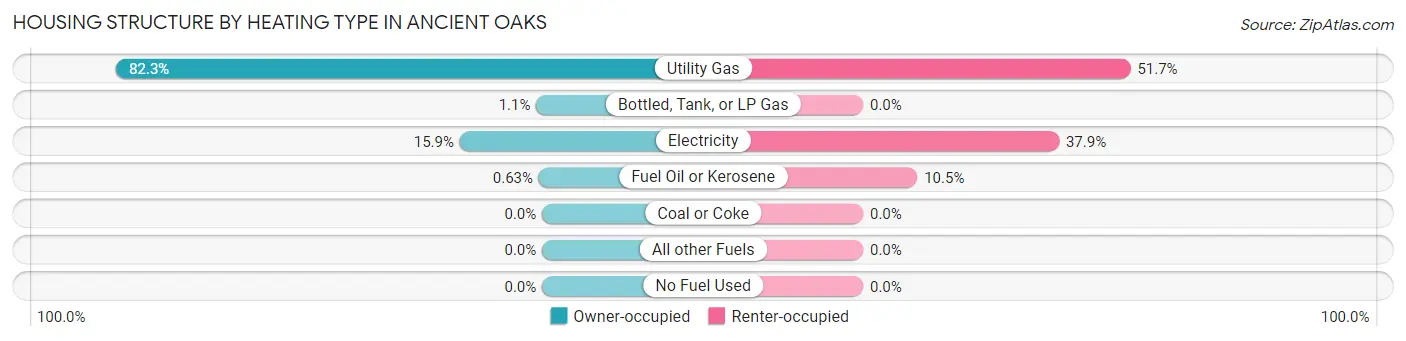
| Heating Type | Owner-occupied | Renter-occupied |
| Utility Gas | 1,693 (82.3%) | 232 (51.7%) |
| Bottled, Tank, or LP Gas | 23 (1.1%) | 0 (0.0%) |
| Electricity | 327 (15.9%) | 170 (37.9%) |
| Fuel Oil or Kerosene | 13 (0.6%) | 47 (10.5%) |
| Coal or Coke | 0 (0.0%) | 0 (0.0%) |
| All other Fuels | 0 (0.0%) | 0 (0.0%) |
| No Fuel Used | 0 (0.0%) | 0 (0.0%) |
| Total | 2,056 (100.0%) | 449 (100.0%) |
Household Vehicle Usage in Ancient Oaks
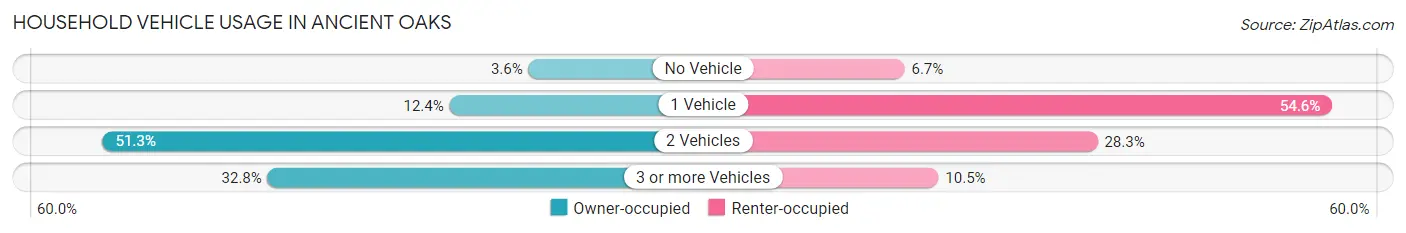
| Vehicles per Household | Owner-occupied | Renter-occupied |
| No Vehicle | 73 (3.5%) | 30 (6.7%) |
| 1 Vehicle | 255 (12.4%) | 245 (54.6%) |
| 2 Vehicles | 1,054 (51.3%) | 127 (28.3%) |
| 3 or more Vehicles | 674 (32.8%) | 47 (10.5%) |
| Total | 2,056 (100.0%) | 449 (100.0%) |
Real Estate & Mortgages in Ancient Oaks
Real Estate and Mortgage Overview in Ancient Oaks
| Characteristic | Without Mortgage | With Mortgage |
| Housing Units | 528 | 1,528 |
| Median Property Value | $339,400 | $416,300 |
| Median Household Income | $101,154 | $881 |
| Monthly Housing Costs | $752 | $459 |
| Real Estate Taxes | $5,082 | $0 |
Property Value by Mortgage Status in Ancient Oaks
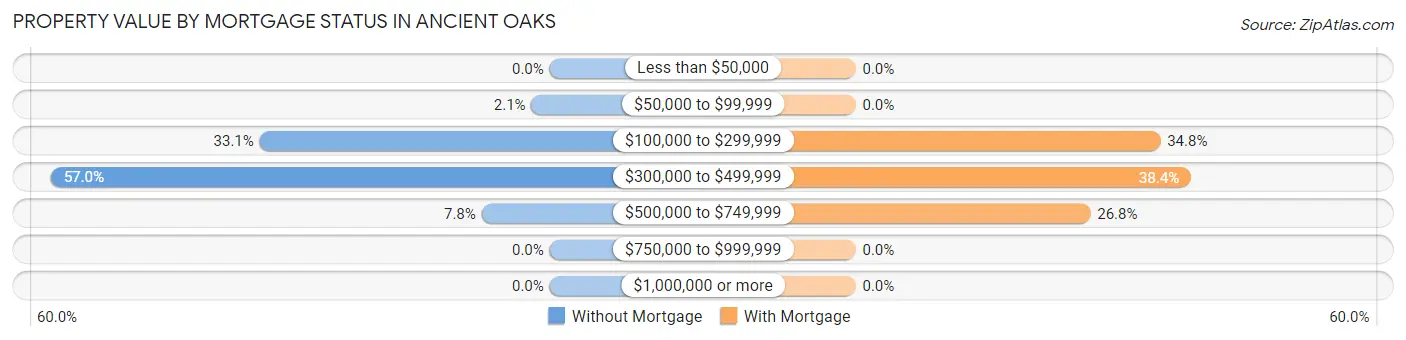
| Property Value | Without Mortgage | With Mortgage |
| Less than $50,000 | 0 (0.0%) | 0 (0.0%) |
| $50,000 to $99,999 | 11 (2.1%) | 0 (0.0%) |
| $100,000 to $299,999 | 175 (33.1%) | 532 (34.8%) |
| $300,000 to $499,999 | 301 (57.0%) | 586 (38.4%) |
| $500,000 to $749,999 | 41 (7.8%) | 410 (26.8%) |
| $750,000 to $999,999 | 0 (0.0%) | 0 (0.0%) |
| $1,000,000 or more | 0 (0.0%) | 0 (0.0%) |
| Total | 528 (100.0%) | 1,528 (100.0%) |
Household Income by Mortgage Status in Ancient Oaks
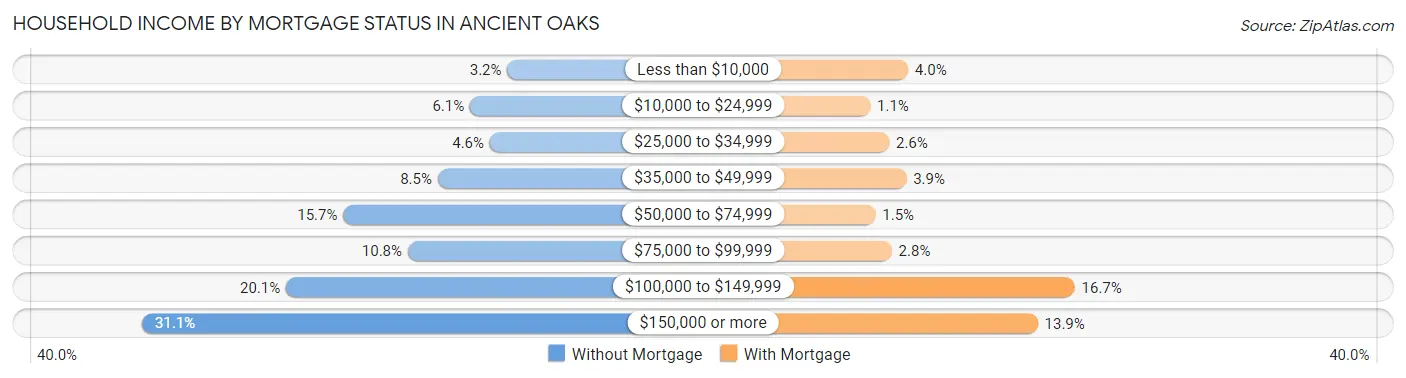
| Household Income | Without Mortgage | With Mortgage |
| Less than $10,000 | 17 (3.2%) | 61 (4.0%) |
| $10,000 to $24,999 | 32 (6.1%) | 17 (1.1%) |
| $25,000 to $34,999 | 24 (4.5%) | 39 (2.5%) |
| $35,000 to $49,999 | 45 (8.5%) | 59 (3.9%) |
| $50,000 to $74,999 | 83 (15.7%) | 23 (1.5%) |
| $75,000 to $99,999 | 57 (10.8%) | 42 (2.8%) |
| $100,000 to $149,999 | 106 (20.1%) | 255 (16.7%) |
| $150,000 or more | 164 (31.1%) | 212 (13.9%) |
| Total | 528 (100.0%) | 1,528 (100.0%) |
Property Value to Household Income Ratio in Ancient Oaks
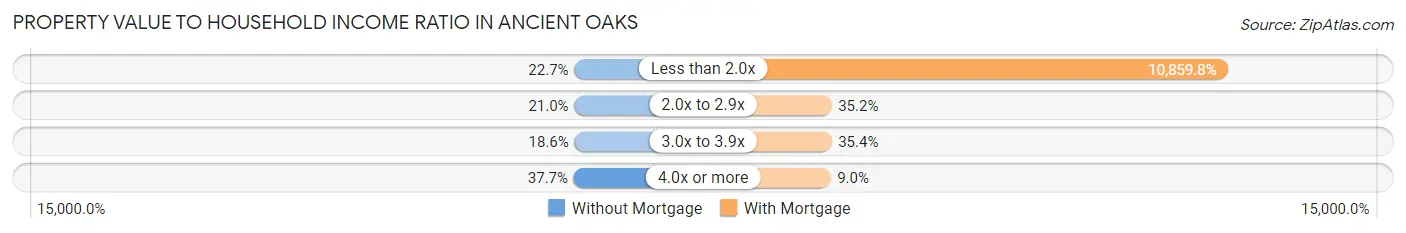
| Value-to-Income Ratio | Without Mortgage | With Mortgage |
| Less than 2.0x | 120 (22.7%) | 165,938 (10,859.8%) |
| 2.0x to 2.9x | 111 (21.0%) | 538 (35.2%) |
| 3.0x to 3.9x | 98 (18.6%) | 541 (35.4%) |
| 4.0x or more | 199 (37.7%) | 137 (9.0%) |
| Total | 528 (100.0%) | 1,528 (100.0%) |
Real Estate Taxes by Mortgage Status in Ancient Oaks
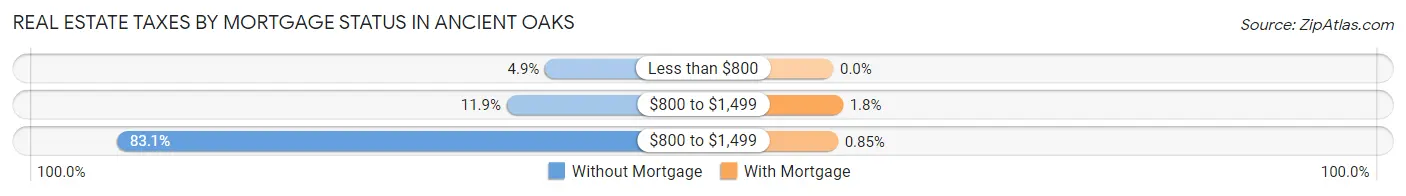
| Property Taxes | Without Mortgage | With Mortgage |
| Less than $800 | 26 (4.9%) | 0 (0.0%) |
| $800 to $1,499 | 63 (11.9%) | 27 (1.8%) |
| $800 to $1,499 | 439 (83.1%) | 13 (0.9%) |
| Total | 528 (100.0%) | 1,528 (100.0%) |
Health & Disability in Ancient Oaks
Health Insurance Coverage by Age in Ancient Oaks
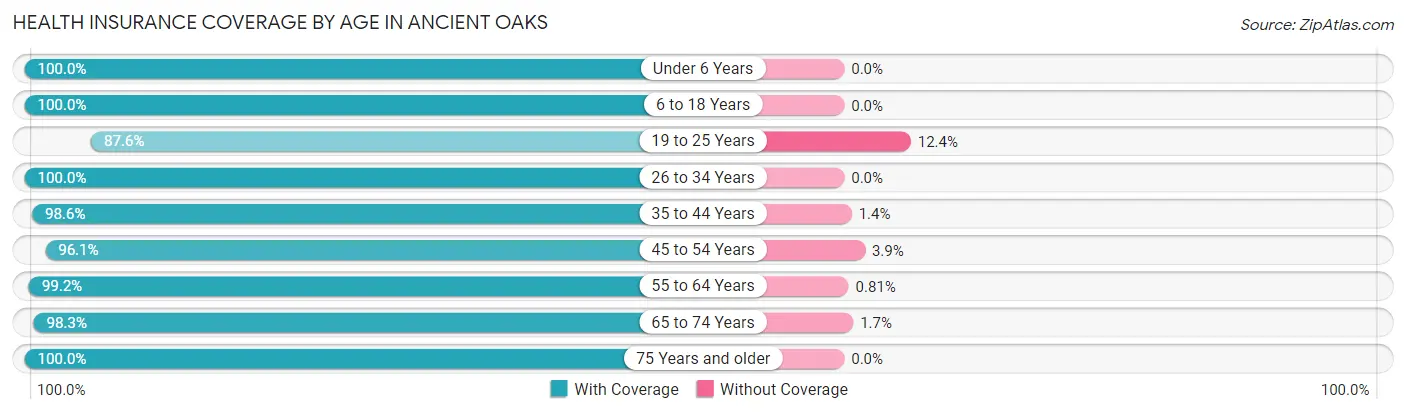
| Age Bracket | With Coverage | Without Coverage |
| Under 6 Years | 523 (100.0%) | 0 (0.0%) |
| 6 to 18 Years | 1,759 (100.0%) | 0 (0.0%) |
| 19 to 25 Years | 318 (87.6%) | 45 (12.4%) |
| 26 to 34 Years | 386 (100.0%) | 0 (0.0%) |
| 35 to 44 Years | 1,208 (98.6%) | 17 (1.4%) |
| 45 to 54 Years | 1,022 (96.1%) | 41 (3.9%) |
| 55 to 64 Years | 854 (99.2%) | 7 (0.8%) |
| 65 to 74 Years | 822 (98.3%) | 14 (1.7%) |
| 75 Years and older | 347 (100.0%) | 0 (0.0%) |
| Total | 7,239 (98.3%) | 124 (1.7%) |
Health Insurance Coverage by Citizenship Status in Ancient Oaks
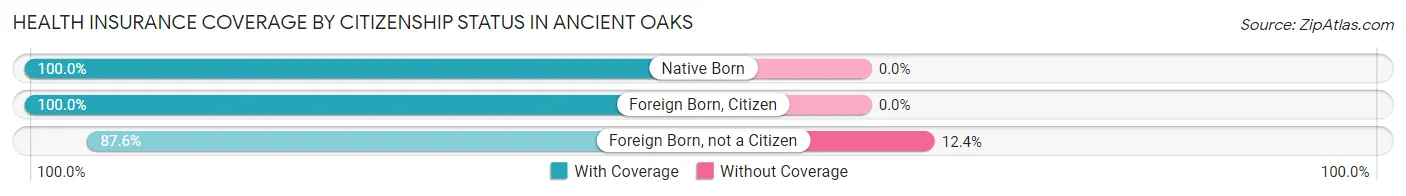
| Citizenship Status | With Coverage | Without Coverage |
| Native Born | 523 (100.0%) | 0 (0.0%) |
| Foreign Born, Citizen | 1,759 (100.0%) | 0 (0.0%) |
| Foreign Born, not a Citizen | 318 (87.6%) | 45 (12.4%) |
Health Insurance Coverage by Household Income in Ancient Oaks
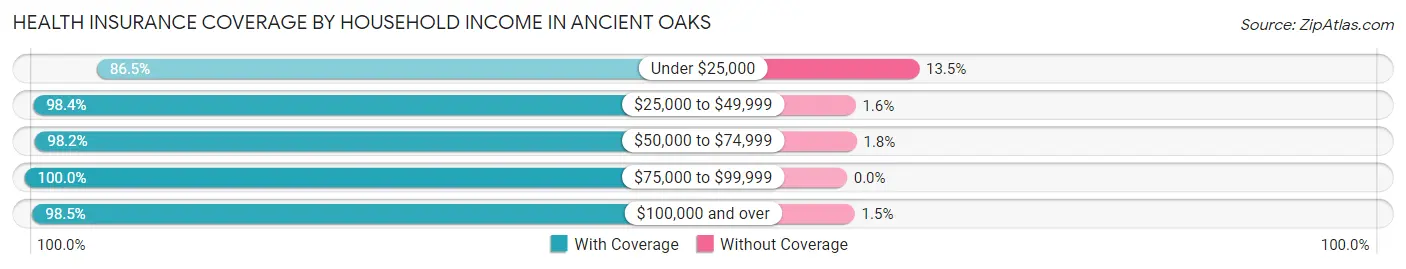
| Household Income | With Coverage | Without Coverage |
| Under $25,000 | 166 (86.5%) | 26 (13.5%) |
| $25,000 to $49,999 | 425 (98.4%) | 7 (1.6%) |
| $50,000 to $74,999 | 916 (98.2%) | 17 (1.8%) |
| $75,000 to $99,999 | 761 (100.0%) | 0 (0.0%) |
| $100,000 and over | 4,963 (98.5%) | 74 (1.5%) |
Public vs Private Health Insurance Coverage by Age in Ancient Oaks
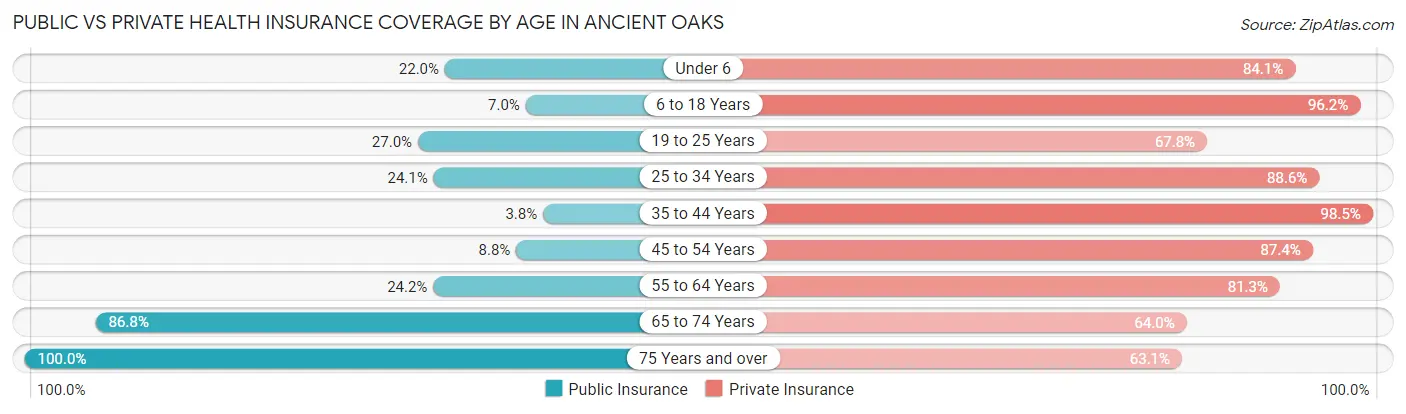
| Age Bracket | Public Insurance | Private Insurance |
| Under 6 | 115 (22.0%) | 440 (84.1%) |
| 6 to 18 Years | 123 (7.0%) | 1,692 (96.2%) |
| 19 to 25 Years | 98 (27.0%) | 246 (67.8%) |
| 25 to 34 Years | 93 (24.1%) | 342 (88.6%) |
| 35 to 44 Years | 46 (3.8%) | 1,207 (98.5%) |
| 45 to 54 Years | 93 (8.7%) | 929 (87.4%) |
| 55 to 64 Years | 208 (24.2%) | 700 (81.3%) |
| 65 to 74 Years | 726 (86.8%) | 535 (64.0%) |
| 75 Years and over | 347 (100.0%) | 219 (63.1%) |
| Total | 1,849 (25.1%) | 6,310 (85.7%) |
Disability Status by Sex by Age in Ancient Oaks
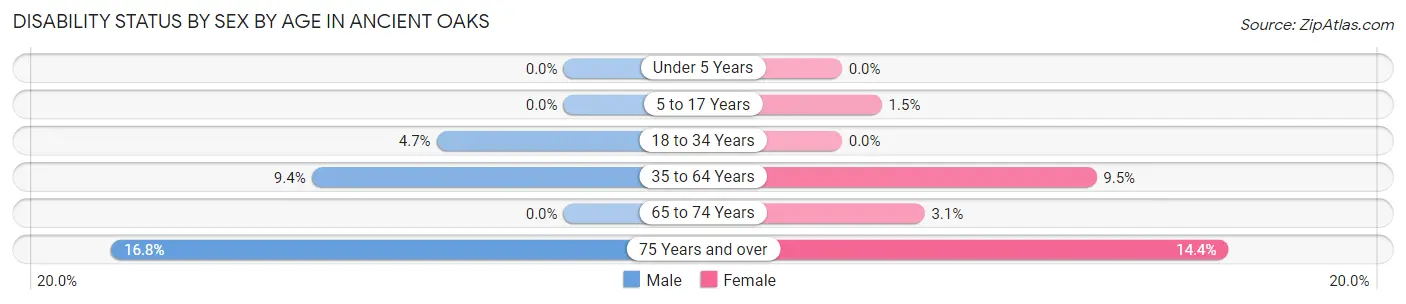
| Age Bracket | Male | Female |
| Under 5 Years | 0 (0.0%) | 0 (0.0%) |
| 5 to 17 Years | 0 (0.0%) | 15 (1.5%) |
| 18 to 34 Years | 17 (4.7%) | 0 (0.0%) |
| 35 to 64 Years | 147 (9.3%) | 149 (9.5%) |
| 65 to 74 Years | 0 (0.0%) | 13 (3.1%) |
| 75 Years and over | 22 (16.8%) | 31 (14.3%) |
Disability Class by Sex by Age in Ancient Oaks
Disability Class: Hearing Difficulty
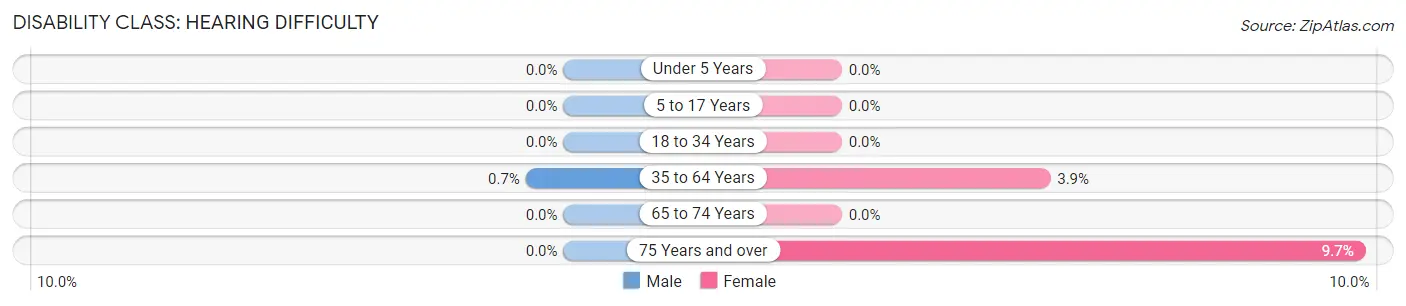
| Age Bracket | Male | Female |
| Under 5 Years | 0 (0.0%) | 0 (0.0%) |
| 5 to 17 Years | 0 (0.0%) | 0 (0.0%) |
| 18 to 34 Years | 0 (0.0%) | 0 (0.0%) |
| 35 to 64 Years | 11 (0.7%) | 61 (3.9%) |
| 65 to 74 Years | 0 (0.0%) | 0 (0.0%) |
| 75 Years and over | 0 (0.0%) | 21 (9.7%) |
Disability Class: Vision Difficulty
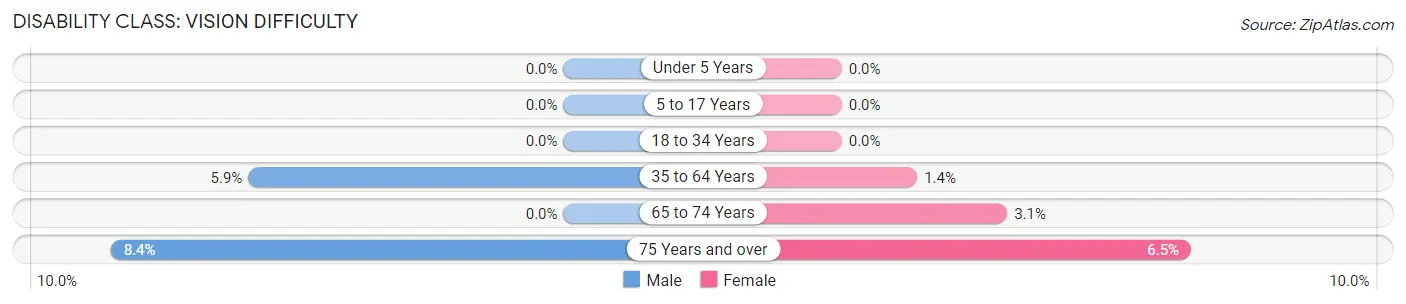
| Age Bracket | Male | Female |
| Under 5 Years | 0 (0.0%) | 0 (0.0%) |
| 5 to 17 Years | 0 (0.0%) | 0 (0.0%) |
| 18 to 34 Years | 0 (0.0%) | 0 (0.0%) |
| 35 to 64 Years | 92 (5.9%) | 22 (1.4%) |
| 65 to 74 Years | 0 (0.0%) | 13 (3.1%) |
| 75 Years and over | 11 (8.4%) | 14 (6.5%) |
Disability Class: Cognitive Difficulty
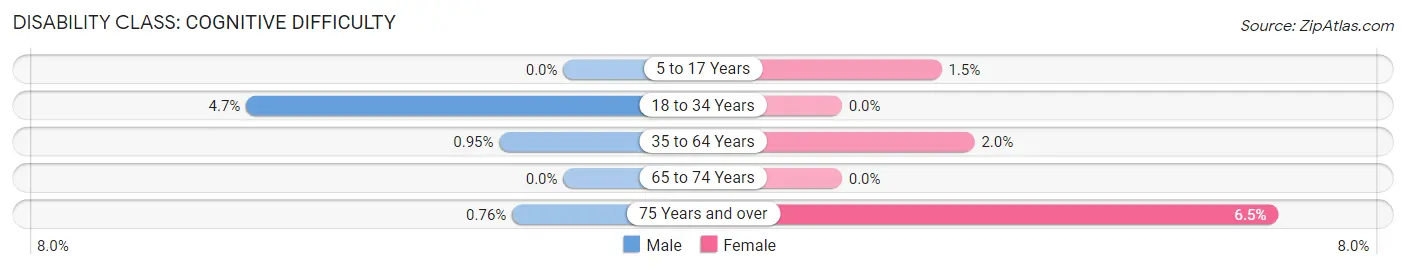
| Age Bracket | Male | Female |
| 5 to 17 Years | 0 (0.0%) | 15 (1.5%) |
| 18 to 34 Years | 17 (4.7%) | 0 (0.0%) |
| 35 to 64 Years | 15 (0.9%) | 31 (2.0%) |
| 65 to 74 Years | 0 (0.0%) | 0 (0.0%) |
| 75 Years and over | 1 (0.8%) | 14 (6.5%) |
Disability Class: Ambulatory Difficulty
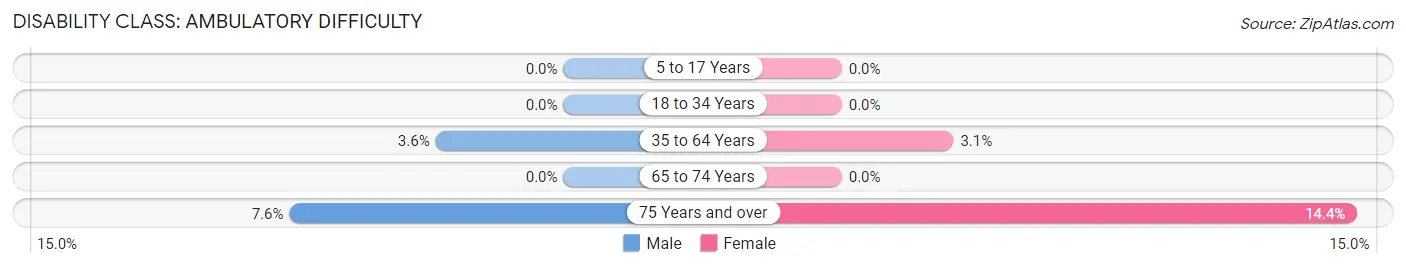
| Age Bracket | Male | Female |
| 5 to 17 Years | 0 (0.0%) | 0 (0.0%) |
| 18 to 34 Years | 0 (0.0%) | 0 (0.0%) |
| 35 to 64 Years | 56 (3.6%) | 49 (3.1%) |
| 65 to 74 Years | 0 (0.0%) | 0 (0.0%) |
| 75 Years and over | 10 (7.6%) | 31 (14.3%) |
Disability Class: Self-Care Difficulty
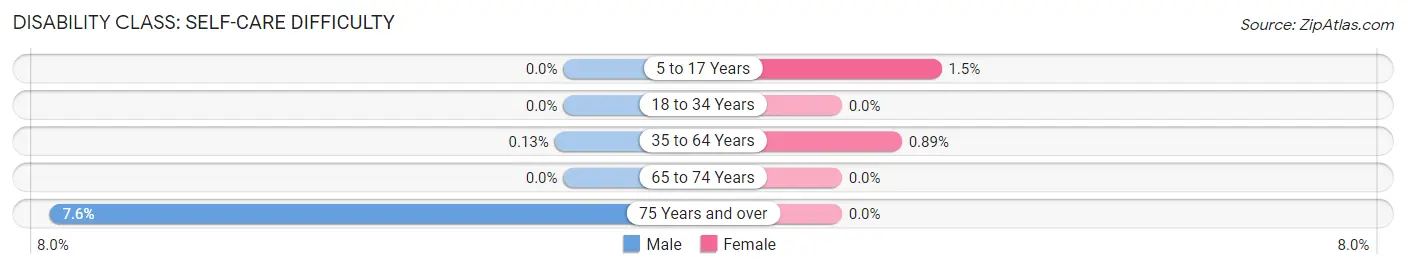
| Age Bracket | Male | Female |
| 5 to 17 Years | 0 (0.0%) | 15 (1.5%) |
| 18 to 34 Years | 0 (0.0%) | 0 (0.0%) |
| 35 to 64 Years | 2 (0.1%) | 14 (0.9%) |
| 65 to 74 Years | 0 (0.0%) | 0 (0.0%) |
| 75 Years and over | 10 (7.6%) | 0 (0.0%) |
Technology Access in Ancient Oaks
Computing Device Access in Ancient Oaks
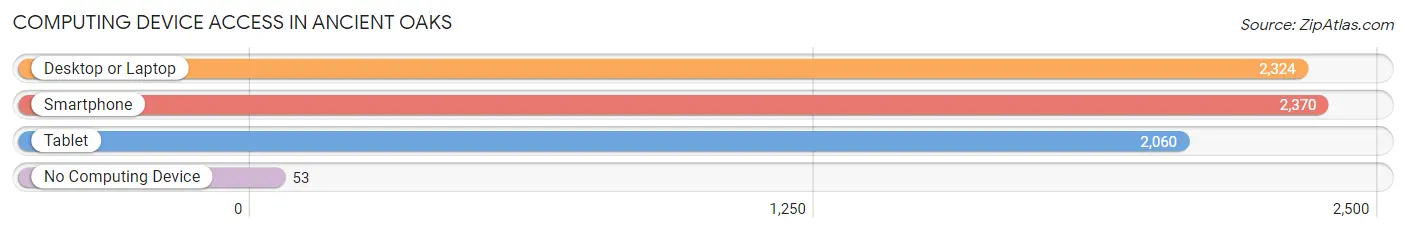
| Device Type | # Households | % Households |
| Desktop or Laptop | 2,324 | 92.8% |
| Smartphone | 2,370 | 94.6% |
| Tablet | 2,060 | 82.2% |
| No Computing Device | 53 | 2.1% |
| Total | 2,505 | 100.0% |
Internet Access in Ancient Oaks
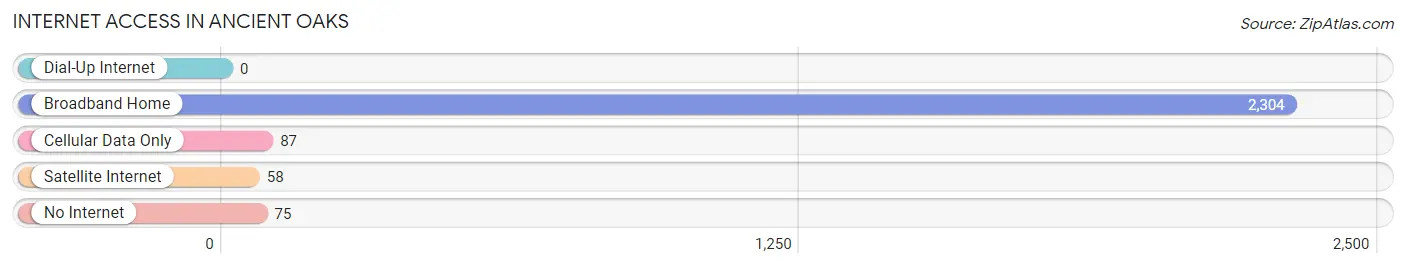
| Internet Type | # Households | % Households |
| Dial-Up Internet | 0 | 0.0% |
| Broadband Home | 2,304 | 92.0% |
| Cellular Data Only | 87 | 3.5% |
| Satellite Internet | 58 | 2.3% |
| No Internet | 75 | 3.0% |
| Total | 2,505 | 100.0% |
Ancient Oaks Summary
Oak, Pennsylvania is a small town located in the southeastern corner of the state. It is situated in the foothills of the Appalachian Mountains and is surrounded by rolling hills and lush forests. The town is home to a population of just over 1,000 people and is known for its quaint charm and rural atmosphere.
History
The area that is now known as Ancient Oaks was first settled in the late 1700s by a group of German immigrants. The settlers were attracted to the area due to its abundance of natural resources and its proximity to the Susquehanna River. The town was officially established in 1810 and was named after the many oak trees that grew in the area.
In the early 1900s, the town experienced a period of growth and prosperity. The population increased and new businesses were established. The town was also home to a number of mills and factories, which provided employment for many of the town’s residents.
Geography
Ancient Oaks is located in the southeastern corner of Pennsylvania, in the foothills of the Appalachian Mountains. The town is situated on the banks of the Susquehanna River and is surrounded by rolling hills and lush forests. The town is located approximately 30 miles from the state capital of Harrisburg and is within easy driving distance of Philadelphia and Baltimore.
Economy
The economy of Ancient Oaks is largely based on agriculture and tourism. The town is home to a number of farms, which produce a variety of crops, including corn, soybeans, and wheat. The town is also home to a number of tourist attractions, including a historic covered bridge, a museum, and a number of outdoor activities.
Demographics
As of the 2010 census, the population of Ancient Oaks was 1,072. The town is predominantly white, with a small percentage of African Americans and Hispanics. The median household income is $45,000 and the median home value is $150,000. The town has a low unemployment rate and a high rate of home ownership.
Ancient Oaks is a small town with a rich history and a unique atmosphere. The town is home to a diverse population and a thriving economy. The town is a great place to live, work, and raise a family.
Common Questions
What is Per Capita Income in Ancient Oaks?
Per Capita income in Ancient Oaks is $53,029.
What is the Median Family Income in Ancient Oaks?
Median Family Income in Ancient Oaks is $139,118.
What is the Median Household income in Ancient Oaks?
Median Household Income in Ancient Oaks is $121,181.
What is Income or Wage Gap in Ancient Oaks?
Income or Wage Gap in Ancient Oaks is 51.7%.
Women in Ancient Oaks earn 48.3 cents for every dollar earned by a man.
What is Inequality or Gini Index in Ancient Oaks?
Inequality or Gini Index in Ancient Oaks is 0.39.
What is the Total Population of Ancient Oaks?
Total Population of Ancient Oaks is 7,363.
What is the Total Male Population of Ancient Oaks?
Total Male Population of Ancient Oaks is 3,518.
What is the Total Female Population of Ancient Oaks?
Total Female Population of Ancient Oaks is 3,845.
What is the Ratio of Males per 100 Females in Ancient Oaks?
There are 91.50 Males per 100 Females in Ancient Oaks.
What is the Ratio of Females per 100 Males in Ancient Oaks?
There are 109.30 Females per 100 Males in Ancient Oaks.
What is the Median Population Age in Ancient Oaks?
Median Population Age in Ancient Oaks is 42.2 Years.
What is the Average Family Size in Ancient Oaks
Average Family Size in Ancient Oaks is 3.3 People.
What is the Average Household Size in Ancient Oaks
Average Household Size in Ancient Oaks is 2.9 People.
How Large is the Labor Force in Ancient Oaks?
There are 3,735 People in the Labor Forcein in Ancient Oaks.
What is the Percentage of People in the Labor Force in Ancient Oaks?
70.2% of People are in the Labor Force in Ancient Oaks.
What is the Unemployment Rate in Ancient Oaks?
Unemployment Rate in Ancient Oaks is 2.1%.