Waller, PA Map & Demographics
Waller Map
Waller Overview
$36,577
PER CAPITA INCOME
0.63
INEQUALITY / GINI INDEX
69
TOTAL POPULATION
21
MALE POPULATION
48
FEMALE POPULATION
43.75
MALES / 100 FEMALES
228.57
FEMALES / 100 MALES
54.0
MEDIAN AGE
1.9
AVG FAMILY SIZE
1.7
AVG HOUSEHOLD SIZE
17
LABOR FORCE [ PEOPLE ]
27.9%
PERCENT IN LABOR FORCE
Income in Waller
Income Overview in Waller
| Characteristic | Number | Measure |
| Per Capita Income | 69 | $36,577 |
| Median Family Income | 32 | $0 |
| Mean Family Income | 32 | $210,103 |
| Median Household Income | 40 | $0 |
| Mean Household Income | 40 | $178,270 |
| Income Deficit | 32 | $0 |
| Wage / Income Gap (%) | 69 | 0.00% |
| Wage / Income Gap ($) | 69 | 100.00¢ per $1 |
| Gini / Inequality Index | 69 | 0.63 |
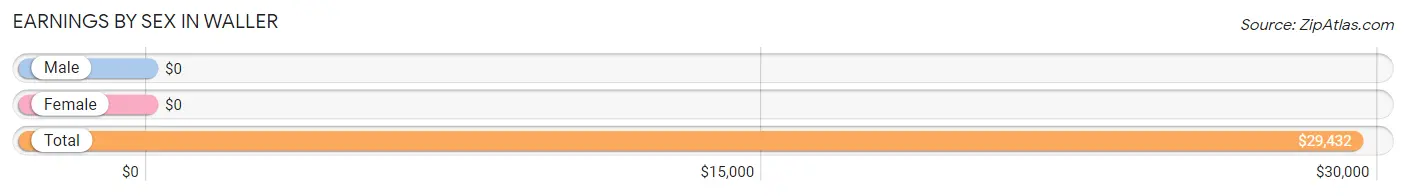
Earnings by Sex in Waller
| Sex | Number | Average Earnings |
| Male | 4 (23.5%) | $0 |
| Female | 13 (76.5%) | $0 |
| Total | 17 (100.0%) | $29,432 |
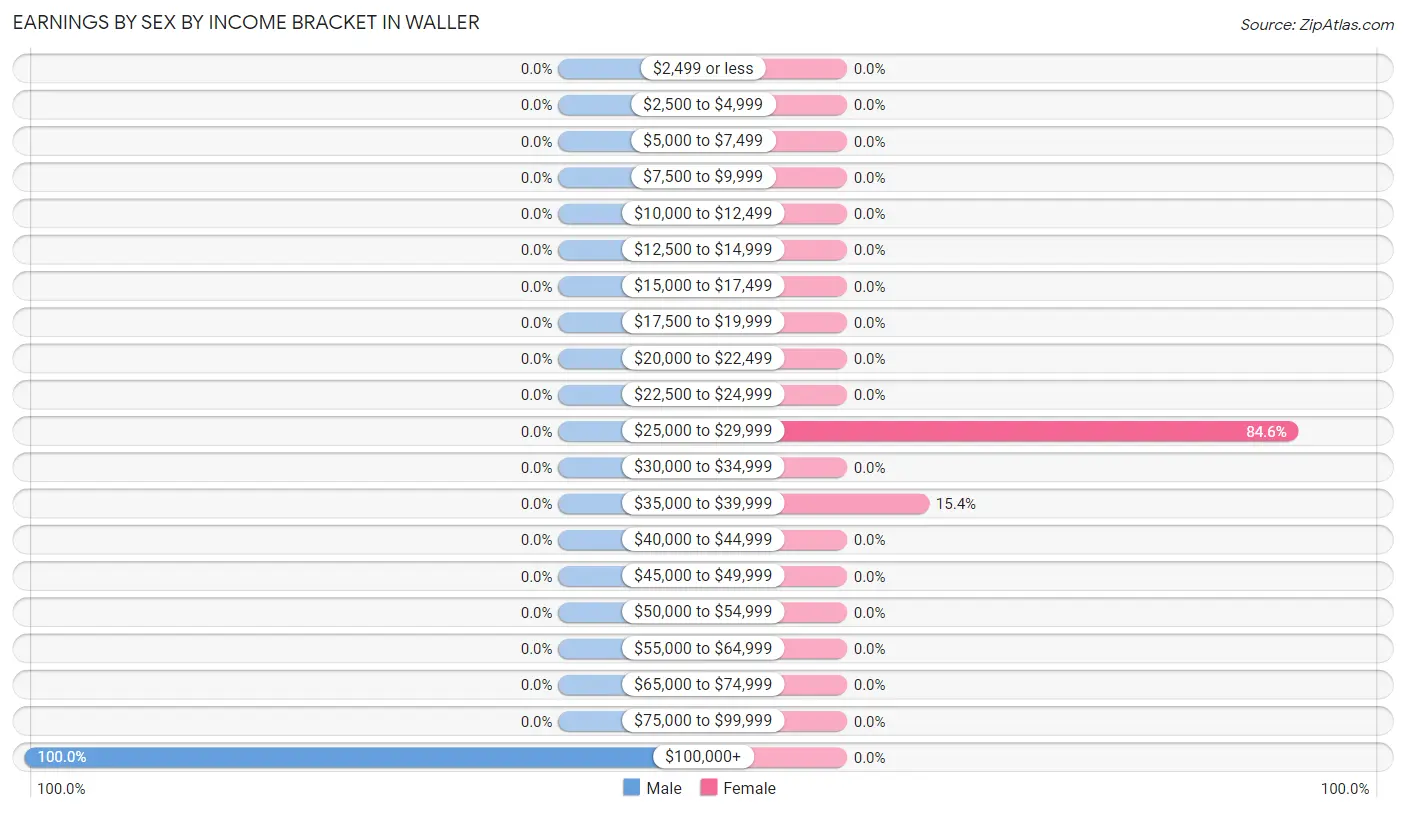
Earnings by Sex by Income Bracket in Waller
The most common earnings brackets in Waller are $100,000+ for men (4 | 100.0%) and $25,000 to $29,999 for women (11 | 84.6%).
| Income | Male | Female |
| $2,499 or less | 0 (0.0%) | 0 (0.0%) |
| $2,500 to $4,999 | 0 (0.0%) | 0 (0.0%) |
| $5,000 to $7,499 | 0 (0.0%) | 0 (0.0%) |
| $7,500 to $9,999 | 0 (0.0%) | 0 (0.0%) |
| $10,000 to $12,499 | 0 (0.0%) | 0 (0.0%) |
| $12,500 to $14,999 | 0 (0.0%) | 0 (0.0%) |
| $15,000 to $17,499 | 0 (0.0%) | 0 (0.0%) |
| $17,500 to $19,999 | 0 (0.0%) | 0 (0.0%) |
| $20,000 to $22,499 | 0 (0.0%) | 0 (0.0%) |
| $22,500 to $24,999 | 0 (0.0%) | 0 (0.0%) |
| $25,000 to $29,999 | 0 (0.0%) | 11 (84.6%) |
| $30,000 to $34,999 | 0 (0.0%) | 0 (0.0%) |
| $35,000 to $39,999 | 0 (0.0%) | 2 (15.4%) |
| $40,000 to $44,999 | 0 (0.0%) | 0 (0.0%) |
| $45,000 to $49,999 | 0 (0.0%) | 0 (0.0%) |
| $50,000 to $54,999 | 0 (0.0%) | 0 (0.0%) |
| $55,000 to $64,999 | 0 (0.0%) | 0 (0.0%) |
| $65,000 to $74,999 | 0 (0.0%) | 0 (0.0%) |
| $75,000 to $99,999 | 0 (0.0%) | 0 (0.0%) |
| $100,000+ | 4 (100.0%) | 0 (0.0%) |
| Total | 4 (100.0%) | 13 (100.0%) |
Earnings by Sex by Educational Attainment in Waller
| Educational Attainment | Male Income | Female Income |
| Less than High School | - | - |
| High School Diploma | - | - |
| College or Associate's Degree | - | - |
| Bachelor's Degree | - | - |
| Graduate Degree | - | - |
| Total | - | - |
Family Income in Waller
Family Income Brackets in Waller
According to the Waller family income data, there are 16 families falling into the $10,000 to $14,999 income range, which is the most common income bracket and makes up 50.0% of all families.
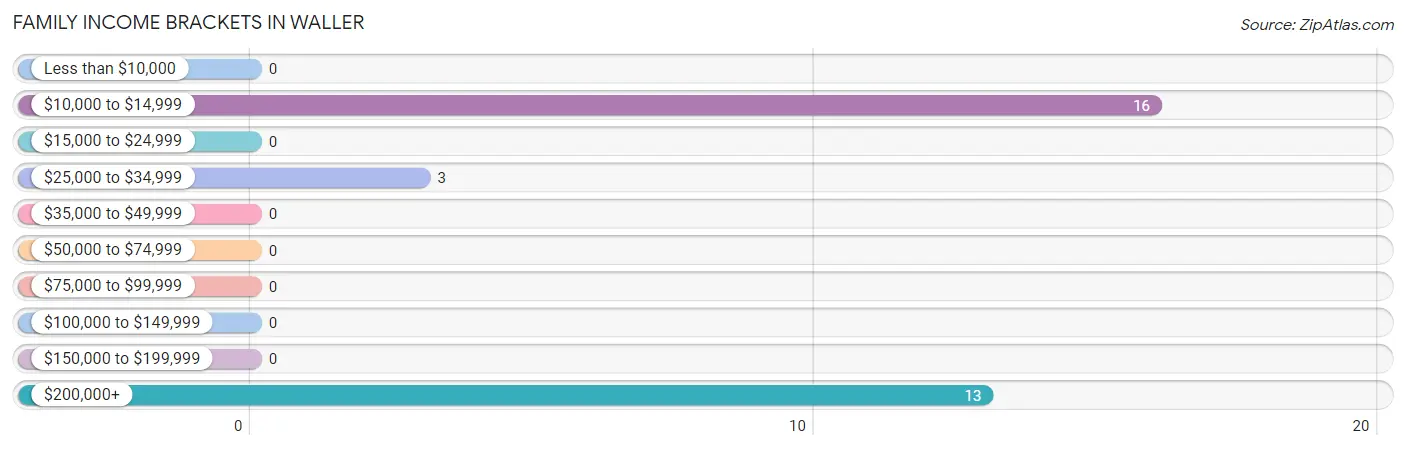
| Income Bracket | # Families | % Families |
| Less than $10,000 | 0 | 0.0% |
| $10,000 to $14,999 | 16 | 50.0% |
| $15,000 to $24,999 | 0 | 0.0% |
| $25,000 to $34,999 | 3 | 9.4% |
| $35,000 to $49,999 | 0 | 0.0% |
| $50,000 to $74,999 | 0 | 0.0% |
| $75,000 to $99,999 | 0 | 0.0% |
| $100,000 to $149,999 | 0 | 0.0% |
| $150,000 to $199,999 | 0 | 0.0% |
| $200,000+ | 13 | 40.6% |
Family Income by Famaliy Size in Waller
2-person families (21 | 65.6%) account for the highest median family income in Waller with $14,141 per family, while 2-person families (21 | 65.6%) have the highest median income of $7,070 per family member.
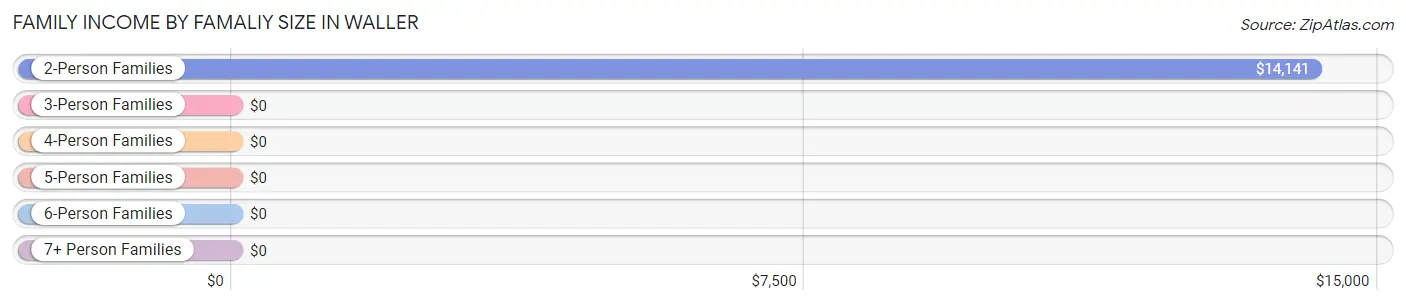
| Income Bracket | # Families | Median Income |
| 2-Person Families | 21 (65.6%) | $14,141 |
| 3-Person Families | 11 (34.4%) | $0 |
| 4-Person Families | 0 (0.0%) | $0 |
| 5-Person Families | 0 (0.0%) | $0 |
| 6-Person Families | 0 (0.0%) | $0 |
| 7+ Person Families | 0 (0.0%) | $0 |
| Total | 32 (100.0%) | $0 |
Family Income by Number of Earners in Waller
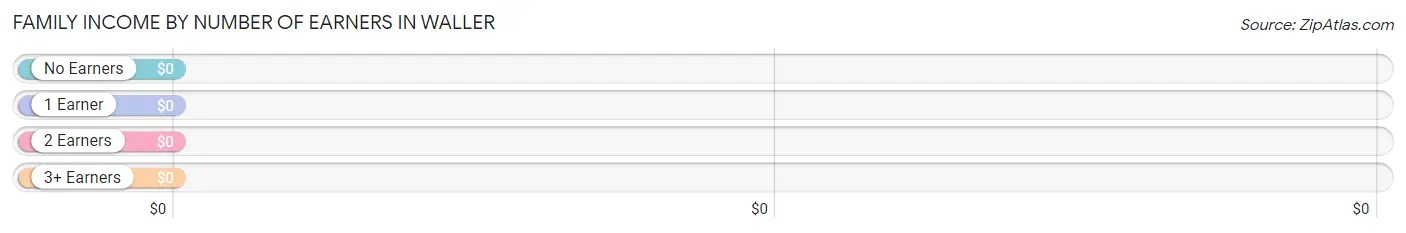
| Number of Earners | # Families | Median Income |
| No Earners | 19 (59.4%) | $0 |
| 1 Earner | 0 (0.0%) | $0 |
| 2 Earners | 13 (40.6%) | $0 |
| 3+ Earners | 0 (0.0%) | $0 |
| Total | 32 (100.0%) | $0 |
Household Income in Waller
Household Income Brackets in Waller
With 16 households falling in the category, the $10,000 to $14,999 income range is the most frequent in Waller, accounting for 40.0% of all households.
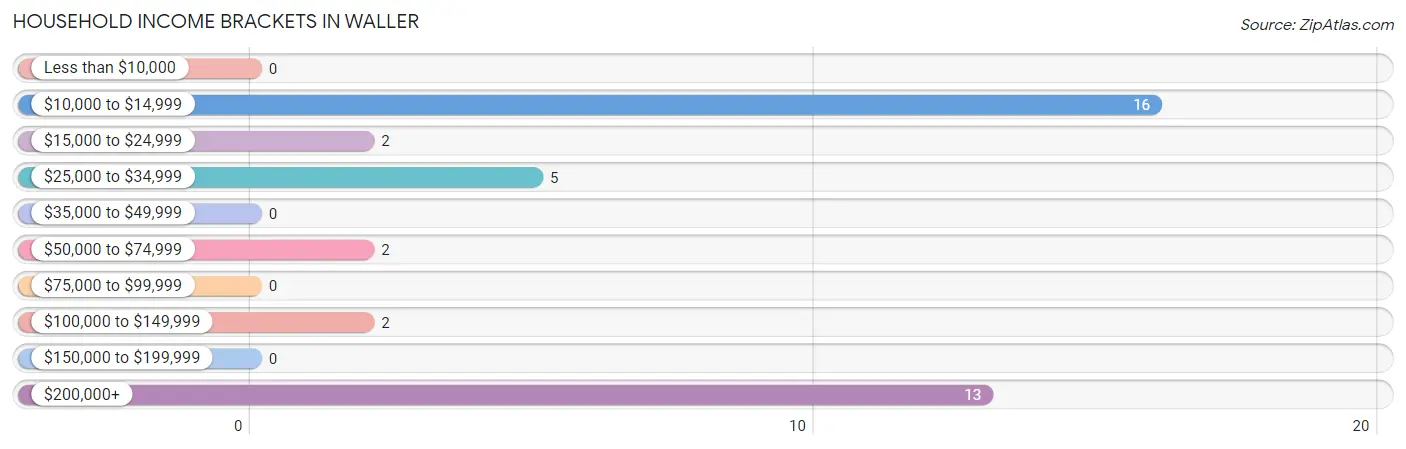
| Income Bracket | # Households | % Households |
| Less than $10,000 | 0 | 0.0% |
| $10,000 to $14,999 | 16 | 40.0% |
| $15,000 to $24,999 | 2 | 5.0% |
| $25,000 to $34,999 | 5 | 12.5% |
| $35,000 to $49,999 | 0 | 0.0% |
| $50,000 to $74,999 | 2 | 5.0% |
| $75,000 to $99,999 | 0 | 0.0% |
| $100,000 to $149,999 | 2 | 5.0% |
| $150,000 to $199,999 | 0 | 0.0% |
| $200,000+ | 13 | 32.5% |
Household Income by Householder Age in Waller
The median household income in Waller is $0, with the highest median household income of $31,250 found in the 65+ years age bracket for the primary householder. A total of 11 households (27.5%) fall into this category. Meanwhile, the 15 to 24 years age bracket for the primary householder has the lowest median household income of $0, with 11 households (27.5%) in this group.
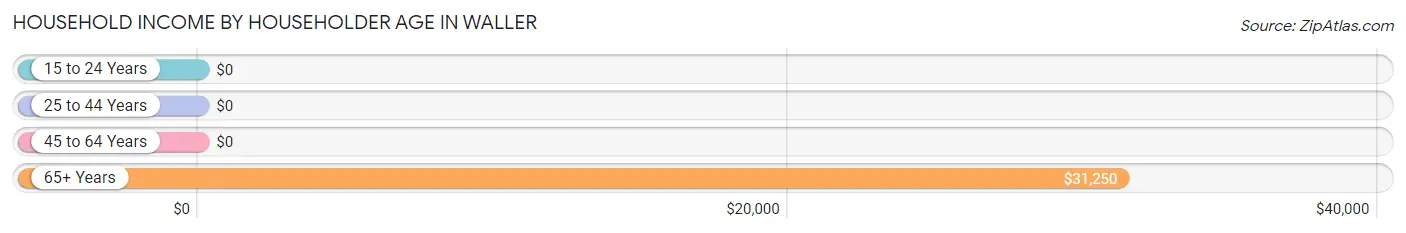
| Income Bracket | # Households | Median Income |
| 15 to 24 Years | 11 (27.5%) | $0 |
| 25 to 44 Years | 0 (0.0%) | $0 |
| 45 to 64 Years | 18 (45.0%) | $0 |
| 65+ Years | 11 (27.5%) | $31,250 |
| Total | 40 (100.0%) | $0 |
Poverty in Waller
Income Below Poverty by Sex and Age in Waller
With 61.9% poverty level for males and 33.3% for females among the residents of Waller, 18 to 24 year old males and 45 to 54 year old females are the most vulnerable to poverty, with 13 males (86.7%) and 16 females (100.0%) in their respective age groups living below the poverty level.
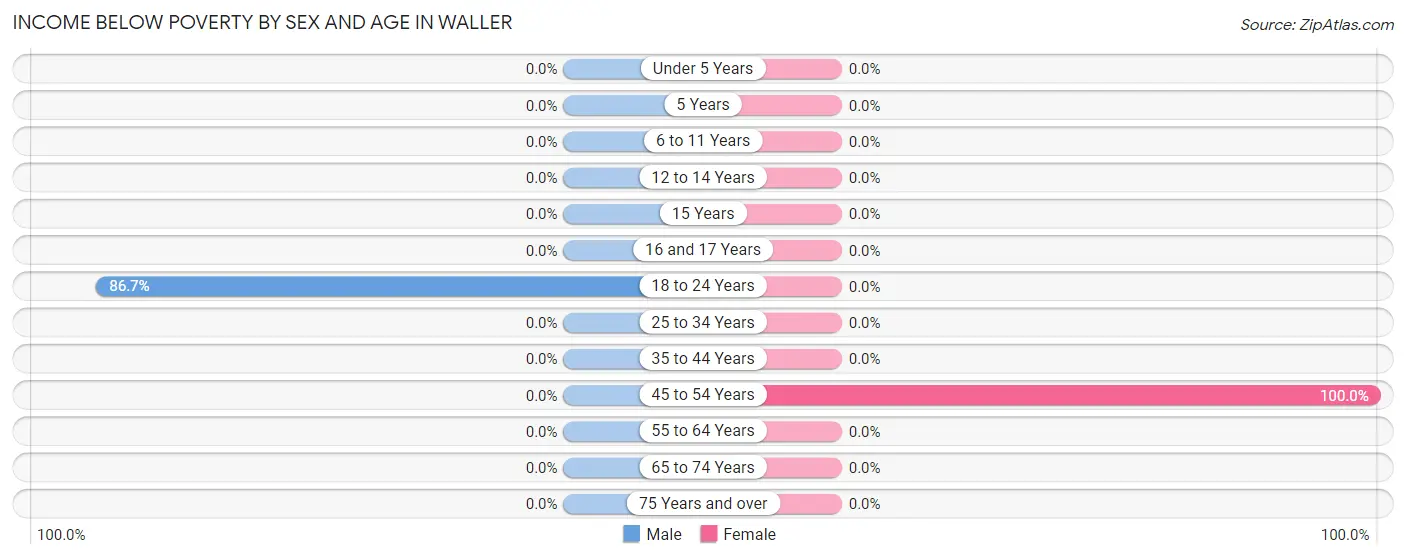
| Age Bracket | Male | Female |
| Under 5 Years | 0 (0.0%) | 0 (0.0%) |
| 5 Years | 0 (0.0%) | 0 (0.0%) |
| 6 to 11 Years | 0 (0.0%) | 0 (0.0%) |
| 12 to 14 Years | 0 (0.0%) | 0 (0.0%) |
| 15 Years | 0 (0.0%) | 0 (0.0%) |
| 16 and 17 Years | 0 (0.0%) | 0 (0.0%) |
| 18 to 24 Years | 13 (86.7%) | 0 (0.0%) |
| 25 to 34 Years | 0 (0.0%) | 0 (0.0%) |
| 35 to 44 Years | 0 (0.0%) | 0 (0.0%) |
| 45 to 54 Years | 0 (0.0%) | 16 (100.0%) |
| 55 to 64 Years | 0 (0.0%) | 0 (0.0%) |
| 65 to 74 Years | 0 (0.0%) | 0 (0.0%) |
| 75 Years and over | 0 (0.0%) | 0 (0.0%) |
| Total | 13 (61.9%) | 16 (33.3%) |
Income Above Poverty by Sex and Age in Waller
According to the poverty statistics in Waller, males aged 55 to 64 years and females aged under 5 years are the age groups that are most secure financially, with 100.0% of males and 100.0% of females in these age groups living above the poverty line.
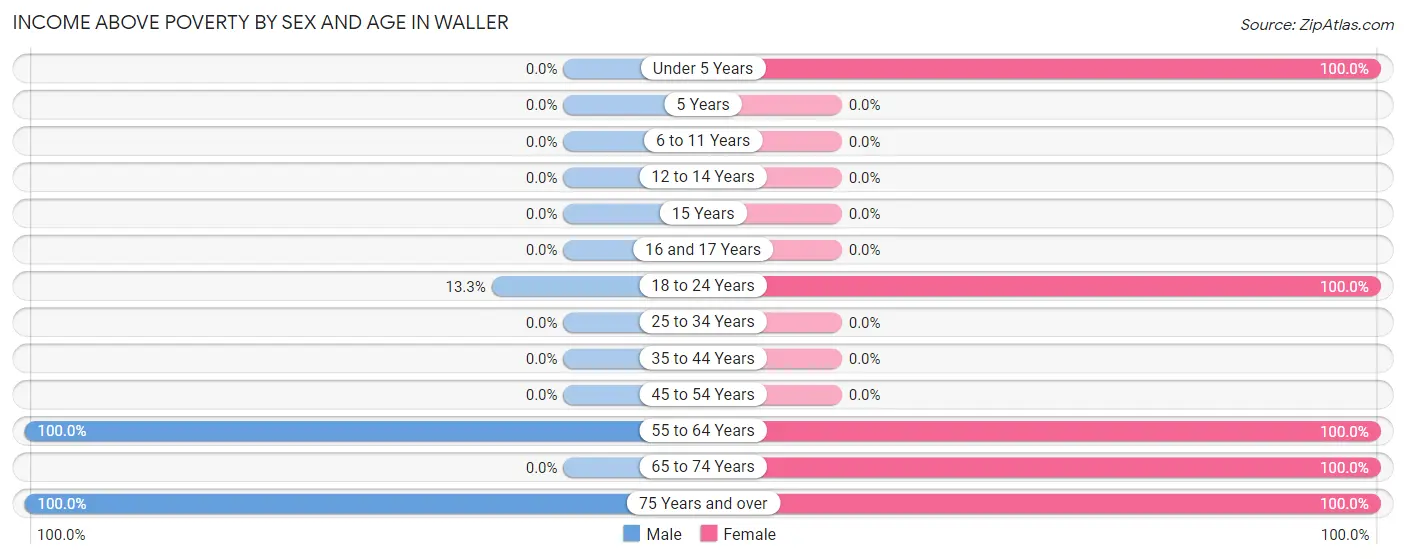
| Age Bracket | Male | Female |
| Under 5 Years | 0 (0.0%) | 8 (100.0%) |
| 5 Years | 0 (0.0%) | 0 (0.0%) |
| 6 to 11 Years | 0 (0.0%) | 0 (0.0%) |
| 12 to 14 Years | 0 (0.0%) | 0 (0.0%) |
| 15 Years | 0 (0.0%) | 0 (0.0%) |
| 16 and 17 Years | 0 (0.0%) | 0 (0.0%) |
| 18 to 24 Years | 2 (13.3%) | 11 (100.0%) |
| 25 to 34 Years | 0 (0.0%) | 0 (0.0%) |
| 35 to 44 Years | 0 (0.0%) | 0 (0.0%) |
| 45 to 54 Years | 0 (0.0%) | 0 (0.0%) |
| 55 to 64 Years | 2 (100.0%) | 2 (100.0%) |
| 65 to 74 Years | 0 (0.0%) | 4 (100.0%) |
| 75 Years and over | 4 (100.0%) | 7 (100.0%) |
| Total | 8 (38.1%) | 32 (66.7%) |
Income Below Poverty Among Married-Couple Families in Waller
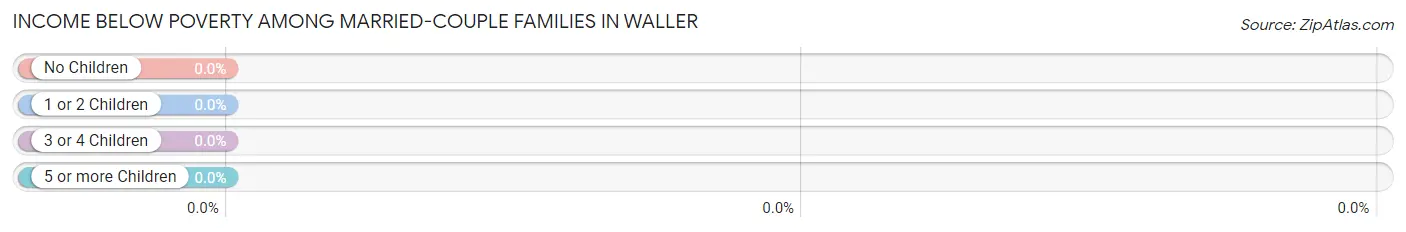
| Children | Above Poverty | Below Poverty |
| No Children | 2 (100.0%) | 0 (0.0%) |
| 1 or 2 Children | 11 (100.0%) | 0 (0.0%) |
| 3 or 4 Children | 0 (0.0%) | 0 (0.0%) |
| 5 or more Children | 0 (0.0%) | 0 (0.0%) |
| Total | 13 (100.0%) | 0 (0.0%) |
Income Below Poverty Among Single-Parent Households in Waller
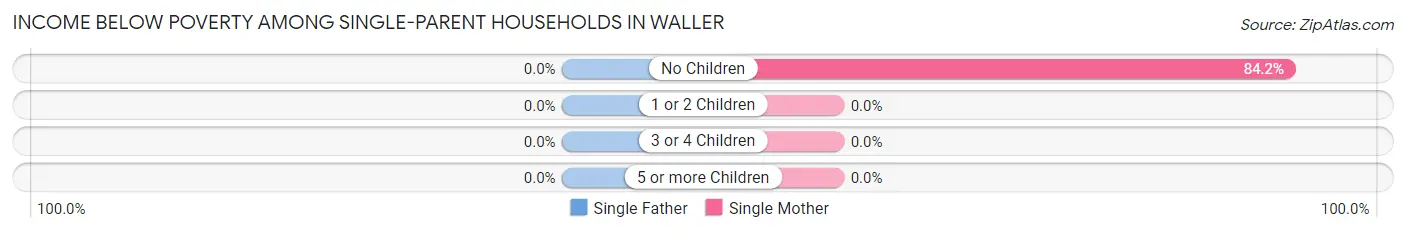
| Children | Single Father | Single Mother |
| No Children | 0 (0.0%) | 16 (84.2%) |
| 1 or 2 Children | 0 (0.0%) | 0 (0.0%) |
| 3 or 4 Children | 0 (0.0%) | 0 (0.0%) |
| 5 or more Children | 0 (0.0%) | 0 (0.0%) |
| Total | 0 (0.0%) | 16 (84.2%) |
Income Below Poverty Among Married-Couple vs Single-Parent Households in Waller
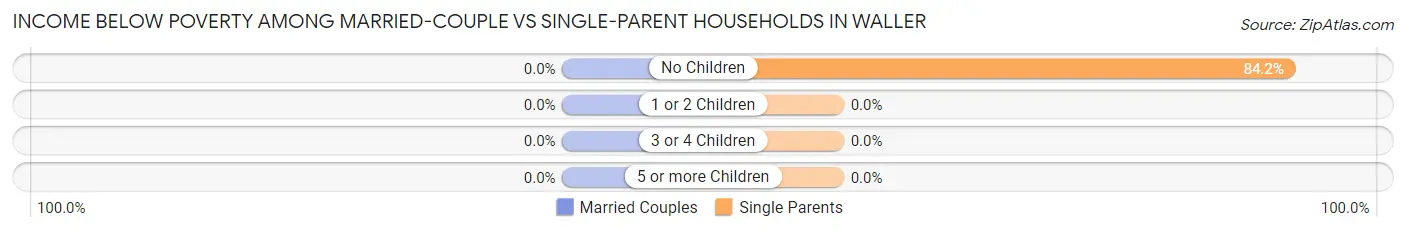
| Children | Married-Couple Families | Single-Parent Households |
| No Children | 0 (0.0%) | 16 (84.2%) |
| 1 or 2 Children | 0 (0.0%) | 0 (0.0%) |
| 3 or 4 Children | 0 (0.0%) | 0 (0.0%) |
| 5 or more Children | 0 (0.0%) | 0 (0.0%) |
| Total | 0 (0.0%) | 16 (84.2%) |
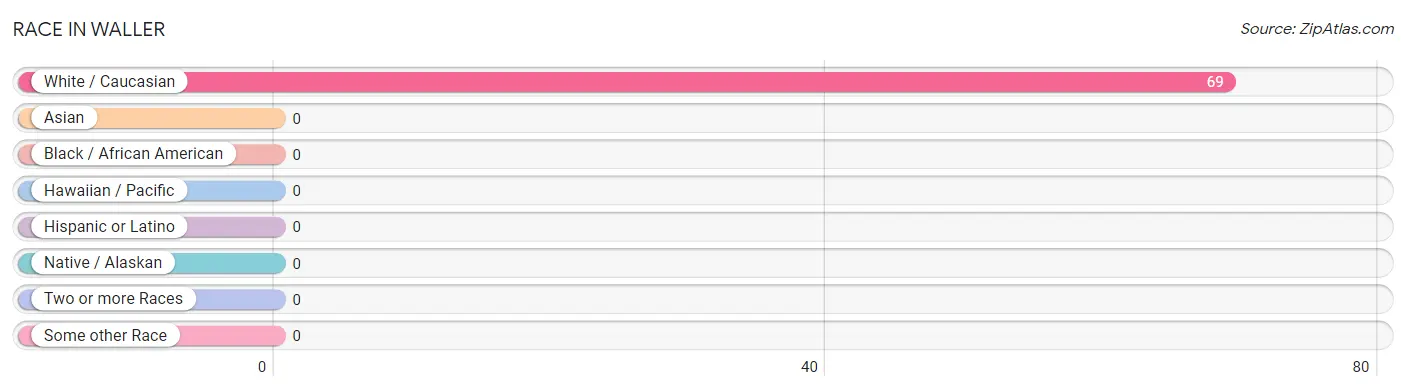
Race in Waller
The most populous races in Waller are , and White / Caucasian (69 | 100.0%).
| Race | # Population | % Population |
| Asian | 0 | 0.0% |
| Black / African American | 0 | 0.0% |
| Hawaiian / Pacific | 0 | 0.0% |
| Hispanic or Latino | 0 | 0.0% |
| Native / Alaskan | 0 | 0.0% |
| White / Caucasian | 69 | 100.0% |
| Two or more Races | 0 | 0.0% |
| Some other Race | 0 | 0.0% |
| Total | 69 | 100.0% |
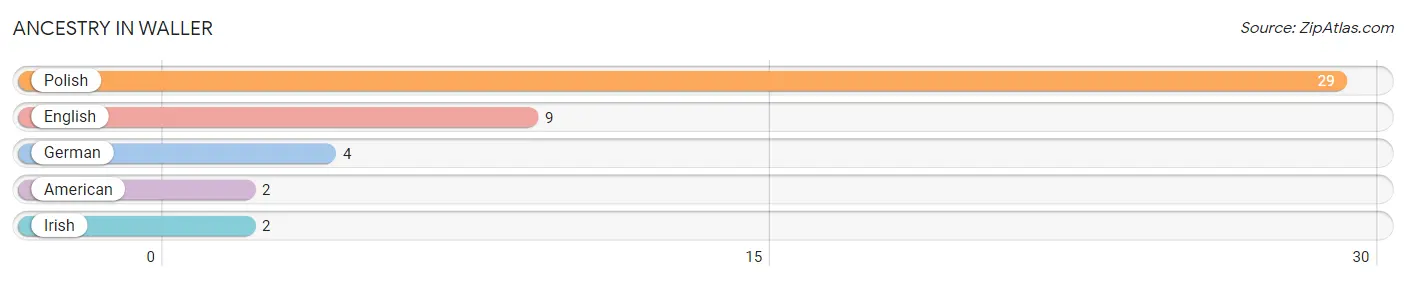
Ancestry in Waller
The most populous ancestries reported in Waller are Polish (29 | 42.0%), English (9 | 13.0%), German (4 | 5.8%), American (2 | 2.9%), and Irish (2 | 2.9%), together accounting for 66.7% of all Waller residents.
| Ancestry | # Population | % Population |
| American | 2 | 2.9% |
| English | 9 | 13.0% |
| German | 4 | 5.8% |
| Irish | 2 | 2.9% |
| Polish | 29 | 42.0% | View All 5 Rows |
Immigrants in Waller

| Immigration Origin | # Population | % Population | View All 0 Rows |
Sex and Age in Waller
Sex and Age in Waller
The most populous age groups in Waller are 15 to 19 Years (13 | 61.9%) for men and 50 to 54 Years (16 | 33.3%) for women.
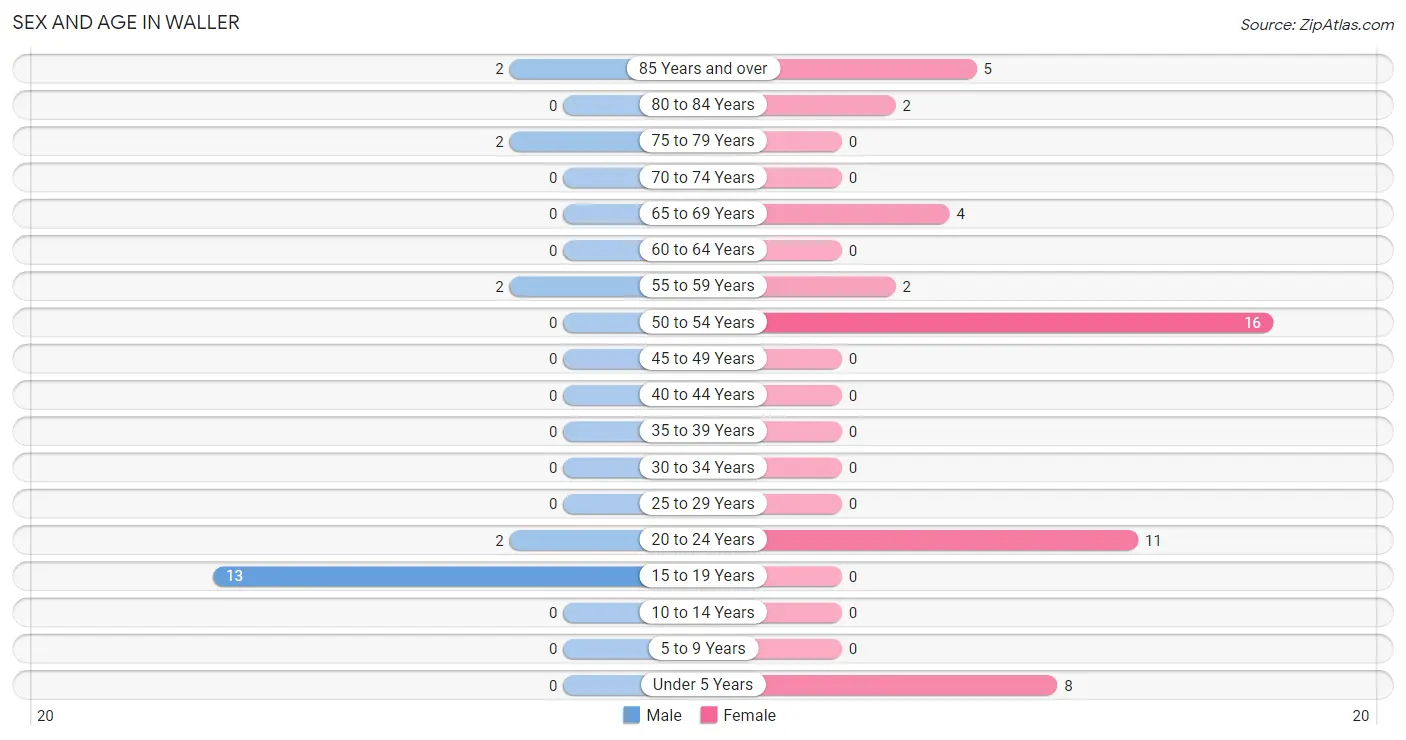
| Age Bracket | Male | Female |
| Under 5 Years | 0 (0.0%) | 8 (16.7%) |
| 5 to 9 Years | 0 (0.0%) | 0 (0.0%) |
| 10 to 14 Years | 0 (0.0%) | 0 (0.0%) |
| 15 to 19 Years | 13 (61.9%) | 0 (0.0%) |
| 20 to 24 Years | 2 (9.5%) | 11 (22.9%) |
| 25 to 29 Years | 0 (0.0%) | 0 (0.0%) |
| 30 to 34 Years | 0 (0.0%) | 0 (0.0%) |
| 35 to 39 Years | 0 (0.0%) | 0 (0.0%) |
| 40 to 44 Years | 0 (0.0%) | 0 (0.0%) |
| 45 to 49 Years | 0 (0.0%) | 0 (0.0%) |
| 50 to 54 Years | 0 (0.0%) | 16 (33.3%) |
| 55 to 59 Years | 2 (9.5%) | 2 (4.2%) |
| 60 to 64 Years | 0 (0.0%) | 0 (0.0%) |
| 65 to 69 Years | 0 (0.0%) | 4 (8.3%) |
| 70 to 74 Years | 0 (0.0%) | 0 (0.0%) |
| 75 to 79 Years | 2 (9.5%) | 0 (0.0%) |
| 80 to 84 Years | 0 (0.0%) | 2 (4.2%) |
| 85 Years and over | 2 (9.5%) | 5 (10.4%) |
| Total | 21 (100.0%) | 48 (100.0%) |
Families and Households in Waller
Median Family Size in Waller
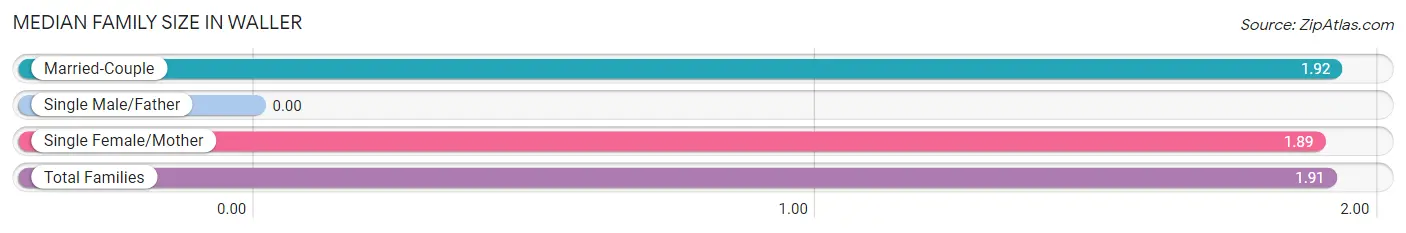
| Family Type | # Families | Family Size |
| Married-Couple | 13 (40.6%) | 1.92 |
| Single Male/Father | 0 (0.0%) | - |
| Single Female/Mother | 19 (59.4%) | 1.89 |
| Total Families | 32 (100.0%) | 1.91 |
Median Household Size in Waller
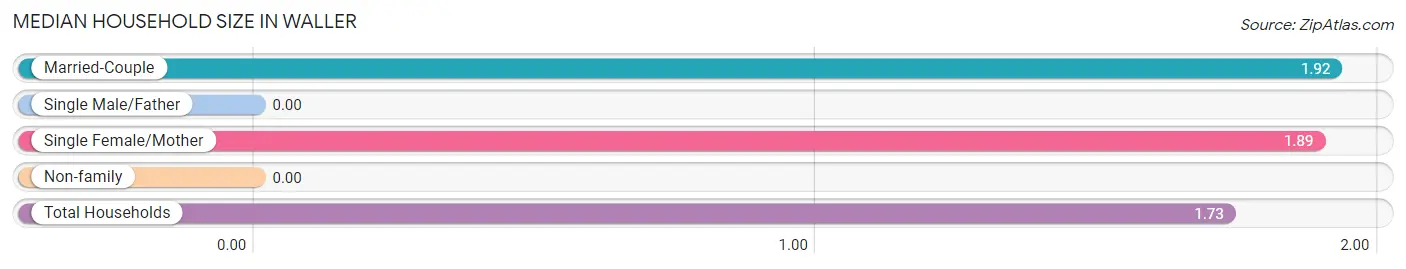
| Household Type | # Households | Household Size |
| Married-Couple | 13 (32.5%) | 1.92 |
| Single Male/Father | 0 (0.0%) | - |
| Single Female/Mother | 19 (47.5%) | 1.89 |
| Non-family | 8 (20.0%) | - |
| Total Households | 40 (100.0%) | 1.73 |
Household Size by Marriage Status in Waller
Out of a total of 40 households in Waller, 32 (80.0%) are family households, while 8 (20.0%) are nonfamily households. The most numerous type of family households are 2-person households, comprising 21, and the most common type of nonfamily households are 1-person households, comprising 8.
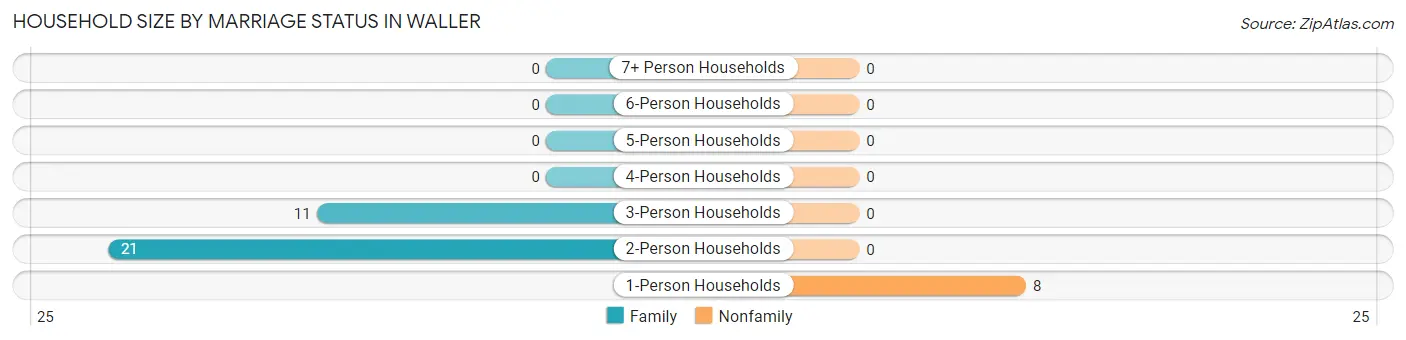
| Household Size | Family Households | Nonfamily Households |
| 1-Person Households | - | 8 (20.0%) |
| 2-Person Households | 21 (52.5%) | 0 (0.0%) |
| 3-Person Households | 11 (27.5%) | 0 (0.0%) |
| 4-Person Households | 0 (0.0%) | 0 (0.0%) |
| 5-Person Households | 0 (0.0%) | 0 (0.0%) |
| 6-Person Households | 0 (0.0%) | 0 (0.0%) |
| 7+ Person Households | 0 (0.0%) | 0 (0.0%) |
| Total | 32 (80.0%) | 8 (20.0%) |
Female Fertility in Waller
Fertility by Age in Waller
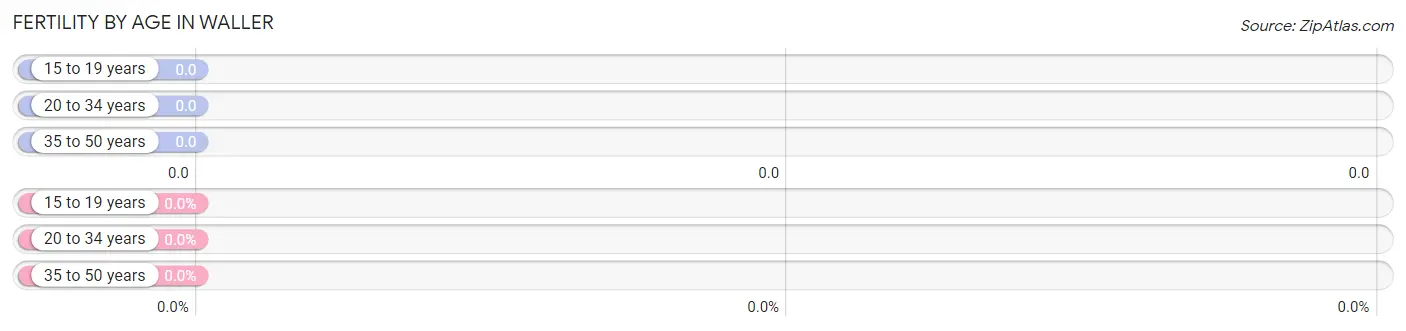
| Age Bracket | Women with Births | Births / 1,000 Women |
| 15 to 19 years | 0 (0.0%) | 0.0 |
| 20 to 34 years | 0 (0.0%) | 0.0 |
| 35 to 50 years | 0 (0.0%) | 0.0 |
| Total | 0 (0.0%) | 0.0 |
Fertility by Age by Marriage Status in Waller
| Age Bracket | Married | Unmarried |
| 15 to 19 years | 0 (0.0%) | 0 (0.0%) |
| 20 to 34 years | 0 (0.0%) | 0 (0.0%) |
| 35 to 50 years | 0 (0.0%) | 0 (0.0%) |
| Total | 0 (0.0%) | 0 (0.0%) |
Fertility by Education in Waller
| Educational Attainment | Women with Births | Births / 1,000 Women |
| Less than High School | 0 (0.0%) | 0.0 |
| High School Diploma | 0 (0.0%) | 0.0 |
| College or Associate's Degree | 0 (0.0%) | 0.0 |
| Bachelor's Degree | 0 (0.0%) | 0.0 |
| Graduate Degree | 0 (0.0%) | 0.0 |
| Total | 0 (0.0%) | 0.0 |
Fertility by Education by Marriage Status in Waller
| Educational Attainment | Married | Unmarried |
| Less than High School | 0 (0.0%) | 0 (0.0%) |
| High School Diploma | 0 (0.0%) | 0 (0.0%) |
| College or Associate's Degree | 0 (0.0%) | 0 (0.0%) |
| Bachelor's Degree | 0 (0.0%) | 0 (0.0%) |
| Graduate Degree | 0 (0.0%) | 0 (0.0%) |
| Total | 0 (0.0%) | 0 (0.0%) |
Employment Characteristics in Waller
Employment by Class of Employer in Waller
Among the 17 employed individuals in Waller, private company employees (15 | 88.2%), and self-employed (incorporated) (2 | 11.8%) make up the most common classes of employment.
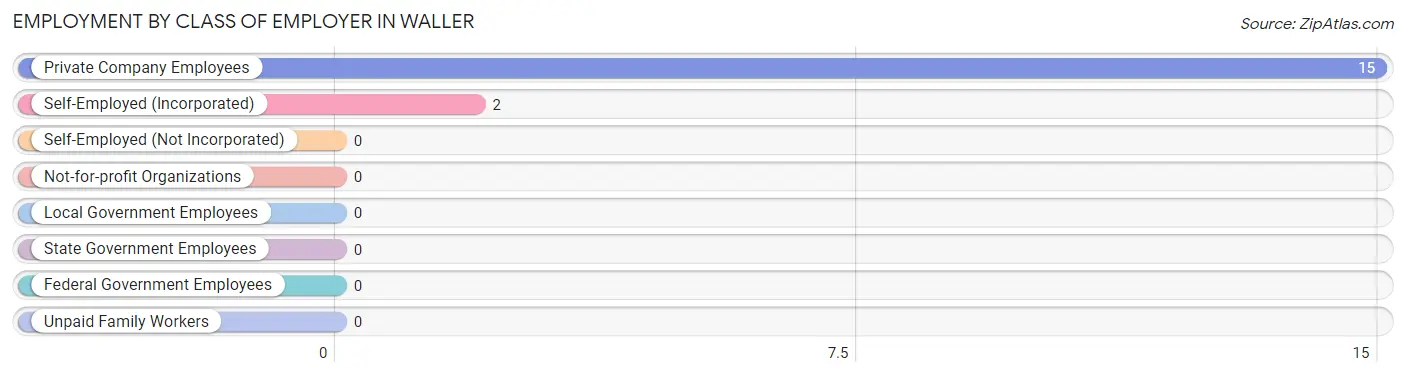
| Employer Class | # Employees | % Employees |
| Private Company Employees | 15 | 88.2% |
| Self-Employed (Incorporated) | 2 | 11.8% |
| Self-Employed (Not Incorporated) | 0 | 0.0% |
| Not-for-profit Organizations | 0 | 0.0% |
| Local Government Employees | 0 | 0.0% |
| State Government Employees | 0 | 0.0% |
| Federal Government Employees | 0 | 0.0% |
| Unpaid Family Workers | 0 | 0.0% |
| Total | 17 | 100.0% |
Employment Status by Age in Waller
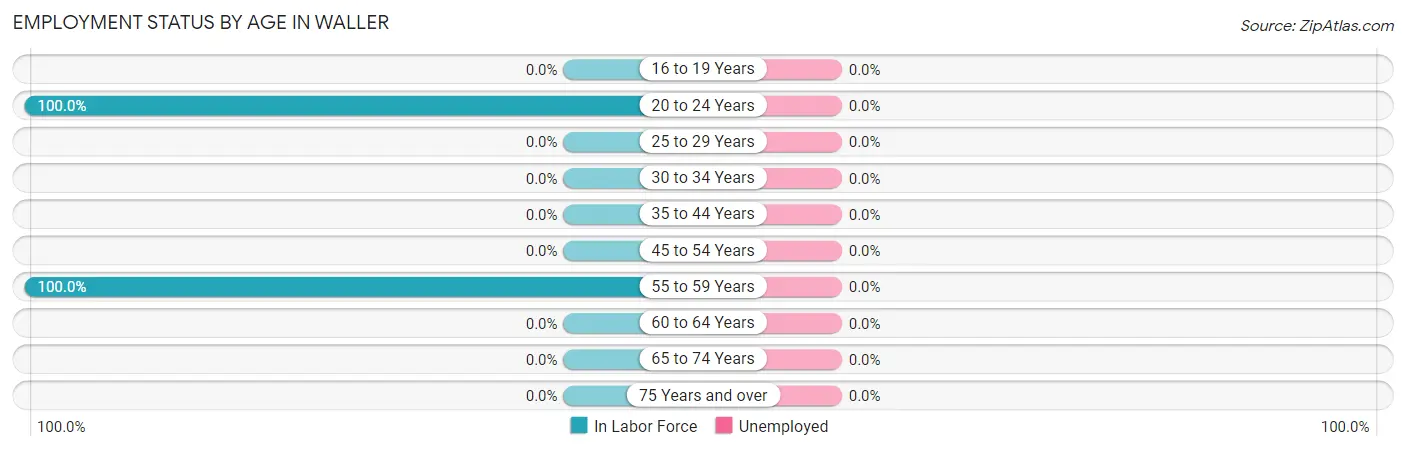
| Age Bracket | In Labor Force | Unemployed |
| 16 to 19 Years | 0 (0.0%) | 0 (0.0%) |
| 20 to 24 Years | 13 (100.0%) | 0 (0.0%) |
| 25 to 29 Years | 0 (0.0%) | 0 (0.0%) |
| 30 to 34 Years | 0 (0.0%) | 0 (0.0%) |
| 35 to 44 Years | 0 (0.0%) | 0 (0.0%) |
| 45 to 54 Years | 0 (0.0%) | 0 (0.0%) |
| 55 to 59 Years | 4 (100.0%) | 0 (0.0%) |
| 60 to 64 Years | 0 (0.0%) | 0 (0.0%) |
| 65 to 74 Years | 0 (0.0%) | 0 (0.0%) |
| 75 Years and over | 0 (0.0%) | 0 (0.0%) |
| Total | 17 (27.9%) | 0 (0.0%) |
Employment Status by Educational Attainment in Waller
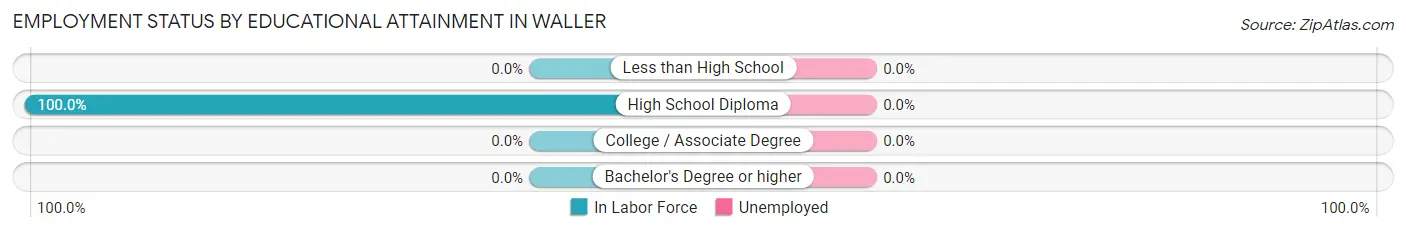
| Educational Attainment | In Labor Force | Unemployed |
| Less than High School | 0 (0.0%) | 0 (0.0%) |
| High School Diploma | 4 (100.0%) | 0 (0.0%) |
| College / Associate Degree | 0 (0.0%) | 0 (0.0%) |
| Bachelor's Degree or higher | 0 (0.0%) | 0 (0.0%) |
| Total | 4 (20.0%) | 0 (0.0%) |
Employment Occupations by Sex in Waller
Management, Business, Science and Arts Occupations
The most common Management, Business, Science and Arts occupations in Waller are Management (2 | 11.8%), and Health Diagnosing & Treating (2 | 11.8%).
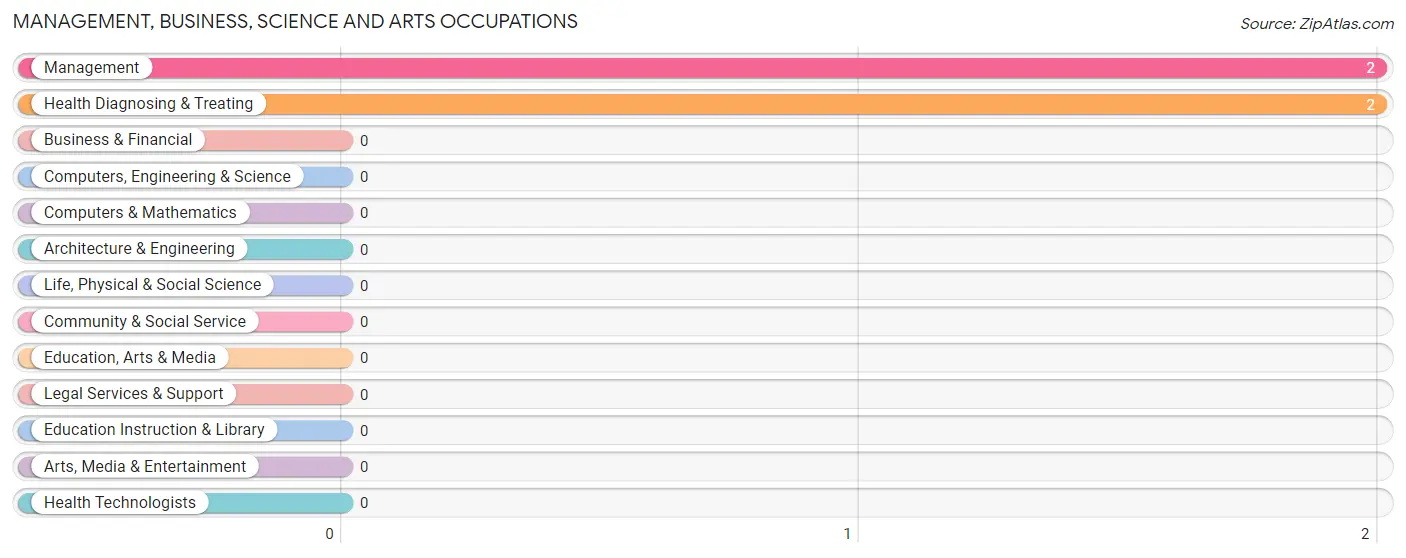
Management, Business, Science and Arts Occupations by Sex
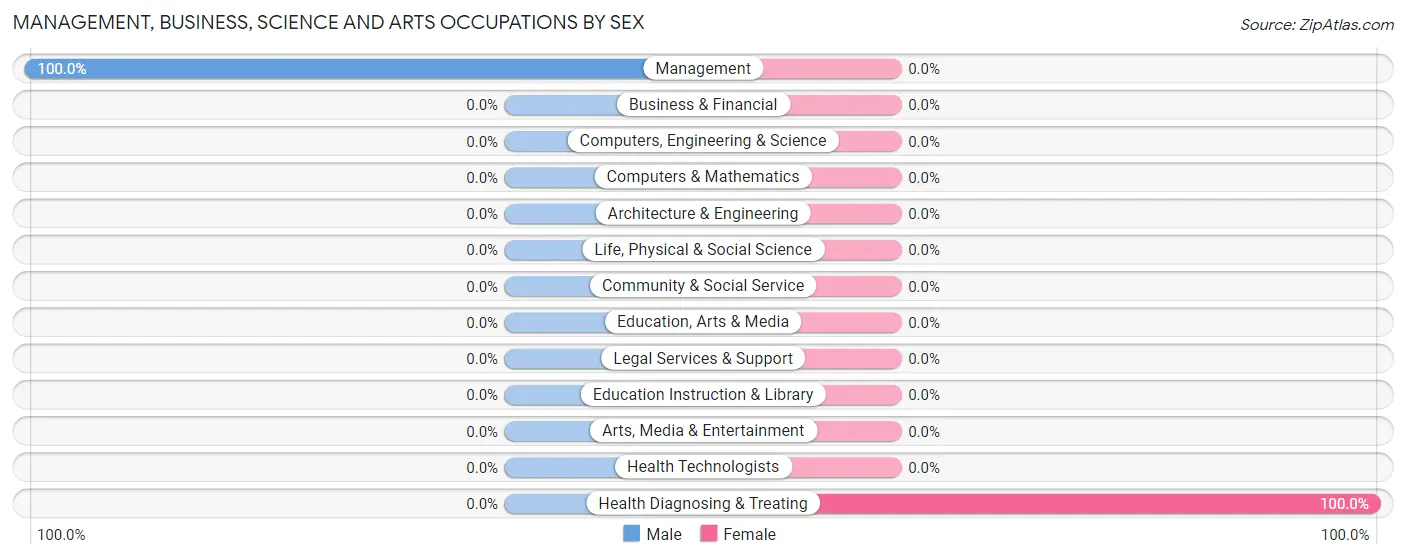
| Occupation | Male | Female |
| Management | 2 (100.0%) | 0 (0.0%) |
| Business & Financial | 0 (0.0%) | 0 (0.0%) |
| Computers, Engineering & Science | 0 (0.0%) | 0 (0.0%) |
| Computers & Mathematics | 0 (0.0%) | 0 (0.0%) |
| Architecture & Engineering | 0 (0.0%) | 0 (0.0%) |
| Life, Physical & Social Science | 0 (0.0%) | 0 (0.0%) |
| Community & Social Service | 0 (0.0%) | 0 (0.0%) |
| Education, Arts & Media | 0 (0.0%) | 0 (0.0%) |
| Legal Services & Support | 0 (0.0%) | 0 (0.0%) |
| Education Instruction & Library | 0 (0.0%) | 0 (0.0%) |
| Arts, Media & Entertainment | 0 (0.0%) | 0 (0.0%) |
| Health Diagnosing & Treating | 0 (0.0%) | 2 (100.0%) |
| Health Technologists | 0 (0.0%) | 0 (0.0%) |
| Total (Category) | 2 (50.0%) | 2 (50.0%) |
| Total (Overall) | 4 (23.5%) | 13 (76.5%) |
Services Occupations
The most common Services occupations in Waller are , and Healthcare Support (11 | 64.7%).
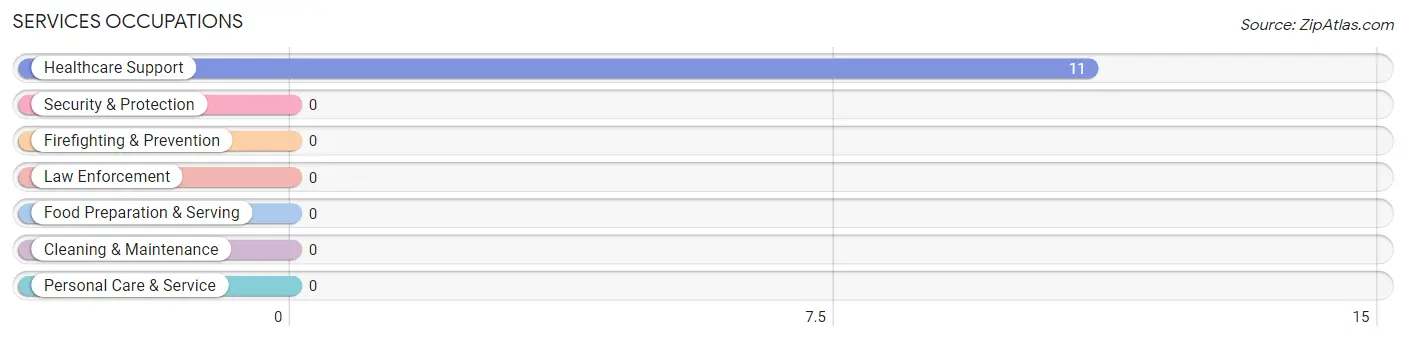
Services Occupations by Sex
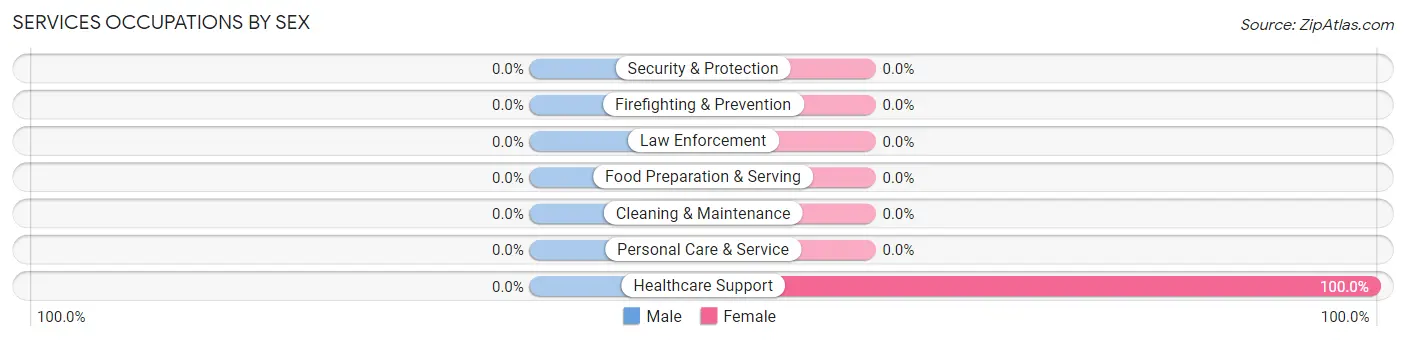
| Occupation | Male | Female |
| Healthcare Support | 0 (0.0%) | 11 (100.0%) |
| Security & Protection | 0 (0.0%) | 0 (0.0%) |
| Firefighting & Prevention | 0 (0.0%) | 0 (0.0%) |
| Law Enforcement | 0 (0.0%) | 0 (0.0%) |
| Food Preparation & Serving | 0 (0.0%) | 0 (0.0%) |
| Cleaning & Maintenance | 0 (0.0%) | 0 (0.0%) |
| Personal Care & Service | 0 (0.0%) | 0 (0.0%) |
| Total (Category) | 0 (0.0%) | 11 (100.0%) |
| Total (Overall) | 4 (23.5%) | 13 (76.5%) |
Sales and Office Occupations
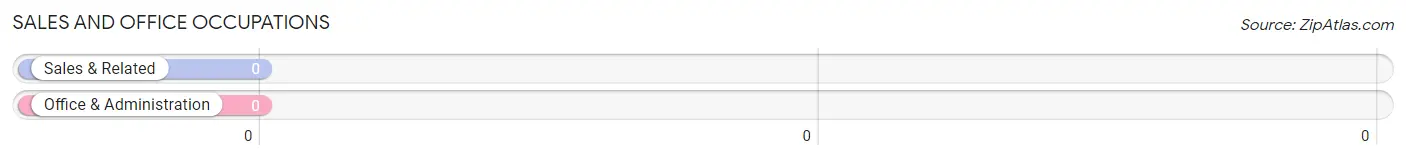
Sales and Office Occupations by Sex
| Occupation | Male | Female |
| Sales & Related | 0 (0.0%) | 0 (0.0%) |
| Office & Administration | 0 (0.0%) | 0 (0.0%) |
| Total (Category) | 0 (0.0%) | 0 (0.0%) |
| Total (Overall) | 4 (23.5%) | 13 (76.5%) |
Natural Resources, Construction and Maintenance Occupations
The most common Natural Resources, Construction and Maintenance occupations in Waller are , and Construction & Extraction (2 | 11.8%).
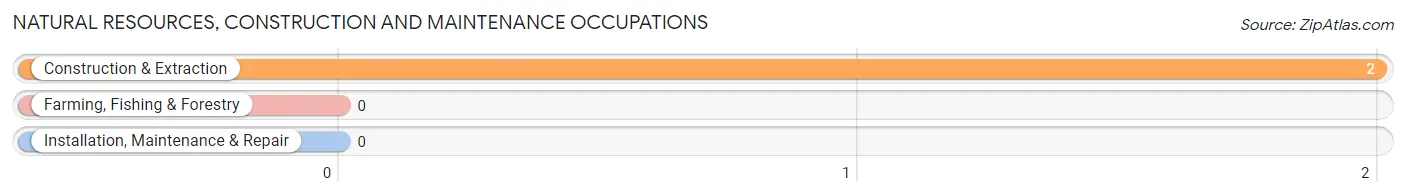
Natural Resources, Construction and Maintenance Occupations by Sex
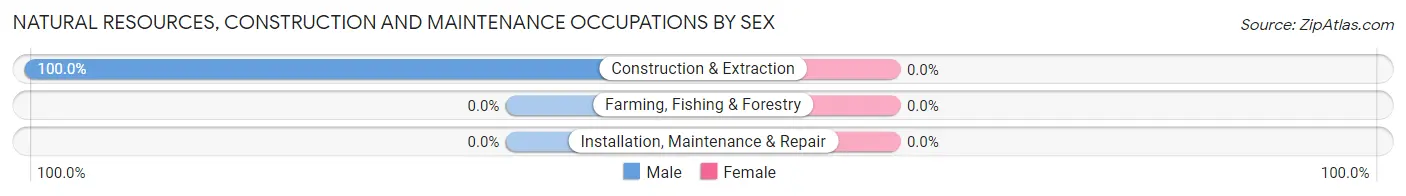
| Occupation | Male | Female |
| Farming, Fishing & Forestry | 0 (0.0%) | 0 (0.0%) |
| Construction & Extraction | 2 (100.0%) | 0 (0.0%) |
| Installation, Maintenance & Repair | 0 (0.0%) | 0 (0.0%) |
| Total (Category) | 2 (100.0%) | 0 (0.0%) |
| Total (Overall) | 4 (23.5%) | 13 (76.5%) |
Production, Transportation and Moving Occupations
Production, Transportation and Moving Occupations by Sex
| Occupation | Male | Female |
| Production | 0 (0.0%) | 0 (0.0%) |
| Transportation | 0 (0.0%) | 0 (0.0%) |
| Material Moving | 0 (0.0%) | 0 (0.0%) |
| Total (Category) | 0 (0.0%) | 0 (0.0%) |
| Total (Overall) | 4 (23.5%) | 13 (76.5%) |
Employment Industries by Sex in Waller
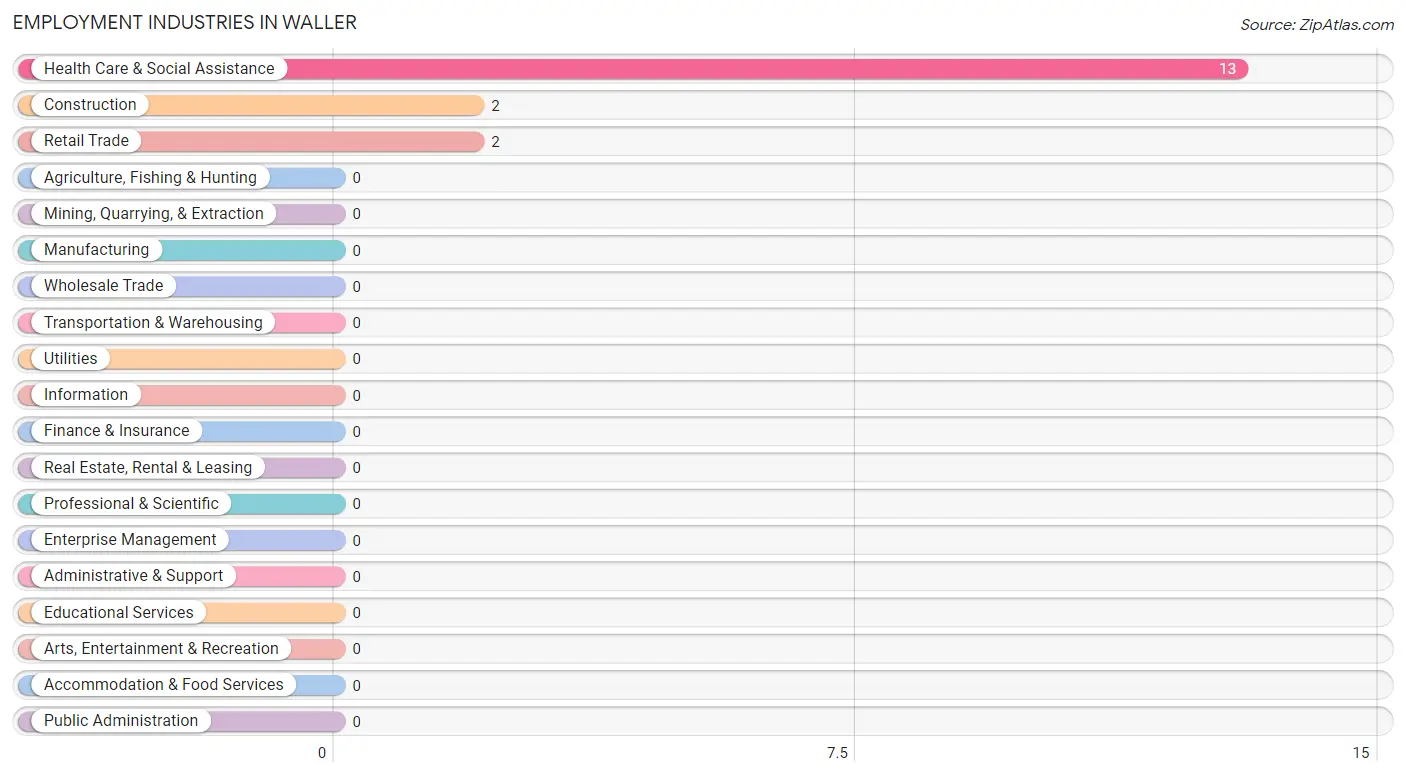
Employment Industries in Waller
The major employment industries in Waller include Health Care & Social Assistance (13 | 76.5%), Construction (2 | 11.8%), and Retail Trade (2 | 11.8%).
Employment Industries by Sex in Waller
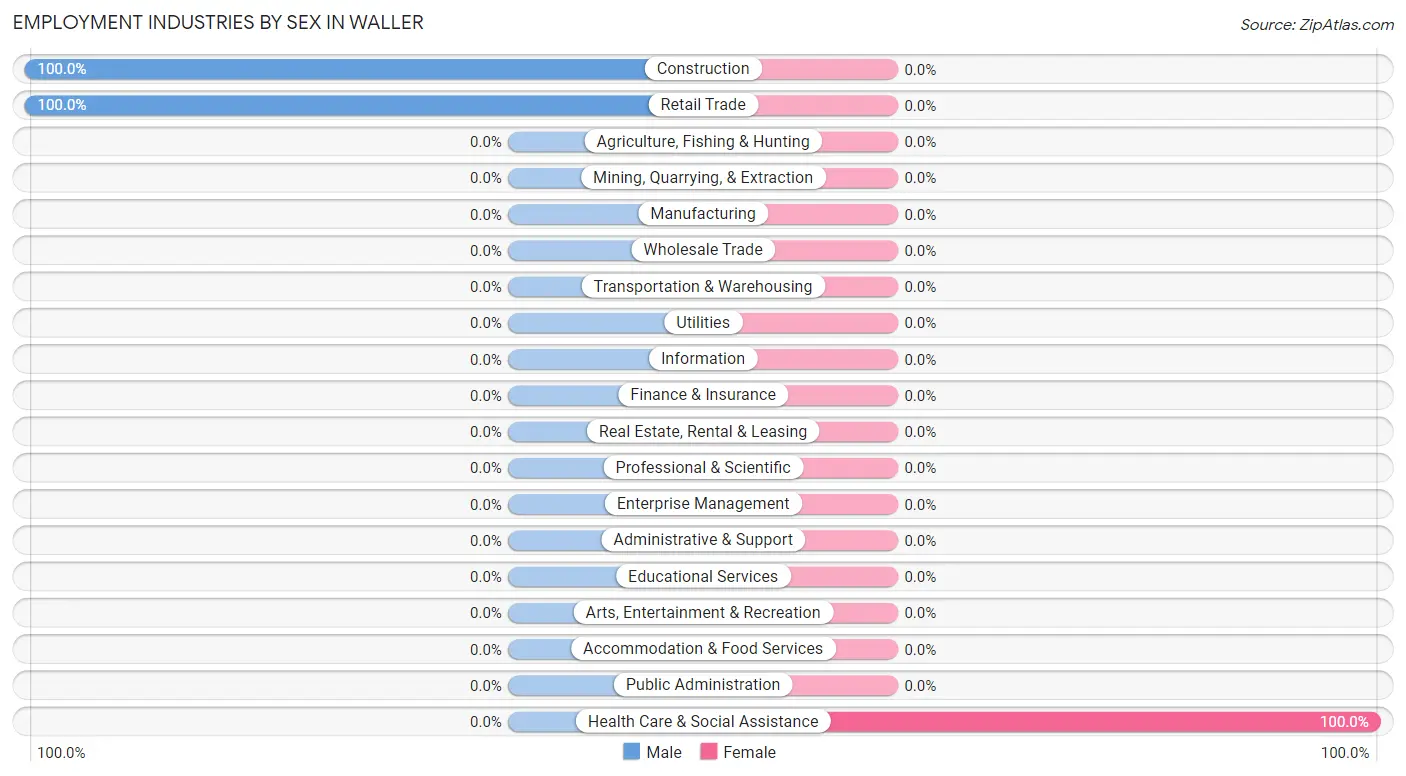
| Industry | Male | Female |
| Agriculture, Fishing & Hunting | 0 (0.0%) | 0 (0.0%) |
| Mining, Quarrying, & Extraction | 0 (0.0%) | 0 (0.0%) |
| Construction | 2 (100.0%) | 0 (0.0%) |
| Manufacturing | 0 (0.0%) | 0 (0.0%) |
| Wholesale Trade | 0 (0.0%) | 0 (0.0%) |
| Retail Trade | 2 (100.0%) | 0 (0.0%) |
| Transportation & Warehousing | 0 (0.0%) | 0 (0.0%) |
| Utilities | 0 (0.0%) | 0 (0.0%) |
| Information | 0 (0.0%) | 0 (0.0%) |
| Finance & Insurance | 0 (0.0%) | 0 (0.0%) |
| Real Estate, Rental & Leasing | 0 (0.0%) | 0 (0.0%) |
| Professional & Scientific | 0 (0.0%) | 0 (0.0%) |
| Enterprise Management | 0 (0.0%) | 0 (0.0%) |
| Administrative & Support | 0 (0.0%) | 0 (0.0%) |
| Educational Services | 0 (0.0%) | 0 (0.0%) |
| Health Care & Social Assistance | 0 (0.0%) | 13 (100.0%) |
| Arts, Entertainment & Recreation | 0 (0.0%) | 0 (0.0%) |
| Accommodation & Food Services | 0 (0.0%) | 0 (0.0%) |
| Public Administration | 0 (0.0%) | 0 (0.0%) |
| Total | 4 (23.5%) | 13 (76.5%) |
Education in Waller
School Enrollment in Waller
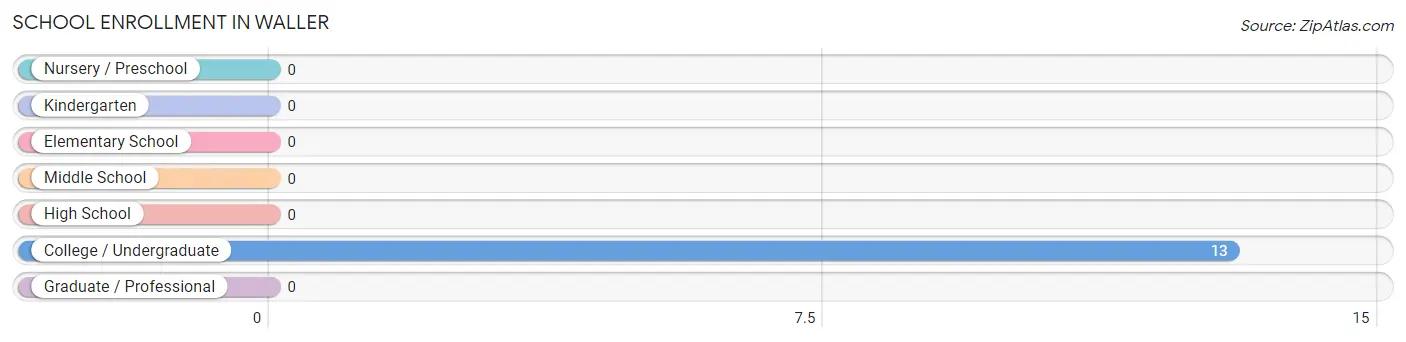
| School Level | # Students | % Students |
| Nursery / Preschool | 0 | 0.0% |
| Kindergarten | 0 | 0.0% |
| Elementary School | 0 | 0.0% |
| Middle School | 0 | 0.0% |
| High School | 0 | 0.0% |
| College / Undergraduate | 13 | 100.0% |
| Graduate / Professional | 0 | 0.0% |
| Total | 13 | 100.0% |
School Enrollment by Age by Funding Source in Waller
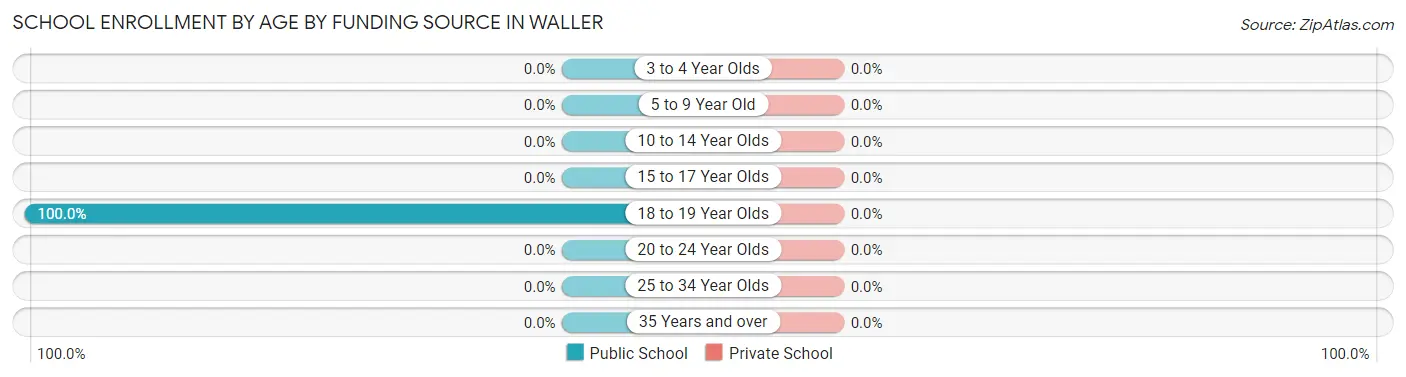
| Age Bracket | Public School | Private School |
| 3 to 4 Year Olds | 0 (0.0%) | 0 (0.0%) |
| 5 to 9 Year Old | 0 (0.0%) | 0 (0.0%) |
| 10 to 14 Year Olds | 0 (0.0%) | 0 (0.0%) |
| 15 to 17 Year Olds | 0 (0.0%) | 0 (0.0%) |
| 18 to 19 Year Olds | 13 (100.0%) | 0 (0.0%) |
| 20 to 24 Year Olds | 0 (0.0%) | 0 (0.0%) |
| 25 to 34 Year Olds | 0 (0.0%) | 0 (0.0%) |
| 35 Years and over | 0 (0.0%) | 0 (0.0%) |
| Total | 13 (100.0%) | 0 (0.0%) |
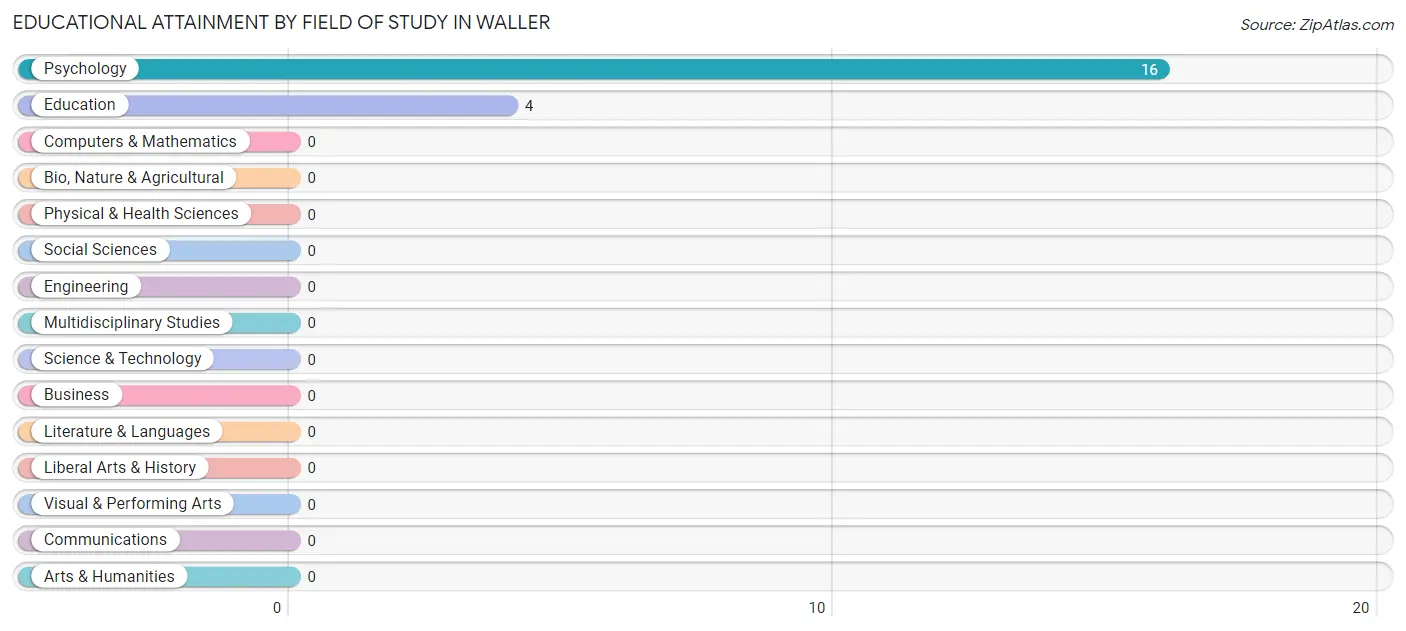
Educational Attainment by Field of Study in Waller
Psychology (16 | 80.0%), and education (4 | 20.0%) are the most common fields of study among 20 individuals in Waller who have obtained a bachelor's degree or higher.
| Field of Study | # Graduates | % Graduates |
| Computers & Mathematics | 0 | 0.0% |
| Bio, Nature & Agricultural | 0 | 0.0% |
| Physical & Health Sciences | 0 | 0.0% |
| Psychology | 16 | 80.0% |
| Social Sciences | 0 | 0.0% |
| Engineering | 0 | 0.0% |
| Multidisciplinary Studies | 0 | 0.0% |
| Science & Technology | 0 | 0.0% |
| Business | 0 | 0.0% |
| Education | 4 | 20.0% |
| Literature & Languages | 0 | 0.0% |
| Liberal Arts & History | 0 | 0.0% |
| Visual & Performing Arts | 0 | 0.0% |
| Communications | 0 | 0.0% |
| Arts & Humanities | 0 | 0.0% |
| Total | 20 | 100.0% |
Transportation & Commute in Waller
Vehicle Availability by Sex in Waller
The most prevalent vehicle ownership categories in Waller are males with 1 vehicle (2, accounting for 50.0%) and females with 1 vehicle (2, making up 15.4%).
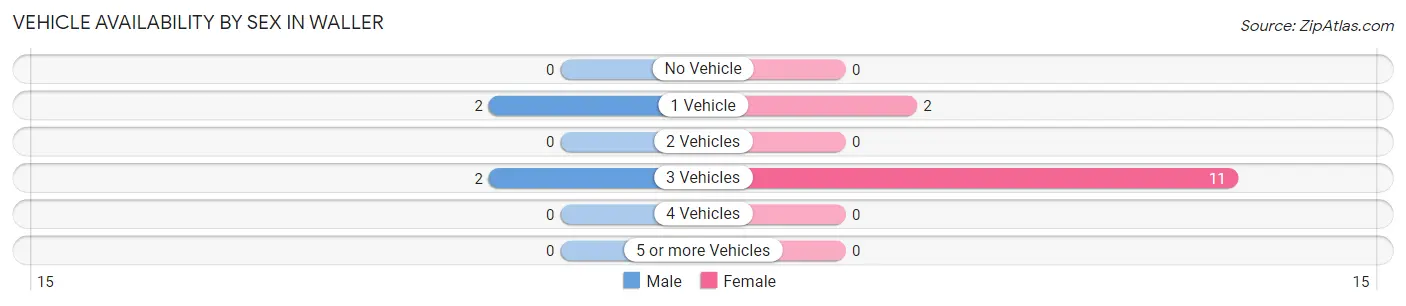
| Vehicles Available | Male | Female |
| No Vehicle | 0 (0.0%) | 0 (0.0%) |
| 1 Vehicle | 2 (50.0%) | 2 (15.4%) |
| 2 Vehicles | 0 (0.0%) | 0 (0.0%) |
| 3 Vehicles | 2 (50.0%) | 11 (84.6%) |
| 4 Vehicles | 0 (0.0%) | 0 (0.0%) |
| 5 or more Vehicles | 0 (0.0%) | 0 (0.0%) |
| Total | 4 (100.0%) | 13 (100.0%) |
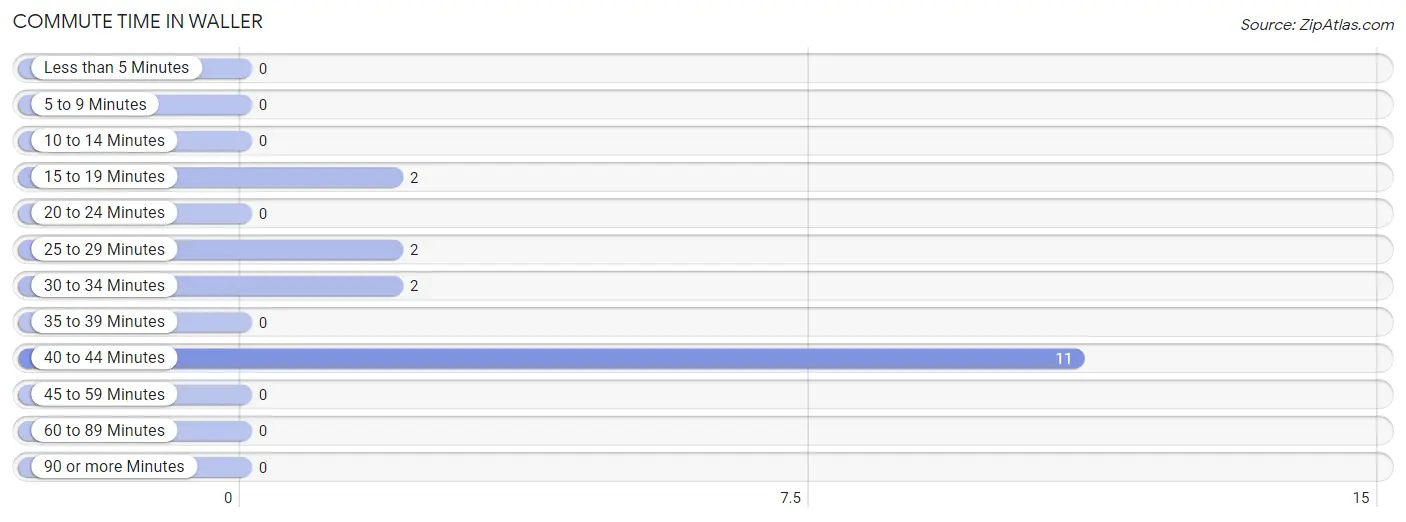
Commute Time in Waller
The most frequently occuring commute durations in Waller are 40 to 44 minutes (11 commuters, 64.7%), 15 to 19 minutes (2 commuters, 11.8%), and 25 to 29 minutes (2 commuters, 11.8%).
| Commute Time | # Commuters | % Commuters |
| Less than 5 Minutes | 0 | 0.0% |
| 5 to 9 Minutes | 0 | 0.0% |
| 10 to 14 Minutes | 0 | 0.0% |
| 15 to 19 Minutes | 2 | 11.8% |
| 20 to 24 Minutes | 0 | 0.0% |
| 25 to 29 Minutes | 2 | 11.8% |
| 30 to 34 Minutes | 2 | 11.8% |
| 35 to 39 Minutes | 0 | 0.0% |
| 40 to 44 Minutes | 11 | 64.7% |
| 45 to 59 Minutes | 0 | 0.0% |
| 60 to 89 Minutes | 0 | 0.0% |
| 90 or more Minutes | 0 | 0.0% |
Commute Time by Sex in Waller
The most common commute times in Waller are 15 to 19 minutes (2 commuters, 50.0%) for males and 40 to 44 minutes (11 commuters, 84.6%) for females.
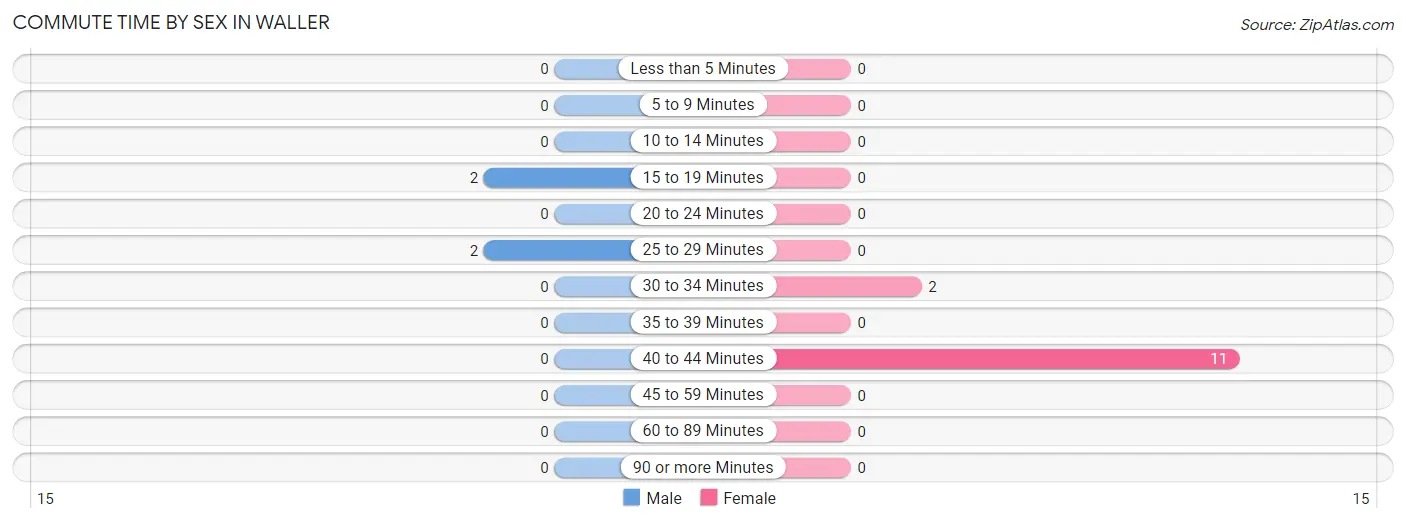
| Commute Time | Male | Female |
| Less than 5 Minutes | 0 (0.0%) | 0 (0.0%) |
| 5 to 9 Minutes | 0 (0.0%) | 0 (0.0%) |
| 10 to 14 Minutes | 0 (0.0%) | 0 (0.0%) |
| 15 to 19 Minutes | 2 (50.0%) | 0 (0.0%) |
| 20 to 24 Minutes | 0 (0.0%) | 0 (0.0%) |
| 25 to 29 Minutes | 2 (50.0%) | 0 (0.0%) |
| 30 to 34 Minutes | 0 (0.0%) | 2 (15.4%) |
| 35 to 39 Minutes | 0 (0.0%) | 0 (0.0%) |
| 40 to 44 Minutes | 0 (0.0%) | 11 (84.6%) |
| 45 to 59 Minutes | 0 (0.0%) | 0 (0.0%) |
| 60 to 89 Minutes | 0 (0.0%) | 0 (0.0%) |
| 90 or more Minutes | 0 (0.0%) | 0 (0.0%) |
Time of Departure to Work by Sex in Waller
The most frequent times of departure to work in Waller are 5:30 AM to 5:59 AM (2, 50.0%) for males and 6:00 AM to 6:29 AM (11, 84.6%) for females.
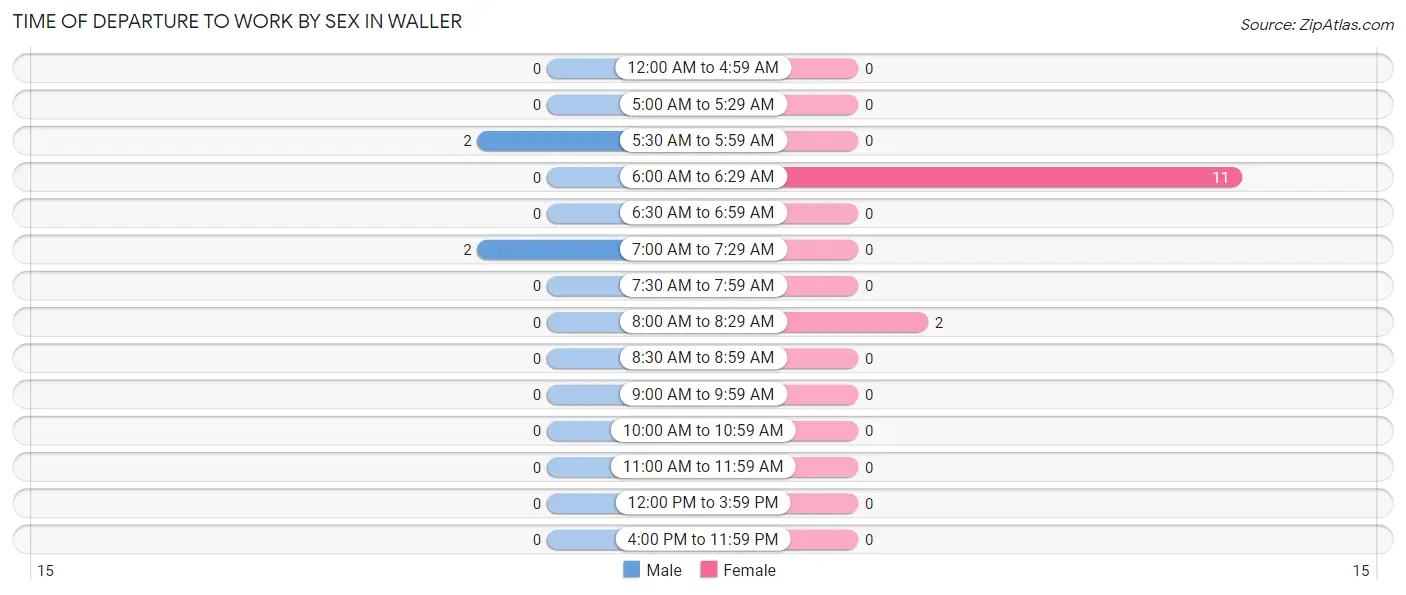
| Time of Departure | Male | Female |
| 12:00 AM to 4:59 AM | 0 (0.0%) | 0 (0.0%) |
| 5:00 AM to 5:29 AM | 0 (0.0%) | 0 (0.0%) |
| 5:30 AM to 5:59 AM | 2 (50.0%) | 0 (0.0%) |
| 6:00 AM to 6:29 AM | 0 (0.0%) | 11 (84.6%) |
| 6:30 AM to 6:59 AM | 0 (0.0%) | 0 (0.0%) |
| 7:00 AM to 7:29 AM | 2 (50.0%) | 0 (0.0%) |
| 7:30 AM to 7:59 AM | 0 (0.0%) | 0 (0.0%) |
| 8:00 AM to 8:29 AM | 0 (0.0%) | 2 (15.4%) |
| 8:30 AM to 8:59 AM | 0 (0.0%) | 0 (0.0%) |
| 9:00 AM to 9:59 AM | 0 (0.0%) | 0 (0.0%) |
| 10:00 AM to 10:59 AM | 0 (0.0%) | 0 (0.0%) |
| 11:00 AM to 11:59 AM | 0 (0.0%) | 0 (0.0%) |
| 12:00 PM to 3:59 PM | 0 (0.0%) | 0 (0.0%) |
| 4:00 PM to 11:59 PM | 0 (0.0%) | 0 (0.0%) |
| Total | 4 (100.0%) | 13 (100.0%) |
Housing Occupancy in Waller
Occupancy by Ownership in Waller
Of the total 40 dwellings in Waller, owner-occupied units account for 40 (100.0%), while renter-occupied units make up 0 (0.0%).
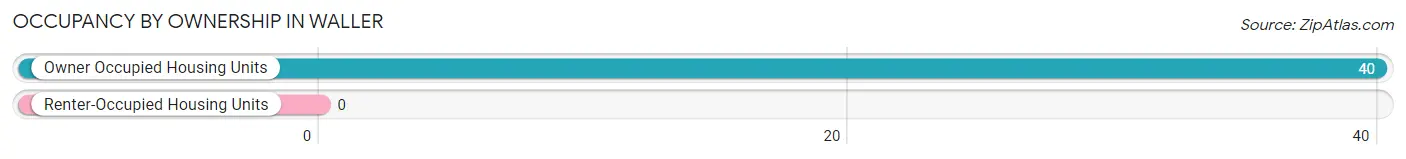
| Occupancy | # Housing Units | % Housing Units |
| Owner Occupied Housing Units | 40 | 100.0% |
| Renter-Occupied Housing Units | 0 | 0.0% |
| Total Occupied Housing Units | 40 | 100.0% |
Occupancy by Household Size in Waller
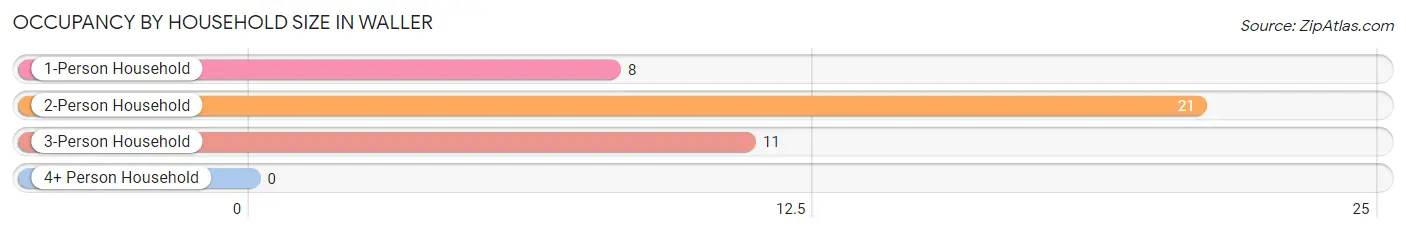
| Household Size | # Housing Units | % Housing Units |
| 1-Person Household | 8 | 20.0% |
| 2-Person Household | 21 | 52.5% |
| 3-Person Household | 11 | 27.5% |
| 4+ Person Household | 0 | 0.0% |
| Total Housing Units | 40 | 100.0% |
Occupancy by Ownership by Household Size in Waller
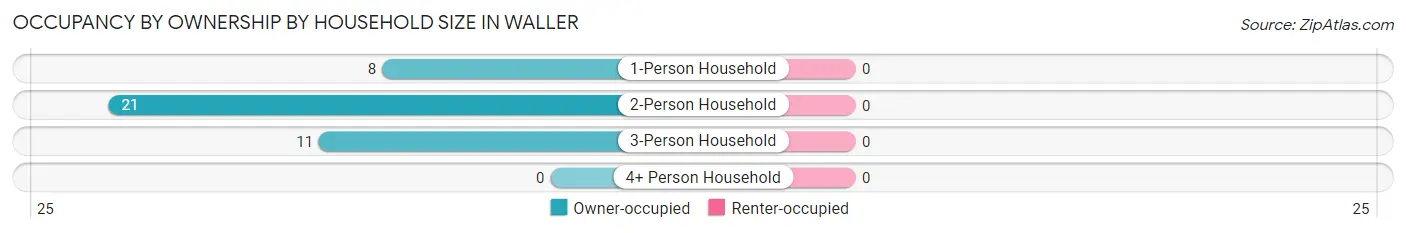
| Household Size | Owner-occupied | Renter-occupied |
| 1-Person Household | 8 (100.0%) | 0 (0.0%) |
| 2-Person Household | 21 (100.0%) | 0 (0.0%) |
| 3-Person Household | 11 (100.0%) | 0 (0.0%) |
| 4+ Person Household | 0 (0.0%) | 0 (0.0%) |
| Total Housing Units | 40 (100.0%) | 0 (0.0%) |
Occupancy by Educational Attainment in Waller
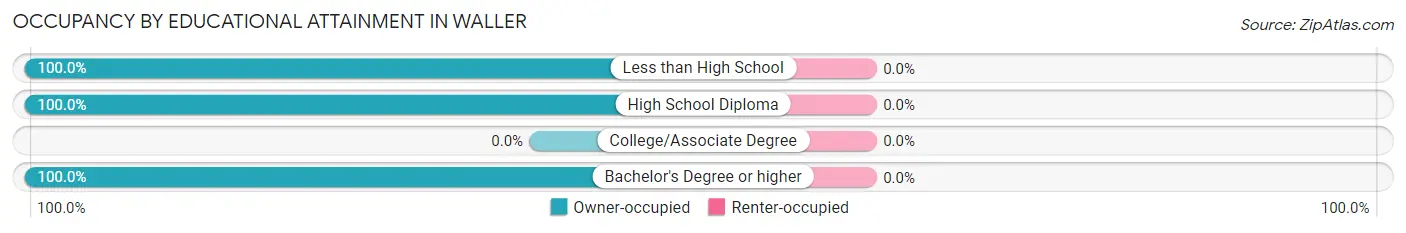
| Household Size | Owner-occupied | Renter-occupied |
| Less than High School | 2 (100.0%) | 0 (0.0%) |
| High School Diploma | 18 (100.0%) | 0 (0.0%) |
| College/Associate Degree | 0 (0.0%) | 0 (0.0%) |
| Bachelor's Degree or higher | 20 (100.0%) | 0 (0.0%) |
Occupancy by Age of Householder in Waller
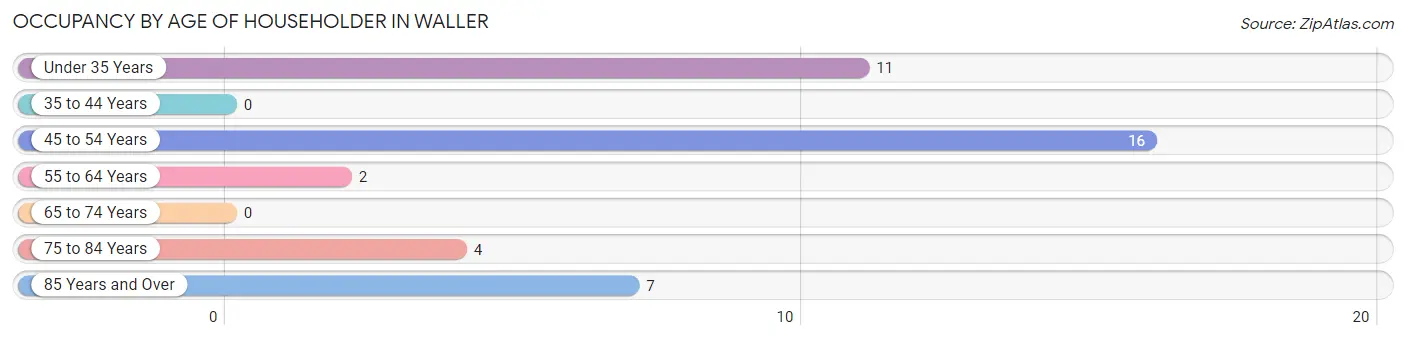
| Age Bracket | # Households | % Households |
| Under 35 Years | 11 | 27.5% |
| 35 to 44 Years | 0 | 0.0% |
| 45 to 54 Years | 16 | 40.0% |
| 55 to 64 Years | 2 | 5.0% |
| 65 to 74 Years | 0 | 0.0% |
| 75 to 84 Years | 4 | 10.0% |
| 85 Years and Over | 7 | 17.5% |
| Total | 40 | 100.0% |
Housing Finances in Waller
Median Income by Occupancy in Waller
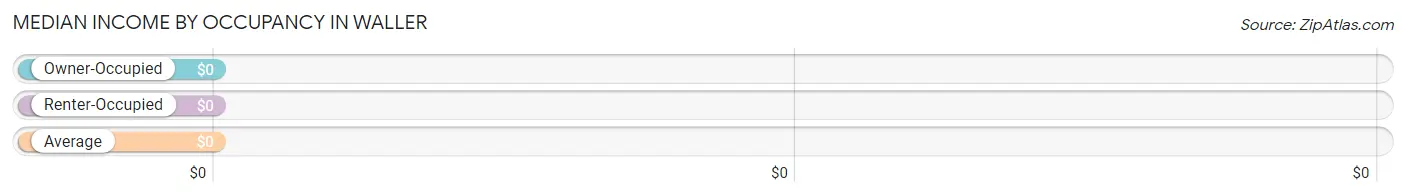
| Occupancy Type | # Households | Median Income |
| Owner-Occupied | 40 (100.0%) | $0 |
| Renter-Occupied | 0 (0.0%) | $0 |
| Average | 40 (100.0%) | $0 |
Occupancy by Householder Income Bracket in Waller
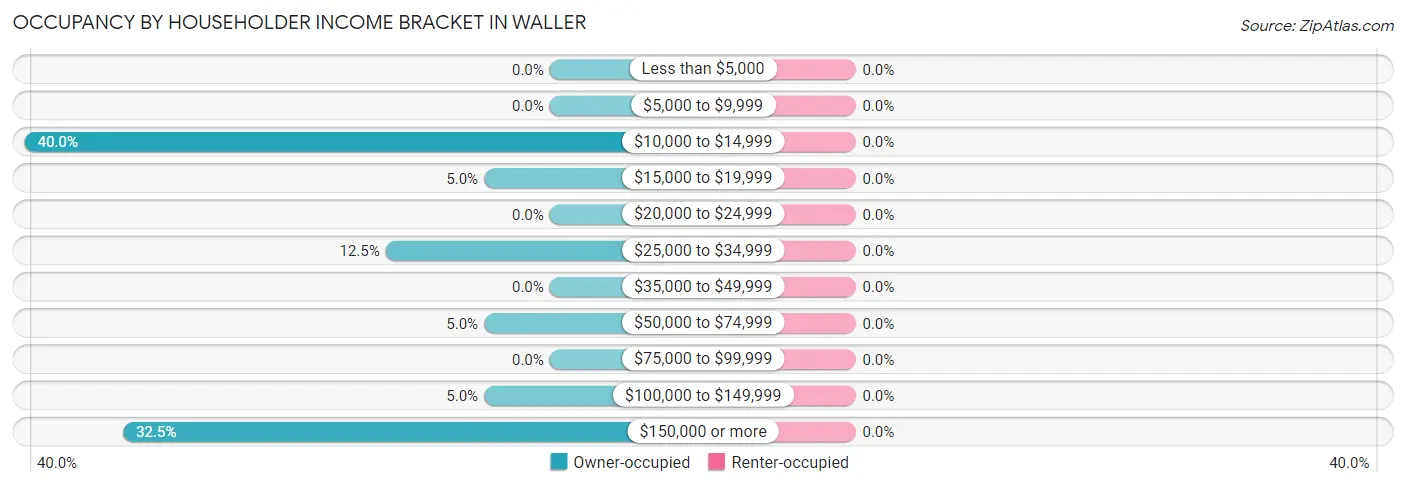
| Income Bracket | Owner-occupied | Renter-occupied |
| Less than $5,000 | 0 (0.0%) | 0 (0.0%) |
| $5,000 to $9,999 | 0 (0.0%) | 0 (0.0%) |
| $10,000 to $14,999 | 16 (40.0%) | 0 (0.0%) |
| $15,000 to $19,999 | 2 (5.0%) | 0 (0.0%) |
| $20,000 to $24,999 | 0 (0.0%) | 0 (0.0%) |
| $25,000 to $34,999 | 5 (12.5%) | 0 (0.0%) |
| $35,000 to $49,999 | 0 (0.0%) | 0 (0.0%) |
| $50,000 to $74,999 | 2 (5.0%) | 0 (0.0%) |
| $75,000 to $99,999 | 0 (0.0%) | 0 (0.0%) |
| $100,000 to $149,999 | 2 (5.0%) | 0 (0.0%) |
| $150,000 or more | 13 (32.5%) | 0 (0.0%) |
| Total | 40 (100.0%) | 0 (0.0%) |
Monthly Housing Cost Tiers in Waller
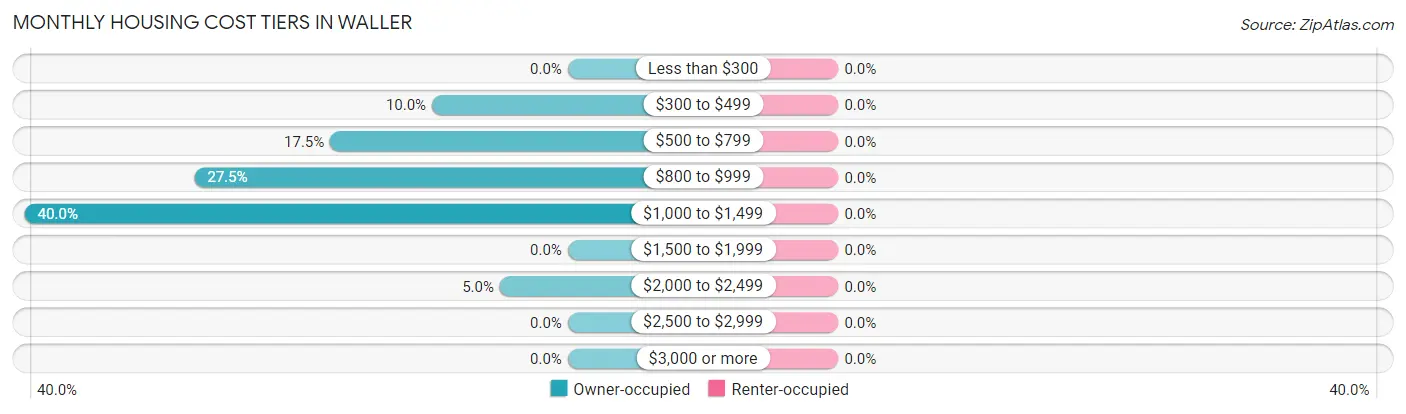
| Monthly Cost | Owner-occupied | Renter-occupied |
| Less than $300 | 0 (0.0%) | 0 (0.0%) |
| $300 to $499 | 4 (10.0%) | 0 (0.0%) |
| $500 to $799 | 7 (17.5%) | 0 (0.0%) |
| $800 to $999 | 11 (27.5%) | 0 (0.0%) |
| $1,000 to $1,499 | 16 (40.0%) | 0 (0.0%) |
| $1,500 to $1,999 | 0 (0.0%) | 0 (0.0%) |
| $2,000 to $2,499 | 2 (5.0%) | 0 (0.0%) |
| $2,500 to $2,999 | 0 (0.0%) | 0 (0.0%) |
| $3,000 or more | 0 (0.0%) | 0 (0.0%) |
| Total | 40 (100.0%) | 0 (0.0%) |
Physical Housing Characteristics in Waller
Housing Structures in Waller
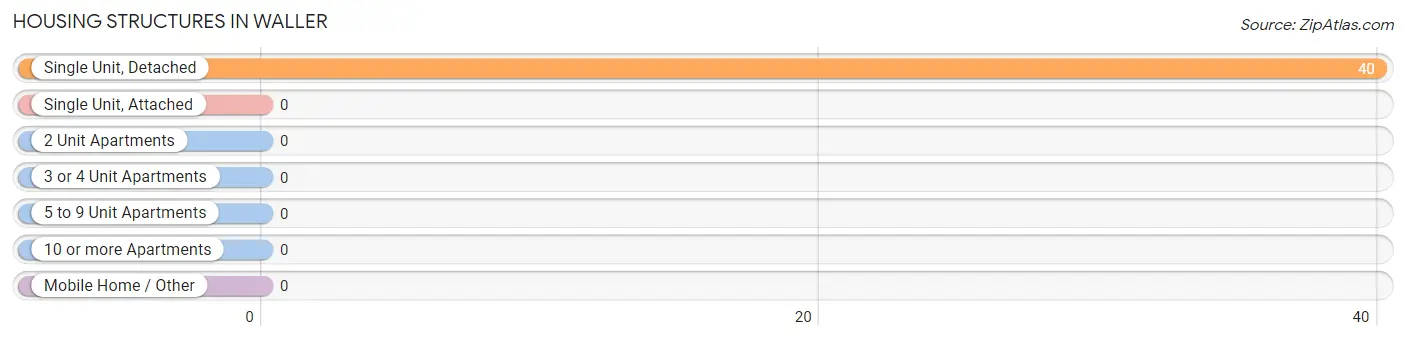
| Structure Type | # Housing Units | % Housing Units |
| Single Unit, Detached | 40 | 100.0% |
| Single Unit, Attached | 0 | 0.0% |
| 2 Unit Apartments | 0 | 0.0% |
| 3 or 4 Unit Apartments | 0 | 0.0% |
| 5 to 9 Unit Apartments | 0 | 0.0% |
| 10 or more Apartments | 0 | 0.0% |
| Mobile Home / Other | 0 | 0.0% |
| Total | 40 | 100.0% |
Housing Structures by Occupancy in Waller
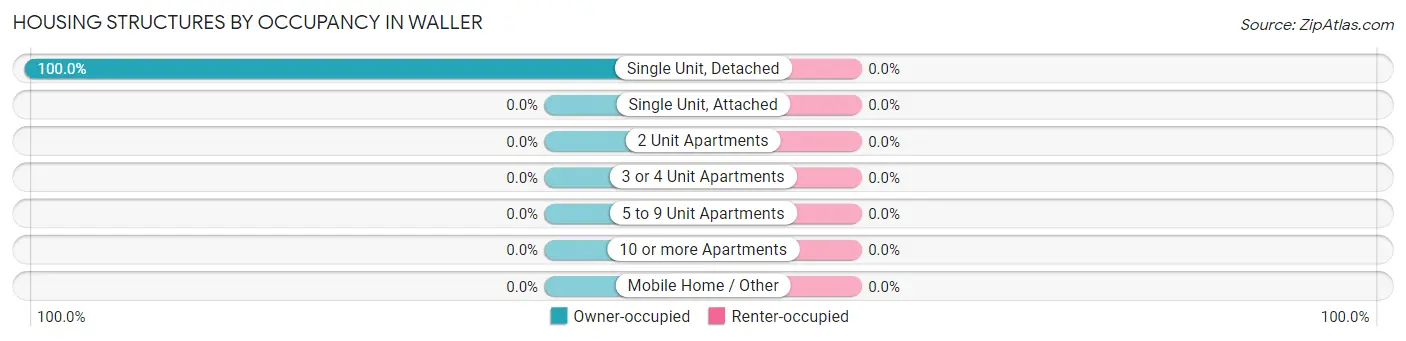
| Structure Type | Owner-occupied | Renter-occupied |
| Single Unit, Detached | 40 (100.0%) | 0 (0.0%) |
| Single Unit, Attached | 0 (0.0%) | 0 (0.0%) |
| 2 Unit Apartments | 0 (0.0%) | 0 (0.0%) |
| 3 or 4 Unit Apartments | 0 (0.0%) | 0 (0.0%) |
| 5 to 9 Unit Apartments | 0 (0.0%) | 0 (0.0%) |
| 10 or more Apartments | 0 (0.0%) | 0 (0.0%) |
| Mobile Home / Other | 0 (0.0%) | 0 (0.0%) |
| Total | 40 (100.0%) | 0 (0.0%) |
Housing Structures by Number of Rooms in Waller
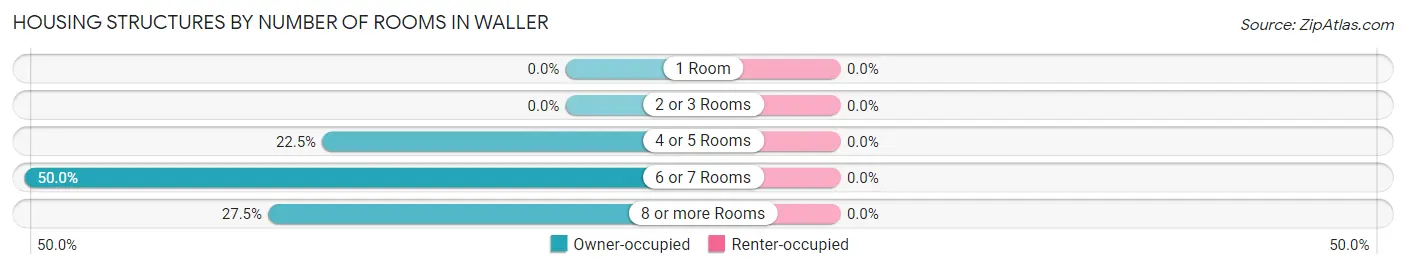
| Number of Rooms | Owner-occupied | Renter-occupied |
| 1 Room | 0 (0.0%) | 0 (0.0%) |
| 2 or 3 Rooms | 0 (0.0%) | 0 (0.0%) |
| 4 or 5 Rooms | 9 (22.5%) | 0 (0.0%) |
| 6 or 7 Rooms | 20 (50.0%) | 0 (0.0%) |
| 8 or more Rooms | 11 (27.5%) | 0 (0.0%) |
| Total | 40 (100.0%) | 0 (0.0%) |
Housing Structure by Heating Type in Waller
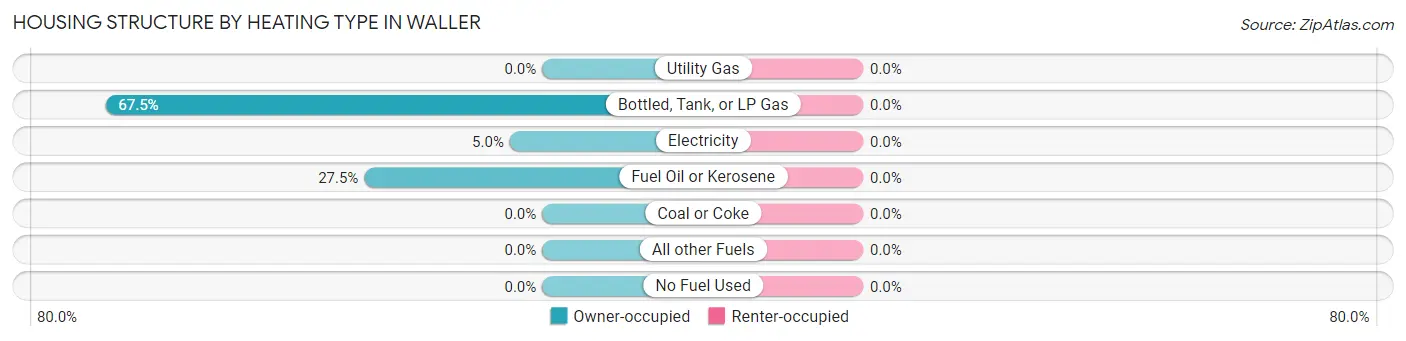
| Heating Type | Owner-occupied | Renter-occupied |
| Utility Gas | 0 (0.0%) | 0 (0.0%) |
| Bottled, Tank, or LP Gas | 27 (67.5%) | 0 (0.0%) |
| Electricity | 2 (5.0%) | 0 (0.0%) |
| Fuel Oil or Kerosene | 11 (27.5%) | 0 (0.0%) |
| Coal or Coke | 0 (0.0%) | 0 (0.0%) |
| All other Fuels | 0 (0.0%) | 0 (0.0%) |
| No Fuel Used | 0 (0.0%) | 0 (0.0%) |
| Total | 40 (100.0%) | 0 (0.0%) |
Household Vehicle Usage in Waller
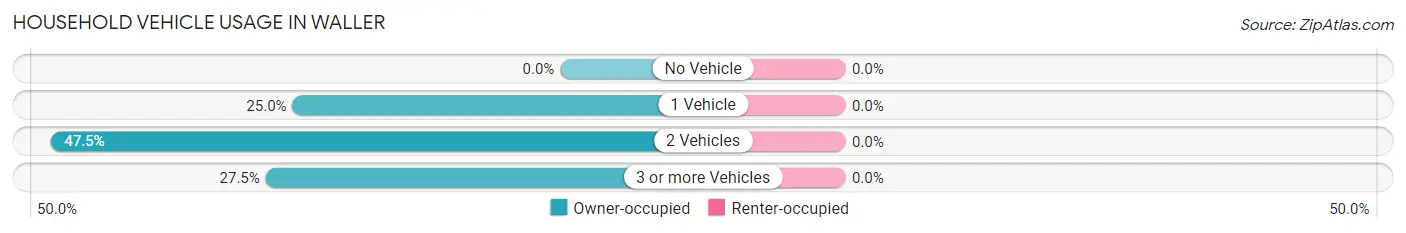
| Vehicles per Household | Owner-occupied | Renter-occupied |
| No Vehicle | 0 (0.0%) | 0 (0.0%) |
| 1 Vehicle | 10 (25.0%) | 0 (0.0%) |
| 2 Vehicles | 19 (47.5%) | 0 (0.0%) |
| 3 or more Vehicles | 11 (27.5%) | 0 (0.0%) |
| Total | 40 (100.0%) | 0 (0.0%) |
Real Estate & Mortgages in Waller
Real Estate and Mortgage Overview in Waller
| Characteristic | Without Mortgage | With Mortgage |
| Housing Units | 11 | 29 |
| Median Property Value | $237,500 | $210,900 |
| Median Household Income | $31,250 | $13 |
| Monthly Housing Costs | $530 | $0 |
| Real Estate Taxes | $3,389 | $0 |
Property Value by Mortgage Status in Waller
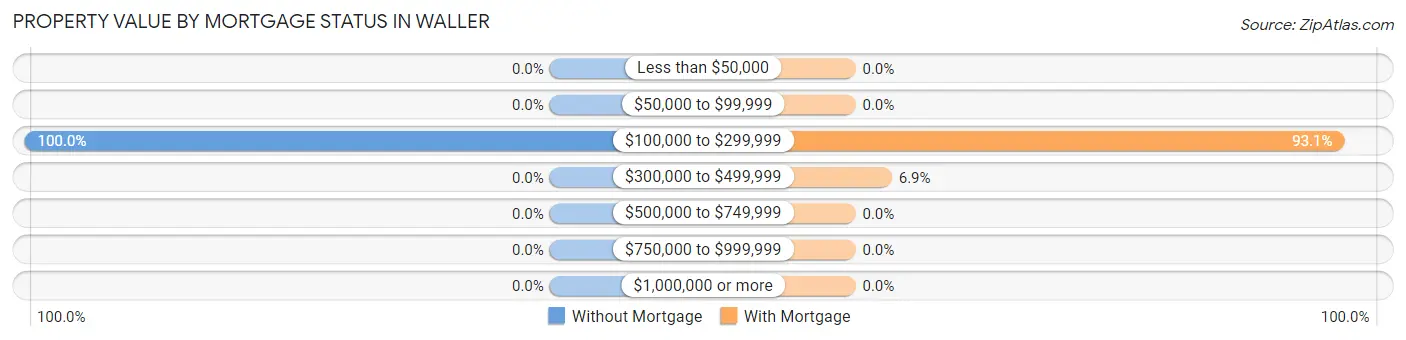
| Property Value | Without Mortgage | With Mortgage |
| Less than $50,000 | 0 (0.0%) | 0 (0.0%) |
| $50,000 to $99,999 | 0 (0.0%) | 0 (0.0%) |
| $100,000 to $299,999 | 11 (100.0%) | 27 (93.1%) |
| $300,000 to $499,999 | 0 (0.0%) | 2 (6.9%) |
| $500,000 to $749,999 | 0 (0.0%) | 0 (0.0%) |
| $750,000 to $999,999 | 0 (0.0%) | 0 (0.0%) |
| $1,000,000 or more | 0 (0.0%) | 0 (0.0%) |
| Total | 11 (100.0%) | 29 (100.0%) |
Household Income by Mortgage Status in Waller
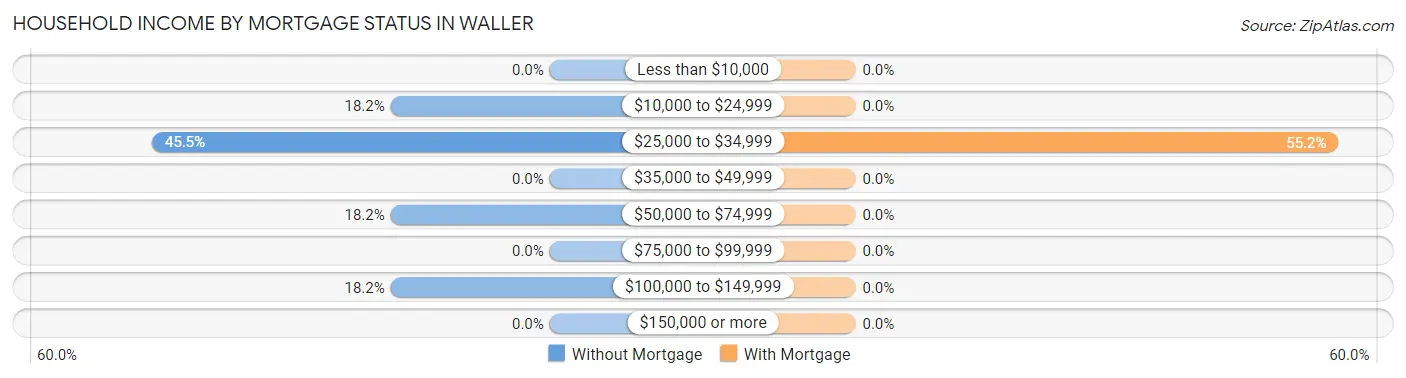
| Household Income | Without Mortgage | With Mortgage |
| Less than $10,000 | 0 (0.0%) | 0 (0.0%) |
| $10,000 to $24,999 | 2 (18.2%) | 0 (0.0%) |
| $25,000 to $34,999 | 5 (45.5%) | 16 (55.2%) |
| $35,000 to $49,999 | 0 (0.0%) | 0 (0.0%) |
| $50,000 to $74,999 | 2 (18.2%) | 0 (0.0%) |
| $75,000 to $99,999 | 0 (0.0%) | 0 (0.0%) |
| $100,000 to $149,999 | 2 (18.2%) | 0 (0.0%) |
| $150,000 or more | 0 (0.0%) | 0 (0.0%) |
| Total | 11 (100.0%) | 29 (100.0%) |
Property Value to Household Income Ratio in Waller
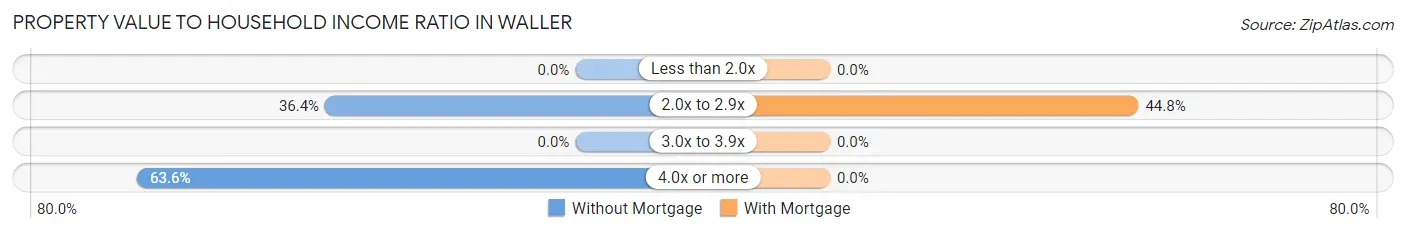
| Value-to-Income Ratio | Without Mortgage | With Mortgage |
| Less than 2.0x | 0 (0.0%) | 0 (0.0%) |
| 2.0x to 2.9x | 4 (36.4%) | 13 (44.8%) |
| 3.0x to 3.9x | 0 (0.0%) | 0 (0.0%) |
| 4.0x or more | 7 (63.6%) | 0 (0.0%) |
| Total | 11 (100.0%) | 29 (100.0%) |
Real Estate Taxes by Mortgage Status in Waller
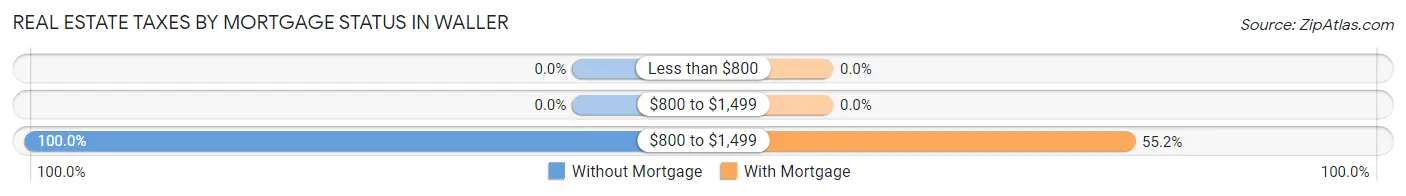
| Property Taxes | Without Mortgage | With Mortgage |
| Less than $800 | 0 (0.0%) | 0 (0.0%) |
| $800 to $1,499 | 0 (0.0%) | 0 (0.0%) |
| $800 to $1,499 | 11 (100.0%) | 16 (55.2%) |
| Total | 11 (100.0%) | 29 (100.0%) |
Health & Disability in Waller
Health Insurance Coverage by Age in Waller
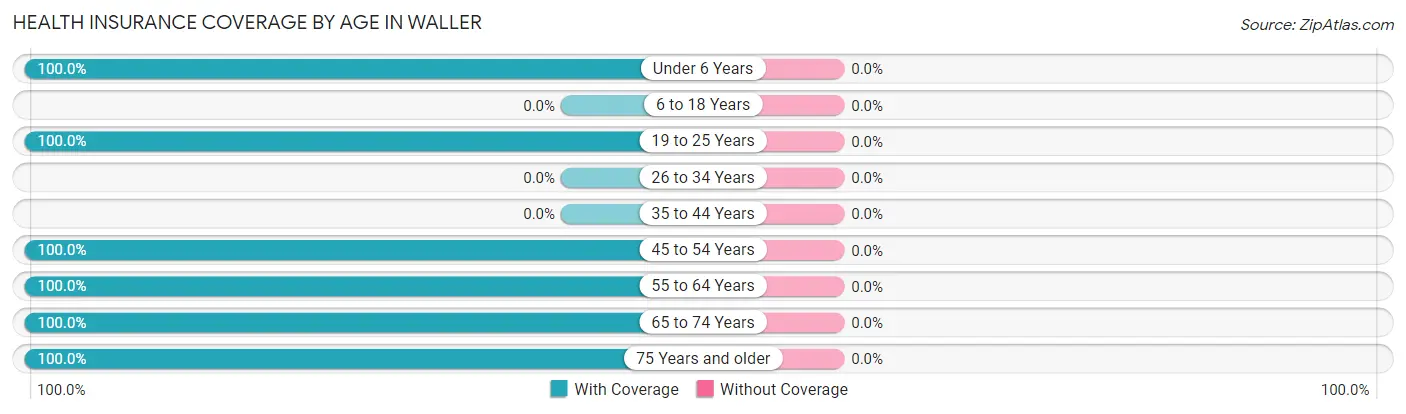
| Age Bracket | With Coverage | Without Coverage |
| Under 6 Years | 8 (100.0%) | 0 (0.0%) |
| 6 to 18 Years | 0 (0.0%) | 0 (0.0%) |
| 19 to 25 Years | 26 (100.0%) | 0 (0.0%) |
| 26 to 34 Years | 0 (0.0%) | 0 (0.0%) |
| 35 to 44 Years | 0 (0.0%) | 0 (0.0%) |
| 45 to 54 Years | 16 (100.0%) | 0 (0.0%) |
| 55 to 64 Years | 4 (100.0%) | 0 (0.0%) |
| 65 to 74 Years | 4 (100.0%) | 0 (0.0%) |
| 75 Years and older | 11 (100.0%) | 0 (0.0%) |
| Total | 69 (100.0%) | 0 (0.0%) |
Health Insurance Coverage by Citizenship Status in Waller
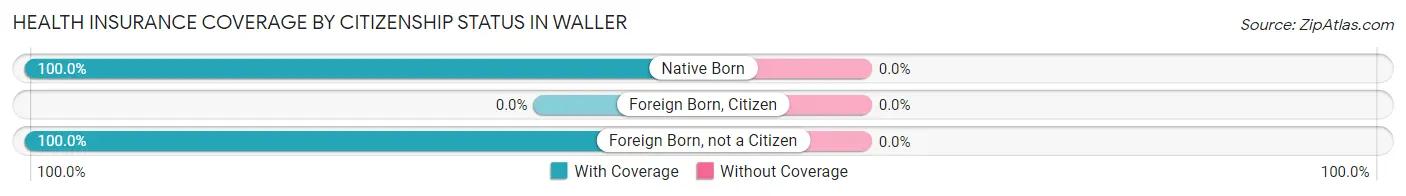
| Citizenship Status | With Coverage | Without Coverage |
| Native Born | 8 (100.0%) | 0 (0.0%) |
| Foreign Born, Citizen | 0 (0.0%) | 0 (0.0%) |
| Foreign Born, not a Citizen | 26 (100.0%) | 0 (0.0%) |
Health Insurance Coverage by Household Income in Waller
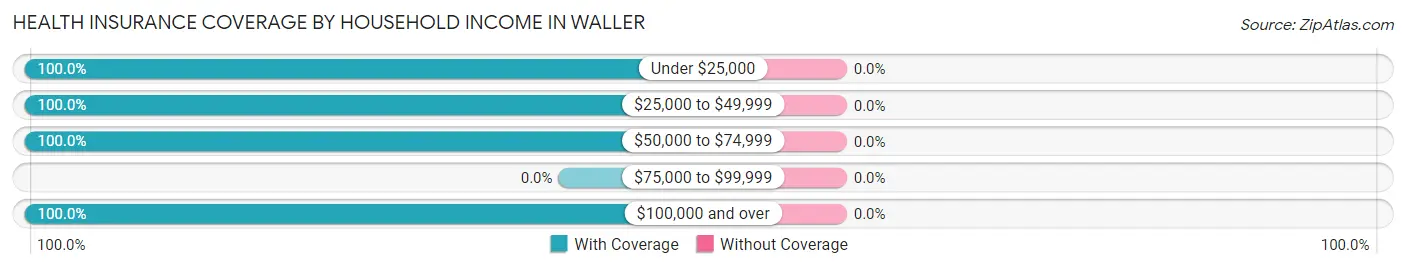
| Household Income | With Coverage | Without Coverage |
| Under $25,000 | 31 (100.0%) | 0 (0.0%) |
| $25,000 to $49,999 | 9 (100.0%) | 0 (0.0%) |
| $50,000 to $74,999 | 2 (100.0%) | 0 (0.0%) |
| $75,000 to $99,999 | 0 (0.0%) | 0 (0.0%) |
| $100,000 and over | 27 (100.0%) | 0 (0.0%) |
Public vs Private Health Insurance Coverage by Age in Waller
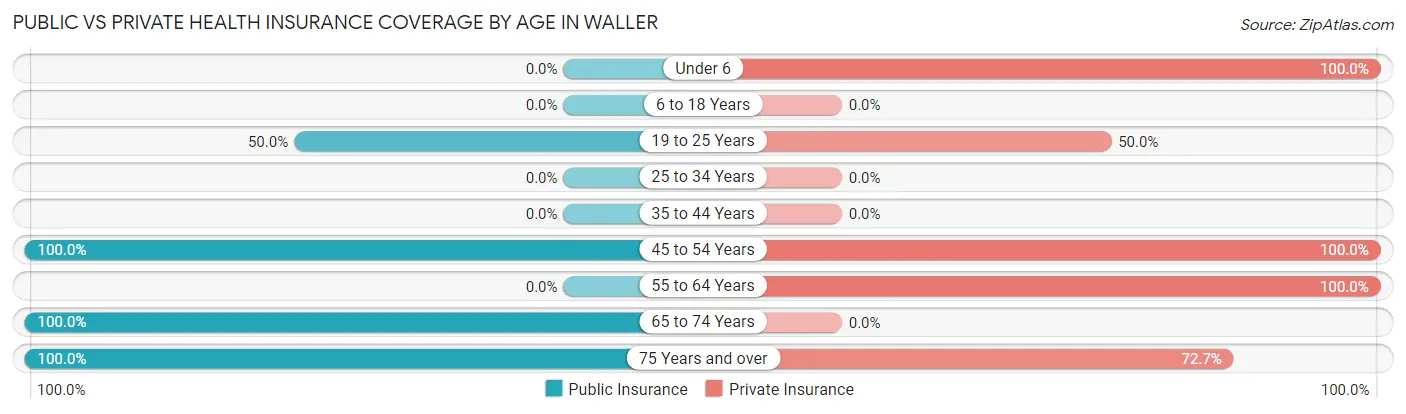
| Age Bracket | Public Insurance | Private Insurance |
| Under 6 | 0 (0.0%) | 8 (100.0%) |
| 6 to 18 Years | 0 (0.0%) | 0 (0.0%) |
| 19 to 25 Years | 13 (50.0%) | 13 (50.0%) |
| 25 to 34 Years | 0 (0.0%) | 0 (0.0%) |
| 35 to 44 Years | 0 (0.0%) | 0 (0.0%) |
| 45 to 54 Years | 16 (100.0%) | 16 (100.0%) |
| 55 to 64 Years | 0 (0.0%) | 4 (100.0%) |
| 65 to 74 Years | 4 (100.0%) | 0 (0.0%) |
| 75 Years and over | 11 (100.0%) | 8 (72.7%) |
| Total | 44 (63.8%) | 49 (71.0%) |
Disability Status by Sex by Age in Waller
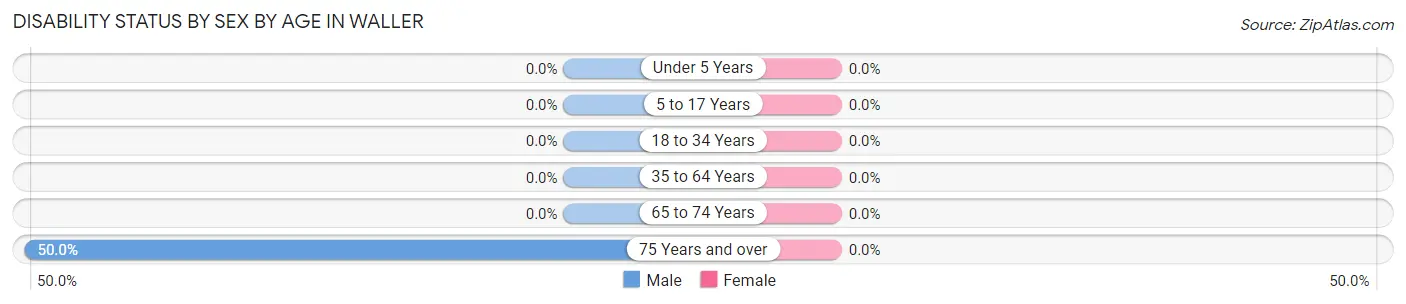
| Age Bracket | Male | Female |
| Under 5 Years | 0 (0.0%) | 0 (0.0%) |
| 5 to 17 Years | 0 (0.0%) | 0 (0.0%) |
| 18 to 34 Years | 0 (0.0%) | 0 (0.0%) |
| 35 to 64 Years | 0 (0.0%) | 0 (0.0%) |
| 65 to 74 Years | 0 (0.0%) | 0 (0.0%) |
| 75 Years and over | 2 (50.0%) | 0 (0.0%) |
Disability Class by Sex by Age in Waller
Disability Class: Hearing Difficulty
| Age Bracket | Male | Female |
| Under 5 Years | 0 (0.0%) | 0 (0.0%) |
| 5 to 17 Years | 0 (0.0%) | 0 (0.0%) |
| 18 to 34 Years | 0 (0.0%) | 0 (0.0%) |
| 35 to 64 Years | 0 (0.0%) | 0 (0.0%) |
| 65 to 74 Years | 0 (0.0%) | 0 (0.0%) |
| 75 Years and over | 2 (50.0%) | 0 (0.0%) |
Disability Class: Vision Difficulty
| Age Bracket | Male | Female |
| Under 5 Years | 0 (0.0%) | 0 (0.0%) |
| 5 to 17 Years | 0 (0.0%) | 0 (0.0%) |
| 18 to 34 Years | 0 (0.0%) | 0 (0.0%) |
| 35 to 64 Years | 0 (0.0%) | 0 (0.0%) |
| 65 to 74 Years | 0 (0.0%) | 0 (0.0%) |
| 75 Years and over | 0 (0.0%) | 0 (0.0%) |
Disability Class: Cognitive Difficulty
| Age Bracket | Male | Female |
| 5 to 17 Years | 0 (0.0%) | 0 (0.0%) |
| 18 to 34 Years | 0 (0.0%) | 0 (0.0%) |
| 35 to 64 Years | 0 (0.0%) | 0 (0.0%) |
| 65 to 74 Years | 0 (0.0%) | 0 (0.0%) |
| 75 Years and over | 0 (0.0%) | 0 (0.0%) |
Disability Class: Ambulatory Difficulty
| Age Bracket | Male | Female |
| 5 to 17 Years | 0 (0.0%) | 0 (0.0%) |
| 18 to 34 Years | 0 (0.0%) | 0 (0.0%) |
| 35 to 64 Years | 0 (0.0%) | 0 (0.0%) |
| 65 to 74 Years | 0 (0.0%) | 0 (0.0%) |
| 75 Years and over | 0 (0.0%) | 0 (0.0%) |
Disability Class: Self-Care Difficulty
| Age Bracket | Male | Female |
| 5 to 17 Years | 0 (0.0%) | 0 (0.0%) |
| 18 to 34 Years | 0 (0.0%) | 0 (0.0%) |
| 35 to 64 Years | 0 (0.0%) | 0 (0.0%) |
| 65 to 74 Years | 0 (0.0%) | 0 (0.0%) |
| 75 Years and over | 0 (0.0%) | 0 (0.0%) |
Technology Access in Waller
Computing Device Access in Waller
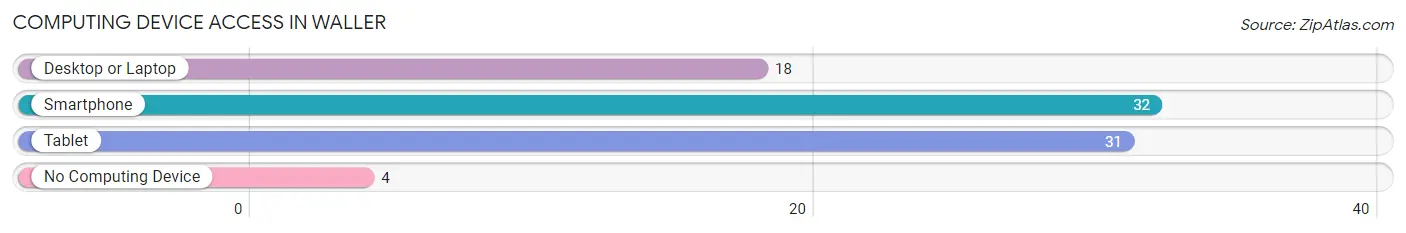
| Device Type | # Households | % Households |
| Desktop or Laptop | 18 | 45.0% |
| Smartphone | 32 | 80.0% |
| Tablet | 31 | 77.5% |
| No Computing Device | 4 | 10.0% |
| Total | 40 | 100.0% |
Internet Access in Waller
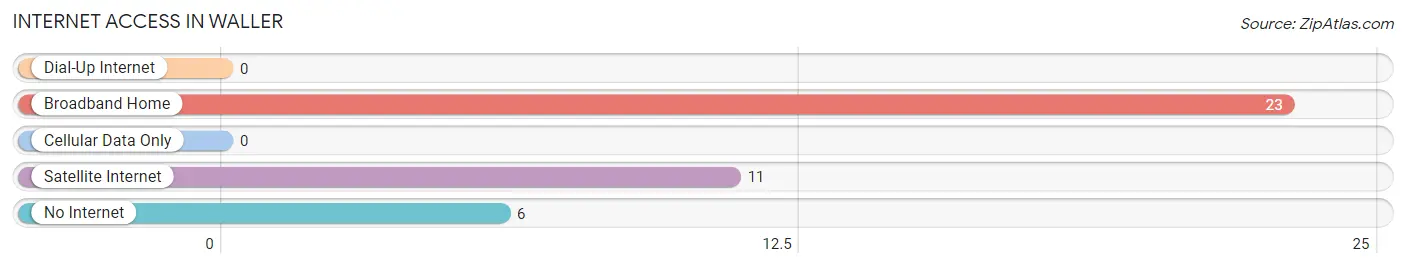
| Internet Type | # Households | % Households |
| Dial-Up Internet | 0 | 0.0% |
| Broadband Home | 23 | 57.5% |
| Cellular Data Only | 0 | 0.0% |
| Satellite Internet | 11 | 27.5% |
| No Internet | 6 | 15.0% |
| Total | 40 | 100.0% |
Waller Summary
History
Waller, Pennsylvania is a small borough located in the northern part of Bucks County, Pennsylvania. It is situated on the banks of the Delaware River, just south of the city of Philadelphia. The area was first settled in the late 1700s by a group of German immigrants who were looking for a place to call home. The town was officially incorporated in 1876 and was named after the Waller family, who were among the first settlers.
The town of Waller has a rich history that dates back to the Revolutionary War. During the war, the town was a major supply center for the Continental Army. The town was also the site of a major battle between the British and American forces in 1777. The battle was a decisive victory for the Americans, and it helped to turn the tide of the war in favor of the colonists.
In the late 1800s, Waller became a popular destination for tourists. The town was known for its picturesque views of the Delaware River and its many historic buildings. The town also had a thriving economy, with many businesses and factories located in the area.
Geography
Waller is located in the northern part of Bucks County, Pennsylvania. It is situated on the banks of the Delaware River, just south of the city of Philadelphia. The town is bordered by the townships of Middletown, Warminster, and Warrington. The total area of Waller is 0.7 square miles, with a population of 1,845 people as of the 2010 census.
The town of Waller is located in a region of rolling hills and valleys. The terrain is mostly flat, with some areas of higher elevation. The town is located in a temperate climate, with hot summers and cold winters. The average annual temperature is around 50 degrees Fahrenheit.
Economy
The economy of Waller is largely based on tourism and small businesses. The town is home to several small businesses, including restaurants, retail stores, and professional services. The town also has a few larger businesses, such as a manufacturing plant and a trucking company.
The town is also home to a number of historic sites, including the Waller Mansion, which was built in the late 1700s. The mansion is now a museum and is open to the public. The town also has a number of parks and recreational areas, including a public pool and a golf course.
Demographics
As of the 2010 census, the population of Waller was 1,845 people. The racial makeup of the town was 94.3% White, 2.2% African American, 0.3% Native American, 0.7% Asian, 0.1% Pacific Islander, and 2.4% from other races. The median household income was $50,938, and the median family income was $60,938.
The town of Waller is served by the Waller Area School District. The district has two elementary schools, one middle school, and one high school. The town also has a public library and a number of churches.
Conclusion
Waller, Pennsylvania is a small borough located in the northern part of Bucks County, Pennsylvania. It is situated on the banks of the Delaware River, just south of the city of Philadelphia. The town has a rich history that dates back to the Revolutionary War, and it is home to a number of historic sites and recreational areas. The economy of Waller is largely based on tourism and small businesses, and the town is served by the Waller Area School District. As of the 2010 census, the population of Waller was 1,845 people.
Common Questions
What is Per Capita Income in Waller?
Per Capita income in Waller is $36,577.
What is Inequality or Gini Index in Waller?
Inequality or Gini Index in Waller is 0.63.
What is the Total Population of Waller?
Total Population of Waller is 69.
What is the Total Male Population of Waller?
Total Male Population of Waller is 21.
What is the Total Female Population of Waller?
Total Female Population of Waller is 48.
What is the Ratio of Males per 100 Females in Waller?
There are 43.75 Males per 100 Females in Waller.
What is the Ratio of Females per 100 Males in Waller?
There are 228.57 Females per 100 Males in Waller.
What is the Median Population Age in Waller?
Median Population Age in Waller is 54.0 Years.
What is the Average Family Size in Waller
Average Family Size in Waller is 1.9 People.
What is the Average Household Size in Waller
Average Household Size in Waller is 1.7 People.
How Large is the Labor Force in Waller?
There are 17 People in the Labor Forcein in Waller.
What is the Percentage of People in the Labor Force in Waller?
27.9% of People are in the Labor Force in Waller.