Woxall, PA Map & Demographics
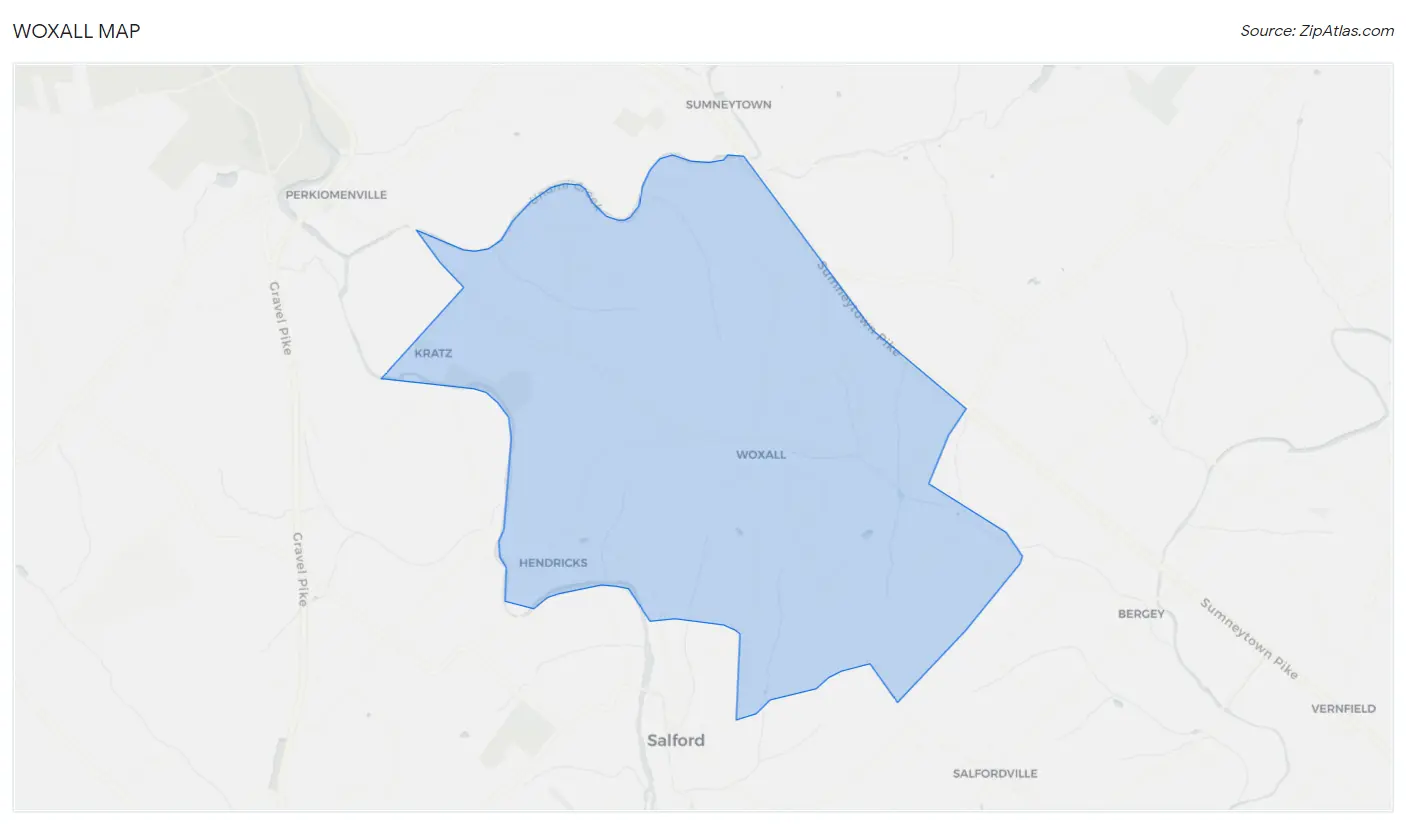
Woxall Map
Woxall Overview
$53,811
PER CAPITA INCOME
$154,479
AVG FAMILY INCOME
$153,021
AVG HOUSEHOLD INCOME
56.8%
WAGE / INCOME GAP [ % ]
43.2¢/ $1
WAGE / INCOME GAP [ $ ]
0.29
INEQUALITY / GINI INDEX
1,392
TOTAL POPULATION
704
MALE POPULATION
688
FEMALE POPULATION
102.33
MALES / 100 FEMALES
97.73
FEMALES / 100 MALES
45.1
MEDIAN AGE
3.1
AVG FAMILY SIZE
3.1
AVG HOUSEHOLD SIZE
814
LABOR FORCE [ PEOPLE ]
76.6%
PERCENT IN LABOR FORCE
Income in Woxall
Income Overview in Woxall
Per Capita Income in Woxall is $53,811, while median incomes of families and households are $154,479 and $153,021 respectively.
| Characteristic | Number | Measure |
| Per Capita Income | 1,392 | $53,811 |
| Median Family Income | 435 | $154,479 |
| Mean Family Income | 435 | $173,775 |
| Median Household Income | 449 | $153,021 |
| Mean Household Income | 449 | $170,345 |
| Income Deficit | 435 | $0 |
| Wage / Income Gap (%) | 1,392 | 56.79% |
| Wage / Income Gap ($) | 1,392 | 43.21¢ per $1 |
| Gini / Inequality Index | 1,392 | 0.29 |
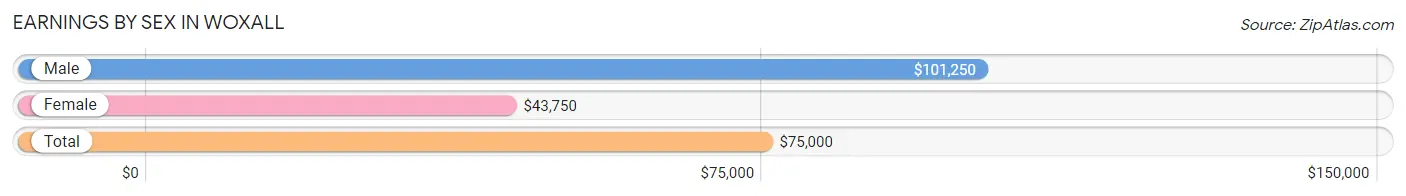
Earnings by Sex in Woxall
Average Earnings in Woxall are $75,000, $101,250 for men and $43,750 for women, a difference of 56.8%.
| Sex | Number | Average Earnings |
| Male | 423 (51.2%) | $101,250 |
| Female | 403 (48.8%) | $43,750 |
| Total | 826 (100.0%) | $75,000 |
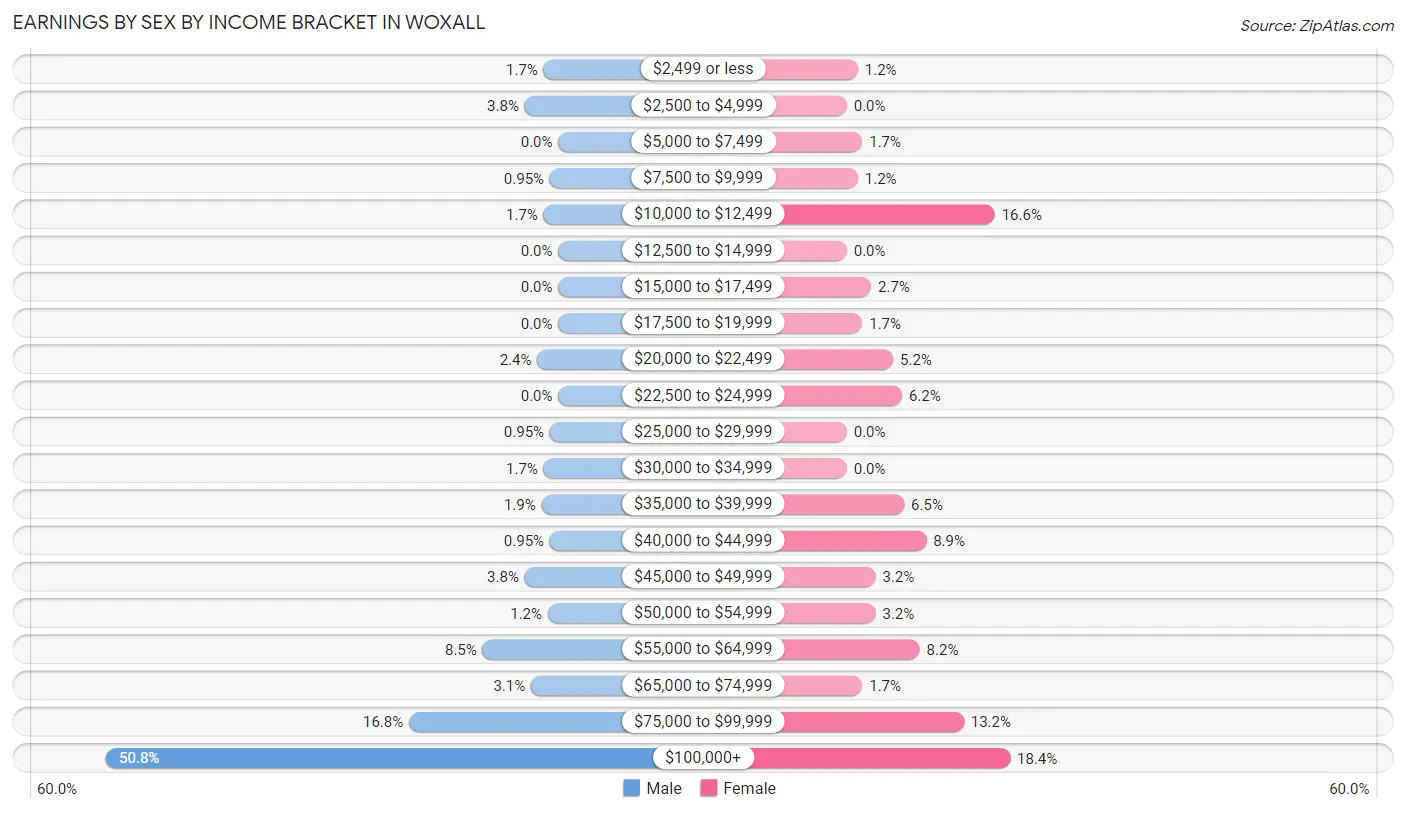
Earnings by Sex by Income Bracket in Woxall
The most common earnings brackets in Woxall are $100,000+ for men (215 | 50.8%) and $100,000+ for women (74 | 18.4%).
| Income | Male | Female |
| $2,499 or less | 7 (1.7%) | 5 (1.2%) |
| $2,500 to $4,999 | 16 (3.8%) | 0 (0.0%) |
| $5,000 to $7,499 | 0 (0.0%) | 7 (1.7%) |
| $7,500 to $9,999 | 4 (0.9%) | 5 (1.2%) |
| $10,000 to $12,499 | 7 (1.7%) | 67 (16.6%) |
| $12,500 to $14,999 | 0 (0.0%) | 0 (0.0%) |
| $15,000 to $17,499 | 0 (0.0%) | 11 (2.7%) |
| $17,500 to $19,999 | 0 (0.0%) | 7 (1.7%) |
| $20,000 to $22,499 | 10 (2.4%) | 21 (5.2%) |
| $22,500 to $24,999 | 0 (0.0%) | 25 (6.2%) |
| $25,000 to $29,999 | 4 (0.9%) | 0 (0.0%) |
| $30,000 to $34,999 | 7 (1.7%) | 0 (0.0%) |
| $35,000 to $39,999 | 8 (1.9%) | 26 (6.5%) |
| $40,000 to $44,999 | 4 (0.9%) | 36 (8.9%) |
| $45,000 to $49,999 | 16 (3.8%) | 13 (3.2%) |
| $50,000 to $54,999 | 5 (1.2%) | 13 (3.2%) |
| $55,000 to $64,999 | 36 (8.5%) | 33 (8.2%) |
| $65,000 to $74,999 | 13 (3.1%) | 7 (1.7%) |
| $75,000 to $99,999 | 71 (16.8%) | 53 (13.2%) |
| $100,000+ | 215 (50.8%) | 74 (18.4%) |
| Total | 423 (100.0%) | 403 (100.0%) |
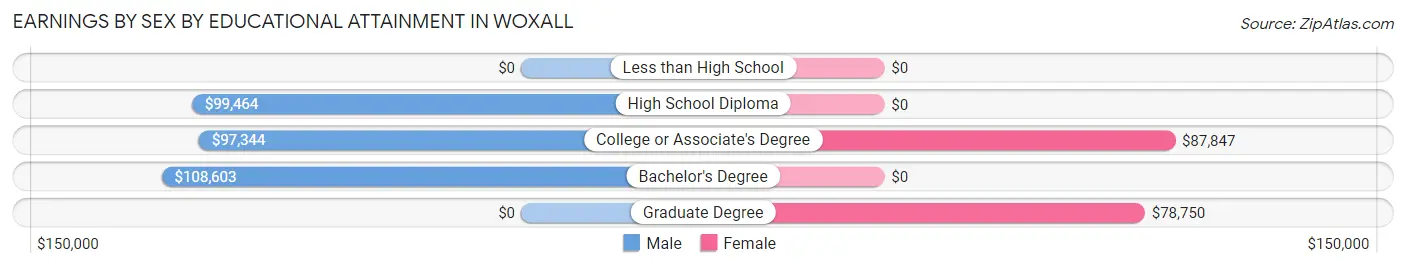
Earnings by Sex by Educational Attainment in Woxall
Average earnings in Woxall are $103,676 for men and $47,885 for women, a difference of 53.8%. Men with an educational attainment of bachelor's degree enjoy the highest average annual earnings of $108,603, while those with college or associate's degree education earn the least with $97,344. Women with an educational attainment of college or associate's degree earn the most with the average annual earnings of $87,847, while those with graduate degree education have the smallest earnings of $78,750.
| Educational Attainment | Male Income | Female Income |
| Less than High School | - | - |
| High School Diploma | $99,464 | $0 |
| College or Associate's Degree | $97,344 | $87,847 |
| Bachelor's Degree | $108,603 | $0 |
| Graduate Degree | - | - |
| Total | $103,676 | $47,885 |
Family Income in Woxall
Family Income Brackets in Woxall
According to the Woxall family income data, there are 135 families falling into the $100,000 to $149,999 income range, which is the most common income bracket and makes up 31.0% of all families.
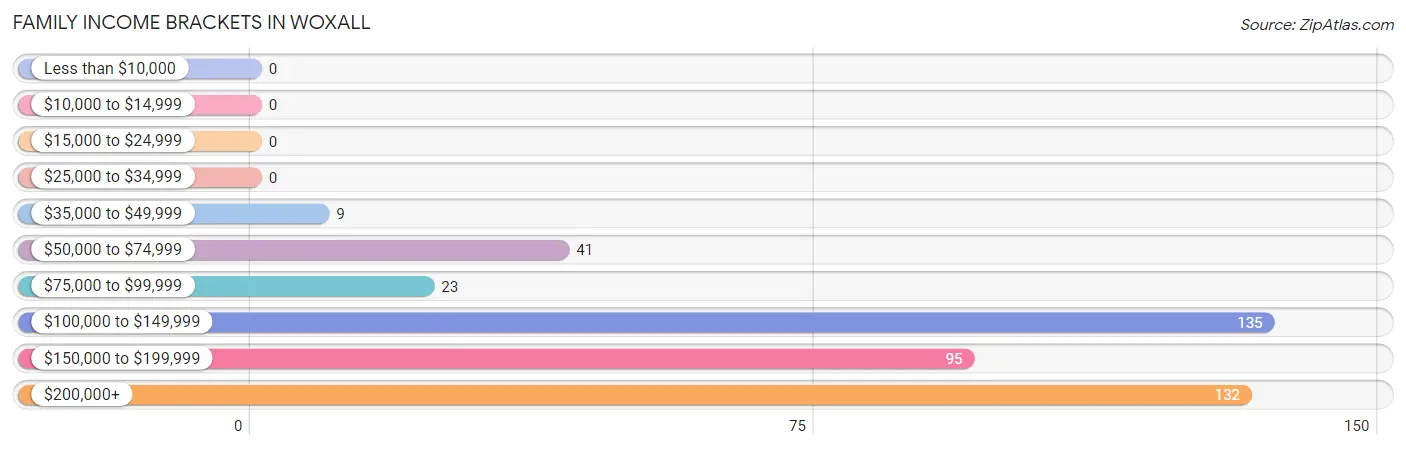
| Income Bracket | # Families | % Families |
| Less than $10,000 | 0 | 0.0% |
| $10,000 to $14,999 | 0 | 0.0% |
| $15,000 to $24,999 | 0 | 0.0% |
| $25,000 to $34,999 | 0 | 0.0% |
| $35,000 to $49,999 | 9 | 2.1% |
| $50,000 to $74,999 | 41 | 9.4% |
| $75,000 to $99,999 | 23 | 5.3% |
| $100,000 to $149,999 | 135 | 31.0% |
| $150,000 to $199,999 | 95 | 21.8% |
| $200,000+ | 132 | 30.3% |
Family Income by Famaliy Size in Woxall
3-person families (70 | 16.1%) account for the highest median family income in Woxall with $213,929 per family, while 3-person families (70 | 16.1%) have the highest median income of $71,310 per family member.
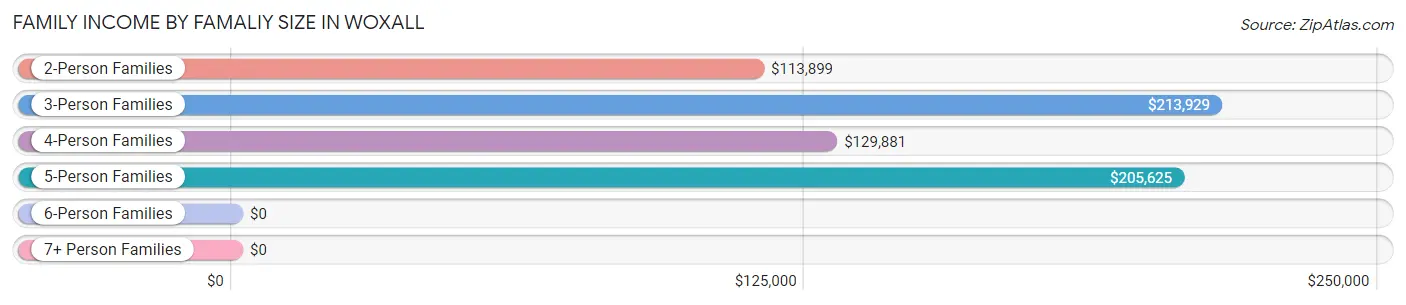
| Income Bracket | # Families | Median Income |
| 2-Person Families | 221 (50.8%) | $113,899 |
| 3-Person Families | 70 (16.1%) | $213,929 |
| 4-Person Families | 56 (12.9%) | $129,881 |
| 5-Person Families | 72 (16.6%) | $205,625 |
| 6-Person Families | 10 (2.3%) | $0 |
| 7+ Person Families | 6 (1.4%) | $0 |
| Total | 435 (100.0%) | $154,479 |
Family Income by Number of Earners in Woxall
The median family income in Woxall is $154,479, with families comprising 3+ earners (80) having the highest median family income of $214,286, while families with no earners (54) have the lowest median family income of $58,947, accounting for 18.4% and 12.4% of families, respectively.
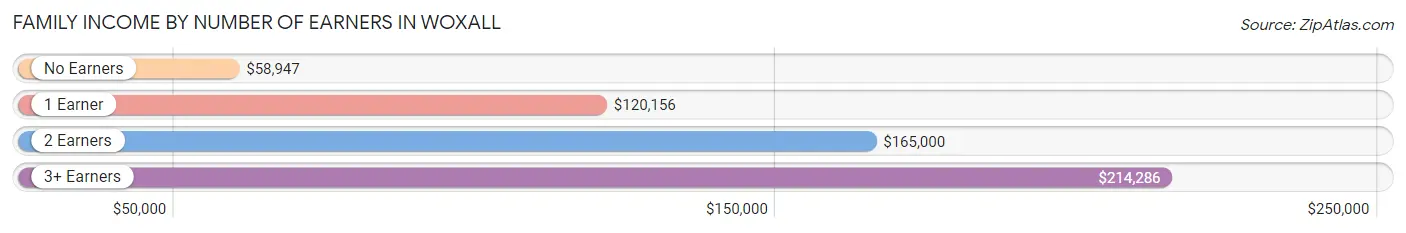
| Number of Earners | # Families | Median Income |
| No Earners | 54 (12.4%) | $58,947 |
| 1 Earner | 41 (9.4%) | $120,156 |
| 2 Earners | 260 (59.8%) | $165,000 |
| 3+ Earners | 80 (18.4%) | $214,286 |
| Total | 435 (100.0%) | $154,479 |
Household Income in Woxall
Household Income Brackets in Woxall
With 135 households falling in the category, the $100,000 to $149,999 income range is the most frequent in Woxall, accounting for 30.1% of all households.
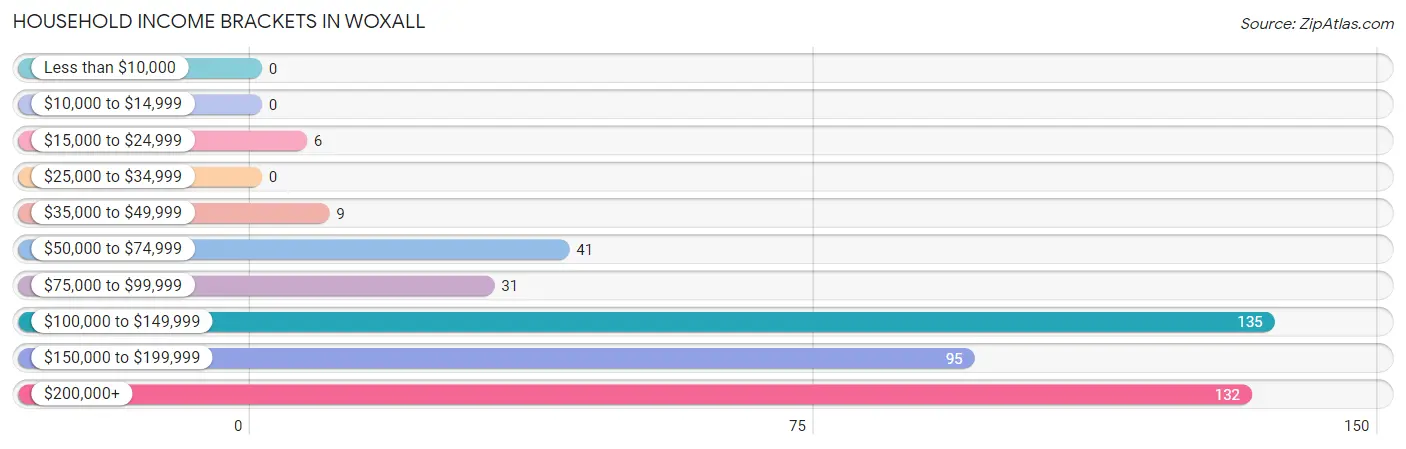
| Income Bracket | # Households | % Households |
| Less than $10,000 | 0 | 0.0% |
| $10,000 to $14,999 | 0 | 0.0% |
| $15,000 to $24,999 | 6 | 1.3% |
| $25,000 to $34,999 | 0 | 0.0% |
| $35,000 to $49,999 | 9 | 2.0% |
| $50,000 to $74,999 | 41 | 9.1% |
| $75,000 to $99,999 | 31 | 6.9% |
| $100,000 to $149,999 | 135 | 30.1% |
| $150,000 to $199,999 | 95 | 21.2% |
| $200,000+ | 132 | 29.4% |
Household Income by Householder Age in Woxall
The median household income in Woxall is $153,021, with the highest median household income of $199,931 found in the 25 to 44 years age bracket for the primary householder. A total of 105 households (23.4%) fall into this category.
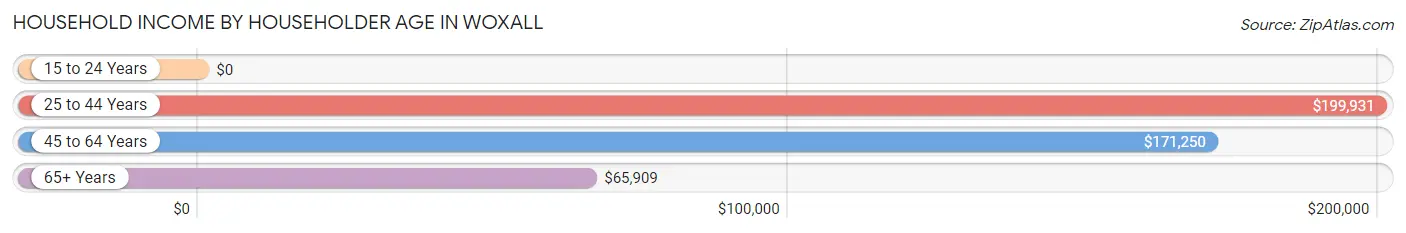
| Income Bracket | # Households | Median Income |
| 15 to 24 Years | 0 (0.0%) | $0 |
| 25 to 44 Years | 105 (23.4%) | $199,931 |
| 45 to 64 Years | 254 (56.6%) | $171,250 |
| 65+ Years | 90 (20.0%) | $65,909 |
| Total | 449 (100.0%) | $153,021 |
Poverty in Woxall
Income Below Poverty by Sex and Age in Woxall
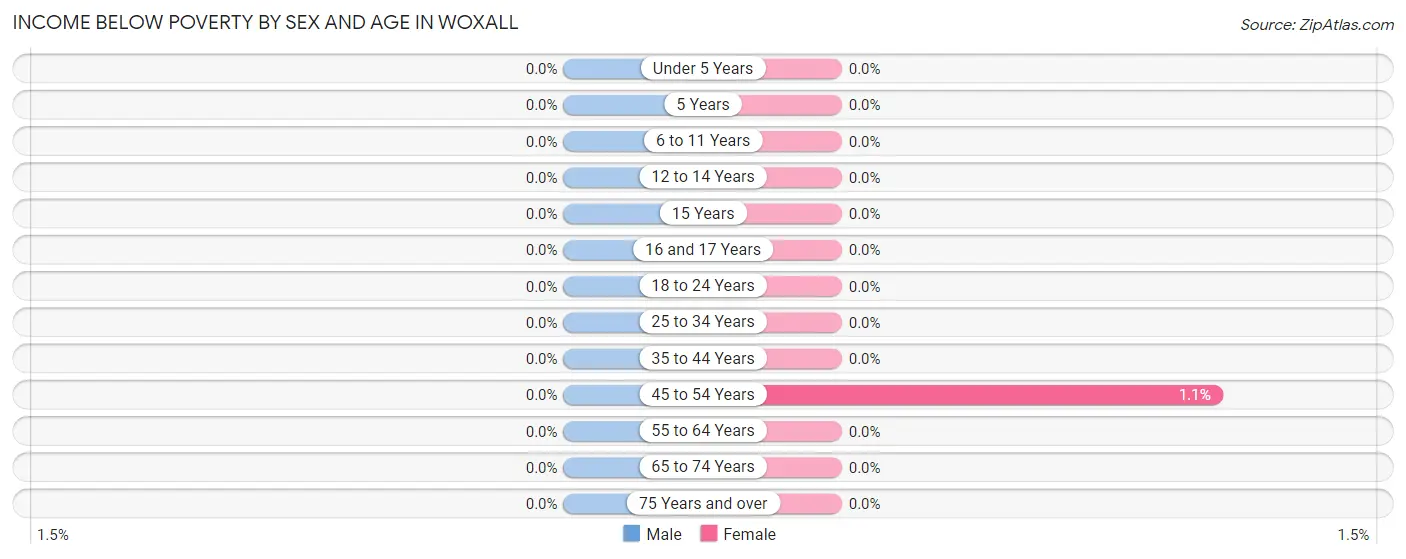
| Age Bracket | Male | Female |
| Under 5 Years | 0 (0.0%) | 0 (0.0%) |
| 5 Years | 0 (0.0%) | 0 (0.0%) |
| 6 to 11 Years | 0 (0.0%) | 0 (0.0%) |
| 12 to 14 Years | 0 (0.0%) | 0 (0.0%) |
| 15 Years | 0 (0.0%) | 0 (0.0%) |
| 16 and 17 Years | 0 (0.0%) | 0 (0.0%) |
| 18 to 24 Years | 0 (0.0%) | 0 (0.0%) |
| 25 to 34 Years | 0 (0.0%) | 0 (0.0%) |
| 35 to 44 Years | 0 (0.0%) | 0 (0.0%) |
| 45 to 54 Years | 0 (0.0%) | 1 (1.1%) |
| 55 to 64 Years | 0 (0.0%) | 0 (0.0%) |
| 65 to 74 Years | 0 (0.0%) | 0 (0.0%) |
| 75 Years and over | 0 (0.0%) | 0 (0.0%) |
| Total | 0 (0.0%) | 1 (0.2%) |
Income Above Poverty by Sex and Age in Woxall
According to the poverty statistics in Woxall, males aged under 5 years and females aged under 5 years are the age groups that are most secure financially, with 100.0% of males and 100.0% of females in these age groups living above the poverty line.
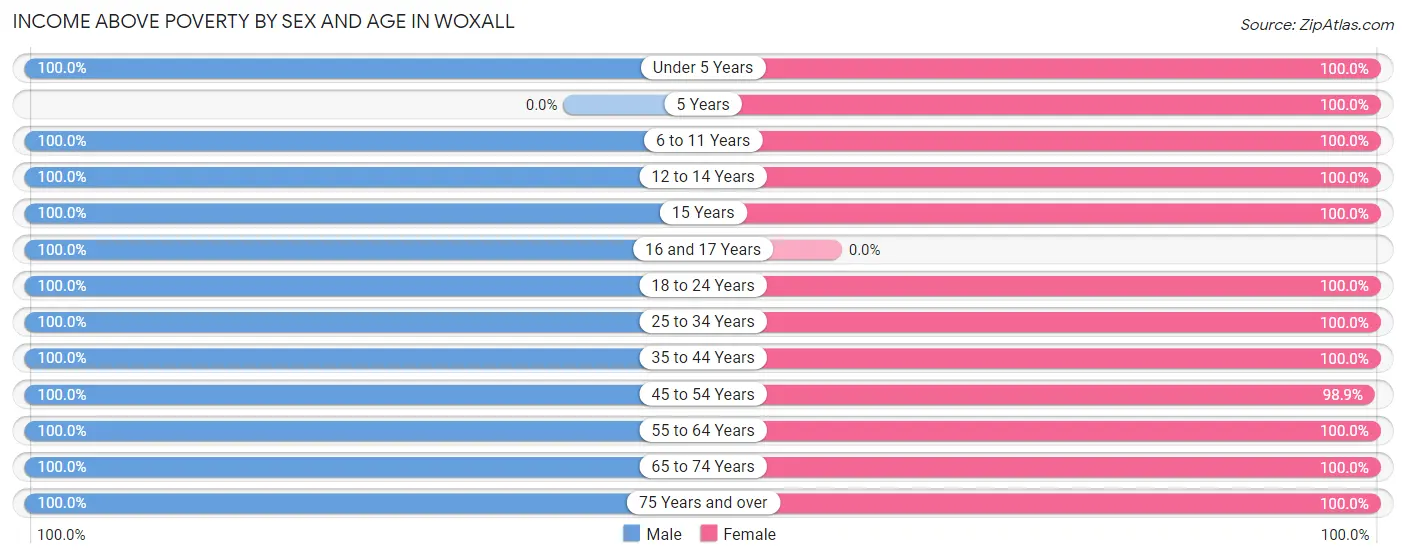
| Age Bracket | Male | Female |
| Under 5 Years | 53 (100.0%) | 24 (100.0%) |
| 5 Years | 0 (0.0%) | 18 (100.0%) |
| 6 to 11 Years | 38 (100.0%) | 77 (100.0%) |
| 12 to 14 Years | 56 (100.0%) | 27 (100.0%) |
| 15 Years | 12 (100.0%) | 14 (100.0%) |
| 16 and 17 Years | 33 (100.0%) | 0 (0.0%) |
| 18 to 24 Years | 50 (100.0%) | 43 (100.0%) |
| 25 to 34 Years | 23 (100.0%) | 85 (100.0%) |
| 35 to 44 Years | 63 (100.0%) | 68 (100.0%) |
| 45 to 54 Years | 84 (100.0%) | 93 (98.9%) |
| 55 to 64 Years | 141 (100.0%) | 152 (100.0%) |
| 65 to 74 Years | 105 (100.0%) | 40 (100.0%) |
| 75 Years and over | 36 (100.0%) | 46 (100.0%) |
| Total | 694 (100.0%) | 687 (99.9%) |
Income Below Poverty Among Married-Couple Families in Woxall
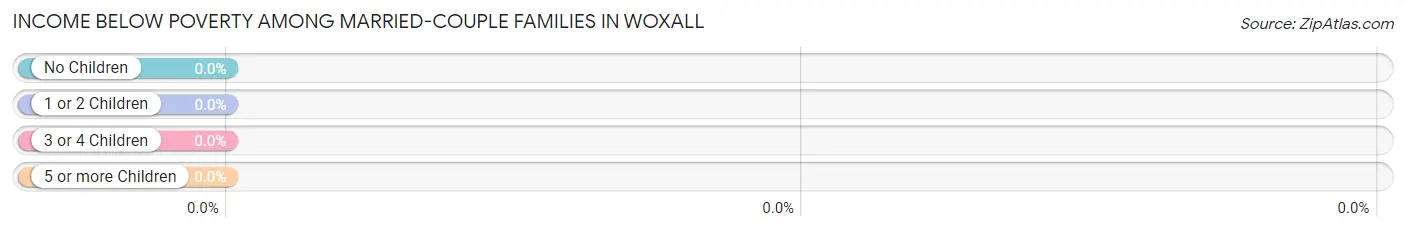
| Children | Above Poverty | Below Poverty |
| No Children | 267 (100.0%) | 0 (0.0%) |
| 1 or 2 Children | 90 (100.0%) | 0 (0.0%) |
| 3 or 4 Children | 58 (100.0%) | 0 (0.0%) |
| 5 or more Children | 0 (0.0%) | 0 (0.0%) |
| Total | 415 (100.0%) | 0 (0.0%) |
Income Below Poverty Among Single-Parent Households in Woxall
| Children | Single Father | Single Mother |
| No Children | 0 (0.0%) | 0 (0.0%) |
| 1 or 2 Children | 0 (0.0%) | 0 (0.0%) |
| 3 or 4 Children | 0 (0.0%) | 0 (0.0%) |
| 5 or more Children | 0 (0.0%) | 0 (0.0%) |
| Total | 0 (0.0%) | 0 (0.0%) |
Income Below Poverty Among Married-Couple vs Single-Parent Households in Woxall
| Children | Married-Couple Families | Single-Parent Households |
| No Children | 0 (0.0%) | 0 (0.0%) |
| 1 or 2 Children | 0 (0.0%) | 0 (0.0%) |
| 3 or 4 Children | 0 (0.0%) | 0 (0.0%) |
| 5 or more Children | 0 (0.0%) | 0 (0.0%) |
| Total | 0 (0.0%) | 0 (0.0%) |
Race in Woxall
The most populous races in Woxall are White / Caucasian (1,201 | 86.3%), Two or more Races (170 | 12.2%), and Hispanic or Latino (89 | 6.4%).
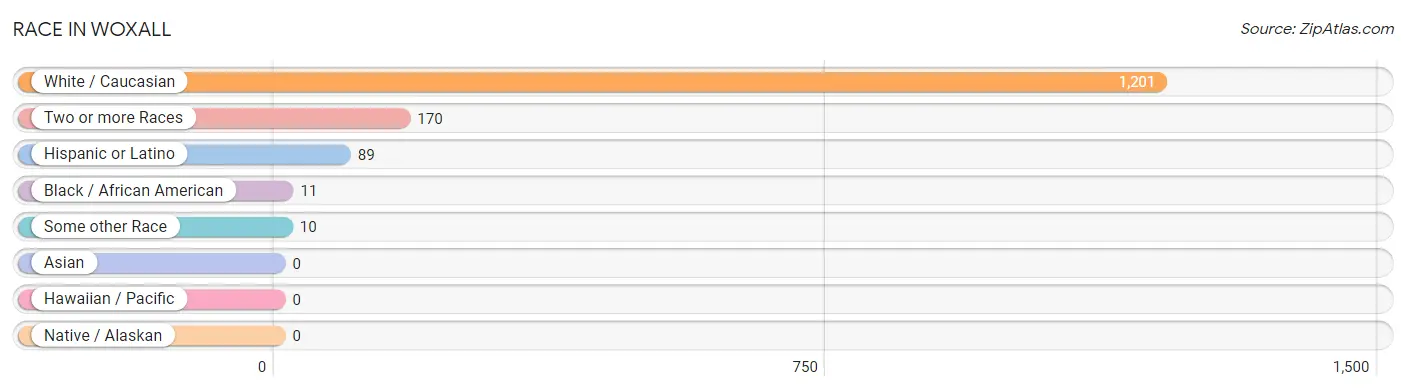
| Race | # Population | % Population |
| Asian | 0 | 0.0% |
| Black / African American | 11 | 0.8% |
| Hawaiian / Pacific | 0 | 0.0% |
| Hispanic or Latino | 89 | 6.4% |
| Native / Alaskan | 0 | 0.0% |
| White / Caucasian | 1,201 | 86.3% |
| Two or more Races | 170 | 12.2% |
| Some other Race | 10 | 0.7% |
| Total | 1,392 | 100.0% |
Ancestry in Woxall
The most populous ancestries reported in Woxall are German (611 | 43.9%), English (226 | 16.2%), Irish (194 | 13.9%), American (120 | 8.6%), and Italian (104 | 7.5%), together accounting for 90.2% of all Woxall residents.
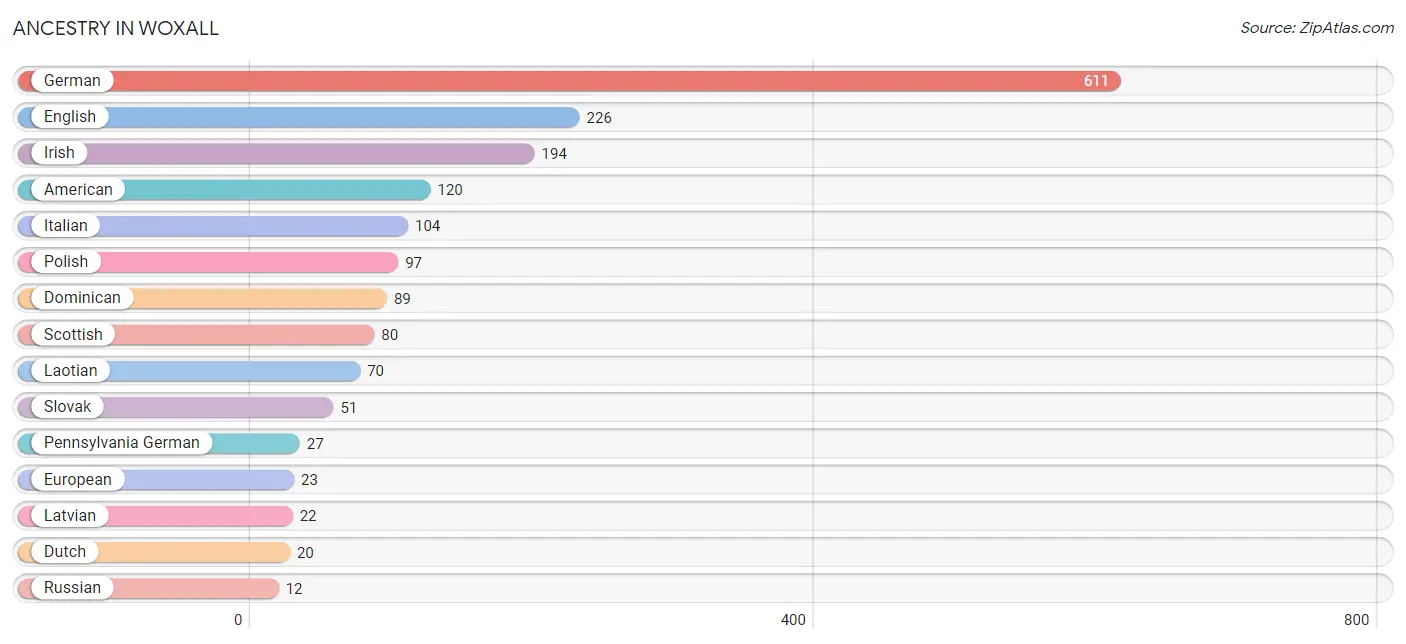
| Ancestry | # Population | % Population |
| American | 120 | 8.6% |
| Austrian | 5 | 0.4% |
| Dominican | 89 | 6.4% |
| Dutch | 20 | 1.4% |
| Eastern European | 4 | 0.3% |
| English | 226 | 16.2% |
| European | 23 | 1.7% |
| German | 611 | 43.9% |
| Irish | 194 | 13.9% |
| Italian | 104 | 7.5% |
| Japanese | 11 | 0.8% |
| Laotian | 70 | 5.0% |
| Latvian | 22 | 1.6% |
| Pennsylvania German | 27 | 1.9% |
| Polish | 97 | 7.0% |
| Russian | 12 | 0.9% |
| Scottish | 80 | 5.8% |
| Slovak | 51 | 3.7% |
| Swedish | 5 | 0.4% |
| Ukrainian | 7 | 0.5% |
| Welsh | 7 | 0.5% | View All 21 Rows |
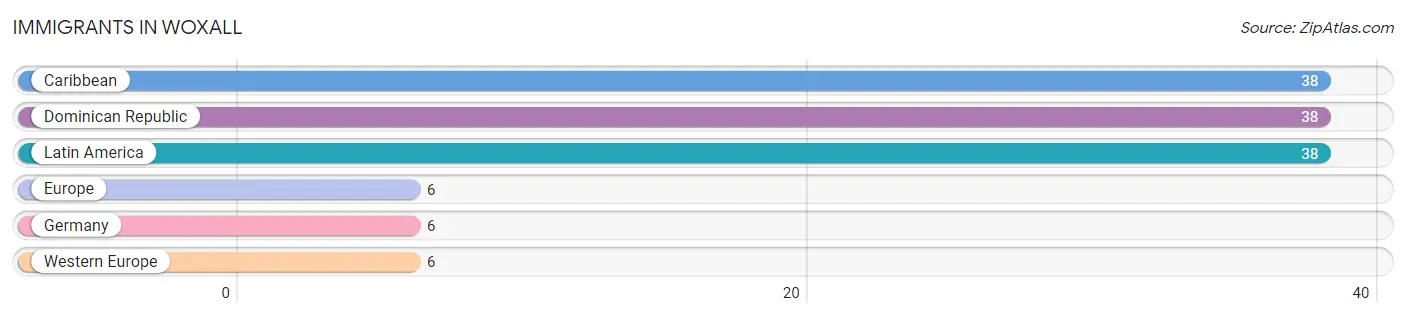
Immigrants in Woxall
The most numerous immigrant groups reported in Woxall came from Caribbean (38 | 2.7%), Dominican Republic (38 | 2.7%), Latin America (38 | 2.7%), Europe (6 | 0.4%), and Germany (6 | 0.4%), together accounting for 9.0% of all Woxall residents.
| Immigration Origin | # Population | % Population |
| Caribbean | 38 | 2.7% |
| Dominican Republic | 38 | 2.7% |
| Europe | 6 | 0.4% |
| Germany | 6 | 0.4% |
| Latin America | 38 | 2.7% |
| Western Europe | 6 | 0.4% | View All 6 Rows |
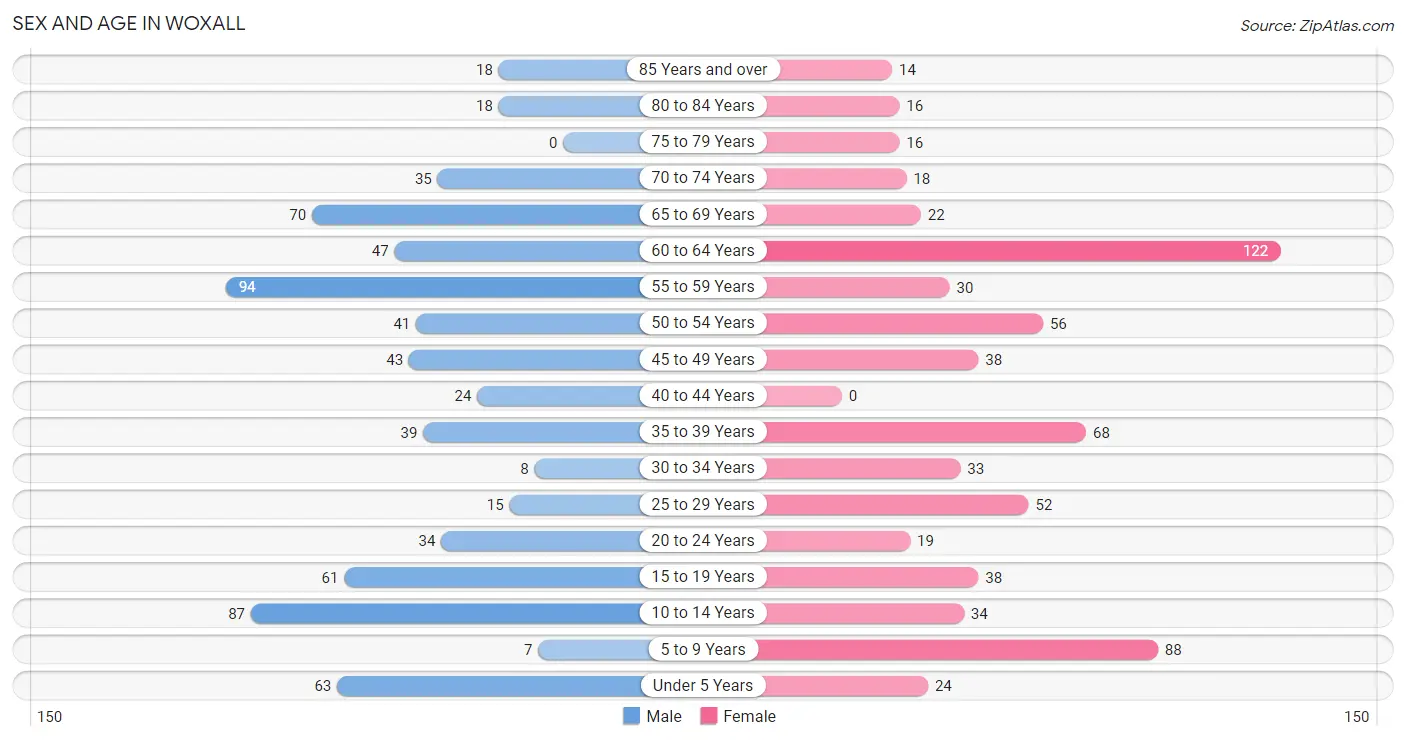
Sex and Age in Woxall
Sex and Age in Woxall
The most populous age groups in Woxall are 55 to 59 Years (94 | 13.4%) for men and 60 to 64 Years (122 | 17.7%) for women.
| Age Bracket | Male | Female |
| Under 5 Years | 63 (8.9%) | 24 (3.5%) |
| 5 to 9 Years | 7 (1.0%) | 88 (12.8%) |
| 10 to 14 Years | 87 (12.4%) | 34 (4.9%) |
| 15 to 19 Years | 61 (8.7%) | 38 (5.5%) |
| 20 to 24 Years | 34 (4.8%) | 19 (2.8%) |
| 25 to 29 Years | 15 (2.1%) | 52 (7.6%) |
| 30 to 34 Years | 8 (1.1%) | 33 (4.8%) |
| 35 to 39 Years | 39 (5.5%) | 68 (9.9%) |
| 40 to 44 Years | 24 (3.4%) | 0 (0.0%) |
| 45 to 49 Years | 43 (6.1%) | 38 (5.5%) |
| 50 to 54 Years | 41 (5.8%) | 56 (8.1%) |
| 55 to 59 Years | 94 (13.4%) | 30 (4.4%) |
| 60 to 64 Years | 47 (6.7%) | 122 (17.7%) |
| 65 to 69 Years | 70 (9.9%) | 22 (3.2%) |
| 70 to 74 Years | 35 (5.0%) | 18 (2.6%) |
| 75 to 79 Years | 0 (0.0%) | 16 (2.3%) |
| 80 to 84 Years | 18 (2.6%) | 16 (2.3%) |
| 85 Years and over | 18 (2.6%) | 14 (2.0%) |
| Total | 704 (100.0%) | 688 (100.0%) |
Families and Households in Woxall
Median Family Size in Woxall
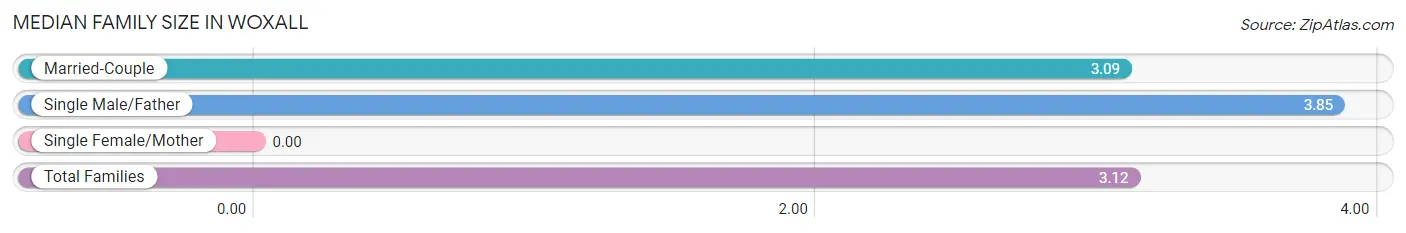
| Family Type | # Families | Family Size |
| Married-Couple | 415 (95.4%) | 3.09 |
| Single Male/Father | 20 (4.6%) | 3.85 |
| Single Female/Mother | 0 (0.0%) | - |
| Total Families | 435 (100.0%) | 3.12 |
Median Household Size in Woxall
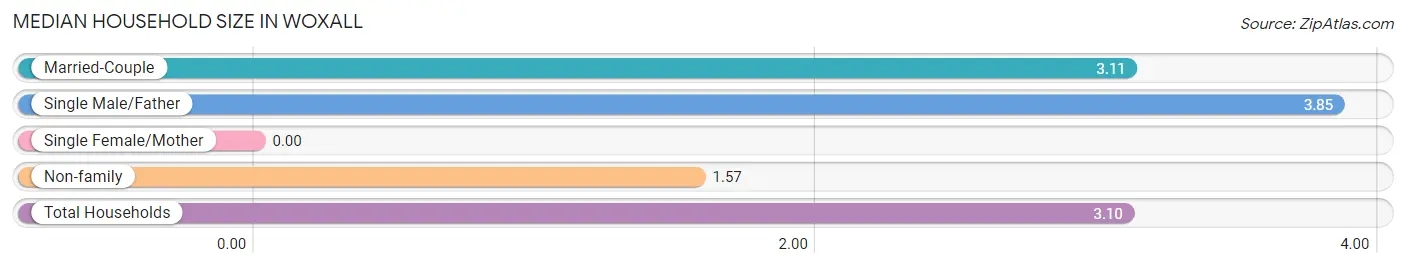
| Household Type | # Households | Household Size |
| Married-Couple | 415 (92.4%) | 3.11 |
| Single Male/Father | 20 (4.4%) | 3.85 |
| Single Female/Mother | 0 (0.0%) | - |
| Non-family | 14 (3.1%) | 1.57 |
| Total Households | 449 (100.0%) | 3.10 |
Household Size by Marriage Status in Woxall
Out of a total of 449 households in Woxall, 435 (96.9%) are family households, while 14 (3.1%) are nonfamily households. The most numerous type of family households are 2-person households, comprising 221, and the most common type of nonfamily households are 2-person households, comprising 8.
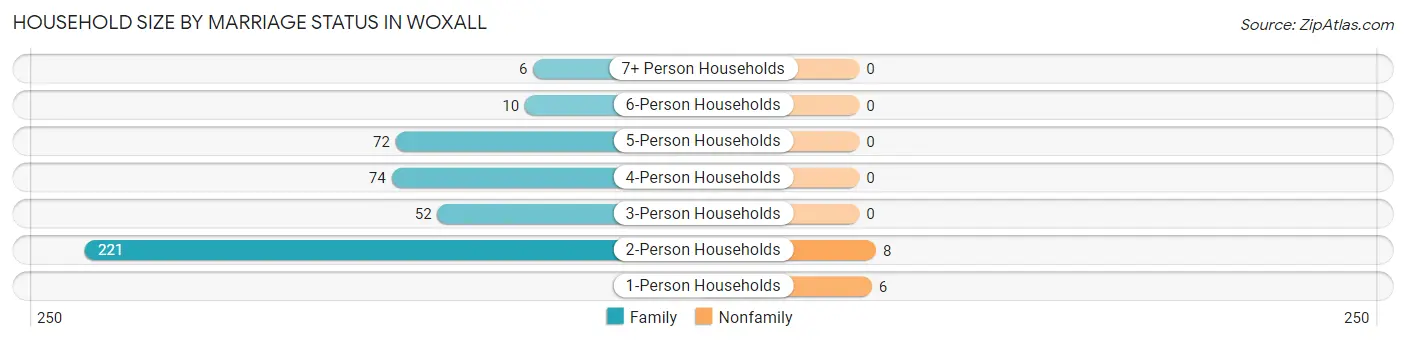
| Household Size | Family Households | Nonfamily Households |
| 1-Person Households | - | 6 (1.3%) |
| 2-Person Households | 221 (49.2%) | 8 (1.8%) |
| 3-Person Households | 52 (11.6%) | 0 (0.0%) |
| 4-Person Households | 74 (16.5%) | 0 (0.0%) |
| 5-Person Households | 72 (16.0%) | 0 (0.0%) |
| 6-Person Households | 10 (2.2%) | 0 (0.0%) |
| 7+ Person Households | 6 (1.3%) | 0 (0.0%) |
| Total | 435 (96.9%) | 14 (3.1%) |
Female Fertility in Woxall
Fertility by Age in Woxall
Average fertility rate in Woxall is 97.0 births per 1,000 women. Women in the age bracket of 35 to 50 years have the highest fertility rate with 226.0 births per 1,000 women. Women in the age bracket of 35 to 50 years acount for 100.0% of all women with births.
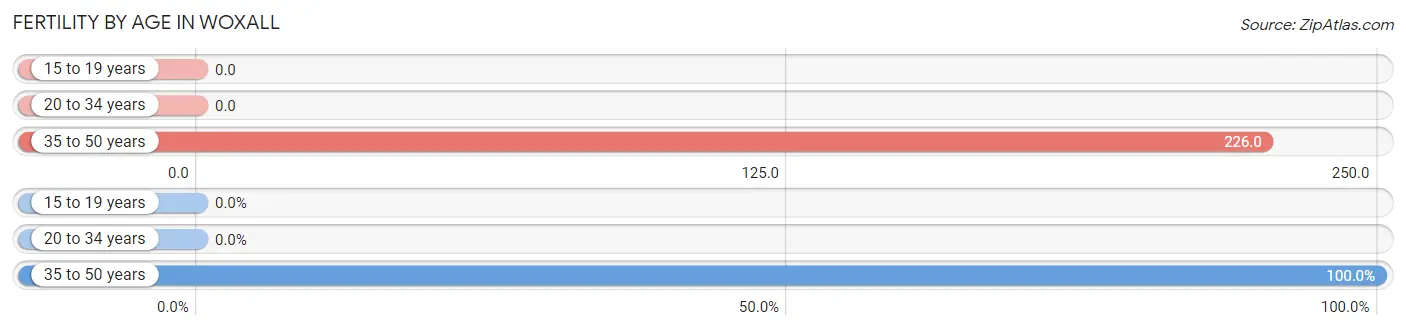
| Age Bracket | Women with Births | Births / 1,000 Women |
| 15 to 19 years | 0 (0.0%) | 0.0 |
| 20 to 34 years | 0 (0.0%) | 0.0 |
| 35 to 50 years | 24 (100.0%) | 226.0 |
| Total | 24 (100.0%) | 97.0 |
Fertility by Age by Marriage Status in Woxall
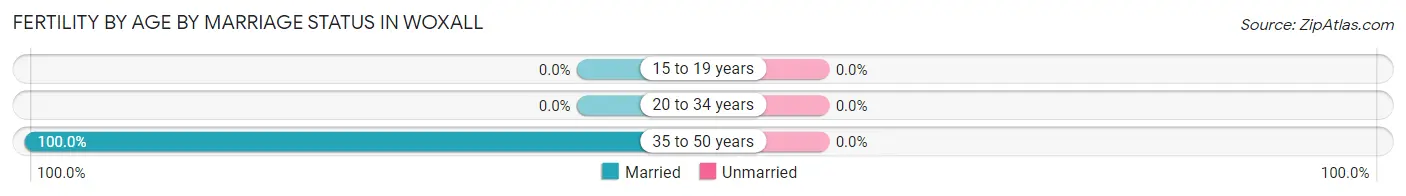
| Age Bracket | Married | Unmarried |
| 15 to 19 years | 0 (0.0%) | 0 (0.0%) |
| 20 to 34 years | 0 (0.0%) | 0 (0.0%) |
| 35 to 50 years | 24 (100.0%) | 0 (0.0%) |
| Total | 24 (100.0%) | 0 (0.0%) |
Fertility by Education in Woxall
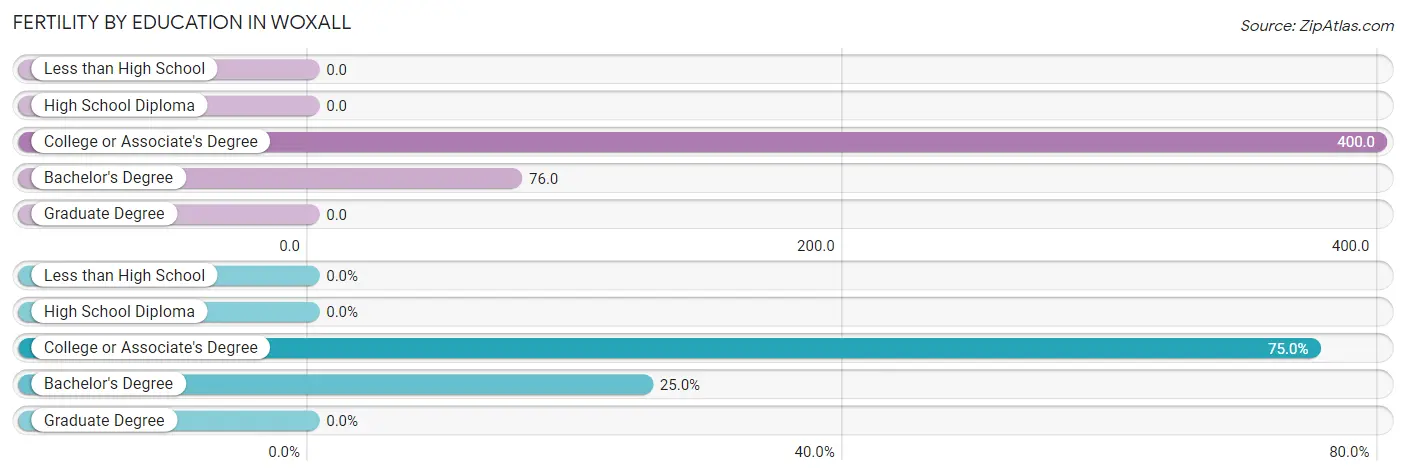
| Educational Attainment | Women with Births | Births / 1,000 Women |
| Less than High School | 0 (0.0%) | 0.0 |
| High School Diploma | 0 (0.0%) | 0.0 |
| College or Associate's Degree | 18 (75.0%) | 400.0 |
| Bachelor's Degree | 6 (25.0%) | 76.0 |
| Graduate Degree | 0 (0.0%) | 0.0 |
| Total | 24 (100.0%) | 97.0 |
Fertility by Education by Marriage Status in Woxall
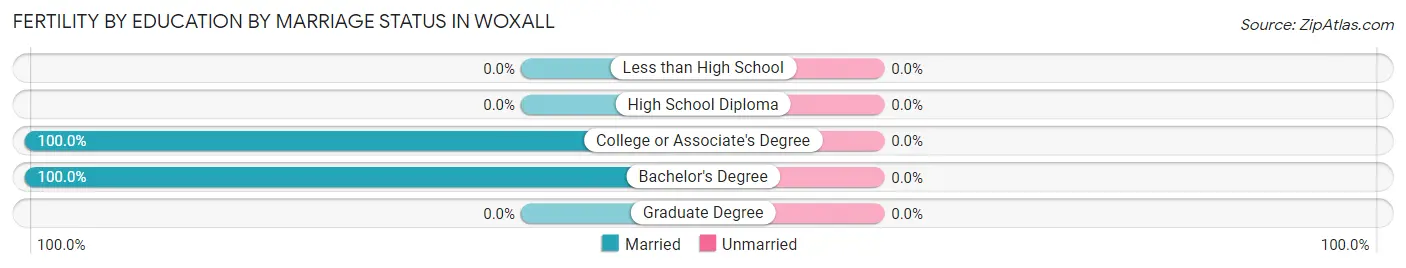
| Educational Attainment | Married | Unmarried |
| Less than High School | 0 (0.0%) | 0 (0.0%) |
| High School Diploma | 0 (0.0%) | 0 (0.0%) |
| College or Associate's Degree | 18 (100.0%) | 0 (0.0%) |
| Bachelor's Degree | 6 (100.0%) | 0 (0.0%) |
| Graduate Degree | 0 (0.0%) | 0 (0.0%) |
| Total | 24 (100.0%) | 0 (0.0%) |
Employment Characteristics in Woxall
Employment by Class of Employer in Woxall
Among the 814 employed individuals in Woxall, private company employees (552 | 67.8%), self-employed (not incorporated) (112 | 13.8%), and local government employees (70 | 8.6%) make up the most common classes of employment.
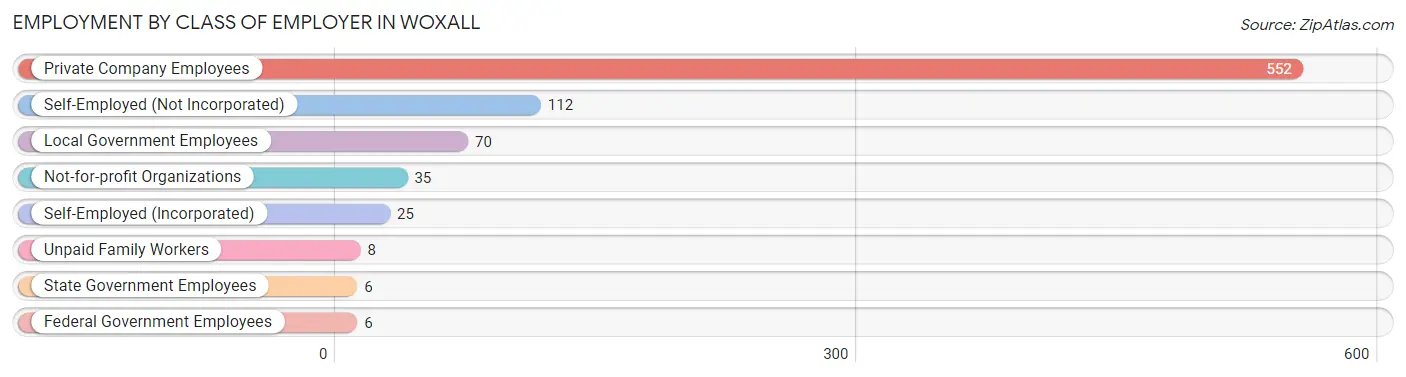
| Employer Class | # Employees | % Employees |
| Private Company Employees | 552 | 67.8% |
| Self-Employed (Incorporated) | 25 | 3.1% |
| Self-Employed (Not Incorporated) | 112 | 13.8% |
| Not-for-profit Organizations | 35 | 4.3% |
| Local Government Employees | 70 | 8.6% |
| State Government Employees | 6 | 0.7% |
| Federal Government Employees | 6 | 0.7% |
| Unpaid Family Workers | 8 | 1.0% |
| Total | 814 | 100.0% |
Employment Status by Age in Woxall
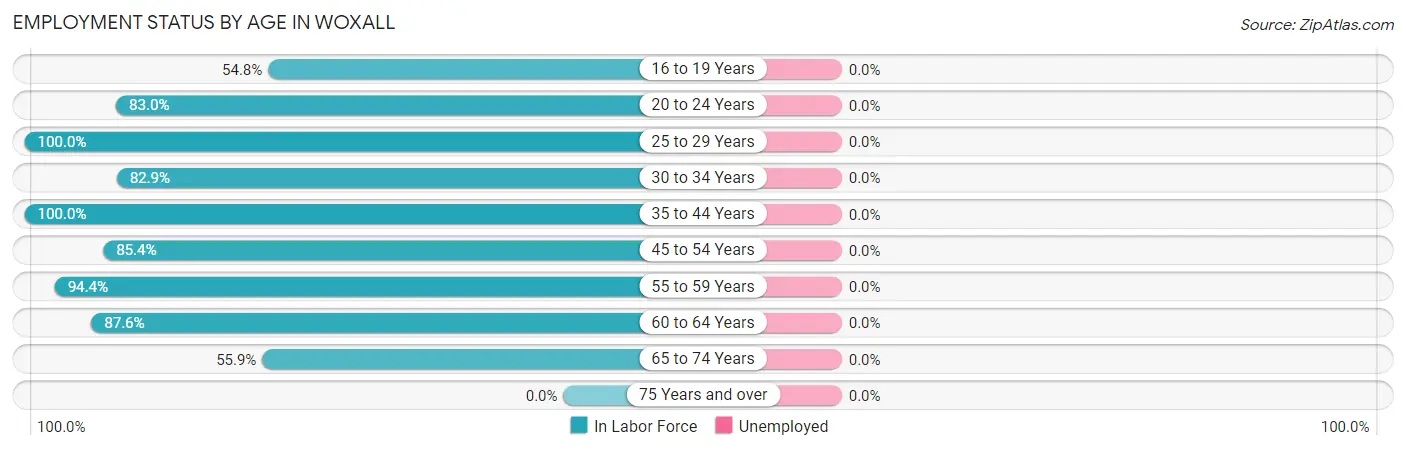
| Age Bracket | In Labor Force | Unemployed |
| 16 to 19 Years | 40 (54.8%) | 0 (0.0%) |
| 20 to 24 Years | 44 (83.0%) | 0 (0.0%) |
| 25 to 29 Years | 67 (100.0%) | 0 (0.0%) |
| 30 to 34 Years | 34 (82.9%) | 0 (0.0%) |
| 35 to 44 Years | 131 (100.0%) | 0 (0.0%) |
| 45 to 54 Years | 152 (85.4%) | 0 (0.0%) |
| 55 to 59 Years | 117 (94.4%) | 0 (0.0%) |
| 60 to 64 Years | 148 (87.6%) | 0 (0.0%) |
| 65 to 74 Years | 81 (55.9%) | 0 (0.0%) |
| 75 Years and over | 0 (0.0%) | 0 (0.0%) |
| Total | 814 (76.6%) | 0 (0.0%) |
Employment Status by Educational Attainment in Woxall
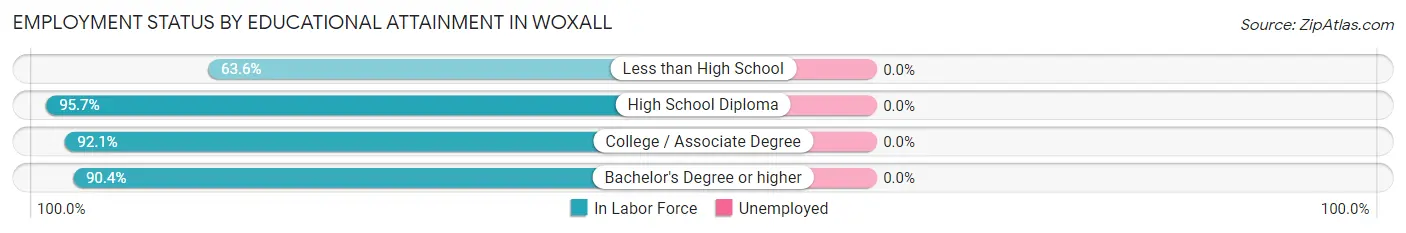
| Educational Attainment | In Labor Force | Unemployed |
| Less than High School | 21 (63.6%) | 0 (0.0%) |
| High School Diploma | 225 (95.7%) | 0 (0.0%) |
| College / Associate Degree | 176 (92.1%) | 0 (0.0%) |
| Bachelor's Degree or higher | 227 (90.4%) | 0 (0.0%) |
| Total | 649 (91.4%) | 0 (0.0%) |
Employment Occupations by Sex in Woxall
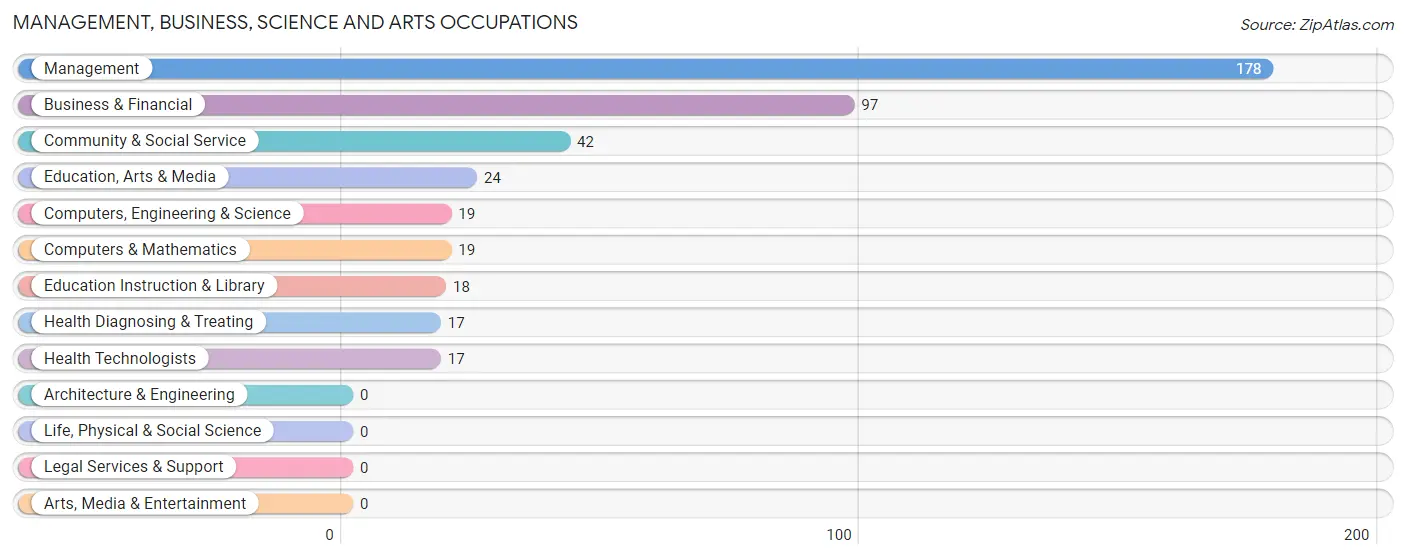
Management, Business, Science and Arts Occupations
The most common Management, Business, Science and Arts occupations in Woxall are Management (178 | 21.9%), Business & Financial (97 | 11.9%), Community & Social Service (42 | 5.2%), Education, Arts & Media (24 | 2.9%), and Computers, Engineering & Science (19 | 2.3%).
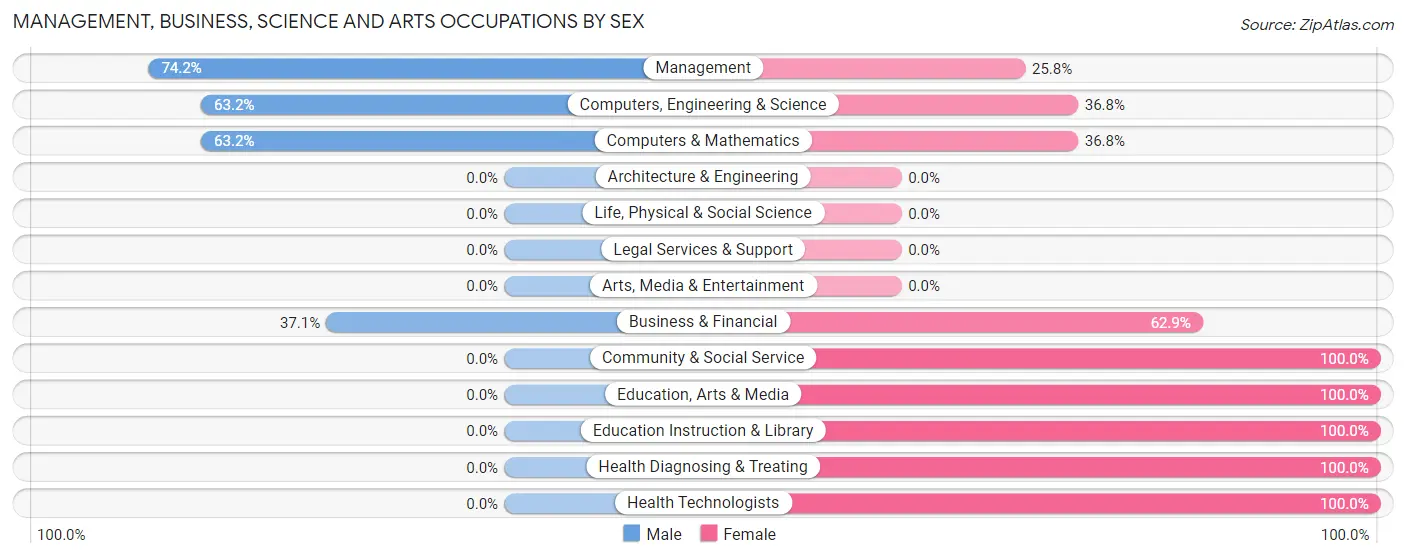
Management, Business, Science and Arts Occupations by Sex
Within the Management, Business, Science and Arts occupations in Woxall, the most male-oriented occupations are Management (74.2%), Computers, Engineering & Science (63.2%), and Computers & Mathematics (63.2%), while the most female-oriented occupations are Community & Social Service (100.0%), Education, Arts & Media (100.0%), and Education Instruction & Library (100.0%).
| Occupation | Male | Female |
| Management | 132 (74.2%) | 46 (25.8%) |
| Business & Financial | 36 (37.1%) | 61 (62.9%) |
| Computers, Engineering & Science | 12 (63.2%) | 7 (36.8%) |
| Computers & Mathematics | 12 (63.2%) | 7 (36.8%) |
| Architecture & Engineering | 0 (0.0%) | 0 (0.0%) |
| Life, Physical & Social Science | 0 (0.0%) | 0 (0.0%) |
| Community & Social Service | 0 (0.0%) | 42 (100.0%) |
| Education, Arts & Media | 0 (0.0%) | 24 (100.0%) |
| Legal Services & Support | 0 (0.0%) | 0 (0.0%) |
| Education Instruction & Library | 0 (0.0%) | 18 (100.0%) |
| Arts, Media & Entertainment | 0 (0.0%) | 0 (0.0%) |
| Health Diagnosing & Treating | 0 (0.0%) | 17 (100.0%) |
| Health Technologists | 0 (0.0%) | 17 (100.0%) |
| Total (Category) | 180 (51.0%) | 173 (49.0%) |
| Total (Overall) | 411 (50.5%) | 403 (49.5%) |
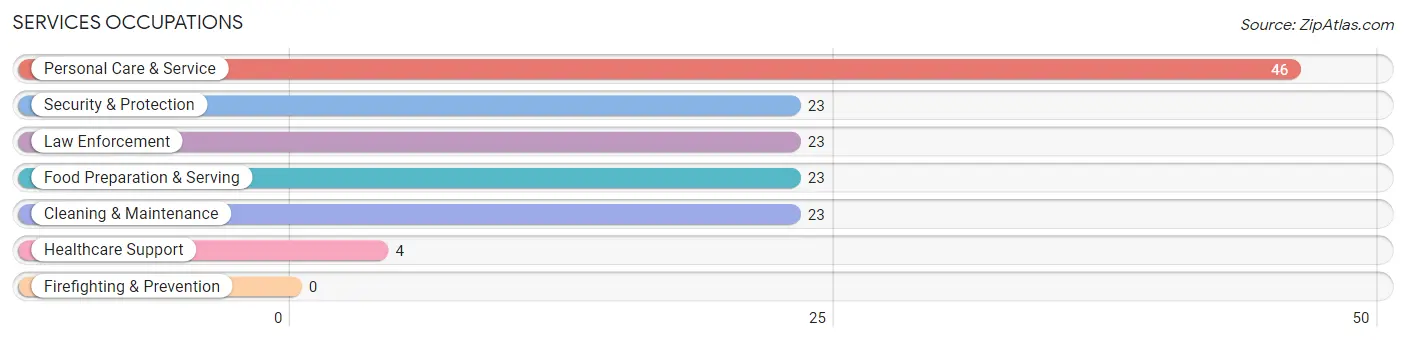
Services Occupations
The most common Services occupations in Woxall are Personal Care & Service (46 | 5.7%), Security & Protection (23 | 2.8%), Law Enforcement (23 | 2.8%), Food Preparation & Serving (23 | 2.8%), and Cleaning & Maintenance (23 | 2.8%).
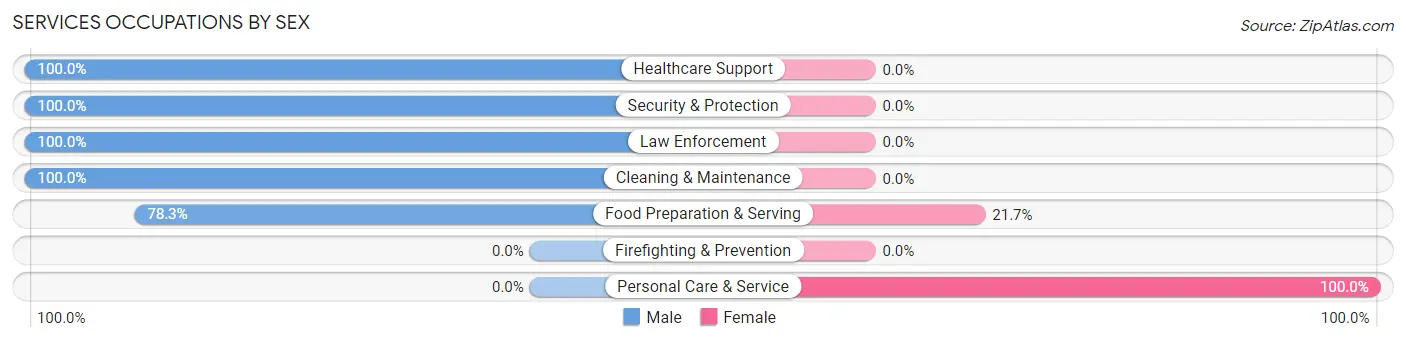
Services Occupations by Sex
Within the Services occupations in Woxall, the most male-oriented occupations are Healthcare Support (100.0%), Security & Protection (100.0%), and Law Enforcement (100.0%), while the most female-oriented occupations are Personal Care & Service (100.0%), and Food Preparation & Serving (21.7%).
| Occupation | Male | Female |
| Healthcare Support | 4 (100.0%) | 0 (0.0%) |
| Security & Protection | 23 (100.0%) | 0 (0.0%) |
| Firefighting & Prevention | 0 (0.0%) | 0 (0.0%) |
| Law Enforcement | 23 (100.0%) | 0 (0.0%) |
| Food Preparation & Serving | 18 (78.3%) | 5 (21.7%) |
| Cleaning & Maintenance | 23 (100.0%) | 0 (0.0%) |
| Personal Care & Service | 0 (0.0%) | 46 (100.0%) |
| Total (Category) | 68 (57.1%) | 51 (42.9%) |
| Total (Overall) | 411 (50.5%) | 403 (49.5%) |
Sales and Office Occupations
The most common Sales and Office occupations in Woxall are , and Office & Administration (170 | 20.9%).
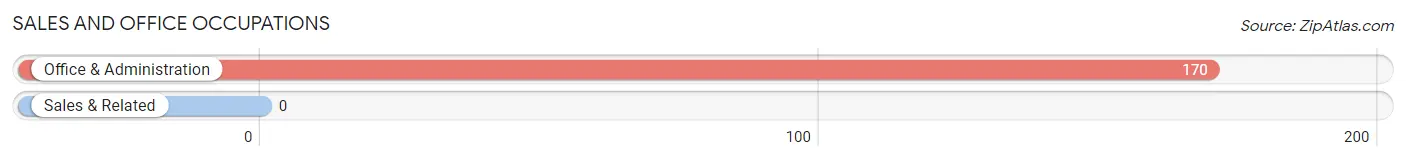
Sales and Office Occupations by Sex
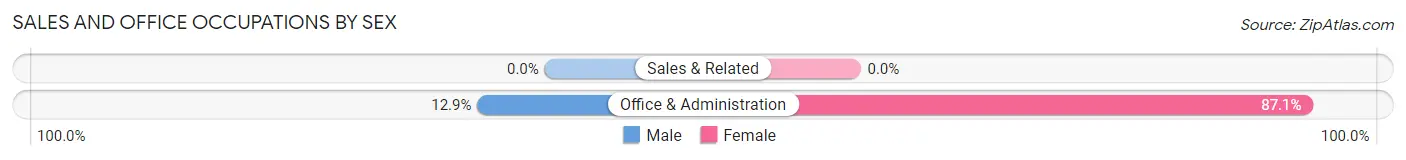
| Occupation | Male | Female |
| Sales & Related | 0 (0.0%) | 0 (0.0%) |
| Office & Administration | 22 (12.9%) | 148 (87.1%) |
| Total (Category) | 22 (12.9%) | 148 (87.1%) |
| Total (Overall) | 411 (50.5%) | 403 (49.5%) |
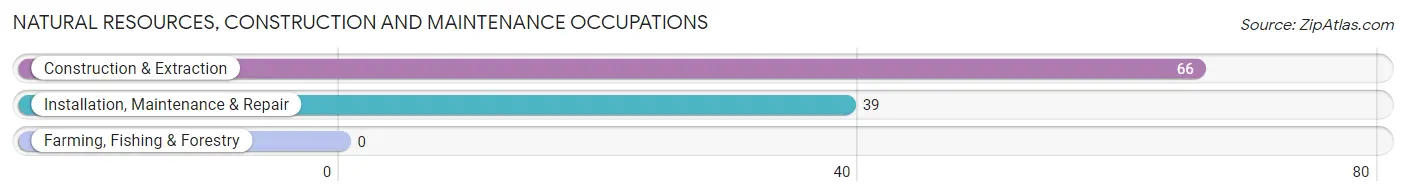
Natural Resources, Construction and Maintenance Occupations
The most common Natural Resources, Construction and Maintenance occupations in Woxall are Construction & Extraction (66 | 8.1%), and Installation, Maintenance & Repair (39 | 4.8%).
Natural Resources, Construction and Maintenance Occupations by Sex
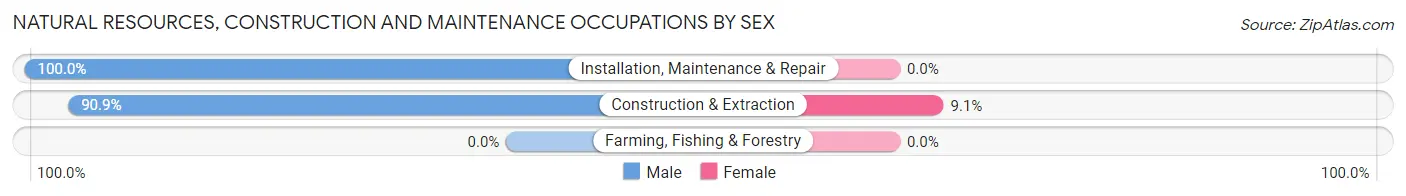
| Occupation | Male | Female |
| Farming, Fishing & Forestry | 0 (0.0%) | 0 (0.0%) |
| Construction & Extraction | 60 (90.9%) | 6 (9.1%) |
| Installation, Maintenance & Repair | 39 (100.0%) | 0 (0.0%) |
| Total (Category) | 99 (94.3%) | 6 (5.7%) |
| Total (Overall) | 411 (50.5%) | 403 (49.5%) |
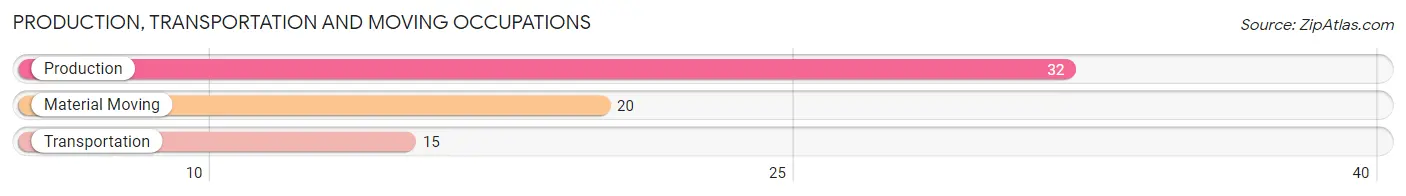
Production, Transportation and Moving Occupations
The most common Production, Transportation and Moving occupations in Woxall are Production (32 | 3.9%), Material Moving (20 | 2.5%), and Transportation (15 | 1.8%).
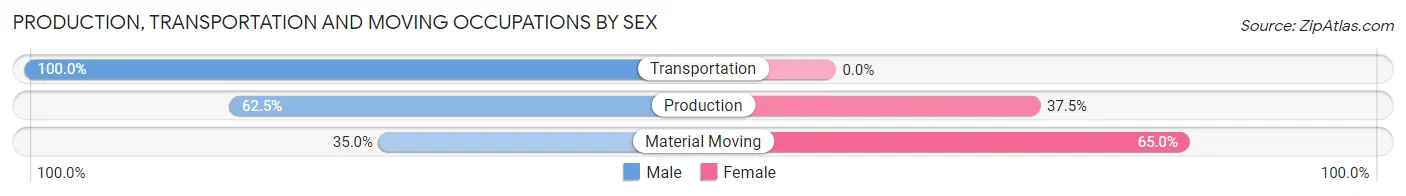
Production, Transportation and Moving Occupations by Sex
| Occupation | Male | Female |
| Production | 20 (62.5%) | 12 (37.5%) |
| Transportation | 15 (100.0%) | 0 (0.0%) |
| Material Moving | 7 (35.0%) | 13 (65.0%) |
| Total (Category) | 42 (62.7%) | 25 (37.3%) |
| Total (Overall) | 411 (50.5%) | 403 (49.5%) |
Employment Industries by Sex in Woxall
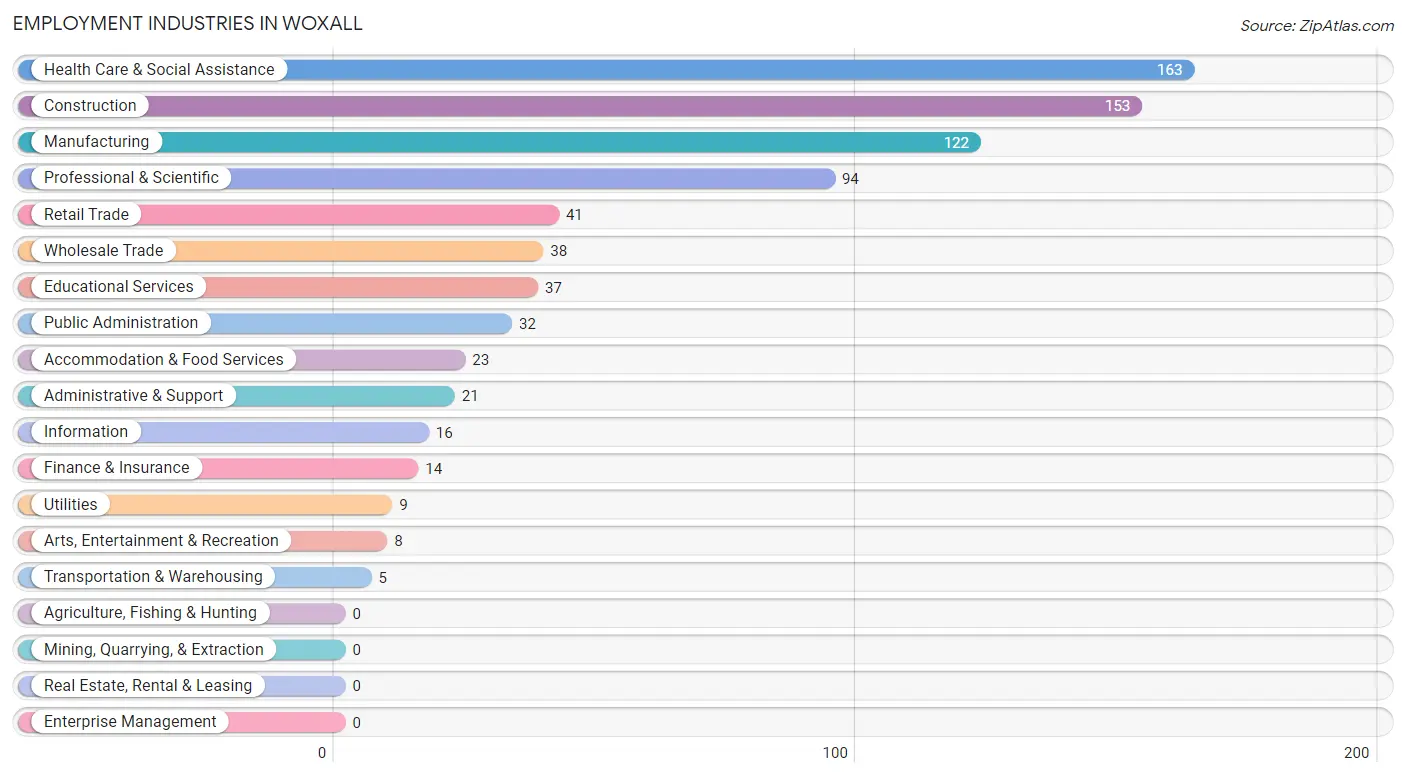
Employment Industries in Woxall
The major employment industries in Woxall include Health Care & Social Assistance (163 | 20.0%), Construction (153 | 18.8%), Manufacturing (122 | 15.0%), Professional & Scientific (94 | 11.6%), and Retail Trade (41 | 5.0%).
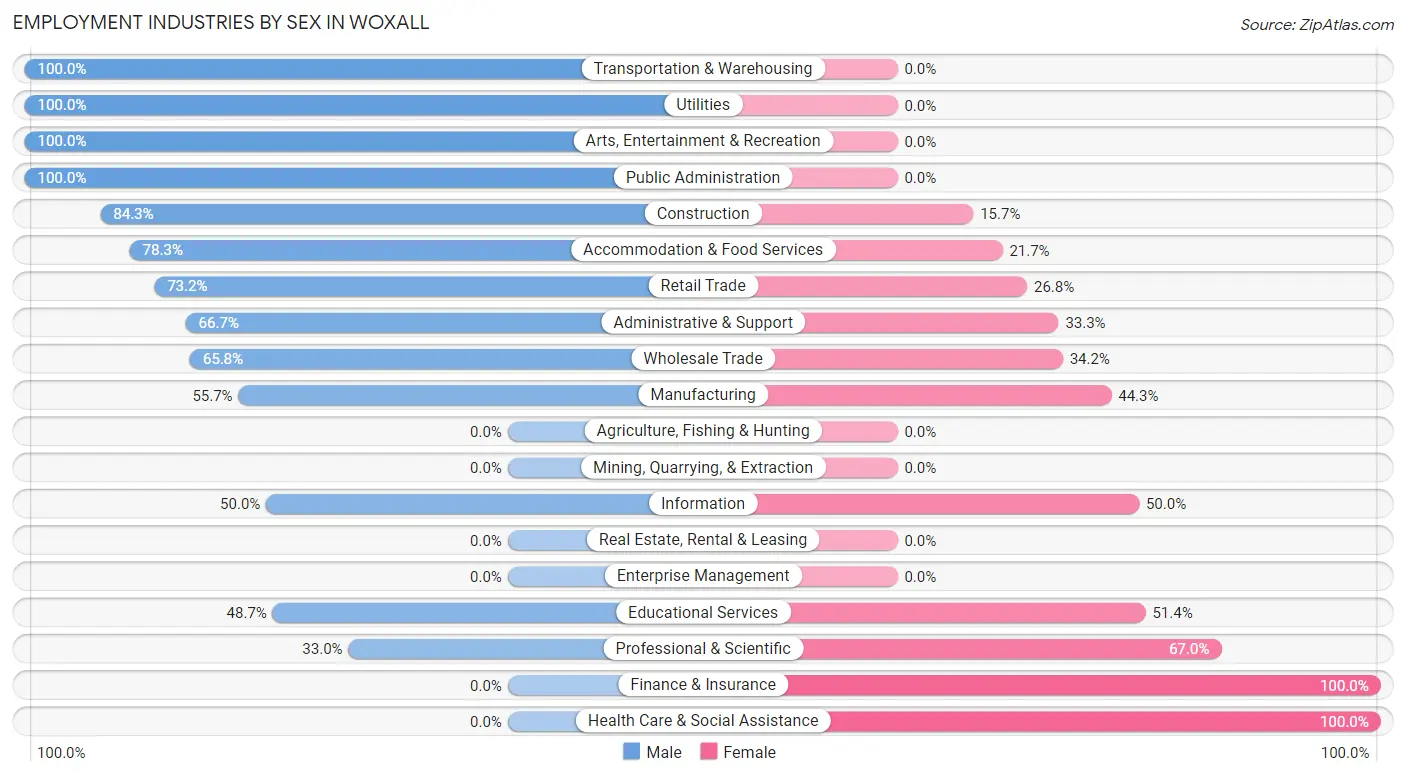
Employment Industries by Sex in Woxall
The Woxall industries that see more men than women are Transportation & Warehousing (100.0%), Utilities (100.0%), and Arts, Entertainment & Recreation (100.0%), whereas the industries that tend to have a higher number of women are Finance & Insurance (100.0%), Health Care & Social Assistance (100.0%), and Professional & Scientific (67.0%).
| Industry | Male | Female |
| Agriculture, Fishing & Hunting | 0 (0.0%) | 0 (0.0%) |
| Mining, Quarrying, & Extraction | 0 (0.0%) | 0 (0.0%) |
| Construction | 129 (84.3%) | 24 (15.7%) |
| Manufacturing | 68 (55.7%) | 54 (44.3%) |
| Wholesale Trade | 25 (65.8%) | 13 (34.2%) |
| Retail Trade | 30 (73.2%) | 11 (26.8%) |
| Transportation & Warehousing | 5 (100.0%) | 0 (0.0%) |
| Utilities | 9 (100.0%) | 0 (0.0%) |
| Information | 8 (50.0%) | 8 (50.0%) |
| Finance & Insurance | 0 (0.0%) | 14 (100.0%) |
| Real Estate, Rental & Leasing | 0 (0.0%) | 0 (0.0%) |
| Professional & Scientific | 31 (33.0%) | 63 (67.0%) |
| Enterprise Management | 0 (0.0%) | 0 (0.0%) |
| Administrative & Support | 14 (66.7%) | 7 (33.3%) |
| Educational Services | 18 (48.6%) | 19 (51.3%) |
| Health Care & Social Assistance | 0 (0.0%) | 163 (100.0%) |
| Arts, Entertainment & Recreation | 8 (100.0%) | 0 (0.0%) |
| Accommodation & Food Services | 18 (78.3%) | 5 (21.7%) |
| Public Administration | 32 (100.0%) | 0 (0.0%) |
| Total | 411 (50.5%) | 403 (49.5%) |
Education in Woxall
School Enrollment in Woxall
The most common levels of schooling among the 353 students in Woxall are high school (118 | 33.4%), elementary school (82 | 23.2%), and middle school (82 | 23.2%).
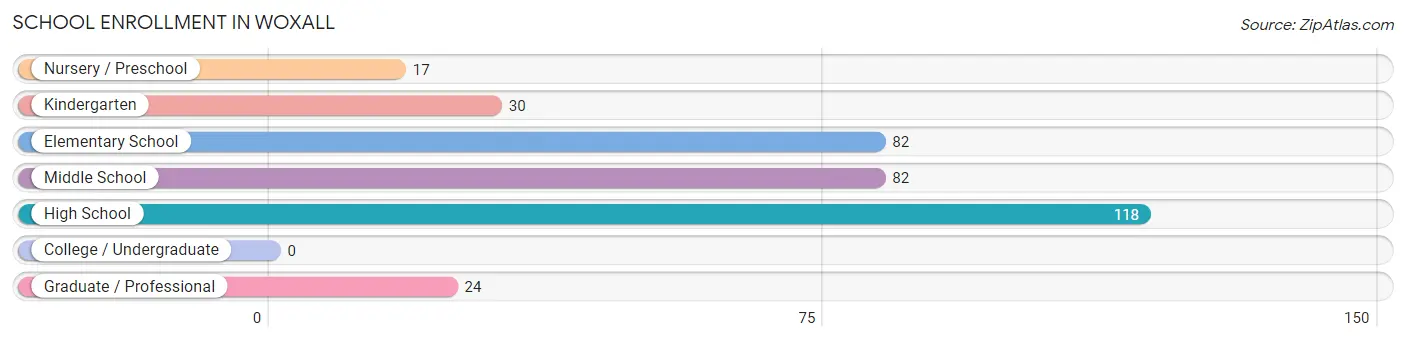
| School Level | # Students | % Students |
| Nursery / Preschool | 17 | 4.8% |
| Kindergarten | 30 | 8.5% |
| Elementary School | 82 | 23.2% |
| Middle School | 82 | 23.2% |
| High School | 118 | 33.4% |
| College / Undergraduate | 0 | 0.0% |
| Graduate / Professional | 24 | 6.8% |
| Total | 353 | 100.0% |
School Enrollment by Age by Funding Source in Woxall
Out of a total of 353 students who are enrolled in schools in Woxall, 83 (23.5%) attend a private institution, while the remaining 270 (76.5%) are enrolled in public schools. The age group of 25 to 34 year olds has the highest likelihood of being enrolled in private schools, with 19 (100.0% in the age bracket) enrolled. Conversely, the age group of 5 to 9 year old has the lowest likelihood of being enrolled in a private school, with 88 (100.0% in the age bracket) attending a public institution.
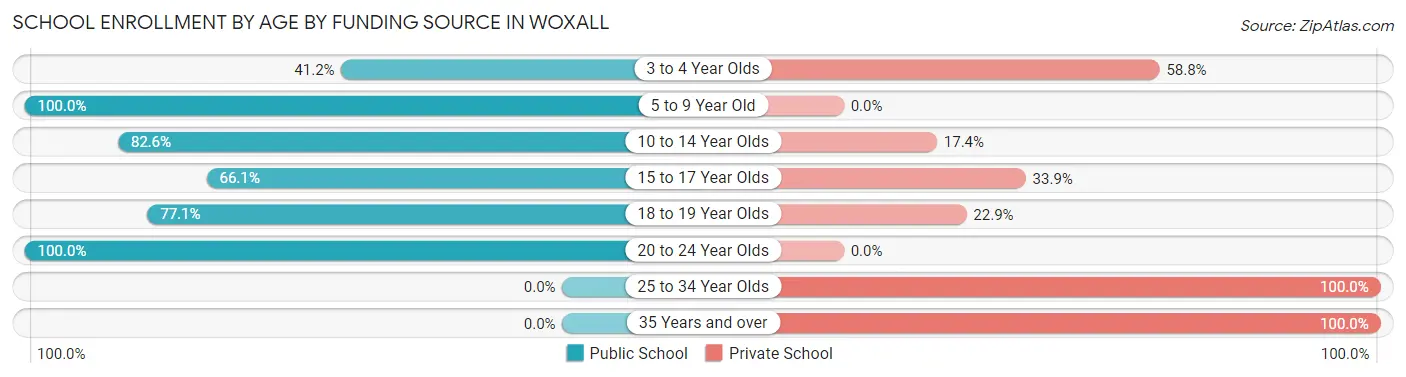
| Age Bracket | Public School | Private School |
| 3 to 4 Year Olds | 7 (41.2%) | 10 (58.8%) |
| 5 to 9 Year Old | 88 (100.0%) | 0 (0.0%) |
| 10 to 14 Year Olds | 100 (82.6%) | 21 (17.4%) |
| 15 to 17 Year Olds | 39 (66.1%) | 20 (33.9%) |
| 18 to 19 Year Olds | 27 (77.1%) | 8 (22.9%) |
| 20 to 24 Year Olds | 9 (100.0%) | 0 (0.0%) |
| 25 to 34 Year Olds | 0 (0.0%) | 19 (100.0%) |
| 35 Years and over | 0 (0.0%) | 5 (100.0%) |
| Total | 270 (76.5%) | 83 (23.5%) |
Educational Attainment by Field of Study in Woxall
Business (78 | 25.2%), arts & humanities (51 | 16.5%), engineering (33 | 10.6%), physical & health sciences (29 | 9.3%), and science & technology (23 | 7.4%) are the most common fields of study among 310 individuals in Woxall who have obtained a bachelor's degree or higher.
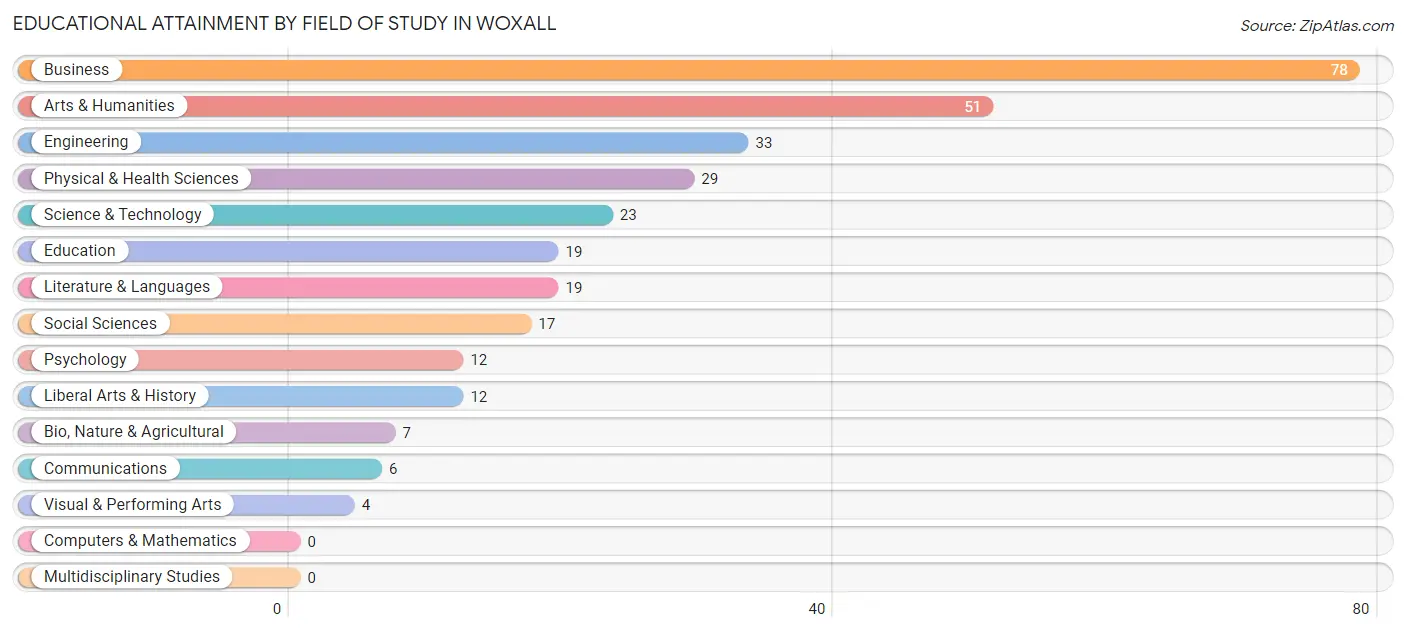
| Field of Study | # Graduates | % Graduates |
| Computers & Mathematics | 0 | 0.0% |
| Bio, Nature & Agricultural | 7 | 2.3% |
| Physical & Health Sciences | 29 | 9.3% |
| Psychology | 12 | 3.9% |
| Social Sciences | 17 | 5.5% |
| Engineering | 33 | 10.6% |
| Multidisciplinary Studies | 0 | 0.0% |
| Science & Technology | 23 | 7.4% |
| Business | 78 | 25.2% |
| Education | 19 | 6.1% |
| Literature & Languages | 19 | 6.1% |
| Liberal Arts & History | 12 | 3.9% |
| Visual & Performing Arts | 4 | 1.3% |
| Communications | 6 | 1.9% |
| Arts & Humanities | 51 | 16.5% |
| Total | 310 | 100.0% |
Transportation & Commute in Woxall
Vehicle Availability by Sex in Woxall
The most prevalent vehicle ownership categories in Woxall are males with 2 vehicles (159, accounting for 38.7%) and females with 2 vehicles (167, making up 39.5%).
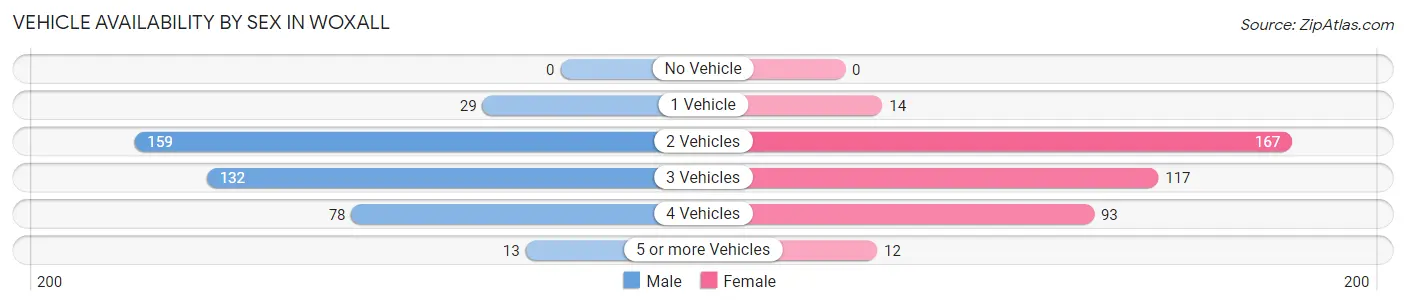
| Vehicles Available | Male | Female |
| No Vehicle | 0 (0.0%) | 0 (0.0%) |
| 1 Vehicle | 29 (7.1%) | 14 (3.5%) |
| 2 Vehicles | 159 (38.7%) | 167 (41.4%) |
| 3 Vehicles | 132 (32.1%) | 117 (29.0%) |
| 4 Vehicles | 78 (19.0%) | 93 (23.1%) |
| 5 or more Vehicles | 13 (3.2%) | 12 (3.0%) |
| Total | 411 (100.0%) | 403 (100.0%) |
Commute Time in Woxall
The most frequently occuring commute durations in Woxall are 15 to 19 minutes (203 commuters, 27.2%), 10 to 14 minutes (131 commuters, 17.5%), and 45 to 59 minutes (87 commuters, 11.7%).
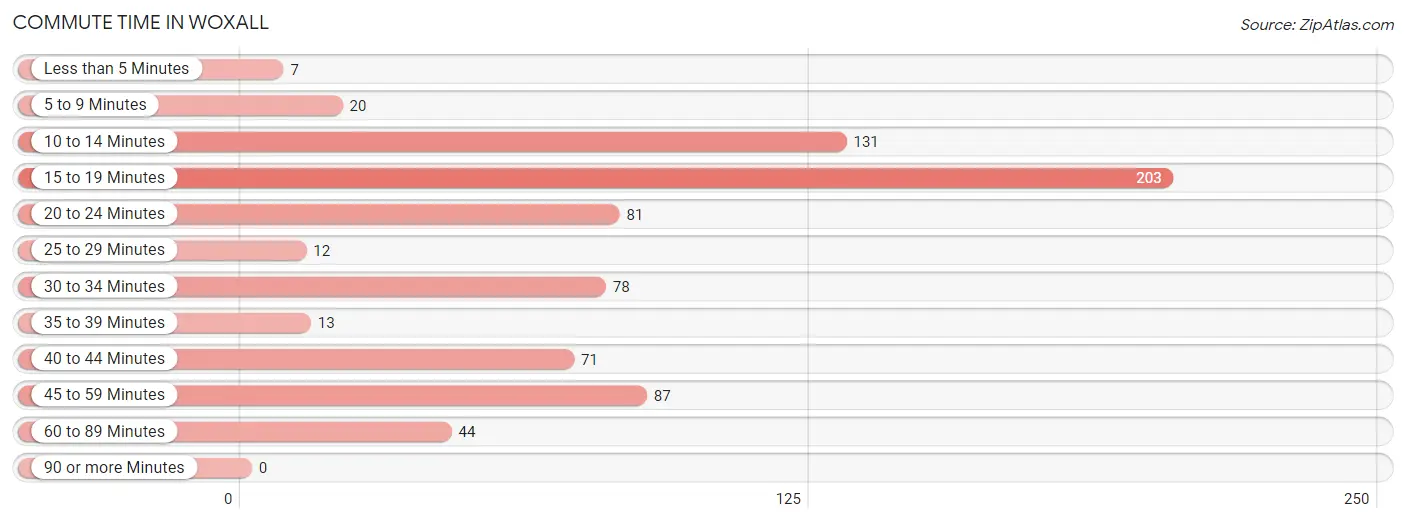
| Commute Time | # Commuters | % Commuters |
| Less than 5 Minutes | 7 | 0.9% |
| 5 to 9 Minutes | 20 | 2.7% |
| 10 to 14 Minutes | 131 | 17.5% |
| 15 to 19 Minutes | 203 | 27.2% |
| 20 to 24 Minutes | 81 | 10.8% |
| 25 to 29 Minutes | 12 | 1.6% |
| 30 to 34 Minutes | 78 | 10.4% |
| 35 to 39 Minutes | 13 | 1.7% |
| 40 to 44 Minutes | 71 | 9.5% |
| 45 to 59 Minutes | 87 | 11.7% |
| 60 to 89 Minutes | 44 | 5.9% |
| 90 or more Minutes | 0 | 0.0% |
Commute Time by Sex in Woxall
The most common commute times in Woxall are 15 to 19 minutes (114 commuters, 29.7%) for males and 15 to 19 minutes (89 commuters, 24.5%) for females.
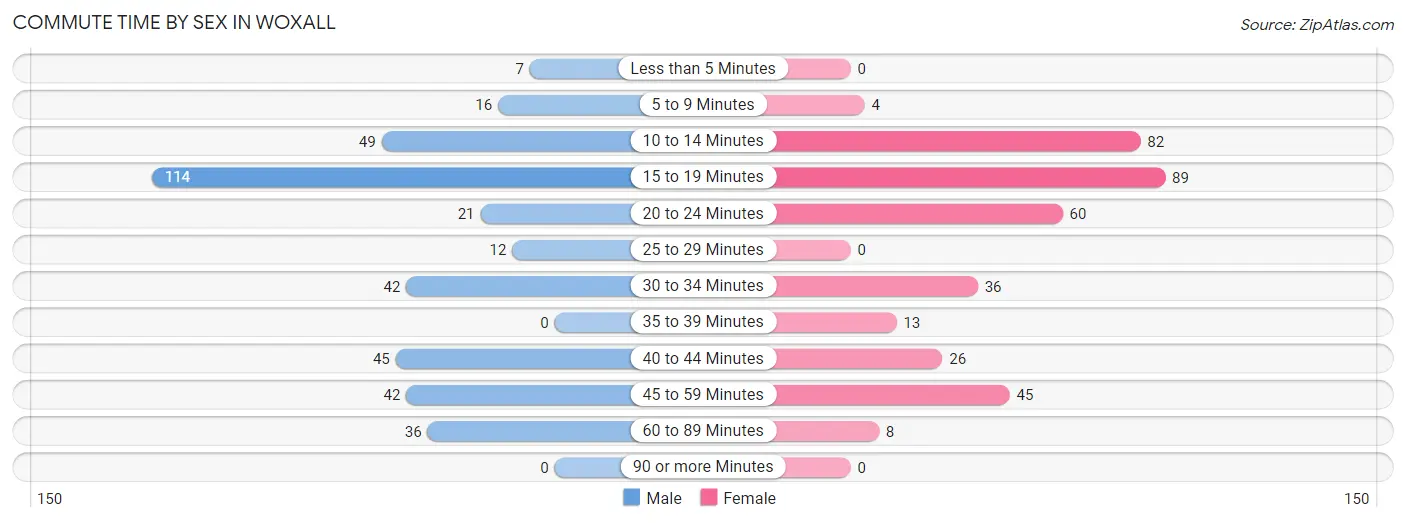
| Commute Time | Male | Female |
| Less than 5 Minutes | 7 (1.8%) | 0 (0.0%) |
| 5 to 9 Minutes | 16 (4.2%) | 4 (1.1%) |
| 10 to 14 Minutes | 49 (12.8%) | 82 (22.6%) |
| 15 to 19 Minutes | 114 (29.7%) | 89 (24.5%) |
| 20 to 24 Minutes | 21 (5.5%) | 60 (16.5%) |
| 25 to 29 Minutes | 12 (3.1%) | 0 (0.0%) |
| 30 to 34 Minutes | 42 (10.9%) | 36 (9.9%) |
| 35 to 39 Minutes | 0 (0.0%) | 13 (3.6%) |
| 40 to 44 Minutes | 45 (11.7%) | 26 (7.2%) |
| 45 to 59 Minutes | 42 (10.9%) | 45 (12.4%) |
| 60 to 89 Minutes | 36 (9.4%) | 8 (2.2%) |
| 90 or more Minutes | 0 (0.0%) | 0 (0.0%) |
Time of Departure to Work by Sex in Woxall
The most frequent times of departure to work in Woxall are 7:00 AM to 7:29 AM (91, 23.7%) for males and 8:00 AM to 8:29 AM (80, 22.0%) for females.
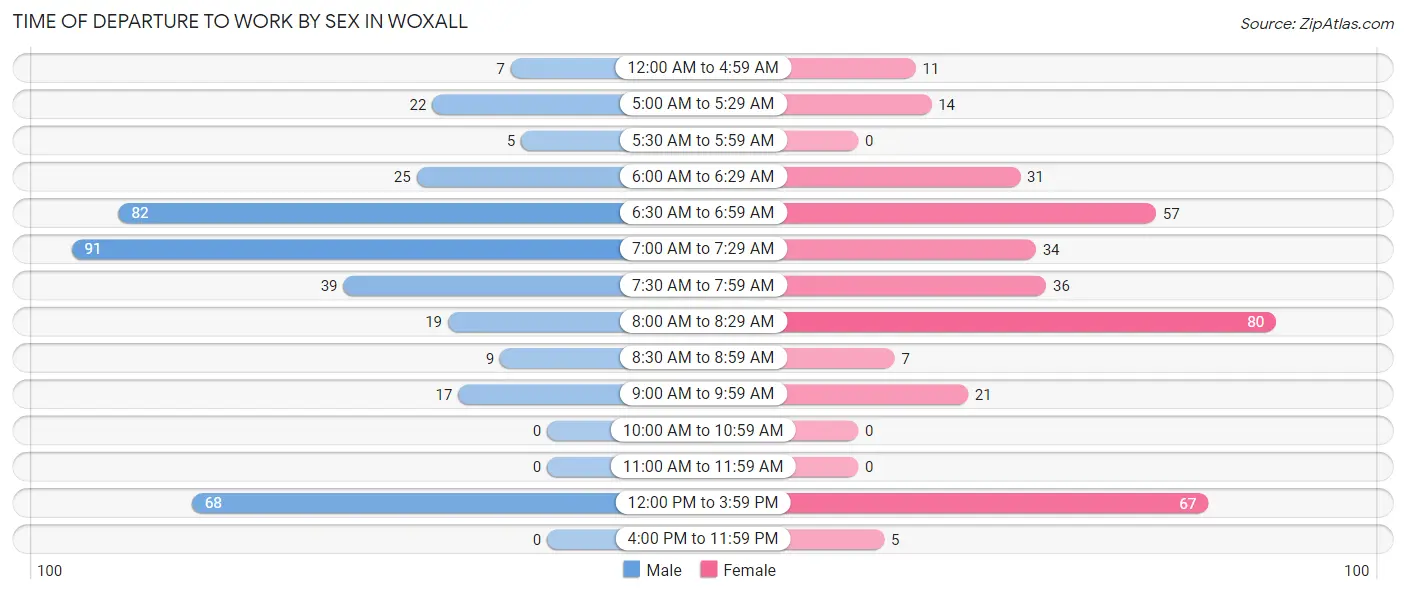
| Time of Departure | Male | Female |
| 12:00 AM to 4:59 AM | 7 (1.8%) | 11 (3.0%) |
| 5:00 AM to 5:29 AM | 22 (5.7%) | 14 (3.9%) |
| 5:30 AM to 5:59 AM | 5 (1.3%) | 0 (0.0%) |
| 6:00 AM to 6:29 AM | 25 (6.5%) | 31 (8.5%) |
| 6:30 AM to 6:59 AM | 82 (21.3%) | 57 (15.7%) |
| 7:00 AM to 7:29 AM | 91 (23.7%) | 34 (9.4%) |
| 7:30 AM to 7:59 AM | 39 (10.2%) | 36 (9.9%) |
| 8:00 AM to 8:29 AM | 19 (5.0%) | 80 (22.0%) |
| 8:30 AM to 8:59 AM | 9 (2.3%) | 7 (1.9%) |
| 9:00 AM to 9:59 AM | 17 (4.4%) | 21 (5.8%) |
| 10:00 AM to 10:59 AM | 0 (0.0%) | 0 (0.0%) |
| 11:00 AM to 11:59 AM | 0 (0.0%) | 0 (0.0%) |
| 12:00 PM to 3:59 PM | 68 (17.7%) | 67 (18.5%) |
| 4:00 PM to 11:59 PM | 0 (0.0%) | 5 (1.4%) |
| Total | 384 (100.0%) | 363 (100.0%) |
Housing Occupancy in Woxall
Occupancy by Ownership in Woxall
Of the total 449 dwellings in Woxall, owner-occupied units account for 418 (93.1%), while renter-occupied units make up 31 (6.9%).
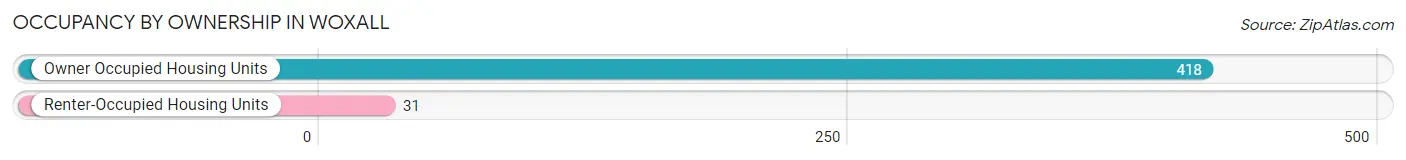
| Occupancy | # Housing Units | % Housing Units |
| Owner Occupied Housing Units | 418 | 93.1% |
| Renter-Occupied Housing Units | 31 | 6.9% |
| Total Occupied Housing Units | 449 | 100.0% |
Occupancy by Household Size in Woxall
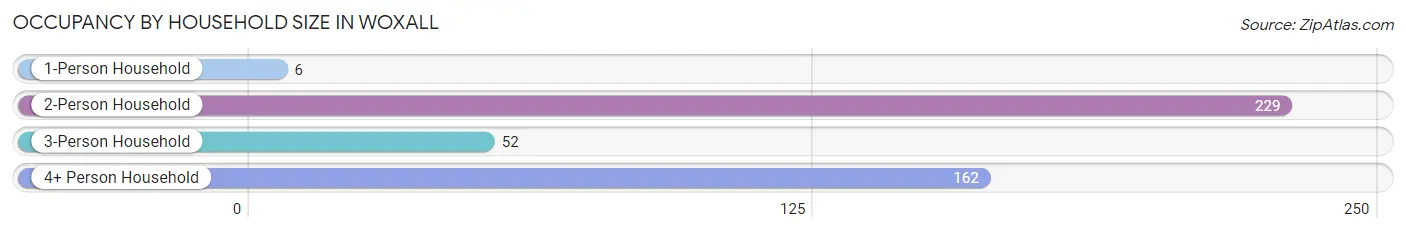
| Household Size | # Housing Units | % Housing Units |
| 1-Person Household | 6 | 1.3% |
| 2-Person Household | 229 | 51.0% |
| 3-Person Household | 52 | 11.6% |
| 4+ Person Household | 162 | 36.1% |
| Total Housing Units | 449 | 100.0% |
Occupancy by Ownership by Household Size in Woxall
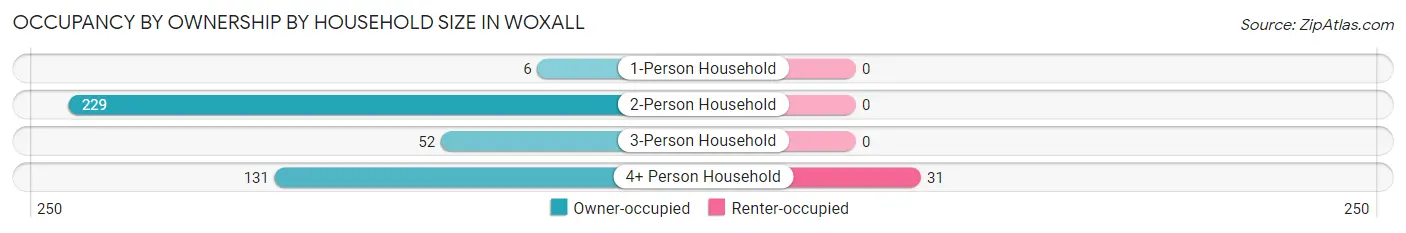
| Household Size | Owner-occupied | Renter-occupied |
| 1-Person Household | 6 (100.0%) | 0 (0.0%) |
| 2-Person Household | 229 (100.0%) | 0 (0.0%) |
| 3-Person Household | 52 (100.0%) | 0 (0.0%) |
| 4+ Person Household | 131 (80.9%) | 31 (19.1%) |
| Total Housing Units | 418 (93.1%) | 31 (6.9%) |
Occupancy by Educational Attainment in Woxall
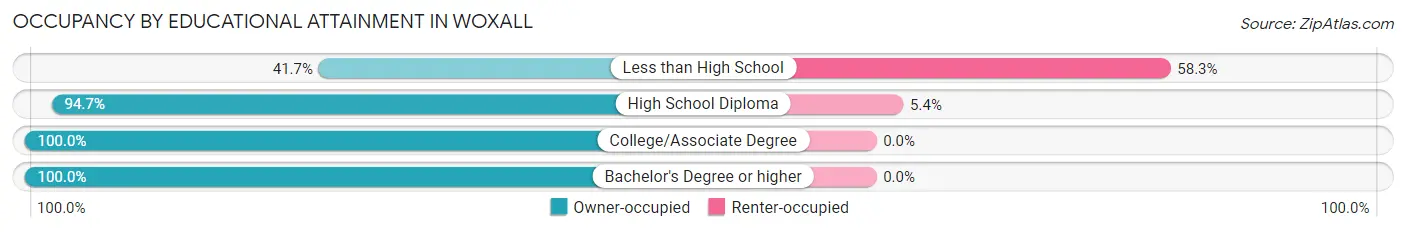
| Household Size | Owner-occupied | Renter-occupied |
| Less than High School | 15 (41.7%) | 21 (58.3%) |
| High School Diploma | 177 (94.7%) | 10 (5.3%) |
| College/Associate Degree | 108 (100.0%) | 0 (0.0%) |
| Bachelor's Degree or higher | 118 (100.0%) | 0 (0.0%) |
Occupancy by Age of Householder in Woxall
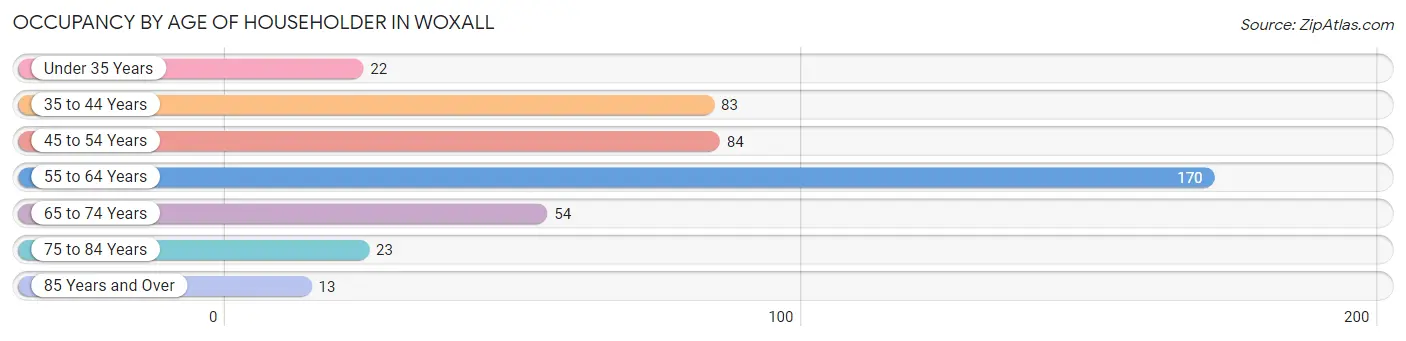
| Age Bracket | # Households | % Households |
| Under 35 Years | 22 | 4.9% |
| 35 to 44 Years | 83 | 18.5% |
| 45 to 54 Years | 84 | 18.7% |
| 55 to 64 Years | 170 | 37.9% |
| 65 to 74 Years | 54 | 12.0% |
| 75 to 84 Years | 23 | 5.1% |
| 85 Years and Over | 13 | 2.9% |
| Total | 449 | 100.0% |
Housing Finances in Woxall
Median Income by Occupancy in Woxall
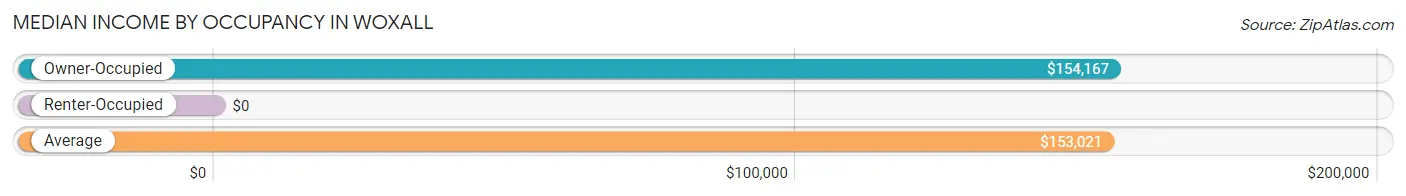
| Occupancy Type | # Households | Median Income |
| Owner-Occupied | 418 (93.1%) | $154,167 |
| Renter-Occupied | 31 (6.9%) | $0 |
| Average | 449 (100.0%) | $153,021 |
Occupancy by Householder Income Bracket in Woxall
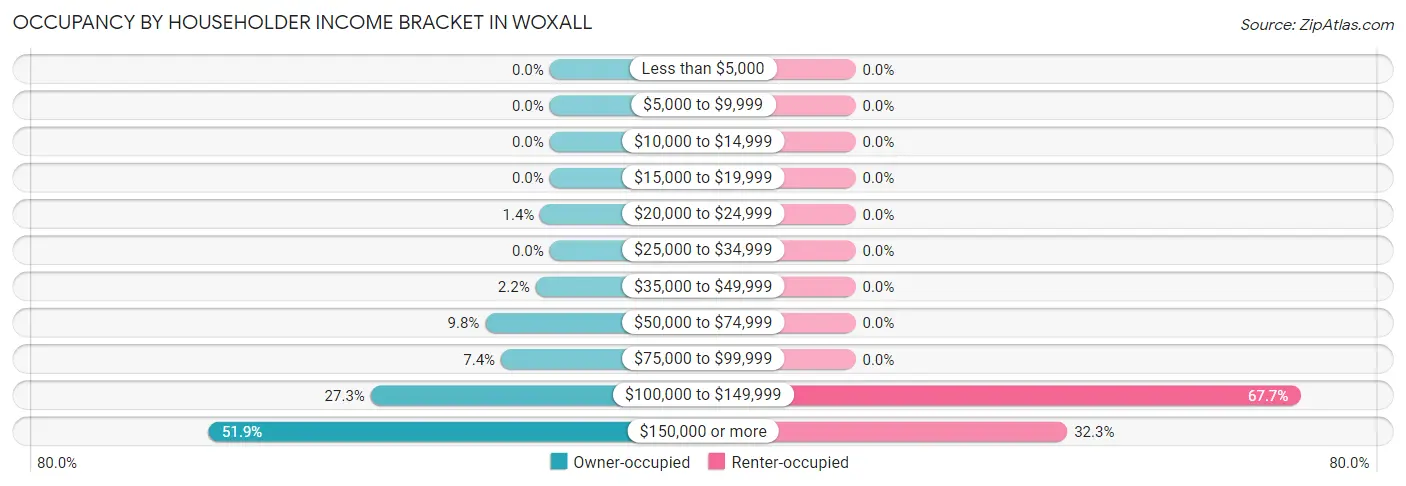
| Income Bracket | Owner-occupied | Renter-occupied |
| Less than $5,000 | 0 (0.0%) | 0 (0.0%) |
| $5,000 to $9,999 | 0 (0.0%) | 0 (0.0%) |
| $10,000 to $14,999 | 0 (0.0%) | 0 (0.0%) |
| $15,000 to $19,999 | 0 (0.0%) | 0 (0.0%) |
| $20,000 to $24,999 | 6 (1.4%) | 0 (0.0%) |
| $25,000 to $34,999 | 0 (0.0%) | 0 (0.0%) |
| $35,000 to $49,999 | 9 (2.1%) | 0 (0.0%) |
| $50,000 to $74,999 | 41 (9.8%) | 0 (0.0%) |
| $75,000 to $99,999 | 31 (7.4%) | 0 (0.0%) |
| $100,000 to $149,999 | 114 (27.3%) | 21 (67.7%) |
| $150,000 or more | 217 (51.9%) | 10 (32.3%) |
| Total | 418 (100.0%) | 31 (100.0%) |
Monthly Housing Cost Tiers in Woxall
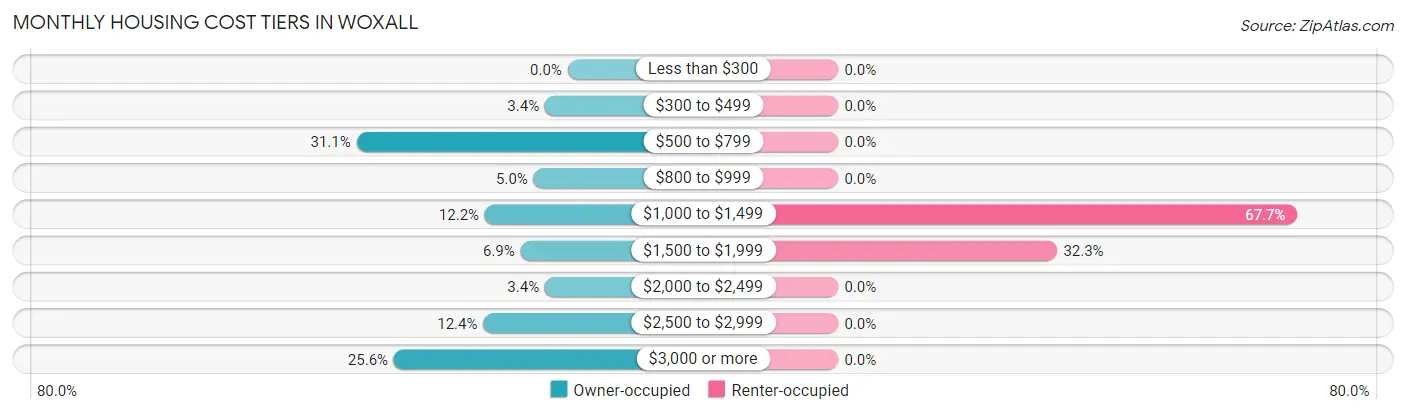
| Monthly Cost | Owner-occupied | Renter-occupied |
| Less than $300 | 0 (0.0%) | 0 (0.0%) |
| $300 to $499 | 14 (3.4%) | 0 (0.0%) |
| $500 to $799 | 130 (31.1%) | 0 (0.0%) |
| $800 to $999 | 21 (5.0%) | 0 (0.0%) |
| $1,000 to $1,499 | 51 (12.2%) | 21 (67.7%) |
| $1,500 to $1,999 | 29 (6.9%) | 10 (32.3%) |
| $2,000 to $2,499 | 14 (3.4%) | 0 (0.0%) |
| $2,500 to $2,999 | 52 (12.4%) | 0 (0.0%) |
| $3,000 or more | 107 (25.6%) | 0 (0.0%) |
| Total | 418 (100.0%) | 31 (100.0%) |
Physical Housing Characteristics in Woxall
Housing Structures in Woxall
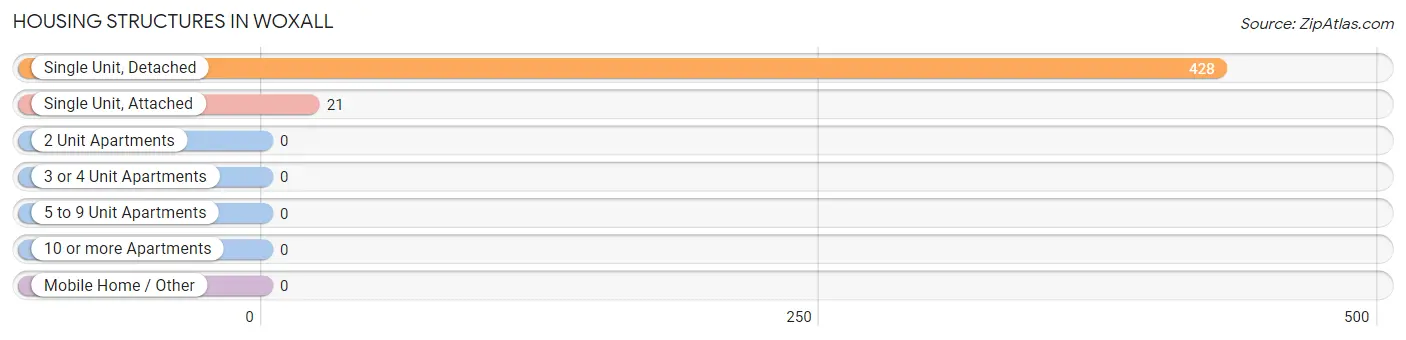
| Structure Type | # Housing Units | % Housing Units |
| Single Unit, Detached | 428 | 95.3% |
| Single Unit, Attached | 21 | 4.7% |
| 2 Unit Apartments | 0 | 0.0% |
| 3 or 4 Unit Apartments | 0 | 0.0% |
| 5 to 9 Unit Apartments | 0 | 0.0% |
| 10 or more Apartments | 0 | 0.0% |
| Mobile Home / Other | 0 | 0.0% |
| Total | 449 | 100.0% |
Housing Structures by Occupancy in Woxall
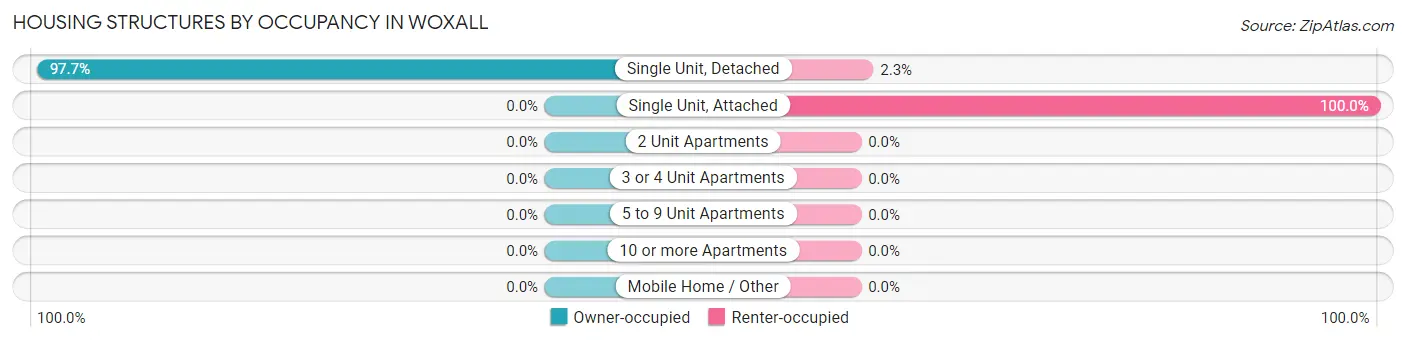
| Structure Type | Owner-occupied | Renter-occupied |
| Single Unit, Detached | 418 (97.7%) | 10 (2.3%) |
| Single Unit, Attached | 0 (0.0%) | 21 (100.0%) |
| 2 Unit Apartments | 0 (0.0%) | 0 (0.0%) |
| 3 or 4 Unit Apartments | 0 (0.0%) | 0 (0.0%) |
| 5 to 9 Unit Apartments | 0 (0.0%) | 0 (0.0%) |
| 10 or more Apartments | 0 (0.0%) | 0 (0.0%) |
| Mobile Home / Other | 0 (0.0%) | 0 (0.0%) |
| Total | 418 (93.1%) | 31 (6.9%) |
Housing Structures by Number of Rooms in Woxall
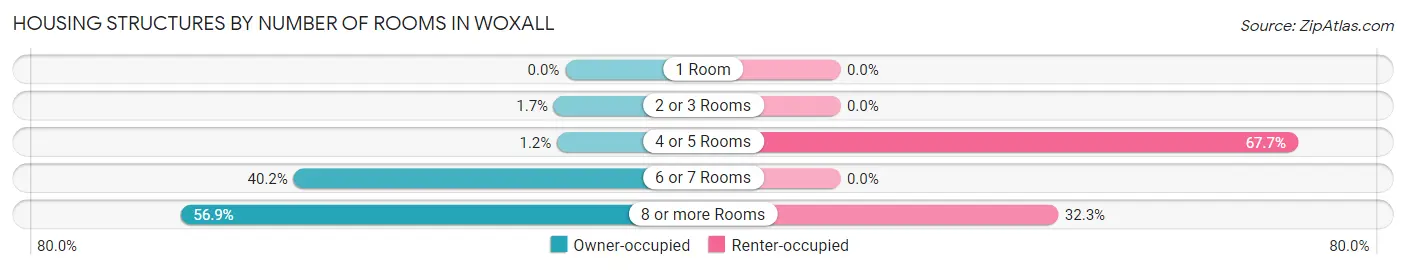
| Number of Rooms | Owner-occupied | Renter-occupied |
| 1 Room | 0 (0.0%) | 0 (0.0%) |
| 2 or 3 Rooms | 7 (1.7%) | 0 (0.0%) |
| 4 or 5 Rooms | 5 (1.2%) | 21 (67.7%) |
| 6 or 7 Rooms | 168 (40.2%) | 0 (0.0%) |
| 8 or more Rooms | 238 (56.9%) | 10 (32.3%) |
| Total | 418 (100.0%) | 31 (100.0%) |
Housing Structure by Heating Type in Woxall
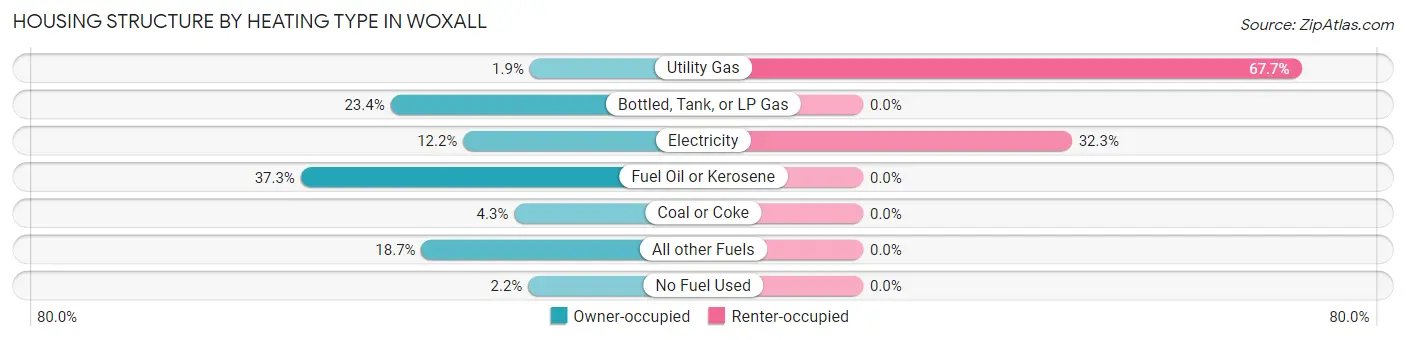
| Heating Type | Owner-occupied | Renter-occupied |
| Utility Gas | 8 (1.9%) | 21 (67.7%) |
| Bottled, Tank, or LP Gas | 98 (23.4%) | 0 (0.0%) |
| Electricity | 51 (12.2%) | 10 (32.3%) |
| Fuel Oil or Kerosene | 156 (37.3%) | 0 (0.0%) |
| Coal or Coke | 18 (4.3%) | 0 (0.0%) |
| All other Fuels | 78 (18.7%) | 0 (0.0%) |
| No Fuel Used | 9 (2.1%) | 0 (0.0%) |
| Total | 418 (100.0%) | 31 (100.0%) |
Household Vehicle Usage in Woxall
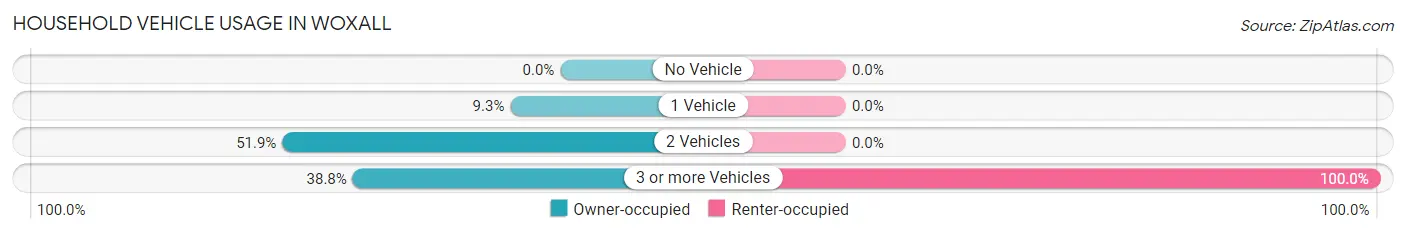
| Vehicles per Household | Owner-occupied | Renter-occupied |
| No Vehicle | 0 (0.0%) | 0 (0.0%) |
| 1 Vehicle | 39 (9.3%) | 0 (0.0%) |
| 2 Vehicles | 217 (51.9%) | 0 (0.0%) |
| 3 or more Vehicles | 162 (38.8%) | 31 (100.0%) |
| Total | 418 (100.0%) | 31 (100.0%) |
Real Estate & Mortgages in Woxall
Real Estate and Mortgage Overview in Woxall
| Characteristic | Without Mortgage | With Mortgage |
| Housing Units | 207 | 211 |
| Median Property Value | $332,400 | $547,400 |
| Median Household Income | $113,563 | $164 |
| Monthly Housing Costs | $747 | $107 |
| Real Estate Taxes | $5,976 | $0 |
Property Value by Mortgage Status in Woxall
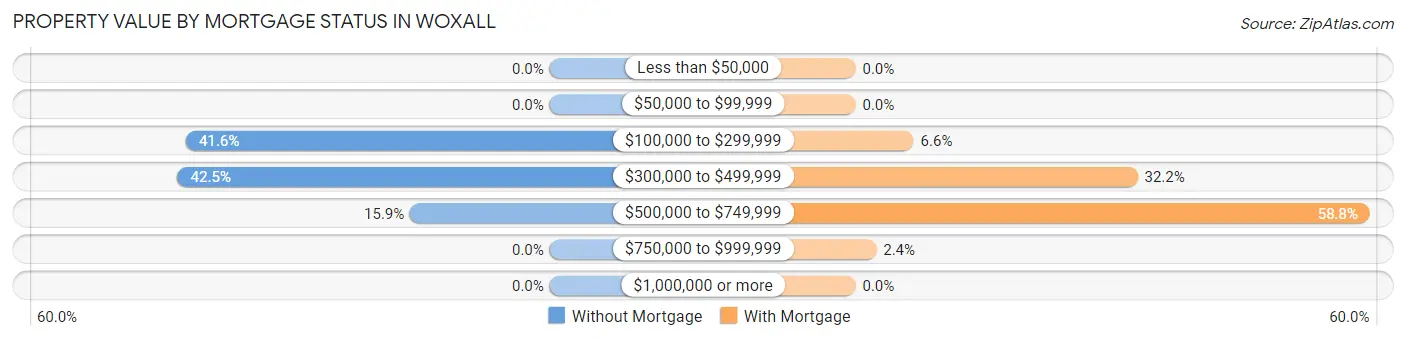
| Property Value | Without Mortgage | With Mortgage |
| Less than $50,000 | 0 (0.0%) | 0 (0.0%) |
| $50,000 to $99,999 | 0 (0.0%) | 0 (0.0%) |
| $100,000 to $299,999 | 86 (41.5%) | 14 (6.6%) |
| $300,000 to $499,999 | 88 (42.5%) | 68 (32.2%) |
| $500,000 to $749,999 | 33 (15.9%) | 124 (58.8%) |
| $750,000 to $999,999 | 0 (0.0%) | 5 (2.4%) |
| $1,000,000 or more | 0 (0.0%) | 0 (0.0%) |
| Total | 207 (100.0%) | 211 (100.0%) |
Household Income by Mortgage Status in Woxall
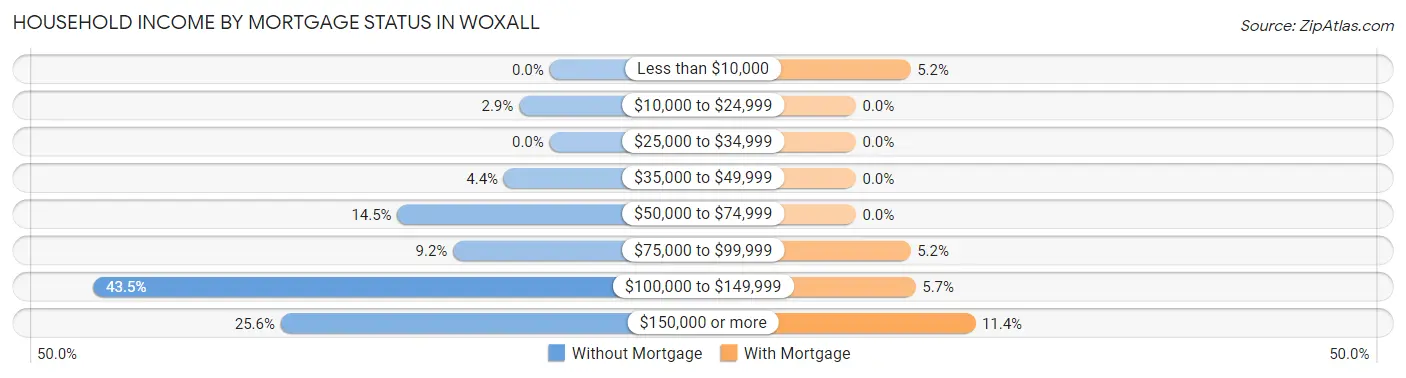
| Household Income | Without Mortgage | With Mortgage |
| Less than $10,000 | 0 (0.0%) | 11 (5.2%) |
| $10,000 to $24,999 | 6 (2.9%) | 0 (0.0%) |
| $25,000 to $34,999 | 0 (0.0%) | 0 (0.0%) |
| $35,000 to $49,999 | 9 (4.3%) | 0 (0.0%) |
| $50,000 to $74,999 | 30 (14.5%) | 0 (0.0%) |
| $75,000 to $99,999 | 19 (9.2%) | 11 (5.2%) |
| $100,000 to $149,999 | 90 (43.5%) | 12 (5.7%) |
| $150,000 or more | 53 (25.6%) | 24 (11.4%) |
| Total | 207 (100.0%) | 211 (100.0%) |
Property Value to Household Income Ratio in Woxall
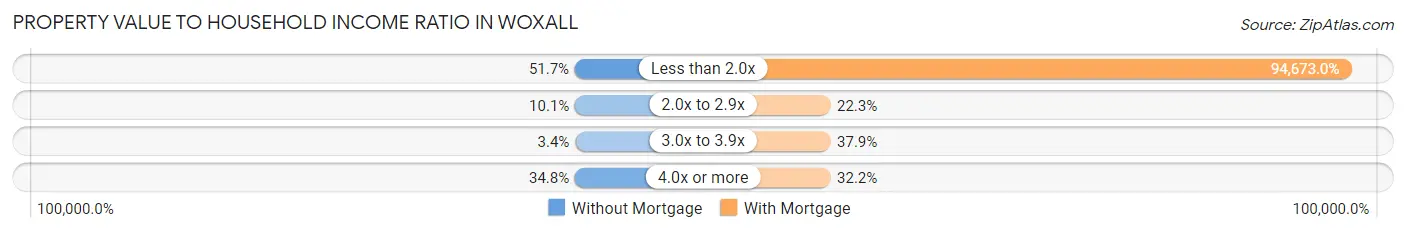
| Value-to-Income Ratio | Without Mortgage | With Mortgage |
| Less than 2.0x | 107 (51.7%) | 199,760 (94,673.0%) |
| 2.0x to 2.9x | 21 (10.1%) | 47 (22.3%) |
| 3.0x to 3.9x | 7 (3.4%) | 80 (37.9%) |
| 4.0x or more | 72 (34.8%) | 68 (32.2%) |
| Total | 207 (100.0%) | 211 (100.0%) |
Real Estate Taxes by Mortgage Status in Woxall
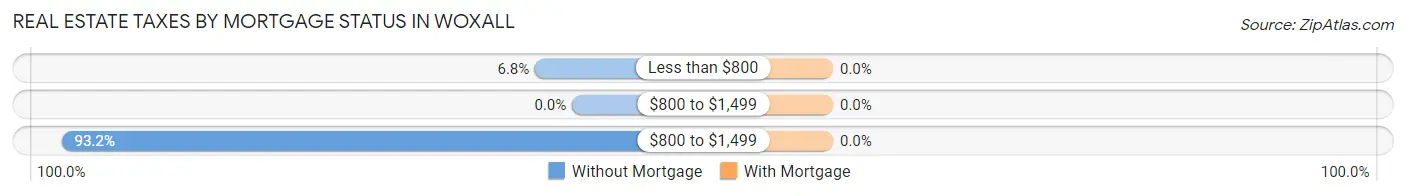
| Property Taxes | Without Mortgage | With Mortgage |
| Less than $800 | 14 (6.8%) | 0 (0.0%) |
| $800 to $1,499 | 0 (0.0%) | 0 (0.0%) |
| $800 to $1,499 | 193 (93.2%) | 0 (0.0%) |
| Total | 207 (100.0%) | 211 (100.0%) |
Health & Disability in Woxall
Health Insurance Coverage by Age in Woxall
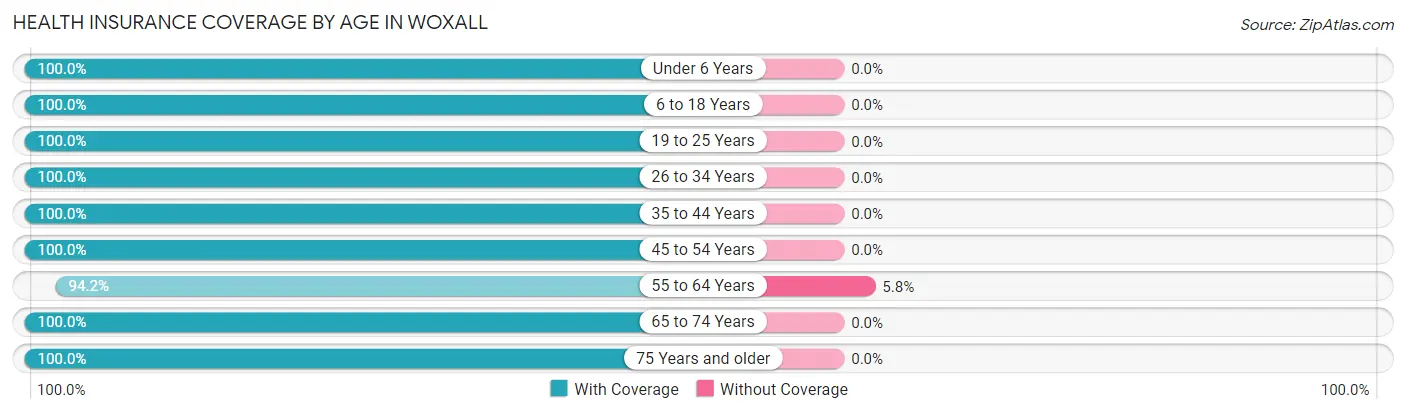
| Age Bracket | With Coverage | Without Coverage |
| Under 6 Years | 105 (100.0%) | 0 (0.0%) |
| 6 to 18 Years | 292 (100.0%) | 0 (0.0%) |
| 19 to 25 Years | 69 (100.0%) | 0 (0.0%) |
| 26 to 34 Years | 97 (100.0%) | 0 (0.0%) |
| 35 to 44 Years | 131 (100.0%) | 0 (0.0%) |
| 45 to 54 Years | 178 (100.0%) | 0 (0.0%) |
| 55 to 64 Years | 276 (94.2%) | 17 (5.8%) |
| 65 to 74 Years | 145 (100.0%) | 0 (0.0%) |
| 75 Years and older | 82 (100.0%) | 0 (0.0%) |
| Total | 1,375 (98.8%) | 17 (1.2%) |
Health Insurance Coverage by Citizenship Status in Woxall
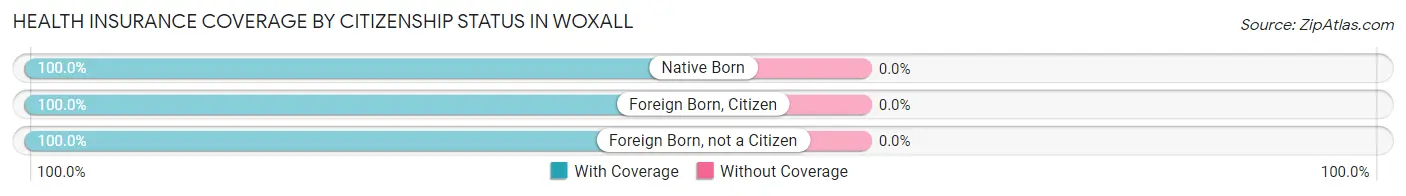
| Citizenship Status | With Coverage | Without Coverage |
| Native Born | 105 (100.0%) | 0 (0.0%) |
| Foreign Born, Citizen | 292 (100.0%) | 0 (0.0%) |
| Foreign Born, not a Citizen | 69 (100.0%) | 0 (0.0%) |
Health Insurance Coverage by Household Income in Woxall
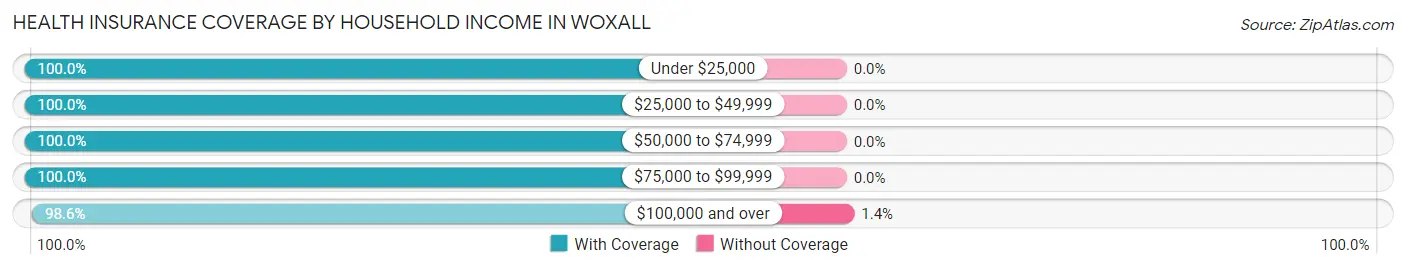
| Household Income | With Coverage | Without Coverage |
| Under $25,000 | 6 (100.0%) | 0 (0.0%) |
| $25,000 to $49,999 | 32 (100.0%) | 0 (0.0%) |
| $50,000 to $74,999 | 84 (100.0%) | 0 (0.0%) |
| $75,000 to $99,999 | 69 (100.0%) | 0 (0.0%) |
| $100,000 and over | 1,182 (98.6%) | 17 (1.4%) |
Public vs Private Health Insurance Coverage by Age in Woxall
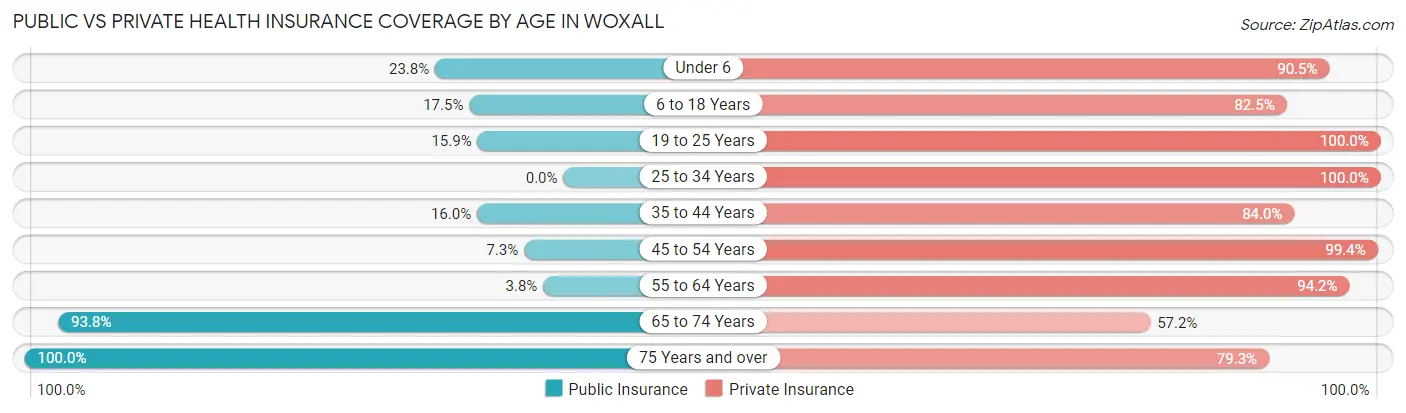
| Age Bracket | Public Insurance | Private Insurance |
| Under 6 | 25 (23.8%) | 95 (90.5%) |
| 6 to 18 Years | 51 (17.5%) | 241 (82.5%) |
| 19 to 25 Years | 11 (15.9%) | 69 (100.0%) |
| 25 to 34 Years | 0 (0.0%) | 97 (100.0%) |
| 35 to 44 Years | 21 (16.0%) | 110 (84.0%) |
| 45 to 54 Years | 13 (7.3%) | 177 (99.4%) |
| 55 to 64 Years | 11 (3.7%) | 276 (94.2%) |
| 65 to 74 Years | 136 (93.8%) | 83 (57.2%) |
| 75 Years and over | 82 (100.0%) | 65 (79.3%) |
| Total | 350 (25.1%) | 1,213 (87.1%) |
Disability Status by Sex by Age in Woxall
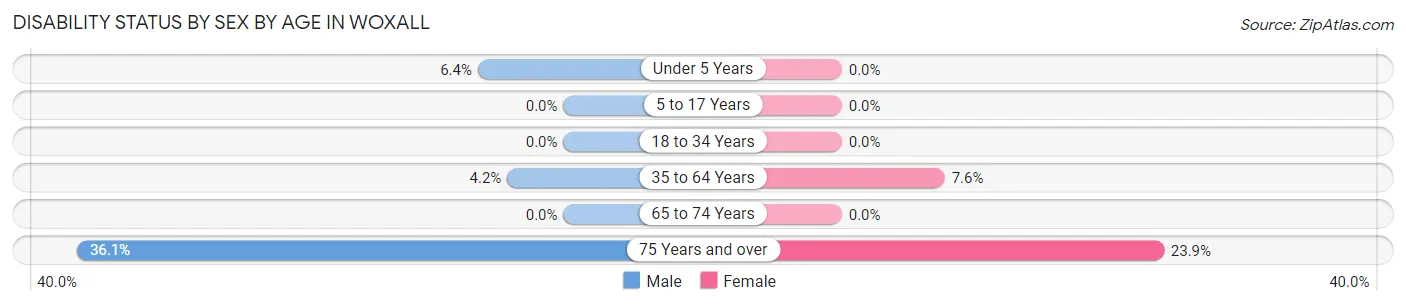
| Age Bracket | Male | Female |
| Under 5 Years | 4 (6.4%) | 0 (0.0%) |
| 5 to 17 Years | 0 (0.0%) | 0 (0.0%) |
| 18 to 34 Years | 0 (0.0%) | 0 (0.0%) |
| 35 to 64 Years | 12 (4.2%) | 24 (7.6%) |
| 65 to 74 Years | 0 (0.0%) | 0 (0.0%) |
| 75 Years and over | 13 (36.1%) | 11 (23.9%) |
Disability Class by Sex by Age in Woxall
Disability Class: Hearing Difficulty
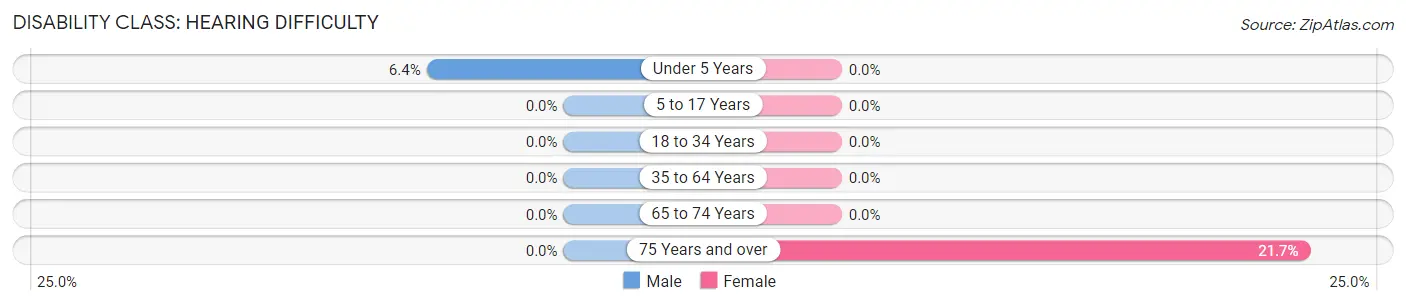
| Age Bracket | Male | Female |
| Under 5 Years | 4 (6.4%) | 0 (0.0%) |
| 5 to 17 Years | 0 (0.0%) | 0 (0.0%) |
| 18 to 34 Years | 0 (0.0%) | 0 (0.0%) |
| 35 to 64 Years | 0 (0.0%) | 0 (0.0%) |
| 65 to 74 Years | 0 (0.0%) | 0 (0.0%) |
| 75 Years and over | 0 (0.0%) | 10 (21.7%) |
Disability Class: Vision Difficulty
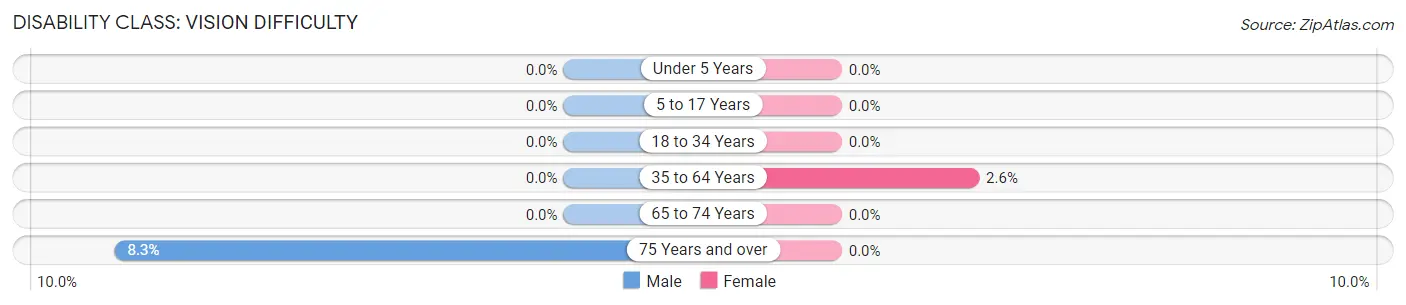
| Age Bracket | Male | Female |
| Under 5 Years | 0 (0.0%) | 0 (0.0%) |
| 5 to 17 Years | 0 (0.0%) | 0 (0.0%) |
| 18 to 34 Years | 0 (0.0%) | 0 (0.0%) |
| 35 to 64 Years | 0 (0.0%) | 8 (2.5%) |
| 65 to 74 Years | 0 (0.0%) | 0 (0.0%) |
| 75 Years and over | 3 (8.3%) | 0 (0.0%) |
Disability Class: Cognitive Difficulty
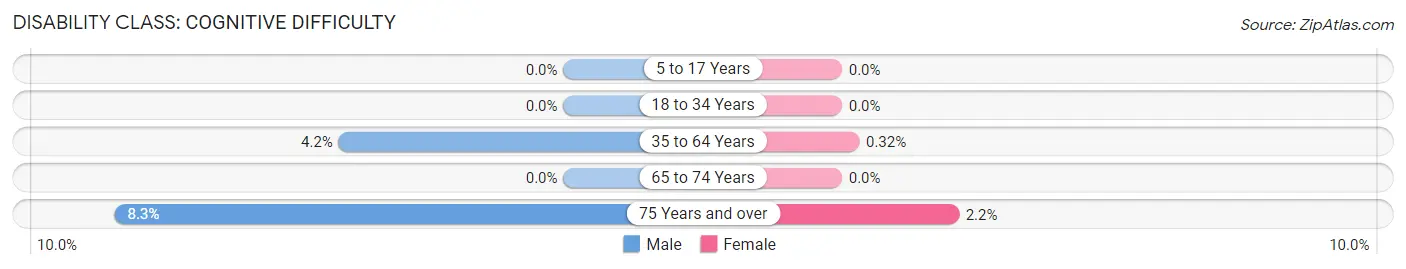
| Age Bracket | Male | Female |
| 5 to 17 Years | 0 (0.0%) | 0 (0.0%) |
| 18 to 34 Years | 0 (0.0%) | 0 (0.0%) |
| 35 to 64 Years | 12 (4.2%) | 1 (0.3%) |
| 65 to 74 Years | 0 (0.0%) | 0 (0.0%) |
| 75 Years and over | 3 (8.3%) | 1 (2.2%) |
Disability Class: Ambulatory Difficulty
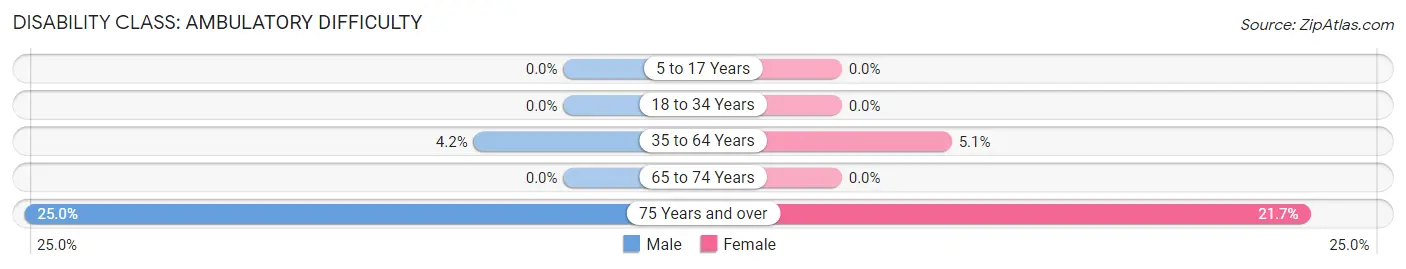
| Age Bracket | Male | Female |
| 5 to 17 Years | 0 (0.0%) | 0 (0.0%) |
| 18 to 34 Years | 0 (0.0%) | 0 (0.0%) |
| 35 to 64 Years | 12 (4.2%) | 16 (5.1%) |
| 65 to 74 Years | 0 (0.0%) | 0 (0.0%) |
| 75 Years and over | 9 (25.0%) | 10 (21.7%) |
Disability Class: Self-Care Difficulty
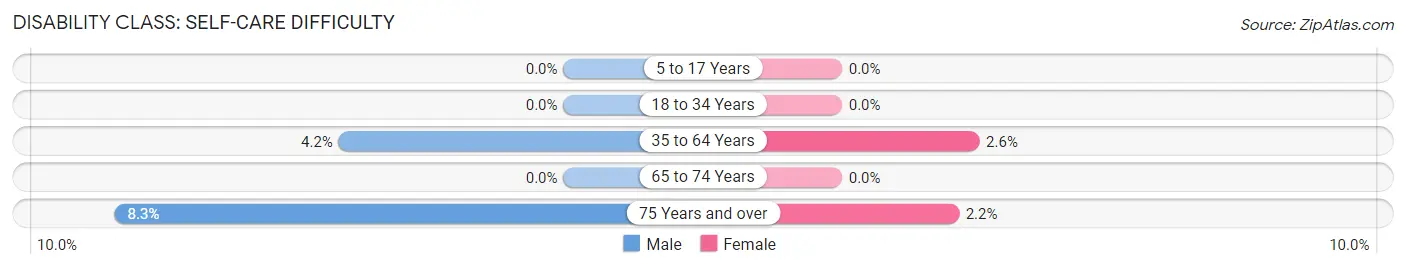
| Age Bracket | Male | Female |
| 5 to 17 Years | 0 (0.0%) | 0 (0.0%) |
| 18 to 34 Years | 0 (0.0%) | 0 (0.0%) |
| 35 to 64 Years | 12 (4.2%) | 8 (2.5%) |
| 65 to 74 Years | 0 (0.0%) | 0 (0.0%) |
| 75 Years and over | 3 (8.3%) | 1 (2.2%) |
Technology Access in Woxall
Computing Device Access in Woxall
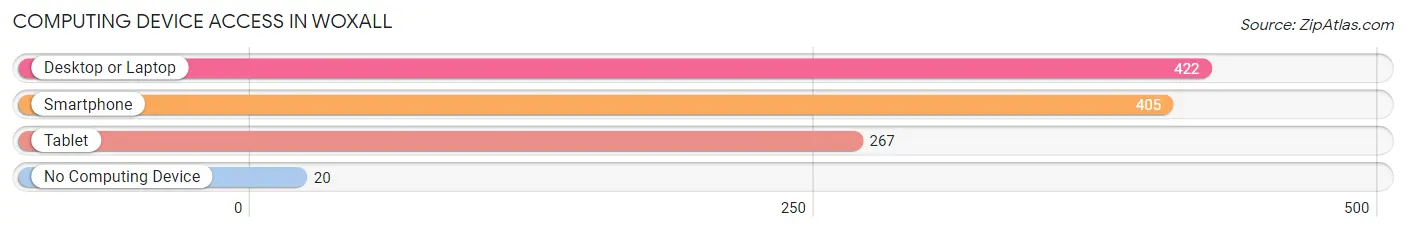
| Device Type | # Households | % Households |
| Desktop or Laptop | 422 | 94.0% |
| Smartphone | 405 | 90.2% |
| Tablet | 267 | 59.5% |
| No Computing Device | 20 | 4.4% |
| Total | 449 | 100.0% |
Internet Access in Woxall
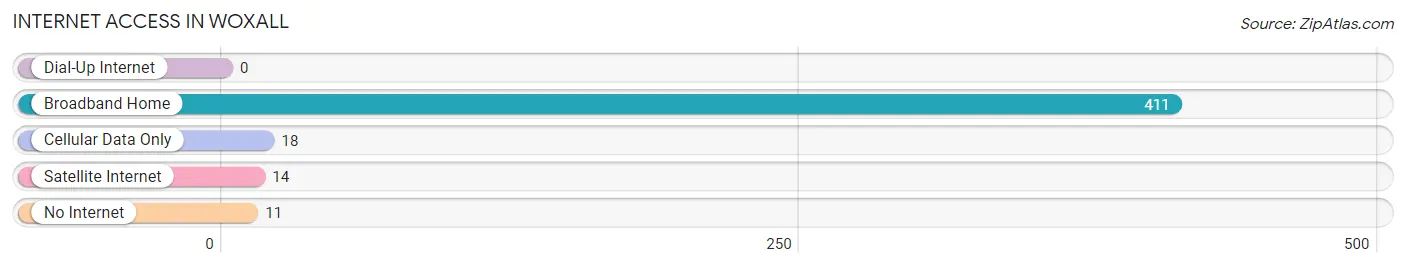
| Internet Type | # Households | % Households |
| Dial-Up Internet | 0 | 0.0% |
| Broadband Home | 411 | 91.5% |
| Cellular Data Only | 18 | 4.0% |
| Satellite Internet | 14 | 3.1% |
| No Internet | 11 | 2.5% |
| Total | 449 | 100.0% |
Woxall Summary
Woxall is a small unincorporated community located in Montgomery County, Pennsylvania. It is situated in the Upper Salford Township, approximately 25 miles northwest of Philadelphia. The population of Woxall was estimated to be 1,845 in the 2010 census.
History
The area that is now Woxall was first settled in the late 1700s by German immigrants. The first settlers were the Woxall family, who gave the community its name. The Woxall family owned a large tract of land in the area, and the community grew up around their homestead.
The first post office in Woxall was established in 1845. The community was officially incorporated in 1854. During the 19th century, Woxall was a thriving agricultural community. The town was home to several mills, including a grist mill, a saw mill, and a paper mill.
Geography
Woxall is located in the Upper Salford Township of Montgomery County, Pennsylvania. It is situated in the Perkiomen Valley, approximately 25 miles northwest of Philadelphia. The community is bordered by the towns of Salford, Sumneytown, and Green Lane.
The terrain of Woxall is mostly flat, with some rolling hills. The area is mostly rural, with some residential and commercial development. The Perkiomen Creek runs through the town, and there are several small lakes in the area.
Economy
The economy of Woxall is largely based on agriculture. The town is home to several farms, which produce a variety of crops, including corn, soybeans, and hay. There are also several small businesses in the area, including a hardware store, a grocery store, and a restaurant.
Demographics
According to the 2010 census, the population of Woxall was 1,845. The racial makeup of the town was 94.3% White, 2.2% African American, 0.7% Asian, and 2.8% from other races. The median household income was $60,938, and the median age was 43.
Woxall is a small, rural community with a strong sense of community. The town is home to several churches, a volunteer fire department, and a community center. The town is also home to several parks and recreational areas, including a public pool and a golf course.
Common Questions
What is Per Capita Income in Woxall?
Per Capita income in Woxall is $53,811.
What is the Median Family Income in Woxall?
Median Family Income in Woxall is $154,479.
What is the Median Household income in Woxall?
Median Household Income in Woxall is $153,021.
What is Income or Wage Gap in Woxall?
Income or Wage Gap in Woxall is 56.8%.
Women in Woxall earn 43.2 cents for every dollar earned by a man.
What is Inequality or Gini Index in Woxall?
Inequality or Gini Index in Woxall is 0.29.
What is the Total Population of Woxall?
Total Population of Woxall is 1,392.
What is the Total Male Population of Woxall?
Total Male Population of Woxall is 704.
What is the Total Female Population of Woxall?
Total Female Population of Woxall is 688.
What is the Ratio of Males per 100 Females in Woxall?
There are 102.33 Males per 100 Females in Woxall.
What is the Ratio of Females per 100 Males in Woxall?
There are 97.73 Females per 100 Males in Woxall.
What is the Median Population Age in Woxall?
Median Population Age in Woxall is 45.1 Years.
What is the Average Family Size in Woxall
Average Family Size in Woxall is 3.1 People.
What is the Average Household Size in Woxall
Average Household Size in Woxall is 3.1 People.
How Large is the Labor Force in Woxall?
There are 814 People in the Labor Forcein in Woxall.
What is the Percentage of People in the Labor Force in Woxall?
76.6% of People are in the Labor Force in Woxall.