Zip Codes with the Highest Percentage of Families with Income Above $200,000 in Scranton, PA
RELATED REPORTS & OPTIONS
Family Income | $200k+
Scranton
Compare Zip Codes
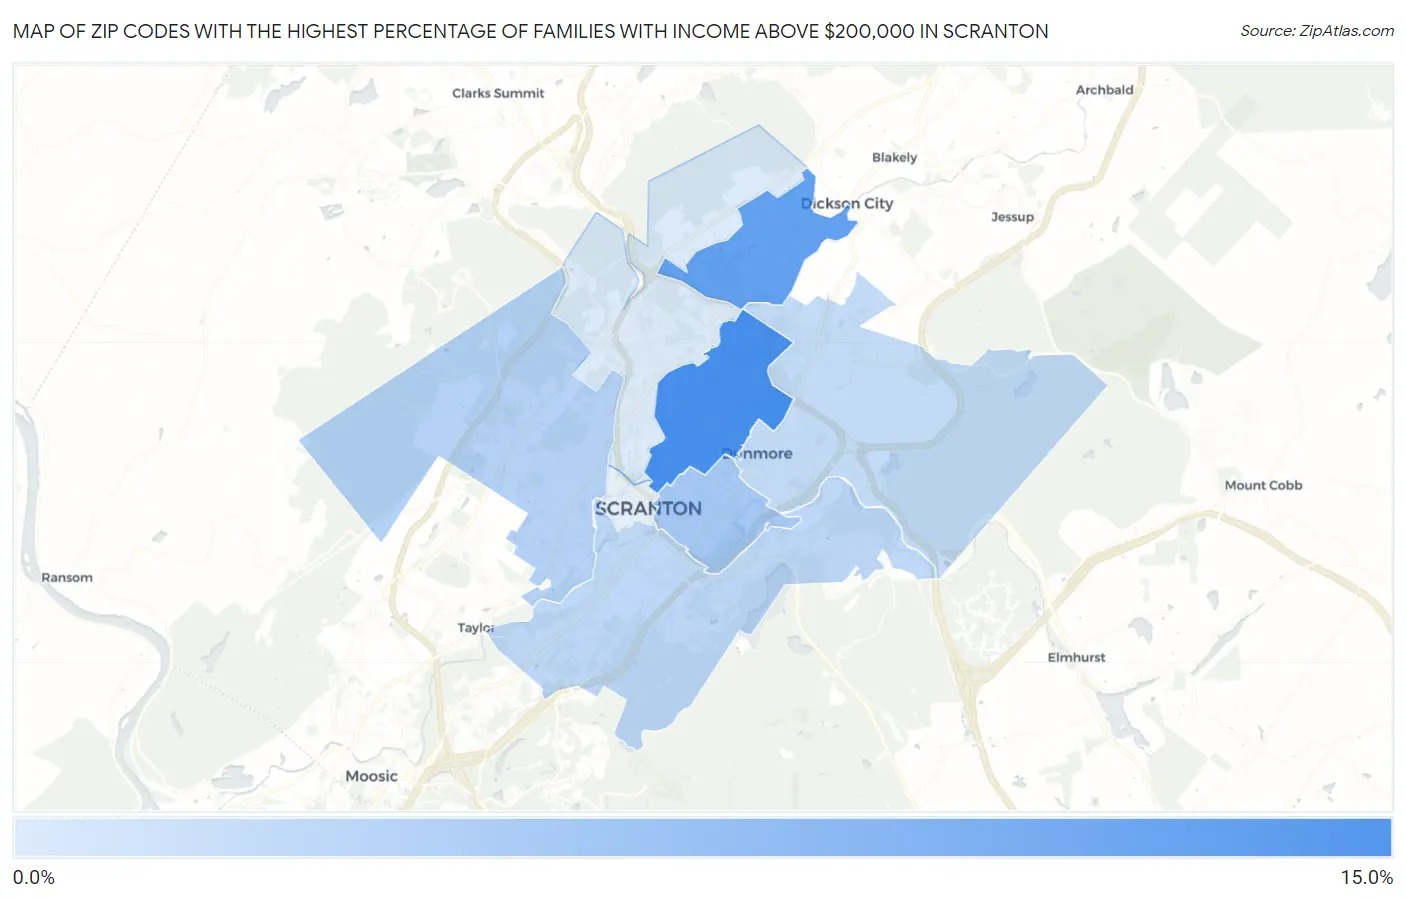
Map of Zip Codes with the Highest Percentage of Families with Income Above $200,000 in Scranton
2.8%
11.0%
Zip Codes with the Highest Percentage of Families with Income Above $200,000 in Scranton, PA
| Zip Code | Families with Income > $200k | vs State | vs National | |
| 1. | 18509 | 11.0% | 14.0%(-3.00)#469 | 14.8%(-3.80)#9,826 |
| 2. | 18519 | 9.5% | 14.0%(-4.50)#556 | 14.8%(-5.30)#11,342 |
| 3. | 18510 | 5.8% | 14.0%(-8.20)#836 | 14.8%(-9.00)#16,811 |
| 4. | 18504 | 4.9% | 14.0%(-9.10)#950 | 14.8%(-9.90)#18,618 |
| 5. | 18505 | 4.4% | 14.0%(-9.60)#1,001 | 14.8%(-10.4)#19,606 |
| 6. | 18512 | 4.1% | 14.0%(-9.90)#1,039 | 14.8%(-10.7)#20,220 |
| 7. | 18508 | 2.8% | 14.0%(-11.2)#1,194 | 14.8%(-12.0)#22,923 |
1
Common Questions
What are the Top 5 Zip Codes with the Highest Percentage of Families with Income Above $200,000 in Scranton, PA?
Top 5 Zip Codes with the Highest Percentage of Families with Income Above $200,000 in Scranton, PA are:
What zip code has the Highest Percentage of Families with Income Above $200,000 in Scranton, PA?
18509 has the Highest Percentage of Families with Income Above $200,000 in Scranton, PA with 11.0%.
What is the Percentage of Families with Income Above $200,000 in Scranton, PA?
Percentage of Families with Income Above $200,000 in Scranton is 5.1%.
What is the Percentage of Families with Income Above $200,000 in Pennsylvania?
Percentage of Families with Income Above $200,000 in Pennsylvania is 14.0%.
What is the Percentage of Families with Income Above $200,000 in the United States?
Percentage of Families with Income Above $200,000 in the United States is 14.8%.