Raubsville, PA Map & Demographics
Raubsville Map
Raubsville Overview
$52,745
PER CAPITA INCOME
$111,250
AVG HOUSEHOLD INCOME
40.9%
WAGE / INCOME GAP [ % ]
59.1¢/ $1
WAGE / INCOME GAP [ $ ]
0.40
INEQUALITY / GINI INDEX
1,349
TOTAL POPULATION
637
MALE POPULATION
712
FEMALE POPULATION
89.47
MALES / 100 FEMALES
111.77
FEMALES / 100 MALES
44.6
MEDIAN AGE
3.6
AVG FAMILY SIZE
3.2
AVG HOUSEHOLD SIZE
591
LABOR FORCE [ PEOPLE ]
57.7%
PERCENT IN LABOR FORCE
Income in Raubsville
Income Overview in Raubsville
| Characteristic | Number | Measure |
| Per Capita Income | 1,349 | $52,745 |
| Median Family Income | 321 | $0 |
| Mean Family Income | 321 | $189,340 |
| Median Household Income | 427 | $111,250 |
| Mean Household Income | 427 | $161,232 |
| Income Deficit | 321 | $0 |
| Wage / Income Gap (%) | 1,349 | 40.91% |
| Wage / Income Gap ($) | 1,349 | 59.09¢ per $1 |
| Gini / Inequality Index | 1,349 | 0.40 |
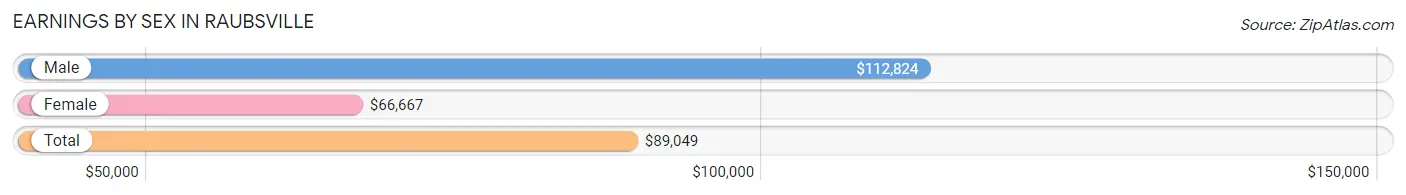
Earnings by Sex in Raubsville
Average Earnings in Raubsville are $89,049, $112,824 for men and $66,667 for women, a difference of 40.9%.
| Sex | Number | Average Earnings |
| Male | 275 (46.5%) | $112,824 |
| Female | 316 (53.5%) | $66,667 |
| Total | 591 (100.0%) | $89,049 |
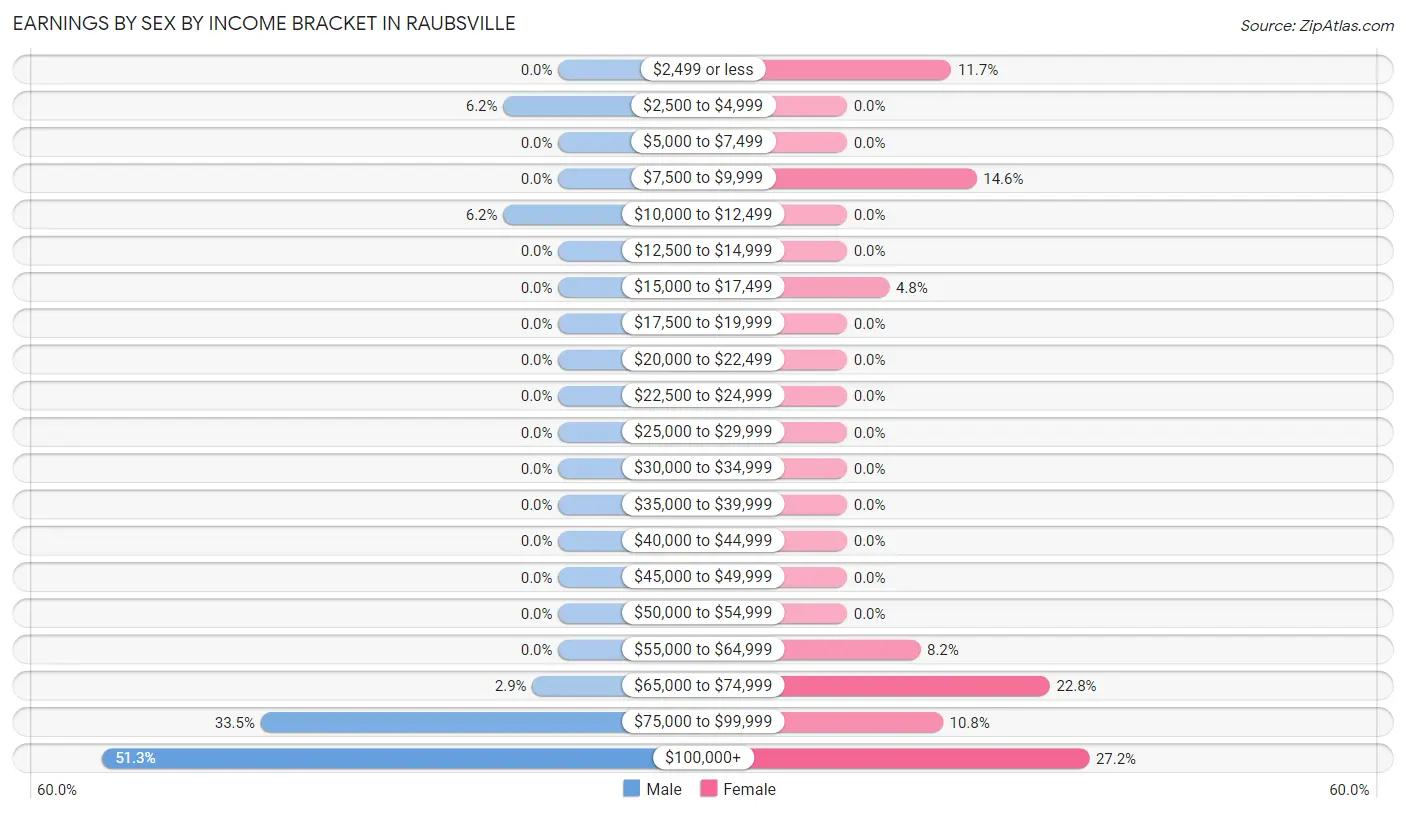
Earnings by Sex by Income Bracket in Raubsville
The most common earnings brackets in Raubsville are $100,000+ for men (141 | 51.3%) and $100,000+ for women (86 | 27.2%).
| Income | Male | Female |
| $2,499 or less | 0 (0.0%) | 37 (11.7%) |
| $2,500 to $4,999 | 17 (6.2%) | 0 (0.0%) |
| $5,000 to $7,499 | 0 (0.0%) | 0 (0.0%) |
| $7,500 to $9,999 | 0 (0.0%) | 46 (14.6%) |
| $10,000 to $12,499 | 17 (6.2%) | 0 (0.0%) |
| $12,500 to $14,999 | 0 (0.0%) | 0 (0.0%) |
| $15,000 to $17,499 | 0 (0.0%) | 15 (4.8%) |
| $17,500 to $19,999 | 0 (0.0%) | 0 (0.0%) |
| $20,000 to $22,499 | 0 (0.0%) | 0 (0.0%) |
| $22,500 to $24,999 | 0 (0.0%) | 0 (0.0%) |
| $25,000 to $29,999 | 0 (0.0%) | 0 (0.0%) |
| $30,000 to $34,999 | 0 (0.0%) | 0 (0.0%) |
| $35,000 to $39,999 | 0 (0.0%) | 0 (0.0%) |
| $40,000 to $44,999 | 0 (0.0%) | 0 (0.0%) |
| $45,000 to $49,999 | 0 (0.0%) | 0 (0.0%) |
| $50,000 to $54,999 | 0 (0.0%) | 0 (0.0%) |
| $55,000 to $64,999 | 0 (0.0%) | 26 (8.2%) |
| $65,000 to $74,999 | 8 (2.9%) | 72 (22.8%) |
| $75,000 to $99,999 | 92 (33.5%) | 34 (10.8%) |
| $100,000+ | 141 (51.3%) | 86 (27.2%) |
| Total | 275 (100.0%) | 316 (100.0%) |
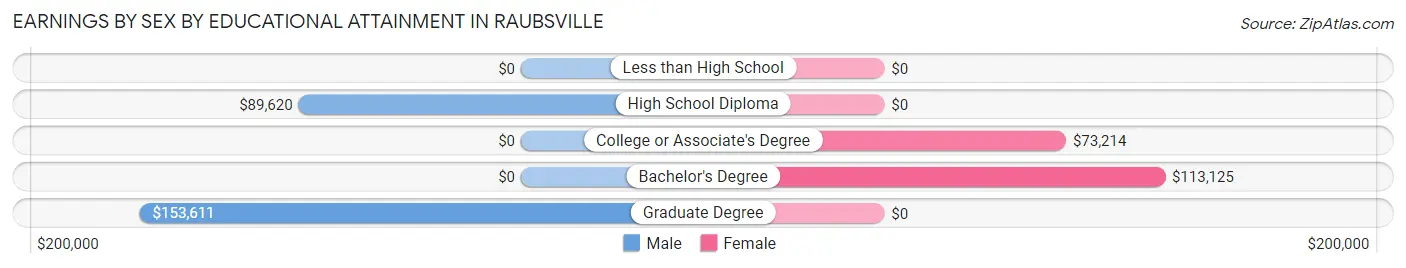
Earnings by Sex by Educational Attainment in Raubsville
Average earnings in Raubsville are $114,398 for men and $75,515 for women, a difference of 34.0%. Men with an educational attainment of graduate degree enjoy the highest average annual earnings of $153,611, while those with high school diploma education earn the least with $89,620. Women with an educational attainment of bachelor's degree earn the most with the average annual earnings of $113,125, while those with college or associate's degree education have the smallest earnings of $73,214.
| Educational Attainment | Male Income | Female Income |
| Less than High School | - | - |
| High School Diploma | $89,620 | $0 |
| College or Associate's Degree | - | - |
| Bachelor's Degree | - | - |
| Graduate Degree | $153,611 | $0 |
| Total | $114,398 | $75,515 |
Family Income in Raubsville
Family Income Brackets in Raubsville
According to the Raubsville family income data, there are 119 families falling into the $200,000+ income range, which is the most common income bracket and makes up 37.1% of all families.
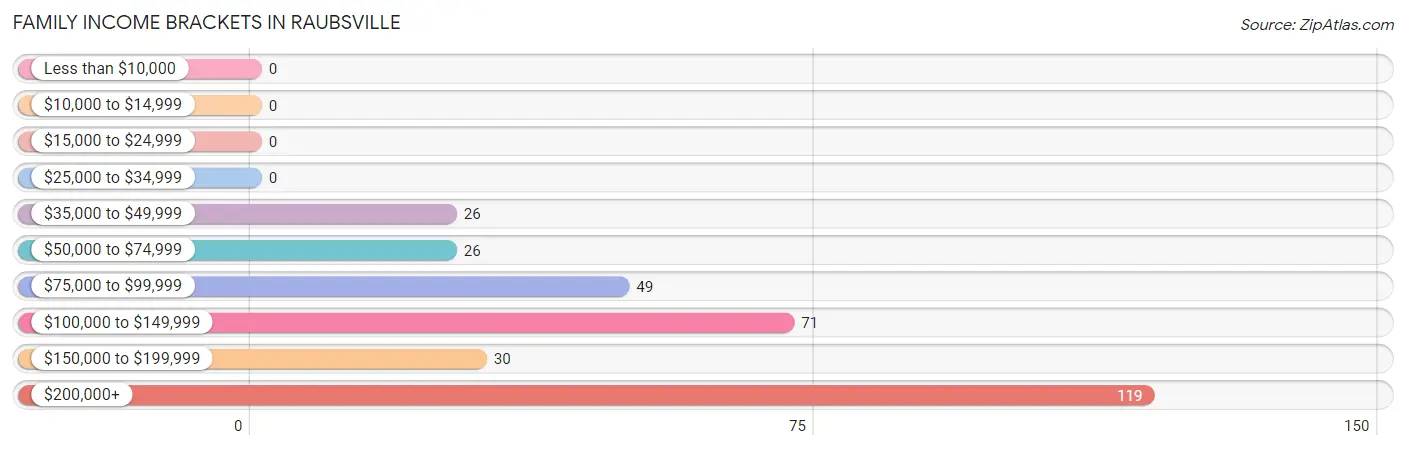
| Income Bracket | # Families | % Families |
| Less than $10,000 | 0 | 0.0% |
| $10,000 to $14,999 | 0 | 0.0% |
| $15,000 to $24,999 | 0 | 0.0% |
| $25,000 to $34,999 | 0 | 0.0% |
| $35,000 to $49,999 | 26 | 8.1% |
| $50,000 to $74,999 | 26 | 8.1% |
| $75,000 to $99,999 | 49 | 15.3% |
| $100,000 to $149,999 | 71 | 22.1% |
| $150,000 to $199,999 | 30 | 9.3% |
| $200,000+ | 119 | 37.1% |
Family Income by Famaliy Size in Raubsville
3-person families (53 | 16.5%) account for the highest median family income in Raubsville with $250,001 per family, while 3-person families (53 | 16.5%) have the highest median income of $83,334 per family member.
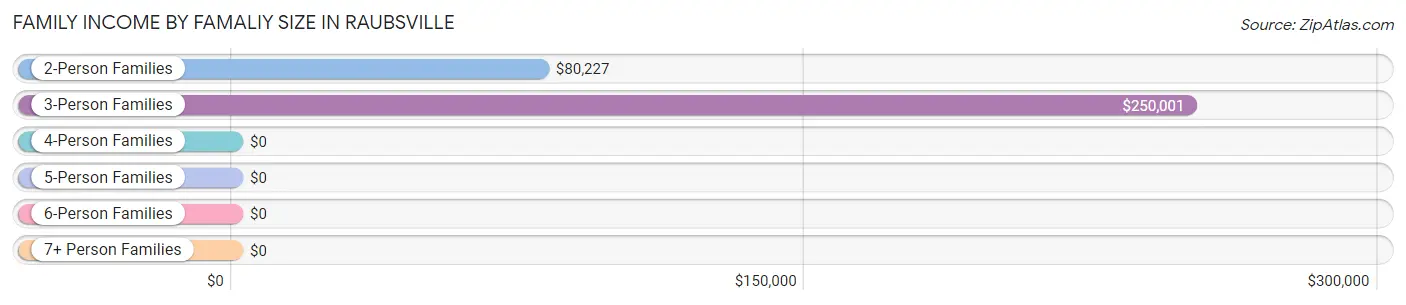
| Income Bracket | # Families | Median Income |
| 2-Person Families | 130 (40.5%) | $80,227 |
| 3-Person Families | 53 (16.5%) | $250,001 |
| 4-Person Families | 23 (7.2%) | $0 |
| 5-Person Families | 61 (19.0%) | $0 |
| 6-Person Families | 54 (16.8%) | $0 |
| 7+ Person Families | 0 (0.0%) | $0 |
| Total | 321 (100.0%) | $0 |
Family Income by Number of Earners in Raubsville
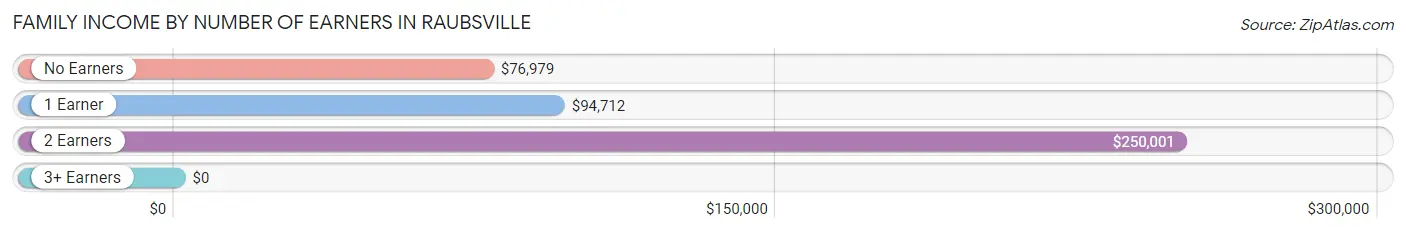
| Number of Earners | # Families | Median Income |
| No Earners | 71 (22.1%) | $76,979 |
| 1 Earner | 46 (14.3%) | $94,712 |
| 2 Earners | 189 (58.9%) | $250,001 |
| 3+ Earners | 15 (4.7%) | $0 |
| Total | 321 (100.0%) | $0 |
Household Income in Raubsville
Household Income Brackets in Raubsville
With 119 households falling in the category, the $200,000+ income range is the most frequent in Raubsville, accounting for 27.9% of all households.
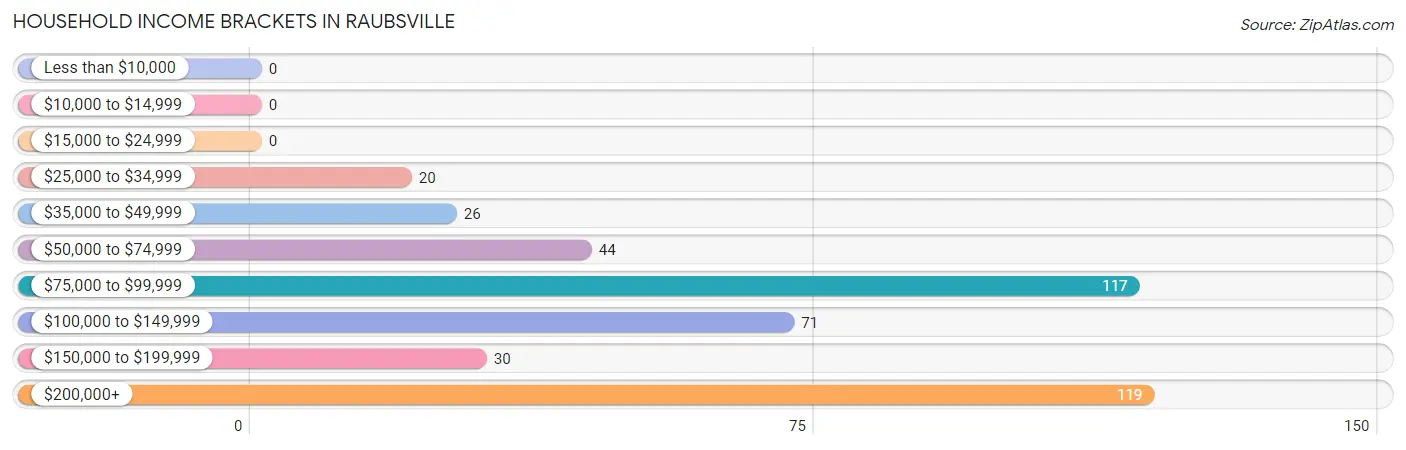
| Income Bracket | # Households | % Households |
| Less than $10,000 | 0 | 0.0% |
| $10,000 to $14,999 | 0 | 0.0% |
| $15,000 to $24,999 | 0 | 0.0% |
| $25,000 to $34,999 | 20 | 4.7% |
| $35,000 to $49,999 | 26 | 6.1% |
| $50,000 to $74,999 | 44 | 10.3% |
| $75,000 to $99,999 | 117 | 27.4% |
| $100,000 to $149,999 | 71 | 16.6% |
| $150,000 to $199,999 | 30 | 7.0% |
| $200,000+ | 119 | 27.9% |
Household Income by Householder Age in Raubsville
The median household income in Raubsville is $111,250, with the highest median household income of $250,001 found in the 25 to 44 years age bracket for the primary householder. A total of 114 households (26.7%) fall into this category.
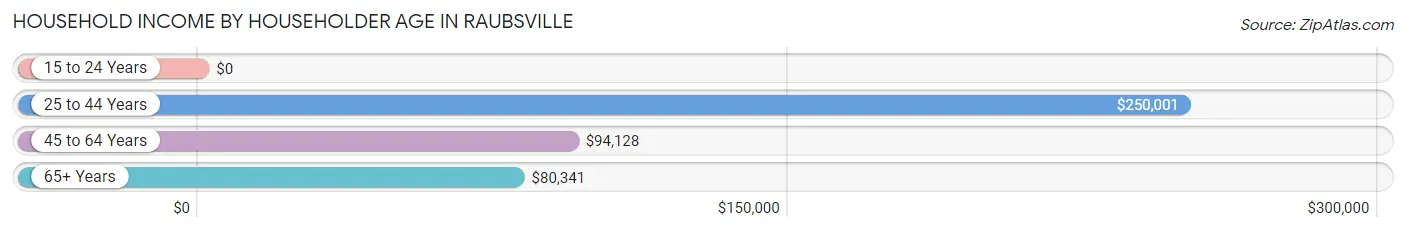
| Income Bracket | # Households | Median Income |
| 15 to 24 Years | 0 (0.0%) | $0 |
| 25 to 44 Years | 114 (26.7%) | $250,001 |
| 45 to 64 Years | 234 (54.8%) | $94,128 |
| 65+ Years | 79 (18.5%) | $80,341 |
| Total | 427 (100.0%) | $111,250 |
Poverty in Raubsville
Income Below Poverty by Sex and Age in Raubsville
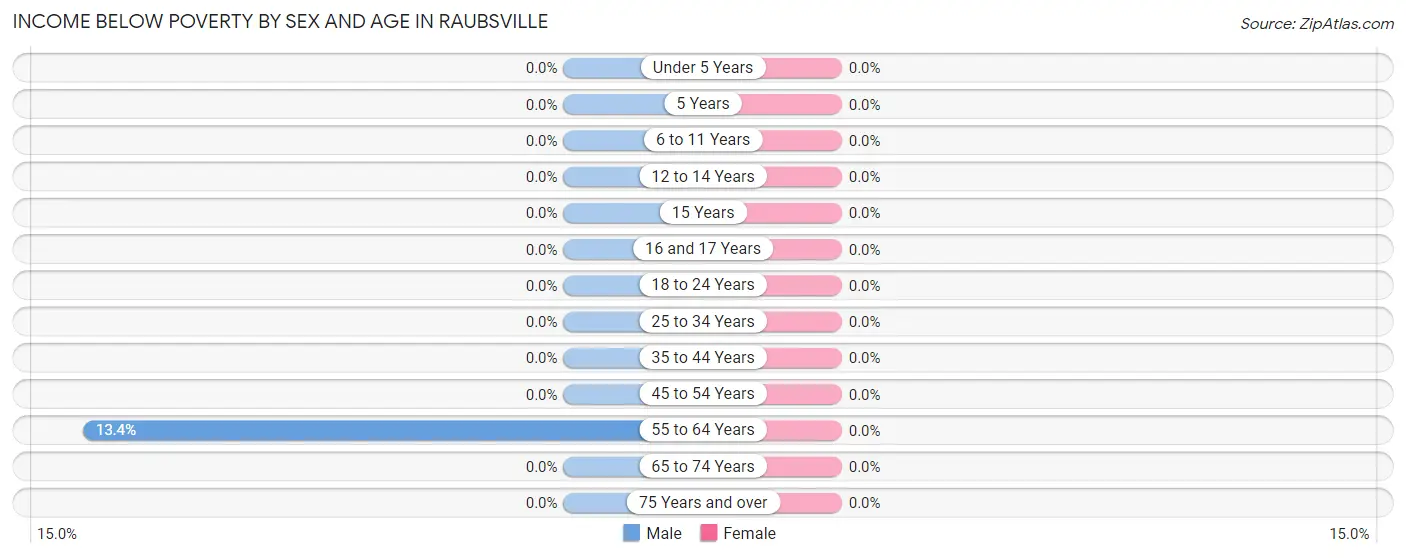
| Age Bracket | Male | Female |
| Under 5 Years | 0 (0.0%) | 0 (0.0%) |
| 5 Years | 0 (0.0%) | 0 (0.0%) |
| 6 to 11 Years | 0 (0.0%) | 0 (0.0%) |
| 12 to 14 Years | 0 (0.0%) | 0 (0.0%) |
| 15 Years | 0 (0.0%) | 0 (0.0%) |
| 16 and 17 Years | 0 (0.0%) | 0 (0.0%) |
| 18 to 24 Years | 0 (0.0%) | 0 (0.0%) |
| 25 to 34 Years | 0 (0.0%) | 0 (0.0%) |
| 35 to 44 Years | 0 (0.0%) | 0 (0.0%) |
| 45 to 54 Years | 0 (0.0%) | 0 (0.0%) |
| 55 to 64 Years | 19 (13.4%) | 0 (0.0%) |
| 65 to 74 Years | 0 (0.0%) | 0 (0.0%) |
| 75 Years and over | 0 (0.0%) | 0 (0.0%) |
| Total | 19 (3.0%) | 0 (0.0%) |
Income Above Poverty by Sex and Age in Raubsville
According to the poverty statistics in Raubsville, males aged under 5 years and females aged under 5 years are the age groups that are most secure financially, with 100.0% of males and 100.0% of females in these age groups living above the poverty line.
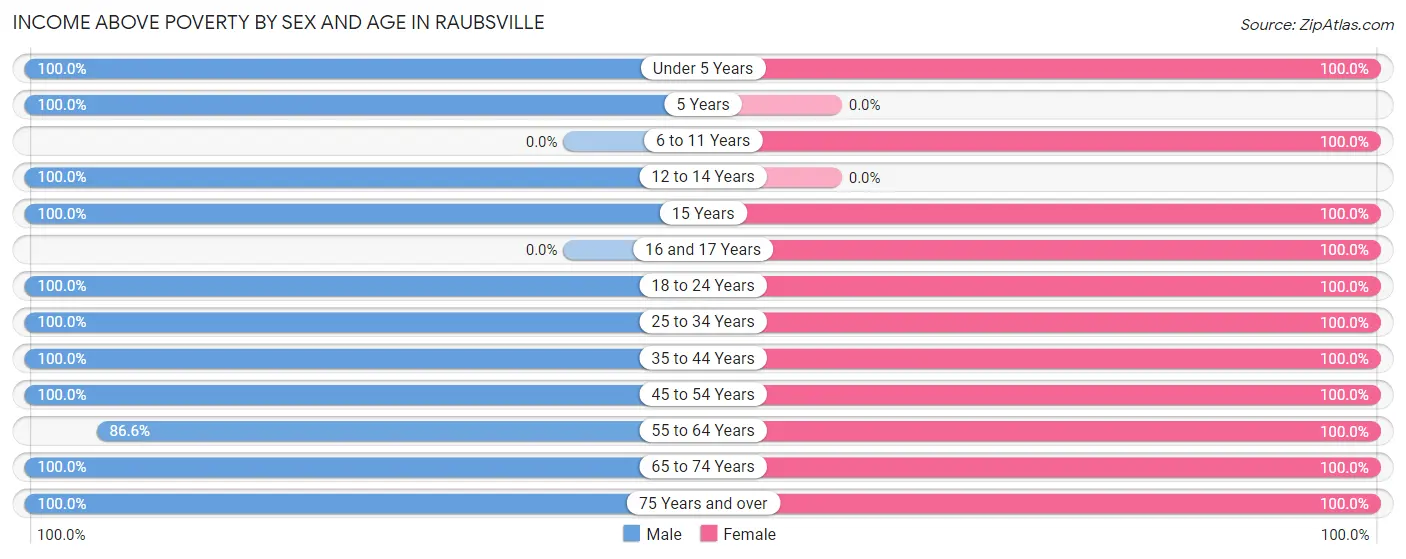
| Age Bracket | Male | Female |
| Under 5 Years | 52 (100.0%) | 24 (100.0%) |
| 5 Years | 13 (100.0%) | 0 (0.0%) |
| 6 to 11 Years | 0 (0.0%) | 49 (100.0%) |
| 12 to 14 Years | 89 (100.0%) | 0 (0.0%) |
| 15 Years | 48 (100.0%) | 49 (100.0%) |
| 16 and 17 Years | 0 (0.0%) | 79 (100.0%) |
| 18 to 24 Years | 34 (100.0%) | 83 (100.0%) |
| 25 to 34 Years | 19 (100.0%) | 15 (100.0%) |
| 35 to 44 Years | 67 (100.0%) | 73 (100.0%) |
| 45 to 54 Years | 95 (100.0%) | 149 (100.0%) |
| 55 to 64 Years | 123 (86.6%) | 101 (100.0%) |
| 65 to 74 Years | 64 (100.0%) | 65 (100.0%) |
| 75 Years and over | 14 (100.0%) | 25 (100.0%) |
| Total | 618 (97.0%) | 712 (100.0%) |
Income Below Poverty Among Married-Couple Families in Raubsville
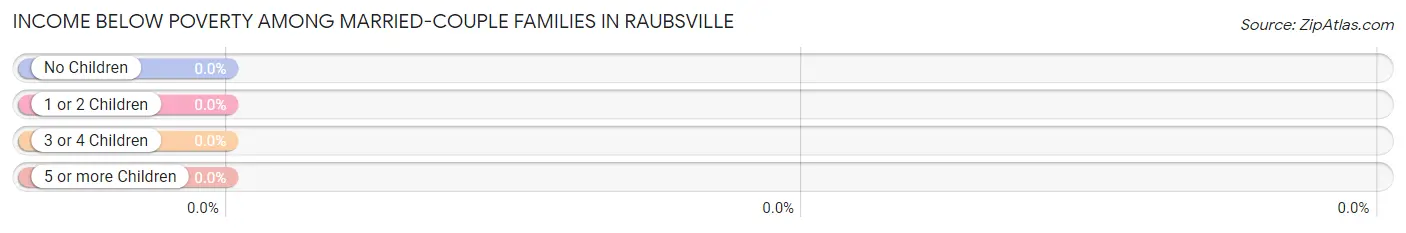
| Children | Above Poverty | Below Poverty |
| No Children | 127 (100.0%) | 0 (0.0%) |
| 1 or 2 Children | 99 (100.0%) | 0 (0.0%) |
| 3 or 4 Children | 69 (100.0%) | 0 (0.0%) |
| 5 or more Children | 0 (0.0%) | 0 (0.0%) |
| Total | 295 (100.0%) | 0 (0.0%) |
Income Below Poverty Among Single-Parent Households in Raubsville
| Children | Single Father | Single Mother |
| No Children | 0 (0.0%) | 0 (0.0%) |
| 1 or 2 Children | 0 (0.0%) | 0 (0.0%) |
| 3 or 4 Children | 0 (0.0%) | 0 (0.0%) |
| 5 or more Children | 0 (0.0%) | 0 (0.0%) |
| Total | 0 (0.0%) | 0 (0.0%) |
Income Below Poverty Among Married-Couple vs Single-Parent Households in Raubsville
| Children | Married-Couple Families | Single-Parent Households |
| No Children | 0 (0.0%) | 0 (0.0%) |
| 1 or 2 Children | 0 (0.0%) | 0 (0.0%) |
| 3 or 4 Children | 0 (0.0%) | 0 (0.0%) |
| 5 or more Children | 0 (0.0%) | 0 (0.0%) |
| Total | 0 (0.0%) | 0 (0.0%) |
Race in Raubsville
The most populous races in Raubsville are White / Caucasian (878 | 65.1%), Black / African American (304 | 22.5%), and Asian (116 | 8.6%).
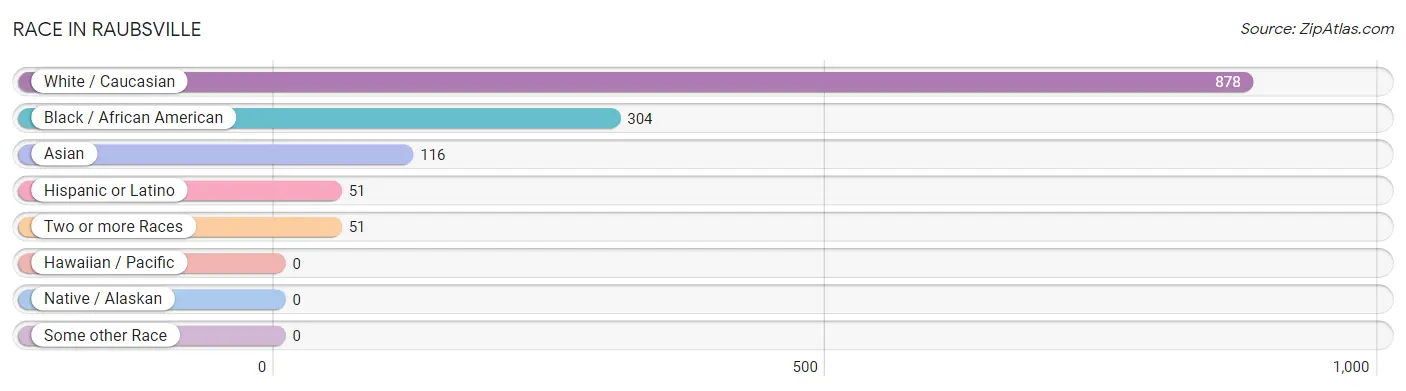
| Race | # Population | % Population |
| Asian | 116 | 8.6% |
| Black / African American | 304 | 22.5% |
| Hawaiian / Pacific | 0 | 0.0% |
| Hispanic or Latino | 51 | 3.8% |
| Native / Alaskan | 0 | 0.0% |
| White / Caucasian | 878 | 65.1% |
| Two or more Races | 51 | 3.8% |
| Some other Race | 0 | 0.0% |
| Total | 1,349 | 100.0% |
Ancestry in Raubsville
The most populous ancestries reported in Raubsville are American (458 | 34.0%), Irish (257 | 19.1%), Haitian (250 | 18.5%), English (218 | 16.2%), and German (99 | 7.3%), together accounting for 95.0% of all Raubsville residents.
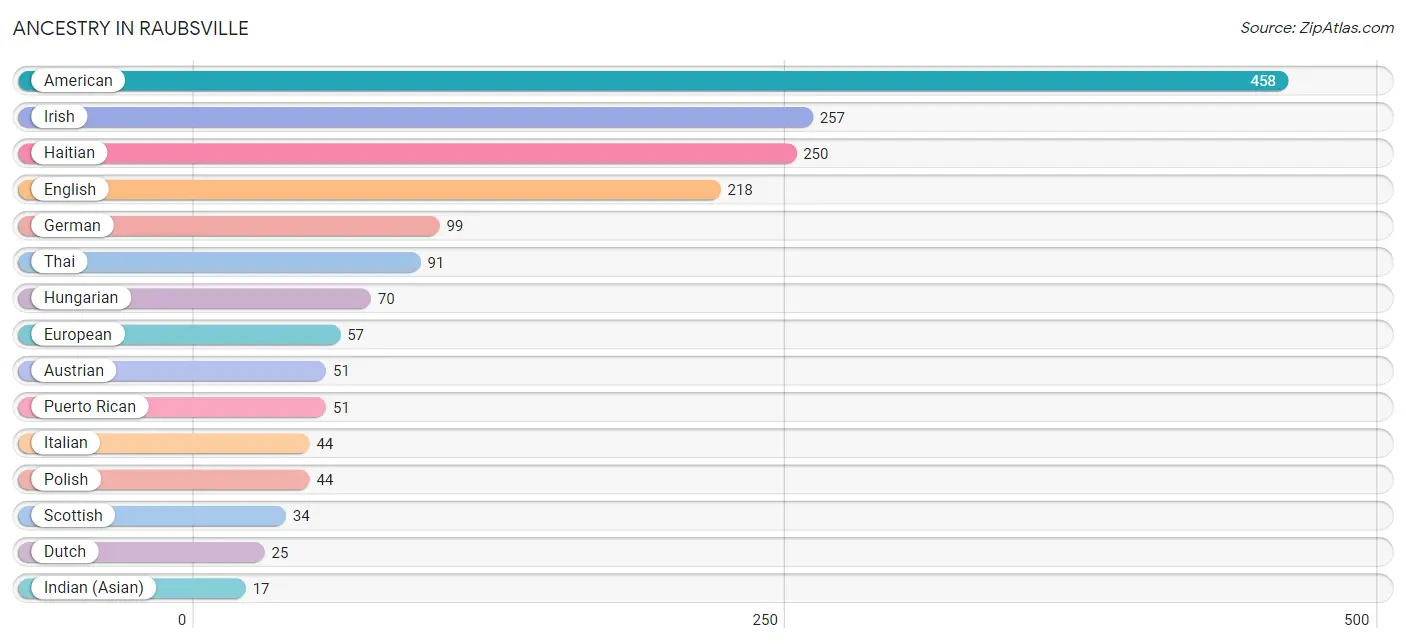
| Ancestry | # Population | % Population |
| American | 458 | 34.0% |
| Austrian | 51 | 3.8% |
| Dutch | 25 | 1.8% |
| English | 218 | 16.2% |
| European | 57 | 4.2% |
| German | 99 | 7.3% |
| Haitian | 250 | 18.5% |
| Hungarian | 70 | 5.2% |
| Indian (Asian) | 17 | 1.3% |
| Irish | 257 | 19.1% |
| Italian | 44 | 3.3% |
| Korean | 8 | 0.6% |
| Polish | 44 | 3.3% |
| Puerto Rican | 51 | 3.8% |
| Scotch-Irish | 15 | 1.1% |
| Scottish | 34 | 2.5% |
| Slovak | 11 | 0.8% |
| Thai | 91 | 6.8% | View All 18 Rows |
Immigrants in Raubsville
The most numerous immigrant groups reported in Raubsville came from Caribbean (114 | 8.5%), Haiti (114 | 8.5%), Latin America (114 | 8.5%), Asia (34 | 2.5%), and India (26 | 1.9%), together accounting for 29.8% of all Raubsville residents.
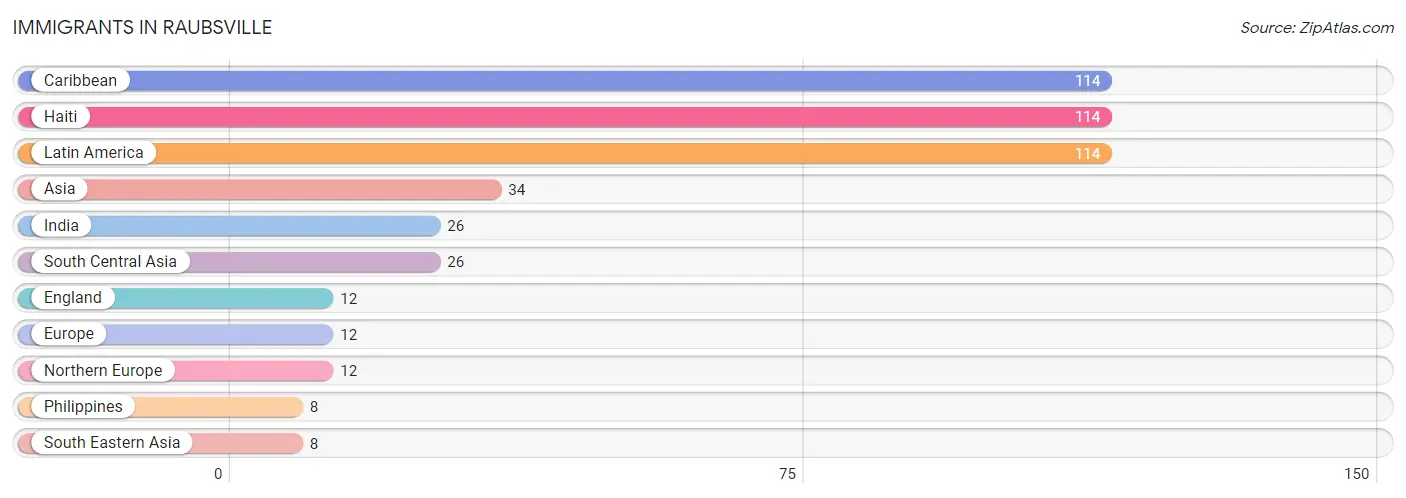
| Immigration Origin | # Population | % Population |
| Asia | 34 | 2.5% |
| Caribbean | 114 | 8.5% |
| England | 12 | 0.9% |
| Europe | 12 | 0.9% |
| Haiti | 114 | 8.5% |
| India | 26 | 1.9% |
| Latin America | 114 | 8.5% |
| Northern Europe | 12 | 0.9% |
| Philippines | 8 | 0.6% |
| South Central Asia | 26 | 1.9% |
| South Eastern Asia | 8 | 0.6% | View All 11 Rows |
Sex and Age in Raubsville
Sex and Age in Raubsville
The most populous age groups in Raubsville are 55 to 59 Years (142 | 22.3%) for men and 15 to 19 Years (174 | 24.4%) for women.
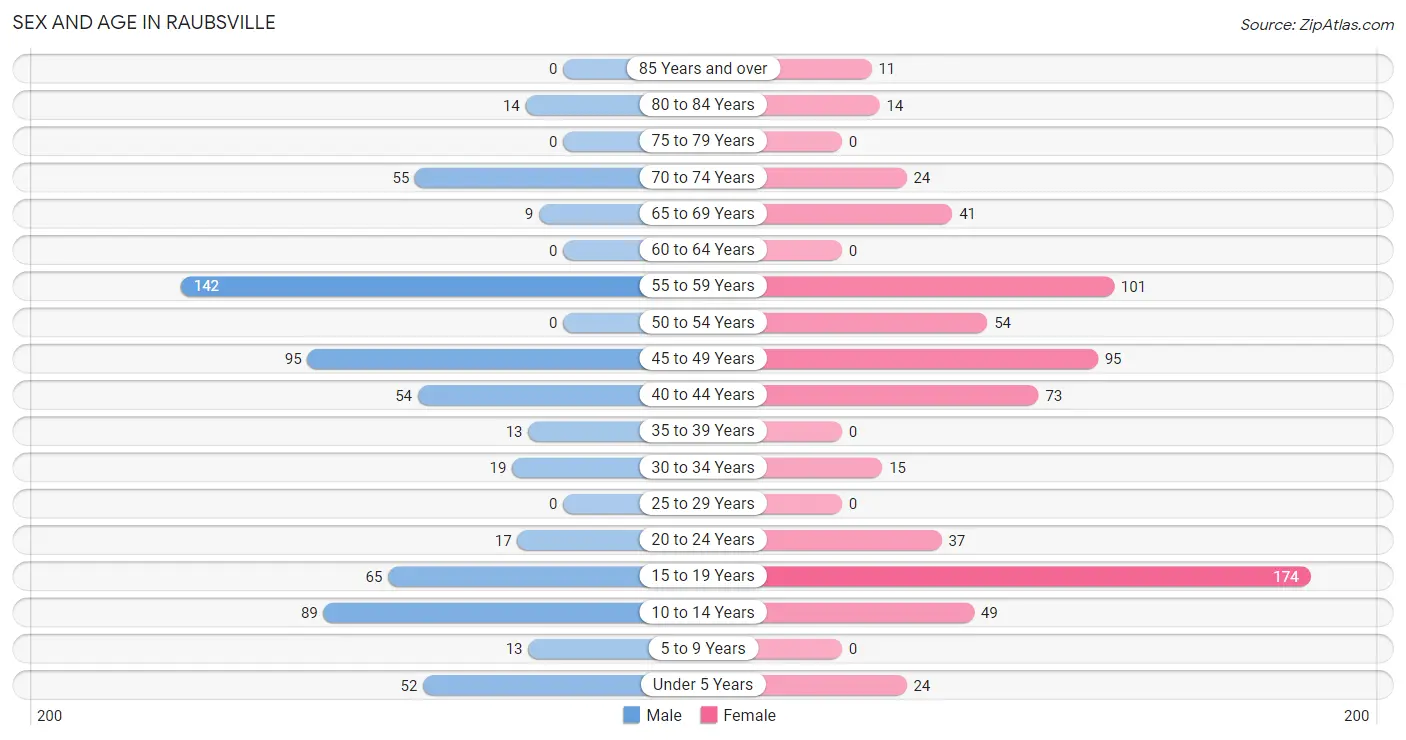
| Age Bracket | Male | Female |
| Under 5 Years | 52 (8.2%) | 24 (3.4%) |
| 5 to 9 Years | 13 (2.0%) | 0 (0.0%) |
| 10 to 14 Years | 89 (14.0%) | 49 (6.9%) |
| 15 to 19 Years | 65 (10.2%) | 174 (24.4%) |
| 20 to 24 Years | 17 (2.7%) | 37 (5.2%) |
| 25 to 29 Years | 0 (0.0%) | 0 (0.0%) |
| 30 to 34 Years | 19 (3.0%) | 15 (2.1%) |
| 35 to 39 Years | 13 (2.0%) | 0 (0.0%) |
| 40 to 44 Years | 54 (8.5%) | 73 (10.2%) |
| 45 to 49 Years | 95 (14.9%) | 95 (13.3%) |
| 50 to 54 Years | 0 (0.0%) | 54 (7.6%) |
| 55 to 59 Years | 142 (22.3%) | 101 (14.2%) |
| 60 to 64 Years | 0 (0.0%) | 0 (0.0%) |
| 65 to 69 Years | 9 (1.4%) | 41 (5.8%) |
| 70 to 74 Years | 55 (8.6%) | 24 (3.4%) |
| 75 to 79 Years | 0 (0.0%) | 0 (0.0%) |
| 80 to 84 Years | 14 (2.2%) | 14 (2.0%) |
| 85 Years and over | 0 (0.0%) | 11 (1.5%) |
| Total | 637 (100.0%) | 712 (100.0%) |
Families and Households in Raubsville
Median Family Size in Raubsville
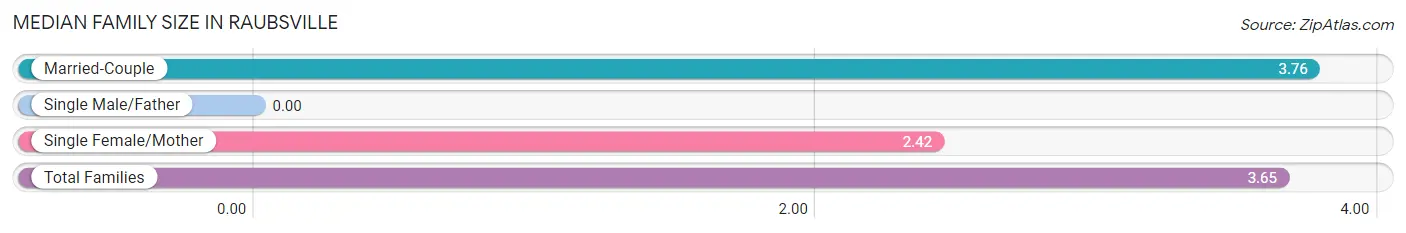
| Family Type | # Families | Family Size |
| Married-Couple | 295 (91.9%) | 3.76 |
| Single Male/Father | 0 (0.0%) | - |
| Single Female/Mother | 26 (8.1%) | 2.42 |
| Total Families | 321 (100.0%) | 3.65 |
Median Household Size in Raubsville
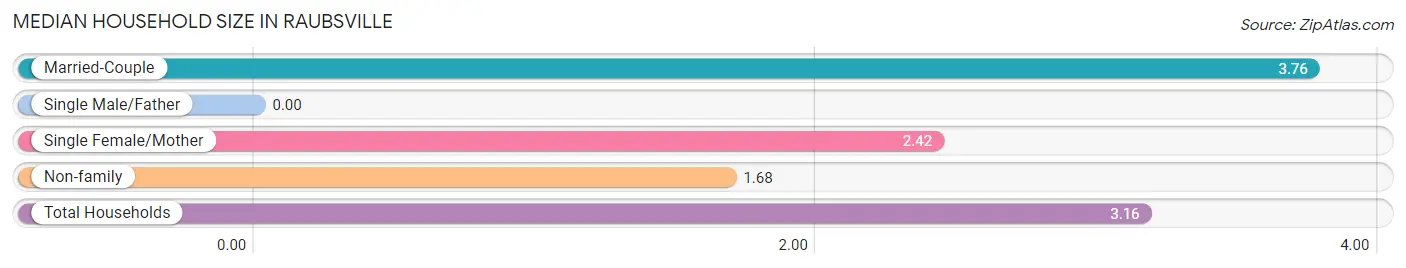
| Household Type | # Households | Household Size |
| Married-Couple | 295 (69.1%) | 3.76 |
| Single Male/Father | 0 (0.0%) | - |
| Single Female/Mother | 26 (6.1%) | 2.42 |
| Non-family | 106 (24.8%) | 1.68 |
| Total Households | 427 (100.0%) | 3.16 |
Household Size by Marriage Status in Raubsville
Out of a total of 427 households in Raubsville, 321 (75.2%) are family households, while 106 (24.8%) are nonfamily households. The most numerous type of family households are 2-person households, comprising 130, and the most common type of nonfamily households are 2-person households, comprising 71.
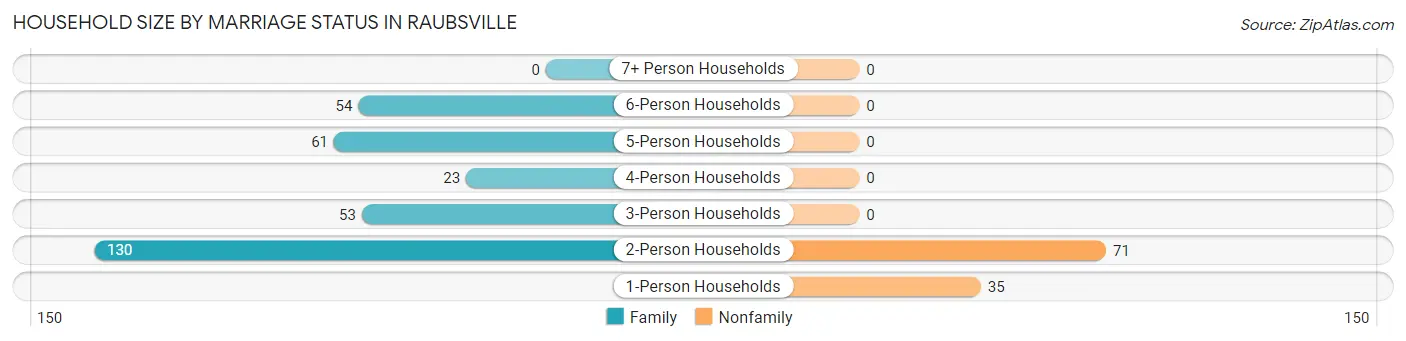
| Household Size | Family Households | Nonfamily Households |
| 1-Person Households | - | 35 (8.2%) |
| 2-Person Households | 130 (30.4%) | 71 (16.6%) |
| 3-Person Households | 53 (12.4%) | 0 (0.0%) |
| 4-Person Households | 23 (5.4%) | 0 (0.0%) |
| 5-Person Households | 61 (14.3%) | 0 (0.0%) |
| 6-Person Households | 54 (12.7%) | 0 (0.0%) |
| 7+ Person Households | 0 (0.0%) | 0 (0.0%) |
| Total | 321 (75.2%) | 106 (24.8%) |
Female Fertility in Raubsville
Fertility by Age in Raubsville
| Age Bracket | Women with Births | Births / 1,000 Women |
| 15 to 19 years | 0 (0.0%) | 0.0 |
| 20 to 34 years | 0 (0.0%) | 0.0 |
| 35 to 50 years | 0 (0.0%) | 0.0 |
| Total | 0 (0.0%) | 0.0 |
Fertility by Age by Marriage Status in Raubsville
| Age Bracket | Married | Unmarried |
| 15 to 19 years | 0 (0.0%) | 0 (0.0%) |
| 20 to 34 years | 0 (0.0%) | 0 (0.0%) |
| 35 to 50 years | 0 (0.0%) | 0 (0.0%) |
| Total | 0 (0.0%) | 0 (0.0%) |
Fertility by Education in Raubsville
| Educational Attainment | Women with Births | Births / 1,000 Women |
| Less than High School | 0 (0.0%) | 0.0 |
| High School Diploma | 0 (0.0%) | 0.0 |
| College or Associate's Degree | 0 (0.0%) | 0.0 |
| Bachelor's Degree | 0 (0.0%) | 0.0 |
| Graduate Degree | 0 (0.0%) | 0.0 |
| Total | 0 (0.0%) | 0.0 |
Fertility by Education by Marriage Status in Raubsville
| Educational Attainment | Married | Unmarried |
| Less than High School | 0 (0.0%) | 0 (0.0%) |
| High School Diploma | 0 (0.0%) | 0 (0.0%) |
| College or Associate's Degree | 0 (0.0%) | 0 (0.0%) |
| Bachelor's Degree | 0 (0.0%) | 0 (0.0%) |
| Graduate Degree | 0 (0.0%) | 0 (0.0%) |
| Total | 0 (0.0%) | 0 (0.0%) |
Employment Characteristics in Raubsville
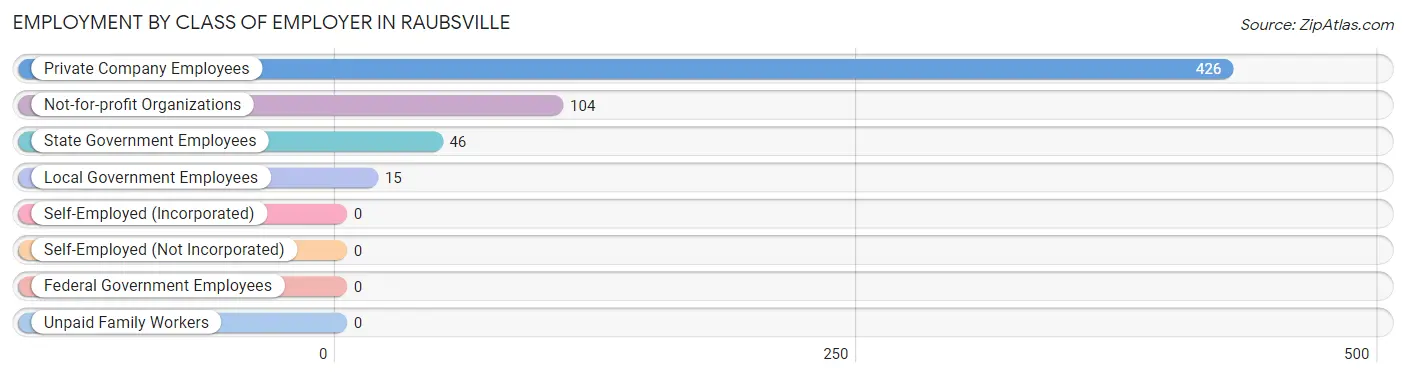
Employment by Class of Employer in Raubsville
Among the 591 employed individuals in Raubsville, private company employees (426 | 72.1%), not-for-profit organizations (104 | 17.6%), and state government employees (46 | 7.8%) make up the most common classes of employment.
| Employer Class | # Employees | % Employees |
| Private Company Employees | 426 | 72.1% |
| Self-Employed (Incorporated) | 0 | 0.0% |
| Self-Employed (Not Incorporated) | 0 | 0.0% |
| Not-for-profit Organizations | 104 | 17.6% |
| Local Government Employees | 15 | 2.5% |
| State Government Employees | 46 | 7.8% |
| Federal Government Employees | 0 | 0.0% |
| Unpaid Family Workers | 0 | 0.0% |
| Total | 591 | 100.0% |
Employment Status by Age in Raubsville
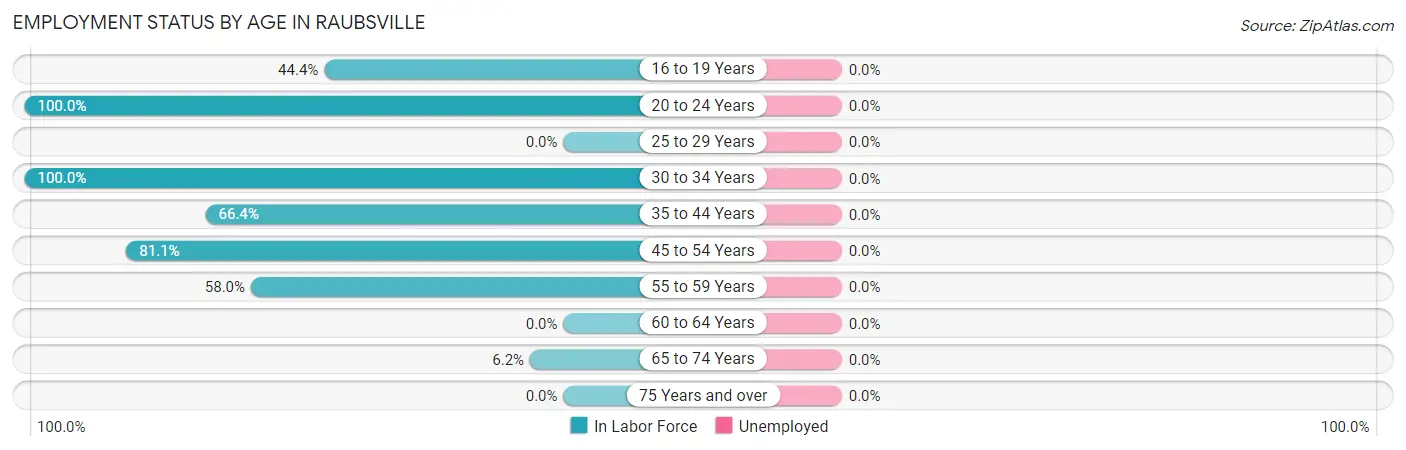
| Age Bracket | In Labor Force | Unemployed |
| 16 to 19 Years | 63 (44.4%) | 0 (0.0%) |
| 20 to 24 Years | 54 (100.0%) | 0 (0.0%) |
| 25 to 29 Years | 0 (0.0%) | 0 (0.0%) |
| 30 to 34 Years | 34 (100.0%) | 0 (0.0%) |
| 35 to 44 Years | 93 (66.4%) | 0 (0.0%) |
| 45 to 54 Years | 198 (81.1%) | 0 (0.0%) |
| 55 to 59 Years | 141 (58.0%) | 0 (0.0%) |
| 60 to 64 Years | 0 (0.0%) | 0 (0.0%) |
| 65 to 74 Years | 8 (6.2%) | 0 (0.0%) |
| 75 Years and over | 0 (0.0%) | 0 (0.0%) |
| Total | 591 (57.7%) | 0 (0.0%) |
Employment Status by Educational Attainment in Raubsville
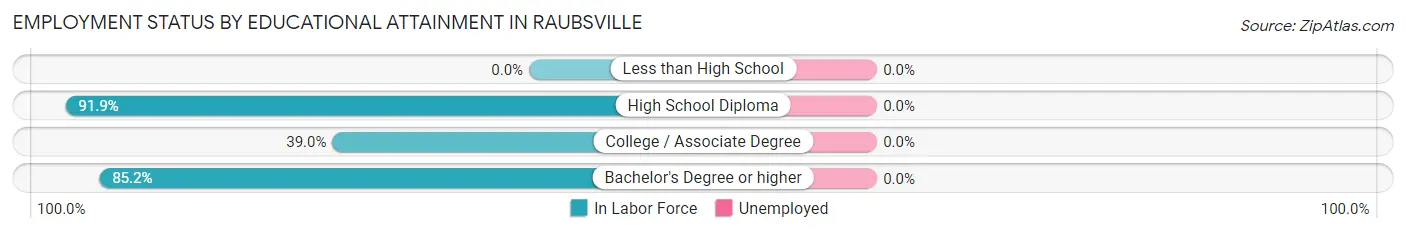
| Educational Attainment | In Labor Force | Unemployed |
| Less than High School | 0 (0.0%) | 0 (0.0%) |
| High School Diploma | 137 (91.9%) | 0 (0.0%) |
| College / Associate Degree | 76 (39.0%) | 0 (0.0%) |
| Bachelor's Degree or higher | 253 (85.2%) | 0 (0.0%) |
| Total | 466 (70.5%) | 0 (0.0%) |
Employment Occupations by Sex in Raubsville
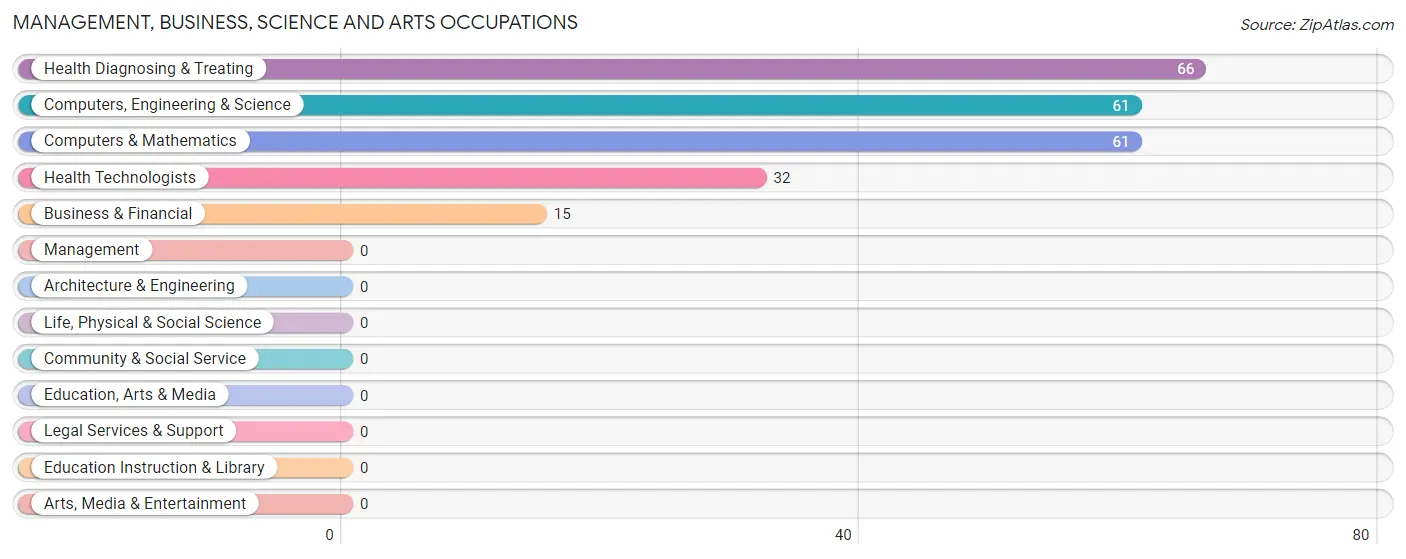
Management, Business, Science and Arts Occupations
The most common Management, Business, Science and Arts occupations in Raubsville are Health Diagnosing & Treating (66 | 11.2%), Computers, Engineering & Science (61 | 10.3%), Computers & Mathematics (61 | 10.3%), Health Technologists (32 | 5.4%), and Business & Financial (15 | 2.5%).
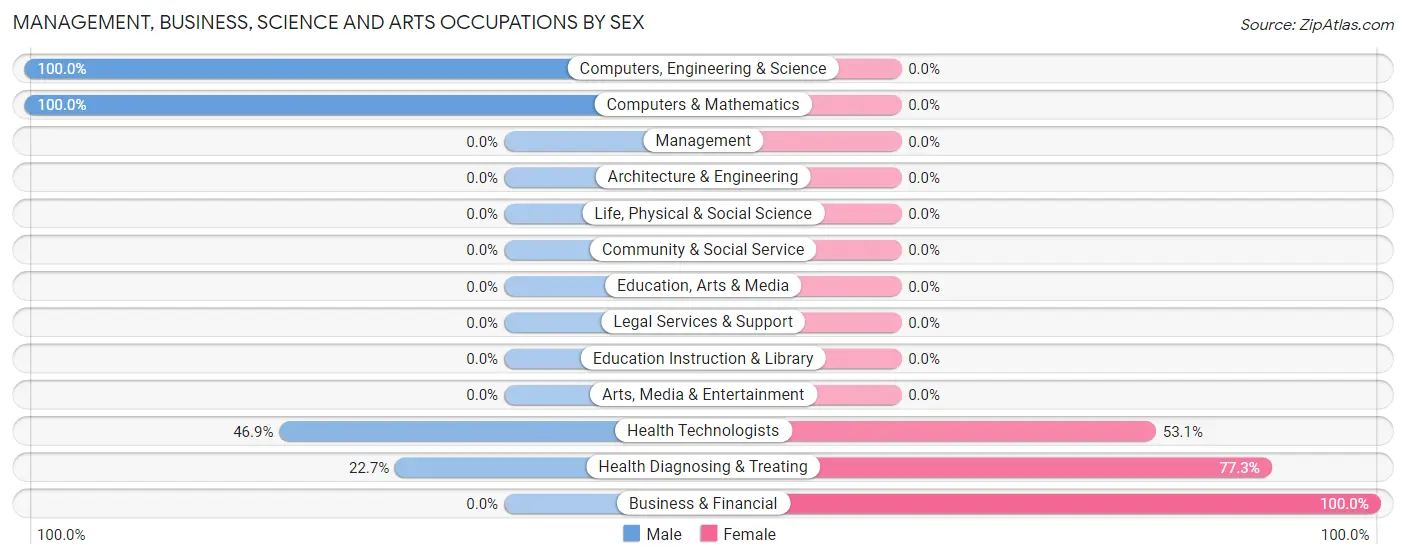
Management, Business, Science and Arts Occupations by Sex
Within the Management, Business, Science and Arts occupations in Raubsville, the most male-oriented occupations are Computers, Engineering & Science (100.0%), Computers & Mathematics (100.0%), and Health Technologists (46.9%), while the most female-oriented occupations are Business & Financial (100.0%), Health Diagnosing & Treating (77.3%), and Health Technologists (53.1%).
| Occupation | Male | Female |
| Management | 0 (0.0%) | 0 (0.0%) |
| Business & Financial | 0 (0.0%) | 15 (100.0%) |
| Computers, Engineering & Science | 61 (100.0%) | 0 (0.0%) |
| Computers & Mathematics | 61 (100.0%) | 0 (0.0%) |
| Architecture & Engineering | 0 (0.0%) | 0 (0.0%) |
| Life, Physical & Social Science | 0 (0.0%) | 0 (0.0%) |
| Community & Social Service | 0 (0.0%) | 0 (0.0%) |
| Education, Arts & Media | 0 (0.0%) | 0 (0.0%) |
| Legal Services & Support | 0 (0.0%) | 0 (0.0%) |
| Education Instruction & Library | 0 (0.0%) | 0 (0.0%) |
| Arts, Media & Entertainment | 0 (0.0%) | 0 (0.0%) |
| Health Diagnosing & Treating | 15 (22.7%) | 51 (77.3%) |
| Health Technologists | 15 (46.9%) | 17 (53.1%) |
| Total (Category) | 76 (53.5%) | 66 (46.5%) |
| Total (Overall) | 275 (46.5%) | 316 (53.5%) |
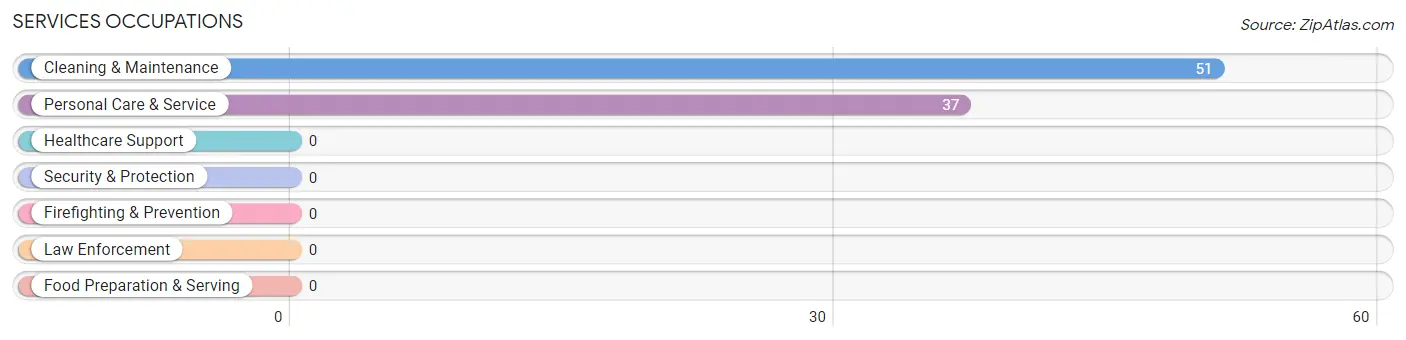
Services Occupations
The most common Services occupations in Raubsville are Cleaning & Maintenance (51 | 8.6%), and Personal Care & Service (37 | 6.3%).
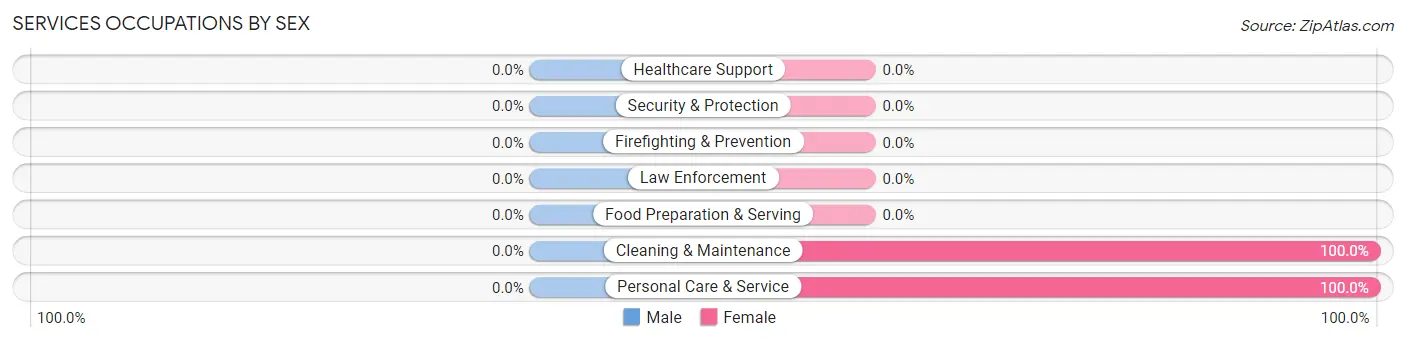
Services Occupations by Sex
| Occupation | Male | Female |
| Healthcare Support | 0 (0.0%) | 0 (0.0%) |
| Security & Protection | 0 (0.0%) | 0 (0.0%) |
| Firefighting & Prevention | 0 (0.0%) | 0 (0.0%) |
| Law Enforcement | 0 (0.0%) | 0 (0.0%) |
| Food Preparation & Serving | 0 (0.0%) | 0 (0.0%) |
| Cleaning & Maintenance | 0 (0.0%) | 51 (100.0%) |
| Personal Care & Service | 0 (0.0%) | 37 (100.0%) |
| Total (Category) | 0 (0.0%) | 88 (100.0%) |
| Total (Overall) | 275 (46.5%) | 316 (53.5%) |
Sales and Office Occupations
The most common Sales and Office occupations in Raubsville are Office & Administration (144 | 24.4%), and Sales & Related (12 | 2.0%).
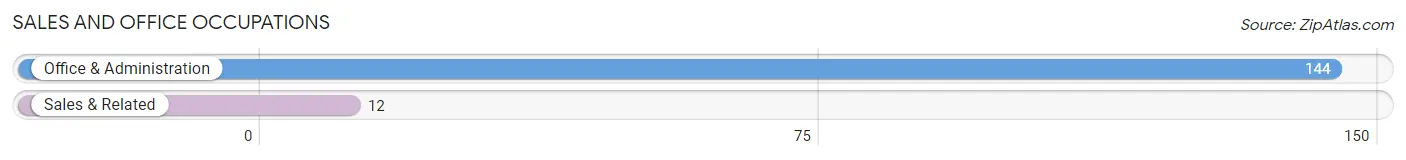
Sales and Office Occupations by Sex
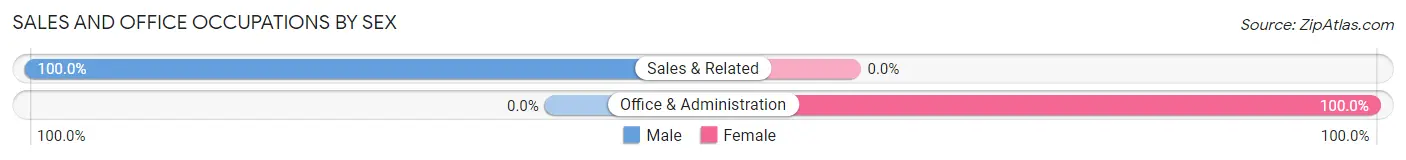
| Occupation | Male | Female |
| Sales & Related | 12 (100.0%) | 0 (0.0%) |
| Office & Administration | 0 (0.0%) | 144 (100.0%) |
| Total (Category) | 12 (7.7%) | 144 (92.3%) |
| Total (Overall) | 275 (46.5%) | 316 (53.5%) |
Natural Resources, Construction and Maintenance Occupations
The most common Natural Resources, Construction and Maintenance occupations in Raubsville are Construction & Extraction (71 | 12.0%), and Installation, Maintenance & Repair (46 | 7.8%).
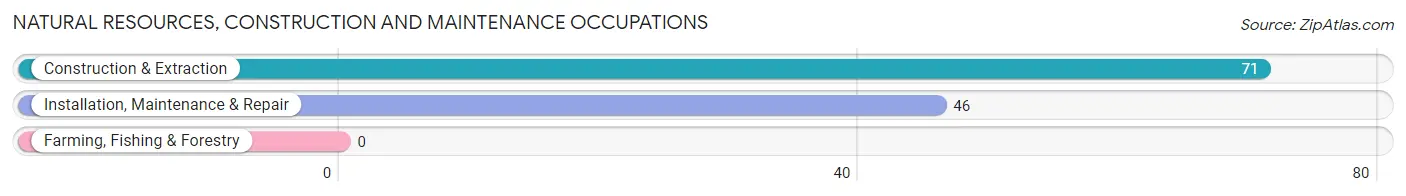
Natural Resources, Construction and Maintenance Occupations by Sex
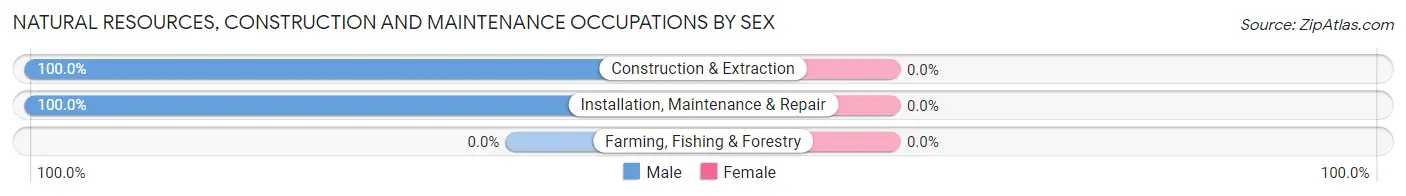
| Occupation | Male | Female |
| Farming, Fishing & Forestry | 0 (0.0%) | 0 (0.0%) |
| Construction & Extraction | 71 (100.0%) | 0 (0.0%) |
| Installation, Maintenance & Repair | 46 (100.0%) | 0 (0.0%) |
| Total (Category) | 117 (100.0%) | 0 (0.0%) |
| Total (Overall) | 275 (46.5%) | 316 (53.5%) |
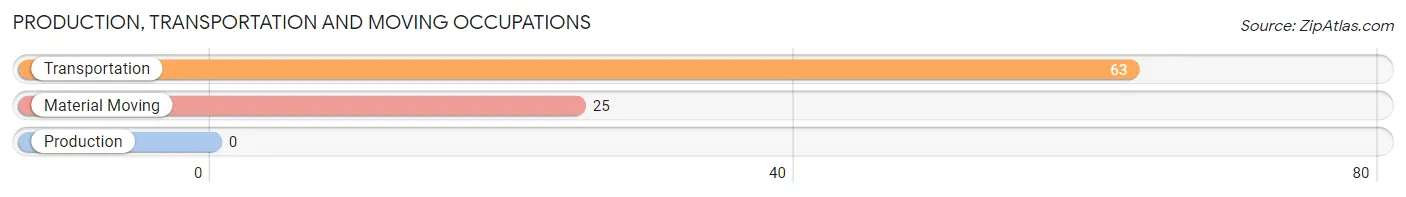
Production, Transportation and Moving Occupations
The most common Production, Transportation and Moving occupations in Raubsville are Transportation (63 | 10.7%), and Material Moving (25 | 4.2%).
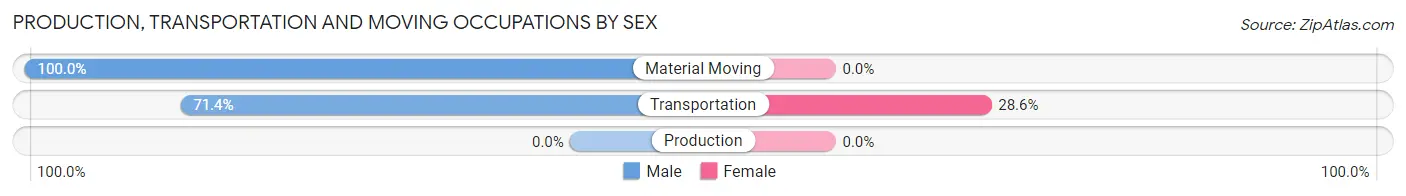
Production, Transportation and Moving Occupations by Sex
| Occupation | Male | Female |
| Production | 0 (0.0%) | 0 (0.0%) |
| Transportation | 45 (71.4%) | 18 (28.6%) |
| Material Moving | 25 (100.0%) | 0 (0.0%) |
| Total (Category) | 70 (79.5%) | 18 (20.4%) |
| Total (Overall) | 275 (46.5%) | 316 (53.5%) |
Employment Industries by Sex in Raubsville
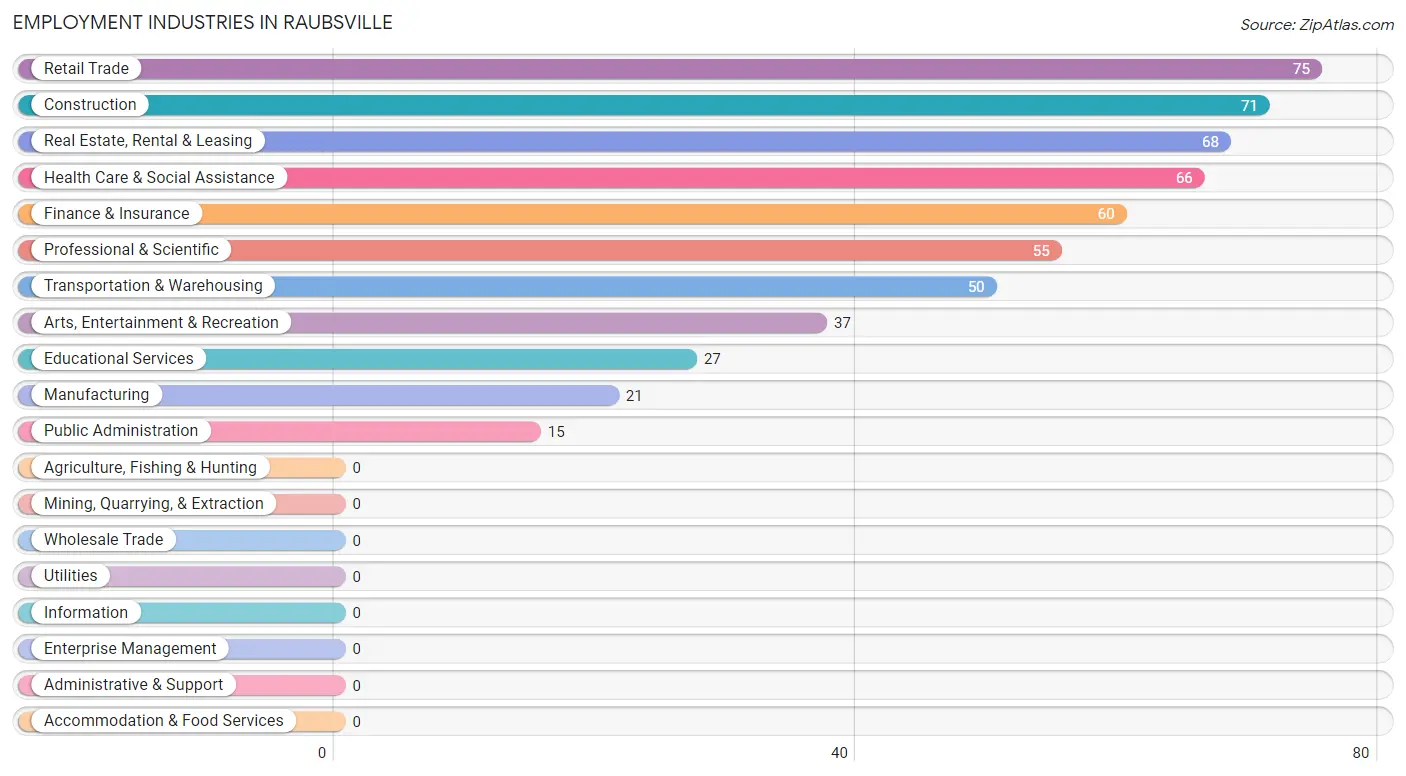
Employment Industries in Raubsville
The major employment industries in Raubsville include Retail Trade (75 | 12.7%), Construction (71 | 12.0%), Real Estate, Rental & Leasing (68 | 11.5%), Health Care & Social Assistance (66 | 11.2%), and Finance & Insurance (60 | 10.2%).
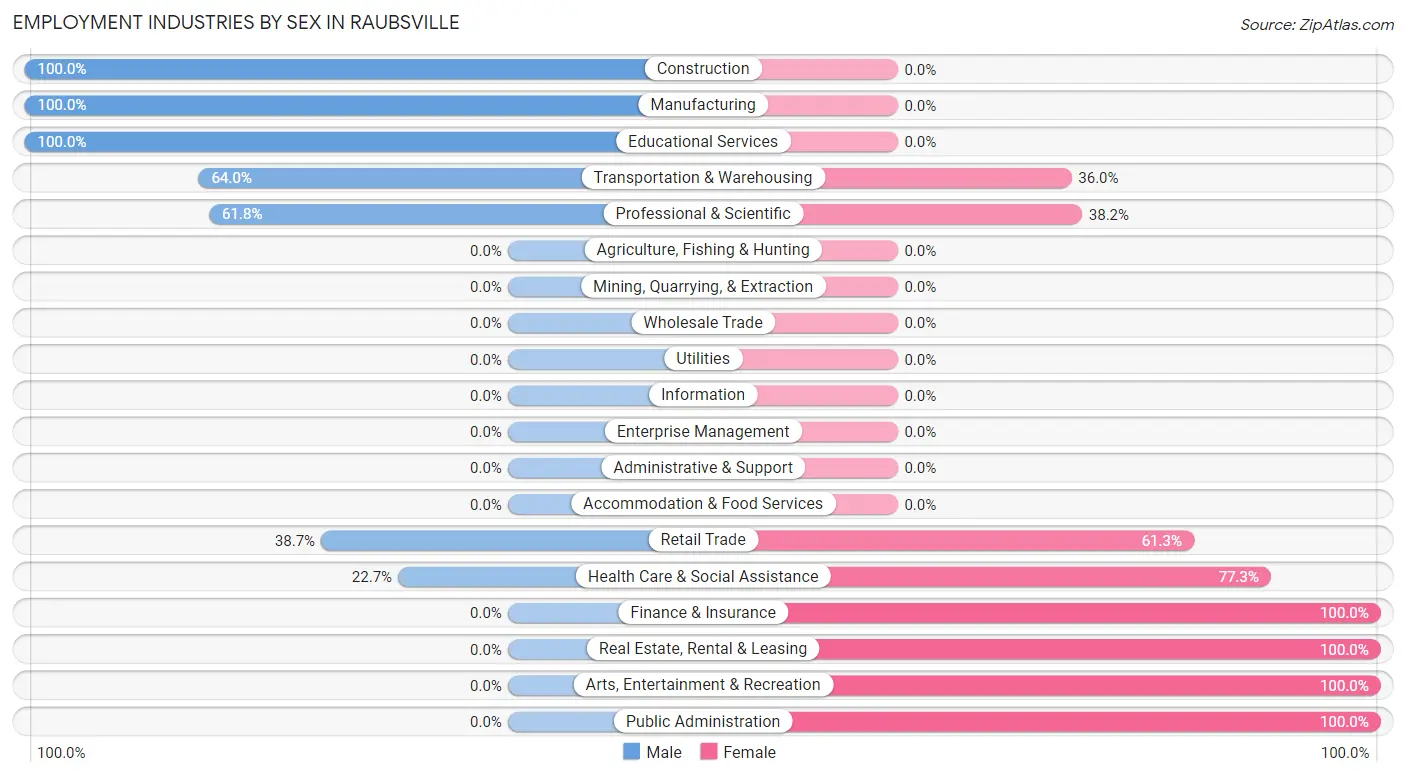
Employment Industries by Sex in Raubsville
The Raubsville industries that see more men than women are Construction (100.0%), Manufacturing (100.0%), and Educational Services (100.0%), whereas the industries that tend to have a higher number of women are Finance & Insurance (100.0%), Real Estate, Rental & Leasing (100.0%), and Arts, Entertainment & Recreation (100.0%).
| Industry | Male | Female |
| Agriculture, Fishing & Hunting | 0 (0.0%) | 0 (0.0%) |
| Mining, Quarrying, & Extraction | 0 (0.0%) | 0 (0.0%) |
| Construction | 71 (100.0%) | 0 (0.0%) |
| Manufacturing | 21 (100.0%) | 0 (0.0%) |
| Wholesale Trade | 0 (0.0%) | 0 (0.0%) |
| Retail Trade | 29 (38.7%) | 46 (61.3%) |
| Transportation & Warehousing | 32 (64.0%) | 18 (36.0%) |
| Utilities | 0 (0.0%) | 0 (0.0%) |
| Information | 0 (0.0%) | 0 (0.0%) |
| Finance & Insurance | 0 (0.0%) | 60 (100.0%) |
| Real Estate, Rental & Leasing | 0 (0.0%) | 68 (100.0%) |
| Professional & Scientific | 34 (61.8%) | 21 (38.2%) |
| Enterprise Management | 0 (0.0%) | 0 (0.0%) |
| Administrative & Support | 0 (0.0%) | 0 (0.0%) |
| Educational Services | 27 (100.0%) | 0 (0.0%) |
| Health Care & Social Assistance | 15 (22.7%) | 51 (77.3%) |
| Arts, Entertainment & Recreation | 0 (0.0%) | 37 (100.0%) |
| Accommodation & Food Services | 0 (0.0%) | 0 (0.0%) |
| Public Administration | 0 (0.0%) | 15 (100.0%) |
| Total | 275 (46.5%) | 316 (53.5%) |
Education in Raubsville
School Enrollment in Raubsville
The most common levels of schooling among the 444 students in Raubsville are high school (176 | 39.6%), middle school (138 | 31.1%), and college / undergraduate (117 | 26.4%).
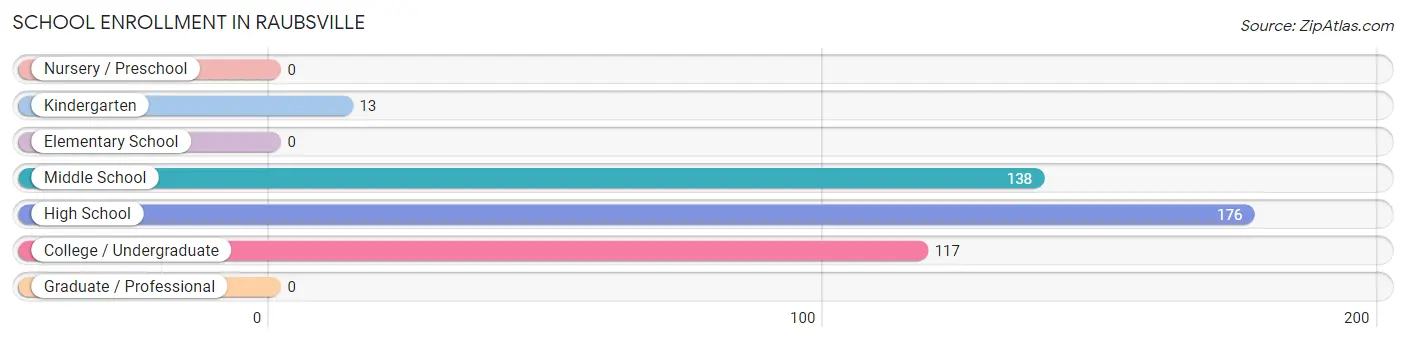
| School Level | # Students | % Students |
| Nursery / Preschool | 0 | 0.0% |
| Kindergarten | 13 | 2.9% |
| Elementary School | 0 | 0.0% |
| Middle School | 138 | 31.1% |
| High School | 176 | 39.6% |
| College / Undergraduate | 117 | 26.4% |
| Graduate / Professional | 0 | 0.0% |
| Total | 444 | 100.0% |
School Enrollment by Age by Funding Source in Raubsville
Out of a total of 444 students who are enrolled in schools in Raubsville, 84 (18.9%) attend a private institution, while the remaining 360 (81.1%) are enrolled in public schools. The age group of 5 to 9 year old has the highest likelihood of being enrolled in private schools, with 13 (100.0% in the age bracket) enrolled. Conversely, the age group of 10 to 14 year olds has the lowest likelihood of being enrolled in a private school, with 138 (100.0% in the age bracket) attending a public institution.
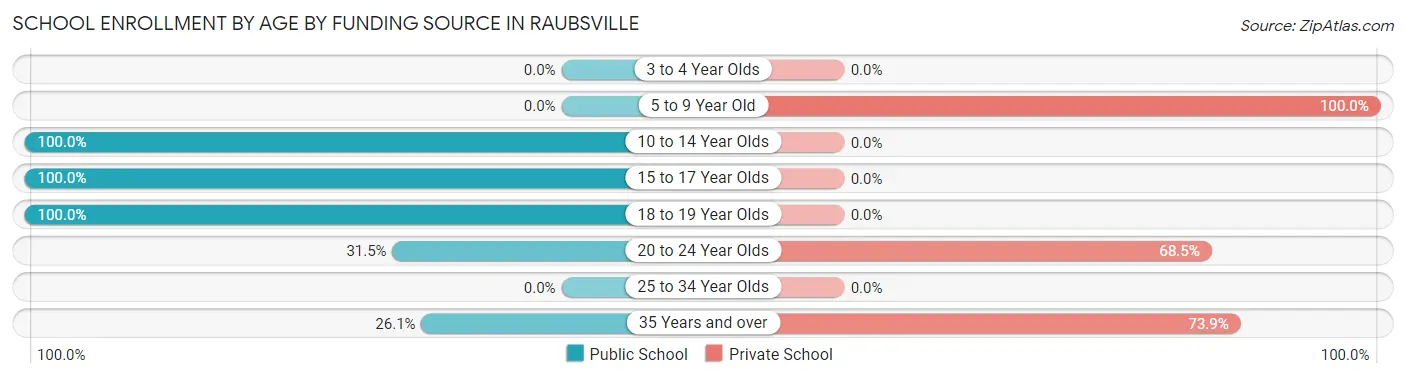
| Age Bracket | Public School | Private School |
| 3 to 4 Year Olds | 0 (0.0%) | 0 (0.0%) |
| 5 to 9 Year Old | 0 (0.0%) | 13 (100.0%) |
| 10 to 14 Year Olds | 138 (100.0%) | 0 (0.0%) |
| 15 to 17 Year Olds | 176 (100.0%) | 0 (0.0%) |
| 18 to 19 Year Olds | 17 (100.0%) | 0 (0.0%) |
| 20 to 24 Year Olds | 17 (31.5%) | 37 (68.5%) |
| 25 to 34 Year Olds | 0 (0.0%) | 0 (0.0%) |
| 35 Years and over | 12 (26.1%) | 34 (73.9%) |
| Total | 360 (81.1%) | 84 (18.9%) |
Educational Attainment by Field of Study in Raubsville
Business (148 | 44.6%), engineering (67 | 20.2%), arts & humanities (34 | 10.2%), science & technology (32 | 9.6%), and literature & languages (18 | 5.4%) are the most common fields of study among 332 individuals in Raubsville who have obtained a bachelor's degree or higher.
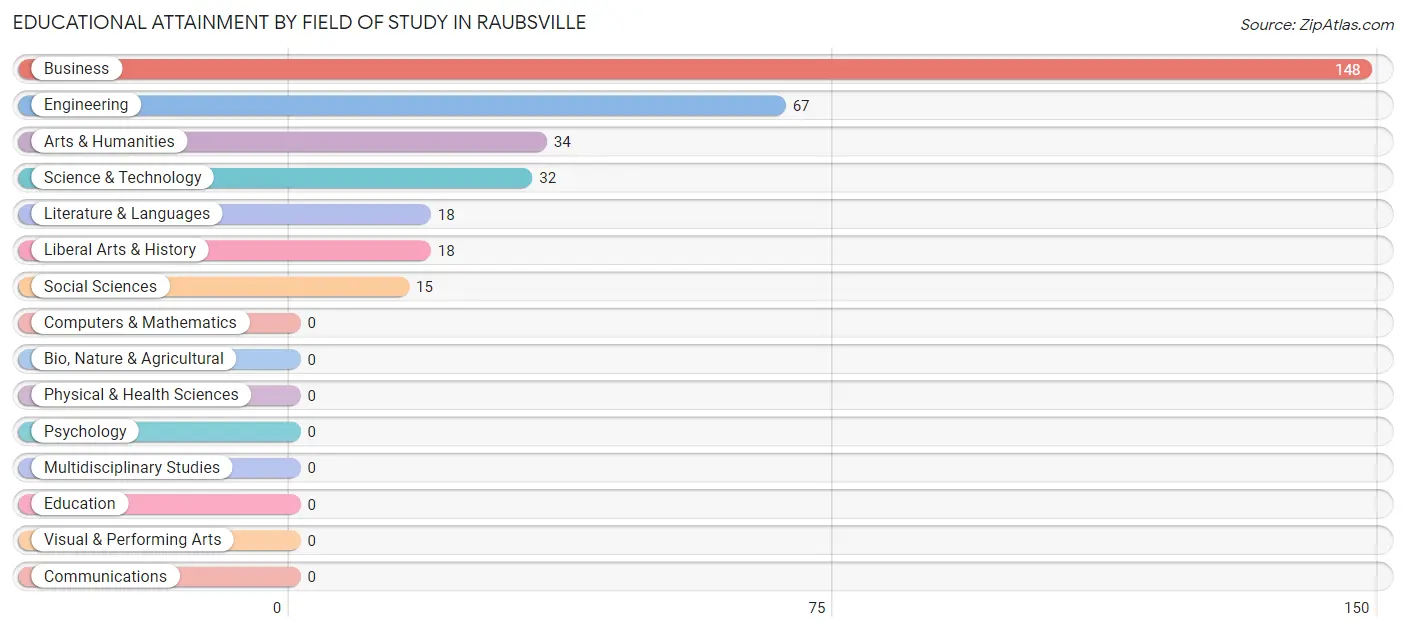
| Field of Study | # Graduates | % Graduates |
| Computers & Mathematics | 0 | 0.0% |
| Bio, Nature & Agricultural | 0 | 0.0% |
| Physical & Health Sciences | 0 | 0.0% |
| Psychology | 0 | 0.0% |
| Social Sciences | 15 | 4.5% |
| Engineering | 67 | 20.2% |
| Multidisciplinary Studies | 0 | 0.0% |
| Science & Technology | 32 | 9.6% |
| Business | 148 | 44.6% |
| Education | 0 | 0.0% |
| Literature & Languages | 18 | 5.4% |
| Liberal Arts & History | 18 | 5.4% |
| Visual & Performing Arts | 0 | 0.0% |
| Communications | 0 | 0.0% |
| Arts & Humanities | 34 | 10.2% |
| Total | 332 | 100.0% |
Transportation & Commute in Raubsville
Vehicle Availability by Sex in Raubsville
The most prevalent vehicle ownership categories in Raubsville are males with 4 vehicles (137, accounting for 49.8%) and females with 4 vehicles (77, making up 43.3%).
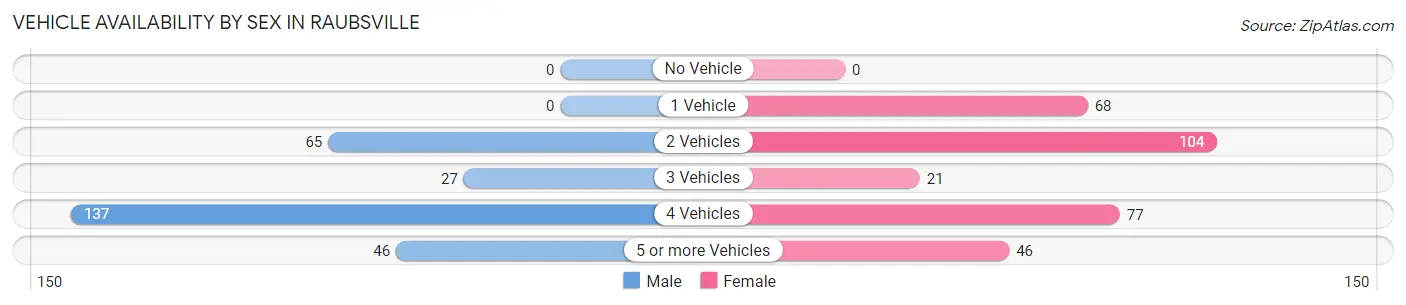
| Vehicles Available | Male | Female |
| No Vehicle | 0 (0.0%) | 0 (0.0%) |
| 1 Vehicle | 0 (0.0%) | 68 (21.5%) |
| 2 Vehicles | 65 (23.6%) | 104 (32.9%) |
| 3 Vehicles | 27 (9.8%) | 21 (6.7%) |
| 4 Vehicles | 137 (49.8%) | 77 (24.4%) |
| 5 or more Vehicles | 46 (16.7%) | 46 (14.6%) |
| Total | 275 (100.0%) | 316 (100.0%) |
Commute Time in Raubsville
The most frequently occuring commute durations in Raubsville are 90 or more minutes (126 commuters, 21.3%), 45 to 59 minutes (93 commuters, 15.7%), and 20 to 24 minutes (71 commuters, 12.0%).
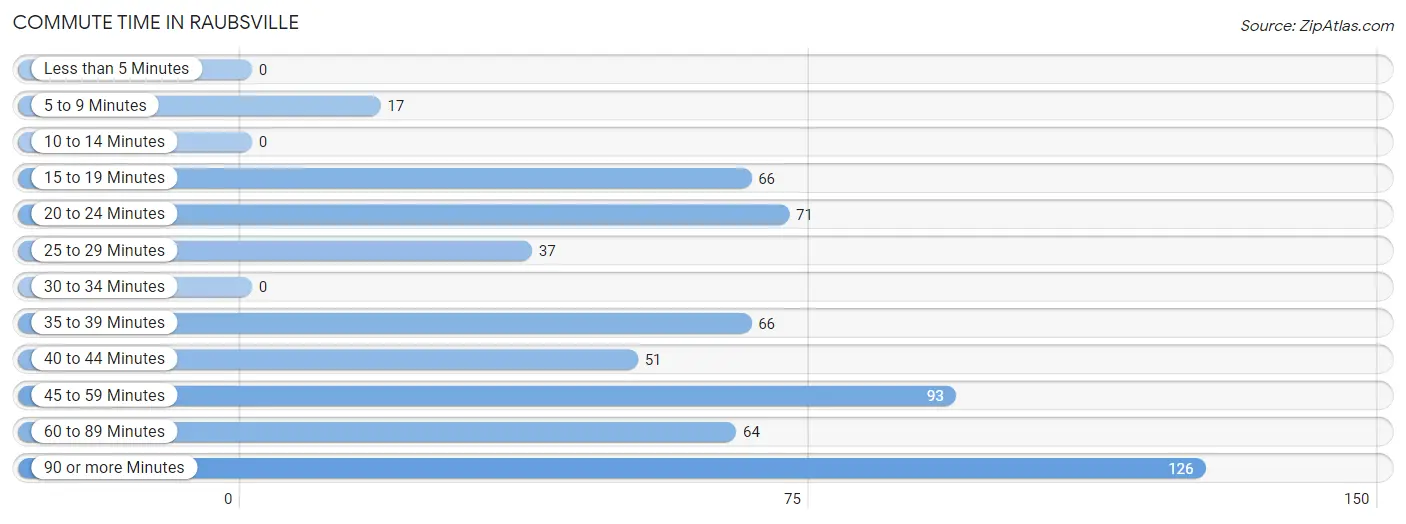
| Commute Time | # Commuters | % Commuters |
| Less than 5 Minutes | 0 | 0.0% |
| 5 to 9 Minutes | 17 | 2.9% |
| 10 to 14 Minutes | 0 | 0.0% |
| 15 to 19 Minutes | 66 | 11.2% |
| 20 to 24 Minutes | 71 | 12.0% |
| 25 to 29 Minutes | 37 | 6.3% |
| 30 to 34 Minutes | 0 | 0.0% |
| 35 to 39 Minutes | 66 | 11.2% |
| 40 to 44 Minutes | 51 | 8.6% |
| 45 to 59 Minutes | 93 | 15.7% |
| 60 to 89 Minutes | 64 | 10.8% |
| 90 or more Minutes | 126 | 21.3% |
Commute Time by Sex in Raubsville
The most common commute times in Raubsville are 45 to 59 minutes (67 commuters, 24.4%) for males and 90 or more minutes (60 commuters, 19.0%) for females.
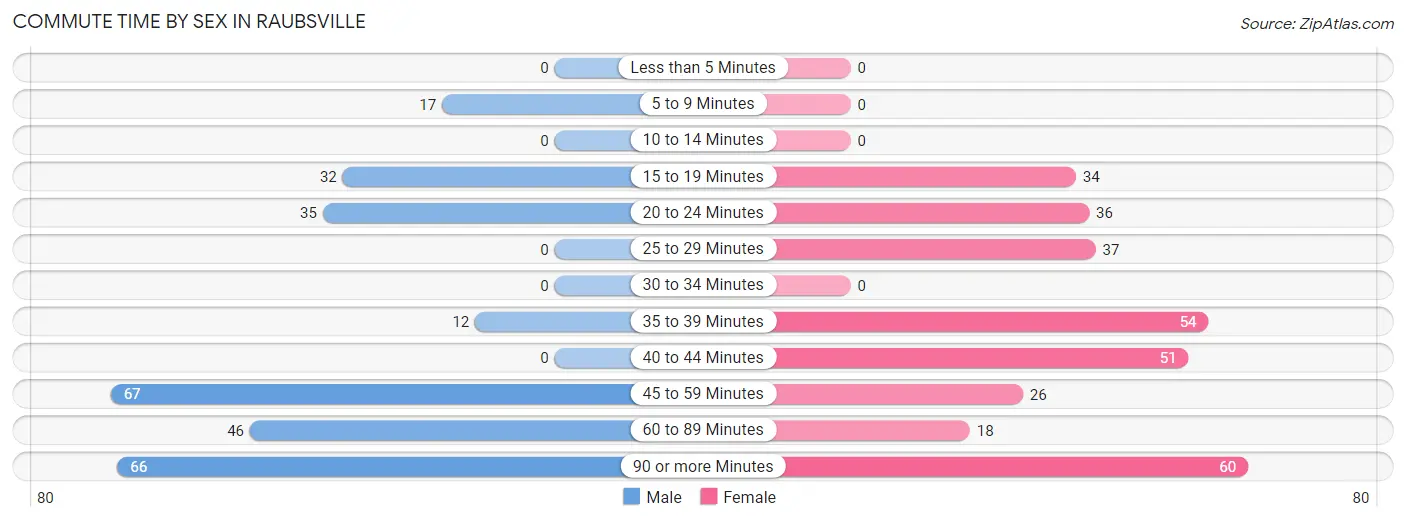
| Commute Time | Male | Female |
| Less than 5 Minutes | 0 (0.0%) | 0 (0.0%) |
| 5 to 9 Minutes | 17 (6.2%) | 0 (0.0%) |
| 10 to 14 Minutes | 0 (0.0%) | 0 (0.0%) |
| 15 to 19 Minutes | 32 (11.6%) | 34 (10.8%) |
| 20 to 24 Minutes | 35 (12.7%) | 36 (11.4%) |
| 25 to 29 Minutes | 0 (0.0%) | 37 (11.7%) |
| 30 to 34 Minutes | 0 (0.0%) | 0 (0.0%) |
| 35 to 39 Minutes | 12 (4.4%) | 54 (17.1%) |
| 40 to 44 Minutes | 0 (0.0%) | 51 (16.1%) |
| 45 to 59 Minutes | 67 (24.4%) | 26 (8.2%) |
| 60 to 89 Minutes | 46 (16.7%) | 18 (5.7%) |
| 90 or more Minutes | 66 (24.0%) | 60 (19.0%) |
Time of Departure to Work by Sex in Raubsville
The most frequent times of departure to work in Raubsville are 6:30 AM to 6:59 AM (105, 38.2%) for males and 4:00 PM to 11:59 PM (75, 23.7%) for females.
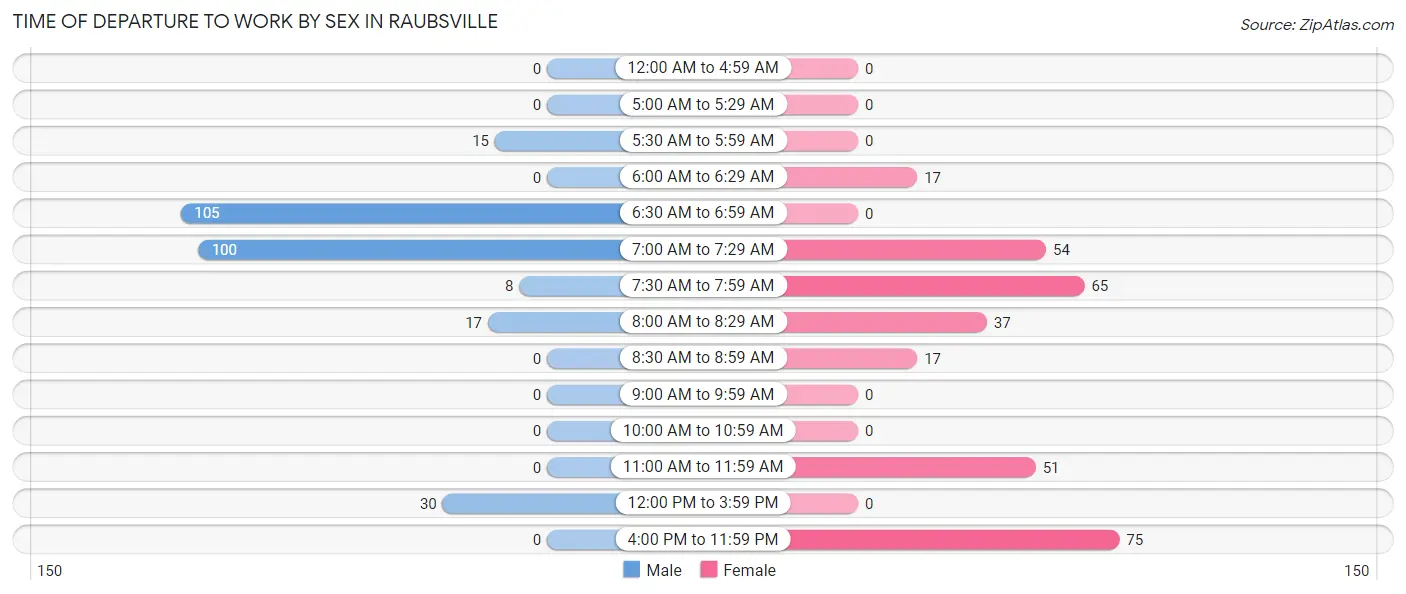
| Time of Departure | Male | Female |
| 12:00 AM to 4:59 AM | 0 (0.0%) | 0 (0.0%) |
| 5:00 AM to 5:29 AM | 0 (0.0%) | 0 (0.0%) |
| 5:30 AM to 5:59 AM | 15 (5.4%) | 0 (0.0%) |
| 6:00 AM to 6:29 AM | 0 (0.0%) | 17 (5.4%) |
| 6:30 AM to 6:59 AM | 105 (38.2%) | 0 (0.0%) |
| 7:00 AM to 7:29 AM | 100 (36.4%) | 54 (17.1%) |
| 7:30 AM to 7:59 AM | 8 (2.9%) | 65 (20.6%) |
| 8:00 AM to 8:29 AM | 17 (6.2%) | 37 (11.7%) |
| 8:30 AM to 8:59 AM | 0 (0.0%) | 17 (5.4%) |
| 9:00 AM to 9:59 AM | 0 (0.0%) | 0 (0.0%) |
| 10:00 AM to 10:59 AM | 0 (0.0%) | 0 (0.0%) |
| 11:00 AM to 11:59 AM | 0 (0.0%) | 51 (16.1%) |
| 12:00 PM to 3:59 PM | 30 (10.9%) | 0 (0.0%) |
| 4:00 PM to 11:59 PM | 0 (0.0%) | 75 (23.7%) |
| Total | 275 (100.0%) | 316 (100.0%) |
Housing Occupancy in Raubsville
Occupancy by Ownership in Raubsville
Of the total 427 dwellings in Raubsville, owner-occupied units account for 316 (74.0%), while renter-occupied units make up 111 (26.0%).
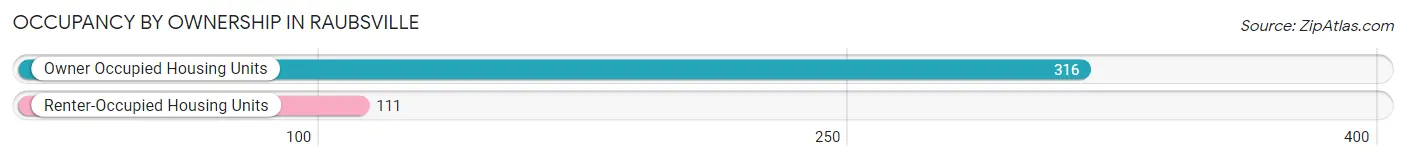
| Occupancy | # Housing Units | % Housing Units |
| Owner Occupied Housing Units | 316 | 74.0% |
| Renter-Occupied Housing Units | 111 | 26.0% |
| Total Occupied Housing Units | 427 | 100.0% |
Occupancy by Household Size in Raubsville
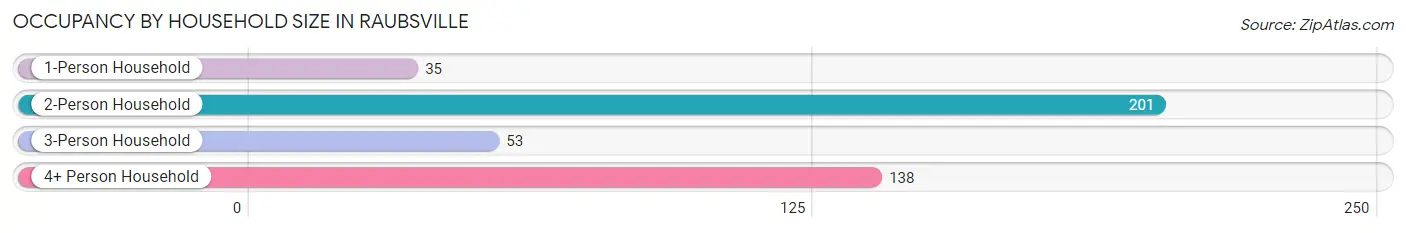
| Household Size | # Housing Units | % Housing Units |
| 1-Person Household | 35 | 8.2% |
| 2-Person Household | 201 | 47.1% |
| 3-Person Household | 53 | 12.4% |
| 4+ Person Household | 138 | 32.3% |
| Total Housing Units | 427 | 100.0% |
Occupancy by Ownership by Household Size in Raubsville
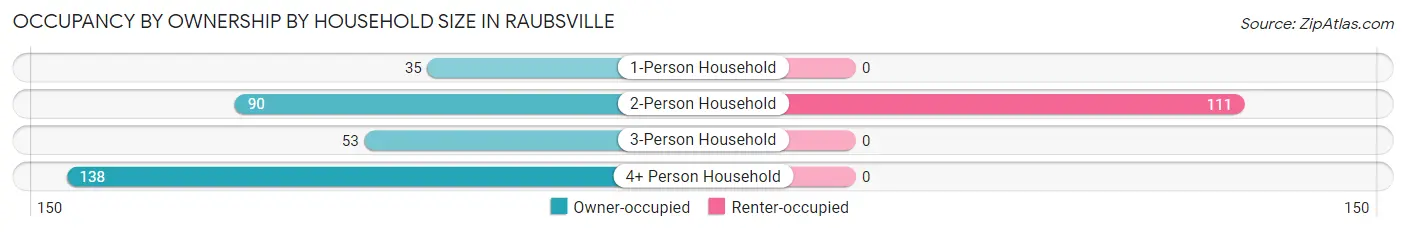
| Household Size | Owner-occupied | Renter-occupied |
| 1-Person Household | 35 (100.0%) | 0 (0.0%) |
| 2-Person Household | 90 (44.8%) | 111 (55.2%) |
| 3-Person Household | 53 (100.0%) | 0 (0.0%) |
| 4+ Person Household | 138 (100.0%) | 0 (0.0%) |
| Total Housing Units | 316 (74.0%) | 111 (26.0%) |
Occupancy by Educational Attainment in Raubsville
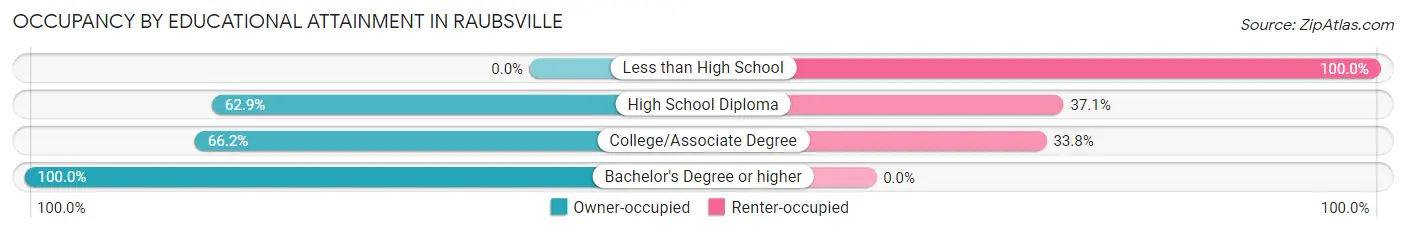
| Household Size | Owner-occupied | Renter-occupied |
| Less than High School | 0 (0.0%) | 20 (100.0%) |
| High School Diploma | 110 (62.9%) | 65 (37.1%) |
| College/Associate Degree | 51 (66.2%) | 26 (33.8%) |
| Bachelor's Degree or higher | 155 (100.0%) | 0 (0.0%) |
Occupancy by Age of Householder in Raubsville
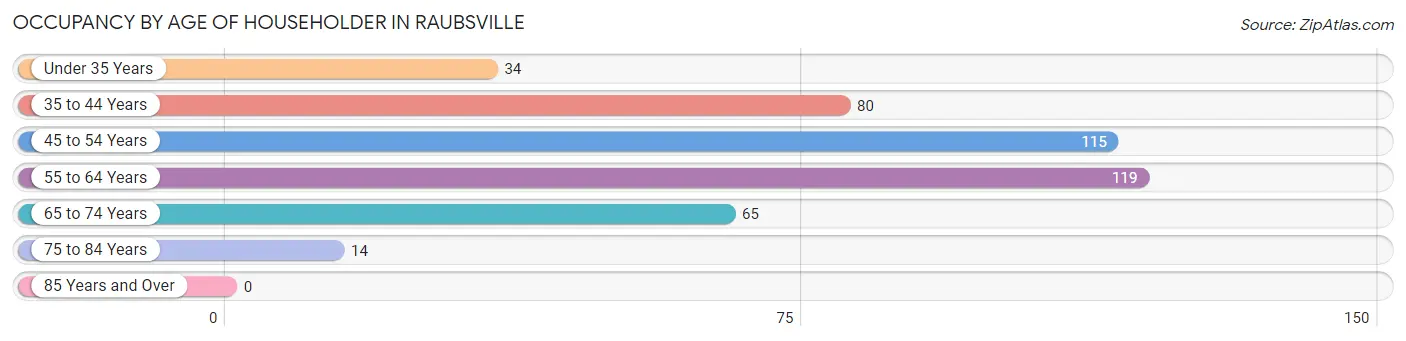
| Age Bracket | # Households | % Households |
| Under 35 Years | 34 | 8.0% |
| 35 to 44 Years | 80 | 18.7% |
| 45 to 54 Years | 115 | 26.9% |
| 55 to 64 Years | 119 | 27.9% |
| 65 to 74 Years | 65 | 15.2% |
| 75 to 84 Years | 14 | 3.3% |
| 85 Years and Over | 0 | 0.0% |
| Total | 427 | 100.0% |
Housing Finances in Raubsville
Median Income by Occupancy in Raubsville
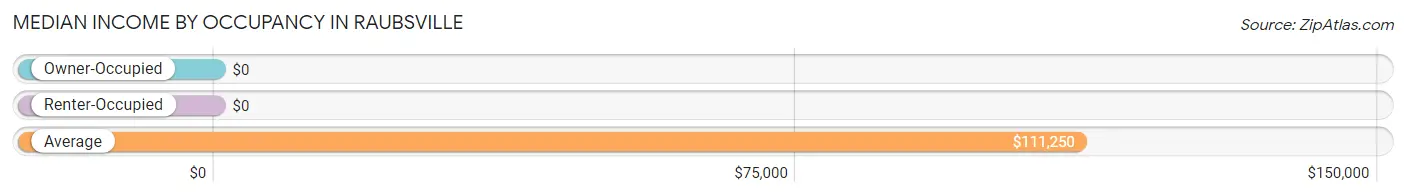
| Occupancy Type | # Households | Median Income |
| Owner-Occupied | 316 (74.0%) | $0 |
| Renter-Occupied | 111 (26.0%) | $0 |
| Average | 427 (100.0%) | $111,250 |
Occupancy by Householder Income Bracket in Raubsville
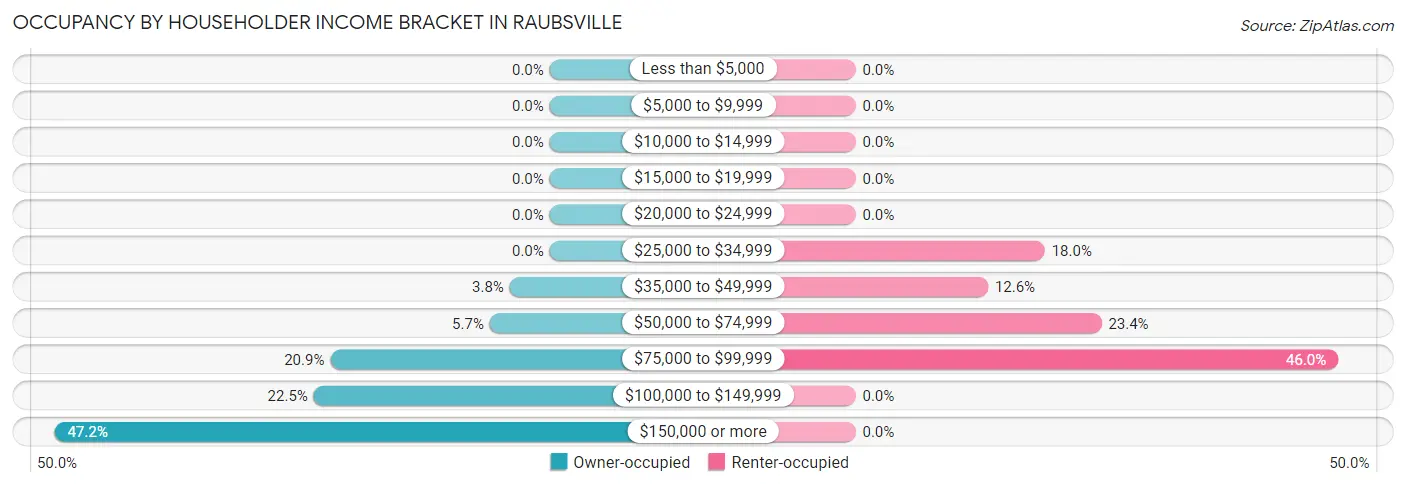
| Income Bracket | Owner-occupied | Renter-occupied |
| Less than $5,000 | 0 (0.0%) | 0 (0.0%) |
| $5,000 to $9,999 | 0 (0.0%) | 0 (0.0%) |
| $10,000 to $14,999 | 0 (0.0%) | 0 (0.0%) |
| $15,000 to $19,999 | 0 (0.0%) | 0 (0.0%) |
| $20,000 to $24,999 | 0 (0.0%) | 0 (0.0%) |
| $25,000 to $34,999 | 0 (0.0%) | 20 (18.0%) |
| $35,000 to $49,999 | 12 (3.8%) | 14 (12.6%) |
| $50,000 to $74,999 | 18 (5.7%) | 26 (23.4%) |
| $75,000 to $99,999 | 66 (20.9%) | 51 (46.0%) |
| $100,000 to $149,999 | 71 (22.5%) | 0 (0.0%) |
| $150,000 or more | 149 (47.1%) | 0 (0.0%) |
| Total | 316 (100.0%) | 111 (100.0%) |
Monthly Housing Cost Tiers in Raubsville
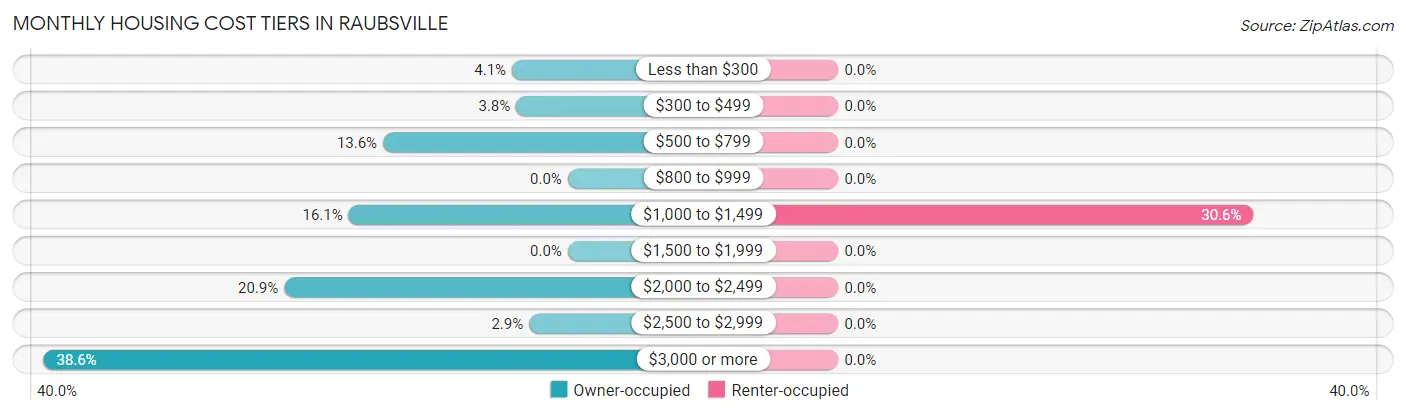
| Monthly Cost | Owner-occupied | Renter-occupied |
| Less than $300 | 13 (4.1%) | 0 (0.0%) |
| $300 to $499 | 12 (3.8%) | 0 (0.0%) |
| $500 to $799 | 43 (13.6%) | 0 (0.0%) |
| $800 to $999 | 0 (0.0%) | 0 (0.0%) |
| $1,000 to $1,499 | 51 (16.1%) | 34 (30.6%) |
| $1,500 to $1,999 | 0 (0.0%) | 0 (0.0%) |
| $2,000 to $2,499 | 66 (20.9%) | 0 (0.0%) |
| $2,500 to $2,999 | 9 (2.9%) | 0 (0.0%) |
| $3,000 or more | 122 (38.6%) | 0 (0.0%) |
| Total | 316 (100.0%) | 111 (100.0%) |
Physical Housing Characteristics in Raubsville
Housing Structures in Raubsville
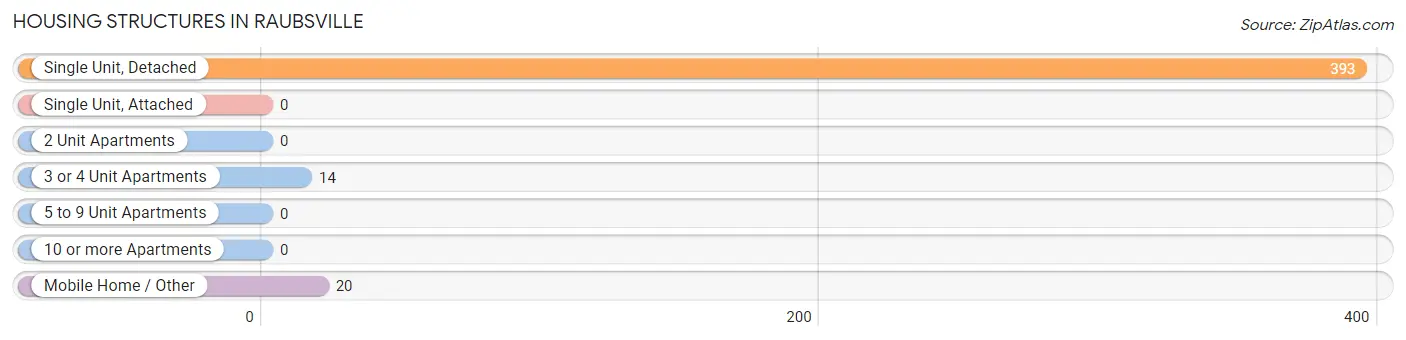
| Structure Type | # Housing Units | % Housing Units |
| Single Unit, Detached | 393 | 92.0% |
| Single Unit, Attached | 0 | 0.0% |
| 2 Unit Apartments | 0 | 0.0% |
| 3 or 4 Unit Apartments | 14 | 3.3% |
| 5 to 9 Unit Apartments | 0 | 0.0% |
| 10 or more Apartments | 0 | 0.0% |
| Mobile Home / Other | 20 | 4.7% |
| Total | 427 | 100.0% |
Housing Structures by Occupancy in Raubsville
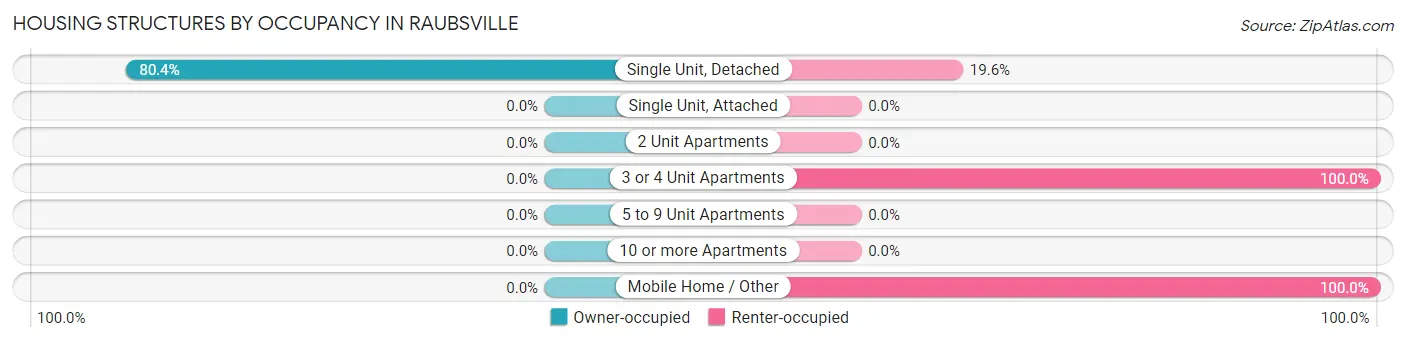
| Structure Type | Owner-occupied | Renter-occupied |
| Single Unit, Detached | 316 (80.4%) | 77 (19.6%) |
| Single Unit, Attached | 0 (0.0%) | 0 (0.0%) |
| 2 Unit Apartments | 0 (0.0%) | 0 (0.0%) |
| 3 or 4 Unit Apartments | 0 (0.0%) | 14 (100.0%) |
| 5 to 9 Unit Apartments | 0 (0.0%) | 0 (0.0%) |
| 10 or more Apartments | 0 (0.0%) | 0 (0.0%) |
| Mobile Home / Other | 0 (0.0%) | 20 (100.0%) |
| Total | 316 (74.0%) | 111 (26.0%) |
Housing Structures by Number of Rooms in Raubsville
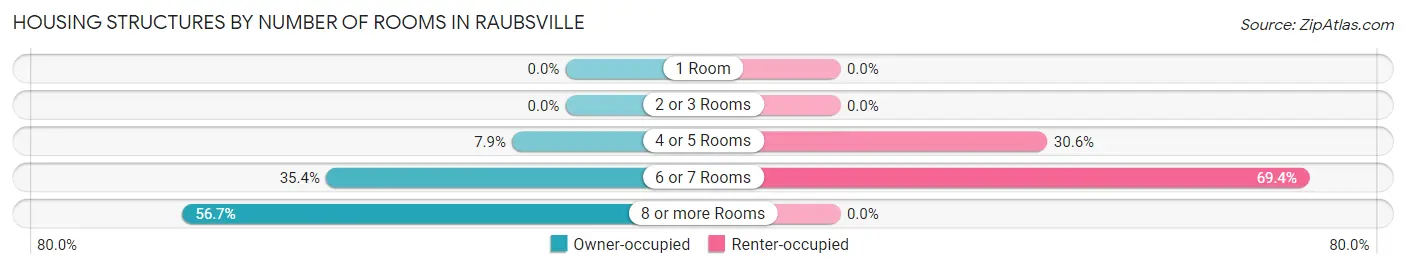
| Number of Rooms | Owner-occupied | Renter-occupied |
| 1 Room | 0 (0.0%) | 0 (0.0%) |
| 2 or 3 Rooms | 0 (0.0%) | 0 (0.0%) |
| 4 or 5 Rooms | 25 (7.9%) | 34 (30.6%) |
| 6 or 7 Rooms | 112 (35.4%) | 77 (69.4%) |
| 8 or more Rooms | 179 (56.7%) | 0 (0.0%) |
| Total | 316 (100.0%) | 111 (100.0%) |
Housing Structure by Heating Type in Raubsville
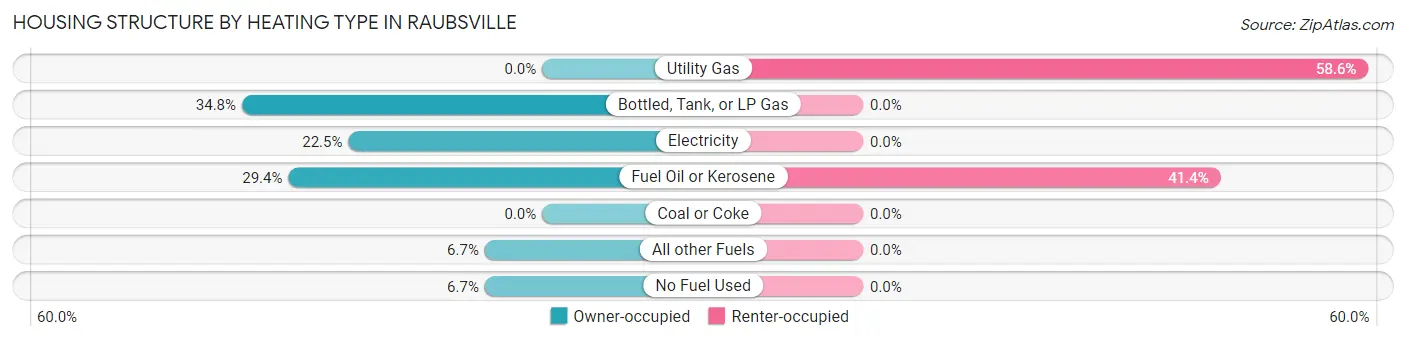
| Heating Type | Owner-occupied | Renter-occupied |
| Utility Gas | 0 (0.0%) | 65 (58.6%) |
| Bottled, Tank, or LP Gas | 110 (34.8%) | 0 (0.0%) |
| Electricity | 71 (22.5%) | 0 (0.0%) |
| Fuel Oil or Kerosene | 93 (29.4%) | 46 (41.4%) |
| Coal or Coke | 0 (0.0%) | 0 (0.0%) |
| All other Fuels | 21 (6.7%) | 0 (0.0%) |
| No Fuel Used | 21 (6.7%) | 0 (0.0%) |
| Total | 316 (100.0%) | 111 (100.0%) |
Household Vehicle Usage in Raubsville
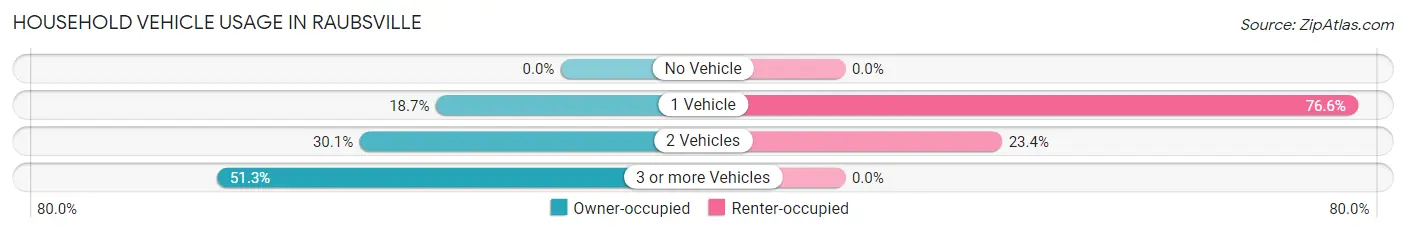
| Vehicles per Household | Owner-occupied | Renter-occupied |
| No Vehicle | 0 (0.0%) | 0 (0.0%) |
| 1 Vehicle | 59 (18.7%) | 85 (76.6%) |
| 2 Vehicles | 95 (30.1%) | 26 (23.4%) |
| 3 or more Vehicles | 162 (51.3%) | 0 (0.0%) |
| Total | 316 (100.0%) | 111 (100.0%) |
Real Estate & Mortgages in Raubsville
Real Estate and Mortgage Overview in Raubsville
| Characteristic | Without Mortgage | With Mortgage |
| Housing Units | 68 | 248 |
| Median Property Value | $348,900 | $514,200 |
| Median Household Income | $111,154 | $134 |
| Monthly Housing Costs | $721 | $122 |
| Real Estate Taxes | - | - |
Property Value by Mortgage Status in Raubsville
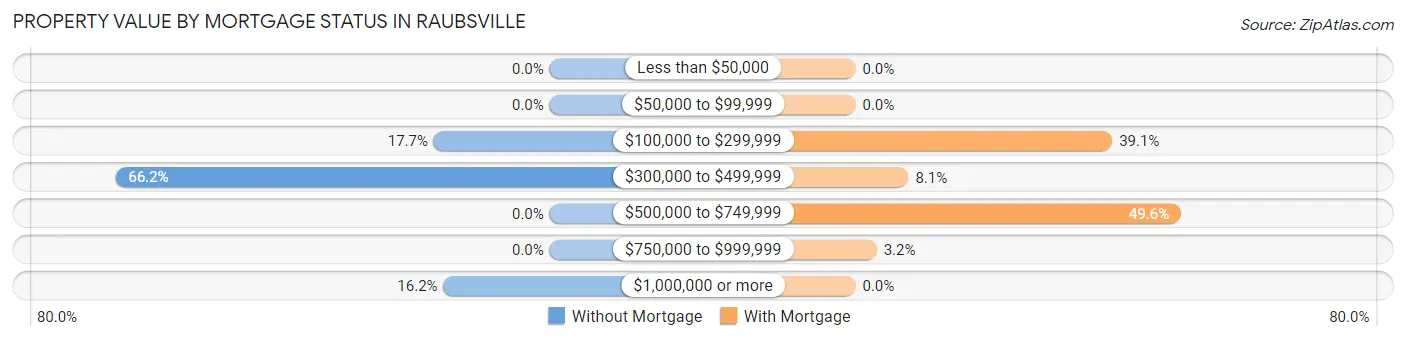
| Property Value | Without Mortgage | With Mortgage |
| Less than $50,000 | 0 (0.0%) | 0 (0.0%) |
| $50,000 to $99,999 | 0 (0.0%) | 0 (0.0%) |
| $100,000 to $299,999 | 12 (17.6%) | 97 (39.1%) |
| $300,000 to $499,999 | 45 (66.2%) | 20 (8.1%) |
| $500,000 to $749,999 | 0 (0.0%) | 123 (49.6%) |
| $750,000 to $999,999 | 0 (0.0%) | 8 (3.2%) |
| $1,000,000 or more | 11 (16.2%) | 0 (0.0%) |
| Total | 68 (100.0%) | 248 (100.0%) |
Household Income by Mortgage Status in Raubsville
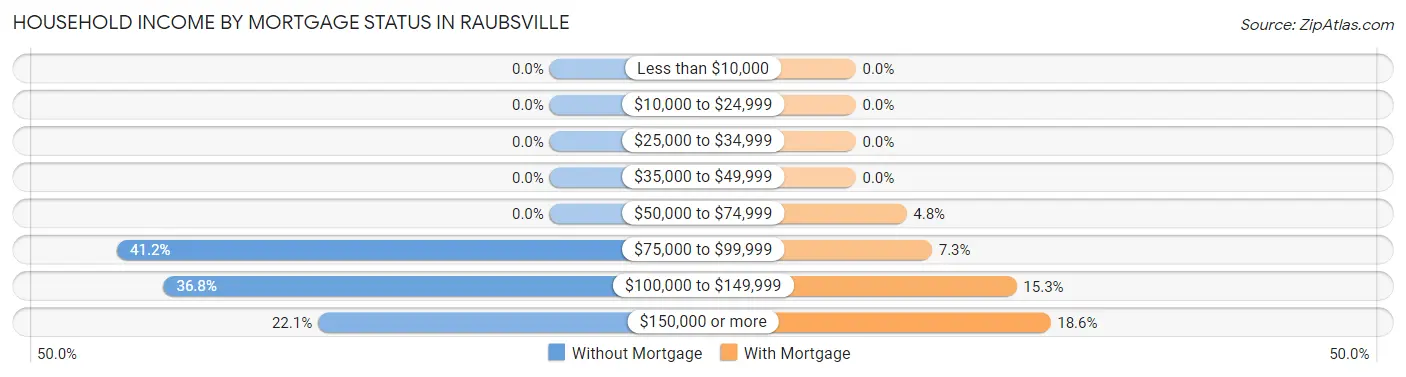
| Household Income | Without Mortgage | With Mortgage |
| Less than $10,000 | 0 (0.0%) | 0 (0.0%) |
| $10,000 to $24,999 | 0 (0.0%) | 0 (0.0%) |
| $25,000 to $34,999 | 0 (0.0%) | 0 (0.0%) |
| $35,000 to $49,999 | 0 (0.0%) | 0 (0.0%) |
| $50,000 to $74,999 | 0 (0.0%) | 12 (4.8%) |
| $75,000 to $99,999 | 28 (41.2%) | 18 (7.3%) |
| $100,000 to $149,999 | 25 (36.8%) | 38 (15.3%) |
| $150,000 or more | 15 (22.1%) | 46 (18.5%) |
| Total | 68 (100.0%) | 248 (100.0%) |
Property Value to Household Income Ratio in Raubsville
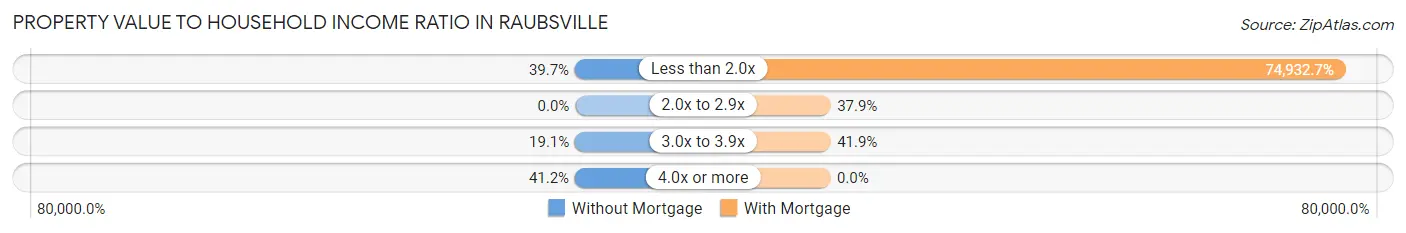
| Value-to-Income Ratio | Without Mortgage | With Mortgage |
| Less than 2.0x | 27 (39.7%) | 185,833 (74,932.7%) |
| 2.0x to 2.9x | 0 (0.0%) | 94 (37.9%) |
| 3.0x to 3.9x | 13 (19.1%) | 104 (41.9%) |
| 4.0x or more | 28 (41.2%) | 0 (0.0%) |
| Total | 68 (100.0%) | 248 (100.0%) |
Real Estate Taxes by Mortgage Status in Raubsville
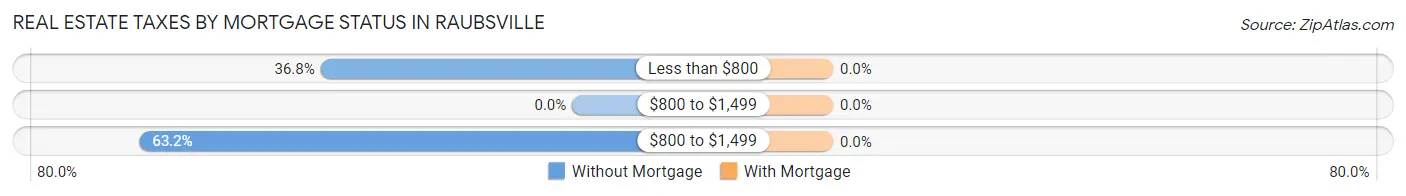
| Property Taxes | Without Mortgage | With Mortgage |
| Less than $800 | 25 (36.8%) | 0 (0.0%) |
| $800 to $1,499 | 0 (0.0%) | 0 (0.0%) |
| $800 to $1,499 | 43 (63.2%) | 0 (0.0%) |
| Total | 68 (100.0%) | 248 (100.0%) |
Health & Disability in Raubsville
Health Insurance Coverage by Age in Raubsville
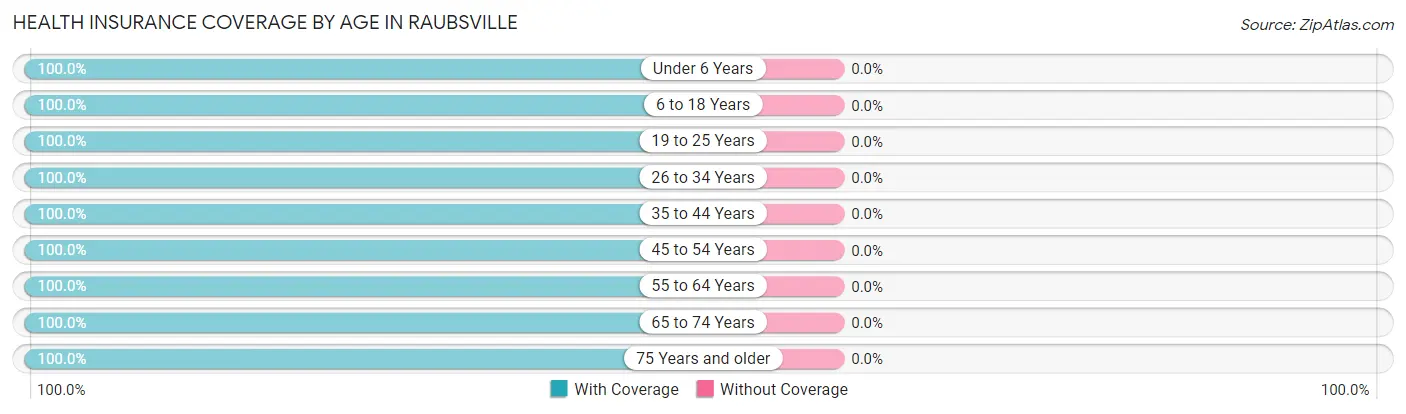
| Age Bracket | With Coverage | Without Coverage |
| Under 6 Years | 89 (100.0%) | 0 (0.0%) |
| 6 to 18 Years | 377 (100.0%) | 0 (0.0%) |
| 19 to 25 Years | 54 (100.0%) | 0 (0.0%) |
| 26 to 34 Years | 34 (100.0%) | 0 (0.0%) |
| 35 to 44 Years | 140 (100.0%) | 0 (0.0%) |
| 45 to 54 Years | 244 (100.0%) | 0 (0.0%) |
| 55 to 64 Years | 243 (100.0%) | 0 (0.0%) |
| 65 to 74 Years | 129 (100.0%) | 0 (0.0%) |
| 75 Years and older | 39 (100.0%) | 0 (0.0%) |
| Total | 1,349 (100.0%) | 0 (0.0%) |
Health Insurance Coverage by Citizenship Status in Raubsville
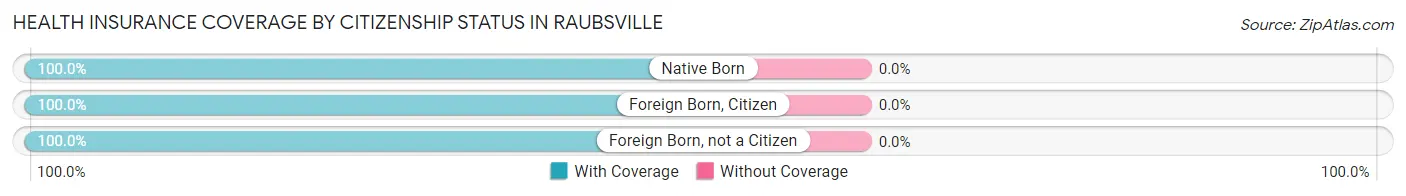
| Citizenship Status | With Coverage | Without Coverage |
| Native Born | 89 (100.0%) | 0 (0.0%) |
| Foreign Born, Citizen | 377 (100.0%) | 0 (0.0%) |
| Foreign Born, not a Citizen | 54 (100.0%) | 0 (0.0%) |
Health Insurance Coverage by Household Income in Raubsville
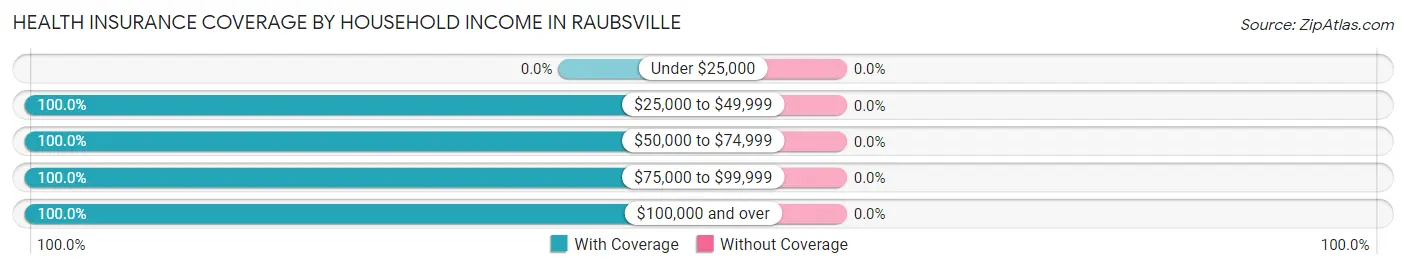
| Household Income | With Coverage | Without Coverage |
| Under $25,000 | 0 (0.0%) | 0 (0.0%) |
| $25,000 to $49,999 | 90 (100.0%) | 0 (0.0%) |
| $50,000 to $74,999 | 81 (100.0%) | 0 (0.0%) |
| $75,000 to $99,999 | 259 (100.0%) | 0 (0.0%) |
| $100,000 and over | 919 (100.0%) | 0 (0.0%) |
Public vs Private Health Insurance Coverage by Age in Raubsville
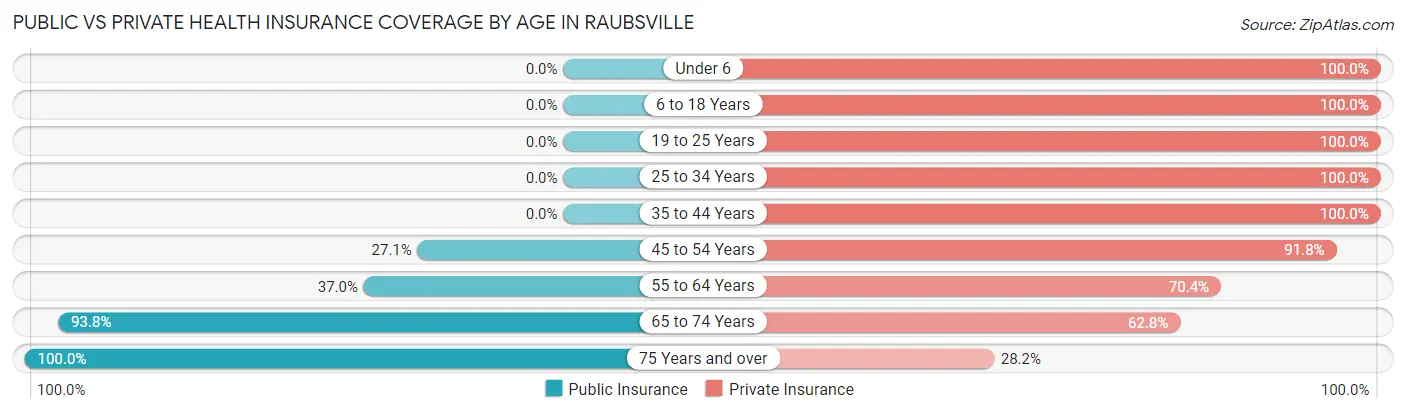
| Age Bracket | Public Insurance | Private Insurance |
| Under 6 | 0 (0.0%) | 89 (100.0%) |
| 6 to 18 Years | 0 (0.0%) | 377 (100.0%) |
| 19 to 25 Years | 0 (0.0%) | 54 (100.0%) |
| 25 to 34 Years | 0 (0.0%) | 34 (100.0%) |
| 35 to 44 Years | 0 (0.0%) | 140 (100.0%) |
| 45 to 54 Years | 66 (27.1%) | 224 (91.8%) |
| 55 to 64 Years | 90 (37.0%) | 171 (70.4%) |
| 65 to 74 Years | 121 (93.8%) | 81 (62.8%) |
| 75 Years and over | 39 (100.0%) | 11 (28.2%) |
| Total | 316 (23.4%) | 1,181 (87.5%) |
Disability Status by Sex by Age in Raubsville
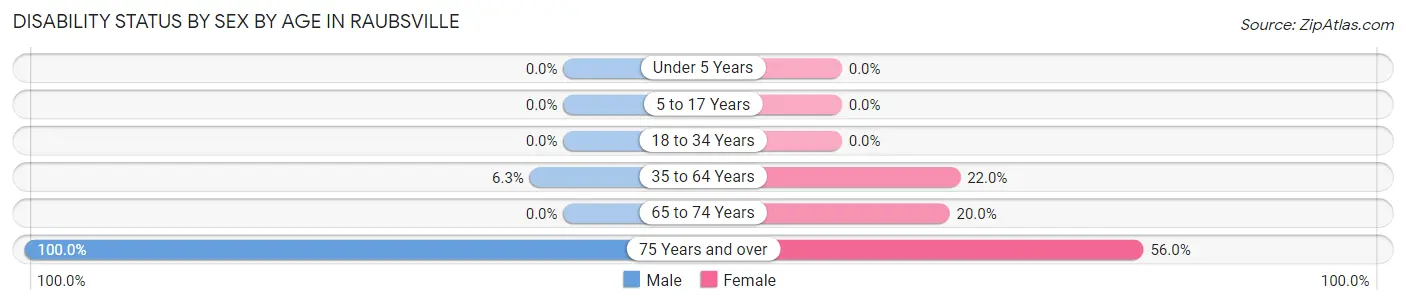
| Age Bracket | Male | Female |
| Under 5 Years | 0 (0.0%) | 0 (0.0%) |
| 5 to 17 Years | 0 (0.0%) | 0 (0.0%) |
| 18 to 34 Years | 0 (0.0%) | 0 (0.0%) |
| 35 to 64 Years | 19 (6.2%) | 71 (22.0%) |
| 65 to 74 Years | 0 (0.0%) | 13 (20.0%) |
| 75 Years and over | 14 (100.0%) | 14 (56.0%) |
Disability Class by Sex by Age in Raubsville
Disability Class: Hearing Difficulty
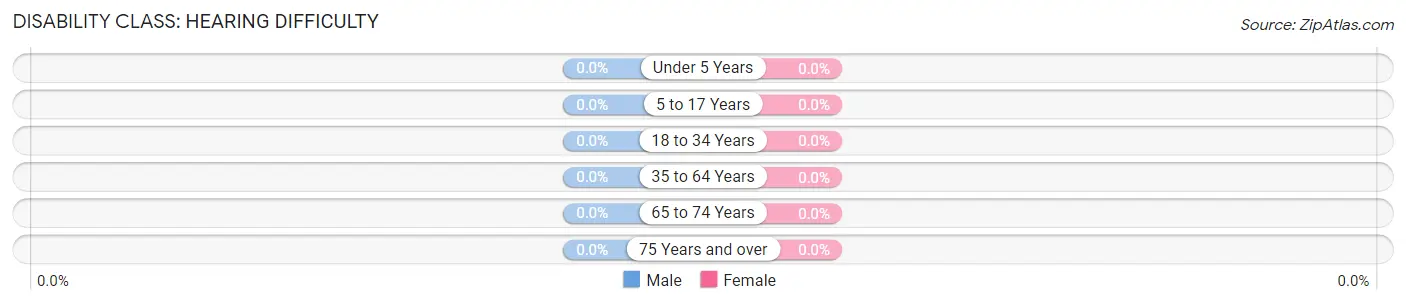
| Age Bracket | Male | Female |
| Under 5 Years | 0 (0.0%) | 0 (0.0%) |
| 5 to 17 Years | 0 (0.0%) | 0 (0.0%) |
| 18 to 34 Years | 0 (0.0%) | 0 (0.0%) |
| 35 to 64 Years | 0 (0.0%) | 0 (0.0%) |
| 65 to 74 Years | 0 (0.0%) | 0 (0.0%) |
| 75 Years and over | 0 (0.0%) | 0 (0.0%) |
Disability Class: Vision Difficulty
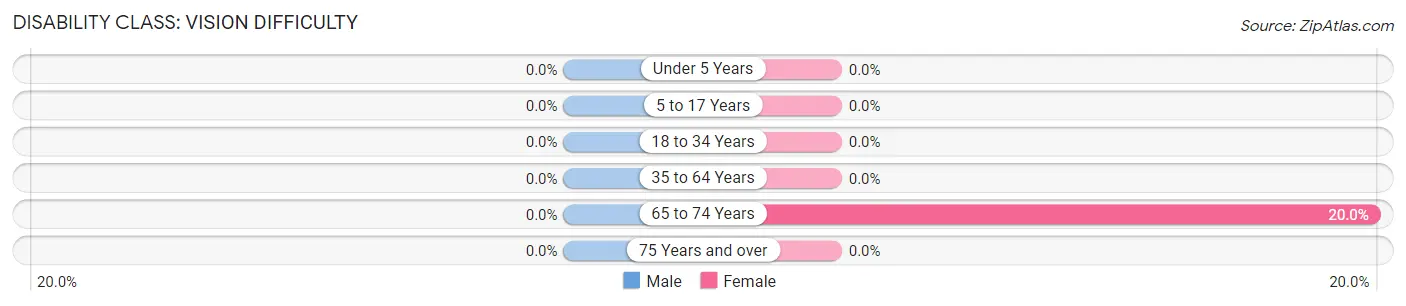
| Age Bracket | Male | Female |
| Under 5 Years | 0 (0.0%) | 0 (0.0%) |
| 5 to 17 Years | 0 (0.0%) | 0 (0.0%) |
| 18 to 34 Years | 0 (0.0%) | 0 (0.0%) |
| 35 to 64 Years | 0 (0.0%) | 0 (0.0%) |
| 65 to 74 Years | 0 (0.0%) | 13 (20.0%) |
| 75 Years and over | 0 (0.0%) | 0 (0.0%) |
Disability Class: Cognitive Difficulty
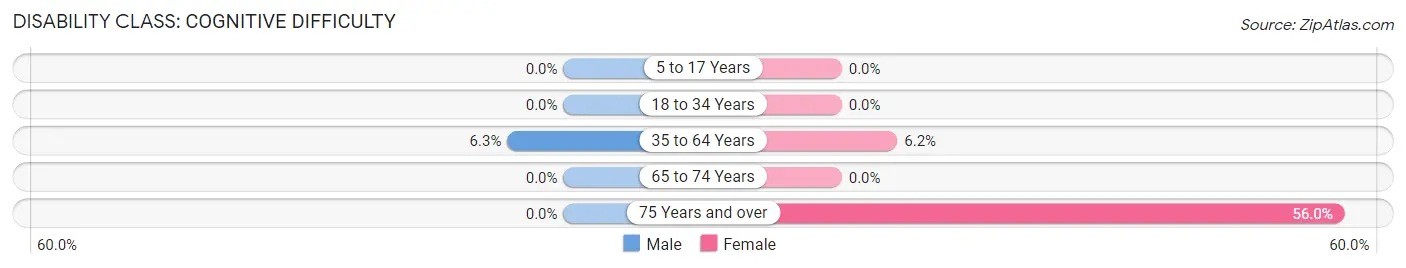
| Age Bracket | Male | Female |
| 5 to 17 Years | 0 (0.0%) | 0 (0.0%) |
| 18 to 34 Years | 0 (0.0%) | 0 (0.0%) |
| 35 to 64 Years | 19 (6.2%) | 20 (6.2%) |
| 65 to 74 Years | 0 (0.0%) | 0 (0.0%) |
| 75 Years and over | 0 (0.0%) | 14 (56.0%) |
Disability Class: Ambulatory Difficulty
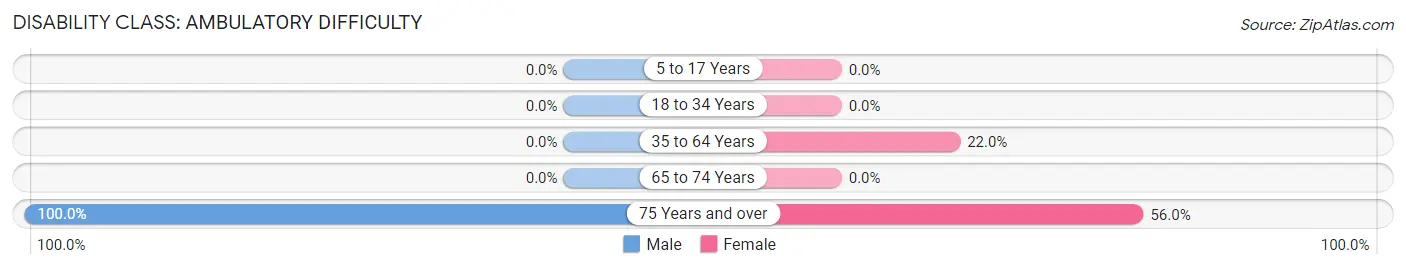
| Age Bracket | Male | Female |
| 5 to 17 Years | 0 (0.0%) | 0 (0.0%) |
| 18 to 34 Years | 0 (0.0%) | 0 (0.0%) |
| 35 to 64 Years | 0 (0.0%) | 71 (22.0%) |
| 65 to 74 Years | 0 (0.0%) | 0 (0.0%) |
| 75 Years and over | 14 (100.0%) | 14 (56.0%) |
Disability Class: Self-Care Difficulty
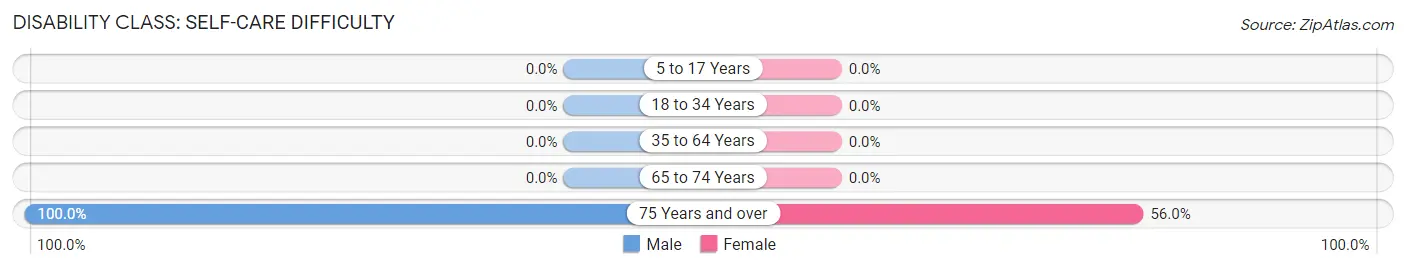
| Age Bracket | Male | Female |
| 5 to 17 Years | 0 (0.0%) | 0 (0.0%) |
| 18 to 34 Years | 0 (0.0%) | 0 (0.0%) |
| 35 to 64 Years | 0 (0.0%) | 0 (0.0%) |
| 65 to 74 Years | 0 (0.0%) | 0 (0.0%) |
| 75 Years and over | 14 (100.0%) | 14 (56.0%) |
Technology Access in Raubsville
Computing Device Access in Raubsville
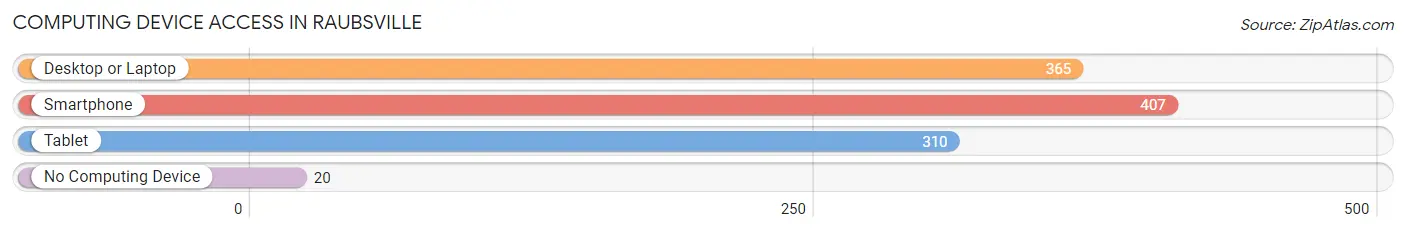
| Device Type | # Households | % Households |
| Desktop or Laptop | 365 | 85.5% |
| Smartphone | 407 | 95.3% |
| Tablet | 310 | 72.6% |
| No Computing Device | 20 | 4.7% |
| Total | 427 | 100.0% |
Internet Access in Raubsville
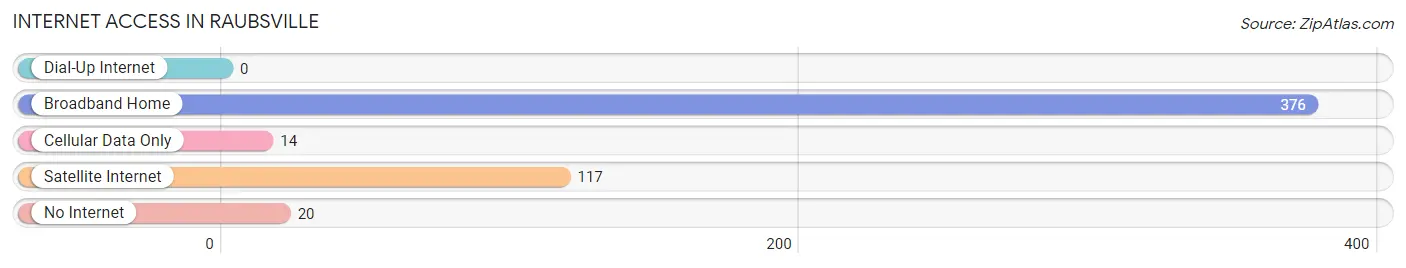
| Internet Type | # Households | % Households |
| Dial-Up Internet | 0 | 0.0% |
| Broadband Home | 376 | 88.1% |
| Cellular Data Only | 14 | 3.3% |
| Satellite Internet | 117 | 27.4% |
| No Internet | 20 | 4.7% |
| Total | 427 | 100.0% |
Raubsville Summary
Raubsville, Pennsylvania is a small borough located in Northampton County, Pennsylvania. It is situated in the Lehigh Valley region of the state, approximately 10 miles north of Easton and about 20 miles west of Allentown. The population of Raubsville was 1,845 at the 2010 census.
History
Raubsville was founded in 1737 by John Raub, a German immigrant who had settled in the area. The town was originally known as Raub's Mill, and was a small farming community. In 1845, the town was officially incorporated as Raubsville.
During the 19th century, Raubsville was a thriving industrial center, with several mills and factories located in the area. The town was also home to a number of churches, including the Raubsville United Methodist Church, which was founded in 1845.
In the early 20th century, Raubsville experienced a period of decline as the local industries began to close. The town was also affected by the Great Depression, and many of the businesses and factories in the area closed.
Geography
Raubsville is located in Northampton County, Pennsylvania, in the Lehigh Valley region of the state. It is situated approximately 10 miles north of Easton and about 20 miles west of Allentown. The borough is bordered by the townships of Williams and Moore to the north, Lower Nazareth to the east, and Upper Nazareth to the south.
The terrain of Raubsville is mostly flat, with some rolling hills in the northern part of the borough. The town is located in the Lehigh Valley, and is part of the Lehigh Valley watershed. The Lehigh River runs through the town, and is a major source of water for the area.
Economy
Raubsville’s economy is largely based on agriculture and light industry. The town is home to several farms, which produce a variety of crops, including corn, soybeans, and wheat. There are also several small businesses in the area, including a few restaurants, a grocery store, and a hardware store.
The town is also home to a number of light industries, including a plastics factory, a printing company, and a metal fabrication plant. The town is also home to a number of small businesses, including a few restaurants, a grocery store, and a hardware store.
Demographics
As of the 2010 census, the population of Raubsville was 1,845. The racial makeup of the town was 94.3% White, 2.2% African American, 0.3% Native American, 0.7% Asian, 0.1% Pacific Islander, and 2.4% from other races. Hispanic or Latino of any race were 3.2% of the population.
The median household income in Raubsville was $45,938, and the median family income was $51,938. The per capita income for the town was $20,938. About 8.3% of families and 10.2% of the population were below the poverty line, including 14.2% of those under age 18 and 6.2% of those age 65 or over.
Common Questions
What is Per Capita Income in Raubsville?
Per Capita income in Raubsville is $52,745.
What is the Median Household income in Raubsville?
Median Household Income in Raubsville is $111,250.
What is Income or Wage Gap in Raubsville?
Income or Wage Gap in Raubsville is 40.9%.
Women in Raubsville earn 59.1 cents for every dollar earned by a man.
What is Inequality or Gini Index in Raubsville?
Inequality or Gini Index in Raubsville is 0.40.
What is the Total Population of Raubsville?
Total Population of Raubsville is 1,349.
What is the Total Male Population of Raubsville?
Total Male Population of Raubsville is 637.
What is the Total Female Population of Raubsville?
Total Female Population of Raubsville is 712.
What is the Ratio of Males per 100 Females in Raubsville?
There are 89.47 Males per 100 Females in Raubsville.
What is the Ratio of Females per 100 Males in Raubsville?
There are 111.77 Females per 100 Males in Raubsville.
What is the Median Population Age in Raubsville?
Median Population Age in Raubsville is 44.6 Years.
What is the Average Family Size in Raubsville
Average Family Size in Raubsville is 3.6 People.
What is the Average Household Size in Raubsville
Average Household Size in Raubsville is 3.2 People.
How Large is the Labor Force in Raubsville?
There are 591 People in the Labor Forcein in Raubsville.
What is the Percentage of People in the Labor Force in Raubsville?
57.7% of People are in the Labor Force in Raubsville.