Woodside, PA Map & Demographics
Woodside Map
Woodside Overview
$64,198
PER CAPITA INCOME
$176,385
AVG FAMILY INCOME
$175,338
AVG HOUSEHOLD INCOME
58.3%
WAGE / INCOME GAP [ % ]
41.7¢/ $1
WAGE / INCOME GAP [ $ ]
0.31
INEQUALITY / GINI INDEX
2,653
TOTAL POPULATION
1,311
MALE POPULATION
1,342
FEMALE POPULATION
97.69
MALES / 100 FEMALES
102.36
FEMALES / 100 MALES
41.5
MEDIAN AGE
3.3
AVG FAMILY SIZE
3.2
AVG HOUSEHOLD SIZE
1,398
LABOR FORCE [ PEOPLE ]
69.4%
PERCENT IN LABOR FORCE
15.2%
UNEMPLOYMENT RATE
Income in Woodside
Income Overview in Woodside
Per Capita Income in Woodside is $64,198, while median incomes of families and households are $176,385 and $175,338 respectively.
| Characteristic | Number | Measure |
| Per Capita Income | 2,653 | $64,198 |
| Median Family Income | 801 | $176,385 |
| Mean Family Income | 801 | $201,048 |
| Median Household Income | 832 | $175,338 |
| Mean Household Income | 832 | $196,116 |
| Income Deficit | 801 | $0 |
| Wage / Income Gap (%) | 2,653 | 58.33% |
| Wage / Income Gap ($) | 2,653 | 41.67¢ per $1 |
| Gini / Inequality Index | 2,653 | 0.31 |
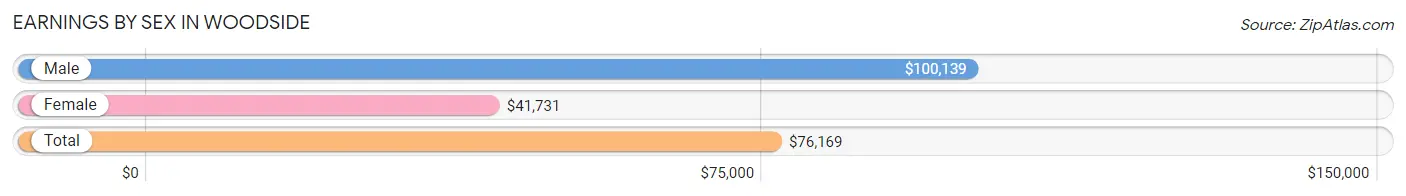
Earnings by Sex in Woodside
Average Earnings in Woodside are $76,169, $100,139 for men and $41,731 for women, a difference of 58.3%.
| Sex | Number | Average Earnings |
| Male | 903 (62.0%) | $100,139 |
| Female | 554 (38.0%) | $41,731 |
| Total | 1,457 (100.0%) | $76,169 |
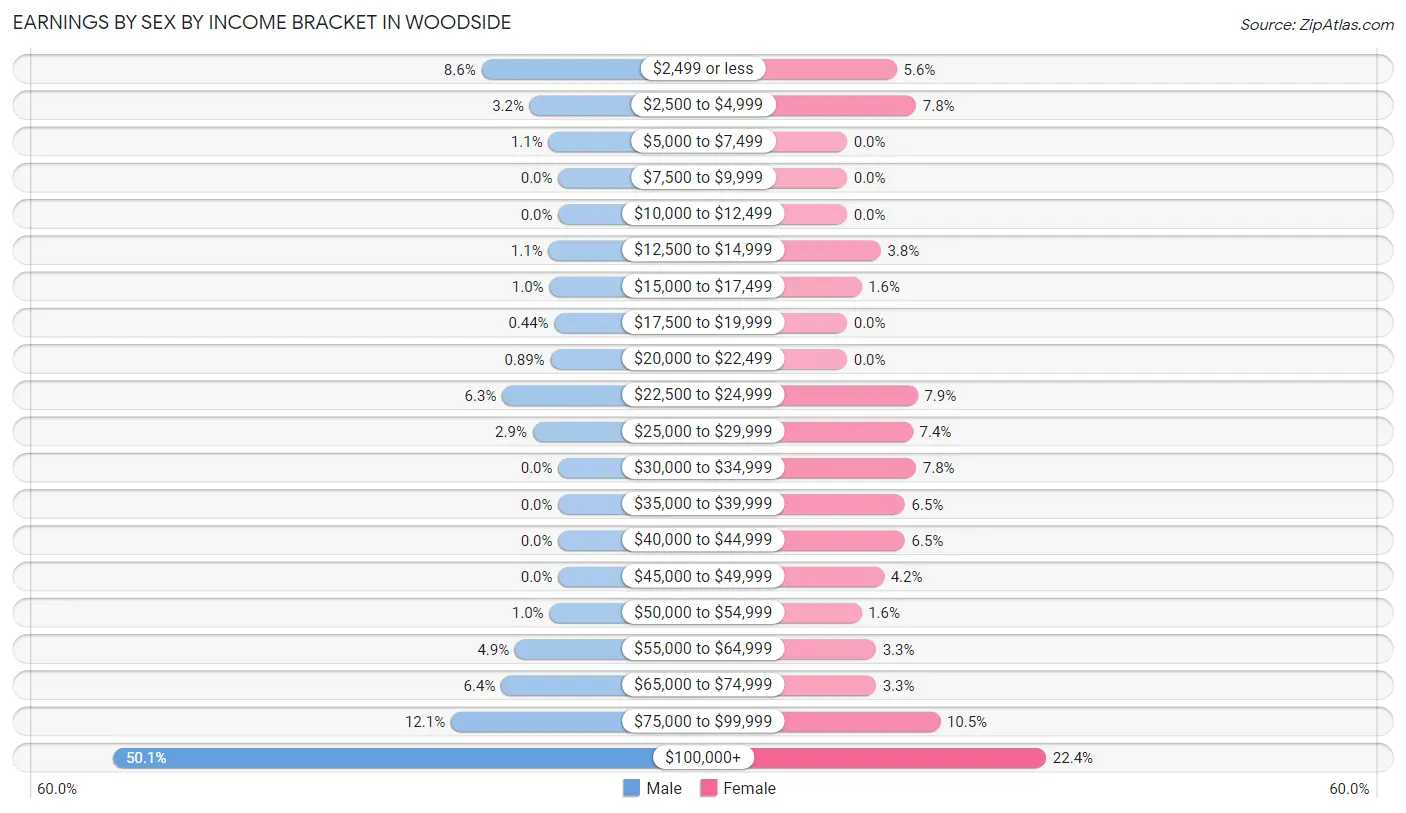
Earnings by Sex by Income Bracket in Woodside
The most common earnings brackets in Woodside are $100,000+ for men (452 | 50.1%) and $100,000+ for women (124 | 22.4%).
| Income | Male | Female |
| $2,499 or less | 78 (8.6%) | 31 (5.6%) |
| $2,500 to $4,999 | 29 (3.2%) | 43 (7.8%) |
| $5,000 to $7,499 | 10 (1.1%) | 0 (0.0%) |
| $7,500 to $9,999 | 0 (0.0%) | 0 (0.0%) |
| $10,000 to $12,499 | 0 (0.0%) | 0 (0.0%) |
| $12,500 to $14,999 | 10 (1.1%) | 21 (3.8%) |
| $15,000 to $17,499 | 9 (1.0%) | 9 (1.6%) |
| $17,500 to $19,999 | 4 (0.4%) | 0 (0.0%) |
| $20,000 to $22,499 | 8 (0.9%) | 0 (0.0%) |
| $22,500 to $24,999 | 57 (6.3%) | 44 (7.9%) |
| $25,000 to $29,999 | 26 (2.9%) | 41 (7.4%) |
| $30,000 to $34,999 | 0 (0.0%) | 43 (7.8%) |
| $35,000 to $39,999 | 0 (0.0%) | 36 (6.5%) |
| $40,000 to $44,999 | 0 (0.0%) | 36 (6.5%) |
| $45,000 to $49,999 | 0 (0.0%) | 23 (4.2%) |
| $50,000 to $54,999 | 9 (1.0%) | 9 (1.6%) |
| $55,000 to $64,999 | 44 (4.9%) | 18 (3.3%) |
| $65,000 to $74,999 | 58 (6.4%) | 18 (3.3%) |
| $75,000 to $99,999 | 109 (12.1%) | 58 (10.5%) |
| $100,000+ | 452 (50.1%) | 124 (22.4%) |
| Total | 903 (100.0%) | 554 (100.0%) |
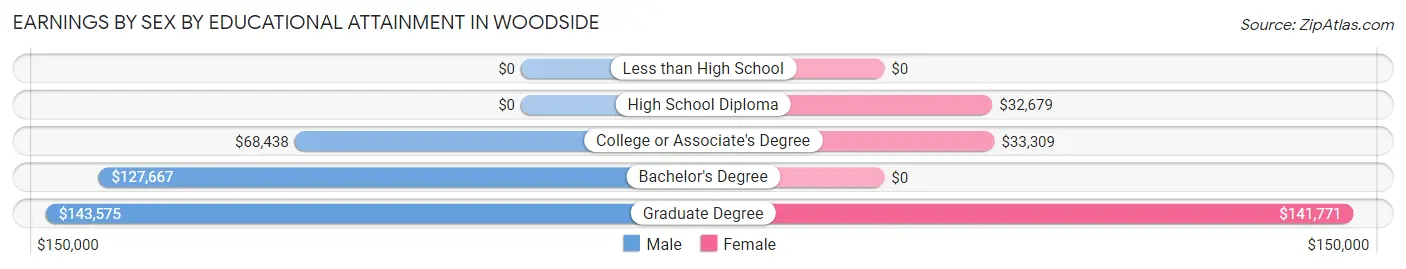
Earnings by Sex by Educational Attainment in Woodside
Average earnings in Woodside are $114,135 for men and $44,891 for women, a difference of 60.7%. Men with an educational attainment of graduate degree enjoy the highest average annual earnings of $143,575, while those with college or associate's degree education earn the least with $68,438. Women with an educational attainment of graduate degree earn the most with the average annual earnings of $141,771, while those with high school diploma education have the smallest earnings of $32,679.
| Educational Attainment | Male Income | Female Income |
| Less than High School | - | - |
| High School Diploma | - | - |
| College or Associate's Degree | $68,438 | $33,309 |
| Bachelor's Degree | $127,667 | $0 |
| Graduate Degree | $143,575 | $141,771 |
| Total | $114,135 | $44,891 |
Family Income in Woodside
Family Income Brackets in Woodside
According to the Woodside family income data, there are 342 families falling into the $200,000+ income range, which is the most common income bracket and makes up 42.7% of all families.
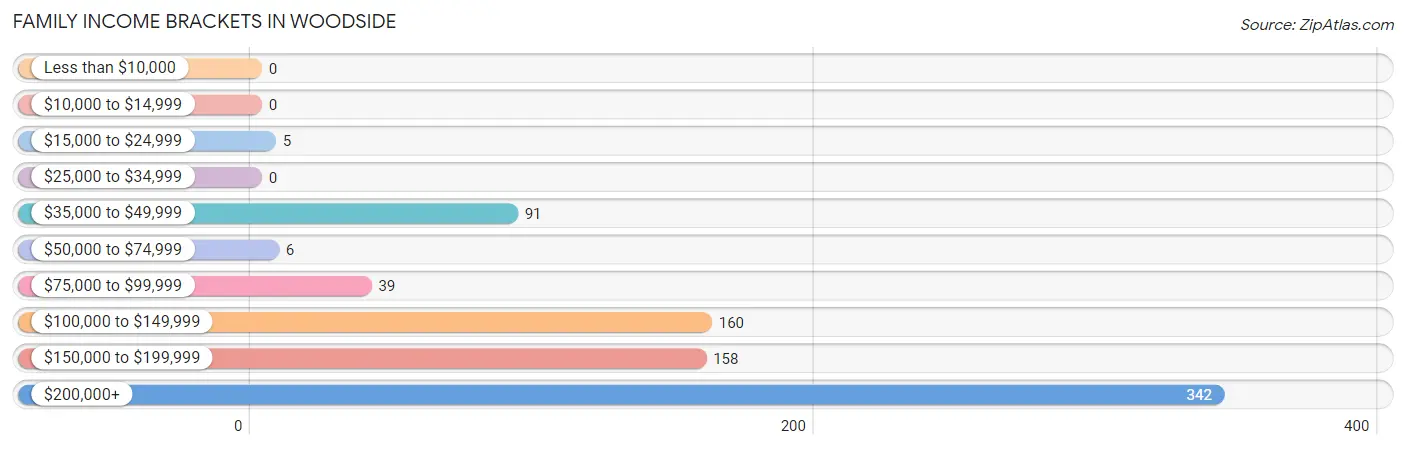
| Income Bracket | # Families | % Families |
| Less than $10,000 | 0 | 0.0% |
| $10,000 to $14,999 | 0 | 0.0% |
| $15,000 to $24,999 | 5 | 0.6% |
| $25,000 to $34,999 | 0 | 0.0% |
| $35,000 to $49,999 | 91 | 11.4% |
| $50,000 to $74,999 | 6 | 0.7% |
| $75,000 to $99,999 | 39 | 4.9% |
| $100,000 to $149,999 | 160 | 20.0% |
| $150,000 to $199,999 | 158 | 19.7% |
| $200,000+ | 342 | 42.7% |
Family Income by Famaliy Size in Woodside
3-person families (175 | 21.8%) account for the highest median family income in Woodside with $211,094 per family, while 2-person families (295 | 36.8%) have the highest median income of $84,812 per family member.
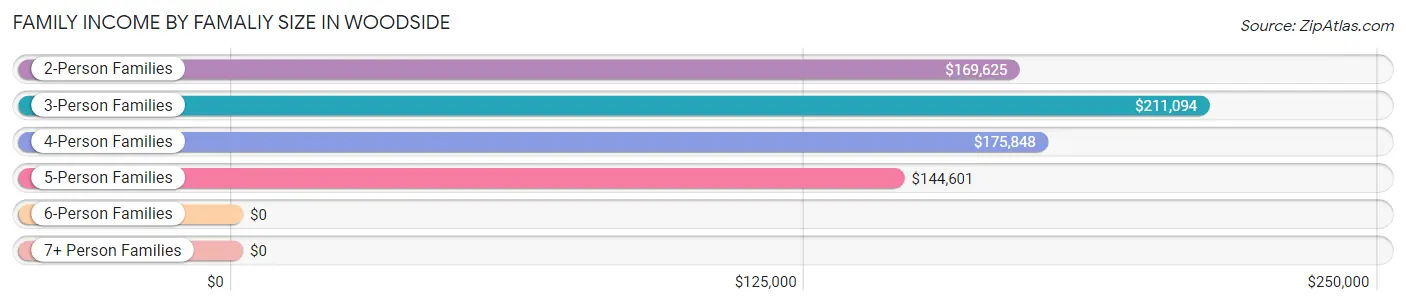
| Income Bracket | # Families | Median Income |
| 2-Person Families | 295 (36.8%) | $169,625 |
| 3-Person Families | 175 (21.8%) | $211,094 |
| 4-Person Families | 149 (18.6%) | $175,848 |
| 5-Person Families | 163 (20.3%) | $144,601 |
| 6-Person Families | 19 (2.4%) | $0 |
| 7+ Person Families | 0 (0.0%) | $0 |
| Total | 801 (100.0%) | $176,385 |
Family Income by Number of Earners in Woodside
The median family income in Woodside is $176,385, with families comprising 2 earners (246) having the highest median family income of $250,001, while families with 1 earner (312) have the lowest median family income of $149,167, accounting for 30.7% and 39.0% of families, respectively.
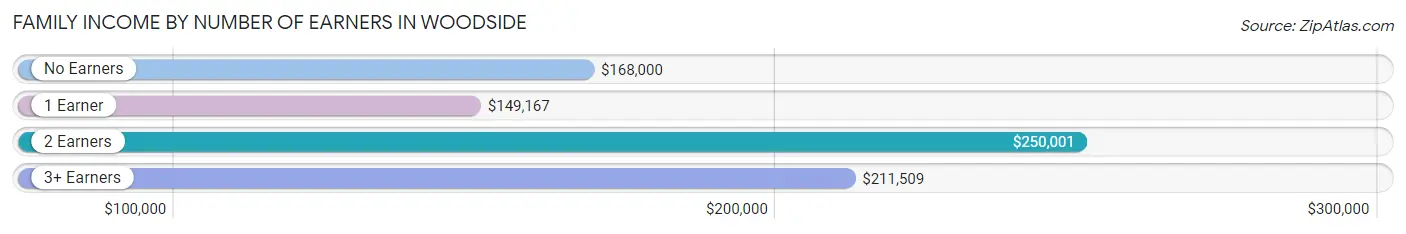
| Number of Earners | # Families | Median Income |
| No Earners | 62 (7.7%) | $168,000 |
| 1 Earner | 312 (39.0%) | $149,167 |
| 2 Earners | 246 (30.7%) | $250,001 |
| 3+ Earners | 181 (22.6%) | $211,509 |
| Total | 801 (100.0%) | $176,385 |
Household Income in Woodside
Household Income Brackets in Woodside
With 342 households falling in the category, the $200,000+ income range is the most frequent in Woodside, accounting for 41.1% of all households.
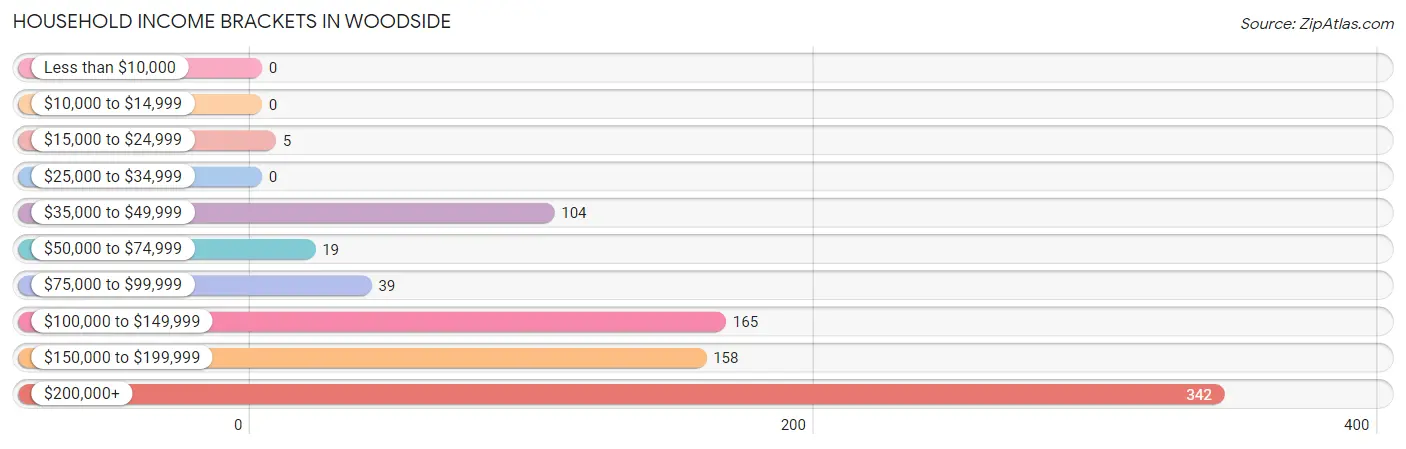
| Income Bracket | # Households | % Households |
| Less than $10,000 | 0 | 0.0% |
| $10,000 to $14,999 | 0 | 0.0% |
| $15,000 to $24,999 | 5 | 0.6% |
| $25,000 to $34,999 | 0 | 0.0% |
| $35,000 to $49,999 | 104 | 12.5% |
| $50,000 to $74,999 | 19 | 2.3% |
| $75,000 to $99,999 | 39 | 4.7% |
| $100,000 to $149,999 | 165 | 19.8% |
| $150,000 to $199,999 | 158 | 19.0% |
| $200,000+ | 342 | 41.1% |
Household Income by Householder Age in Woodside
The median household income in Woodside is $175,338, with the highest median household income of $211,466 found in the 45 to 64 years age bracket for the primary householder. A total of 358 households (43.0%) fall into this category.
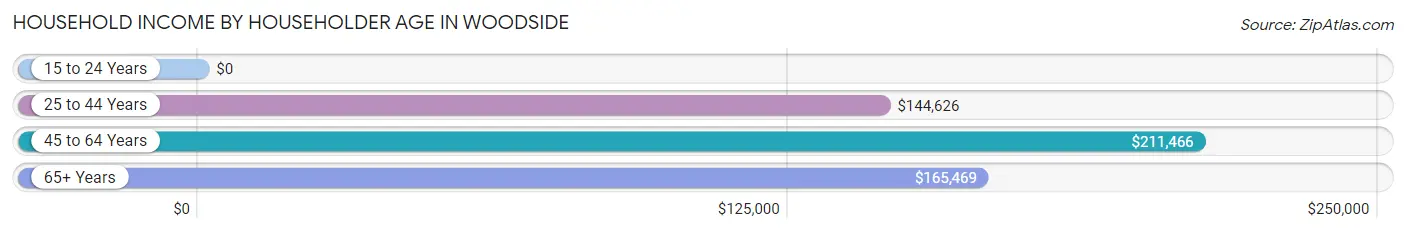
| Income Bracket | # Households | Median Income |
| 15 to 24 Years | 0 (0.0%) | $0 |
| 25 to 44 Years | 263 (31.6%) | $144,626 |
| 45 to 64 Years | 358 (43.0%) | $211,466 |
| 65+ Years | 211 (25.4%) | $165,469 |
| Total | 832 (100.0%) | $175,338 |
Poverty in Woodside
Income Below Poverty by Sex and Age in Woodside
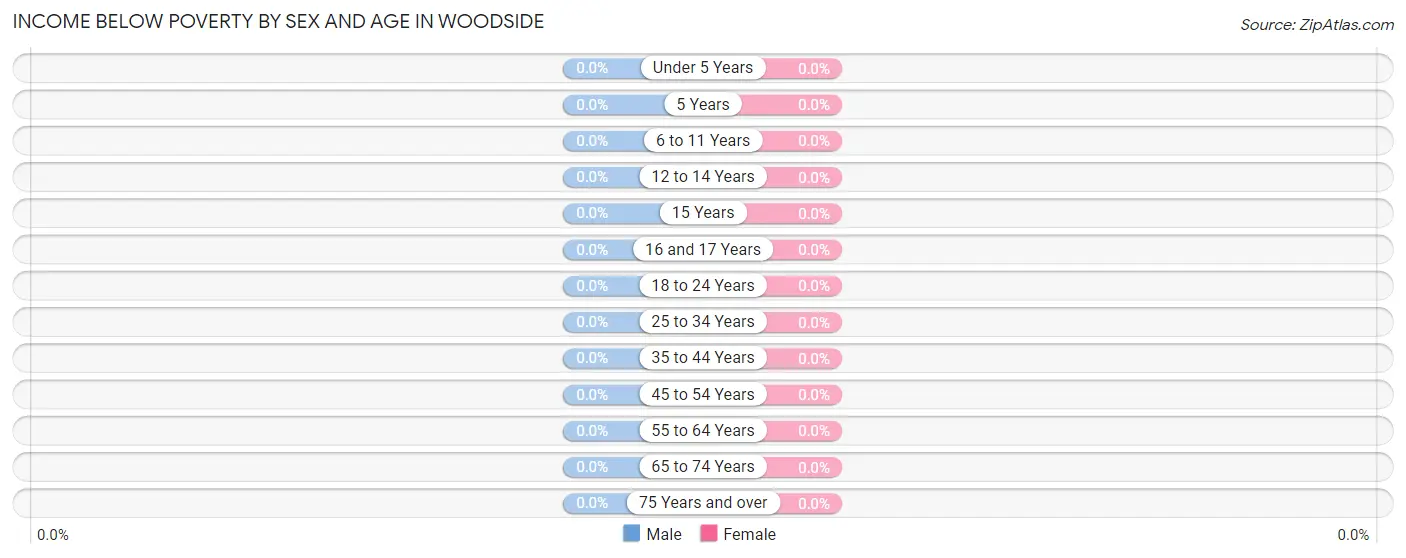
| Age Bracket | Male | Female |
| Under 5 Years | 0 (0.0%) | 0 (0.0%) |
| 5 Years | 0 (0.0%) | 0 (0.0%) |
| 6 to 11 Years | 0 (0.0%) | 0 (0.0%) |
| 12 to 14 Years | 0 (0.0%) | 0 (0.0%) |
| 15 Years | 0 (0.0%) | 0 (0.0%) |
| 16 and 17 Years | 0 (0.0%) | 0 (0.0%) |
| 18 to 24 Years | 0 (0.0%) | 0 (0.0%) |
| 25 to 34 Years | 0 (0.0%) | 0 (0.0%) |
| 35 to 44 Years | 0 (0.0%) | 0 (0.0%) |
| 45 to 54 Years | 0 (0.0%) | 0 (0.0%) |
| 55 to 64 Years | 0 (0.0%) | 0 (0.0%) |
| 65 to 74 Years | 0 (0.0%) | 0 (0.0%) |
| 75 Years and over | 0 (0.0%) | 0 (0.0%) |
| Total | 0 (0.0%) | 0 (0.0%) |
Income Above Poverty by Sex and Age in Woodside
According to the poverty statistics in Woodside, males aged under 5 years and females aged under 5 years are the age groups that are most secure financially, with 100.0% of males and 100.0% of females in these age groups living above the poverty line.
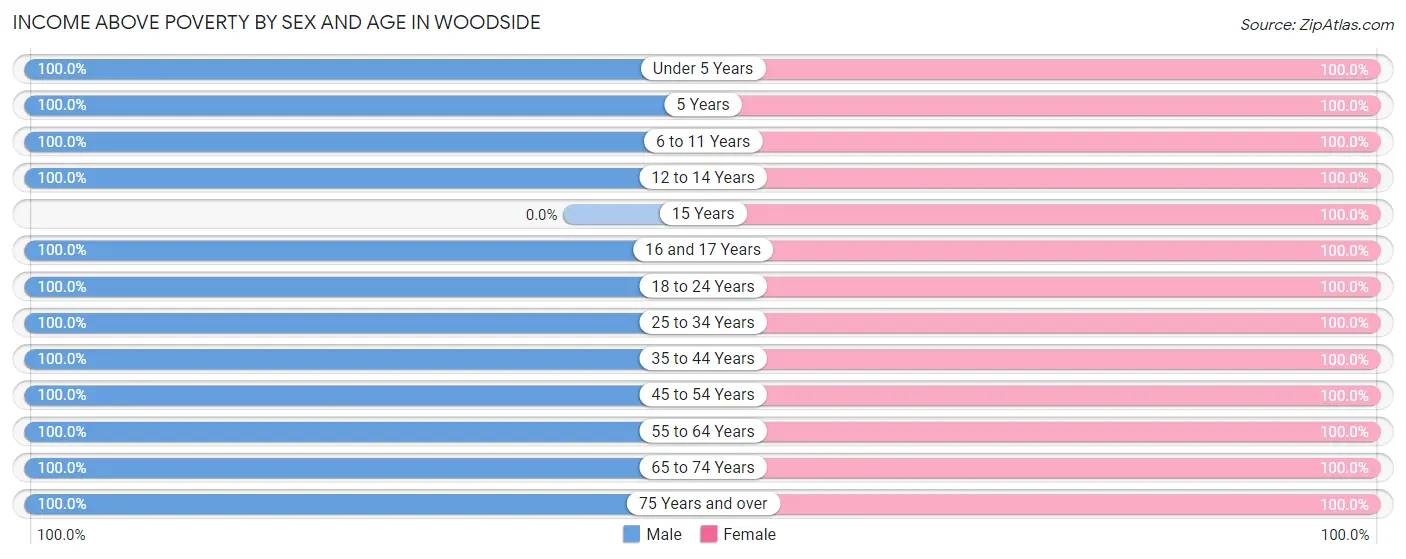
| Age Bracket | Male | Female |
| Under 5 Years | 72 (100.0%) | 28 (100.0%) |
| 5 Years | 22 (100.0%) | 11 (100.0%) |
| 6 to 11 Years | 159 (100.0%) | 167 (100.0%) |
| 12 to 14 Years | 30 (100.0%) | 140 (100.0%) |
| 15 Years | 0 (0.0%) | 10 (100.0%) |
| 16 and 17 Years | 30 (100.0%) | 21 (100.0%) |
| 18 to 24 Years | 58 (100.0%) | 67 (100.0%) |
| 25 to 34 Years | 150 (100.0%) | 170 (100.0%) |
| 35 to 44 Years | 222 (100.0%) | 184 (100.0%) |
| 45 to 54 Years | 205 (100.0%) | 165 (100.0%) |
| 55 to 64 Years | 154 (100.0%) | 127 (100.0%) |
| 65 to 74 Years | 166 (100.0%) | 187 (100.0%) |
| 75 Years and over | 43 (100.0%) | 65 (100.0%) |
| Total | 1,311 (100.0%) | 1,342 (100.0%) |
Income Below Poverty Among Married-Couple Families in Woodside
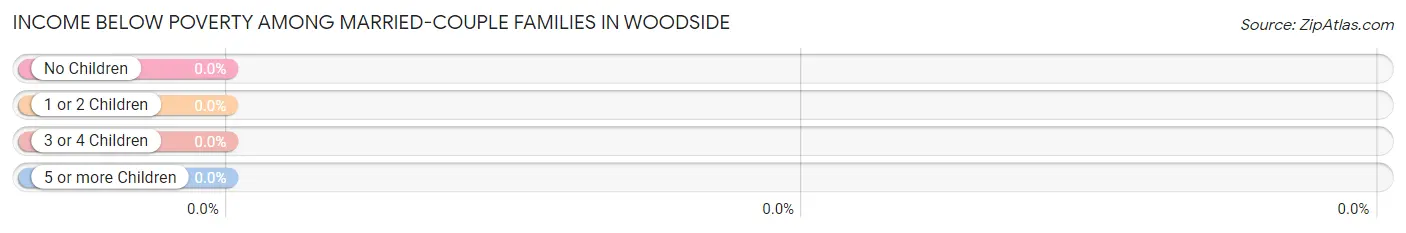
| Children | Above Poverty | Below Poverty |
| No Children | 413 (100.0%) | 0 (0.0%) |
| 1 or 2 Children | 252 (100.0%) | 0 (0.0%) |
| 3 or 4 Children | 131 (100.0%) | 0 (0.0%) |
| 5 or more Children | 0 (0.0%) | 0 (0.0%) |
| Total | 796 (100.0%) | 0 (0.0%) |
Income Below Poverty Among Single-Parent Households in Woodside
| Children | Single Father | Single Mother |
| No Children | 0 (0.0%) | 0 (0.0%) |
| 1 or 2 Children | 0 (0.0%) | 0 (0.0%) |
| 3 or 4 Children | 0 (0.0%) | 0 (0.0%) |
| 5 or more Children | 0 (0.0%) | 0 (0.0%) |
| Total | 0 (0.0%) | 0 (0.0%) |
Income Below Poverty Among Married-Couple vs Single-Parent Households in Woodside
| Children | Married-Couple Families | Single-Parent Households |
| No Children | 0 (0.0%) | 0 (0.0%) |
| 1 or 2 Children | 0 (0.0%) | 0 (0.0%) |
| 3 or 4 Children | 0 (0.0%) | 0 (0.0%) |
| 5 or more Children | 0 (0.0%) | 0 (0.0%) |
| Total | 0 (0.0%) | 0 (0.0%) |
Race in Woodside
The most populous races in Woodside are White / Caucasian (2,382 | 89.8%), Hispanic or Latino (197 | 7.4%), and Asian (138 | 5.2%).
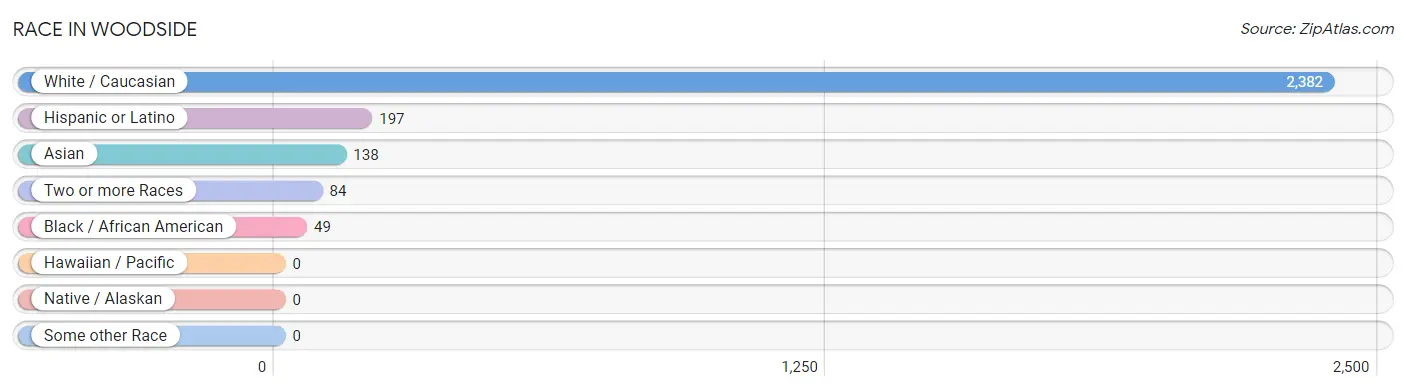
| Race | # Population | % Population |
| Asian | 138 | 5.2% |
| Black / African American | 49 | 1.8% |
| Hawaiian / Pacific | 0 | 0.0% |
| Hispanic or Latino | 197 | 7.4% |
| Native / Alaskan | 0 | 0.0% |
| White / Caucasian | 2,382 | 89.8% |
| Two or more Races | 84 | 3.2% |
| Some other Race | 0 | 0.0% |
| Total | 2,653 | 100.0% |
Ancestry in Woodside
The most populous ancestries reported in Woodside are German (482 | 18.2%), Irish (460 | 17.3%), Polish (431 | 16.3%), Italian (214 | 8.1%), and American (113 | 4.3%), together accounting for 64.1% of all Woodside residents.
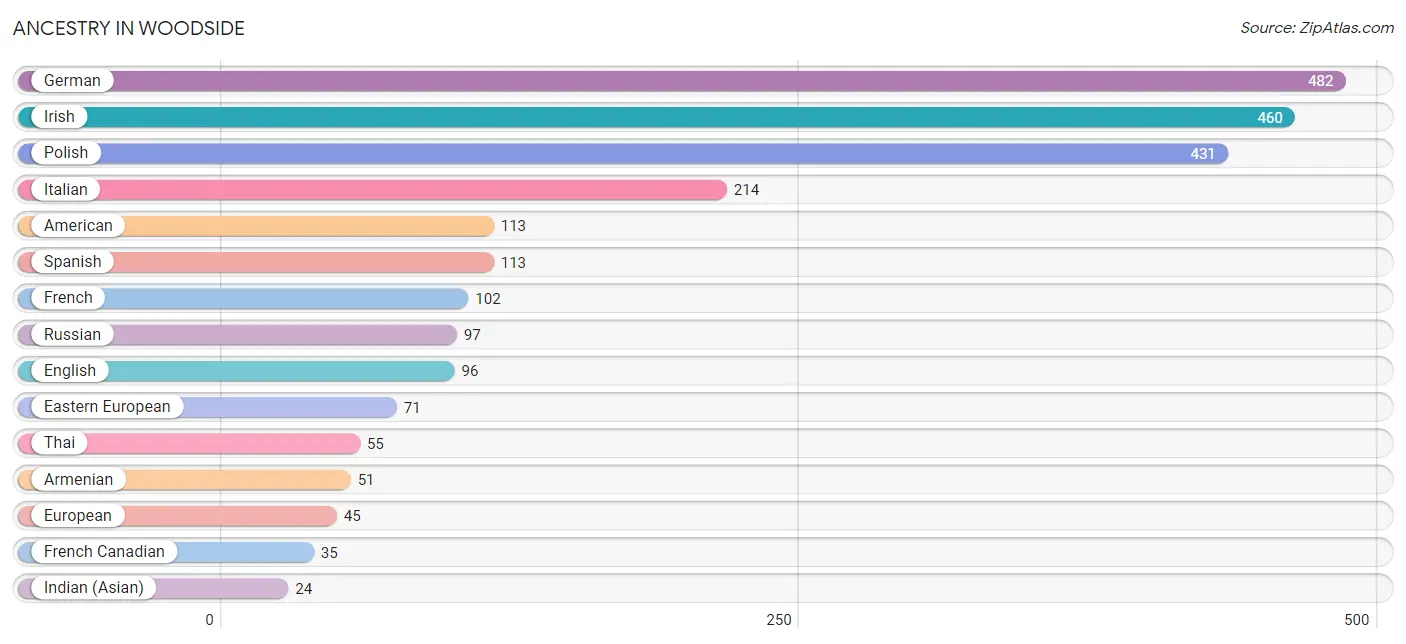
| Ancestry | # Population | % Population |
| American | 113 | 4.3% |
| Argentinean | 12 | 0.4% |
| Armenian | 51 | 1.9% |
| Croatian | 10 | 0.4% |
| Czech | 8 | 0.3% |
| Dutch | 11 | 0.4% |
| Eastern European | 71 | 2.7% |
| English | 96 | 3.6% |
| European | 45 | 1.7% |
| Filipino | 11 | 0.4% |
| French | 102 | 3.8% |
| French Canadian | 35 | 1.3% |
| German | 482 | 18.2% |
| Greek | 7 | 0.3% |
| Hungarian | 16 | 0.6% |
| Indian (Asian) | 24 | 0.9% |
| Irish | 460 | 17.3% |
| Italian | 214 | 8.1% |
| Lithuanian | 14 | 0.5% |
| Polish | 431 | 16.3% |
| Puerto Rican | 23 | 0.9% |
| Russian | 97 | 3.7% |
| Scottish | 22 | 0.8% |
| South American | 12 | 0.4% |
| Spanish | 113 | 4.3% |
| Thai | 55 | 2.1% |
| Ukrainian | 18 | 0.7% |
| Welsh | 8 | 0.3% | View All 28 Rows |
Immigrants in Woodside
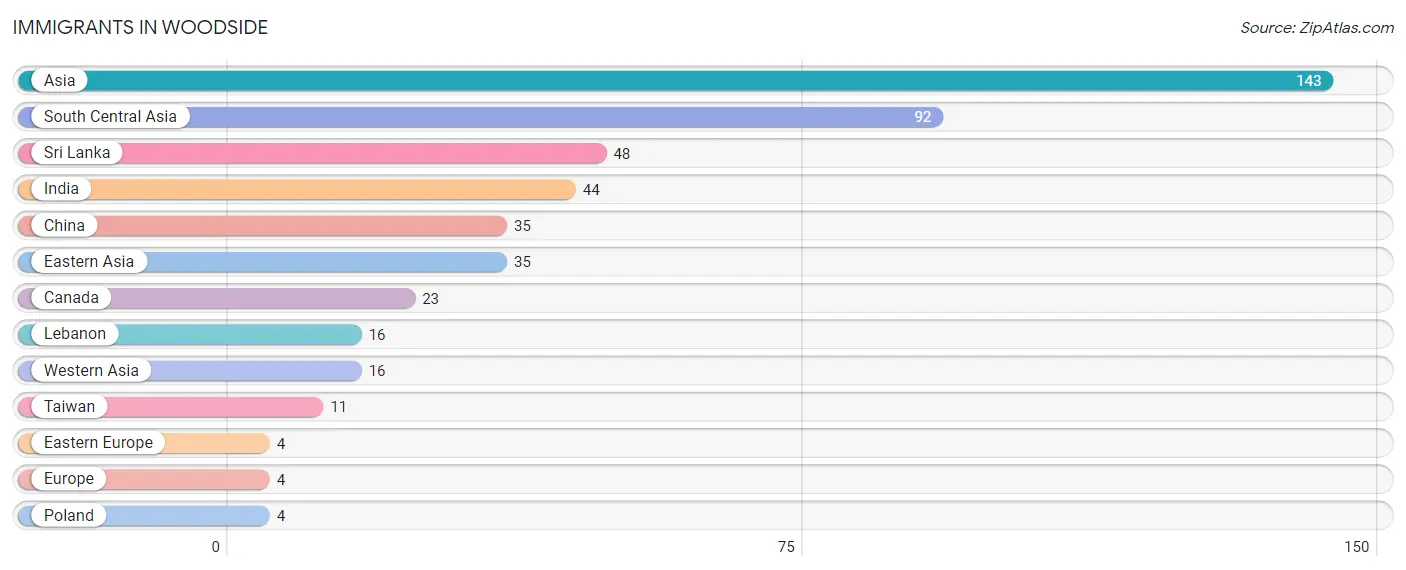
The most numerous immigrant groups reported in Woodside came from Asia (143 | 5.4%), South Central Asia (92 | 3.5%), Sri Lanka (48 | 1.8%), India (44 | 1.7%), and China (35 | 1.3%), together accounting for 13.7% of all Woodside residents.
| Immigration Origin | # Population | % Population |
| Asia | 143 | 5.4% |
| Canada | 23 | 0.9% |
| China | 35 | 1.3% |
| Eastern Asia | 35 | 1.3% |
| Eastern Europe | 4 | 0.2% |
| Europe | 4 | 0.2% |
| India | 44 | 1.7% |
| Lebanon | 16 | 0.6% |
| Poland | 4 | 0.2% |
| South Central Asia | 92 | 3.5% |
| Sri Lanka | 48 | 1.8% |
| Taiwan | 11 | 0.4% |
| Western Asia | 16 | 0.6% | View All 13 Rows |
Sex and Age in Woodside
Sex and Age in Woodside
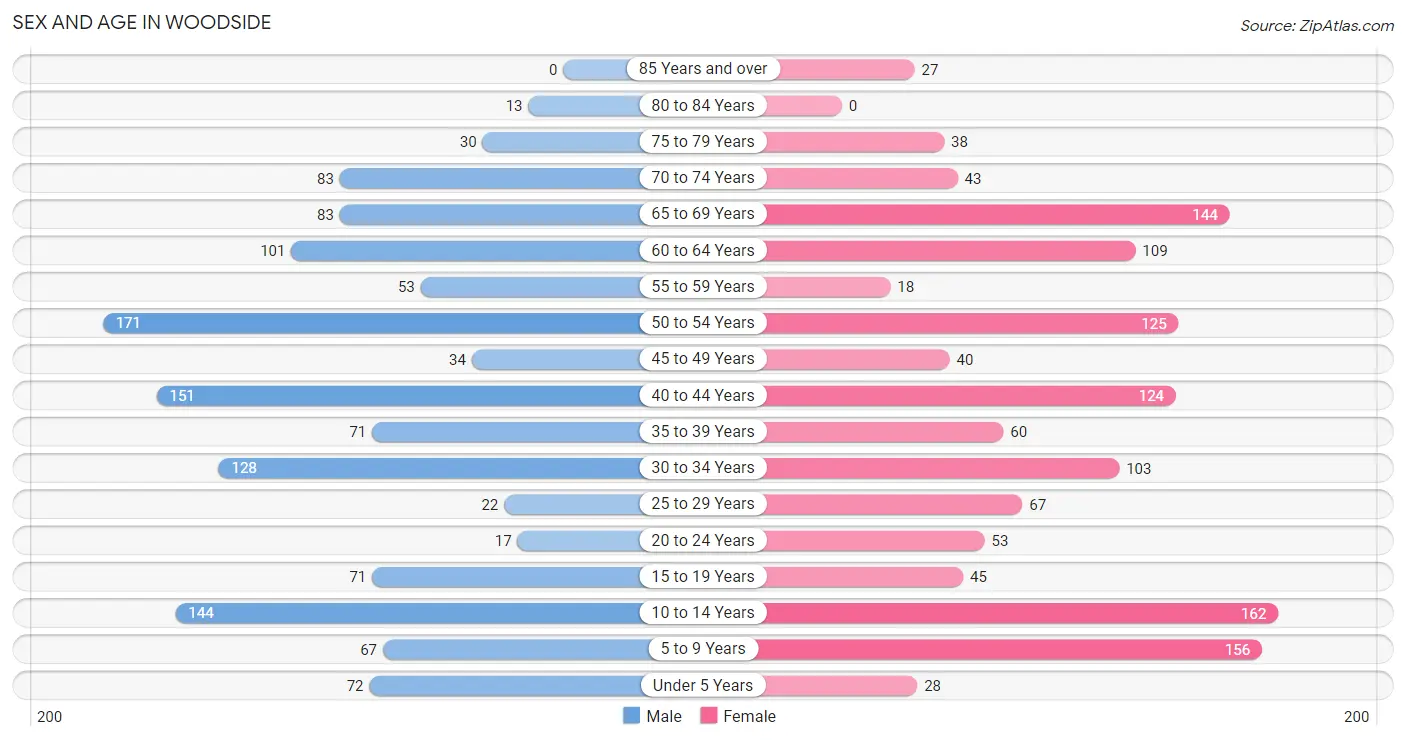
The most populous age groups in Woodside are 50 to 54 Years (171 | 13.0%) for men and 10 to 14 Years (162 | 12.1%) for women.
| Age Bracket | Male | Female |
| Under 5 Years | 72 (5.5%) | 28 (2.1%) |
| 5 to 9 Years | 67 (5.1%) | 156 (11.6%) |
| 10 to 14 Years | 144 (11.0%) | 162 (12.1%) |
| 15 to 19 Years | 71 (5.4%) | 45 (3.4%) |
| 20 to 24 Years | 17 (1.3%) | 53 (4.0%) |
| 25 to 29 Years | 22 (1.7%) | 67 (5.0%) |
| 30 to 34 Years | 128 (9.8%) | 103 (7.7%) |
| 35 to 39 Years | 71 (5.4%) | 60 (4.5%) |
| 40 to 44 Years | 151 (11.5%) | 124 (9.2%) |
| 45 to 49 Years | 34 (2.6%) | 40 (3.0%) |
| 50 to 54 Years | 171 (13.0%) | 125 (9.3%) |
| 55 to 59 Years | 53 (4.0%) | 18 (1.3%) |
| 60 to 64 Years | 101 (7.7%) | 109 (8.1%) |
| 65 to 69 Years | 83 (6.3%) | 144 (10.7%) |
| 70 to 74 Years | 83 (6.3%) | 43 (3.2%) |
| 75 to 79 Years | 30 (2.3%) | 38 (2.8%) |
| 80 to 84 Years | 13 (1.0%) | 0 (0.0%) |
| 85 Years and over | 0 (0.0%) | 27 (2.0%) |
| Total | 1,311 (100.0%) | 1,342 (100.0%) |
Families and Households in Woodside
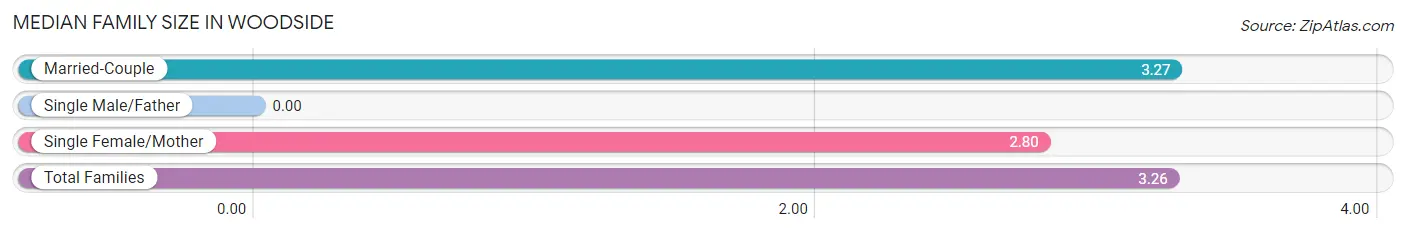
Median Family Size in Woodside
| Family Type | # Families | Family Size |
| Married-Couple | 796 (99.4%) | 3.27 |
| Single Male/Father | 0 (0.0%) | - |
| Single Female/Mother | 5 (0.6%) | 2.80 |
| Total Families | 801 (100.0%) | 3.26 |
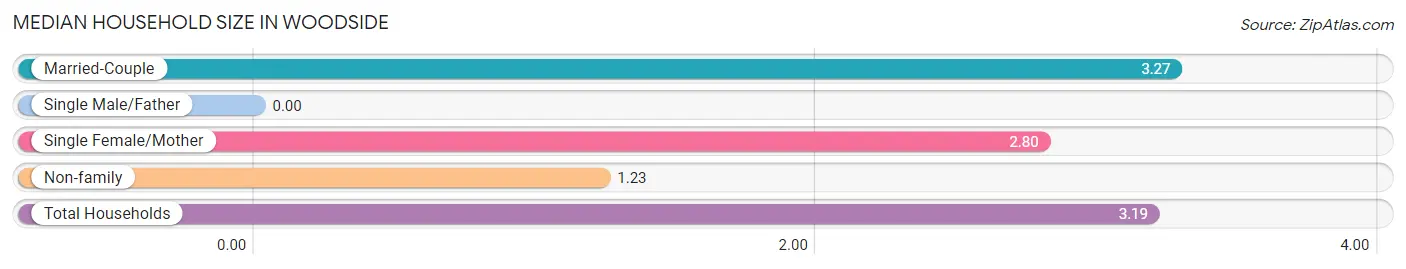
Median Household Size in Woodside
| Household Type | # Households | Household Size |
| Married-Couple | 796 (95.7%) | 3.27 |
| Single Male/Father | 0 (0.0%) | - |
| Single Female/Mother | 5 (0.6%) | 2.80 |
| Non-family | 31 (3.7%) | 1.23 |
| Total Households | 832 (100.0%) | 3.19 |
Household Size by Marriage Status in Woodside
Out of a total of 832 households in Woodside, 801 (96.3%) are family households, while 31 (3.7%) are nonfamily households. The most numerous type of family households are 2-person households, comprising 295, and the most common type of nonfamily households are 1-person households, comprising 26.
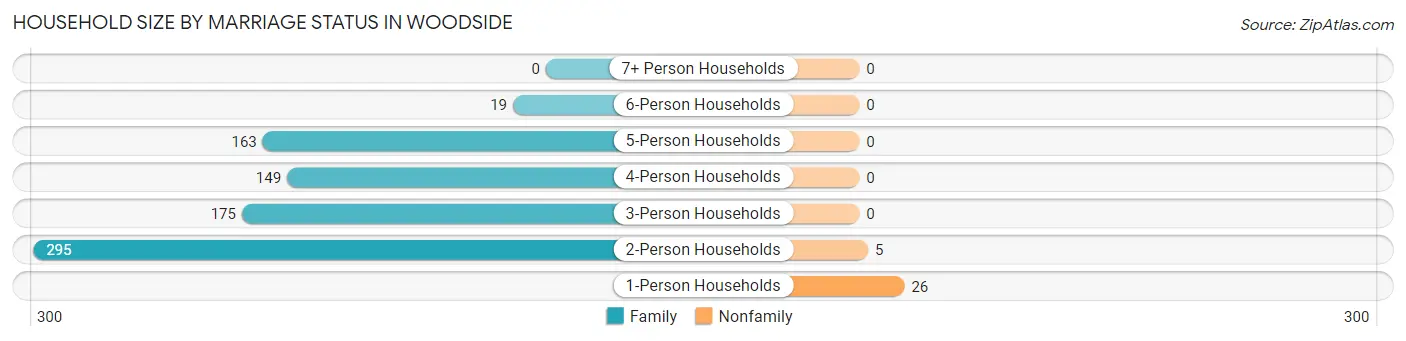
| Household Size | Family Households | Nonfamily Households |
| 1-Person Households | - | 26 (3.1%) |
| 2-Person Households | 295 (35.5%) | 5 (0.6%) |
| 3-Person Households | 175 (21.0%) | 0 (0.0%) |
| 4-Person Households | 149 (17.9%) | 0 (0.0%) |
| 5-Person Households | 163 (19.6%) | 0 (0.0%) |
| 6-Person Households | 19 (2.3%) | 0 (0.0%) |
| 7+ Person Households | 0 (0.0%) | 0 (0.0%) |
| Total | 801 (96.3%) | 31 (3.7%) |
Female Fertility in Woodside
Fertility by Age in Woodside
Average fertility rate in Woodside is 18.0 births per 1,000 women. Women in the age bracket of 35 to 50 years have the highest fertility rate with 37.0 births per 1,000 women. Women in the age bracket of 35 to 50 years acount for 100.0% of all women with births.
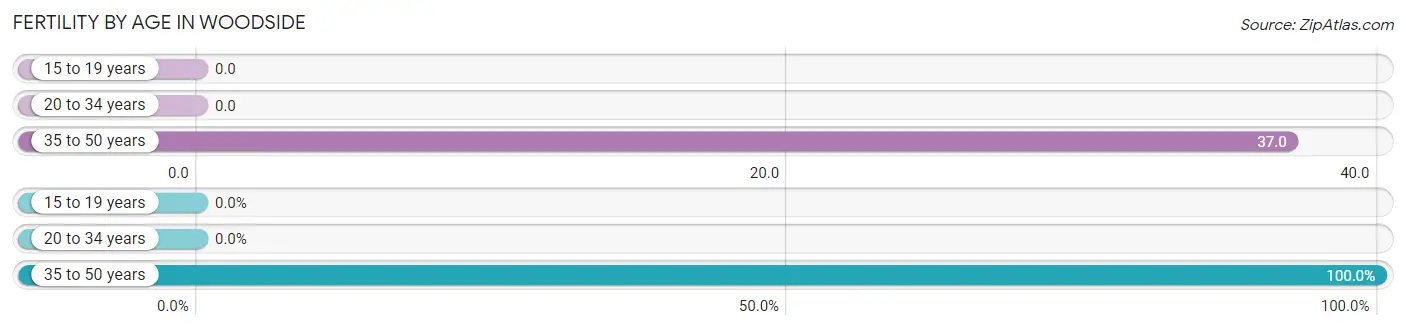
| Age Bracket | Women with Births | Births / 1,000 Women |
| 15 to 19 years | 0 (0.0%) | 0.0 |
| 20 to 34 years | 0 (0.0%) | 0.0 |
| 35 to 50 years | 9 (100.0%) | 37.0 |
| Total | 9 (100.0%) | 18.0 |
Fertility by Age by Marriage Status in Woodside
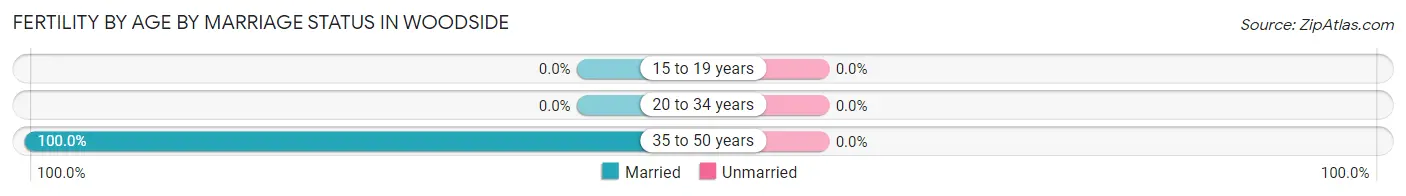
| Age Bracket | Married | Unmarried |
| 15 to 19 years | 0 (0.0%) | 0 (0.0%) |
| 20 to 34 years | 0 (0.0%) | 0 (0.0%) |
| 35 to 50 years | 9 (100.0%) | 0 (0.0%) |
| Total | 9 (100.0%) | 0 (0.0%) |
Fertility by Education in Woodside
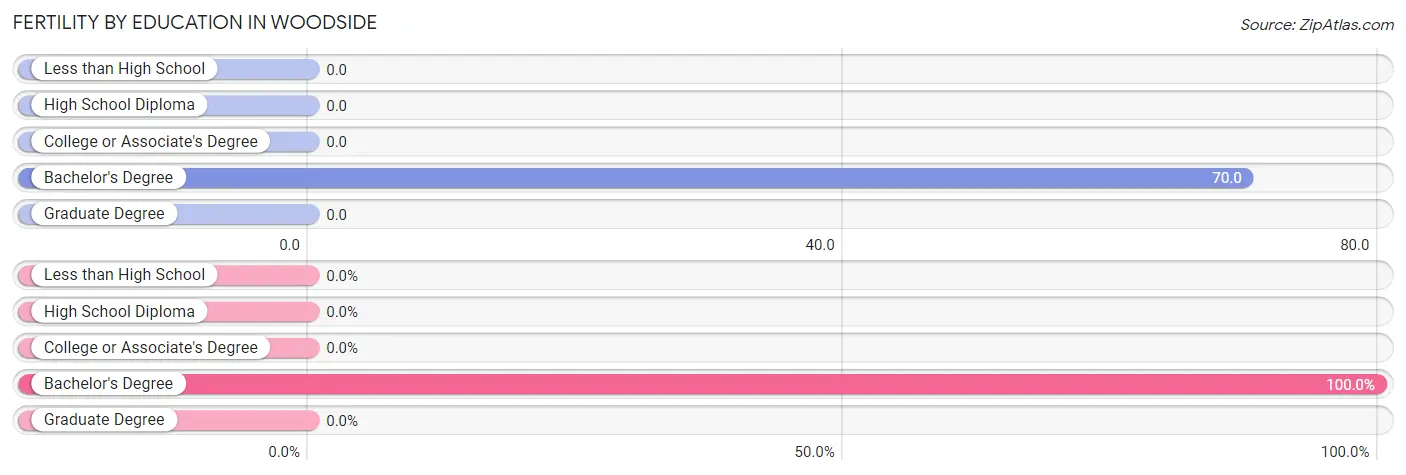
| Educational Attainment | Women with Births | Births / 1,000 Women |
| Less than High School | 0 (0.0%) | 0.0 |
| High School Diploma | 0 (0.0%) | 0.0 |
| College or Associate's Degree | 0 (0.0%) | 0.0 |
| Bachelor's Degree | 9 (100.0%) | 70.0 |
| Graduate Degree | 0 (0.0%) | 0.0 |
| Total | 9 (100.0%) | 18.0 |
Fertility by Education by Marriage Status in Woodside
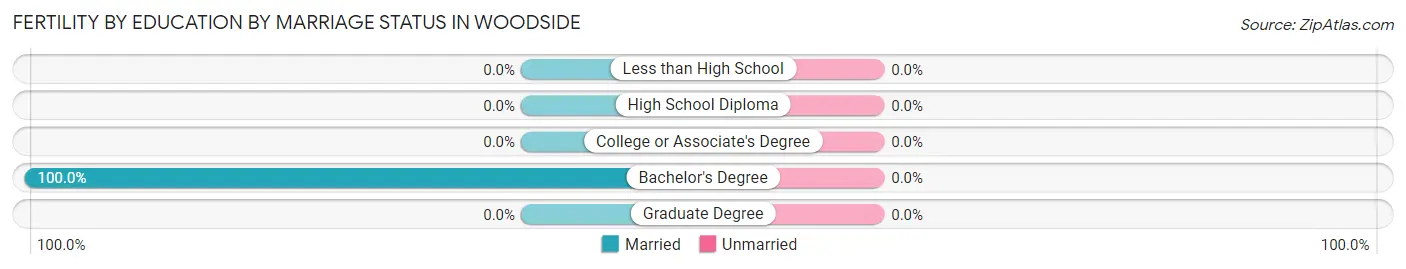
| Educational Attainment | Married | Unmarried |
| Less than High School | 0 (0.0%) | 0 (0.0%) |
| High School Diploma | 0 (0.0%) | 0 (0.0%) |
| College or Associate's Degree | 0 (0.0%) | 0 (0.0%) |
| Bachelor's Degree | 9 (100.0%) | 0 (0.0%) |
| Graduate Degree | 0 (0.0%) | 0 (0.0%) |
| Total | 9 (100.0%) | 0 (0.0%) |
Employment Characteristics in Woodside
Employment by Class of Employer in Woodside
Among the 1,185 employed individuals in Woodside, private company employees (880 | 74.3%), not-for-profit organizations (91 | 7.7%), and self-employed (incorporated) (81 | 6.8%) make up the most common classes of employment.
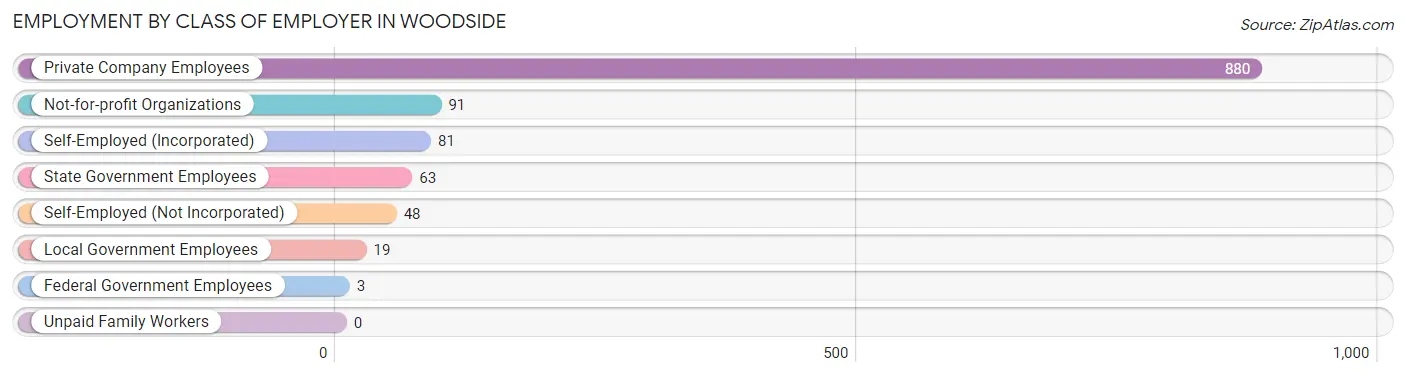
| Employer Class | # Employees | % Employees |
| Private Company Employees | 880 | 74.3% |
| Self-Employed (Incorporated) | 81 | 6.8% |
| Self-Employed (Not Incorporated) | 48 | 4.1% |
| Not-for-profit Organizations | 91 | 7.7% |
| Local Government Employees | 19 | 1.6% |
| State Government Employees | 63 | 5.3% |
| Federal Government Employees | 3 | 0.3% |
| Unpaid Family Workers | 0 | 0.0% |
| Total | 1,185 | 100.0% |
Employment Status by Age in Woodside
According to the labor force statistics for Woodside, out of the total population over 16 years of age (2,014), 69.4% or 1,398 individuals are in the labor force, with 15.2% or 212 of them unemployed. The age group with the highest labor force participation rate is 25 to 29 years, with 100.0% or 89 individuals in the labor force. Within the labor force, the 20 to 24 years age range has the highest percentage of unemployed individuals, with 49.1% or 28 of them being unemployed.
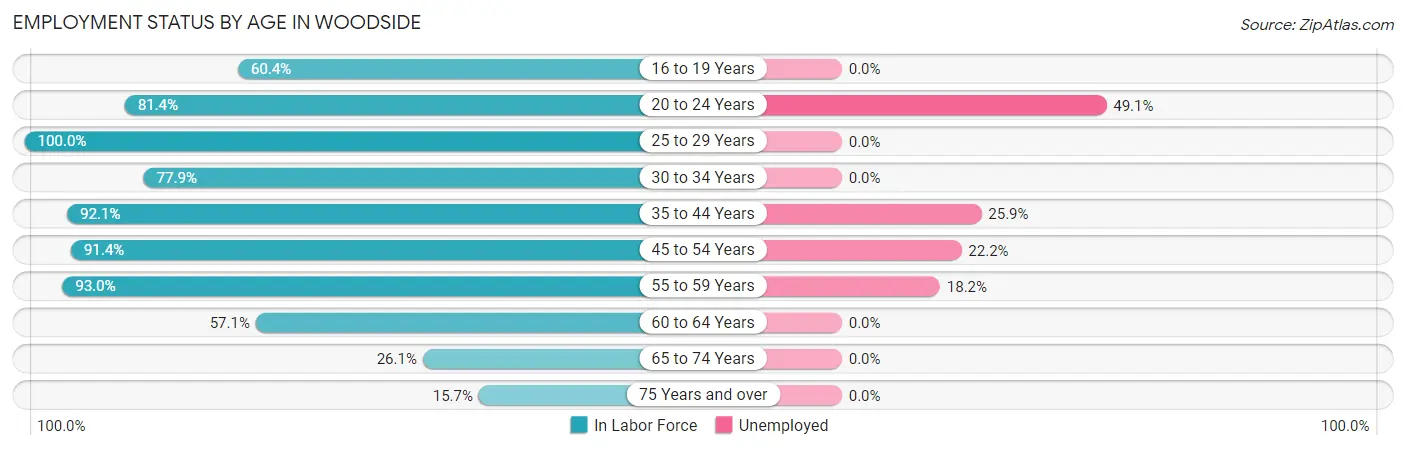
| Age Bracket | In Labor Force | Unemployed |
| 16 to 19 Years | 64 (60.4%) | 0 (0.0%) |
| 20 to 24 Years | 57 (81.4%) | 28 (49.1%) |
| 25 to 29 Years | 89 (100.0%) | 0 (0.0%) |
| 30 to 34 Years | 180 (77.9%) | 0 (0.0%) |
| 35 to 44 Years | 374 (92.1%) | 97 (25.9%) |
| 45 to 54 Years | 338 (91.4%) | 75 (22.2%) |
| 55 to 59 Years | 66 (93.0%) | 12 (18.2%) |
| 60 to 64 Years | 120 (57.1%) | 0 (0.0%) |
| 65 to 74 Years | 92 (26.1%) | 0 (0.0%) |
| 75 Years and over | 17 (15.7%) | 0 (0.0%) |
| Total | 1,398 (69.4%) | 212 (15.2%) |
Employment Status by Educational Attainment in Woodside
According to labor force statistics for Woodside, 84.7% of individuals (1,166) out of the total population between 25 and 64 years of age (1,377) are in the labor force, with 15.8% or 184 of them being unemployed. The group with the highest labor force participation rate are those with the educational attainment of less than high school, with 100.0% or 49 individuals in the labor force. Within the labor force, individuals with high school diploma education have the highest percentage of unemployment, with 36.1% or 57 of them being unemployed.
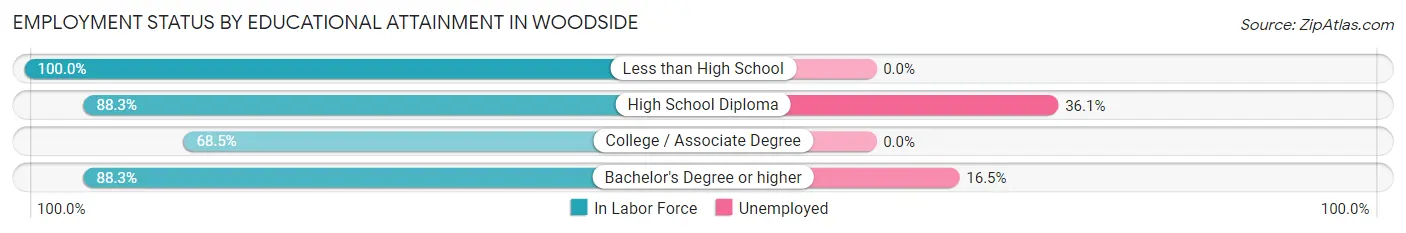
| Educational Attainment | In Labor Force | Unemployed |
| Less than High School | 49 (100.0%) | 0 (0.0%) |
| High School Diploma | 158 (88.3%) | 65 (36.1%) |
| College / Associate Degree | 189 (68.5%) | 0 (0.0%) |
| Bachelor's Degree or higher | 771 (88.3%) | 144 (16.5%) |
| Total | 1,166 (84.7%) | 218 (15.8%) |
Employment Occupations by Sex in Woodside
Management, Business, Science and Arts Occupations
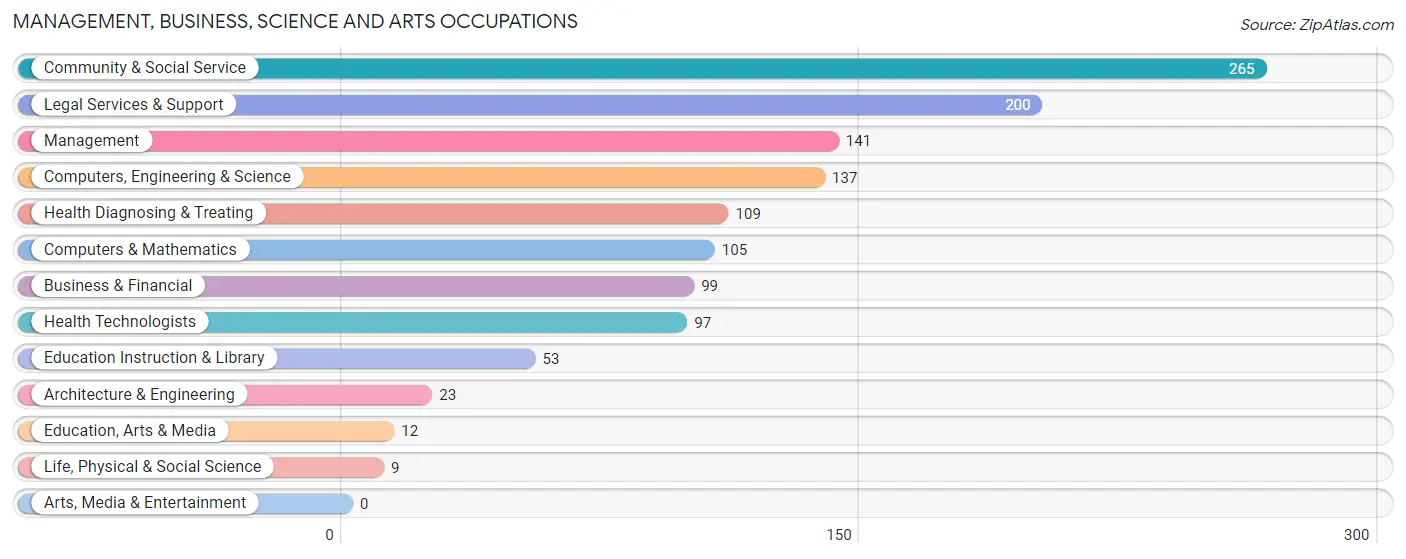
The most common Management, Business, Science and Arts occupations in Woodside are Community & Social Service (265 | 22.4%), Legal Services & Support (200 | 16.9%), Management (141 | 11.9%), Computers, Engineering & Science (137 | 11.6%), and Health Diagnosing & Treating (109 | 9.2%).
Management, Business, Science and Arts Occupations by Sex
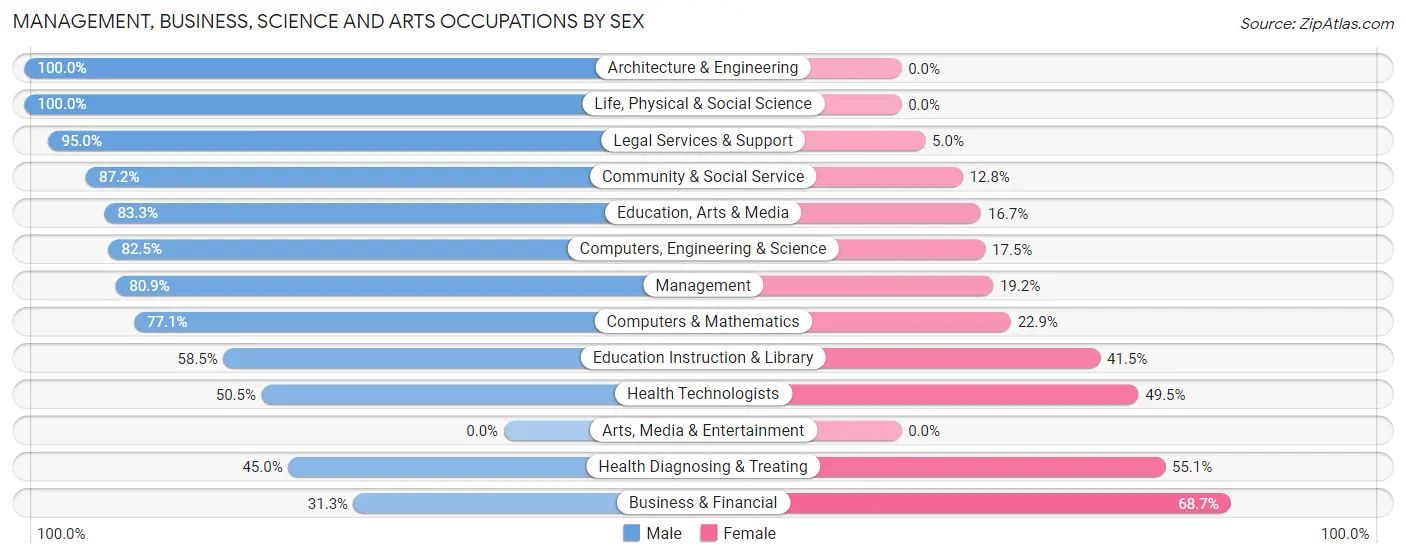
Within the Management, Business, Science and Arts occupations in Woodside, the most male-oriented occupations are Architecture & Engineering (100.0%), Life, Physical & Social Science (100.0%), and Legal Services & Support (95.0%), while the most female-oriented occupations are Business & Financial (68.7%), Health Diagnosing & Treating (55.0%), and Health Technologists (49.5%).
| Occupation | Male | Female |
| Management | 114 (80.8%) | 27 (19.2%) |
| Business & Financial | 31 (31.3%) | 68 (68.7%) |
| Computers, Engineering & Science | 113 (82.5%) | 24 (17.5%) |
| Computers & Mathematics | 81 (77.1%) | 24 (22.9%) |
| Architecture & Engineering | 23 (100.0%) | 0 (0.0%) |
| Life, Physical & Social Science | 9 (100.0%) | 0 (0.0%) |
| Community & Social Service | 231 (87.2%) | 34 (12.8%) |
| Education, Arts & Media | 10 (83.3%) | 2 (16.7%) |
| Legal Services & Support | 190 (95.0%) | 10 (5.0%) |
| Education Instruction & Library | 31 (58.5%) | 22 (41.5%) |
| Arts, Media & Entertainment | 0 (0.0%) | 0 (0.0%) |
| Health Diagnosing & Treating | 49 (45.0%) | 60 (55.0%) |
| Health Technologists | 49 (50.5%) | 48 (49.5%) |
| Total (Category) | 538 (71.6%) | 213 (28.4%) |
| Total (Overall) | 729 (61.5%) | 456 (38.5%) |
Services Occupations
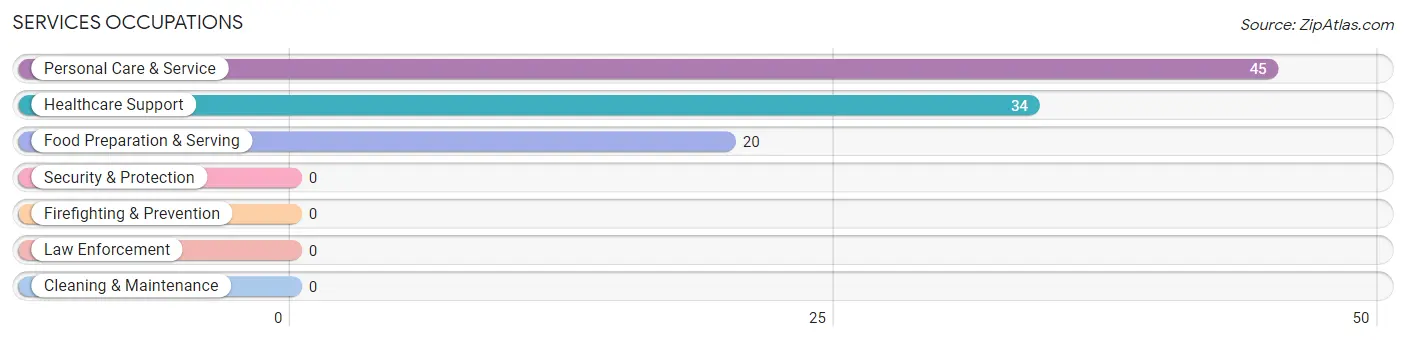
The most common Services occupations in Woodside are Personal Care & Service (45 | 3.8%), Healthcare Support (34 | 2.9%), and Food Preparation & Serving (20 | 1.7%).
Services Occupations by Sex
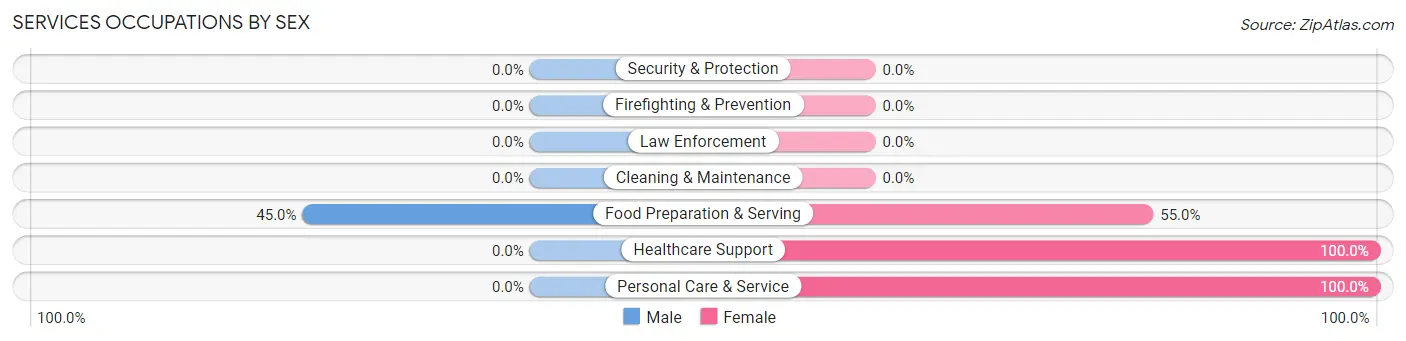
| Occupation | Male | Female |
| Healthcare Support | 0 (0.0%) | 34 (100.0%) |
| Security & Protection | 0 (0.0%) | 0 (0.0%) |
| Firefighting & Prevention | 0 (0.0%) | 0 (0.0%) |
| Law Enforcement | 0 (0.0%) | 0 (0.0%) |
| Food Preparation & Serving | 9 (45.0%) | 11 (55.0%) |
| Cleaning & Maintenance | 0 (0.0%) | 0 (0.0%) |
| Personal Care & Service | 0 (0.0%) | 45 (100.0%) |
| Total (Category) | 9 (9.1%) | 90 (90.9%) |
| Total (Overall) | 729 (61.5%) | 456 (38.5%) |
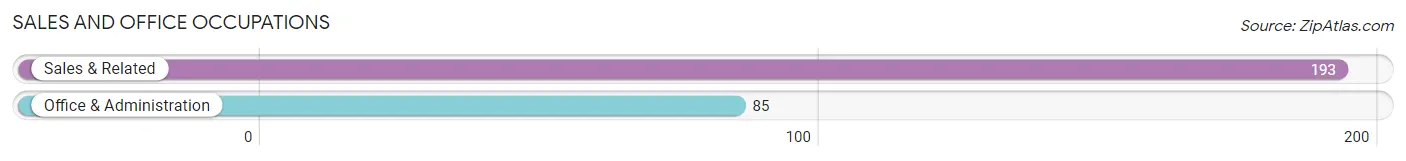
Sales and Office Occupations
The most common Sales and Office occupations in Woodside are Sales & Related (193 | 16.3%), and Office & Administration (85 | 7.2%).
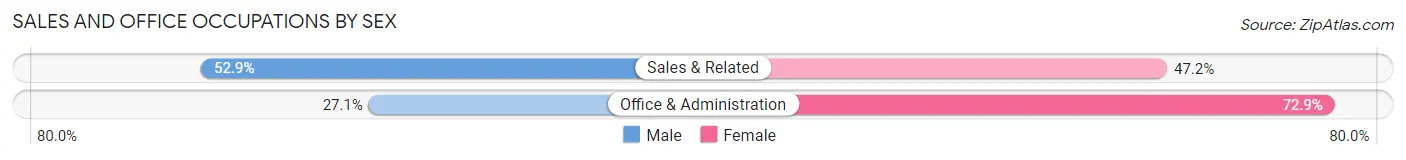
Sales and Office Occupations by Sex
| Occupation | Male | Female |
| Sales & Related | 102 (52.8%) | 91 (47.1%) |
| Office & Administration | 23 (27.1%) | 62 (72.9%) |
| Total (Category) | 125 (45.0%) | 153 (55.0%) |
| Total (Overall) | 729 (61.5%) | 456 (38.5%) |
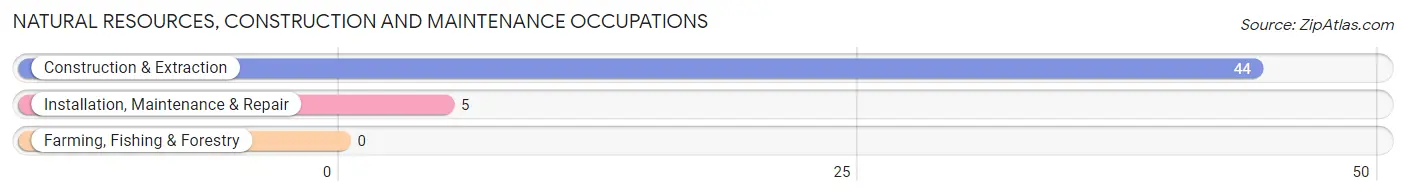
Natural Resources, Construction and Maintenance Occupations
The most common Natural Resources, Construction and Maintenance occupations in Woodside are Construction & Extraction (44 | 3.7%), and Installation, Maintenance & Repair (5 | 0.4%).
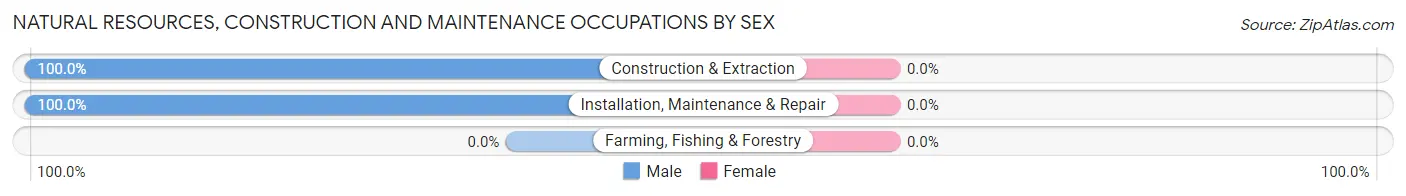
Natural Resources, Construction and Maintenance Occupations by Sex
| Occupation | Male | Female |
| Farming, Fishing & Forestry | 0 (0.0%) | 0 (0.0%) |
| Construction & Extraction | 44 (100.0%) | 0 (0.0%) |
| Installation, Maintenance & Repair | 5 (100.0%) | 0 (0.0%) |
| Total (Category) | 49 (100.0%) | 0 (0.0%) |
| Total (Overall) | 729 (61.5%) | 456 (38.5%) |
Production, Transportation and Moving Occupations
The most common Production, Transportation and Moving occupations in Woodside are , and Transportation (8 | 0.7%).
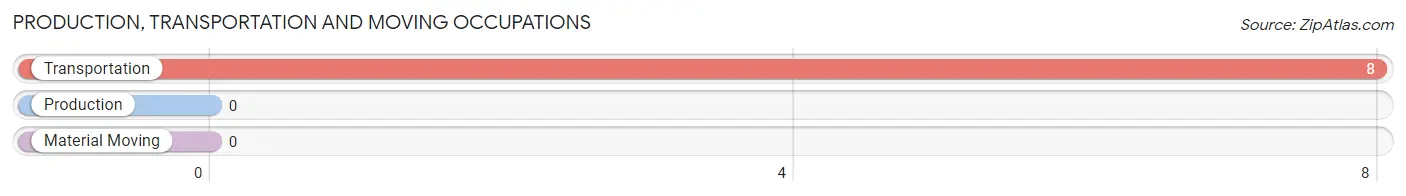
Production, Transportation and Moving Occupations by Sex

| Occupation | Male | Female |
| Production | 0 (0.0%) | 0 (0.0%) |
| Transportation | 8 (100.0%) | 0 (0.0%) |
| Material Moving | 0 (0.0%) | 0 (0.0%) |
| Total (Category) | 8 (100.0%) | 0 (0.0%) |
| Total (Overall) | 729 (61.5%) | 456 (38.5%) |
Employment Industries by Sex in Woodside
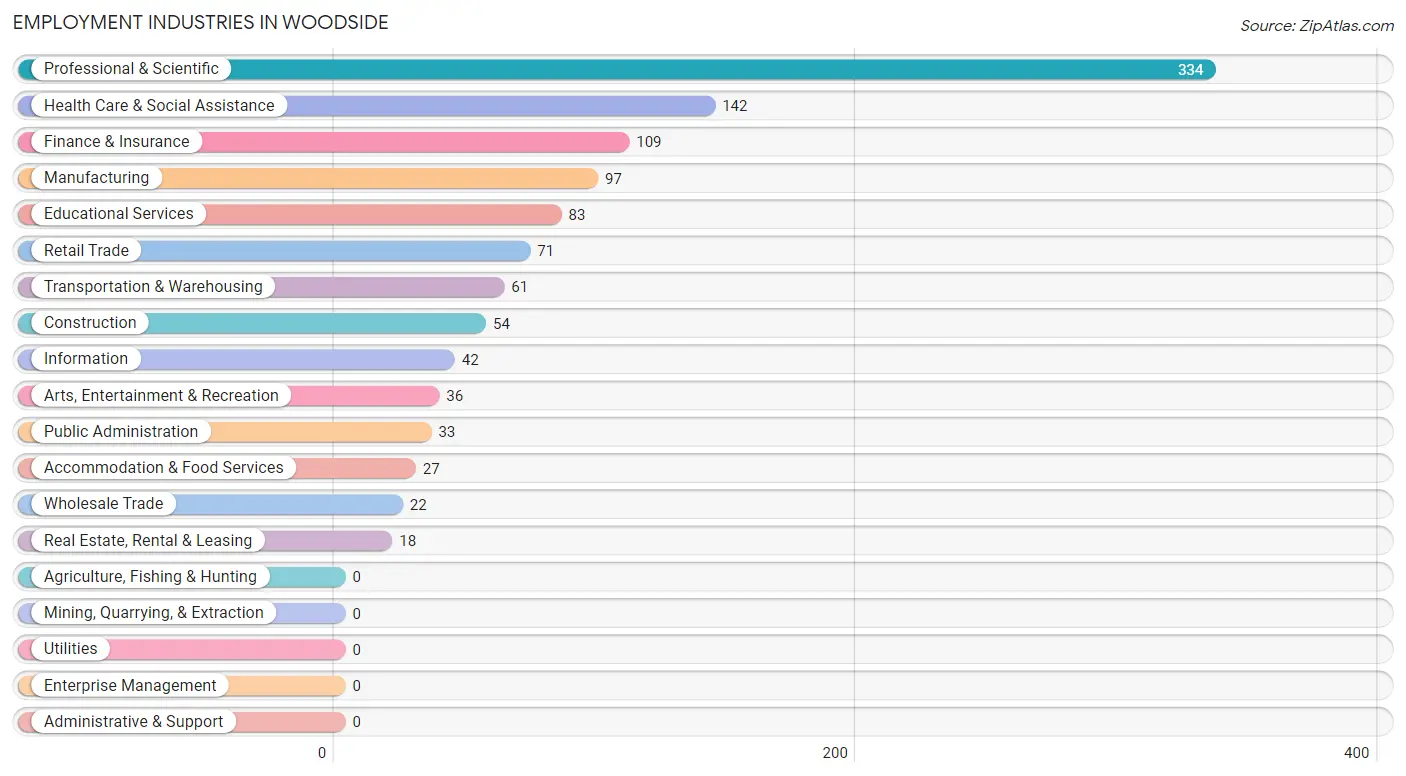
Employment Industries in Woodside
The major employment industries in Woodside include Professional & Scientific (334 | 28.2%), Health Care & Social Assistance (142 | 12.0%), Finance & Insurance (109 | 9.2%), Manufacturing (97 | 8.2%), and Educational Services (83 | 7.0%).
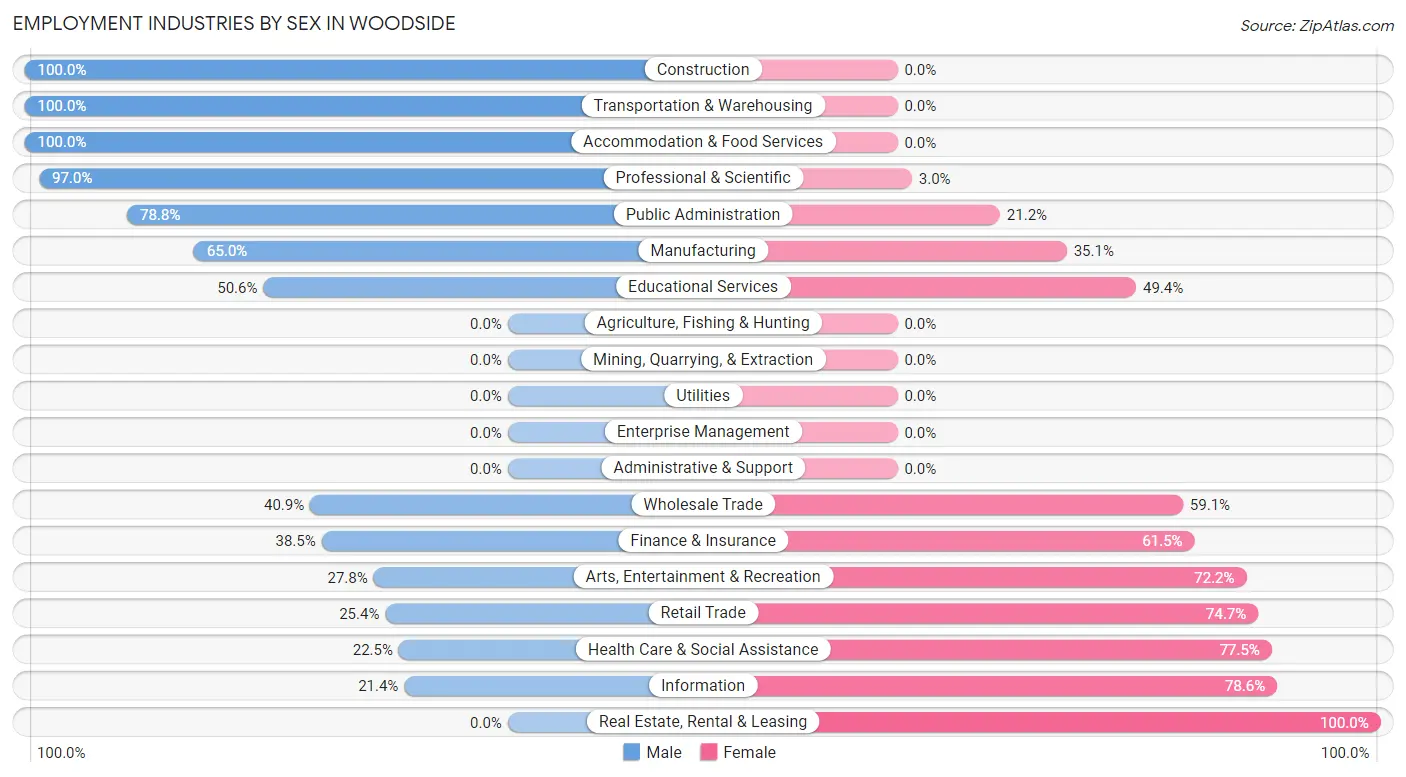
Employment Industries by Sex in Woodside
The Woodside industries that see more men than women are Construction (100.0%), Transportation & Warehousing (100.0%), and Accommodation & Food Services (100.0%), whereas the industries that tend to have a higher number of women are Real Estate, Rental & Leasing (100.0%), Information (78.6%), and Health Care & Social Assistance (77.5%).
| Industry | Male | Female |
| Agriculture, Fishing & Hunting | 0 (0.0%) | 0 (0.0%) |
| Mining, Quarrying, & Extraction | 0 (0.0%) | 0 (0.0%) |
| Construction | 54 (100.0%) | 0 (0.0%) |
| Manufacturing | 63 (64.9%) | 34 (35.0%) |
| Wholesale Trade | 9 (40.9%) | 13 (59.1%) |
| Retail Trade | 18 (25.4%) | 53 (74.7%) |
| Transportation & Warehousing | 61 (100.0%) | 0 (0.0%) |
| Utilities | 0 (0.0%) | 0 (0.0%) |
| Information | 9 (21.4%) | 33 (78.6%) |
| Finance & Insurance | 42 (38.5%) | 67 (61.5%) |
| Real Estate, Rental & Leasing | 0 (0.0%) | 18 (100.0%) |
| Professional & Scientific | 324 (97.0%) | 10 (3.0%) |
| Enterprise Management | 0 (0.0%) | 0 (0.0%) |
| Administrative & Support | 0 (0.0%) | 0 (0.0%) |
| Educational Services | 42 (50.6%) | 41 (49.4%) |
| Health Care & Social Assistance | 32 (22.5%) | 110 (77.5%) |
| Arts, Entertainment & Recreation | 10 (27.8%) | 26 (72.2%) |
| Accommodation & Food Services | 27 (100.0%) | 0 (0.0%) |
| Public Administration | 26 (78.8%) | 7 (21.2%) |
| Total | 729 (61.5%) | 456 (38.5%) |
Education in Woodside
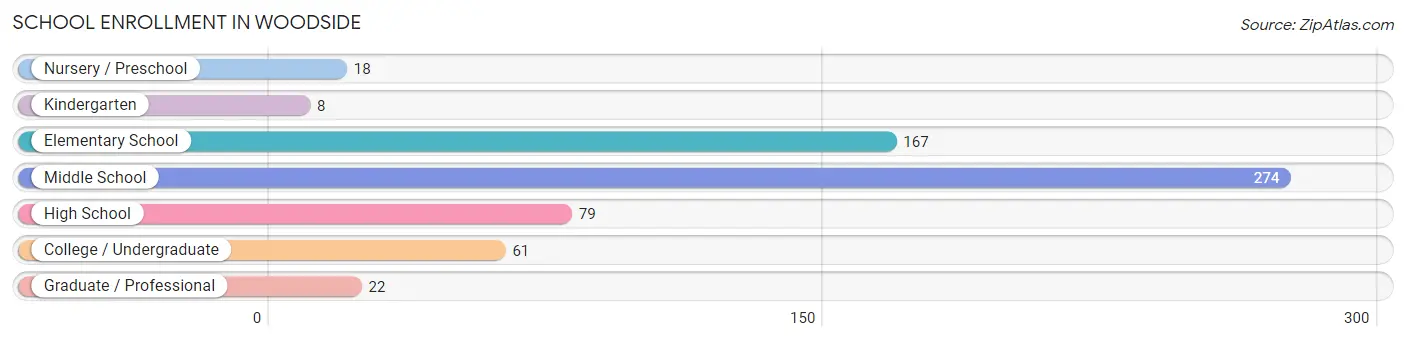
School Enrollment in Woodside
The most common levels of schooling among the 629 students in Woodside are middle school (274 | 43.6%), elementary school (167 | 26.6%), and high school (79 | 12.6%).
| School Level | # Students | % Students |
| Nursery / Preschool | 18 | 2.9% |
| Kindergarten | 8 | 1.3% |
| Elementary School | 167 | 26.6% |
| Middle School | 274 | 43.6% |
| High School | 79 | 12.6% |
| College / Undergraduate | 61 | 9.7% |
| Graduate / Professional | 22 | 3.5% |
| Total | 629 | 100.0% |
School Enrollment by Age by Funding Source in Woodside
Out of a total of 629 students who are enrolled in schools in Woodside, 95 (15.1%) attend a private institution, while the remaining 534 (84.9%) are enrolled in public schools. The age group of 3 to 4 year olds has the highest likelihood of being enrolled in private schools, with 18 (100.0% in the age bracket) enrolled. Conversely, the age group of 10 to 14 year olds has the lowest likelihood of being enrolled in a private school, with 306 (100.0% in the age bracket) attending a public institution.
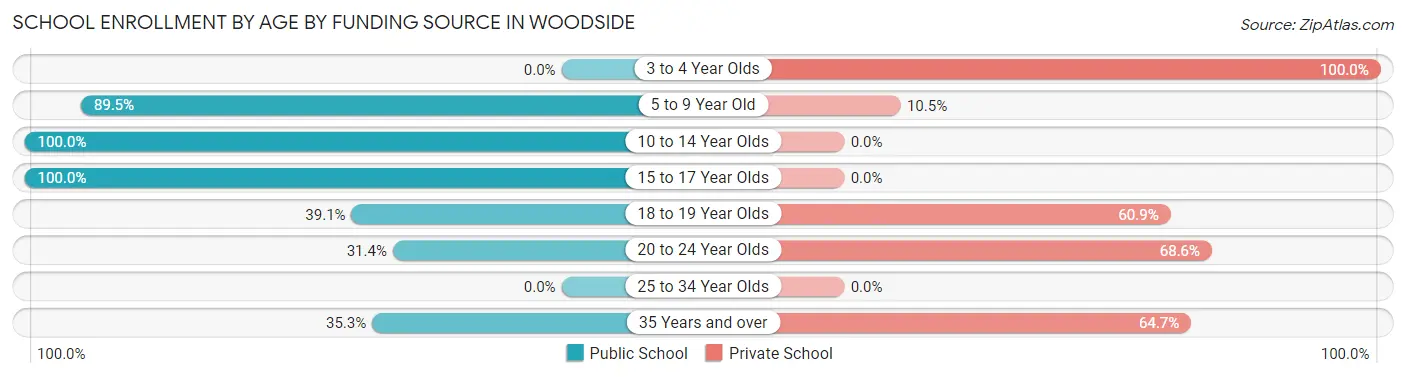
| Age Bracket | Public School | Private School |
| 3 to 4 Year Olds | 0 (0.0%) | 18 (100.0%) |
| 5 to 9 Year Old | 145 (89.5%) | 17 (10.5%) |
| 10 to 14 Year Olds | 306 (100.0%) | 0 (0.0%) |
| 15 to 17 Year Olds | 51 (100.0%) | 0 (0.0%) |
| 18 to 19 Year Olds | 9 (39.1%) | 14 (60.9%) |
| 20 to 24 Year Olds | 11 (31.4%) | 24 (68.6%) |
| 25 to 34 Year Olds | 0 (0.0%) | 0 (0.0%) |
| 35 Years and over | 12 (35.3%) | 22 (64.7%) |
| Total | 534 (84.9%) | 95 (15.1%) |
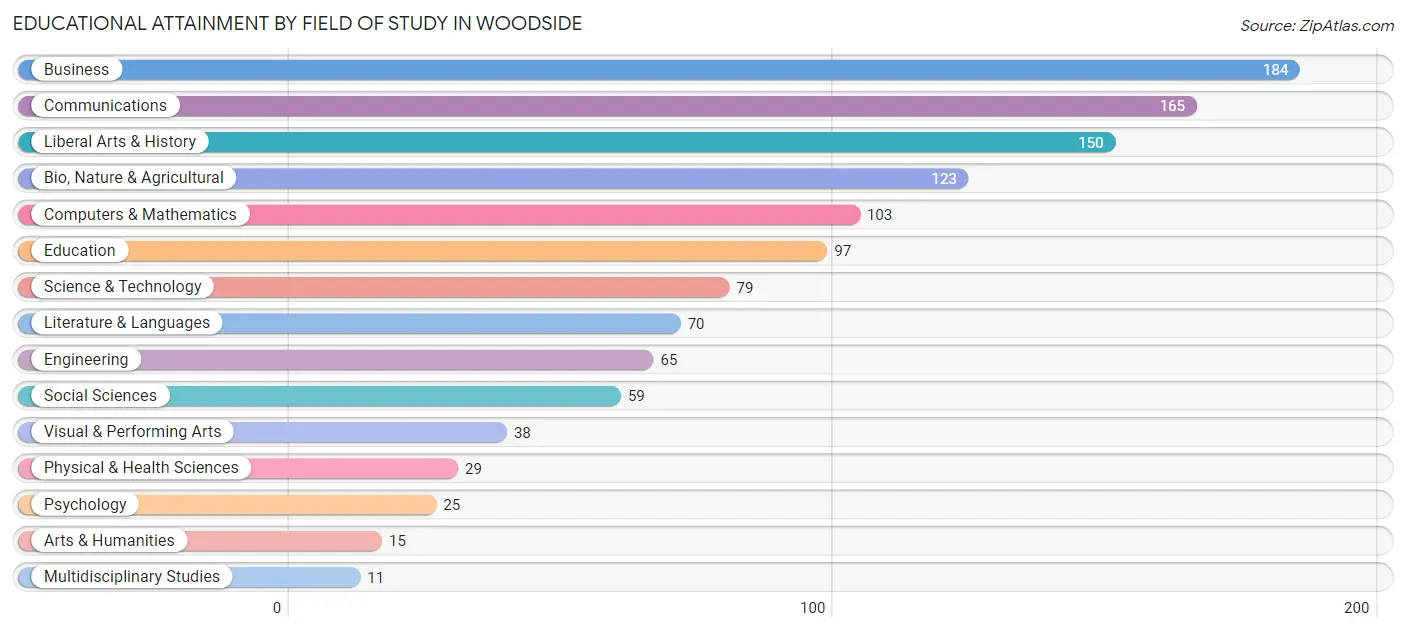
Educational Attainment by Field of Study in Woodside
Business (184 | 15.2%), communications (165 | 13.6%), liberal arts & history (150 | 12.4%), bio, nature & agricultural (123 | 10.1%), and computers & mathematics (103 | 8.5%) are the most common fields of study among 1,213 individuals in Woodside who have obtained a bachelor's degree or higher.
| Field of Study | # Graduates | % Graduates |
| Computers & Mathematics | 103 | 8.5% |
| Bio, Nature & Agricultural | 123 | 10.1% |
| Physical & Health Sciences | 29 | 2.4% |
| Psychology | 25 | 2.1% |
| Social Sciences | 59 | 4.9% |
| Engineering | 65 | 5.4% |
| Multidisciplinary Studies | 11 | 0.9% |
| Science & Technology | 79 | 6.5% |
| Business | 184 | 15.2% |
| Education | 97 | 8.0% |
| Literature & Languages | 70 | 5.8% |
| Liberal Arts & History | 150 | 12.4% |
| Visual & Performing Arts | 38 | 3.1% |
| Communications | 165 | 13.6% |
| Arts & Humanities | 15 | 1.2% |
| Total | 1,213 | 100.0% |
Transportation & Commute in Woodside
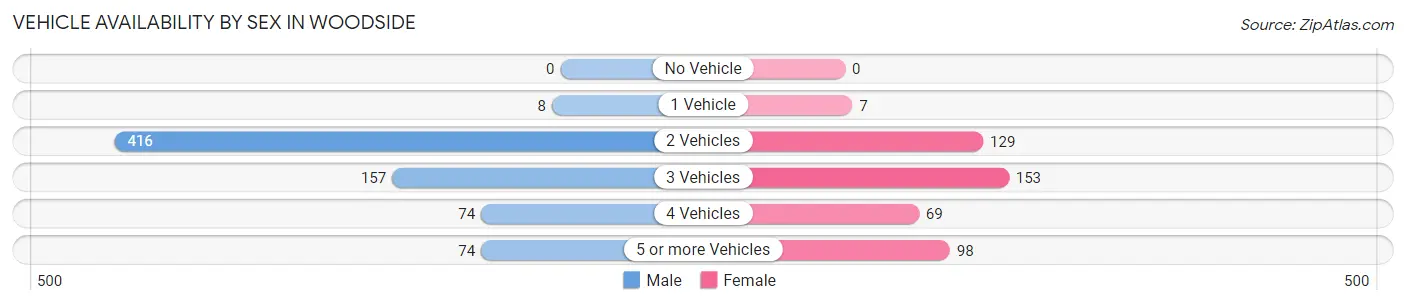
Vehicle Availability by Sex in Woodside
The most prevalent vehicle ownership categories in Woodside are males with 2 vehicles (416, accounting for 57.1%) and females with 2 vehicles (129, making up 91.2%).
| Vehicles Available | Male | Female |
| No Vehicle | 0 (0.0%) | 0 (0.0%) |
| 1 Vehicle | 8 (1.1%) | 7 (1.5%) |
| 2 Vehicles | 416 (57.1%) | 129 (28.3%) |
| 3 Vehicles | 157 (21.5%) | 153 (33.6%) |
| 4 Vehicles | 74 (10.2%) | 69 (15.1%) |
| 5 or more Vehicles | 74 (10.2%) | 98 (21.5%) |
| Total | 729 (100.0%) | 456 (100.0%) |
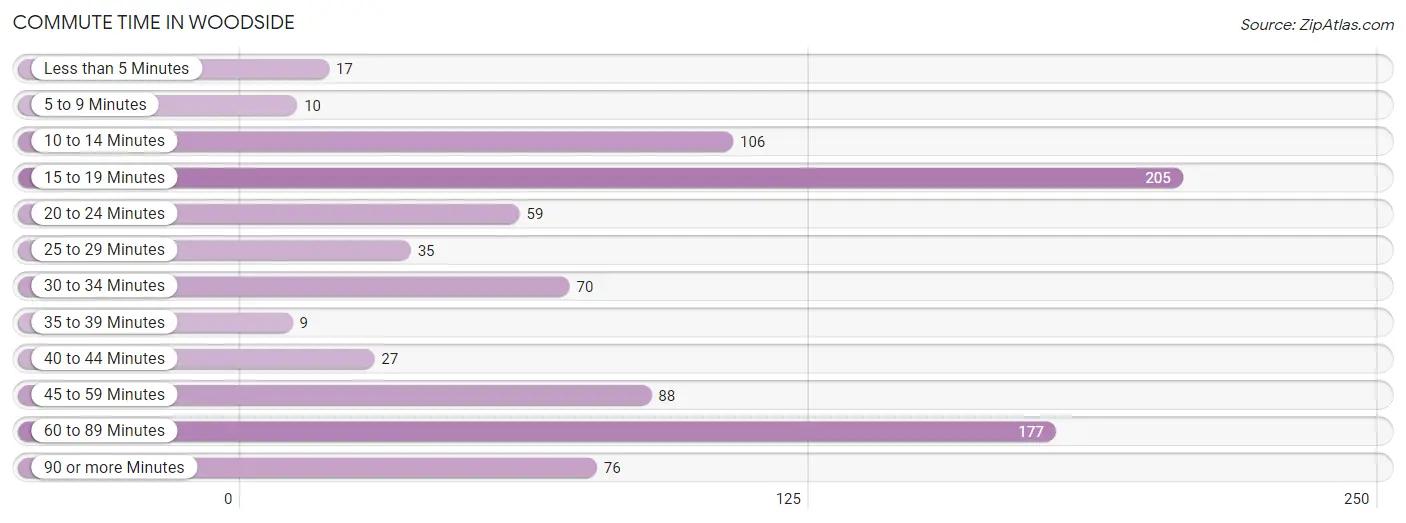
Commute Time in Woodside
The most frequently occuring commute durations in Woodside are 15 to 19 minutes (205 commuters, 23.3%), 60 to 89 minutes (177 commuters, 20.1%), and 10 to 14 minutes (106 commuters, 12.1%).
| Commute Time | # Commuters | % Commuters |
| Less than 5 Minutes | 17 | 1.9% |
| 5 to 9 Minutes | 10 | 1.1% |
| 10 to 14 Minutes | 106 | 12.1% |
| 15 to 19 Minutes | 205 | 23.3% |
| 20 to 24 Minutes | 59 | 6.7% |
| 25 to 29 Minutes | 35 | 4.0% |
| 30 to 34 Minutes | 70 | 8.0% |
| 35 to 39 Minutes | 9 | 1.0% |
| 40 to 44 Minutes | 27 | 3.1% |
| 45 to 59 Minutes | 88 | 10.0% |
| 60 to 89 Minutes | 177 | 20.1% |
| 90 or more Minutes | 76 | 8.6% |
Commute Time by Sex in Woodside
The most common commute times in Woodside are 60 to 89 minutes (104 commuters, 22.8%) for males and 15 to 19 minutes (122 commuters, 28.8%) for females.
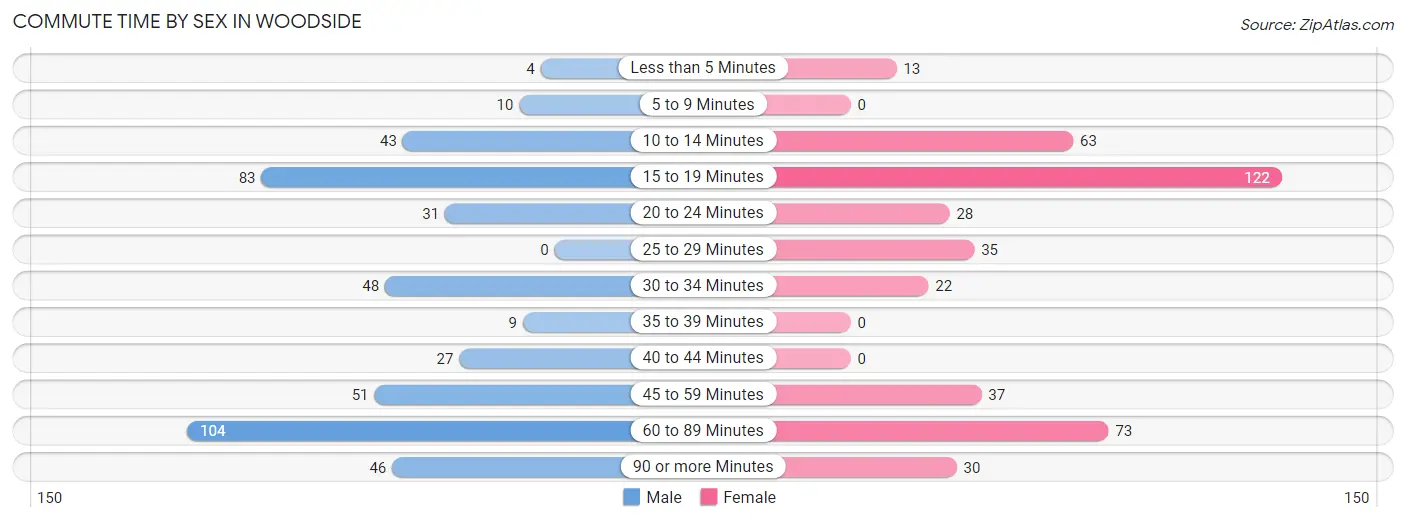
| Commute Time | Male | Female |
| Less than 5 Minutes | 4 (0.9%) | 13 (3.1%) |
| 5 to 9 Minutes | 10 (2.2%) | 0 (0.0%) |
| 10 to 14 Minutes | 43 (9.4%) | 63 (14.9%) |
| 15 to 19 Minutes | 83 (18.2%) | 122 (28.8%) |
| 20 to 24 Minutes | 31 (6.8%) | 28 (6.6%) |
| 25 to 29 Minutes | 0 (0.0%) | 35 (8.3%) |
| 30 to 34 Minutes | 48 (10.5%) | 22 (5.2%) |
| 35 to 39 Minutes | 9 (2.0%) | 0 (0.0%) |
| 40 to 44 Minutes | 27 (5.9%) | 0 (0.0%) |
| 45 to 59 Minutes | 51 (11.2%) | 37 (8.7%) |
| 60 to 89 Minutes | 104 (22.8%) | 73 (17.3%) |
| 90 or more Minutes | 46 (10.1%) | 30 (7.1%) |
Time of Departure to Work by Sex in Woodside
The most frequent times of departure to work in Woodside are 7:00 AM to 7:29 AM (100, 21.9%) for males and 7:30 AM to 7:59 AM (102, 24.1%) for females.
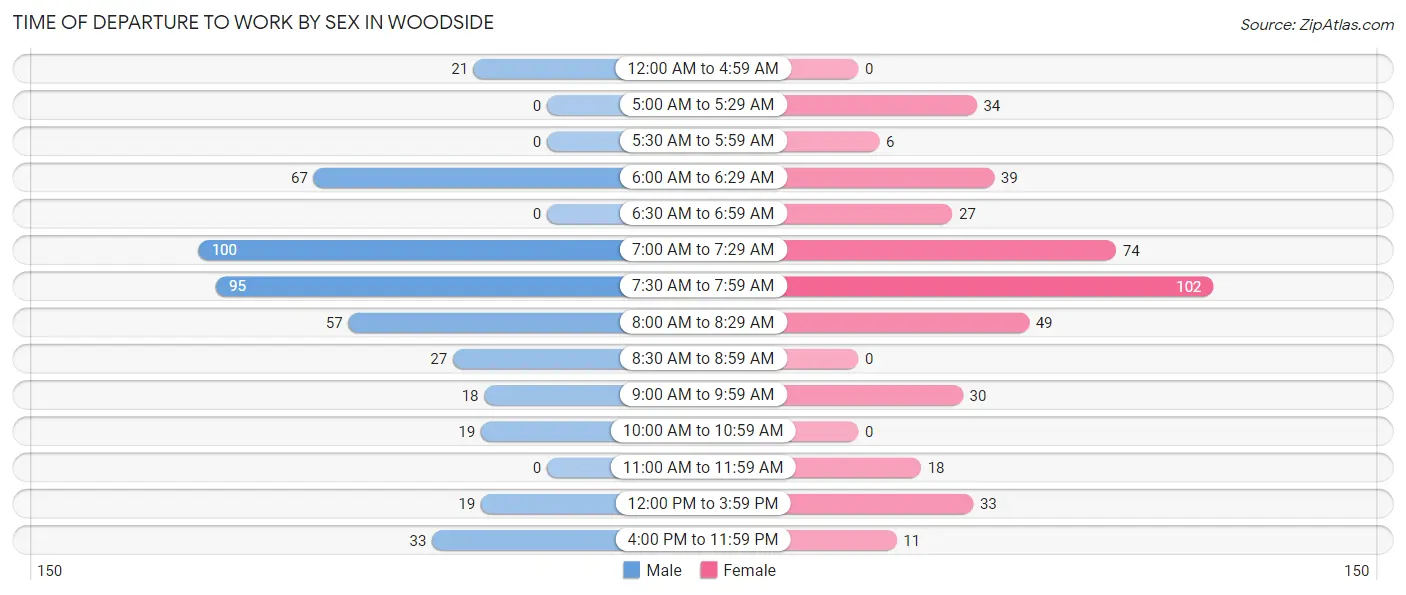
| Time of Departure | Male | Female |
| 12:00 AM to 4:59 AM | 21 (4.6%) | 0 (0.0%) |
| 5:00 AM to 5:29 AM | 0 (0.0%) | 34 (8.0%) |
| 5:30 AM to 5:59 AM | 0 (0.0%) | 6 (1.4%) |
| 6:00 AM to 6:29 AM | 67 (14.7%) | 39 (9.2%) |
| 6:30 AM to 6:59 AM | 0 (0.0%) | 27 (6.4%) |
| 7:00 AM to 7:29 AM | 100 (21.9%) | 74 (17.5%) |
| 7:30 AM to 7:59 AM | 95 (20.8%) | 102 (24.1%) |
| 8:00 AM to 8:29 AM | 57 (12.5%) | 49 (11.6%) |
| 8:30 AM to 8:59 AM | 27 (5.9%) | 0 (0.0%) |
| 9:00 AM to 9:59 AM | 18 (4.0%) | 30 (7.1%) |
| 10:00 AM to 10:59 AM | 19 (4.2%) | 0 (0.0%) |
| 11:00 AM to 11:59 AM | 0 (0.0%) | 18 (4.3%) |
| 12:00 PM to 3:59 PM | 19 (4.2%) | 33 (7.8%) |
| 4:00 PM to 11:59 PM | 33 (7.2%) | 11 (2.6%) |
| Total | 456 (100.0%) | 423 (100.0%) |
Housing Occupancy in Woodside
Occupancy by Ownership in Woodside
Of the total 832 dwellings in Woodside, owner-occupied units account for 827 (99.4%), while renter-occupied units make up 5 (0.6%).
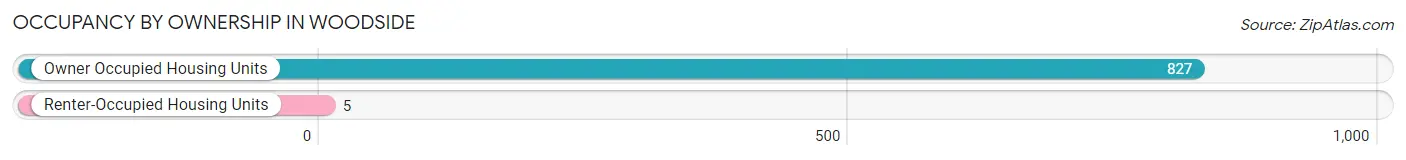
| Occupancy | # Housing Units | % Housing Units |
| Owner Occupied Housing Units | 827 | 99.4% |
| Renter-Occupied Housing Units | 5 | 0.6% |
| Total Occupied Housing Units | 832 | 100.0% |
Occupancy by Household Size in Woodside
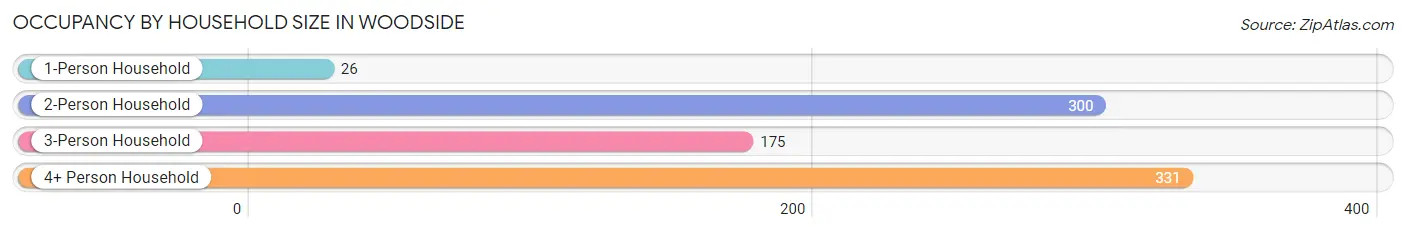
| Household Size | # Housing Units | % Housing Units |
| 1-Person Household | 26 | 3.1% |
| 2-Person Household | 300 | 36.1% |
| 3-Person Household | 175 | 21.0% |
| 4+ Person Household | 331 | 39.8% |
| Total Housing Units | 832 | 100.0% |
Occupancy by Ownership by Household Size in Woodside
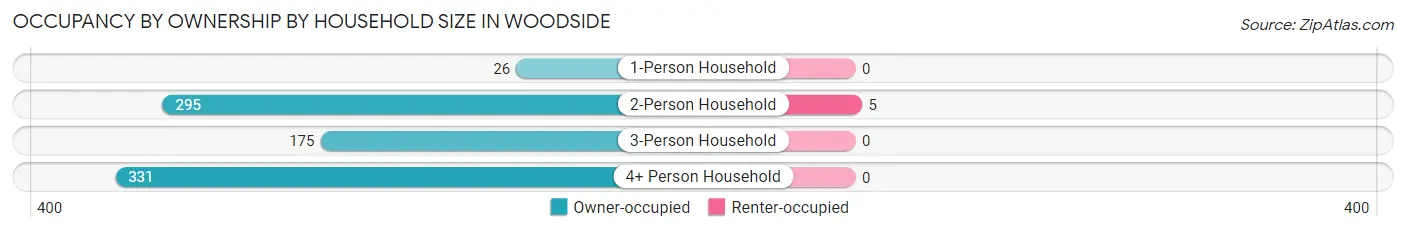
| Household Size | Owner-occupied | Renter-occupied |
| 1-Person Household | 26 (100.0%) | 0 (0.0%) |
| 2-Person Household | 295 (98.3%) | 5 (1.7%) |
| 3-Person Household | 175 (100.0%) | 0 (0.0%) |
| 4+ Person Household | 331 (100.0%) | 0 (0.0%) |
| Total Housing Units | 827 (99.4%) | 5 (0.6%) |
Occupancy by Educational Attainment in Woodside
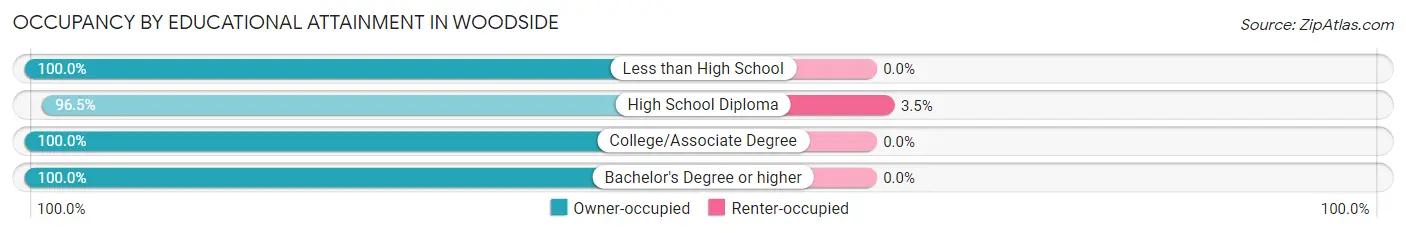
| Household Size | Owner-occupied | Renter-occupied |
| Less than High School | 9 (100.0%) | 0 (0.0%) |
| High School Diploma | 137 (96.5%) | 5 (3.5%) |
| College/Associate Degree | 123 (100.0%) | 0 (0.0%) |
| Bachelor's Degree or higher | 558 (100.0%) | 0 (0.0%) |
Occupancy by Age of Householder in Woodside
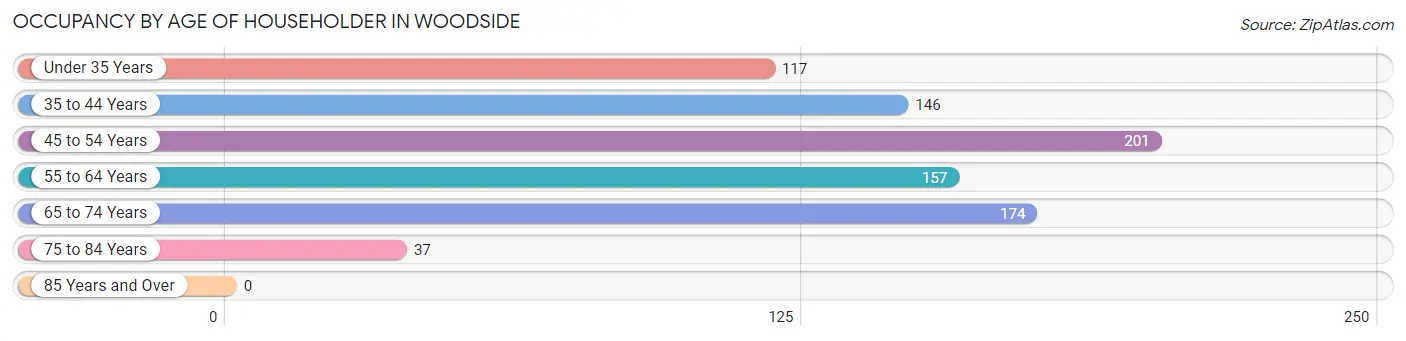
| Age Bracket | # Households | % Households |
| Under 35 Years | 117 | 14.1% |
| 35 to 44 Years | 146 | 17.5% |
| 45 to 54 Years | 201 | 24.2% |
| 55 to 64 Years | 157 | 18.9% |
| 65 to 74 Years | 174 | 20.9% |
| 75 to 84 Years | 37 | 4.4% |
| 85 Years and Over | 0 | 0.0% |
| Total | 832 | 100.0% |
Housing Finances in Woodside
Median Income by Occupancy in Woodside
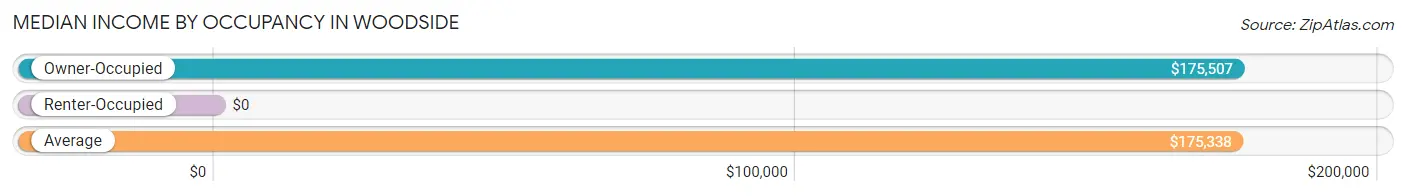
| Occupancy Type | # Households | Median Income |
| Owner-Occupied | 827 (99.4%) | $175,507 |
| Renter-Occupied | 5 (0.6%) | $0 |
| Average | 832 (100.0%) | $175,338 |
Occupancy by Householder Income Bracket in Woodside
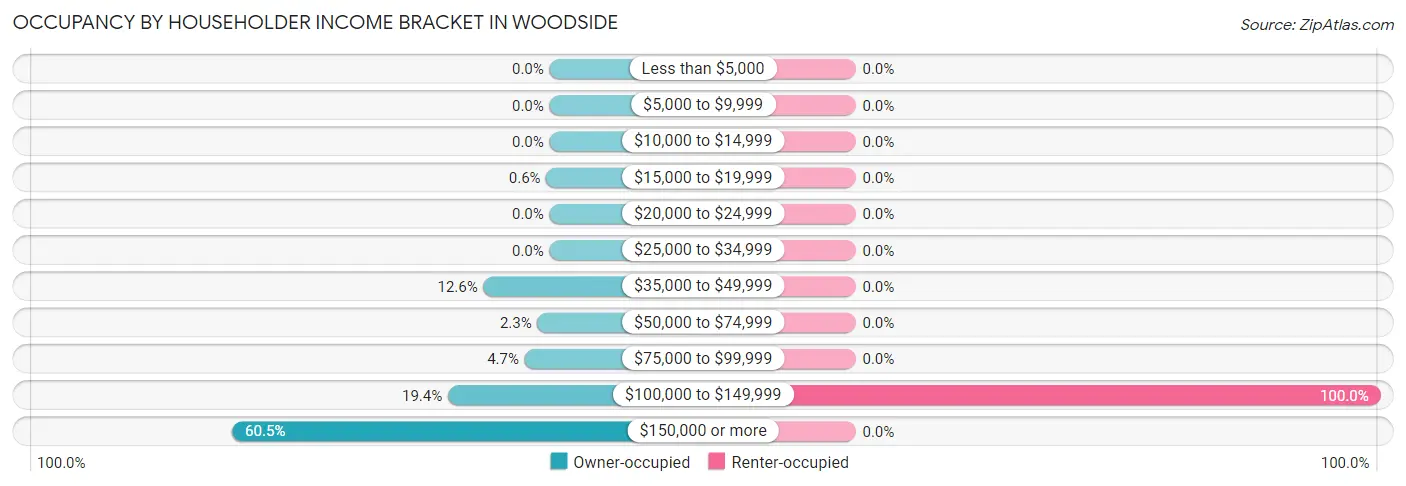
| Income Bracket | Owner-occupied | Renter-occupied |
| Less than $5,000 | 0 (0.0%) | 0 (0.0%) |
| $5,000 to $9,999 | 0 (0.0%) | 0 (0.0%) |
| $10,000 to $14,999 | 0 (0.0%) | 0 (0.0%) |
| $15,000 to $19,999 | 5 (0.6%) | 0 (0.0%) |
| $20,000 to $24,999 | 0 (0.0%) | 0 (0.0%) |
| $25,000 to $34,999 | 0 (0.0%) | 0 (0.0%) |
| $35,000 to $49,999 | 104 (12.6%) | 0 (0.0%) |
| $50,000 to $74,999 | 19 (2.3%) | 0 (0.0%) |
| $75,000 to $99,999 | 39 (4.7%) | 0 (0.0%) |
| $100,000 to $149,999 | 160 (19.4%) | 5 (100.0%) |
| $150,000 or more | 500 (60.5%) | 0 (0.0%) |
| Total | 827 (100.0%) | 5 (100.0%) |
Monthly Housing Cost Tiers in Woodside
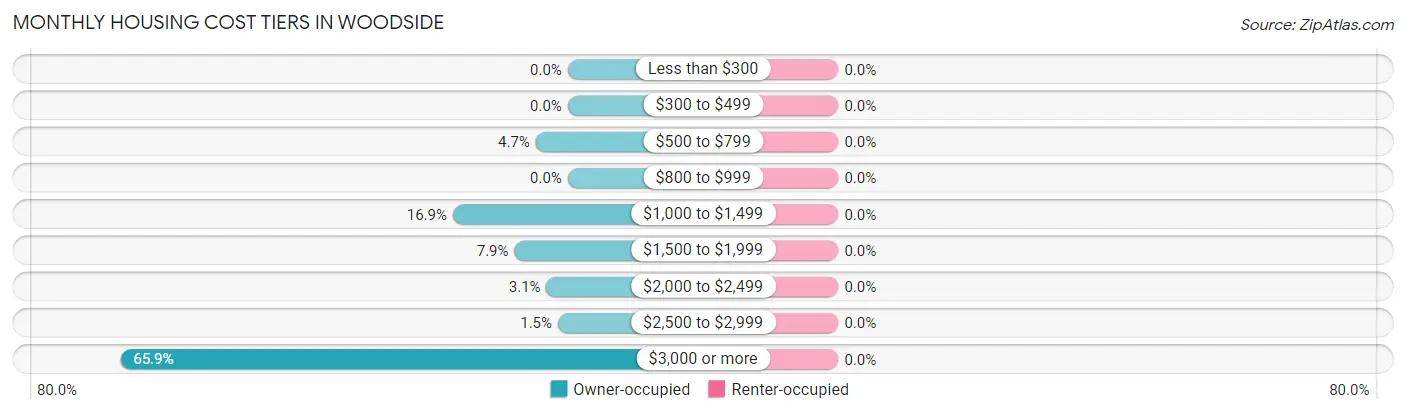
| Monthly Cost | Owner-occupied | Renter-occupied |
| Less than $300 | 0 (0.0%) | 0 (0.0%) |
| $300 to $499 | 0 (0.0%) | 0 (0.0%) |
| $500 to $799 | 39 (4.7%) | 0 (0.0%) |
| $800 to $999 | 0 (0.0%) | 0 (0.0%) |
| $1,000 to $1,499 | 140 (16.9%) | 0 (0.0%) |
| $1,500 to $1,999 | 65 (7.9%) | 0 (0.0%) |
| $2,000 to $2,499 | 26 (3.1%) | 0 (0.0%) |
| $2,500 to $2,999 | 12 (1.5%) | 0 (0.0%) |
| $3,000 or more | 545 (65.9%) | 0 (0.0%) |
| Total | 827 (100.0%) | 5 (100.0%) |
Physical Housing Characteristics in Woodside
Housing Structures in Woodside
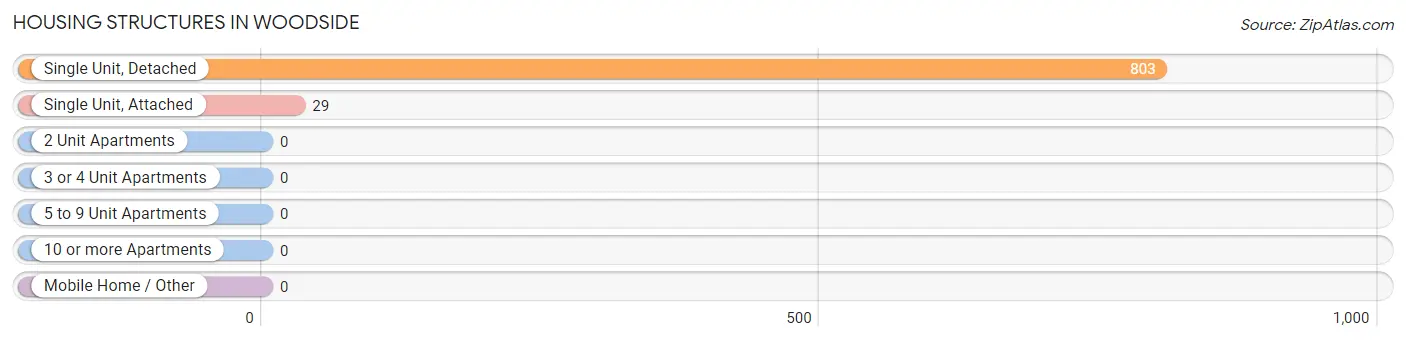
| Structure Type | # Housing Units | % Housing Units |
| Single Unit, Detached | 803 | 96.5% |
| Single Unit, Attached | 29 | 3.5% |
| 2 Unit Apartments | 0 | 0.0% |
| 3 or 4 Unit Apartments | 0 | 0.0% |
| 5 to 9 Unit Apartments | 0 | 0.0% |
| 10 or more Apartments | 0 | 0.0% |
| Mobile Home / Other | 0 | 0.0% |
| Total | 832 | 100.0% |
Housing Structures by Occupancy in Woodside
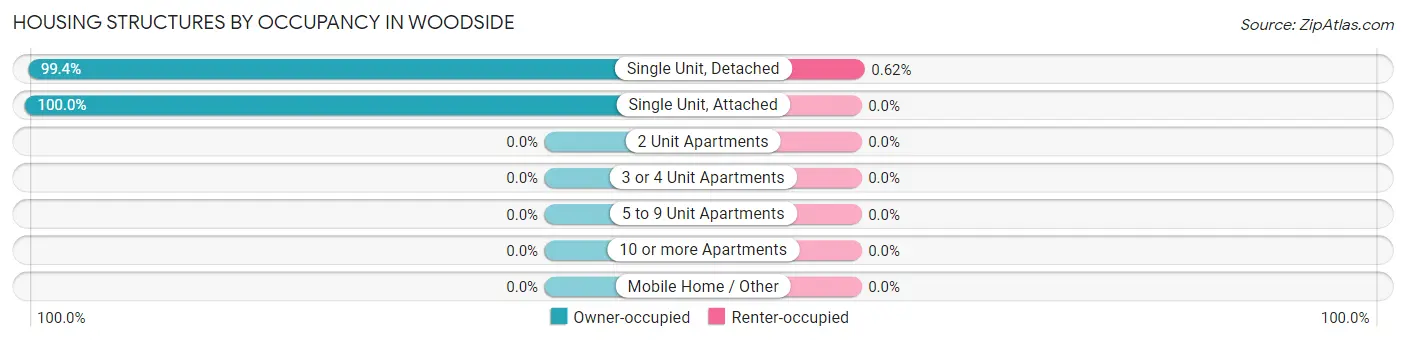
| Structure Type | Owner-occupied | Renter-occupied |
| Single Unit, Detached | 798 (99.4%) | 5 (0.6%) |
| Single Unit, Attached | 29 (100.0%) | 0 (0.0%) |
| 2 Unit Apartments | 0 (0.0%) | 0 (0.0%) |
| 3 or 4 Unit Apartments | 0 (0.0%) | 0 (0.0%) |
| 5 to 9 Unit Apartments | 0 (0.0%) | 0 (0.0%) |
| 10 or more Apartments | 0 (0.0%) | 0 (0.0%) |
| Mobile Home / Other | 0 (0.0%) | 0 (0.0%) |
| Total | 827 (99.4%) | 5 (0.6%) |
Housing Structures by Number of Rooms in Woodside
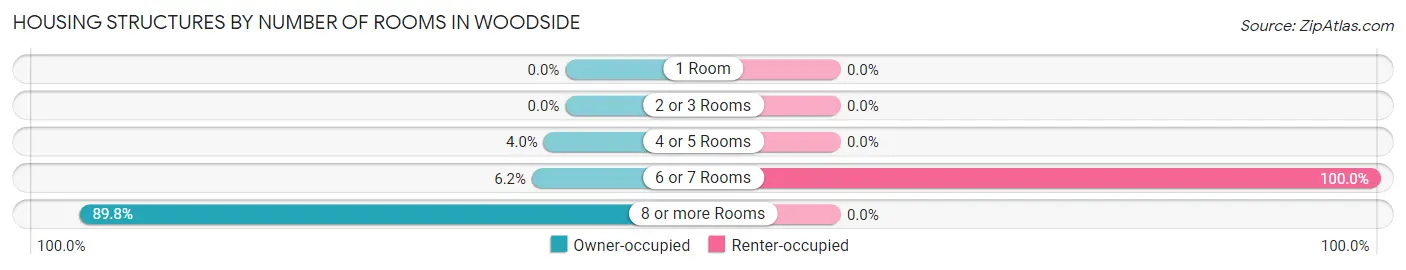
| Number of Rooms | Owner-occupied | Renter-occupied |
| 1 Room | 0 (0.0%) | 0 (0.0%) |
| 2 or 3 Rooms | 0 (0.0%) | 0 (0.0%) |
| 4 or 5 Rooms | 33 (4.0%) | 0 (0.0%) |
| 6 or 7 Rooms | 51 (6.2%) | 5 (100.0%) |
| 8 or more Rooms | 743 (89.8%) | 0 (0.0%) |
| Total | 827 (100.0%) | 5 (100.0%) |
Housing Structure by Heating Type in Woodside
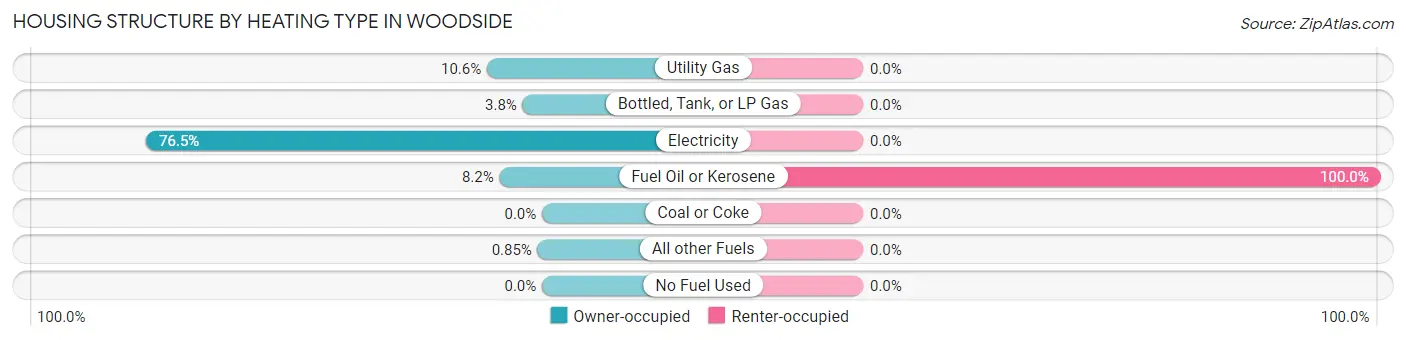
| Heating Type | Owner-occupied | Renter-occupied |
| Utility Gas | 88 (10.6%) | 0 (0.0%) |
| Bottled, Tank, or LP Gas | 31 (3.7%) | 0 (0.0%) |
| Electricity | 633 (76.5%) | 0 (0.0%) |
| Fuel Oil or Kerosene | 68 (8.2%) | 5 (100.0%) |
| Coal or Coke | 0 (0.0%) | 0 (0.0%) |
| All other Fuels | 7 (0.9%) | 0 (0.0%) |
| No Fuel Used | 0 (0.0%) | 0 (0.0%) |
| Total | 827 (100.0%) | 5 (100.0%) |
Household Vehicle Usage in Woodside
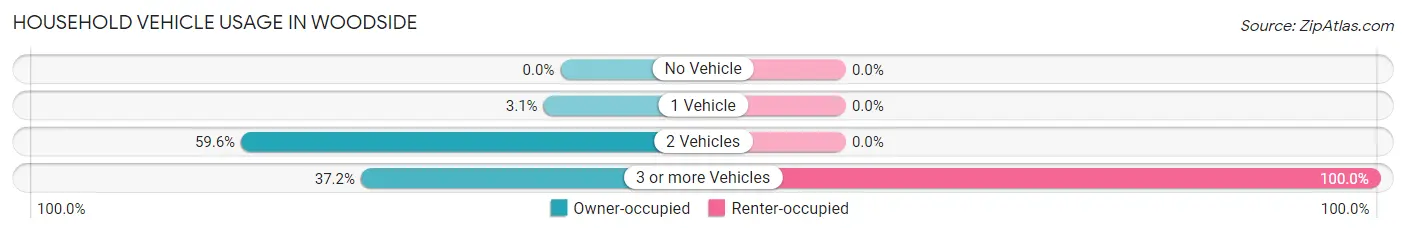
| Vehicles per Household | Owner-occupied | Renter-occupied |
| No Vehicle | 0 (0.0%) | 0 (0.0%) |
| 1 Vehicle | 26 (3.1%) | 0 (0.0%) |
| 2 Vehicles | 493 (59.6%) | 0 (0.0%) |
| 3 or more Vehicles | 308 (37.2%) | 5 (100.0%) |
| Total | 827 (100.0%) | 5 (100.0%) |
Real Estate & Mortgages in Woodside
Real Estate and Mortgage Overview in Woodside
| Characteristic | Without Mortgage | With Mortgage |
| Housing Units | 220 | 607 |
| Median Property Value | $632,500 | $606,500 |
| Median Household Income | $170,455 | $348 |
| Monthly Housing Costs | $1,373 | $545 |
| Real Estate Taxes | $10,001 | $0 |
Property Value by Mortgage Status in Woodside
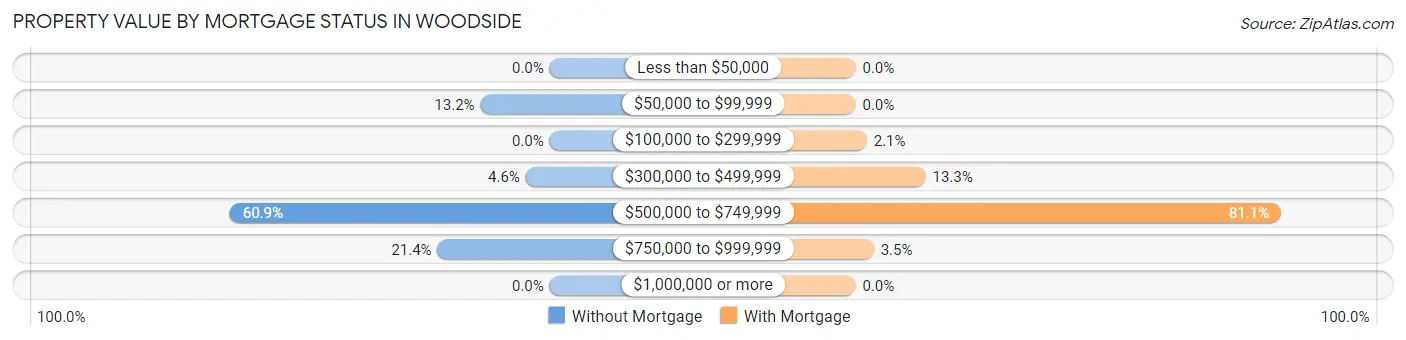
| Property Value | Without Mortgage | With Mortgage |
| Less than $50,000 | 0 (0.0%) | 0 (0.0%) |
| $50,000 to $99,999 | 29 (13.2%) | 0 (0.0%) |
| $100,000 to $299,999 | 0 (0.0%) | 13 (2.1%) |
| $300,000 to $499,999 | 10 (4.5%) | 81 (13.3%) |
| $500,000 to $749,999 | 134 (60.9%) | 492 (81.0%) |
| $750,000 to $999,999 | 47 (21.4%) | 21 (3.5%) |
| $1,000,000 or more | 0 (0.0%) | 0 (0.0%) |
| Total | 220 (100.0%) | 607 (100.0%) |
Household Income by Mortgage Status in Woodside
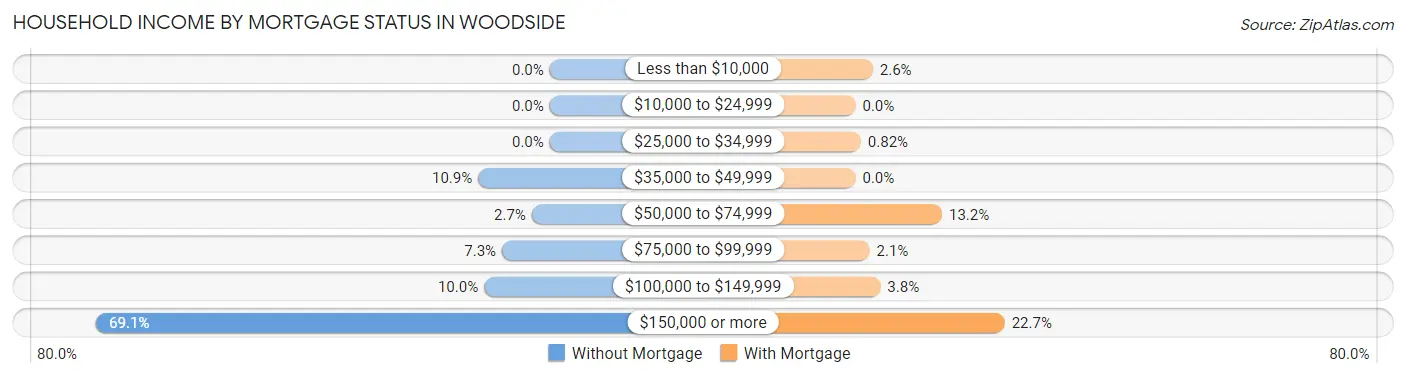
| Household Income | Without Mortgage | With Mortgage |
| Less than $10,000 | 0 (0.0%) | 16 (2.6%) |
| $10,000 to $24,999 | 0 (0.0%) | 0 (0.0%) |
| $25,000 to $34,999 | 0 (0.0%) | 5 (0.8%) |
| $35,000 to $49,999 | 24 (10.9%) | 0 (0.0%) |
| $50,000 to $74,999 | 6 (2.7%) | 80 (13.2%) |
| $75,000 to $99,999 | 16 (7.3%) | 13 (2.1%) |
| $100,000 to $149,999 | 22 (10.0%) | 23 (3.8%) |
| $150,000 or more | 152 (69.1%) | 138 (22.7%) |
| Total | 220 (100.0%) | 607 (100.0%) |
Property Value to Household Income Ratio in Woodside

| Value-to-Income Ratio | Without Mortgage | With Mortgage |
| Less than 2.0x | 29 (13.2%) | 176,473 (29,073.0%) |
| 2.0x to 2.9x | 52 (23.6%) | 94 (15.5%) |
| 3.0x to 3.9x | 60 (27.3%) | 150 (24.7%) |
| 4.0x or more | 79 (35.9%) | 117 (19.3%) |
| Total | 220 (100.0%) | 607 (100.0%) |
Real Estate Taxes by Mortgage Status in Woodside
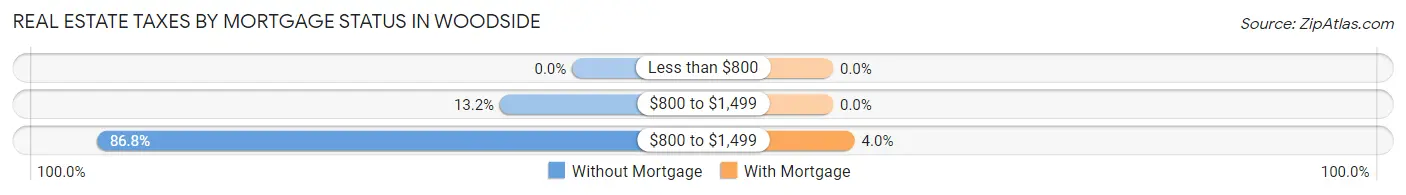
| Property Taxes | Without Mortgage | With Mortgage |
| Less than $800 | 0 (0.0%) | 0 (0.0%) |
| $800 to $1,499 | 29 (13.2%) | 0 (0.0%) |
| $800 to $1,499 | 191 (86.8%) | 24 (4.0%) |
| Total | 220 (100.0%) | 607 (100.0%) |
Health & Disability in Woodside
Health Insurance Coverage by Age in Woodside
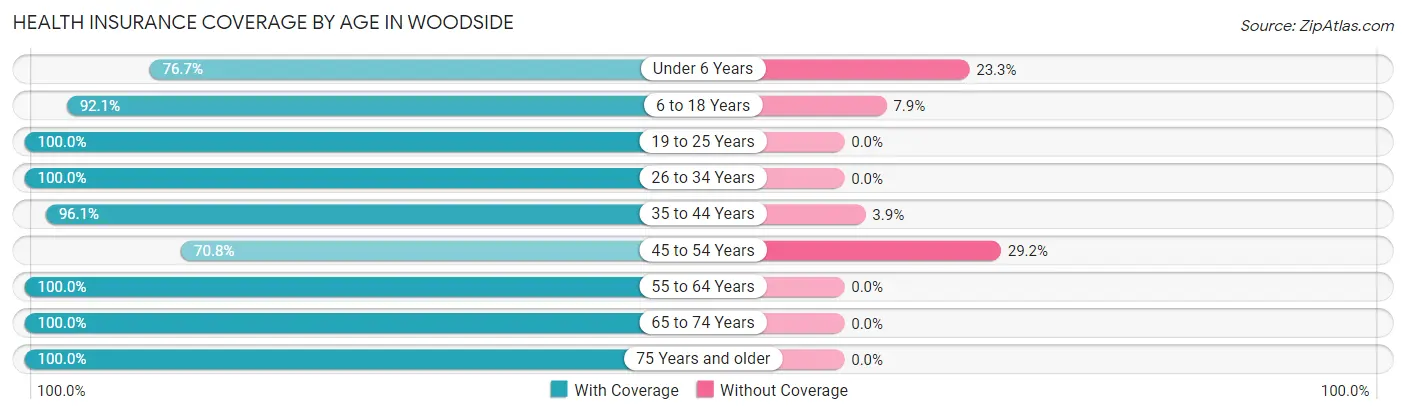
| Age Bracket | With Coverage | Without Coverage |
| Under 6 Years | 102 (76.7%) | 31 (23.3%) |
| 6 to 18 Years | 551 (92.1%) | 47 (7.9%) |
| 19 to 25 Years | 84 (100.0%) | 0 (0.0%) |
| 26 to 34 Years | 320 (100.0%) | 0 (0.0%) |
| 35 to 44 Years | 390 (96.1%) | 16 (3.9%) |
| 45 to 54 Years | 262 (70.8%) | 108 (29.2%) |
| 55 to 64 Years | 281 (100.0%) | 0 (0.0%) |
| 65 to 74 Years | 353 (100.0%) | 0 (0.0%) |
| 75 Years and older | 108 (100.0%) | 0 (0.0%) |
| Total | 2,451 (92.4%) | 202 (7.6%) |
Health Insurance Coverage by Citizenship Status in Woodside
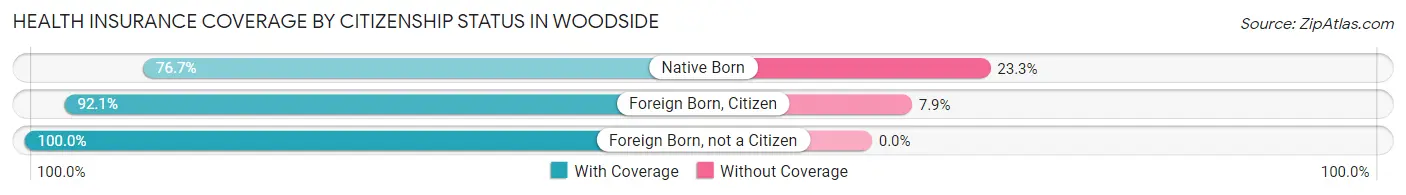
| Citizenship Status | With Coverage | Without Coverage |
| Native Born | 102 (76.7%) | 31 (23.3%) |
| Foreign Born, Citizen | 551 (92.1%) | 47 (7.9%) |
| Foreign Born, not a Citizen | 84 (100.0%) | 0 (0.0%) |
Health Insurance Coverage by Household Income in Woodside
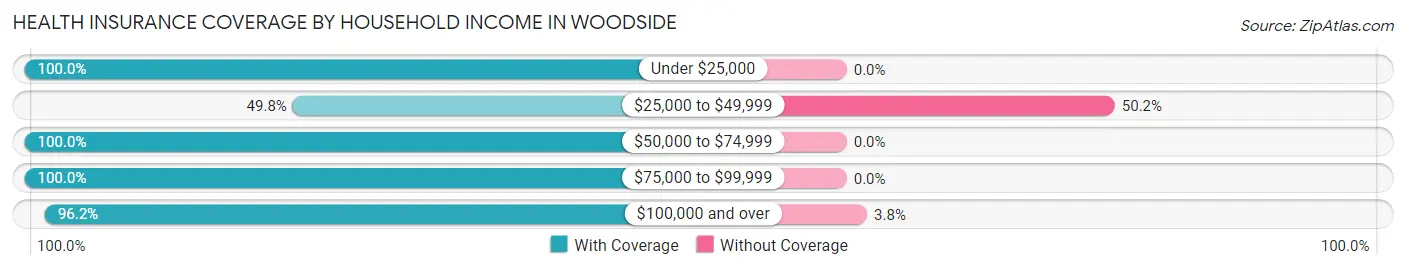
| Household Income | With Coverage | Without Coverage |
| Under $25,000 | 9 (100.0%) | 0 (0.0%) |
| $25,000 to $49,999 | 113 (49.8%) | 114 (50.2%) |
| $50,000 to $74,999 | 24 (100.0%) | 0 (0.0%) |
| $75,000 to $99,999 | 84 (100.0%) | 0 (0.0%) |
| $100,000 and over | 2,221 (96.2%) | 88 (3.8%) |
Public vs Private Health Insurance Coverage by Age in Woodside
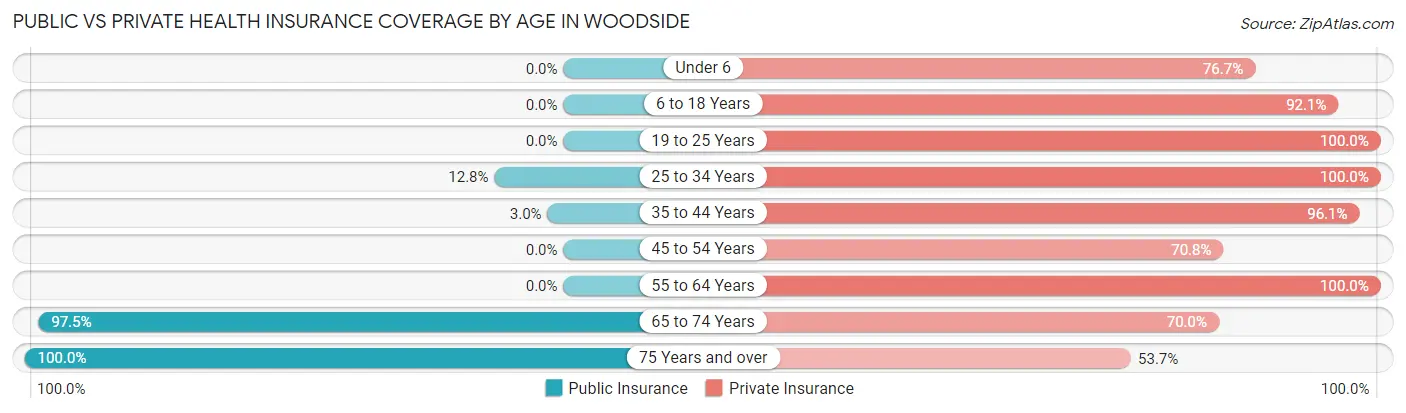
| Age Bracket | Public Insurance | Private Insurance |
| Under 6 | 0 (0.0%) | 102 (76.7%) |
| 6 to 18 Years | 0 (0.0%) | 551 (92.1%) |
| 19 to 25 Years | 0 (0.0%) | 84 (100.0%) |
| 25 to 34 Years | 41 (12.8%) | 320 (100.0%) |
| 35 to 44 Years | 12 (3.0%) | 390 (96.1%) |
| 45 to 54 Years | 0 (0.0%) | 262 (70.8%) |
| 55 to 64 Years | 0 (0.0%) | 281 (100.0%) |
| 65 to 74 Years | 344 (97.5%) | 247 (70.0%) |
| 75 Years and over | 108 (100.0%) | 58 (53.7%) |
| Total | 505 (19.0%) | 2,295 (86.5%) |
Disability Status by Sex by Age in Woodside
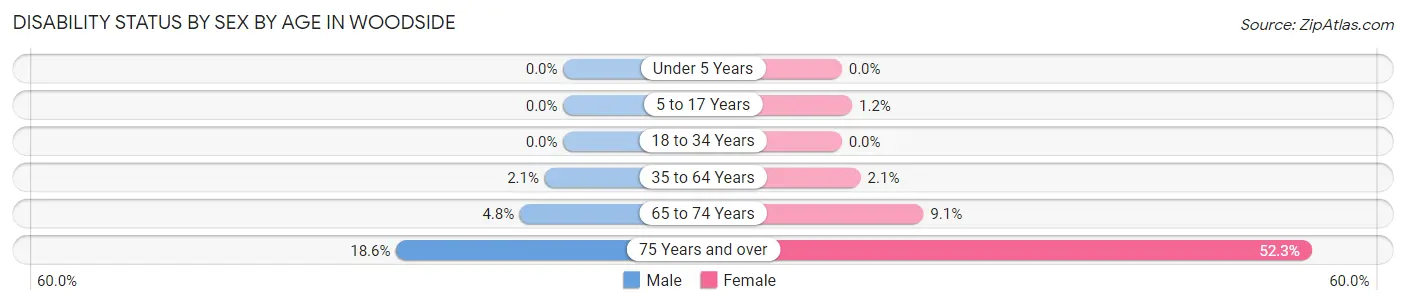
| Age Bracket | Male | Female |
| Under 5 Years | 0 (0.0%) | 0 (0.0%) |
| 5 to 17 Years | 0 (0.0%) | 4 (1.1%) |
| 18 to 34 Years | 0 (0.0%) | 0 (0.0%) |
| 35 to 64 Years | 12 (2.1%) | 10 (2.1%) |
| 65 to 74 Years | 8 (4.8%) | 17 (9.1%) |
| 75 Years and over | 8 (18.6%) | 34 (52.3%) |
Disability Class by Sex by Age in Woodside
Disability Class: Hearing Difficulty
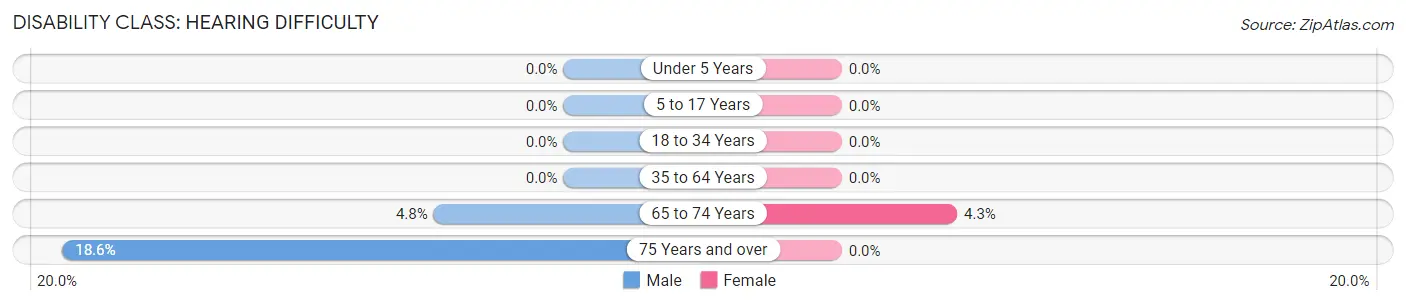
| Age Bracket | Male | Female |
| Under 5 Years | 0 (0.0%) | 0 (0.0%) |
| 5 to 17 Years | 0 (0.0%) | 0 (0.0%) |
| 18 to 34 Years | 0 (0.0%) | 0 (0.0%) |
| 35 to 64 Years | 0 (0.0%) | 0 (0.0%) |
| 65 to 74 Years | 8 (4.8%) | 8 (4.3%) |
| 75 Years and over | 8 (18.6%) | 0 (0.0%) |
Disability Class: Vision Difficulty
| Age Bracket | Male | Female |
| Under 5 Years | 0 (0.0%) | 0 (0.0%) |
| 5 to 17 Years | 0 (0.0%) | 0 (0.0%) |
| 18 to 34 Years | 0 (0.0%) | 0 (0.0%) |
| 35 to 64 Years | 0 (0.0%) | 0 (0.0%) |
| 65 to 74 Years | 0 (0.0%) | 0 (0.0%) |
| 75 Years and over | 0 (0.0%) | 0 (0.0%) |
Disability Class: Cognitive Difficulty
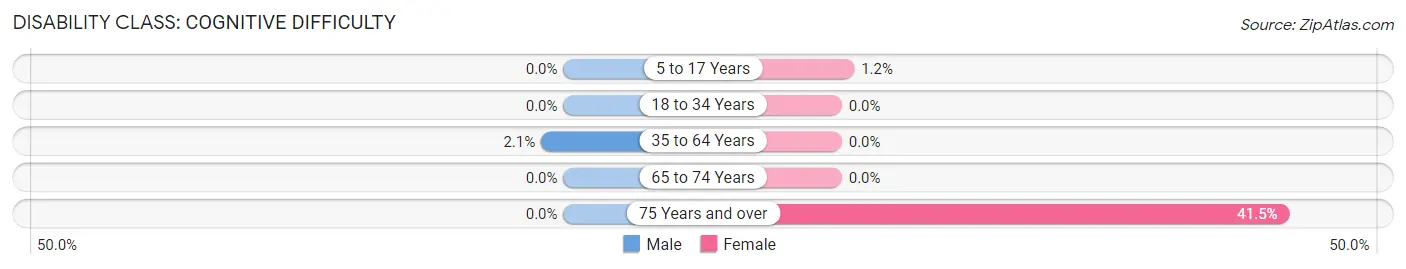
| Age Bracket | Male | Female |
| 5 to 17 Years | 0 (0.0%) | 4 (1.1%) |
| 18 to 34 Years | 0 (0.0%) | 0 (0.0%) |
| 35 to 64 Years | 12 (2.1%) | 0 (0.0%) |
| 65 to 74 Years | 0 (0.0%) | 0 (0.0%) |
| 75 Years and over | 0 (0.0%) | 27 (41.5%) |
Disability Class: Ambulatory Difficulty
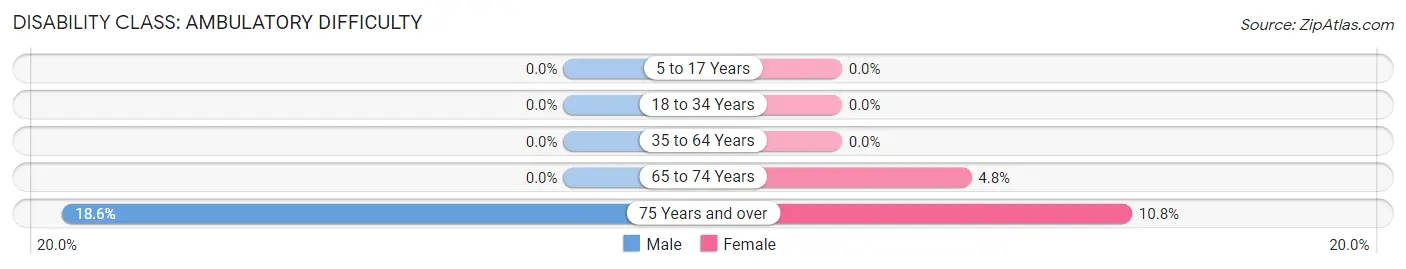
| Age Bracket | Male | Female |
| 5 to 17 Years | 0 (0.0%) | 0 (0.0%) |
| 18 to 34 Years | 0 (0.0%) | 0 (0.0%) |
| 35 to 64 Years | 0 (0.0%) | 0 (0.0%) |
| 65 to 74 Years | 0 (0.0%) | 9 (4.8%) |
| 75 Years and over | 8 (18.6%) | 7 (10.8%) |
Disability Class: Self-Care Difficulty
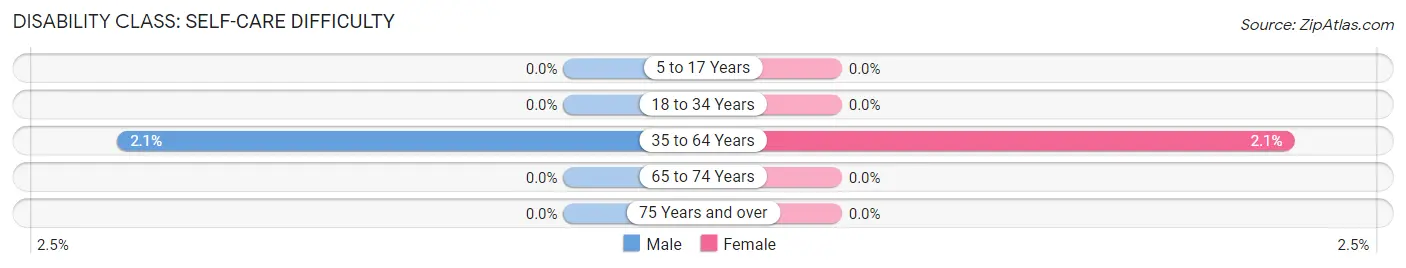
| Age Bracket | Male | Female |
| 5 to 17 Years | 0 (0.0%) | 0 (0.0%) |
| 18 to 34 Years | 0 (0.0%) | 0 (0.0%) |
| 35 to 64 Years | 12 (2.1%) | 10 (2.1%) |
| 65 to 74 Years | 0 (0.0%) | 0 (0.0%) |
| 75 Years and over | 0 (0.0%) | 0 (0.0%) |
Technology Access in Woodside
Computing Device Access in Woodside
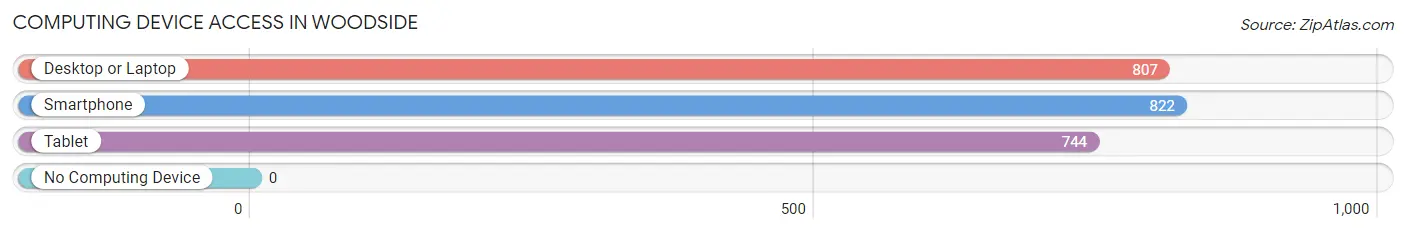
| Device Type | # Households | % Households |
| Desktop or Laptop | 807 | 97.0% |
| Smartphone | 822 | 98.8% |
| Tablet | 744 | 89.4% |
| No Computing Device | 0 | 0.0% |
| Total | 832 | 100.0% |
Internet Access in Woodside
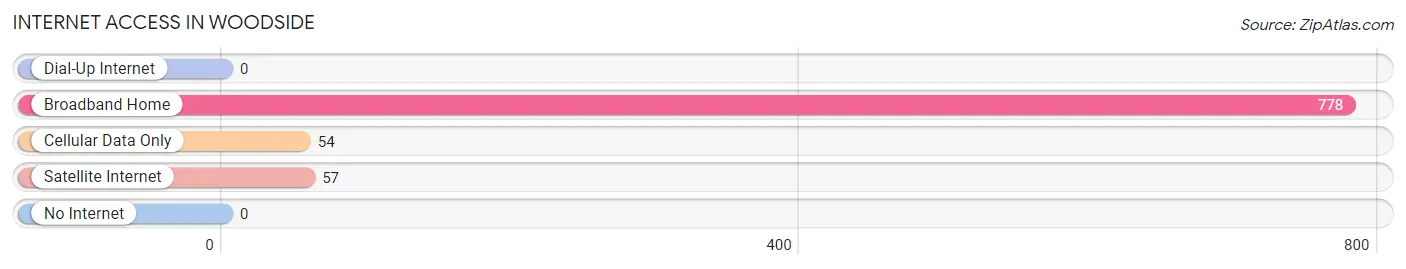
| Internet Type | # Households | % Households |
| Dial-Up Internet | 0 | 0.0% |
| Broadband Home | 778 | 93.5% |
| Cellular Data Only | 54 | 6.5% |
| Satellite Internet | 57 | 6.9% |
| No Internet | 0 | 0.0% |
| Total | 832 | 100.0% |
Woodside Summary
Woodside is a small borough located in Allegheny County, Pennsylvania. It is situated in the western part of the county, approximately 10 miles from the city of Pittsburgh. The borough was incorporated in 1876 and has a population of approximately 1,500 people.
History
Woodside was originally part of the township of Ross, which was established in 1788. The area was first settled in the late 1700s by a group of German immigrants. The first post office in the area was established in 1845 and the first school was built in 1848. The area was known as “Woodside” due to the abundance of trees in the area.
In 1876, the area was incorporated as a borough and the first mayor was elected. The borough was named after the nearby woods. The first industry in the area was a sawmill, which was built in 1877. The sawmill was followed by a brickyard and a coal mine.
In the late 1800s, the borough experienced a period of growth and development. Several churches were built, including the First Presbyterian Church, which was established in 1883. The borough also had a number of stores, including a general store, a drug store, and a hardware store.
In the early 1900s, the borough experienced a period of decline. The coal mine closed in the 1920s and the brickyard closed in the 1930s. The population of the borough decreased from 1,500 in 1900 to just over 500 in 1950.
In the late 1950s, the borough experienced a period of revitalization. The population increased to 1,500 in 1960 and has remained relatively stable since then.
Geography
Woodside is located in western Allegheny County, approximately 10 miles from the city of Pittsburgh. The borough is situated on a hillside and is surrounded by woods. The borough is bordered by the boroughs of Ross and West View to the north, the borough of Bellevue to the east, and the boroughs of Ben Avon and Emsworth to the south.
The borough has a total area of 0.6 square miles, all of which is land. The borough is located in the Allegheny Plateau region of Pennsylvania and is part of the Pittsburgh metropolitan area.
Economy
The economy of Woodside is largely based on small businesses and services. The borough has a number of small retail stores, restaurants, and professional services. The borough also has a number of small manufacturing businesses, including a metal fabrication shop and a printing company.
The borough is also home to a number of small businesses that provide services to the surrounding communities. These businesses include a landscaping company, a plumbing company, and a heating and air conditioning company.
Demographics
As of the 2010 census, the population of Woodside was 1,521. The racial makeup of the borough was 94.3% White, 2.2% African American, 0.2% Native American, 0.7% Asian, 0.1% Pacific Islander, 0.7% from other races, and 1.8% from two or more races. Hispanic or Latino of any race were 1.7% of the population.
The median household income in Woodside was $45,938, and the median family income was $51,250. The per capita income for the borough was $20,945. About 8.3% of families and 10.2% of the population were below the poverty line, including 14.2% of those under age 18 and 6.2% of those age 65 or over.
Common Questions
What is Per Capita Income in Woodside?
Per Capita income in Woodside is $64,198.
What is the Median Family Income in Woodside?
Median Family Income in Woodside is $176,385.
What is the Median Household income in Woodside?
Median Household Income in Woodside is $175,338.
What is Income or Wage Gap in Woodside?
Income or Wage Gap in Woodside is 58.3%.
Women in Woodside earn 41.7 cents for every dollar earned by a man.
What is Inequality or Gini Index in Woodside?
Inequality or Gini Index in Woodside is 0.31.
What is the Total Population of Woodside?
Total Population of Woodside is 2,653.
What is the Total Male Population of Woodside?
Total Male Population of Woodside is 1,311.
What is the Total Female Population of Woodside?
Total Female Population of Woodside is 1,342.
What is the Ratio of Males per 100 Females in Woodside?
There are 97.69 Males per 100 Females in Woodside.
What is the Ratio of Females per 100 Males in Woodside?
There are 102.36 Females per 100 Males in Woodside.
What is the Median Population Age in Woodside?
Median Population Age in Woodside is 41.5 Years.
What is the Average Family Size in Woodside
Average Family Size in Woodside is 3.3 People.
What is the Average Household Size in Woodside
Average Household Size in Woodside is 3.2 People.
How Large is the Labor Force in Woodside?
There are 1,398 People in the Labor Forcein in Woodside.
What is the Percentage of People in the Labor Force in Woodside?
69.4% of People are in the Labor Force in Woodside.
What is the Unemployment Rate in Woodside?
Unemployment Rate in Woodside is 15.2%.