Ardmore, PA Map & Demographics
Ardmore Map
Ardmore Overview
$75,362
PER CAPITA INCOME
$168,549
AVG FAMILY INCOME
$117,997
AVG HOUSEHOLD INCOME
29.2%
WAGE / INCOME GAP [ % ]
70.8¢/ $1
WAGE / INCOME GAP [ $ ]
0.49
INEQUALITY / GINI INDEX
14,075
TOTAL POPULATION
6,561
MALE POPULATION
7,514
FEMALE POPULATION
87.32
MALES / 100 FEMALES
114.53
FEMALES / 100 MALES
39.6
MEDIAN AGE
3.0
AVG FAMILY SIZE
2.2
AVG HOUSEHOLD SIZE
8,071
LABOR FORCE [ PEOPLE ]
71.1%
PERCENT IN LABOR FORCE
4.8%
UNEMPLOYMENT RATE
Ardmore Zip Codes
Income in Ardmore
Income Overview in Ardmore
Per Capita Income in Ardmore is $75,362, while median incomes of families and households are $168,549 and $117,997 respectively.
| Characteristic | Number | Measure |
| Per Capita Income | 14,075 | $75,362 |
| Median Family Income | 3,585 | $168,549 |
| Mean Family Income | 3,585 | $225,176 |
| Median Household Income | 6,305 | $117,997 |
| Mean Household Income | 6,305 | $165,746 |
| Income Deficit | 3,585 | $0 |
| Wage / Income Gap (%) | 14,075 | 29.15% |
| Wage / Income Gap ($) | 14,075 | 70.85¢ per $1 |
| Gini / Inequality Index | 14,075 | 0.49 |
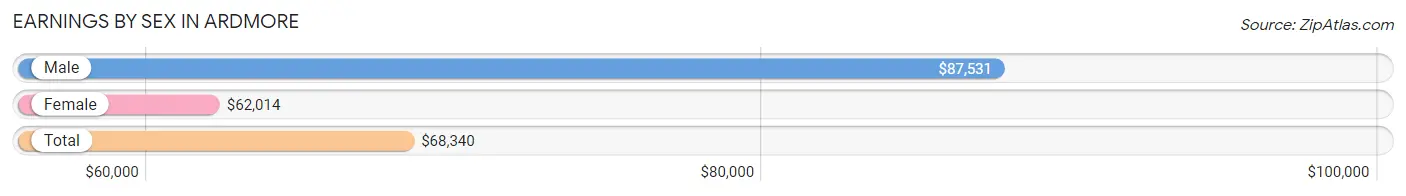
Earnings by Sex in Ardmore
Average Earnings in Ardmore are $68,340, $87,531 for men and $62,014 for women, a difference of 29.1%.
| Sex | Number | Average Earnings |
| Male | 4,067 (47.1%) | $87,531 |
| Female | 4,563 (52.9%) | $62,014 |
| Total | 8,630 (100.0%) | $68,340 |
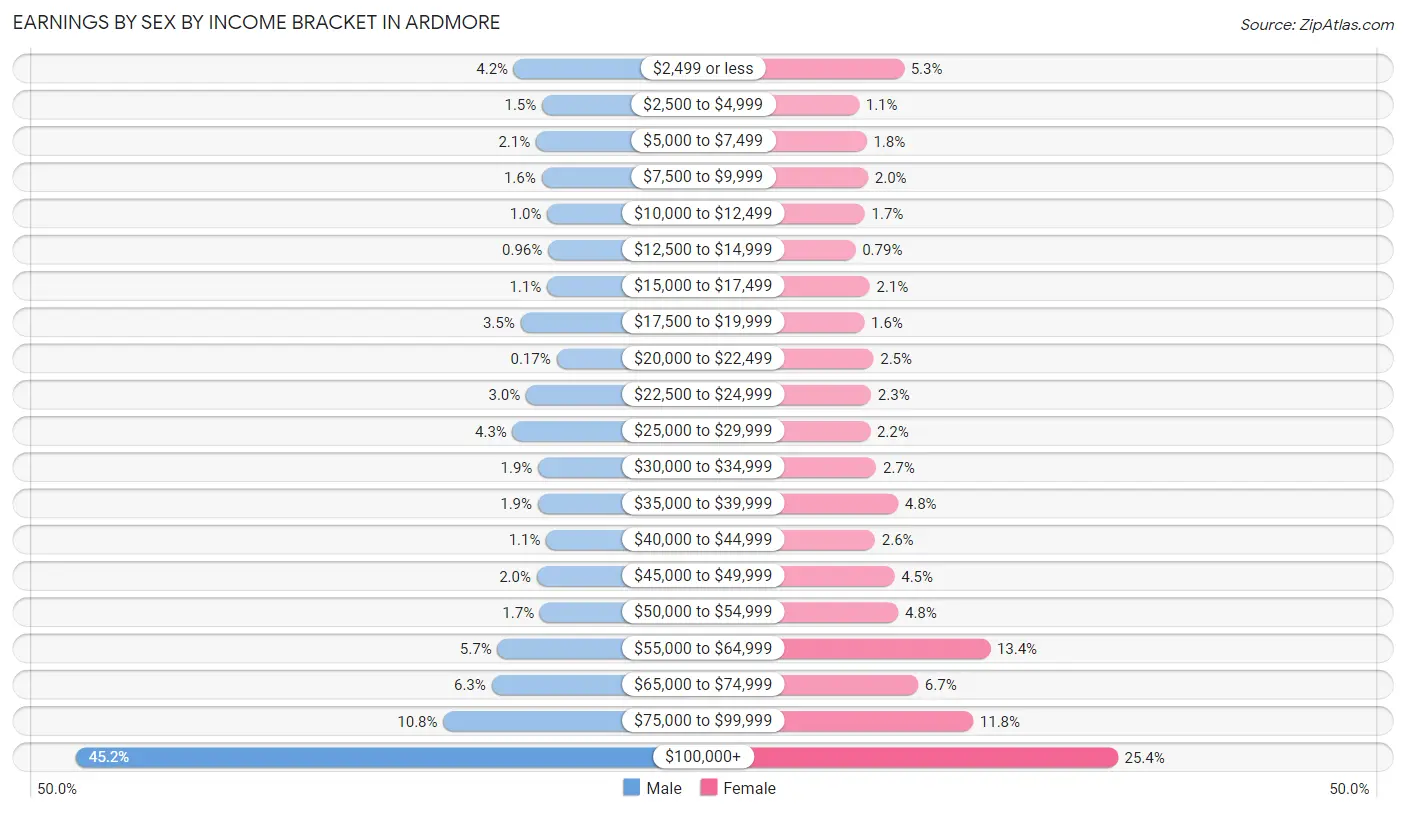
Earnings by Sex by Income Bracket in Ardmore
The most common earnings brackets in Ardmore are $100,000+ for men (1,838 | 45.2%) and $100,000+ for women (1,157 | 25.4%).
| Income | Male | Female |
| $2,499 or less | 169 (4.2%) | 243 (5.3%) |
| $2,500 to $4,999 | 62 (1.5%) | 51 (1.1%) |
| $5,000 to $7,499 | 85 (2.1%) | 84 (1.8%) |
| $7,500 to $9,999 | 64 (1.6%) | 90 (2.0%) |
| $10,000 to $12,499 | 42 (1.0%) | 76 (1.7%) |
| $12,500 to $14,999 | 39 (1.0%) | 36 (0.8%) |
| $15,000 to $17,499 | 43 (1.1%) | 97 (2.1%) |
| $17,500 to $19,999 | 144 (3.5%) | 74 (1.6%) |
| $20,000 to $22,499 | 7 (0.2%) | 113 (2.5%) |
| $22,500 to $24,999 | 123 (3.0%) | 103 (2.3%) |
| $25,000 to $29,999 | 174 (4.3%) | 99 (2.2%) |
| $30,000 to $34,999 | 77 (1.9%) | 125 (2.7%) |
| $35,000 to $39,999 | 78 (1.9%) | 218 (4.8%) |
| $40,000 to $44,999 | 46 (1.1%) | 120 (2.6%) |
| $45,000 to $49,999 | 82 (2.0%) | 203 (4.4%) |
| $50,000 to $54,999 | 70 (1.7%) | 219 (4.8%) |
| $55,000 to $64,999 | 232 (5.7%) | 612 (13.4%) |
| $65,000 to $74,999 | 254 (6.2%) | 304 (6.7%) |
| $75,000 to $99,999 | 438 (10.8%) | 539 (11.8%) |
| $100,000+ | 1,838 (45.2%) | 1,157 (25.4%) |
| Total | 4,067 (100.0%) | 4,563 (100.0%) |
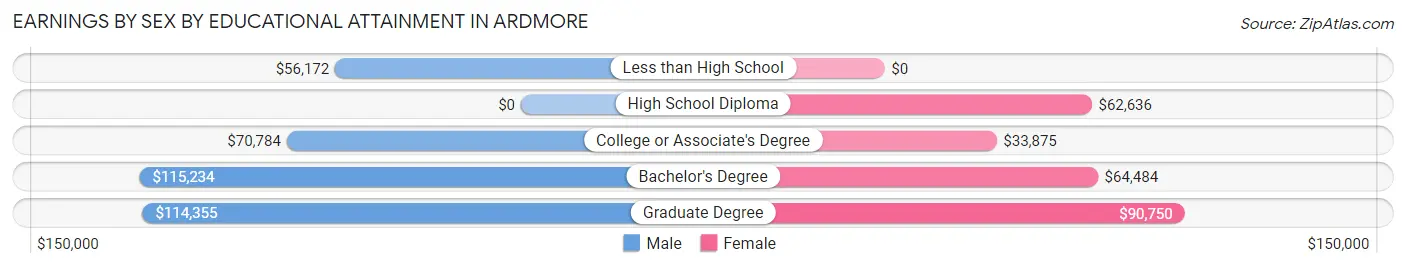
Earnings by Sex by Educational Attainment in Ardmore
Average earnings in Ardmore are $99,630 for men and $63,993 for women, a difference of 35.8%. Men with an educational attainment of bachelor's degree enjoy the highest average annual earnings of $115,234, while those with less than high school education earn the least with $56,172. Women with an educational attainment of graduate degree earn the most with the average annual earnings of $90,750, while those with college or associate's degree education have the smallest earnings of $33,875.
| Educational Attainment | Male Income | Female Income |
| Less than High School | $56,172 | $0 |
| High School Diploma | - | - |
| College or Associate's Degree | $70,784 | $33,875 |
| Bachelor's Degree | $115,234 | $64,484 |
| Graduate Degree | $114,355 | $90,750 |
| Total | $99,630 | $63,993 |
Family Income in Ardmore
Family Income Brackets in Ardmore
According to the Ardmore family income data, there are 1,513 families falling into the $200,000+ income range, which is the most common income bracket and makes up 42.2% of all families. Conversely, the $10,000 to $14,999 income bracket is the least frequent group with only 7 families (0.2%) belonging to this category.
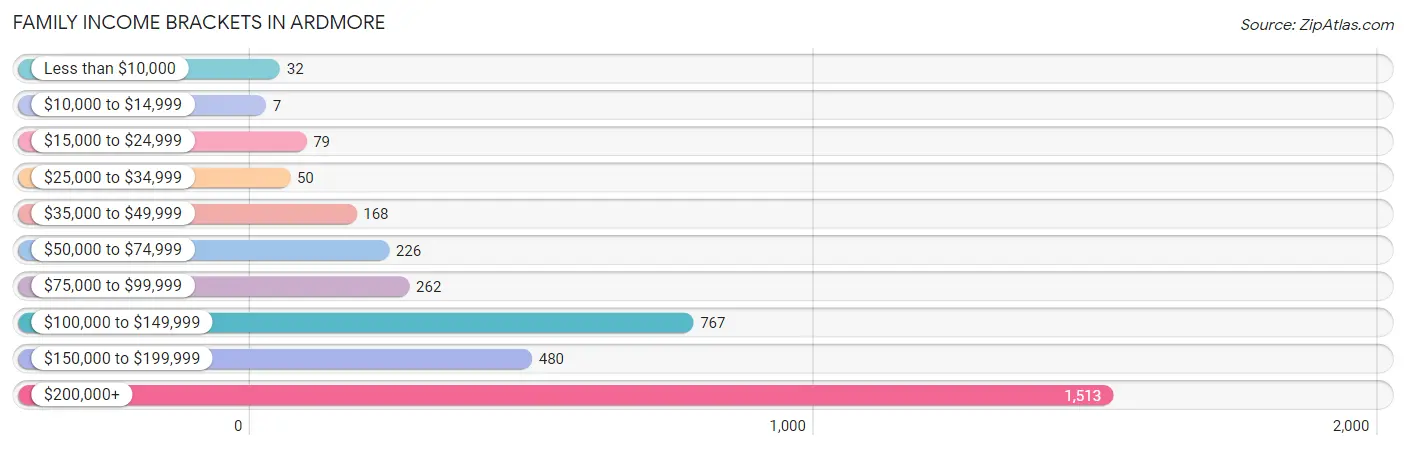
| Income Bracket | # Families | % Families |
| Less than $10,000 | 32 | 0.9% |
| $10,000 to $14,999 | 7 | 0.2% |
| $15,000 to $24,999 | 79 | 2.2% |
| $25,000 to $34,999 | 50 | 1.4% |
| $35,000 to $49,999 | 168 | 4.7% |
| $50,000 to $74,999 | 226 | 6.3% |
| $75,000 to $99,999 | 262 | 7.3% |
| $100,000 to $149,999 | 767 | 21.4% |
| $150,000 to $199,999 | 480 | 13.4% |
| $200,000+ | 1,513 | 42.2% |
Family Income by Famaliy Size in Ardmore
4-person families (639 | 17.8%) account for the highest median family income in Ardmore with $219,063 per family, while 2-person families (1,737 | 48.4%) have the highest median income of $80,738 per family member.
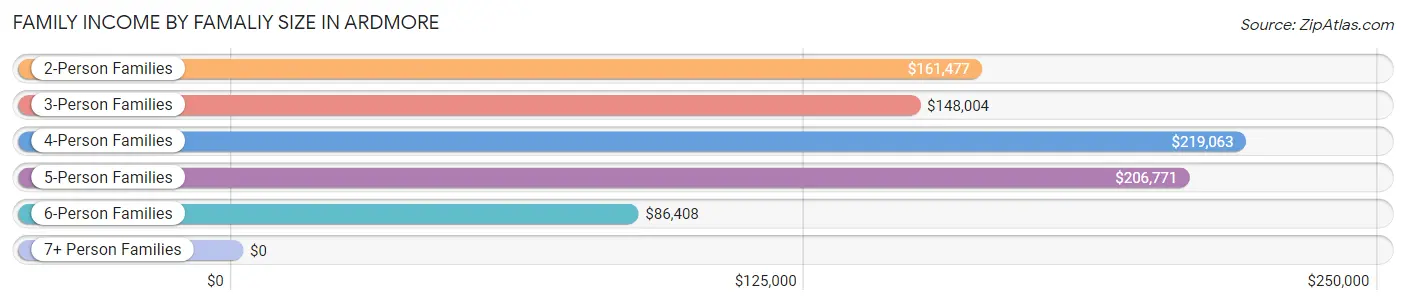
| Income Bracket | # Families | Median Income |
| 2-Person Families | 1,737 (48.4%) | $161,477 |
| 3-Person Families | 773 (21.6%) | $148,004 |
| 4-Person Families | 639 (17.8%) | $219,063 |
| 5-Person Families | 283 (7.9%) | $206,771 |
| 6-Person Families | 107 (3.0%) | $86,408 |
| 7+ Person Families | 46 (1.3%) | $0 |
| Total | 3,585 (100.0%) | $168,549 |
Family Income by Number of Earners in Ardmore
The median family income in Ardmore is $168,549, with families comprising 2 earners (2,133) having the highest median family income of $217,989, while families with no earners (370) have the lowest median family income of $59,063, accounting for 59.5% and 10.3% of families, respectively.
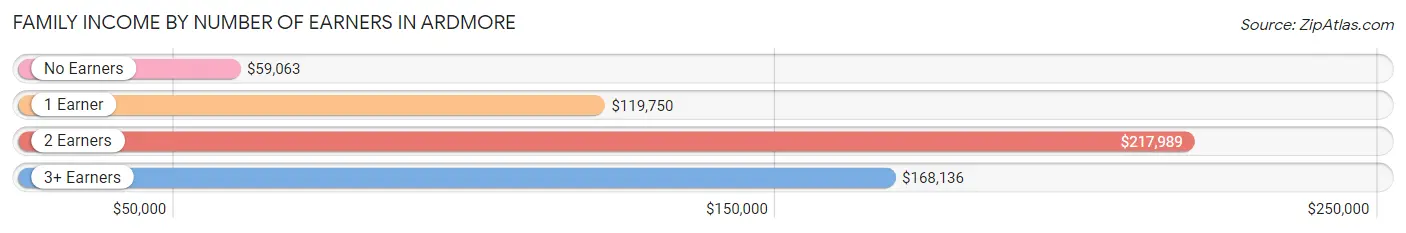
| Number of Earners | # Families | Median Income |
| No Earners | 370 (10.3%) | $59,063 |
| 1 Earner | 749 (20.9%) | $119,750 |
| 2 Earners | 2,133 (59.5%) | $217,989 |
| 3+ Earners | 333 (9.3%) | $168,136 |
| Total | 3,585 (100.0%) | $168,549 |
Household Income in Ardmore
Household Income Brackets in Ardmore
With 1,753 households falling in the category, the $200,000+ income range is the most frequent in Ardmore, accounting for 27.8% of all households. In contrast, only 101 households (1.6%) fall into the $10,000 to $14,999 income bracket, making it the least populous group.
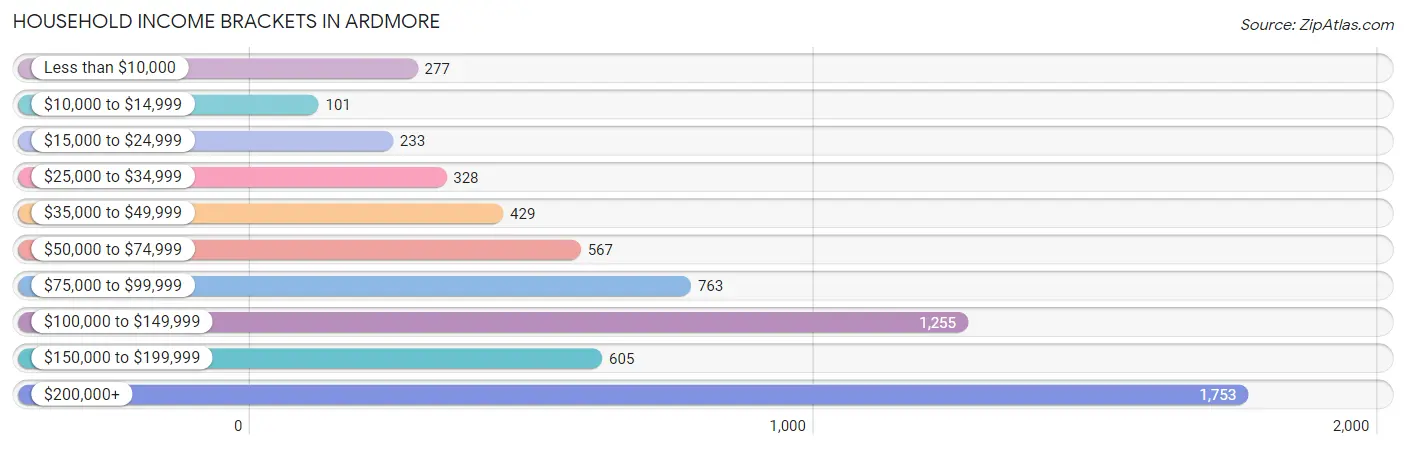
| Income Bracket | # Households | % Households |
| Less than $10,000 | 277 | 4.4% |
| $10,000 to $14,999 | 101 | 1.6% |
| $15,000 to $24,999 | 233 | 3.7% |
| $25,000 to $34,999 | 328 | 5.2% |
| $35,000 to $49,999 | 429 | 6.8% |
| $50,000 to $74,999 | 567 | 9.0% |
| $75,000 to $99,999 | 763 | 12.1% |
| $100,000 to $149,999 | 1,255 | 19.9% |
| $150,000 to $199,999 | 605 | 9.6% |
| $200,000+ | 1,753 | 27.8% |
Household Income by Householder Age in Ardmore
The median household income in Ardmore is $117,997, with the highest median household income of $147,279 found in the 25 to 44 years age bracket for the primary householder. A total of 2,579 households (40.9%) fall into this category. Meanwhile, the 15 to 24 years age bracket for the primary householder has the lowest median household income of $0, with 205 households (3.3%) in this group.
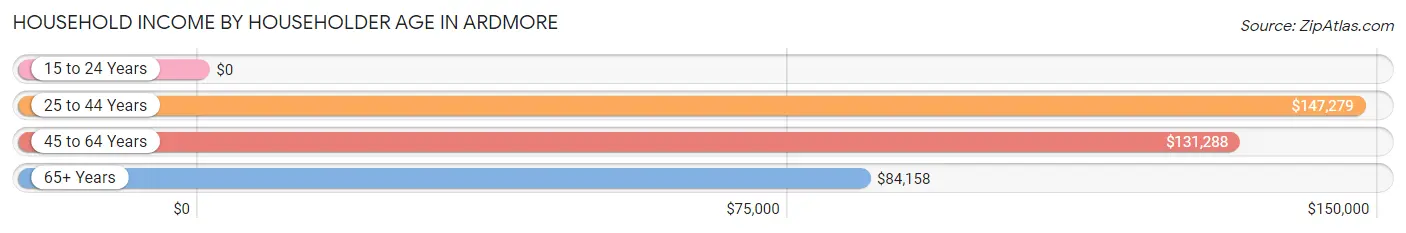
| Income Bracket | # Households | Median Income |
| 15 to 24 Years | 205 (3.3%) | $0 |
| 25 to 44 Years | 2,579 (40.9%) | $147,279 |
| 45 to 64 Years | 1,654 (26.2%) | $131,288 |
| 65+ Years | 1,867 (29.6%) | $84,158 |
| Total | 6,305 (100.0%) | $117,997 |
Poverty in Ardmore
Income Below Poverty by Sex and Age in Ardmore
With 4.5% poverty level for males and 6.3% for females among the residents of Ardmore, 15 year old males and 45 to 54 year old females are the most vulnerable to poverty, with 22 males (29.7%) and 83 females (10.4%) in their respective age groups living below the poverty level.
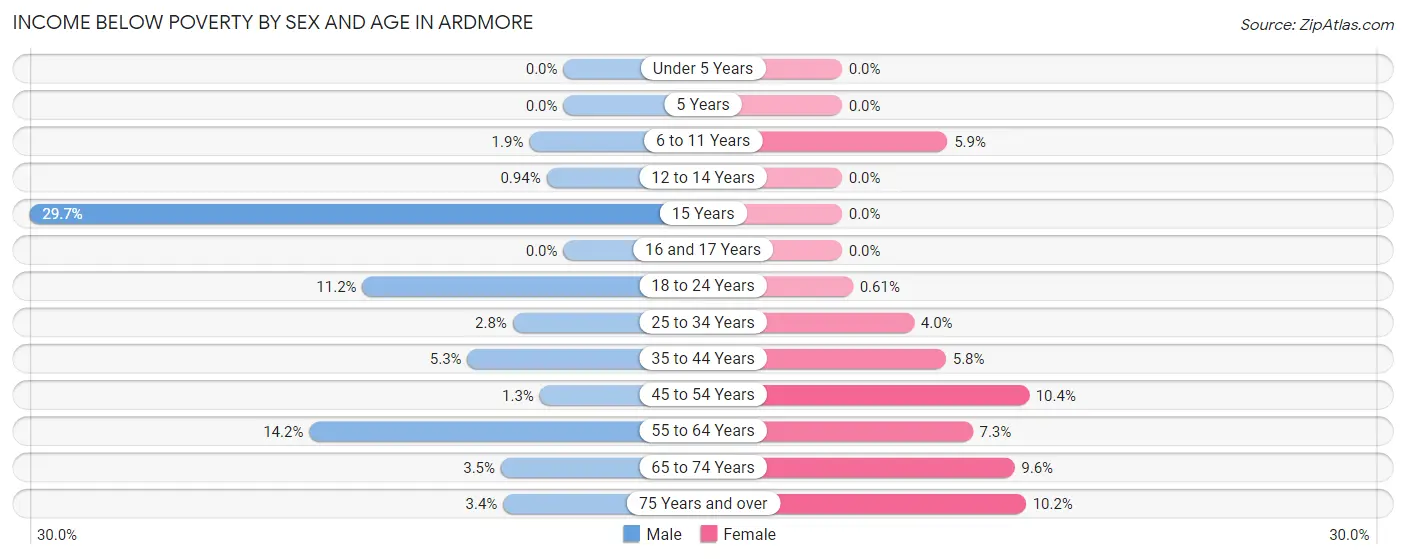
| Age Bracket | Male | Female |
| Under 5 Years | 0 (0.0%) | 0 (0.0%) |
| 5 Years | 0 (0.0%) | 0 (0.0%) |
| 6 to 11 Years | 12 (1.9%) | 34 (5.9%) |
| 12 to 14 Years | 3 (0.9%) | 0 (0.0%) |
| 15 Years | 22 (29.7%) | 0 (0.0%) |
| 16 and 17 Years | 0 (0.0%) | 0 (0.0%) |
| 18 to 24 Years | 49 (11.2%) | 2 (0.6%) |
| 25 to 34 Years | 25 (2.8%) | 47 (4.0%) |
| 35 to 44 Years | 65 (5.3%) | 77 (5.8%) |
| 45 to 54 Years | 11 (1.3%) | 83 (10.4%) |
| 55 to 64 Years | 74 (14.1%) | 60 (7.3%) |
| 65 to 74 Years | 20 (3.5%) | 81 (9.6%) |
| 75 Years and over | 15 (3.4%) | 87 (10.2%) |
| Total | 296 (4.5%) | 471 (6.3%) |
Income Above Poverty by Sex and Age in Ardmore
According to the poverty statistics in Ardmore, males aged under 5 years and females aged under 5 years are the age groups that are most secure financially, with 100.0% of males and 100.0% of females in these age groups living above the poverty line.
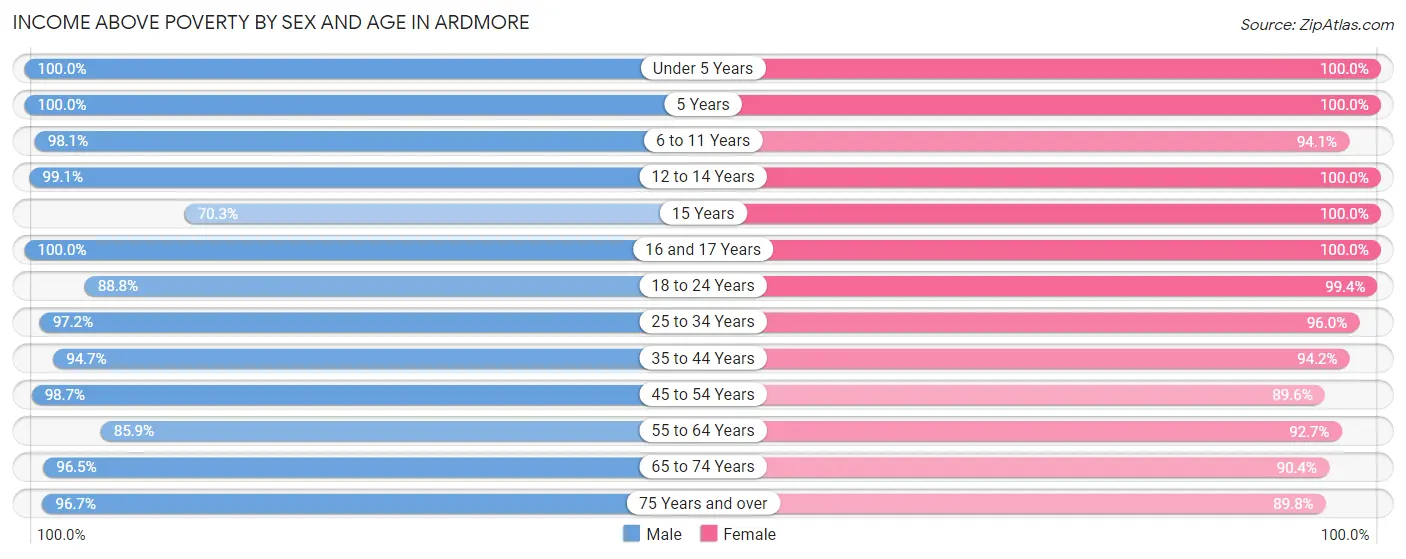
| Age Bracket | Male | Female |
| Under 5 Years | 364 (100.0%) | 327 (100.0%) |
| 5 Years | 124 (100.0%) | 85 (100.0%) |
| 6 to 11 Years | 619 (98.1%) | 545 (94.1%) |
| 12 to 14 Years | 317 (99.1%) | 93 (100.0%) |
| 15 Years | 52 (70.3%) | 97 (100.0%) |
| 16 and 17 Years | 94 (100.0%) | 185 (100.0%) |
| 18 to 24 Years | 389 (88.8%) | 328 (99.4%) |
| 25 to 34 Years | 863 (97.2%) | 1,126 (96.0%) |
| 35 to 44 Years | 1,152 (94.7%) | 1,254 (94.2%) |
| 45 to 54 Years | 825 (98.7%) | 714 (89.6%) |
| 55 to 64 Years | 449 (85.9%) | 764 (92.7%) |
| 65 to 74 Years | 554 (96.5%) | 762 (90.4%) |
| 75 Years and over | 433 (96.7%) | 763 (89.8%) |
| Total | 6,235 (95.5%) | 7,043 (93.7%) |
Income Below Poverty Among Married-Couple Families in Ardmore
The poverty statistics for married-couple families in Ardmore show that 1.8% or 57 of the total 3,156 families live below the poverty line. Families with 1 or 2 children have the highest poverty rate of 2.9%, comprising of 37 families. On the other hand, families with 3 or 4 children have the lowest poverty rate of 0.0%, which includes 0 families.
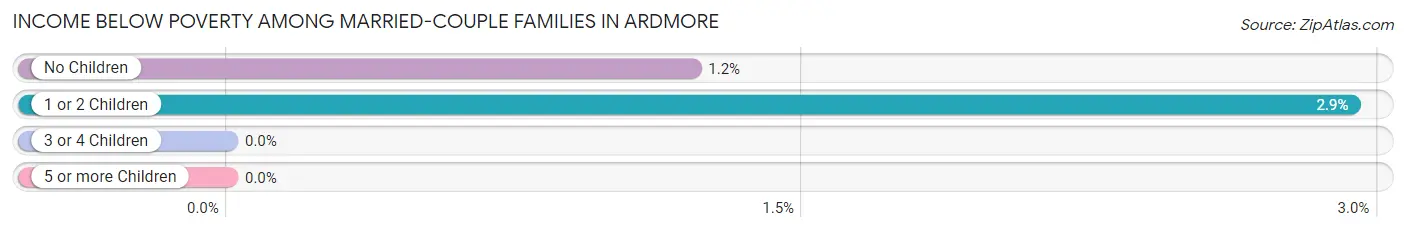
| Children | Above Poverty | Below Poverty |
| No Children | 1,638 (98.8%) | 20 (1.2%) |
| 1 or 2 Children | 1,227 (97.1%) | 37 (2.9%) |
| 3 or 4 Children | 191 (100.0%) | 0 (0.0%) |
| 5 or more Children | 43 (100.0%) | 0 (0.0%) |
| Total | 3,099 (98.2%) | 57 (1.8%) |
Income Below Poverty Among Single-Parent Households in Ardmore
According to the poverty data in Ardmore, 31.7% or 33 single-father households and 0.9% or 3 single-mother households are living below the poverty line. Among single-father households, those with no children have the highest poverty rate, with 33 households (100.0%) experiencing poverty. Likewise, among single-mother households, those with 5 or more children have the highest poverty rate, with 3 households (100.0%) falling below the poverty line.
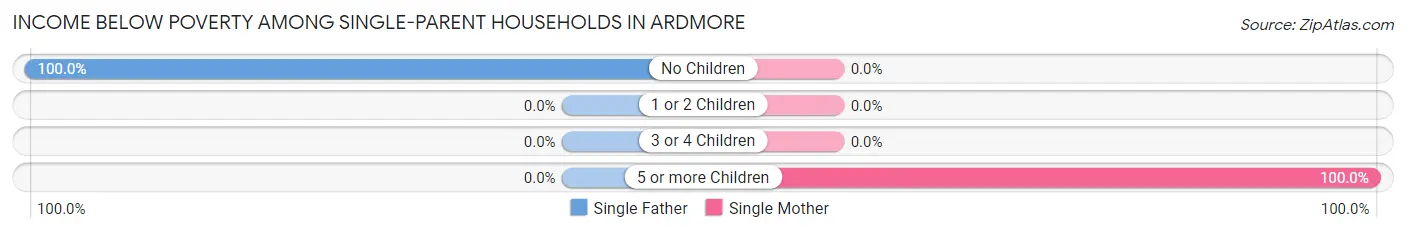
| Children | Single Father | Single Mother |
| No Children | 33 (100.0%) | 0 (0.0%) |
| 1 or 2 Children | 0 (0.0%) | 0 (0.0%) |
| 3 or 4 Children | 0 (0.0%) | 0 (0.0%) |
| 5 or more Children | 0 (0.0%) | 3 (100.0%) |
| Total | 33 (31.7%) | 3 (0.9%) |
Income Below Poverty Among Married-Couple vs Single-Parent Households in Ardmore
The poverty data for Ardmore shows that 57 of the married-couple family households (1.8%) and 36 of the single-parent households (8.4%) are living below the poverty level. Within the married-couple family households, those with 1 or 2 children have the highest poverty rate, with 37 households (2.9%) falling below the poverty line. Among the single-parent households, those with 5 or more children have the highest poverty rate, with 3 household (100.0%) living below poverty.
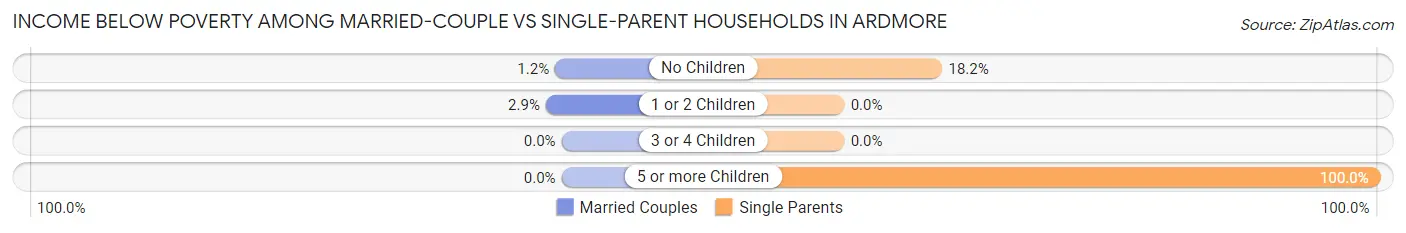
| Children | Married-Couple Families | Single-Parent Households |
| No Children | 20 (1.2%) | 33 (18.2%) |
| 1 or 2 Children | 37 (2.9%) | 0 (0.0%) |
| 3 or 4 Children | 0 (0.0%) | 0 (0.0%) |
| 5 or more Children | 0 (0.0%) | 3 (100.0%) |
| Total | 57 (1.8%) | 36 (8.4%) |
Race in Ardmore
The most populous races in Ardmore are White / Caucasian (11,135 | 79.1%), Black / African American (1,142 | 8.1%), and Two or more Races (924 | 6.6%).
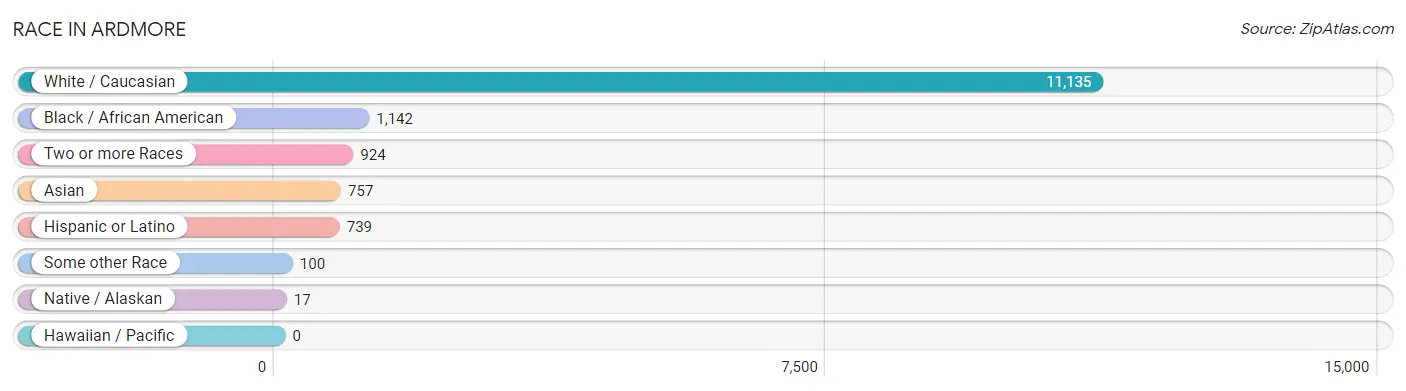
| Race | # Population | % Population |
| Asian | 757 | 5.4% |
| Black / African American | 1,142 | 8.1% |
| Hawaiian / Pacific | 0 | 0.0% |
| Hispanic or Latino | 739 | 5.2% |
| Native / Alaskan | 17 | 0.1% |
| White / Caucasian | 11,135 | 79.1% |
| Two or more Races | 924 | 6.6% |
| Some other Race | 100 | 0.7% |
| Total | 14,075 | 100.0% |
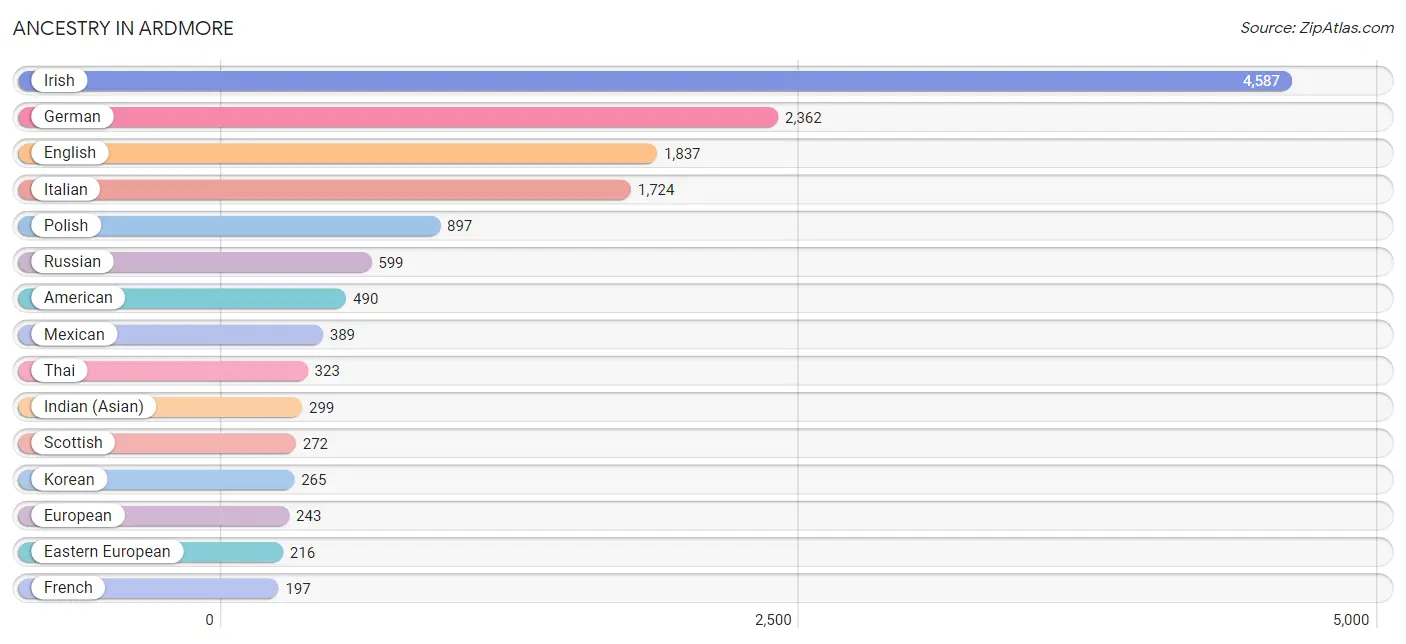
Ancestry in Ardmore
The most populous ancestries reported in Ardmore are Irish (4,587 | 32.6%), German (2,362 | 16.8%), English (1,837 | 13.1%), Italian (1,724 | 12.2%), and Polish (897 | 6.4%), together accounting for 81.0% of all Ardmore residents.
| Ancestry | # Population | % Population |
| African | 28 | 0.2% |
| American | 490 | 3.5% |
| Arab | 111 | 0.8% |
| Armenian | 18 | 0.1% |
| Austrian | 21 | 0.2% |
| Bhutanese | 16 | 0.1% |
| Brazilian | 37 | 0.3% |
| British | 170 | 1.2% |
| Bulgarian | 66 | 0.5% |
| Burmese | 161 | 1.1% |
| Carpatho Rusyn | 13 | 0.1% |
| Central American | 16 | 0.1% |
| Cherokee | 15 | 0.1% |
| Choctaw | 2 | 0.0% |
| Colombian | 65 | 0.5% |
| Croatian | 17 | 0.1% |
| Cuban | 35 | 0.3% |
| Czech | 55 | 0.4% |
| Czechoslovakian | 23 | 0.2% |
| Danish | 9 | 0.1% |
| Dominican | 16 | 0.1% |
| Dutch | 40 | 0.3% |
| Eastern European | 216 | 1.5% |
| English | 1,837 | 13.1% |
| Estonian | 9 | 0.1% |
| Ethiopian | 11 | 0.1% |
| European | 243 | 1.7% |
| Filipino | 15 | 0.1% |
| Finnish | 53 | 0.4% |
| French | 197 | 1.4% |
| French Canadian | 18 | 0.1% |
| German | 2,362 | 16.8% |
| Greek | 44 | 0.3% |
| Haitian | 23 | 0.2% |
| Hungarian | 86 | 0.6% |
| Indian (Asian) | 299 | 2.1% |
| Iranian | 57 | 0.4% |
| Irish | 4,587 | 32.6% |
| Italian | 1,724 | 12.2% |
| Jamaican | 75 | 0.5% |
| Japanese | 20 | 0.1% |
| Korean | 265 | 1.9% |
| Latvian | 43 | 0.3% |
| Lebanese | 28 | 0.2% |
| Lithuanian | 86 | 0.6% |
| Mexican | 389 | 2.8% |
| Moroccan | 7 | 0.1% |
| Northern European | 52 | 0.4% |
| Norwegian | 162 | 1.1% |
| Pennsylvania German | 21 | 0.2% |
| Peruvian | 41 | 0.3% |
| Polish | 897 | 6.4% |
| Portuguese | 33 | 0.2% |
| Puerto Rican | 99 | 0.7% |
| Romanian | 11 | 0.1% |
| Russian | 599 | 4.3% |
| Salvadoran | 16 | 0.1% |
| Scandinavian | 47 | 0.3% |
| Scotch-Irish | 162 | 1.1% |
| Scottish | 272 | 1.9% |
| Senegalese | 12 | 0.1% |
| Serbian | 29 | 0.2% |
| Slavic | 6 | 0.0% |
| Slovak | 126 | 0.9% |
| South American | 106 | 0.7% |
| Spaniard | 64 | 0.4% |
| Spanish | 14 | 0.1% |
| Sri Lankan | 9 | 0.1% |
| Subsaharan African | 74 | 0.5% |
| Swedish | 162 | 1.1% |
| Swiss | 68 | 0.5% |
| Thai | 323 | 2.3% |
| Trinidadian and Tobagonian | 11 | 0.1% |
| Turkish | 64 | 0.4% |
| Ukrainian | 150 | 1.1% |
| Welsh | 62 | 0.4% | View All 76 Rows |
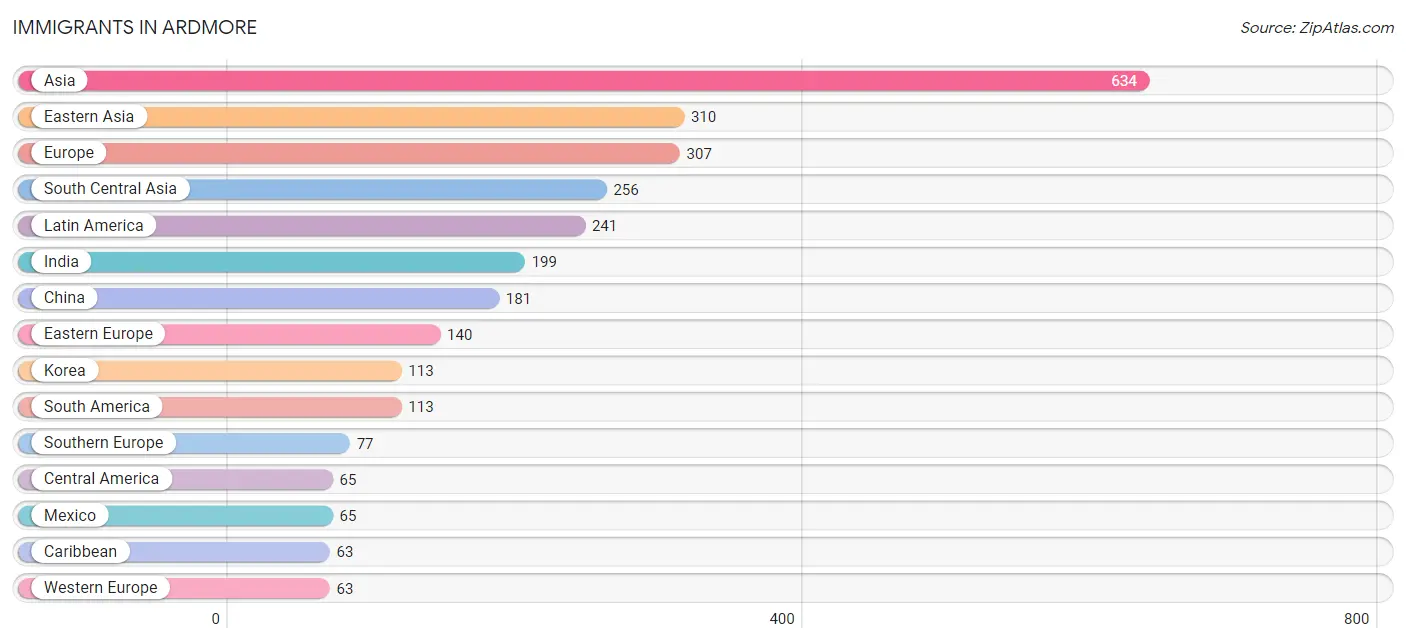
Immigrants in Ardmore
The most numerous immigrant groups reported in Ardmore came from Asia (634 | 4.5%), Eastern Asia (310 | 2.2%), Europe (307 | 2.2%), South Central Asia (256 | 1.8%), and Latin America (241 | 1.7%), together accounting for 12.4% of all Ardmore residents.
| Immigration Origin | # Population | % Population |
| Africa | 51 | 0.4% |
| Asia | 634 | 4.5% |
| Australia | 6 | 0.0% |
| Brazil | 37 | 0.3% |
| Bulgaria | 58 | 0.4% |
| Canada | 12 | 0.1% |
| Caribbean | 63 | 0.4% |
| Central America | 65 | 0.5% |
| China | 181 | 1.3% |
| Colombia | 52 | 0.4% |
| Croatia | 2 | 0.0% |
| Dominican Republic | 16 | 0.1% |
| Eastern Africa | 18 | 0.1% |
| Eastern Asia | 310 | 2.2% |
| Eastern Europe | 140 | 1.0% |
| Ethiopia | 11 | 0.1% |
| Europe | 307 | 2.2% |
| France | 8 | 0.1% |
| Germany | 37 | 0.3% |
| Hong Kong | 21 | 0.2% |
| India | 199 | 1.4% |
| Iran | 57 | 0.4% |
| Ireland | 6 | 0.0% |
| Italy | 42 | 0.3% |
| Jamaica | 47 | 0.3% |
| Japan | 16 | 0.1% |
| Korea | 113 | 0.8% |
| Latin America | 241 | 1.7% |
| Mexico | 65 | 0.5% |
| Morocco | 7 | 0.1% |
| Netherlands | 18 | 0.1% |
| Northern Africa | 21 | 0.2% |
| Northern Europe | 27 | 0.2% |
| Oceania | 6 | 0.0% |
| Peru | 24 | 0.2% |
| Philippines | 62 | 0.4% |
| Poland | 43 | 0.3% |
| Portugal | 15 | 0.1% |
| Russia | 20 | 0.1% |
| Scotland | 9 | 0.1% |
| South America | 113 | 0.8% |
| South Central Asia | 256 | 1.8% |
| South Eastern Asia | 62 | 0.4% |
| Southern Europe | 77 | 0.5% |
| Spain | 20 | 0.1% |
| Taiwan | 25 | 0.2% |
| Turkey | 6 | 0.0% |
| Uganda | 7 | 0.1% |
| Western Africa | 12 | 0.1% |
| Western Asia | 6 | 0.0% |
| Western Europe | 63 | 0.4% | View All 51 Rows |
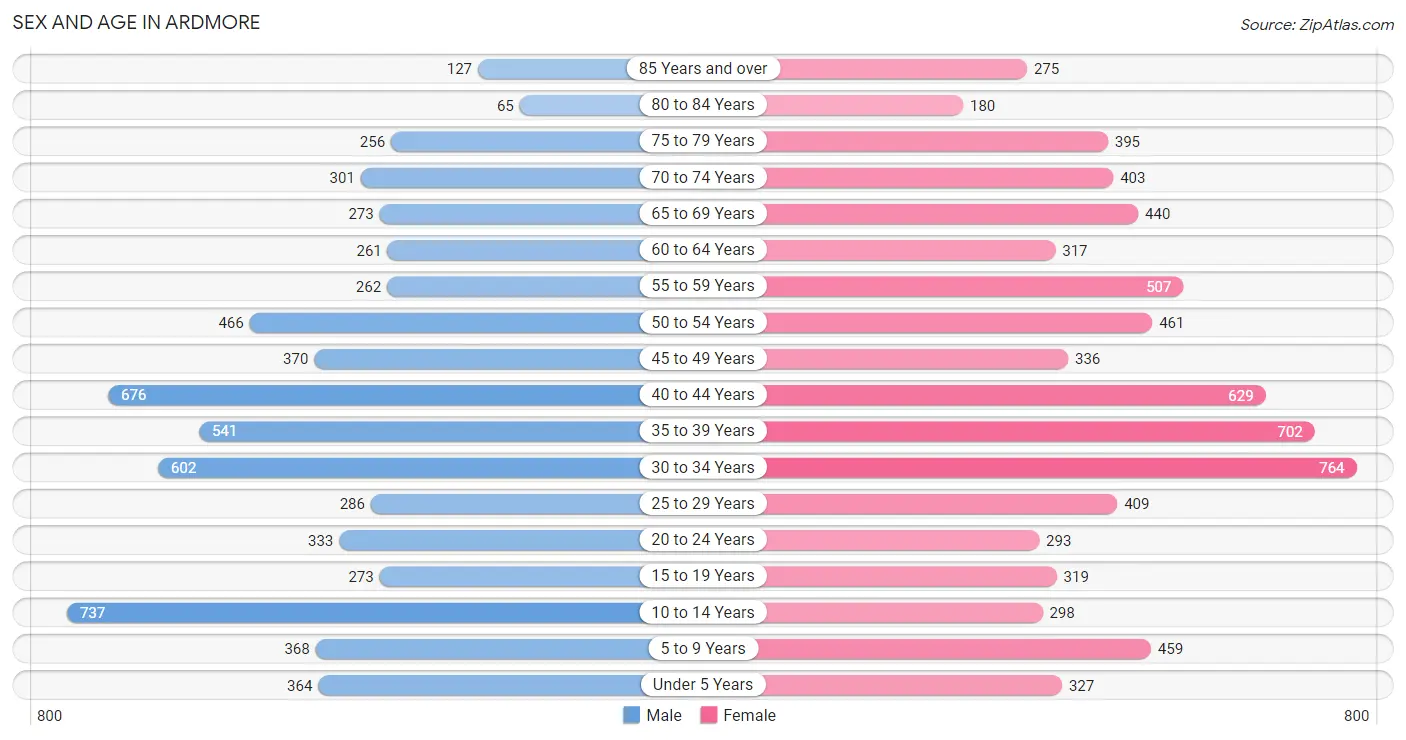
Sex and Age in Ardmore
Sex and Age in Ardmore
The most populous age groups in Ardmore are 10 to 14 Years (737 | 11.2%) for men and 30 to 34 Years (764 | 10.2%) for women.
| Age Bracket | Male | Female |
| Under 5 Years | 364 (5.6%) | 327 (4.3%) |
| 5 to 9 Years | 368 (5.6%) | 459 (6.1%) |
| 10 to 14 Years | 737 (11.2%) | 298 (4.0%) |
| 15 to 19 Years | 273 (4.2%) | 319 (4.3%) |
| 20 to 24 Years | 333 (5.1%) | 293 (3.9%) |
| 25 to 29 Years | 286 (4.4%) | 409 (5.4%) |
| 30 to 34 Years | 602 (9.2%) | 764 (10.2%) |
| 35 to 39 Years | 541 (8.3%) | 702 (9.3%) |
| 40 to 44 Years | 676 (10.3%) | 629 (8.4%) |
| 45 to 49 Years | 370 (5.6%) | 336 (4.5%) |
| 50 to 54 Years | 466 (7.1%) | 461 (6.1%) |
| 55 to 59 Years | 262 (4.0%) | 507 (6.8%) |
| 60 to 64 Years | 261 (4.0%) | 317 (4.2%) |
| 65 to 69 Years | 273 (4.2%) | 440 (5.9%) |
| 70 to 74 Years | 301 (4.6%) | 403 (5.4%) |
| 75 to 79 Years | 256 (3.9%) | 395 (5.3%) |
| 80 to 84 Years | 65 (1.0%) | 180 (2.4%) |
| 85 Years and over | 127 (1.9%) | 275 (3.7%) |
| Total | 6,561 (100.0%) | 7,514 (100.0%) |
Families and Households in Ardmore
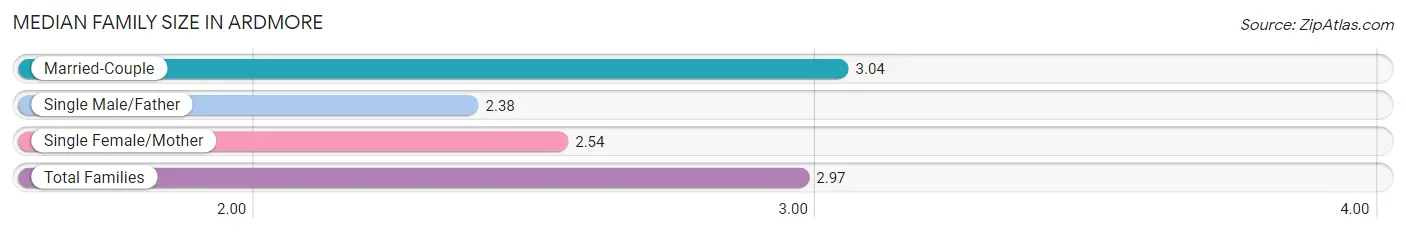
Median Family Size in Ardmore
The median family size in Ardmore is 2.97 persons per family, with married-couple families (3,156 | 88.0%) accounting for the largest median family size of 3.04 persons per family. On the other hand, single male/father families (104 | 2.9%) represent the smallest median family size with 2.38 persons per family.
| Family Type | # Families | Family Size |
| Married-Couple | 3,156 (88.0%) | 3.04 |
| Single Male/Father | 104 (2.9%) | 2.38 |
| Single Female/Mother | 325 (9.1%) | 2.54 |
| Total Families | 3,585 (100.0%) | 2.97 |
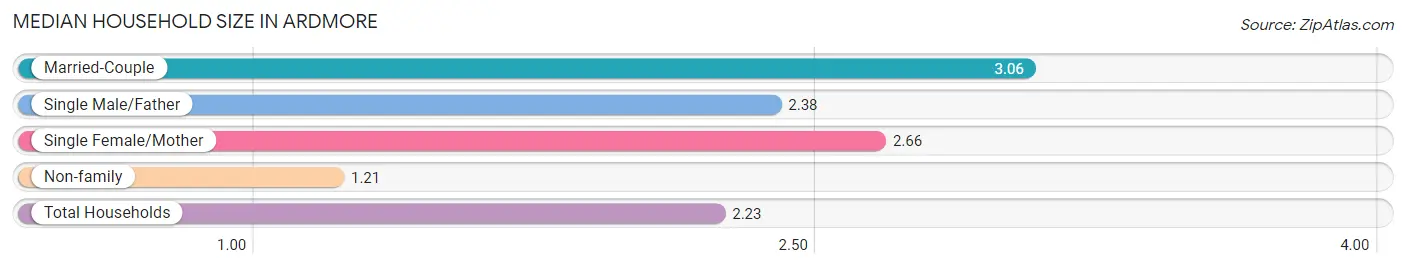
Median Household Size in Ardmore
The median household size in Ardmore is 2.23 persons per household, with married-couple households (3,156 | 50.1%) accounting for the largest median household size of 3.06 persons per household. non-family households (2,720 | 43.1%) represent the smallest median household size with 1.21 persons per household.
| Household Type | # Households | Household Size |
| Married-Couple | 3,156 (50.1%) | 3.06 |
| Single Male/Father | 104 (1.7%) | 2.38 |
| Single Female/Mother | 325 (5.1%) | 2.66 |
| Non-family | 2,720 (43.1%) | 1.21 |
| Total Households | 6,305 (100.0%) | 2.23 |
Household Size by Marriage Status in Ardmore
Out of a total of 6,305 households in Ardmore, 3,585 (56.9%) are family households, while 2,720 (43.1%) are nonfamily households. The most numerous type of family households are 2-person households, comprising 1,716, and the most common type of nonfamily households are 1-person households, comprising 2,252.
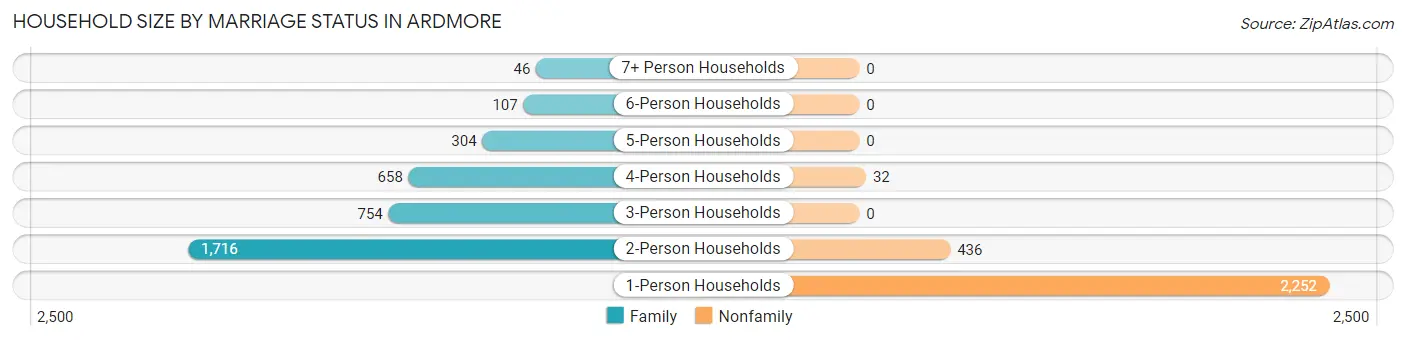
| Household Size | Family Households | Nonfamily Households |
| 1-Person Households | - | 2,252 (35.7%) |
| 2-Person Households | 1,716 (27.2%) | 436 (6.9%) |
| 3-Person Households | 754 (12.0%) | 0 (0.0%) |
| 4-Person Households | 658 (10.4%) | 32 (0.5%) |
| 5-Person Households | 304 (4.8%) | 0 (0.0%) |
| 6-Person Households | 107 (1.7%) | 0 (0.0%) |
| 7+ Person Households | 46 (0.7%) | 0 (0.0%) |
| Total | 3,585 (56.9%) | 2,720 (43.1%) |
Female Fertility in Ardmore
Fertility by Age in Ardmore
Average fertility rate in Ardmore is 60.0 births per 1,000 women. Women in the age bracket of 20 to 34 years have the highest fertility rate with 96.0 births per 1,000 women. Women in the age bracket of 20 to 34 years acount for 66.8% of all women with births.
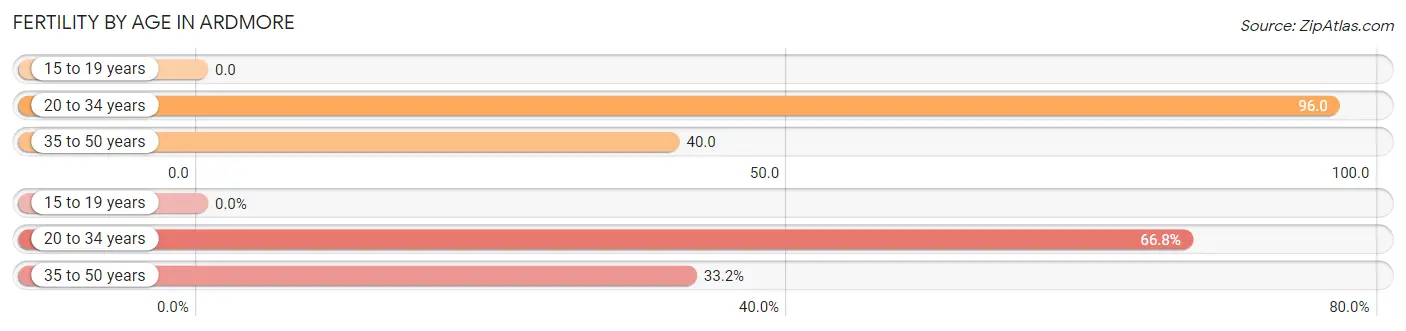
| Age Bracket | Women with Births | Births / 1,000 Women |
| 15 to 19 years | 0 (0.0%) | 0.0 |
| 20 to 34 years | 141 (66.8%) | 96.0 |
| 35 to 50 years | 70 (33.2%) | 40.0 |
| Total | 211 (100.0%) | 60.0 |
Fertility by Age by Marriage Status in Ardmore
87.7% of women with births (211) in Ardmore are married. The highest percentage of unmarried women with births falls into 20 to 34 years age bracket with 18.4% of them unmarried at the time of birth, while the lowest percentage of unmarried women with births belong to 35 to 50 years age bracket with 0.0% of them unmarried.
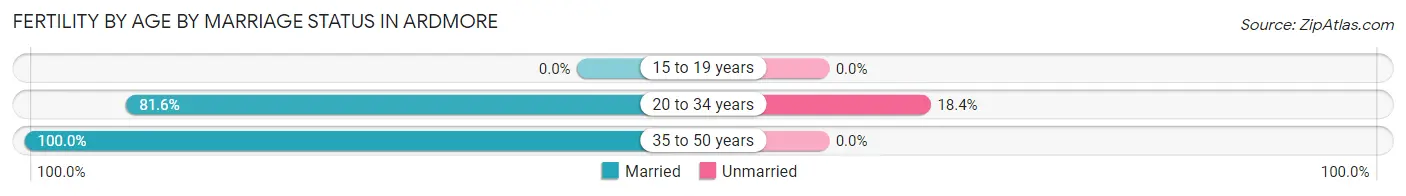
| Age Bracket | Married | Unmarried |
| 15 to 19 years | 0 (0.0%) | 0 (0.0%) |
| 20 to 34 years | 115 (81.6%) | 26 (18.4%) |
| 35 to 50 years | 70 (100.0%) | 0 (0.0%) |
| Total | 185 (87.7%) | 26 (12.3%) |
Fertility by Education in Ardmore
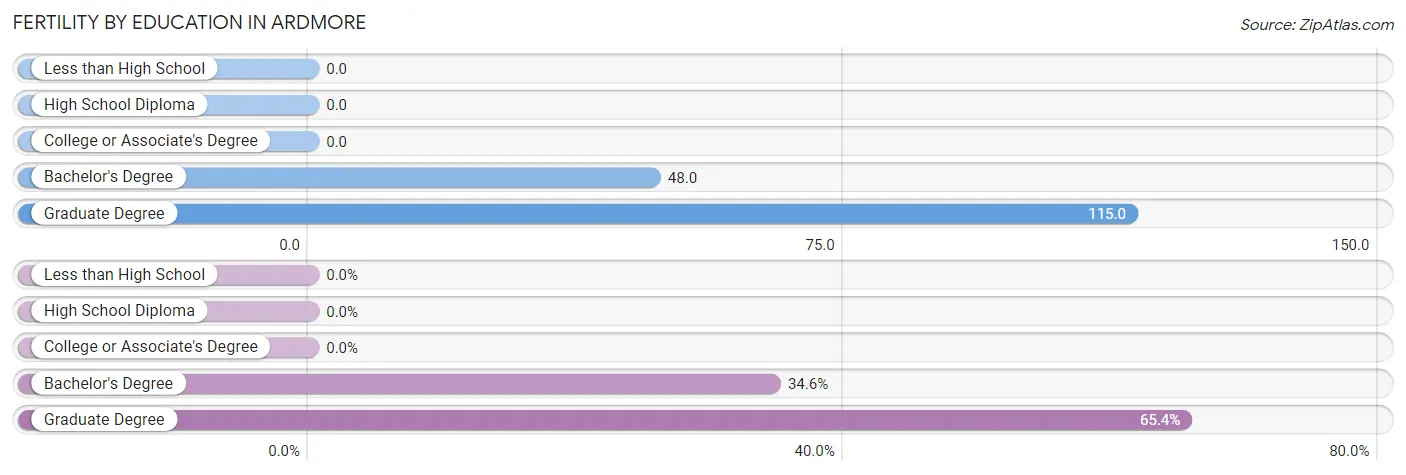
| Educational Attainment | Women with Births | Births / 1,000 Women |
| Less than High School | 0 (0.0%) | 0.0 |
| High School Diploma | 0 (0.0%) | 0.0 |
| College or Associate's Degree | 0 (0.0%) | 0.0 |
| Bachelor's Degree | 73 (34.6%) | 48.0 |
| Graduate Degree | 138 (65.4%) | 115.0 |
| Total | 211 (100.0%) | 60.0 |
Fertility by Education by Marriage Status in Ardmore
12.3% of women with births in Ardmore are unmarried. Women with the educational attainment of graduate degree are most likely to be married with 100.0% of them married at childbirth, while women with the educational attainment of bachelor's degree are least likely to be married with 35.6% of them unmarried at childbirth.
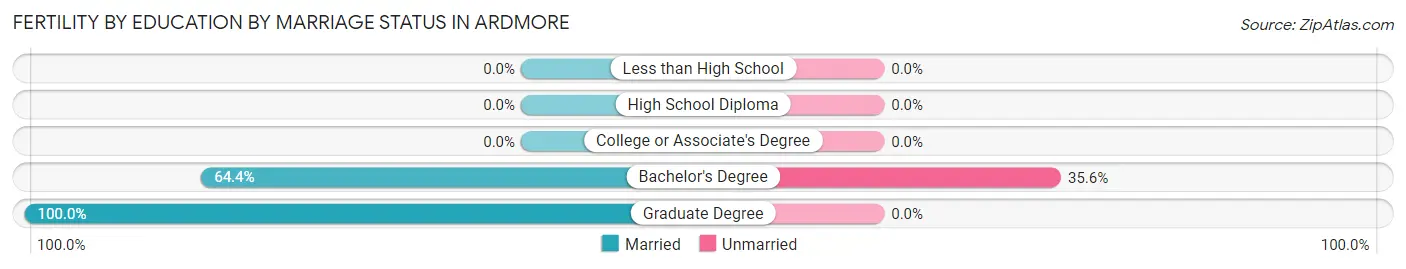
| Educational Attainment | Married | Unmarried |
| Less than High School | 0 (0.0%) | 0 (0.0%) |
| High School Diploma | 0 (0.0%) | 0 (0.0%) |
| College or Associate's Degree | 0 (0.0%) | 0 (0.0%) |
| Bachelor's Degree | 47 (64.4%) | 26 (35.6%) |
| Graduate Degree | 138 (100.0%) | 0 (0.0%) |
| Total | 185 (87.7%) | 26 (12.3%) |
Employment Characteristics in Ardmore
Employment by Class of Employer in Ardmore
Among the 7,585 employed individuals in Ardmore, private company employees (4,330 | 57.1%), not-for-profit organizations (2,005 | 26.4%), and self-employed (not incorporated) (401 | 5.3%) make up the most common classes of employment.
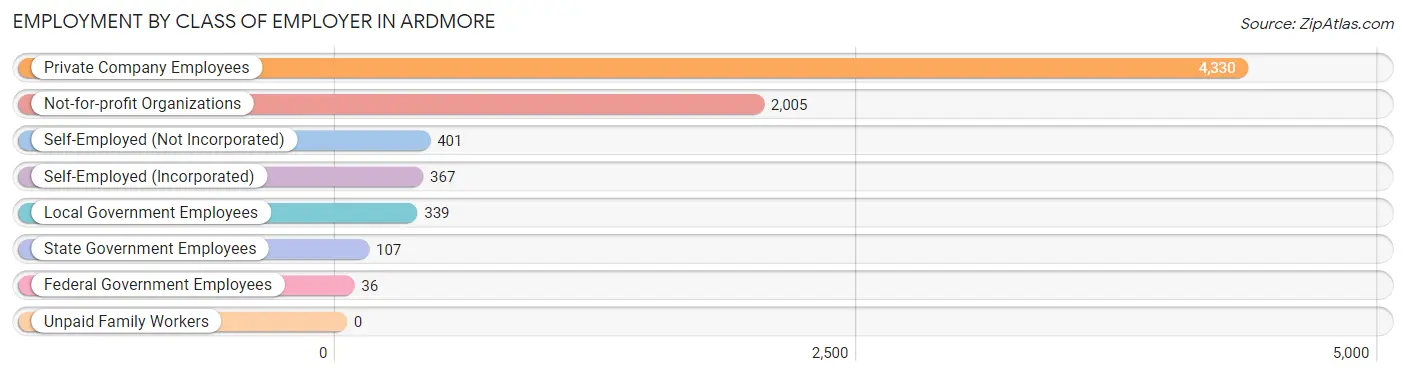
| Employer Class | # Employees | % Employees |
| Private Company Employees | 4,330 | 57.1% |
| Self-Employed (Incorporated) | 367 | 4.8% |
| Self-Employed (Not Incorporated) | 401 | 5.3% |
| Not-for-profit Organizations | 2,005 | 26.4% |
| Local Government Employees | 339 | 4.5% |
| State Government Employees | 107 | 1.4% |
| Federal Government Employees | 36 | 0.5% |
| Unpaid Family Workers | 0 | 0.0% |
| Total | 7,585 | 100.0% |
Employment Status by Age in Ardmore
According to the labor force statistics for Ardmore, out of the total population over 16 years of age (11,351), 71.1% or 8,071 individuals are in the labor force, with 4.8% or 387 of them unemployed. The age group with the highest labor force participation rate is 25 to 29 years, with 94.8% or 659 individuals in the labor force. Within the labor force, the 75 years and over age range has the highest percentage of unemployed individuals, with 32.8% or 95 of them being unemployed.
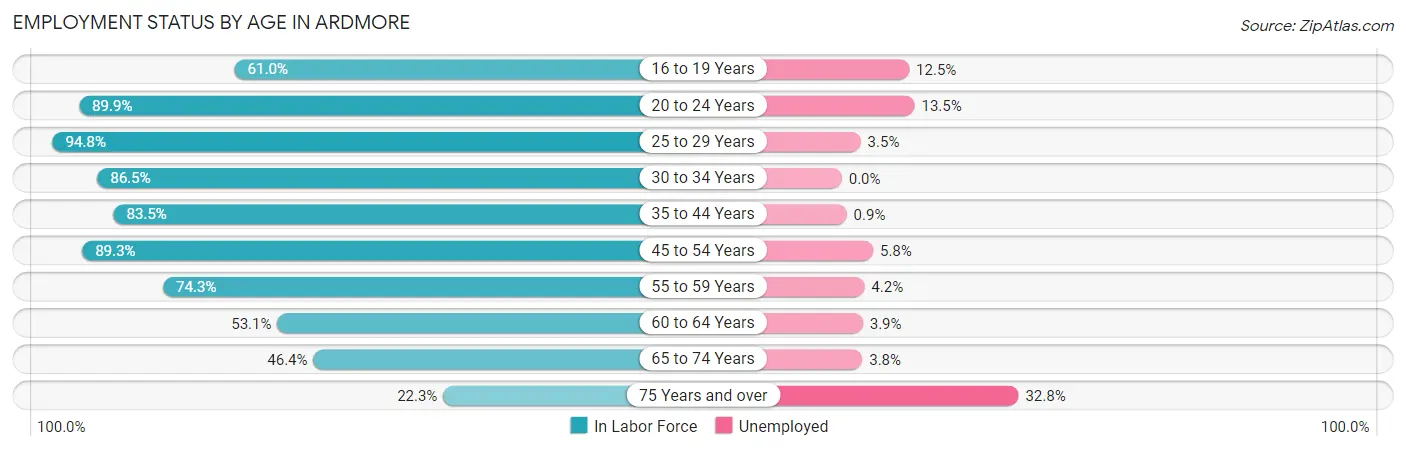
| Age Bracket | In Labor Force | Unemployed |
| 16 to 19 Years | 257 (61.0%) | 32 (12.5%) |
| 20 to 24 Years | 563 (89.9%) | 76 (13.5%) |
| 25 to 29 Years | 659 (94.8%) | 23 (3.5%) |
| 30 to 34 Years | 1,182 (86.5%) | 0 (0.0%) |
| 35 to 44 Years | 2,128 (83.5%) | 19 (0.9%) |
| 45 to 54 Years | 1,458 (89.3%) | 85 (5.8%) |
| 55 to 59 Years | 571 (74.3%) | 24 (4.2%) |
| 60 to 64 Years | 307 (53.1%) | 12 (3.9%) |
| 65 to 74 Years | 657 (46.4%) | 25 (3.8%) |
| 75 Years and over | 289 (22.3%) | 95 (32.8%) |
| Total | 8,071 (71.1%) | 387 (4.8%) |
Employment Status by Educational Attainment in Ardmore
According to labor force statistics for Ardmore, 83.1% of individuals (6,306) out of the total population between 25 and 64 years of age (7,589) are in the labor force, with 2.6% or 164 of them being unemployed. The group with the highest labor force participation rate are those with the educational attainment of bachelor's degree or higher, with 88.6% or 5,177 individuals in the labor force. Within the labor force, individuals with college / associate degree education have the highest percentage of unemployment, with 10.1% or 60 of them being unemployed.
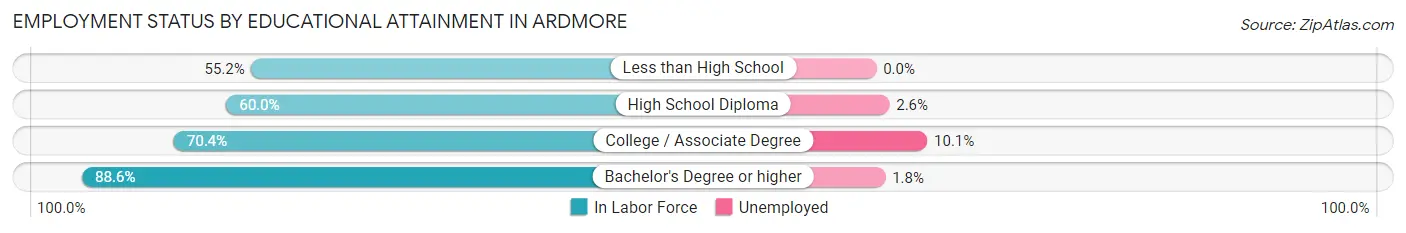
| Educational Attainment | In Labor Force | Unemployed |
| Less than High School | 74 (55.2%) | 0 (0.0%) |
| High School Diploma | 461 (60.0%) | 20 (2.6%) |
| College / Associate Degree | 594 (70.4%) | 85 (10.1%) |
| Bachelor's Degree or higher | 5,177 (88.6%) | 105 (1.8%) |
| Total | 6,306 (83.1%) | 197 (2.6%) |
Employment Occupations by Sex in Ardmore
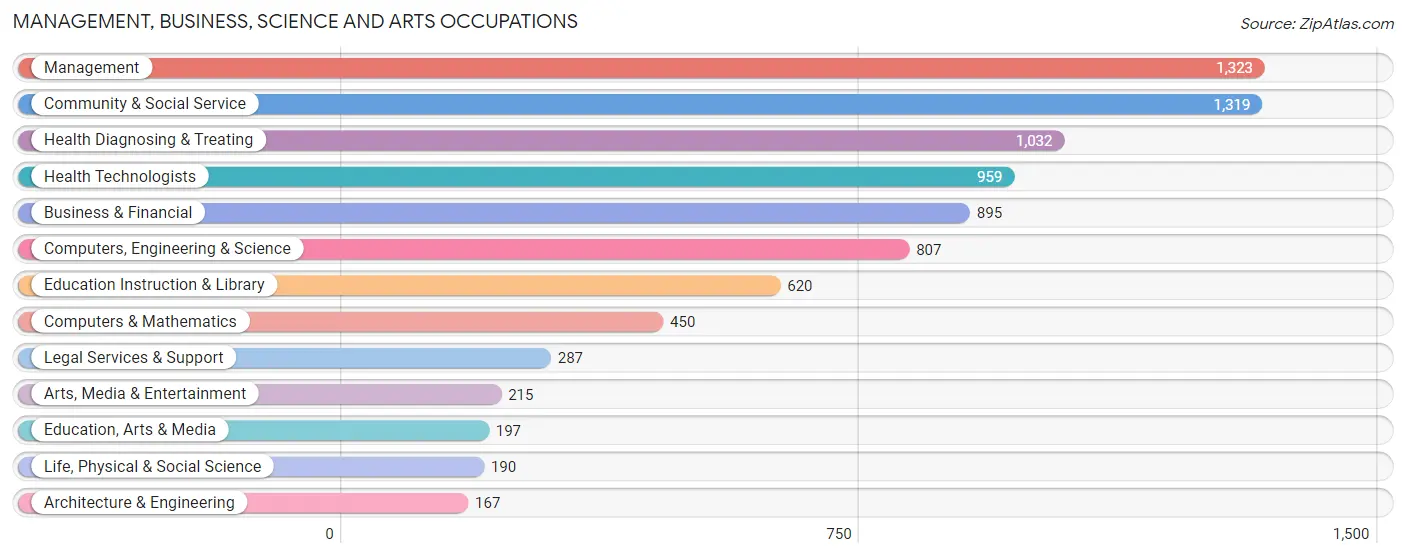
Management, Business, Science and Arts Occupations
The most common Management, Business, Science and Arts occupations in Ardmore are Management (1,323 | 17.2%), Community & Social Service (1,319 | 17.2%), Health Diagnosing & Treating (1,032 | 13.4%), Health Technologists (959 | 12.5%), and Business & Financial (895 | 11.7%).
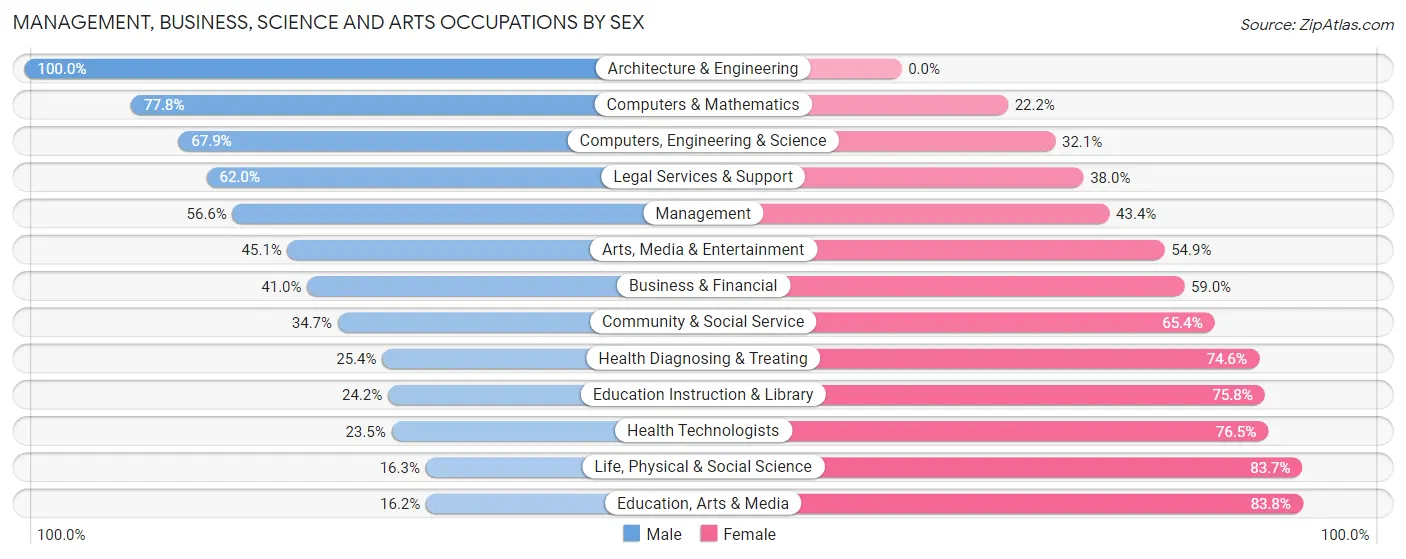
Management, Business, Science and Arts Occupations by Sex
Within the Management, Business, Science and Arts occupations in Ardmore, the most male-oriented occupations are Architecture & Engineering (100.0%), Computers & Mathematics (77.8%), and Computers, Engineering & Science (67.9%), while the most female-oriented occupations are Education, Arts & Media (83.8%), Life, Physical & Social Science (83.7%), and Health Technologists (76.5%).
| Occupation | Male | Female |
| Management | 749 (56.6%) | 574 (43.4%) |
| Business & Financial | 367 (41.0%) | 528 (59.0%) |
| Computers, Engineering & Science | 548 (67.9%) | 259 (32.1%) |
| Computers & Mathematics | 350 (77.8%) | 100 (22.2%) |
| Architecture & Engineering | 167 (100.0%) | 0 (0.0%) |
| Life, Physical & Social Science | 31 (16.3%) | 159 (83.7%) |
| Community & Social Service | 457 (34.6%) | 862 (65.3%) |
| Education, Arts & Media | 32 (16.2%) | 165 (83.8%) |
| Legal Services & Support | 178 (62.0%) | 109 (38.0%) |
| Education Instruction & Library | 150 (24.2%) | 470 (75.8%) |
| Arts, Media & Entertainment | 97 (45.1%) | 118 (54.9%) |
| Health Diagnosing & Treating | 262 (25.4%) | 770 (74.6%) |
| Health Technologists | 225 (23.5%) | 734 (76.5%) |
| Total (Category) | 2,383 (44.3%) | 2,993 (55.7%) |
| Total (Overall) | 3,473 (45.2%) | 4,208 (54.8%) |
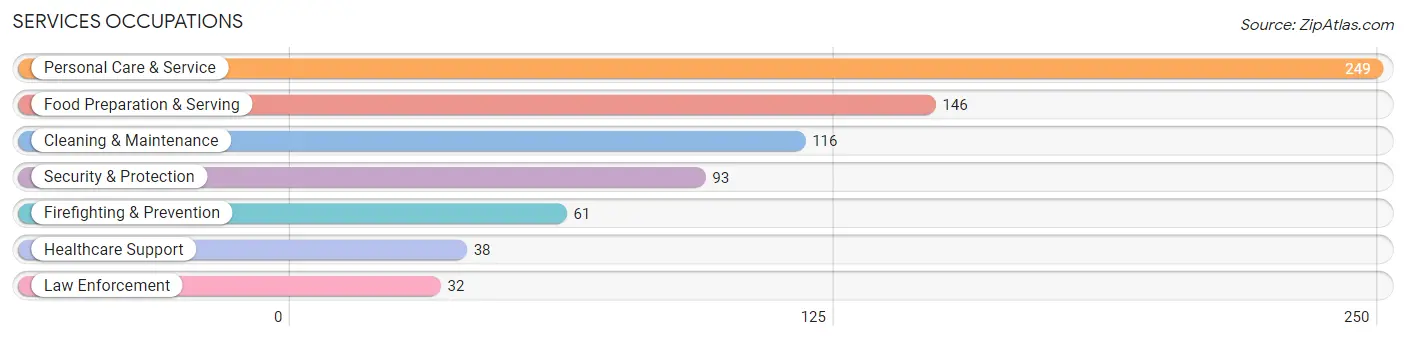
Services Occupations
The most common Services occupations in Ardmore are Personal Care & Service (249 | 3.2%), Food Preparation & Serving (146 | 1.9%), Cleaning & Maintenance (116 | 1.5%), Security & Protection (93 | 1.2%), and Firefighting & Prevention (61 | 0.8%).
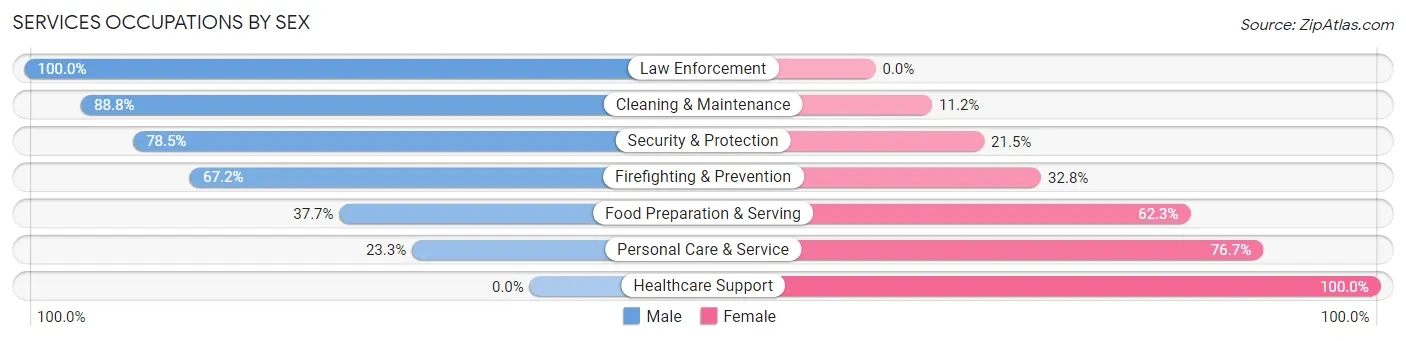
Services Occupations by Sex
Within the Services occupations in Ardmore, the most male-oriented occupations are Law Enforcement (100.0%), Cleaning & Maintenance (88.8%), and Security & Protection (78.5%), while the most female-oriented occupations are Healthcare Support (100.0%), Personal Care & Service (76.7%), and Food Preparation & Serving (62.3%).
| Occupation | Male | Female |
| Healthcare Support | 0 (0.0%) | 38 (100.0%) |
| Security & Protection | 73 (78.5%) | 20 (21.5%) |
| Firefighting & Prevention | 41 (67.2%) | 20 (32.8%) |
| Law Enforcement | 32 (100.0%) | 0 (0.0%) |
| Food Preparation & Serving | 55 (37.7%) | 91 (62.3%) |
| Cleaning & Maintenance | 103 (88.8%) | 13 (11.2%) |
| Personal Care & Service | 58 (23.3%) | 191 (76.7%) |
| Total (Category) | 289 (45.0%) | 353 (55.0%) |
| Total (Overall) | 3,473 (45.2%) | 4,208 (54.8%) |
Sales and Office Occupations
The most common Sales and Office occupations in Ardmore are Sales & Related (711 | 9.3%), and Office & Administration (550 | 7.2%).
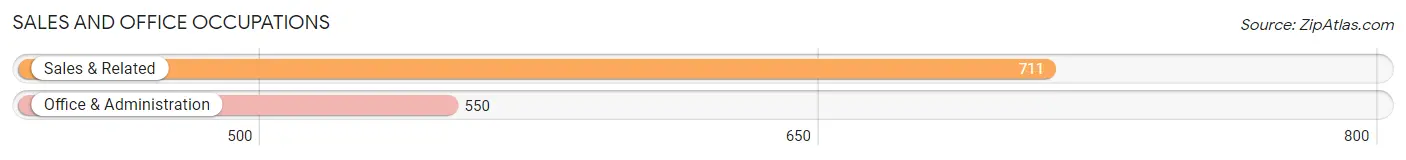
Sales and Office Occupations by Sex
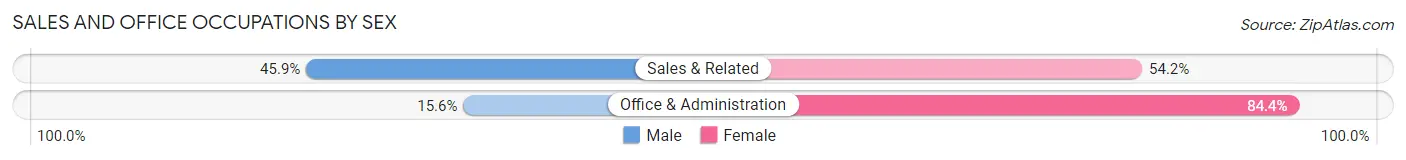
| Occupation | Male | Female |
| Sales & Related | 326 (45.9%) | 385 (54.1%) |
| Office & Administration | 86 (15.6%) | 464 (84.4%) |
| Total (Category) | 412 (32.7%) | 849 (67.3%) |
| Total (Overall) | 3,473 (45.2%) | 4,208 (54.8%) |
Natural Resources, Construction and Maintenance Occupations
The most common Natural Resources, Construction and Maintenance occupations in Ardmore are Construction & Extraction (120 | 1.6%), and Installation, Maintenance & Repair (65 | 0.9%).
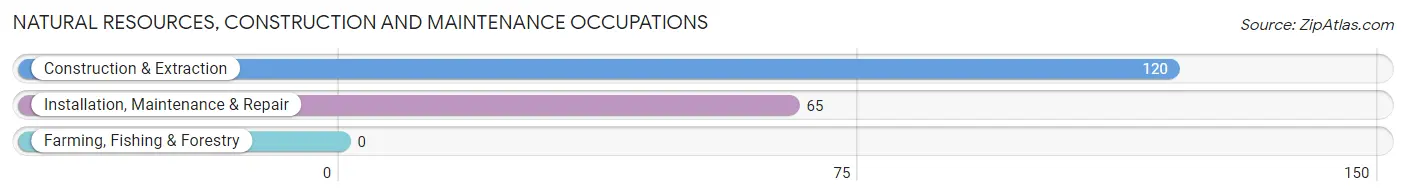
Natural Resources, Construction and Maintenance Occupations by Sex
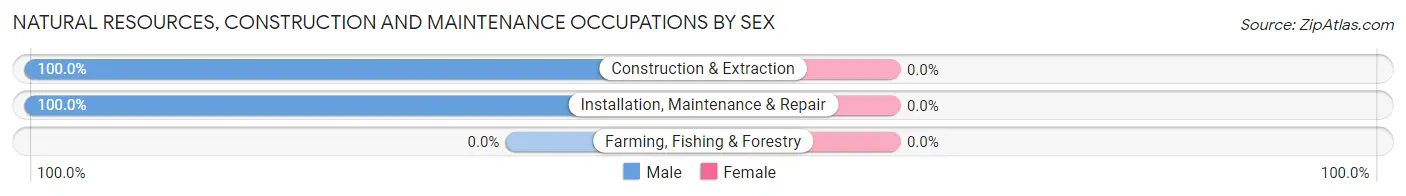
| Occupation | Male | Female |
| Farming, Fishing & Forestry | 0 (0.0%) | 0 (0.0%) |
| Construction & Extraction | 120 (100.0%) | 0 (0.0%) |
| Installation, Maintenance & Repair | 65 (100.0%) | 0 (0.0%) |
| Total (Category) | 185 (100.0%) | 0 (0.0%) |
| Total (Overall) | 3,473 (45.2%) | 4,208 (54.8%) |
Production, Transportation and Moving Occupations
The most common Production, Transportation and Moving occupations in Ardmore are Transportation (126 | 1.6%), Material Moving (50 | 0.6%), and Production (41 | 0.5%).
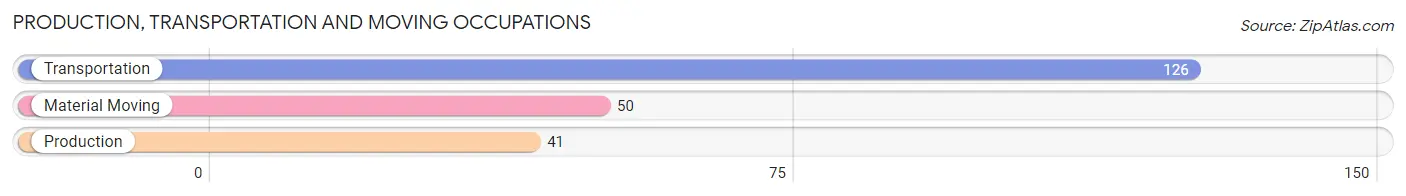
Production, Transportation and Moving Occupations by Sex
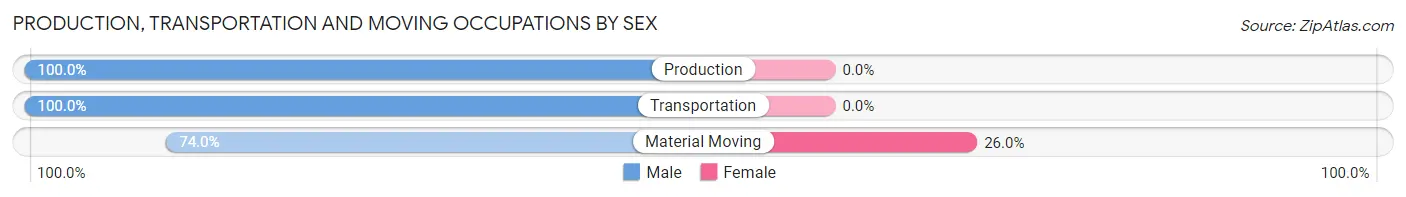
| Occupation | Male | Female |
| Production | 41 (100.0%) | 0 (0.0%) |
| Transportation | 126 (100.0%) | 0 (0.0%) |
| Material Moving | 37 (74.0%) | 13 (26.0%) |
| Total (Category) | 204 (94.0%) | 13 (6.0%) |
| Total (Overall) | 3,473 (45.2%) | 4,208 (54.8%) |
Employment Industries by Sex in Ardmore
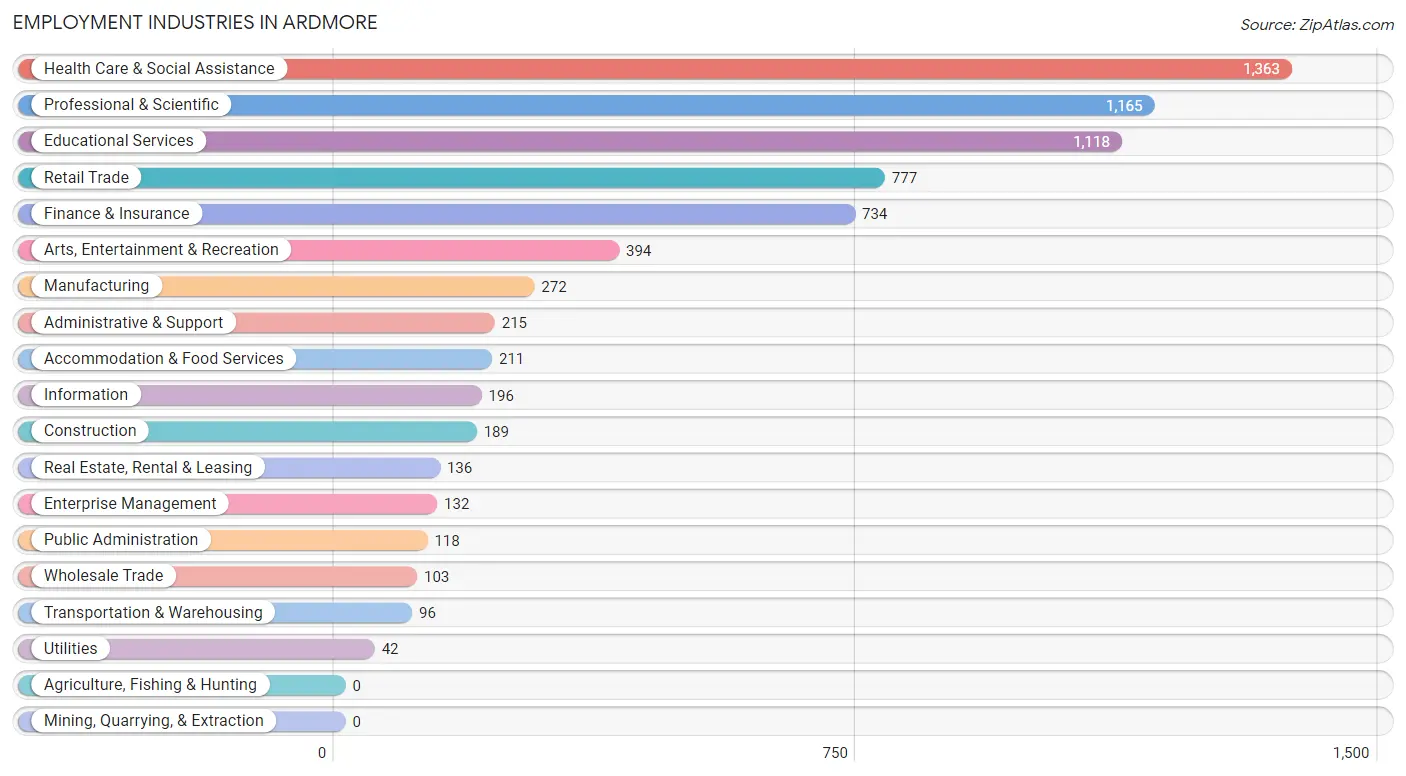
Employment Industries in Ardmore
The major employment industries in Ardmore include Health Care & Social Assistance (1,363 | 17.7%), Professional & Scientific (1,165 | 15.2%), Educational Services (1,118 | 14.6%), Retail Trade (777 | 10.1%), and Finance & Insurance (734 | 9.6%).
Employment Industries by Sex in Ardmore
The Ardmore industries that see more men than women are Utilities (100.0%), Transportation & Warehousing (91.7%), and Construction (87.8%), whereas the industries that tend to have a higher number of women are Health Care & Social Assistance (79.5%), Retail Trade (64.0%), and Educational Services (63.4%).
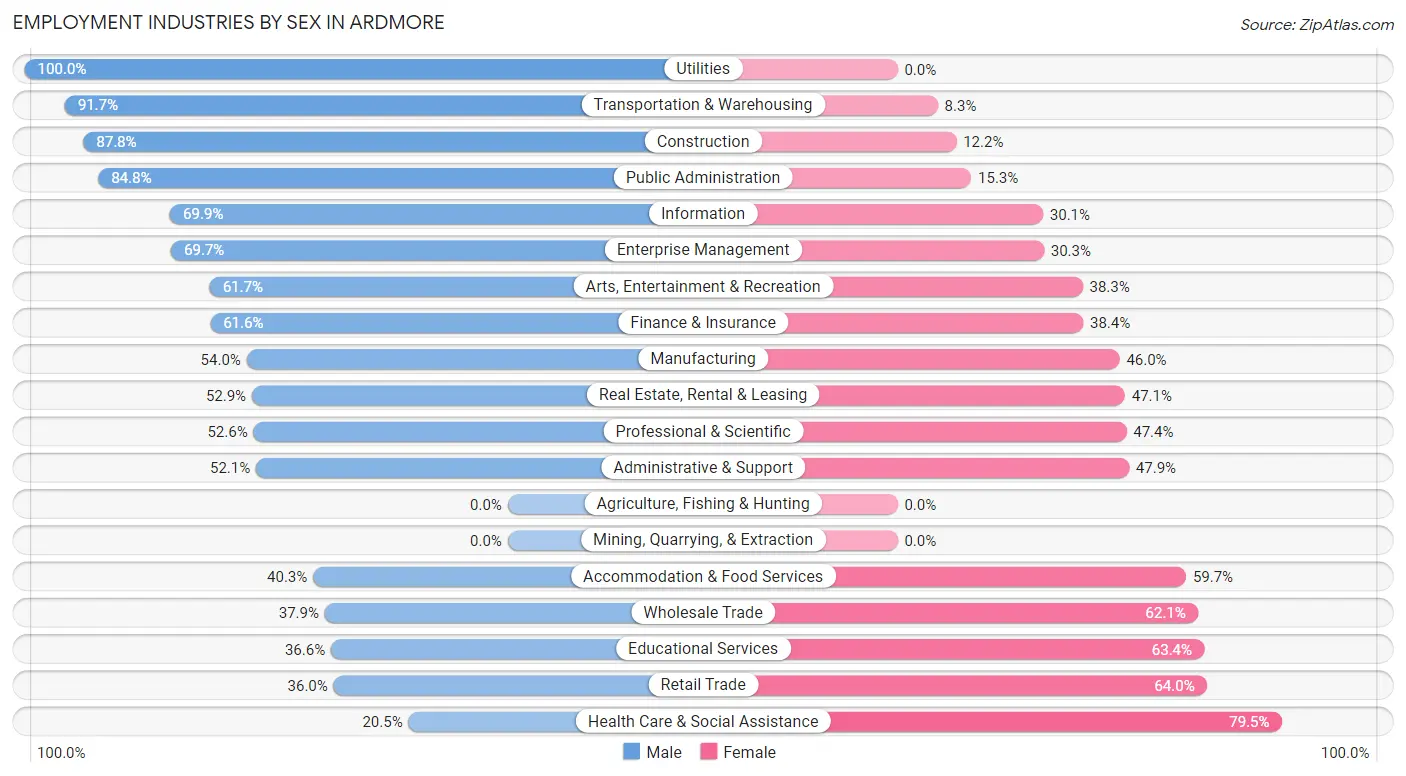
| Industry | Male | Female |
| Agriculture, Fishing & Hunting | 0 (0.0%) | 0 (0.0%) |
| Mining, Quarrying, & Extraction | 0 (0.0%) | 0 (0.0%) |
| Construction | 166 (87.8%) | 23 (12.2%) |
| Manufacturing | 147 (54.0%) | 125 (46.0%) |
| Wholesale Trade | 39 (37.9%) | 64 (62.1%) |
| Retail Trade | 280 (36.0%) | 497 (64.0%) |
| Transportation & Warehousing | 88 (91.7%) | 8 (8.3%) |
| Utilities | 42 (100.0%) | 0 (0.0%) |
| Information | 137 (69.9%) | 59 (30.1%) |
| Finance & Insurance | 452 (61.6%) | 282 (38.4%) |
| Real Estate, Rental & Leasing | 72 (52.9%) | 64 (47.1%) |
| Professional & Scientific | 613 (52.6%) | 552 (47.4%) |
| Enterprise Management | 92 (69.7%) | 40 (30.3%) |
| Administrative & Support | 112 (52.1%) | 103 (47.9%) |
| Educational Services | 409 (36.6%) | 709 (63.4%) |
| Health Care & Social Assistance | 280 (20.5%) | 1,083 (79.5%) |
| Arts, Entertainment & Recreation | 243 (61.7%) | 151 (38.3%) |
| Accommodation & Food Services | 85 (40.3%) | 126 (59.7%) |
| Public Administration | 100 (84.8%) | 18 (15.2%) |
| Total | 3,473 (45.2%) | 4,208 (54.8%) |
Education in Ardmore
School Enrollment in Ardmore
The most common levels of schooling among the 3,322 students in Ardmore are elementary school (787 | 23.7%), middle school (750 | 22.6%), and high school (534 | 16.1%).
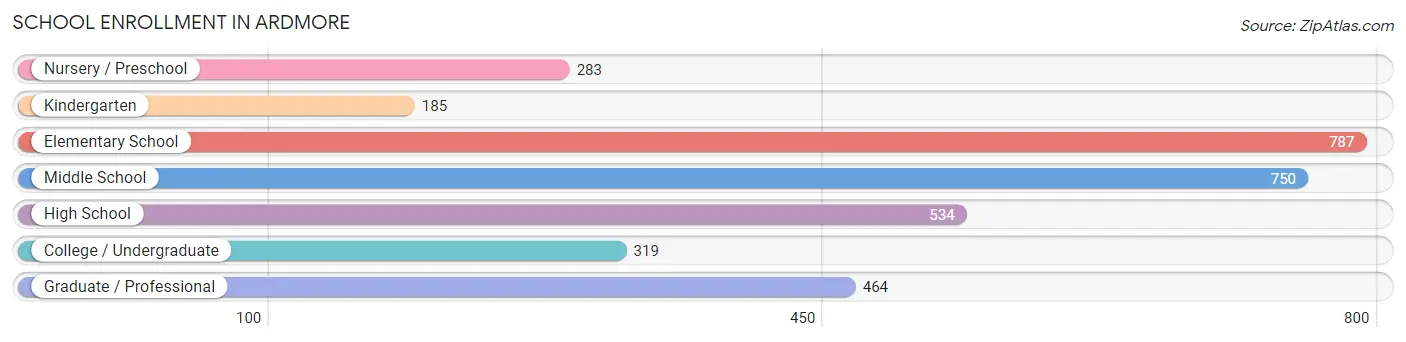
| School Level | # Students | % Students |
| Nursery / Preschool | 283 | 8.5% |
| Kindergarten | 185 | 5.6% |
| Elementary School | 787 | 23.7% |
| Middle School | 750 | 22.6% |
| High School | 534 | 16.1% |
| College / Undergraduate | 319 | 9.6% |
| Graduate / Professional | 464 | 14.0% |
| Total | 3,322 | 100.0% |
School Enrollment by Age by Funding Source in Ardmore
Out of a total of 3,322 students who are enrolled in schools in Ardmore, 1,090 (32.8%) attend a private institution, while the remaining 2,232 (67.2%) are enrolled in public schools. The age group of 25 to 34 year olds has the highest likelihood of being enrolled in private schools, with 162 (77.5% in the age bracket) enrolled. Conversely, the age group of 10 to 14 year olds has the lowest likelihood of being enrolled in a private school, with 941 (90.9% in the age bracket) attending a public institution.
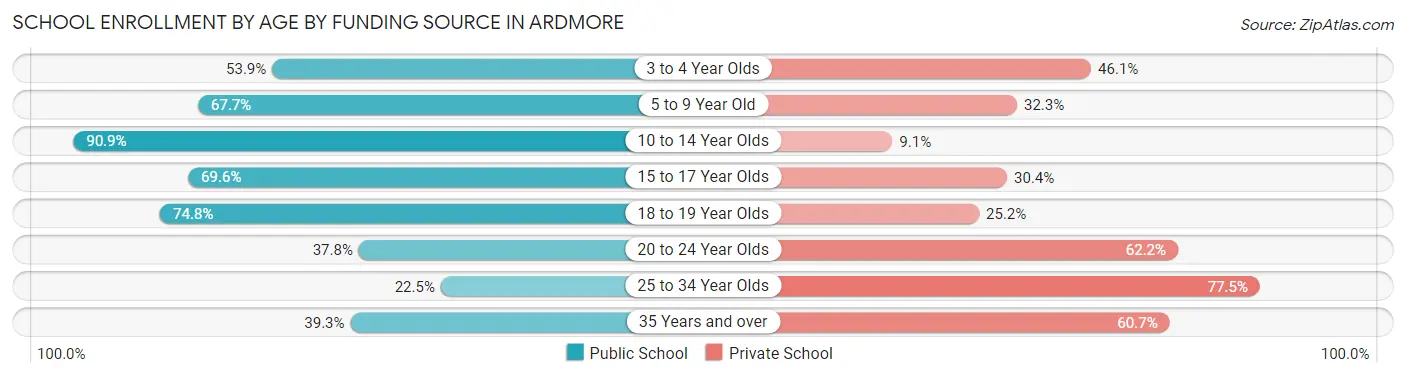
| Age Bracket | Public School | Private School |
| 3 to 4 Year Olds | 83 (53.9%) | 71 (46.1%) |
| 5 to 9 Year Old | 560 (67.7%) | 267 (32.3%) |
| 10 to 14 Year Olds | 941 (90.9%) | 94 (9.1%) |
| 15 to 17 Year Olds | 313 (69.6%) | 137 (30.4%) |
| 18 to 19 Year Olds | 83 (74.8%) | 28 (25.2%) |
| 20 to 24 Year Olds | 91 (37.8%) | 150 (62.2%) |
| 25 to 34 Year Olds | 47 (22.5%) | 162 (77.5%) |
| 35 Years and over | 116 (39.3%) | 179 (60.7%) |
| Total | 2,232 (67.2%) | 1,090 (32.8%) |
Educational Attainment by Field of Study in Ardmore
Business (1,326 | 16.3%), social sciences (1,184 | 14.5%), science & technology (826 | 10.1%), liberal arts & history (697 | 8.6%), and literature & languages (678 | 8.3%) are the most common fields of study among 8,147 individuals in Ardmore who have obtained a bachelor's degree or higher.
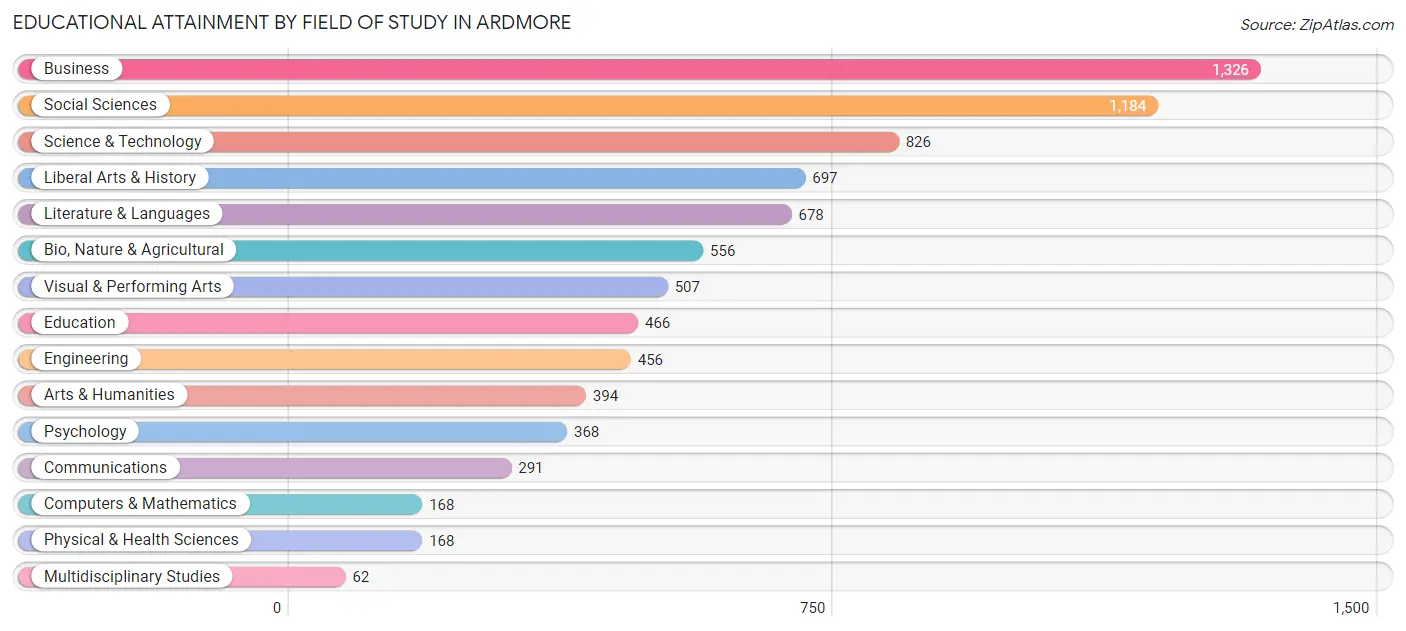
| Field of Study | # Graduates | % Graduates |
| Computers & Mathematics | 168 | 2.1% |
| Bio, Nature & Agricultural | 556 | 6.8% |
| Physical & Health Sciences | 168 | 2.1% |
| Psychology | 368 | 4.5% |
| Social Sciences | 1,184 | 14.5% |
| Engineering | 456 | 5.6% |
| Multidisciplinary Studies | 62 | 0.8% |
| Science & Technology | 826 | 10.1% |
| Business | 1,326 | 16.3% |
| Education | 466 | 5.7% |
| Literature & Languages | 678 | 8.3% |
| Liberal Arts & History | 697 | 8.6% |
| Visual & Performing Arts | 507 | 6.2% |
| Communications | 291 | 3.6% |
| Arts & Humanities | 394 | 4.8% |
| Total | 8,147 | 100.0% |
Transportation & Commute in Ardmore
Vehicle Availability by Sex in Ardmore
The most prevalent vehicle ownership categories in Ardmore are males with 2 vehicles (2,093, accounting for 60.7%) and females with 2 vehicles (2,168, making up 50.6%).
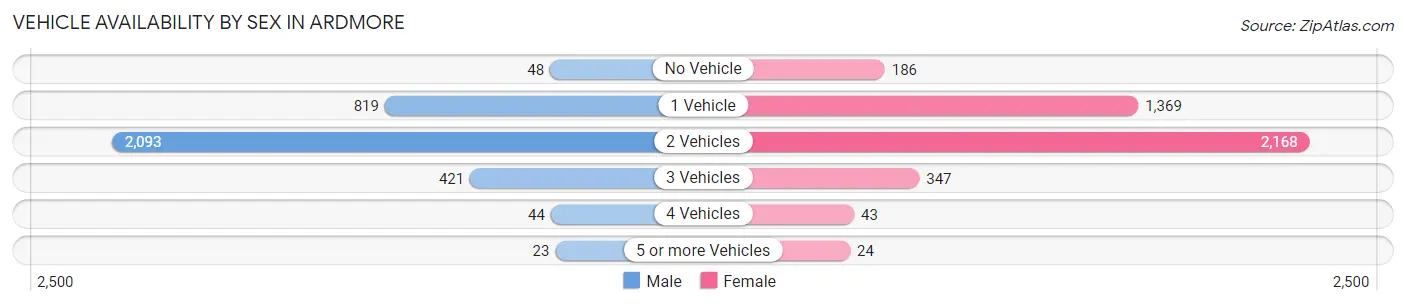
| Vehicles Available | Male | Female |
| No Vehicle | 48 (1.4%) | 186 (4.5%) |
| 1 Vehicle | 819 (23.7%) | 1,369 (33.1%) |
| 2 Vehicles | 2,093 (60.7%) | 2,168 (52.4%) |
| 3 Vehicles | 421 (12.2%) | 347 (8.4%) |
| 4 Vehicles | 44 (1.3%) | 43 (1.0%) |
| 5 or more Vehicles | 23 (0.7%) | 24 (0.6%) |
| Total | 3,448 (100.0%) | 4,137 (100.0%) |
Commute Time in Ardmore
The most frequently occuring commute durations in Ardmore are 10 to 14 minutes (958 commuters, 16.3%), 30 to 34 minutes (765 commuters, 13.0%), and 15 to 19 minutes (706 commuters, 12.0%).
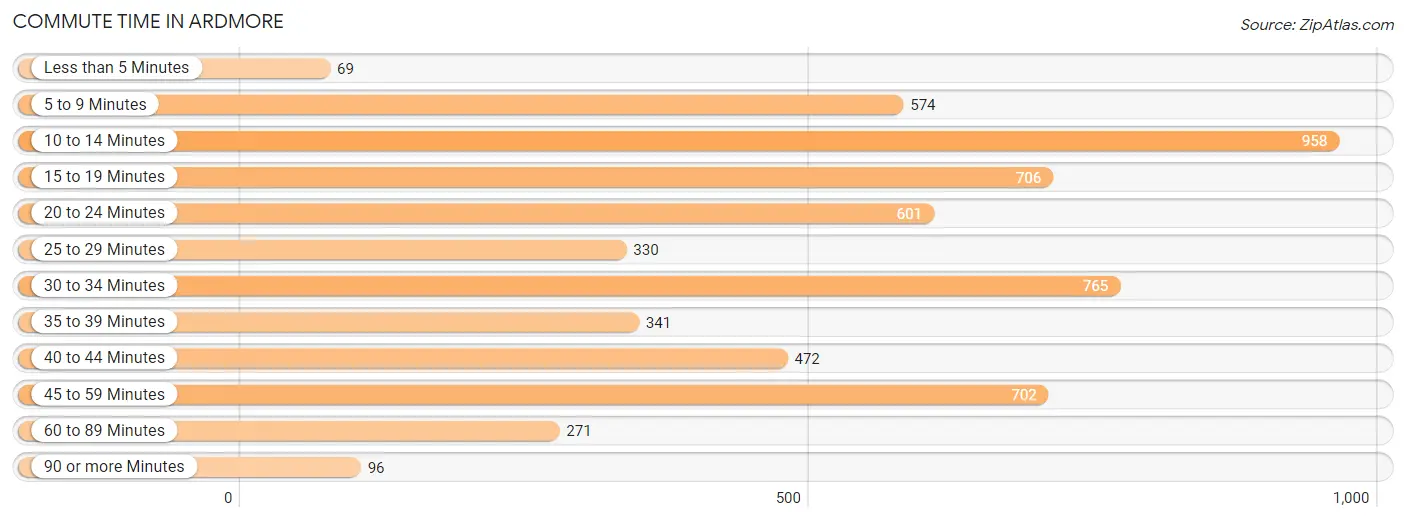
| Commute Time | # Commuters | % Commuters |
| Less than 5 Minutes | 69 | 1.2% |
| 5 to 9 Minutes | 574 | 9.8% |
| 10 to 14 Minutes | 958 | 16.3% |
| 15 to 19 Minutes | 706 | 12.0% |
| 20 to 24 Minutes | 601 | 10.2% |
| 25 to 29 Minutes | 330 | 5.6% |
| 30 to 34 Minutes | 765 | 13.0% |
| 35 to 39 Minutes | 341 | 5.8% |
| 40 to 44 Minutes | 472 | 8.0% |
| 45 to 59 Minutes | 702 | 11.9% |
| 60 to 89 Minutes | 271 | 4.6% |
| 90 or more Minutes | 96 | 1.6% |
Commute Time by Sex in Ardmore
The most common commute times in Ardmore are 20 to 24 minutes (409 commuters, 15.2%) for males and 10 to 14 minutes (598 commuters, 18.7%) for females.
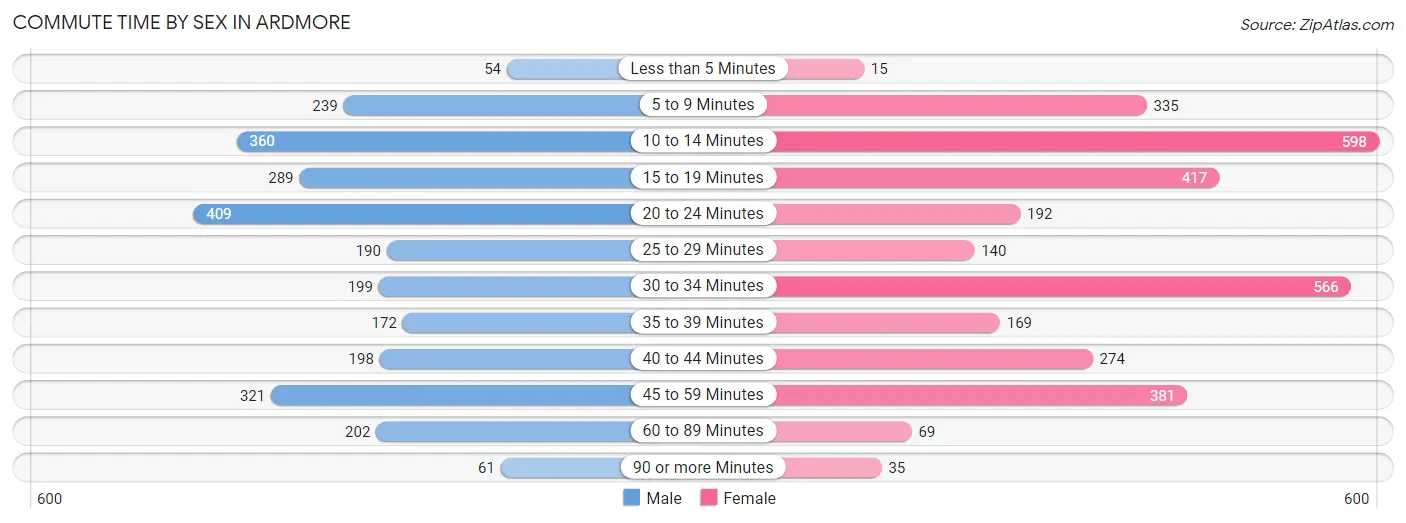
| Commute Time | Male | Female |
| Less than 5 Minutes | 54 (2.0%) | 15 (0.5%) |
| 5 to 9 Minutes | 239 (8.9%) | 335 (10.5%) |
| 10 to 14 Minutes | 360 (13.4%) | 598 (18.7%) |
| 15 to 19 Minutes | 289 (10.7%) | 417 (13.1%) |
| 20 to 24 Minutes | 409 (15.2%) | 192 (6.0%) |
| 25 to 29 Minutes | 190 (7.0%) | 140 (4.4%) |
| 30 to 34 Minutes | 199 (7.4%) | 566 (17.7%) |
| 35 to 39 Minutes | 172 (6.4%) | 169 (5.3%) |
| 40 to 44 Minutes | 198 (7.3%) | 274 (8.6%) |
| 45 to 59 Minutes | 321 (11.9%) | 381 (11.9%) |
| 60 to 89 Minutes | 202 (7.5%) | 69 (2.2%) |
| 90 or more Minutes | 61 (2.3%) | 35 (1.1%) |
Time of Departure to Work by Sex in Ardmore
The most frequent times of departure to work in Ardmore are 8:00 AM to 8:29 AM (475, 17.6%) for males and 7:30 AM to 7:59 AM (715, 22.4%) for females.
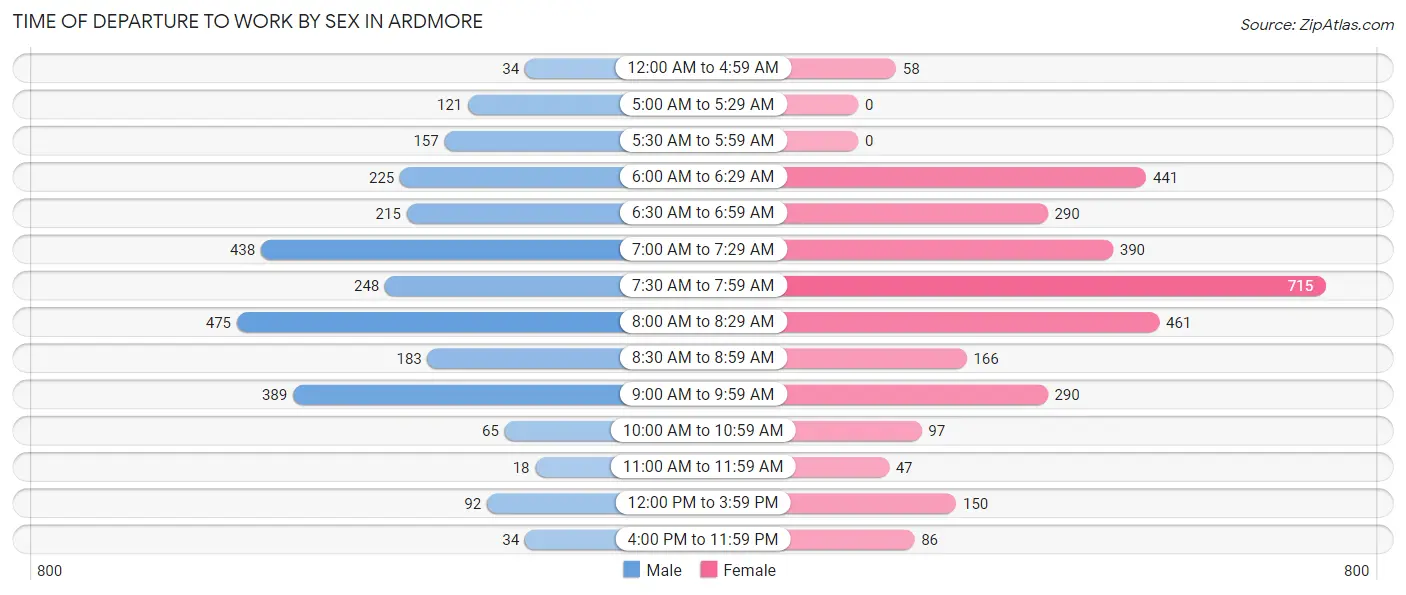
| Time of Departure | Male | Female |
| 12:00 AM to 4:59 AM | 34 (1.3%) | 58 (1.8%) |
| 5:00 AM to 5:29 AM | 121 (4.5%) | 0 (0.0%) |
| 5:30 AM to 5:59 AM | 157 (5.8%) | 0 (0.0%) |
| 6:00 AM to 6:29 AM | 225 (8.4%) | 441 (13.8%) |
| 6:30 AM to 6:59 AM | 215 (8.0%) | 290 (9.1%) |
| 7:00 AM to 7:29 AM | 438 (16.3%) | 390 (12.2%) |
| 7:30 AM to 7:59 AM | 248 (9.2%) | 715 (22.4%) |
| 8:00 AM to 8:29 AM | 475 (17.6%) | 461 (14.4%) |
| 8:30 AM to 8:59 AM | 183 (6.8%) | 166 (5.2%) |
| 9:00 AM to 9:59 AM | 389 (14.4%) | 290 (9.1%) |
| 10:00 AM to 10:59 AM | 65 (2.4%) | 97 (3.0%) |
| 11:00 AM to 11:59 AM | 18 (0.7%) | 47 (1.5%) |
| 12:00 PM to 3:59 PM | 92 (3.4%) | 150 (4.7%) |
| 4:00 PM to 11:59 PM | 34 (1.3%) | 86 (2.7%) |
| Total | 2,694 (100.0%) | 3,191 (100.0%) |
Housing Occupancy in Ardmore
Occupancy by Ownership in Ardmore
Of the total 6,305 dwellings in Ardmore, owner-occupied units account for 4,096 (65.0%), while renter-occupied units make up 2,209 (35.0%).
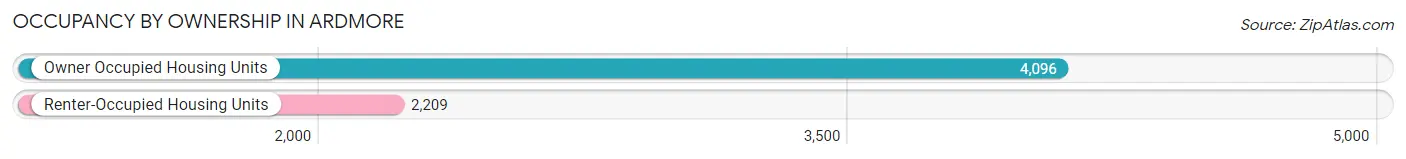
| Occupancy | # Housing Units | % Housing Units |
| Owner Occupied Housing Units | 4,096 | 65.0% |
| Renter-Occupied Housing Units | 2,209 | 35.0% |
| Total Occupied Housing Units | 6,305 | 100.0% |
Occupancy by Household Size in Ardmore
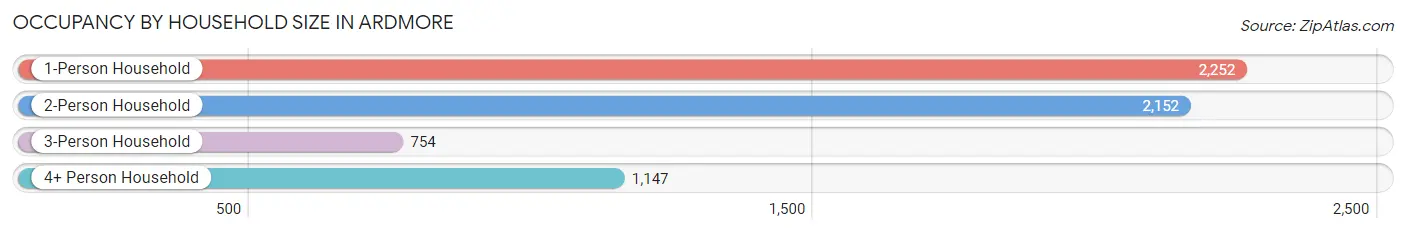
| Household Size | # Housing Units | % Housing Units |
| 1-Person Household | 2,252 | 35.7% |
| 2-Person Household | 2,152 | 34.1% |
| 3-Person Household | 754 | 12.0% |
| 4+ Person Household | 1,147 | 18.2% |
| Total Housing Units | 6,305 | 100.0% |
Occupancy by Ownership by Household Size in Ardmore
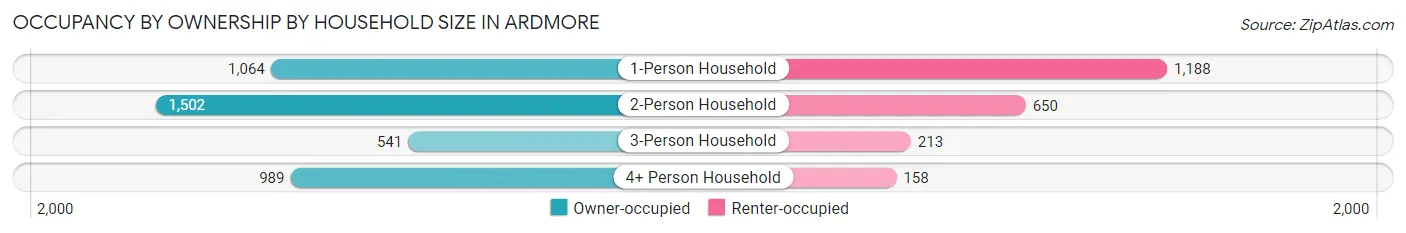
| Household Size | Owner-occupied | Renter-occupied |
| 1-Person Household | 1,064 (47.2%) | 1,188 (52.7%) |
| 2-Person Household | 1,502 (69.8%) | 650 (30.2%) |
| 3-Person Household | 541 (71.8%) | 213 (28.2%) |
| 4+ Person Household | 989 (86.2%) | 158 (13.8%) |
| Total Housing Units | 4,096 (65.0%) | 2,209 (35.0%) |
Occupancy by Educational Attainment in Ardmore
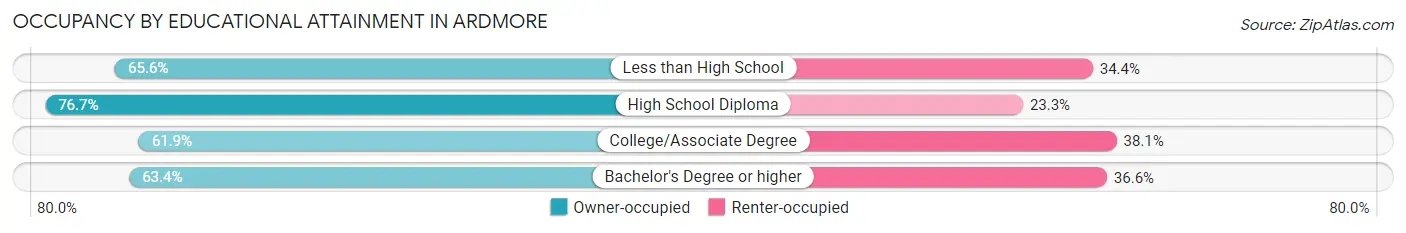
| Household Size | Owner-occupied | Renter-occupied |
| Less than High School | 107 (65.6%) | 56 (34.4%) |
| High School Diploma | 613 (76.7%) | 186 (23.3%) |
| College/Associate Degree | 474 (61.9%) | 292 (38.1%) |
| Bachelor's Degree or higher | 2,902 (63.4%) | 1,675 (36.6%) |
Occupancy by Age of Householder in Ardmore
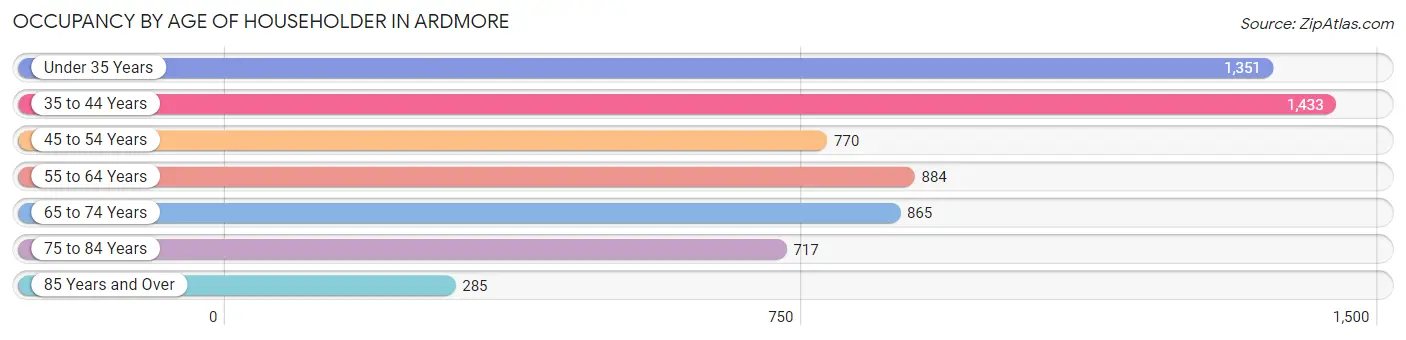
| Age Bracket | # Households | % Households |
| Under 35 Years | 1,351 | 21.4% |
| 35 to 44 Years | 1,433 | 22.7% |
| 45 to 54 Years | 770 | 12.2% |
| 55 to 64 Years | 884 | 14.0% |
| 65 to 74 Years | 865 | 13.7% |
| 75 to 84 Years | 717 | 11.4% |
| 85 Years and Over | 285 | 4.5% |
| Total | 6,305 | 100.0% |
Housing Finances in Ardmore
Median Income by Occupancy in Ardmore
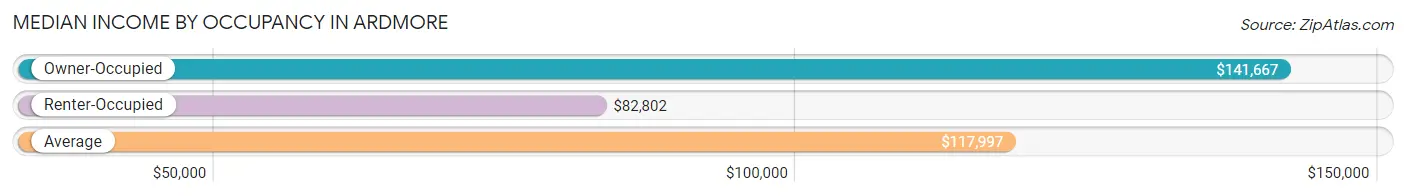
| Occupancy Type | # Households | Median Income |
| Owner-Occupied | 4,096 (65.0%) | $141,667 |
| Renter-Occupied | 2,209 (35.0%) | $82,802 |
| Average | 6,305 (100.0%) | $117,997 |
Occupancy by Householder Income Bracket in Ardmore
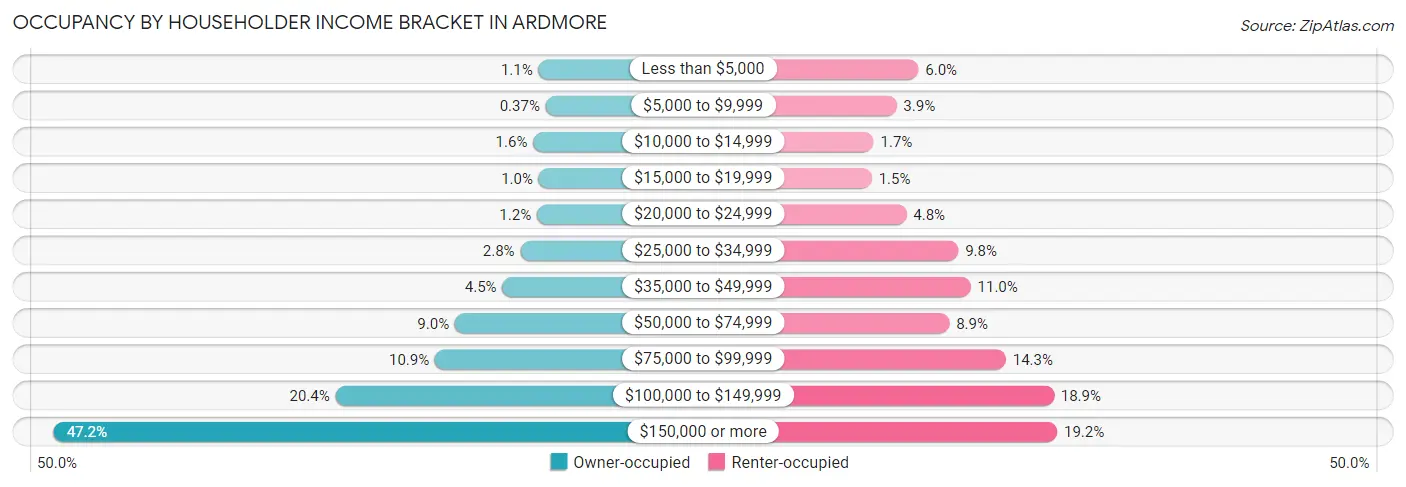
| Income Bracket | Owner-occupied | Renter-occupied |
| Less than $5,000 | 43 (1.1%) | 132 (6.0%) |
| $5,000 to $9,999 | 15 (0.4%) | 86 (3.9%) |
| $10,000 to $14,999 | 64 (1.6%) | 38 (1.7%) |
| $15,000 to $19,999 | 42 (1.0%) | 34 (1.5%) |
| $20,000 to $24,999 | 49 (1.2%) | 107 (4.8%) |
| $25,000 to $34,999 | 114 (2.8%) | 216 (9.8%) |
| $35,000 to $49,999 | 184 (4.5%) | 242 (11.0%) |
| $50,000 to $74,999 | 369 (9.0%) | 197 (8.9%) |
| $75,000 to $99,999 | 447 (10.9%) | 316 (14.3%) |
| $100,000 to $149,999 | 835 (20.4%) | 417 (18.9%) |
| $150,000 or more | 1,934 (47.2%) | 424 (19.2%) |
| Total | 4,096 (100.0%) | 2,209 (100.0%) |
Monthly Housing Cost Tiers in Ardmore
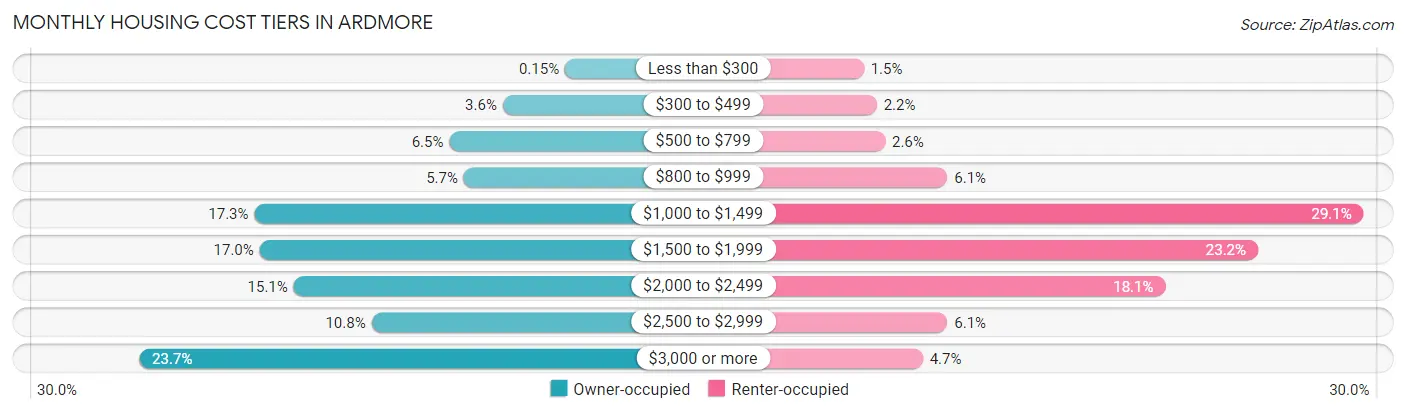
| Monthly Cost | Owner-occupied | Renter-occupied |
| Less than $300 | 6 (0.2%) | 32 (1.5%) |
| $300 to $499 | 147 (3.6%) | 48 (2.2%) |
| $500 to $799 | 268 (6.5%) | 58 (2.6%) |
| $800 to $999 | 235 (5.7%) | 134 (6.1%) |
| $1,000 to $1,499 | 709 (17.3%) | 642 (29.1%) |
| $1,500 to $1,999 | 697 (17.0%) | 513 (23.2%) |
| $2,000 to $2,499 | 620 (15.1%) | 400 (18.1%) |
| $2,500 to $2,999 | 444 (10.8%) | 134 (6.1%) |
| $3,000 or more | 970 (23.7%) | 104 (4.7%) |
| Total | 4,096 (100.0%) | 2,209 (100.0%) |
Physical Housing Characteristics in Ardmore
Housing Structures in Ardmore
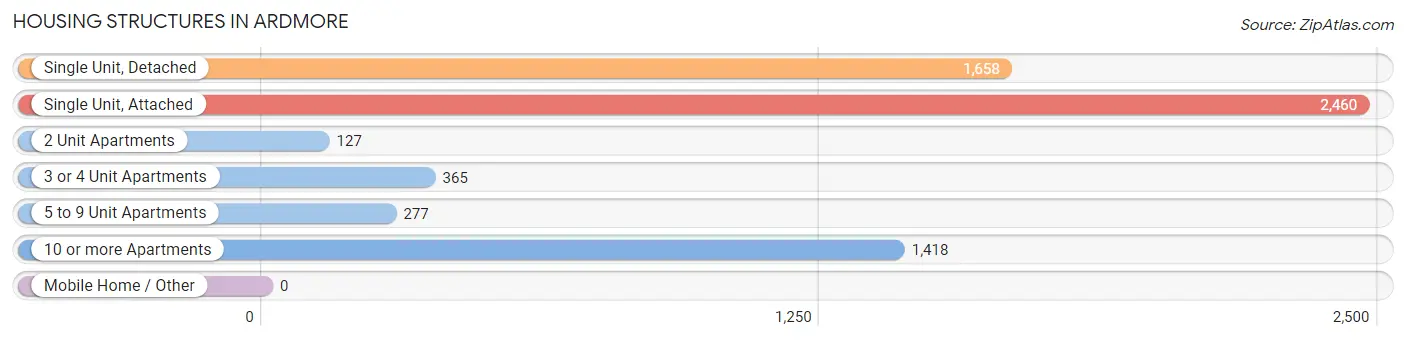
| Structure Type | # Housing Units | % Housing Units |
| Single Unit, Detached | 1,658 | 26.3% |
| Single Unit, Attached | 2,460 | 39.0% |
| 2 Unit Apartments | 127 | 2.0% |
| 3 or 4 Unit Apartments | 365 | 5.8% |
| 5 to 9 Unit Apartments | 277 | 4.4% |
| 10 or more Apartments | 1,418 | 22.5% |
| Mobile Home / Other | 0 | 0.0% |
| Total | 6,305 | 100.0% |
Housing Structures by Occupancy in Ardmore
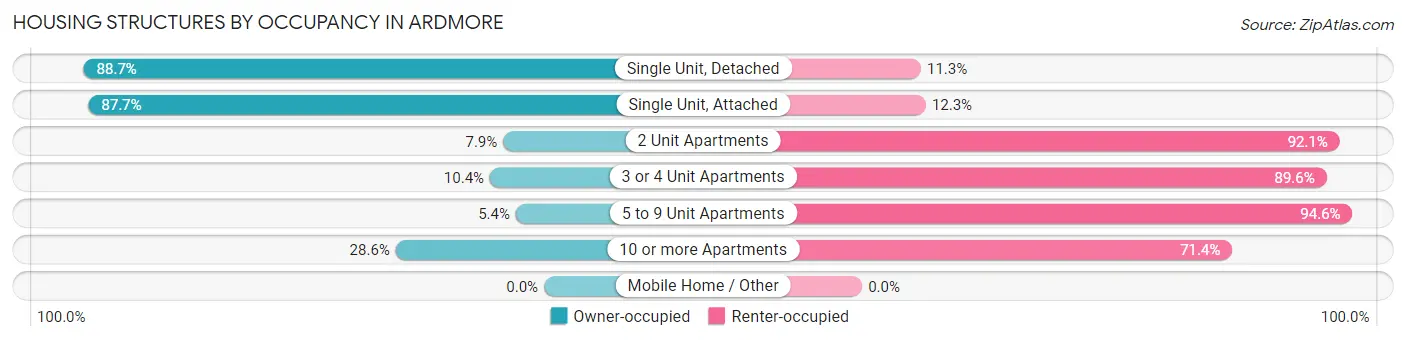
| Structure Type | Owner-occupied | Renter-occupied |
| Single Unit, Detached | 1,470 (88.7%) | 188 (11.3%) |
| Single Unit, Attached | 2,158 (87.7%) | 302 (12.3%) |
| 2 Unit Apartments | 10 (7.9%) | 117 (92.1%) |
| 3 or 4 Unit Apartments | 38 (10.4%) | 327 (89.6%) |
| 5 to 9 Unit Apartments | 15 (5.4%) | 262 (94.6%) |
| 10 or more Apartments | 405 (28.6%) | 1,013 (71.4%) |
| Mobile Home / Other | 0 (0.0%) | 0 (0.0%) |
| Total | 4,096 (65.0%) | 2,209 (35.0%) |
Housing Structures by Number of Rooms in Ardmore
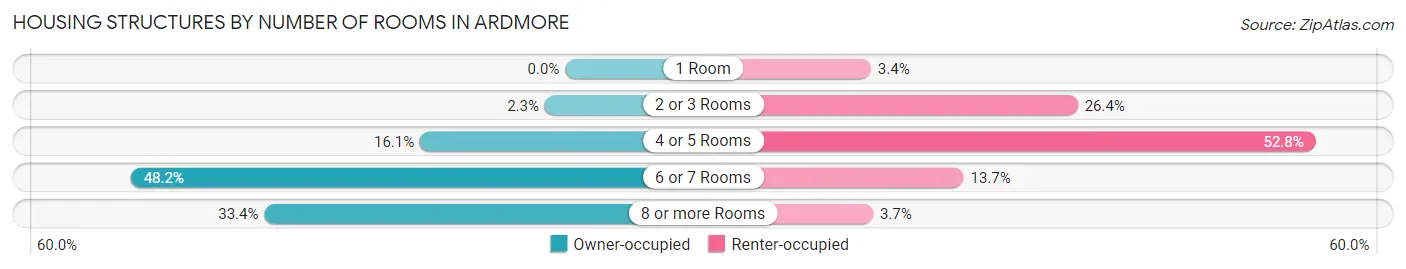
| Number of Rooms | Owner-occupied | Renter-occupied |
| 1 Room | 0 (0.0%) | 76 (3.4%) |
| 2 or 3 Rooms | 93 (2.3%) | 583 (26.4%) |
| 4 or 5 Rooms | 660 (16.1%) | 1,166 (52.8%) |
| 6 or 7 Rooms | 1,975 (48.2%) | 303 (13.7%) |
| 8 or more Rooms | 1,368 (33.4%) | 81 (3.7%) |
| Total | 4,096 (100.0%) | 2,209 (100.0%) |
Housing Structure by Heating Type in Ardmore
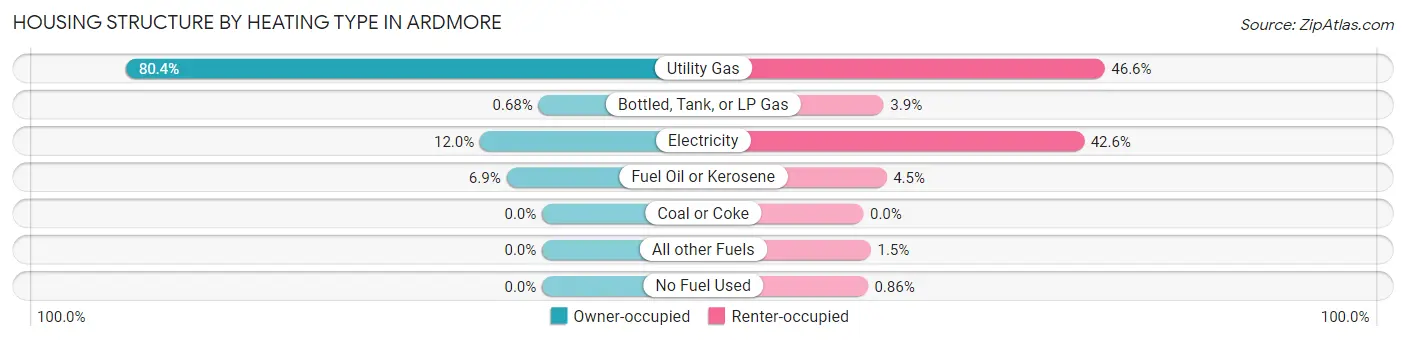
| Heating Type | Owner-occupied | Renter-occupied |
| Utility Gas | 3,295 (80.4%) | 1,030 (46.6%) |
| Bottled, Tank, or LP Gas | 28 (0.7%) | 87 (3.9%) |
| Electricity | 491 (12.0%) | 942 (42.6%) |
| Fuel Oil or Kerosene | 282 (6.9%) | 99 (4.5%) |
| Coal or Coke | 0 (0.0%) | 0 (0.0%) |
| All other Fuels | 0 (0.0%) | 32 (1.5%) |
| No Fuel Used | 0 (0.0%) | 19 (0.9%) |
| Total | 4,096 (100.0%) | 2,209 (100.0%) |
Household Vehicle Usage in Ardmore
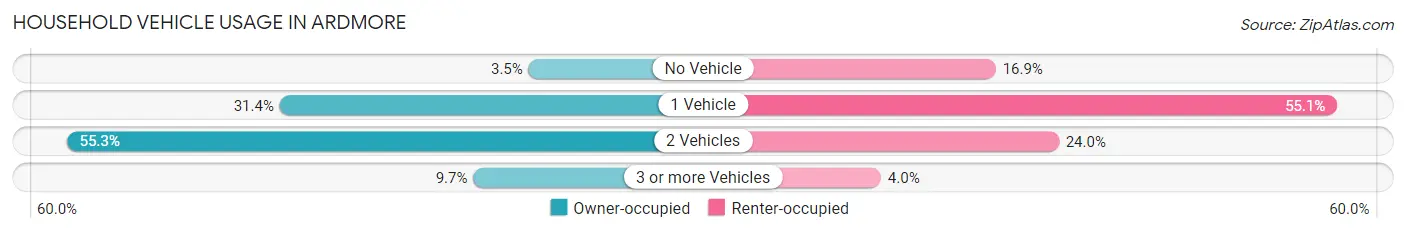
| Vehicles per Household | Owner-occupied | Renter-occupied |
| No Vehicle | 145 (3.5%) | 373 (16.9%) |
| 1 Vehicle | 1,287 (31.4%) | 1,218 (55.1%) |
| 2 Vehicles | 2,265 (55.3%) | 529 (23.9%) |
| 3 or more Vehicles | 399 (9.7%) | 89 (4.0%) |
| Total | 4,096 (100.0%) | 2,209 (100.0%) |
Real Estate & Mortgages in Ardmore
Real Estate and Mortgage Overview in Ardmore
| Characteristic | Without Mortgage | With Mortgage |
| Housing Units | 1,209 | 2,887 |
| Median Property Value | $397,500 | $430,400 |
| Median Household Income | $84,327 | $1,677 |
| Monthly Housing Costs | $1,059 | $947 |
| Real Estate Taxes | $6,028 | $0 |
Property Value by Mortgage Status in Ardmore
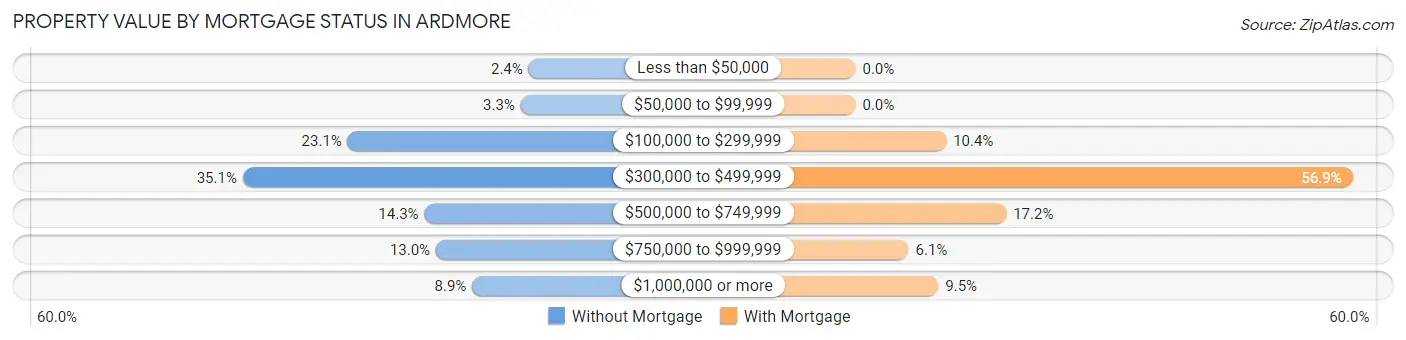
| Property Value | Without Mortgage | With Mortgage |
| Less than $50,000 | 29 (2.4%) | 0 (0.0%) |
| $50,000 to $99,999 | 40 (3.3%) | 0 (0.0%) |
| $100,000 to $299,999 | 279 (23.1%) | 299 (10.4%) |
| $300,000 to $499,999 | 424 (35.1%) | 1,643 (56.9%) |
| $500,000 to $749,999 | 173 (14.3%) | 497 (17.2%) |
| $750,000 to $999,999 | 157 (13.0%) | 175 (6.1%) |
| $1,000,000 or more | 107 (8.8%) | 273 (9.5%) |
| Total | 1,209 (100.0%) | 2,887 (100.0%) |
Household Income by Mortgage Status in Ardmore
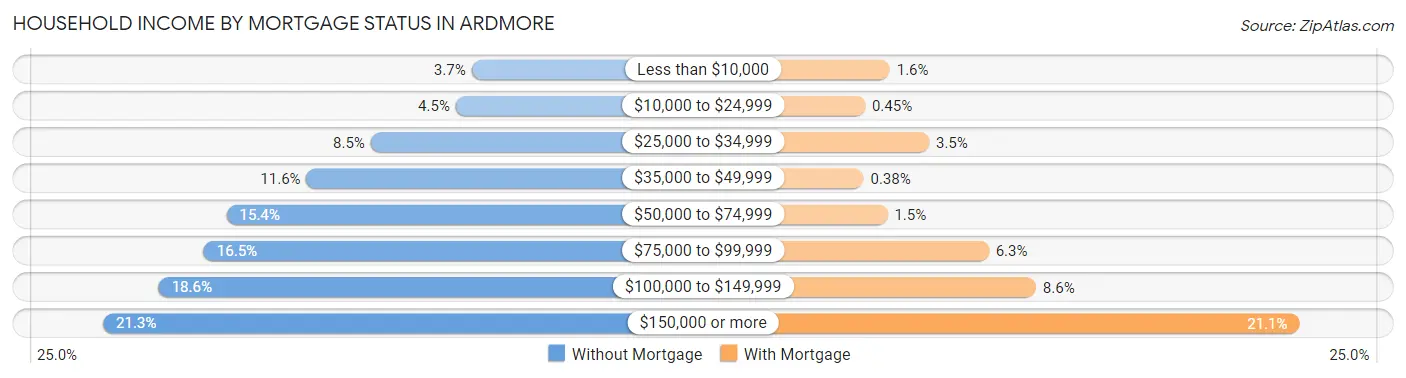
| Household Income | Without Mortgage | With Mortgage |
| Less than $10,000 | 45 (3.7%) | 47 (1.6%) |
| $10,000 to $24,999 | 54 (4.5%) | 13 (0.4%) |
| $25,000 to $34,999 | 103 (8.5%) | 101 (3.5%) |
| $35,000 to $49,999 | 140 (11.6%) | 11 (0.4%) |
| $50,000 to $74,999 | 186 (15.4%) | 44 (1.5%) |
| $75,000 to $99,999 | 199 (16.5%) | 183 (6.3%) |
| $100,000 to $149,999 | 225 (18.6%) | 248 (8.6%) |
| $150,000 or more | 257 (21.3%) | 610 (21.1%) |
| Total | 1,209 (100.0%) | 2,887 (100.0%) |
Property Value to Household Income Ratio in Ardmore
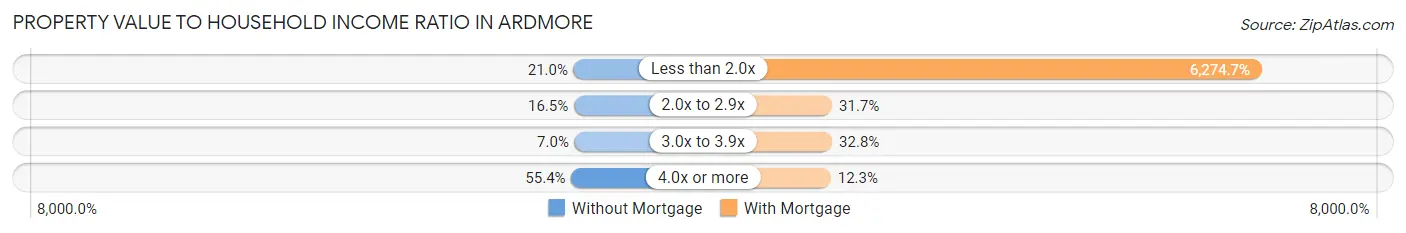
| Value-to-Income Ratio | Without Mortgage | With Mortgage |
| Less than 2.0x | 254 (21.0%) | 181,151 (6,274.7%) |
| 2.0x to 2.9x | 200 (16.5%) | 916 (31.7%) |
| 3.0x to 3.9x | 85 (7.0%) | 946 (32.8%) |
| 4.0x or more | 670 (55.4%) | 355 (12.3%) |
| Total | 1,209 (100.0%) | 2,887 (100.0%) |
Real Estate Taxes by Mortgage Status in Ardmore
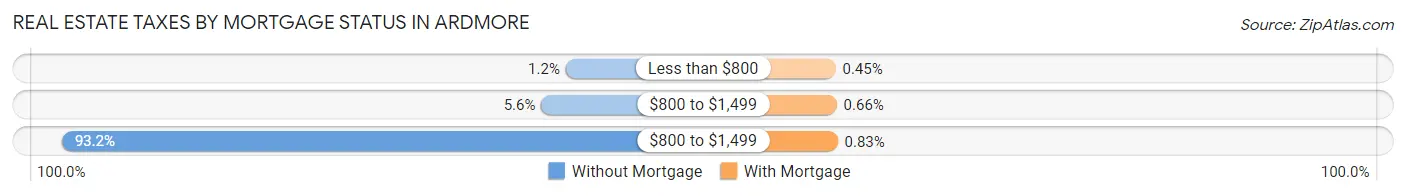
| Property Taxes | Without Mortgage | With Mortgage |
| Less than $800 | 14 (1.2%) | 13 (0.4%) |
| $800 to $1,499 | 68 (5.6%) | 19 (0.7%) |
| $800 to $1,499 | 1,127 (93.2%) | 24 (0.8%) |
| Total | 1,209 (100.0%) | 2,887 (100.0%) |
Health & Disability in Ardmore
Health Insurance Coverage by Age in Ardmore
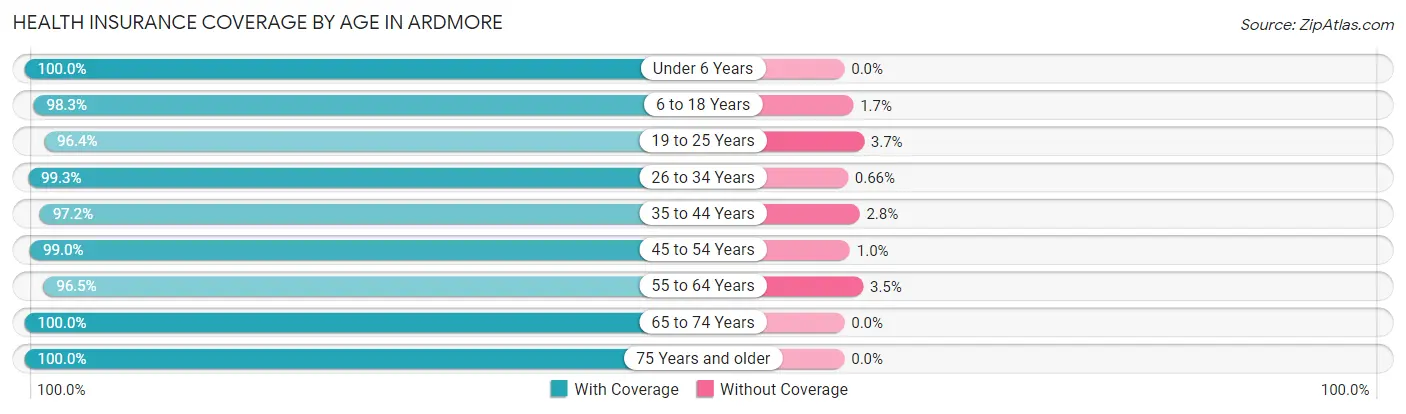
| Age Bracket | With Coverage | Without Coverage |
| Under 6 Years | 900 (100.0%) | 0 (0.0%) |
| 6 to 18 Years | 2,120 (98.3%) | 36 (1.7%) |
| 19 to 25 Years | 765 (96.4%) | 29 (3.6%) |
| 26 to 34 Years | 1,969 (99.3%) | 13 (0.7%) |
| 35 to 44 Years | 2,476 (97.2%) | 72 (2.8%) |
| 45 to 54 Years | 1,616 (99.0%) | 17 (1.0%) |
| 55 to 64 Years | 1,300 (96.5%) | 47 (3.5%) |
| 65 to 74 Years | 1,417 (100.0%) | 0 (0.0%) |
| 75 Years and older | 1,298 (100.0%) | 0 (0.0%) |
| Total | 13,861 (98.5%) | 214 (1.5%) |
Health Insurance Coverage by Citizenship Status in Ardmore
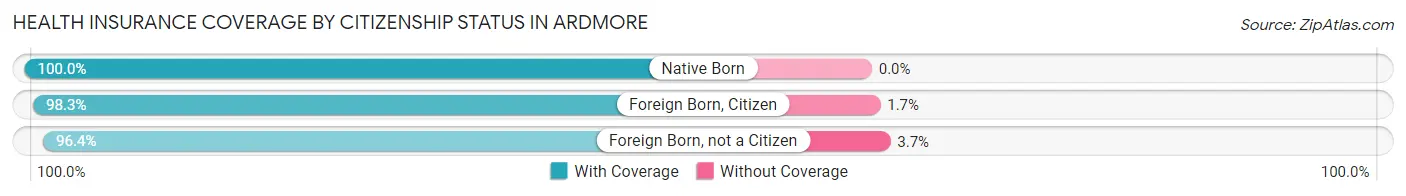
| Citizenship Status | With Coverage | Without Coverage |
| Native Born | 900 (100.0%) | 0 (0.0%) |
| Foreign Born, Citizen | 2,120 (98.3%) | 36 (1.7%) |
| Foreign Born, not a Citizen | 765 (96.4%) | 29 (3.6%) |
Health Insurance Coverage by Household Income in Ardmore
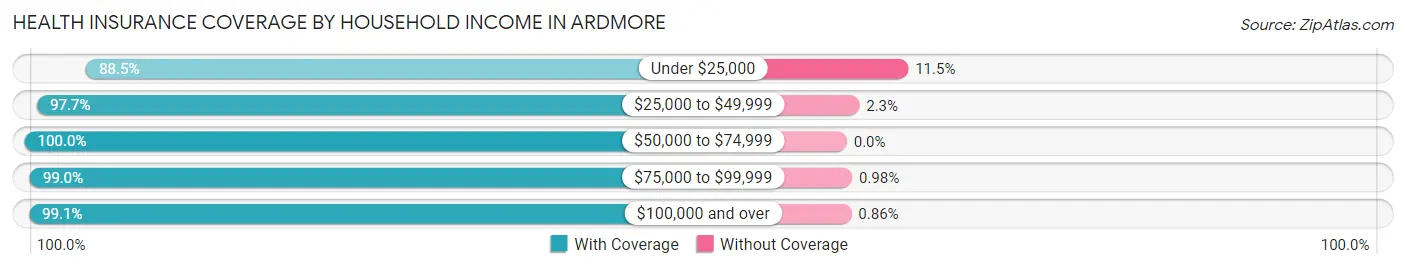
| Household Income | With Coverage | Without Coverage |
| Under $25,000 | 692 (88.5%) | 90 (11.5%) |
| $25,000 to $49,999 | 1,125 (97.7%) | 27 (2.3%) |
| $50,000 to $74,999 | 990 (100.0%) | 0 (0.0%) |
| $75,000 to $99,999 | 1,312 (99.0%) | 13 (1.0%) |
| $100,000 and over | 9,721 (99.1%) | 84 (0.9%) |
Public vs Private Health Insurance Coverage by Age in Ardmore
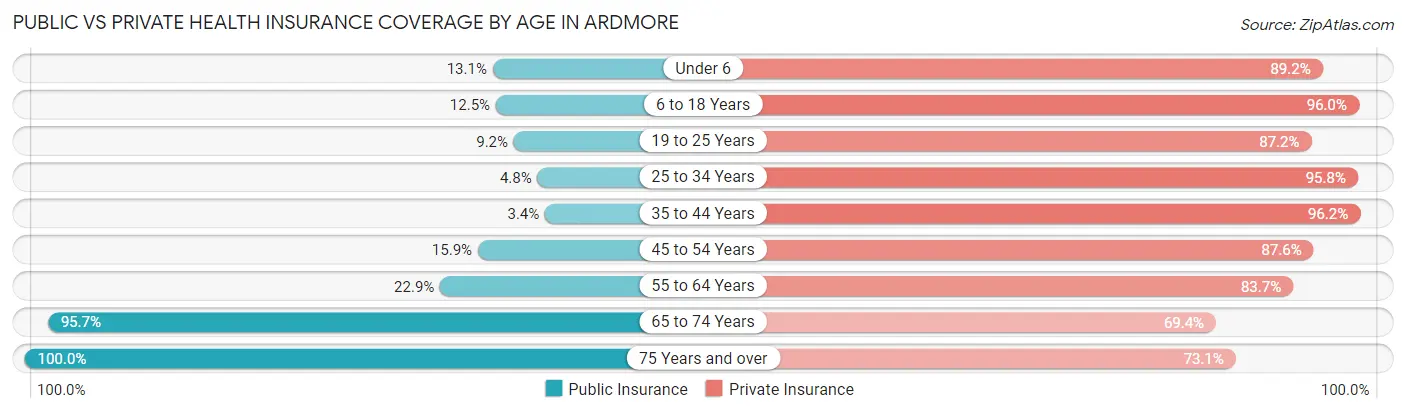
| Age Bracket | Public Insurance | Private Insurance |
| Under 6 | 118 (13.1%) | 803 (89.2%) |
| 6 to 18 Years | 270 (12.5%) | 2,069 (96.0%) |
| 19 to 25 Years | 73 (9.2%) | 692 (87.2%) |
| 25 to 34 Years | 95 (4.8%) | 1,898 (95.8%) |
| 35 to 44 Years | 86 (3.4%) | 2,451 (96.2%) |
| 45 to 54 Years | 259 (15.9%) | 1,430 (87.6%) |
| 55 to 64 Years | 308 (22.9%) | 1,128 (83.7%) |
| 65 to 74 Years | 1,356 (95.7%) | 984 (69.4%) |
| 75 Years and over | 1,298 (100.0%) | 949 (73.1%) |
| Total | 3,863 (27.5%) | 12,404 (88.1%) |
Disability Status by Sex by Age in Ardmore
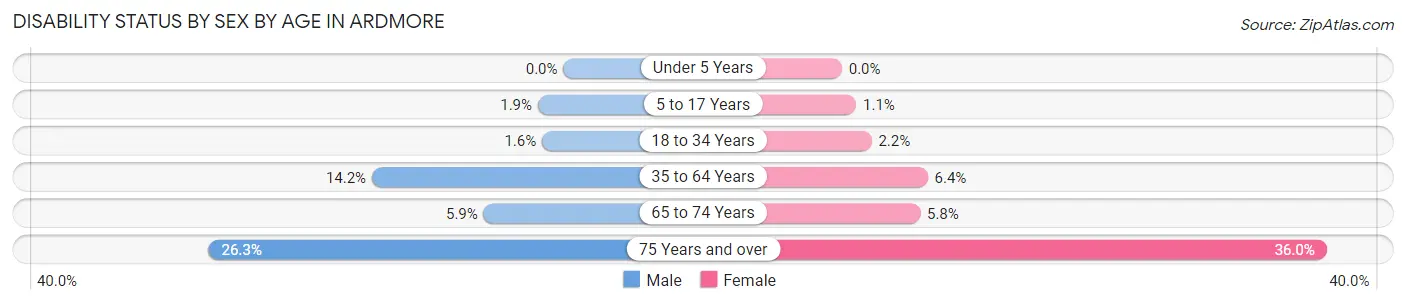
| Age Bracket | Male | Female |
| Under 5 Years | 0 (0.0%) | 0 (0.0%) |
| 5 to 17 Years | 24 (1.9%) | 11 (1.1%) |
| 18 to 34 Years | 21 (1.6%) | 33 (2.2%) |
| 35 to 64 Years | 366 (14.2%) | 188 (6.4%) |
| 65 to 74 Years | 34 (5.9%) | 49 (5.8%) |
| 75 Years and over | 118 (26.3%) | 306 (36.0%) |
Disability Class by Sex by Age in Ardmore
Disability Class: Hearing Difficulty
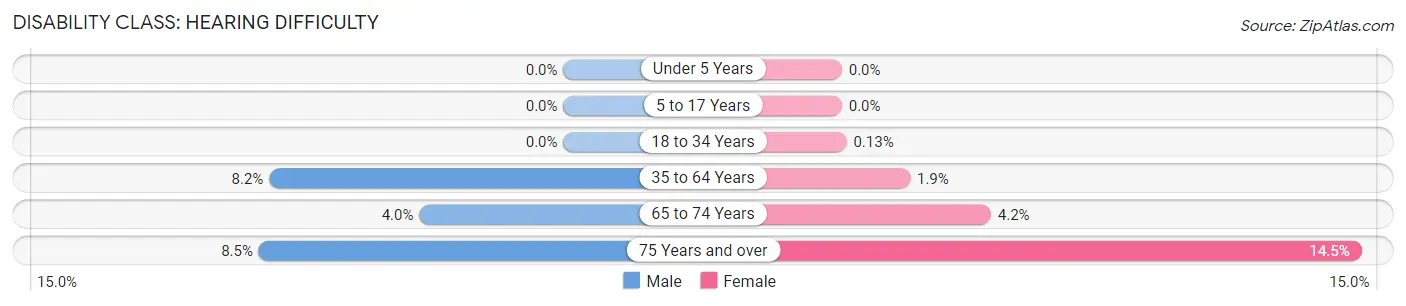
| Age Bracket | Male | Female |
| Under 5 Years | 0 (0.0%) | 0 (0.0%) |
| 5 to 17 Years | 0 (0.0%) | 0 (0.0%) |
| 18 to 34 Years | 0 (0.0%) | 2 (0.1%) |
| 35 to 64 Years | 211 (8.2%) | 56 (1.9%) |
| 65 to 74 Years | 23 (4.0%) | 35 (4.2%) |
| 75 Years and over | 38 (8.5%) | 123 (14.5%) |
Disability Class: Vision Difficulty
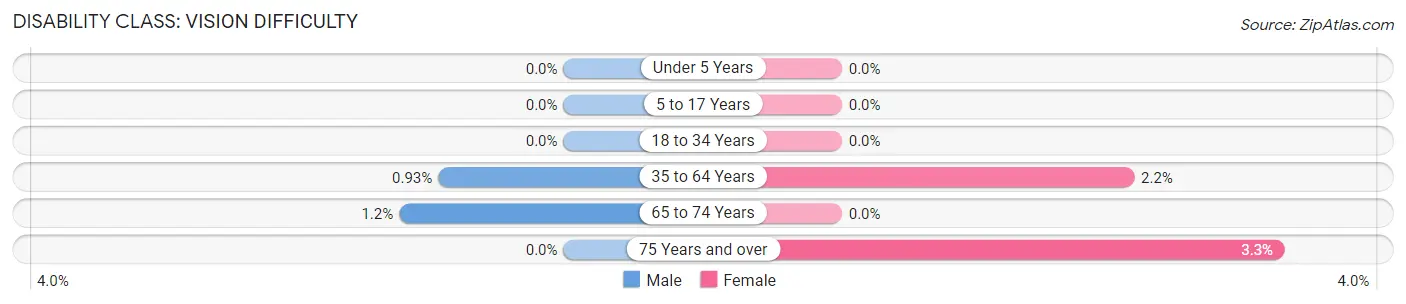
| Age Bracket | Male | Female |
| Under 5 Years | 0 (0.0%) | 0 (0.0%) |
| 5 to 17 Years | 0 (0.0%) | 0 (0.0%) |
| 18 to 34 Years | 0 (0.0%) | 0 (0.0%) |
| 35 to 64 Years | 24 (0.9%) | 64 (2.2%) |
| 65 to 74 Years | 7 (1.2%) | 0 (0.0%) |
| 75 Years and over | 0 (0.0%) | 28 (3.3%) |
Disability Class: Cognitive Difficulty
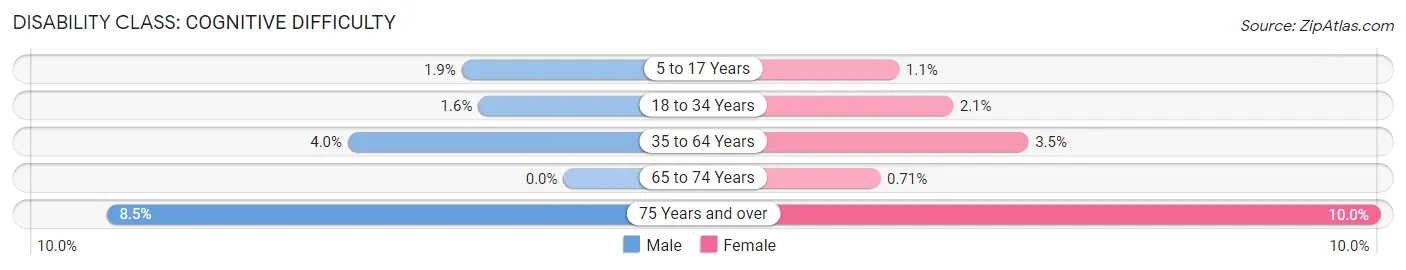
| Age Bracket | Male | Female |
| 5 to 17 Years | 24 (1.9%) | 11 (1.1%) |
| 18 to 34 Years | 21 (1.6%) | 31 (2.1%) |
| 35 to 64 Years | 103 (4.0%) | 102 (3.5%) |
| 65 to 74 Years | 0 (0.0%) | 6 (0.7%) |
| 75 Years and over | 38 (8.5%) | 85 (10.0%) |
Disability Class: Ambulatory Difficulty
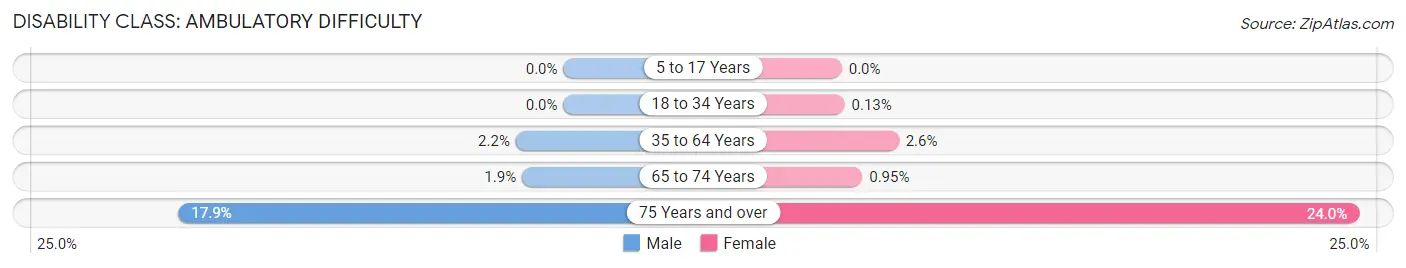
| Age Bracket | Male | Female |
| 5 to 17 Years | 0 (0.0%) | 0 (0.0%) |
| 18 to 34 Years | 0 (0.0%) | 2 (0.1%) |
| 35 to 64 Years | 57 (2.2%) | 78 (2.6%) |
| 65 to 74 Years | 11 (1.9%) | 8 (0.9%) |
| 75 Years and over | 80 (17.9%) | 204 (24.0%) |
Disability Class: Self-Care Difficulty
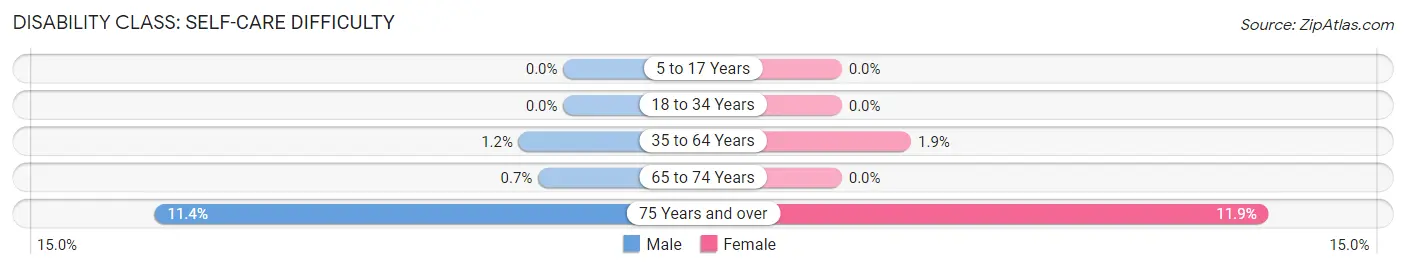
| Age Bracket | Male | Female |
| 5 to 17 Years | 0 (0.0%) | 0 (0.0%) |
| 18 to 34 Years | 0 (0.0%) | 0 (0.0%) |
| 35 to 64 Years | 32 (1.2%) | 57 (1.9%) |
| 65 to 74 Years | 4 (0.7%) | 0 (0.0%) |
| 75 Years and over | 51 (11.4%) | 101 (11.9%) |
Technology Access in Ardmore
Computing Device Access in Ardmore
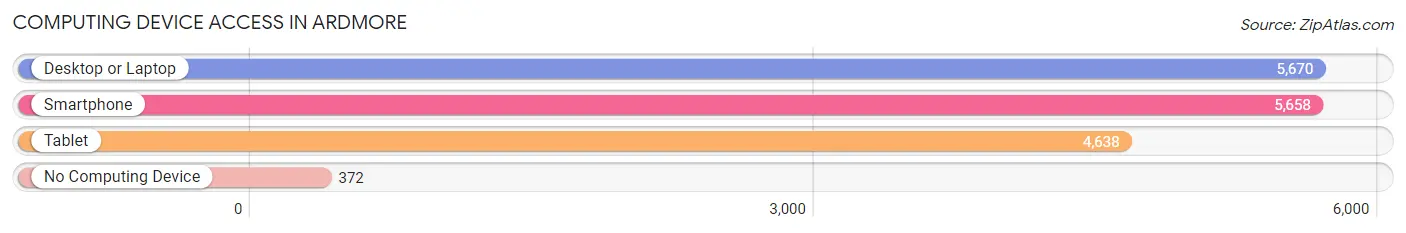
| Device Type | # Households | % Households |
| Desktop or Laptop | 5,670 | 89.9% |
| Smartphone | 5,658 | 89.7% |
| Tablet | 4,638 | 73.6% |
| No Computing Device | 372 | 5.9% |
| Total | 6,305 | 100.0% |
Internet Access in Ardmore
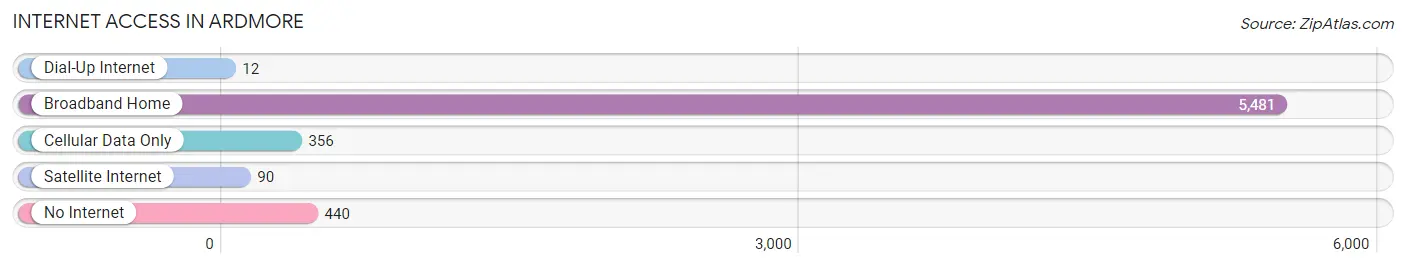
| Internet Type | # Households | % Households |
| Dial-Up Internet | 12 | 0.2% |
| Broadband Home | 5,481 | 86.9% |
| Cellular Data Only | 356 | 5.7% |
| Satellite Internet | 90 | 1.4% |
| No Internet | 440 | 7.0% |
| Total | 6,305 | 100.0% |
Ardmore Summary
Ardmore is a small, suburban town located in Montgomery County, Pennsylvania. It is situated just outside of Philadelphia, and is part of the Main Line, a group of affluent suburbs located along the Pennsylvania Railroad. Ardmore is known for its vibrant downtown area, which is home to a variety of shops, restaurants, and other businesses. The town is also home to several parks, including Suburban Square, a popular shopping center.
History
Ardmore was founded in 1873 by the Pennsylvania Railroad. The town was named after the nearby Ardmore station, which was named after the Irish town of Ardmore. The town quickly grew, and by the early 1900s, it had become a popular destination for wealthy Philadelphians. The town was incorporated in 1895, and in the following decades, it continued to grow and develop.
Geography
Ardmore is located in southeastern Pennsylvania, just outside of Philadelphia. It is situated in Montgomery County, and is part of the Main Line, a group of affluent suburbs located along the Pennsylvania Railroad. The town is bordered by Lower Merion Township to the north, Haverford Township to the east, and Bryn Mawr to the south. The town covers an area of 2.3 square miles, and has a population of approximately 12,000 people.
Economy
Ardmore is home to a variety of businesses, including retail stores, restaurants, and professional services. The town is also home to several corporate offices, including the headquarters of the Vanguard Group, a financial services company. The town is also home to several educational institutions, including the Haverford School, a private college preparatory school.
Demographics
As of the 2010 census, Ardmore had a population of 12,455 people. The racial makeup of the town was 79.2% White, 11.2% African American, 0.2% Native American, 4.3% Asian, and 4.9% from other races. The median household income was $76,837, and the median family income was $90,945. The town had a poverty rate of 5.3%.
Ardmore is a diverse and vibrant community, with a variety of cultures and backgrounds represented. The town is home to a variety of religious institutions, including churches, synagogues, and mosques. The town is also home to a variety of recreational activities, including parks, trails, and golf courses.
Common Questions
What is Per Capita Income in Ardmore?
Per Capita income in Ardmore is $75,362.
What is the Median Family Income in Ardmore?
Median Family Income in Ardmore is $168,549.
What is the Median Household income in Ardmore?
Median Household Income in Ardmore is $117,997.
What is Income or Wage Gap in Ardmore?
Income or Wage Gap in Ardmore is 29.2%.
Women in Ardmore earn 70.8 cents for every dollar earned by a man.
What is Inequality or Gini Index in Ardmore?
Inequality or Gini Index in Ardmore is 0.49.
What is the Total Population of Ardmore?
Total Population of Ardmore is 14,075.
What is the Total Male Population of Ardmore?
Total Male Population of Ardmore is 6,561.
What is the Total Female Population of Ardmore?
Total Female Population of Ardmore is 7,514.
What is the Ratio of Males per 100 Females in Ardmore?
There are 87.32 Males per 100 Females in Ardmore.
What is the Ratio of Females per 100 Males in Ardmore?
There are 114.53 Females per 100 Males in Ardmore.
What is the Median Population Age in Ardmore?
Median Population Age in Ardmore is 39.6 Years.
What is the Average Family Size in Ardmore
Average Family Size in Ardmore is 3.0 People.
What is the Average Household Size in Ardmore
Average Household Size in Ardmore is 2.2 People.
How Large is the Labor Force in Ardmore?
There are 8,071 People in the Labor Forcein in Ardmore.
What is the Percentage of People in the Labor Force in Ardmore?
71.1% of People are in the Labor Force in Ardmore.
What is the Unemployment Rate in Ardmore?
Unemployment Rate in Ardmore is 4.8%.