Milford Square, PA Map & Demographics
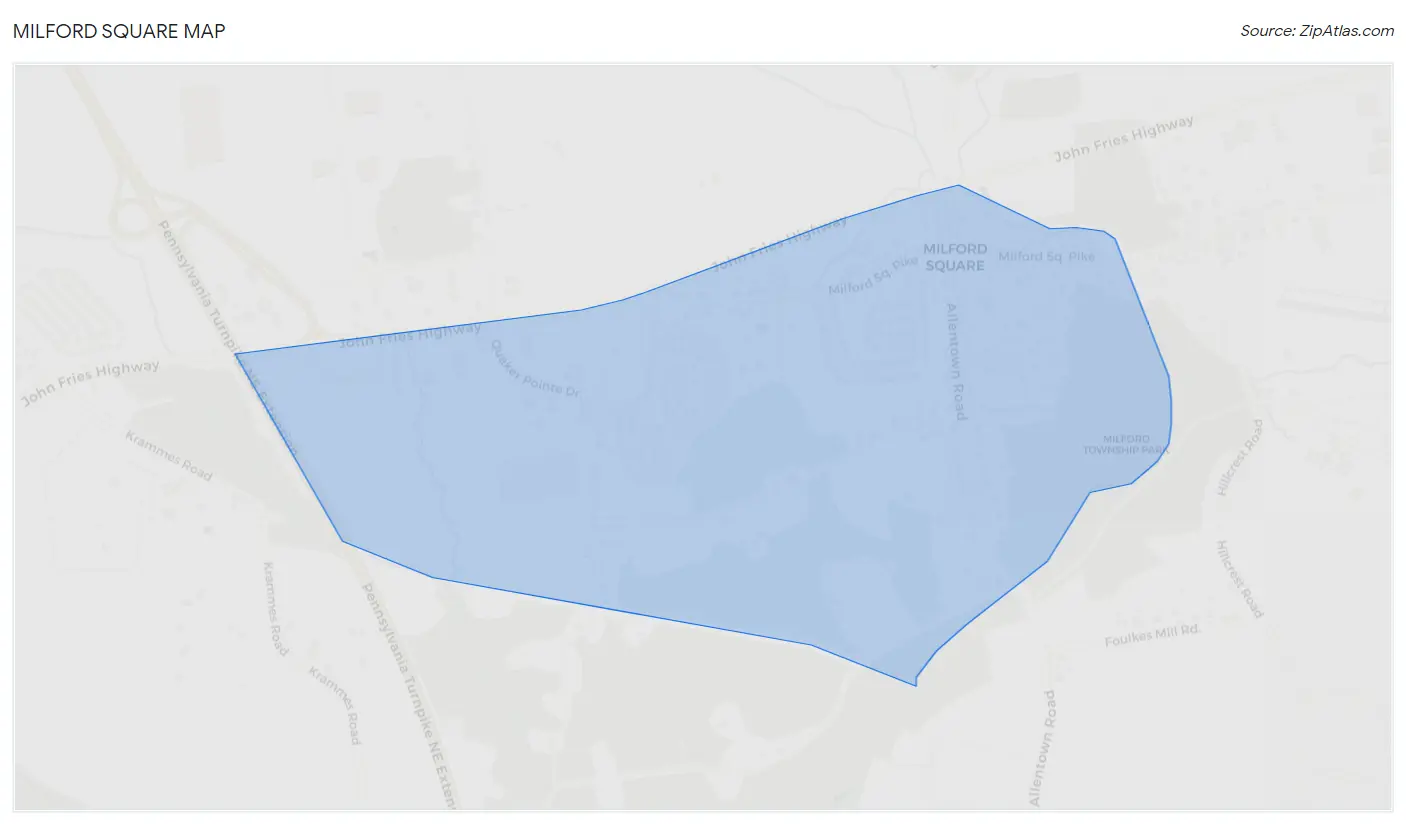
Milford Square Map
Milford Square Overview
$64,229
PER CAPITA INCOME
$179,857
AVG FAMILY INCOME
$178,607
AVG HOUSEHOLD INCOME
55.1%
WAGE / INCOME GAP [ % ]
44.9¢/ $1
WAGE / INCOME GAP [ $ ]
0.28
INEQUALITY / GINI INDEX
1,293
TOTAL POPULATION
596
MALE POPULATION
697
FEMALE POPULATION
85.51
MALES / 100 FEMALES
116.95
FEMALES / 100 MALES
41.3
MEDIAN AGE
2.8
AVG FAMILY SIZE
2.6
AVG HOUSEHOLD SIZE
891
LABOR FORCE [ PEOPLE ]
88.5%
PERCENT IN LABOR FORCE
Milford Square Zip Codes
Milford Square Area Codes
Income in Milford Square
Income Overview in Milford Square
Per Capita Income in Milford Square is $64,229, while median incomes of families and households are $179,857 and $178,607 respectively.
| Characteristic | Number | Measure |
| Per Capita Income | 1,293 | $64,229 |
| Median Family Income | 432 | $179,857 |
| Mean Family Income | 432 | $184,017 |
| Median Household Income | 502 | $178,607 |
| Mean Household Income | 502 | $162,727 |
| Income Deficit | 432 | $0 |
| Wage / Income Gap (%) | 1,293 | 55.11% |
| Wage / Income Gap ($) | 1,293 | 44.89¢ per $1 |
| Gini / Inequality Index | 1,293 | 0.28 |
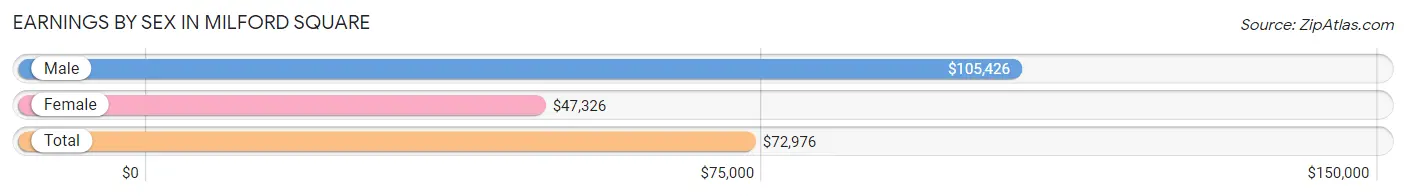
Earnings by Sex in Milford Square
Average Earnings in Milford Square are $72,976, $105,426 for men and $47,326 for women, a difference of 55.1%.
| Sex | Number | Average Earnings |
| Male | 425 (46.5%) | $105,426 |
| Female | 489 (53.5%) | $47,326 |
| Total | 914 (100.0%) | $72,976 |
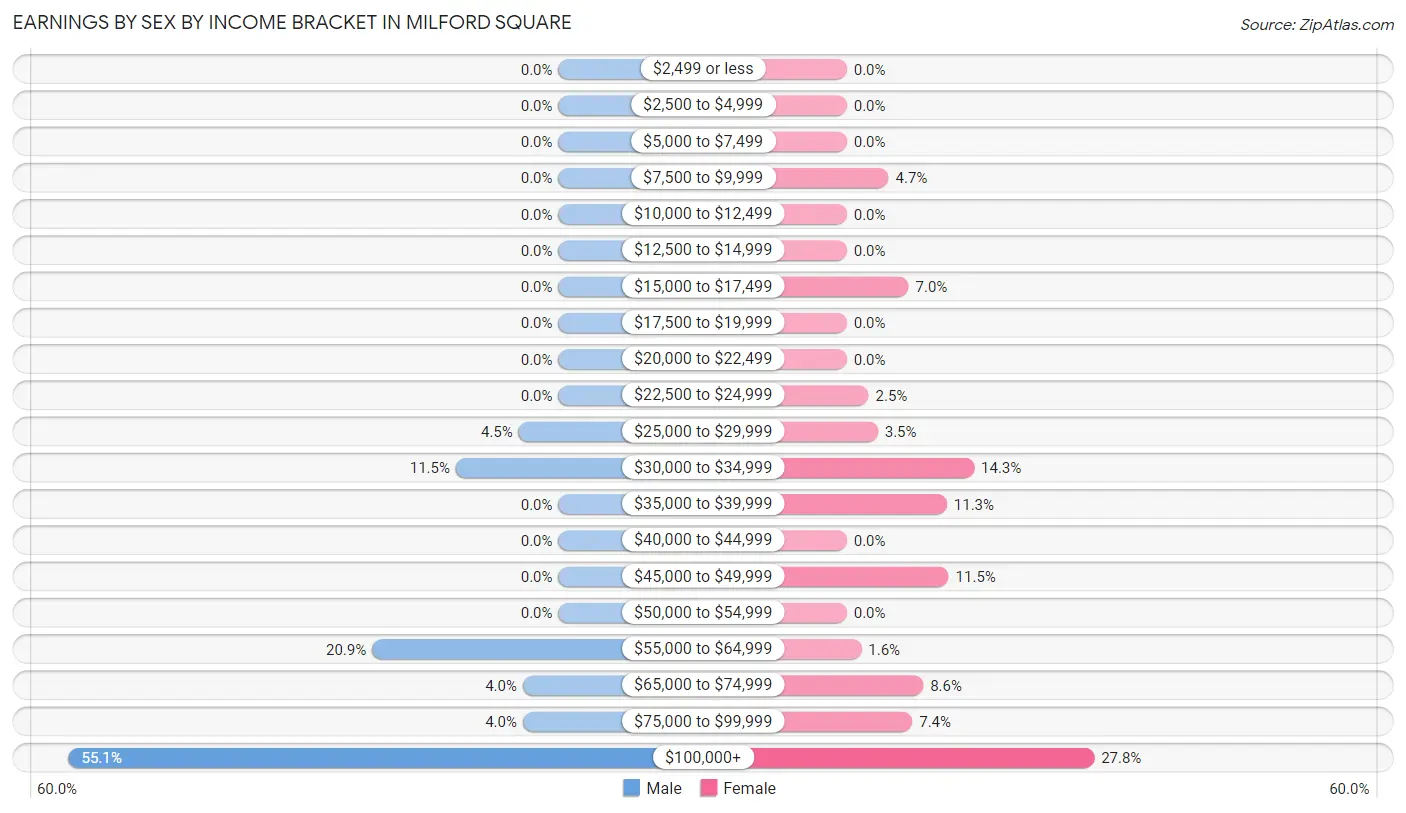
Earnings by Sex by Income Bracket in Milford Square
The most common earnings brackets in Milford Square are $100,000+ for men (234 | 55.1%) and $100,000+ for women (136 | 27.8%).
| Income | Male | Female |
| $2,499 or less | 0 (0.0%) | 0 (0.0%) |
| $2,500 to $4,999 | 0 (0.0%) | 0 (0.0%) |
| $5,000 to $7,499 | 0 (0.0%) | 0 (0.0%) |
| $7,500 to $9,999 | 0 (0.0%) | 23 (4.7%) |
| $10,000 to $12,499 | 0 (0.0%) | 0 (0.0%) |
| $12,500 to $14,999 | 0 (0.0%) | 0 (0.0%) |
| $15,000 to $17,499 | 0 (0.0%) | 34 (7.0%) |
| $17,500 to $19,999 | 0 (0.0%) | 0 (0.0%) |
| $20,000 to $22,499 | 0 (0.0%) | 0 (0.0%) |
| $22,500 to $24,999 | 0 (0.0%) | 12 (2.5%) |
| $25,000 to $29,999 | 19 (4.5%) | 17 (3.5%) |
| $30,000 to $34,999 | 49 (11.5%) | 70 (14.3%) |
| $35,000 to $39,999 | 0 (0.0%) | 55 (11.3%) |
| $40,000 to $44,999 | 0 (0.0%) | 0 (0.0%) |
| $45,000 to $49,999 | 0 (0.0%) | 56 (11.5%) |
| $50,000 to $54,999 | 0 (0.0%) | 0 (0.0%) |
| $55,000 to $64,999 | 89 (20.9%) | 8 (1.6%) |
| $65,000 to $74,999 | 17 (4.0%) | 42 (8.6%) |
| $75,000 to $99,999 | 17 (4.0%) | 36 (7.4%) |
| $100,000+ | 234 (55.1%) | 136 (27.8%) |
| Total | 425 (100.0%) | 489 (100.0%) |
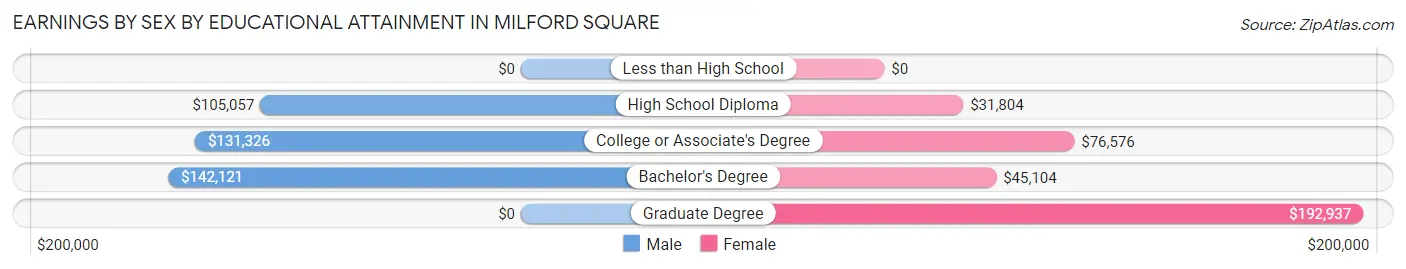
Earnings by Sex by Educational Attainment in Milford Square
| Educational Attainment | Male Income | Female Income |
| Less than High School | - | - |
| High School Diploma | $105,057 | $31,804 |
| College or Associate's Degree | $131,326 | $76,576 |
| Bachelor's Degree | $142,121 | $45,104 |
| Graduate Degree | - | - |
| Total | $105,966 | $0 |
Family Income in Milford Square
Family Income Brackets in Milford Square
According to the Milford Square family income data, there are 197 families falling into the $150,000 to $199,999 income range, which is the most common income bracket and makes up 45.6% of all families.
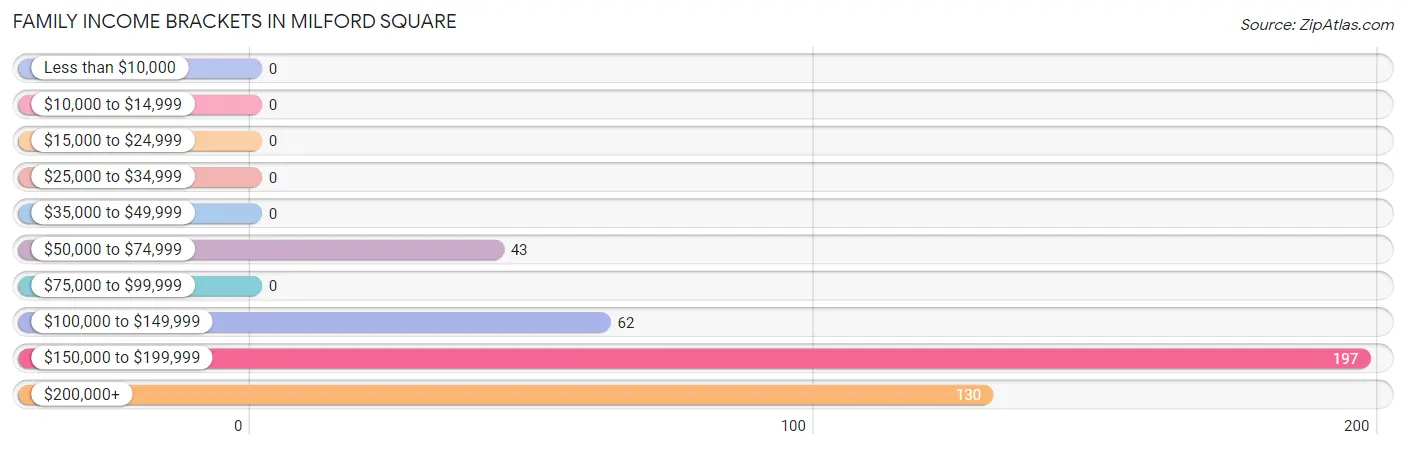
| Income Bracket | # Families | % Families |
| Less than $10,000 | 0 | 0.0% |
| $10,000 to $14,999 | 0 | 0.0% |
| $15,000 to $24,999 | 0 | 0.0% |
| $25,000 to $34,999 | 0 | 0.0% |
| $35,000 to $49,999 | 0 | 0.0% |
| $50,000 to $74,999 | 43 | 10.0% |
| $75,000 to $99,999 | 0 | 0.0% |
| $100,000 to $149,999 | 62 | 14.4% |
| $150,000 to $199,999 | 197 | 45.6% |
| $200,000+ | 130 | 30.1% |
Family Income by Famaliy Size in Milford Square
3-person families (50 | 11.6%) account for the highest median family income in Milford Square with $221,176 per family, while 2-person families (229 | 53.0%) have the highest median income of $96,364 per family member.
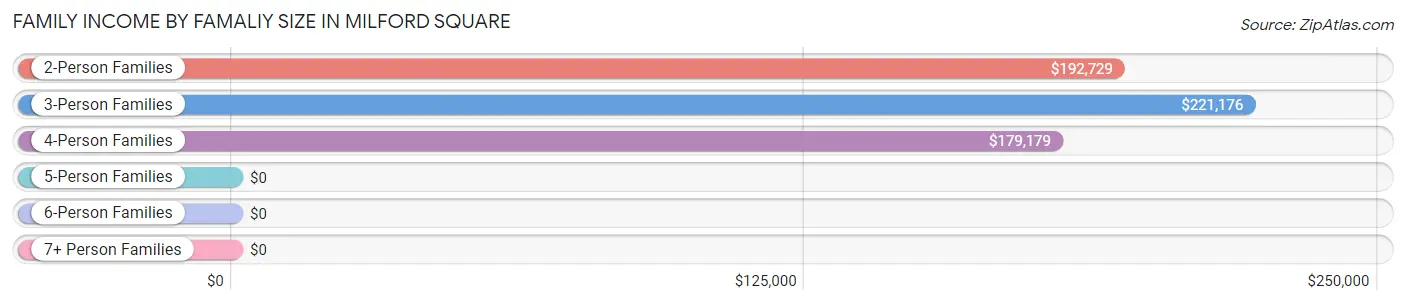
| Income Bracket | # Families | Median Income |
| 2-Person Families | 229 (53.0%) | $192,729 |
| 3-Person Families | 50 (11.6%) | $221,176 |
| 4-Person Families | 146 (33.8%) | $179,179 |
| 5-Person Families | 0 (0.0%) | $0 |
| 6-Person Families | 7 (1.6%) | $0 |
| 7+ Person Families | 0 (0.0%) | $0 |
| Total | 432 (100.0%) | $179,857 |
Family Income by Number of Earners in Milford Square
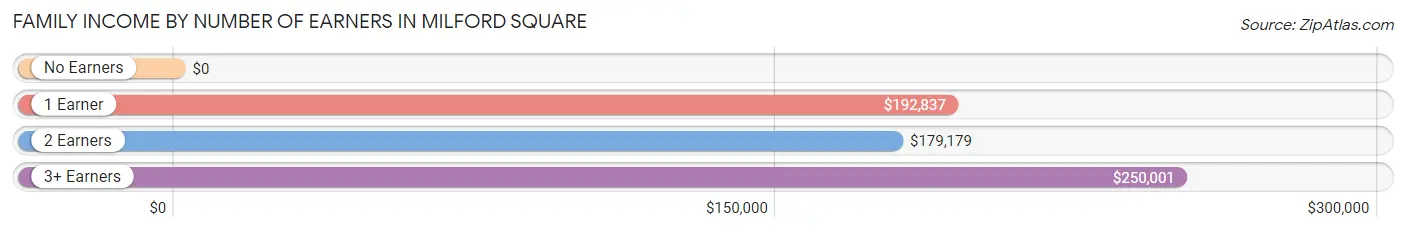
| Number of Earners | # Families | Median Income |
| No Earners | 20 (4.6%) | $0 |
| 1 Earner | 109 (25.2%) | $192,837 |
| 2 Earners | 228 (52.8%) | $179,179 |
| 3+ Earners | 75 (17.4%) | $250,001 |
| Total | 432 (100.0%) | $179,857 |
Household Income in Milford Square
Household Income Brackets in Milford Square
With 197 households falling in the category, the $150,000 to $199,999 income range is the most frequent in Milford Square, accounting for 39.2% of all households.
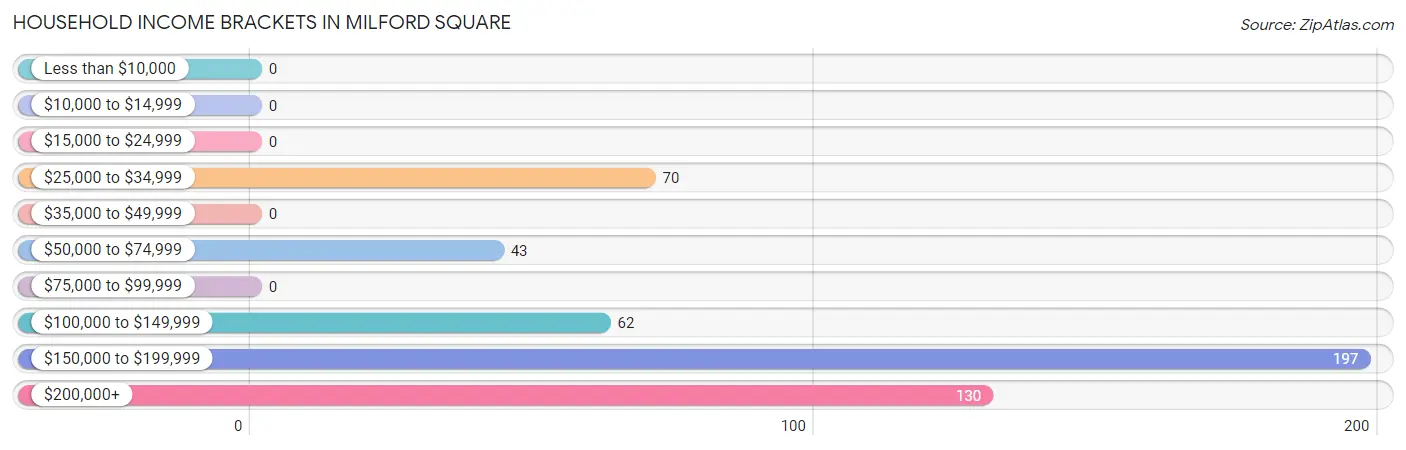
| Income Bracket | # Households | % Households |
| Less than $10,000 | 0 | 0.0% |
| $10,000 to $14,999 | 0 | 0.0% |
| $15,000 to $24,999 | 0 | 0.0% |
| $25,000 to $34,999 | 70 | 13.9% |
| $35,000 to $49,999 | 0 | 0.0% |
| $50,000 to $74,999 | 43 | 8.6% |
| $75,000 to $99,999 | 0 | 0.0% |
| $100,000 to $149,999 | 62 | 12.4% |
| $150,000 to $199,999 | 197 | 39.2% |
| $200,000+ | 130 | 25.9% |
Household Income by Householder Age in Milford Square
The median household income in Milford Square is $178,607, with the highest median household income of $193,433 found in the 25 to 44 years age bracket for the primary householder. A total of 189 households (37.7%) fall into this category.
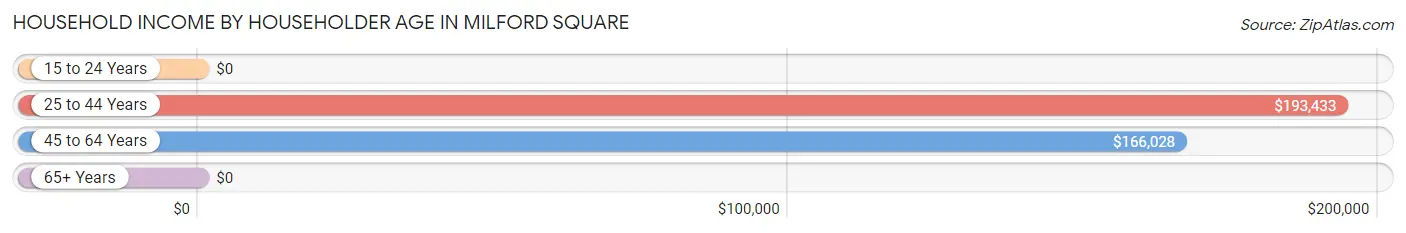
| Income Bracket | # Households | Median Income |
| 15 to 24 Years | 0 (0.0%) | $0 |
| 25 to 44 Years | 189 (37.7%) | $193,433 |
| 45 to 64 Years | 293 (58.4%) | $166,028 |
| 65+ Years | 20 (4.0%) | $0 |
| Total | 502 (100.0%) | $178,607 |
Poverty in Milford Square
Income Below Poverty by Sex and Age in Milford Square
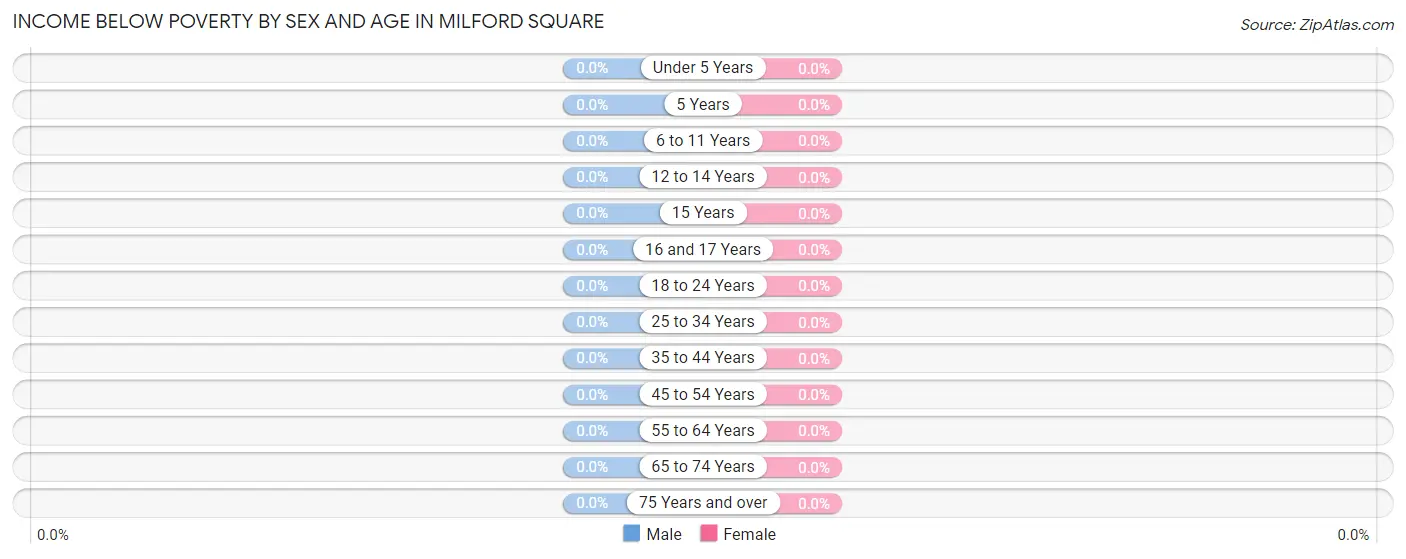
| Age Bracket | Male | Female |
| Under 5 Years | 0 (0.0%) | 0 (0.0%) |
| 5 Years | 0 (0.0%) | 0 (0.0%) |
| 6 to 11 Years | 0 (0.0%) | 0 (0.0%) |
| 12 to 14 Years | 0 (0.0%) | 0 (0.0%) |
| 15 Years | 0 (0.0%) | 0 (0.0%) |
| 16 and 17 Years | 0 (0.0%) | 0 (0.0%) |
| 18 to 24 Years | 0 (0.0%) | 0 (0.0%) |
| 25 to 34 Years | 0 (0.0%) | 0 (0.0%) |
| 35 to 44 Years | 0 (0.0%) | 0 (0.0%) |
| 45 to 54 Years | 0 (0.0%) | 0 (0.0%) |
| 55 to 64 Years | 0 (0.0%) | 0 (0.0%) |
| 65 to 74 Years | 0 (0.0%) | 0 (0.0%) |
| 75 Years and over | 0 (0.0%) | 0 (0.0%) |
| Total | 0 (0.0%) | 0 (0.0%) |
Income Above Poverty by Sex and Age in Milford Square
According to the poverty statistics in Milford Square, males aged under 5 years and females aged under 5 years are the age groups that are most secure financially, with 100.0% of males and 100.0% of females in these age groups living above the poverty line.
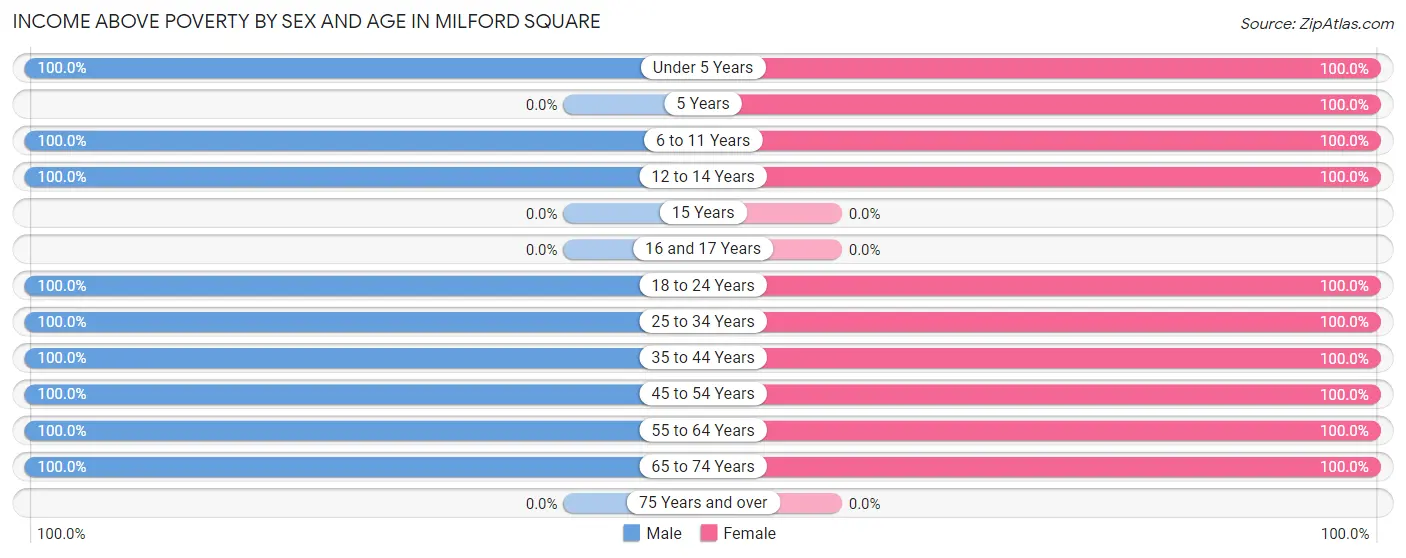
| Age Bracket | Male | Female |
| Under 5 Years | 12 (100.0%) | 29 (100.0%) |
| 5 Years | 0 (0.0%) | 13 (100.0%) |
| 6 to 11 Years | 55 (100.0%) | 86 (100.0%) |
| 12 to 14 Years | 72 (100.0%) | 19 (100.0%) |
| 15 Years | 0 (0.0%) | 0 (0.0%) |
| 16 and 17 Years | 0 (0.0%) | 0 (0.0%) |
| 18 to 24 Years | 28 (100.0%) | 40 (100.0%) |
| 25 to 34 Years | 89 (100.0%) | 48 (100.0%) |
| 35 to 44 Years | 73 (100.0%) | 185 (100.0%) |
| 45 to 54 Years | 138 (100.0%) | 142 (100.0%) |
| 55 to 64 Years | 106 (100.0%) | 74 (100.0%) |
| 65 to 74 Years | 23 (100.0%) | 61 (100.0%) |
| 75 Years and over | 0 (0.0%) | 0 (0.0%) |
| Total | 596 (100.0%) | 697 (100.0%) |
Income Below Poverty Among Married-Couple Families in Milford Square
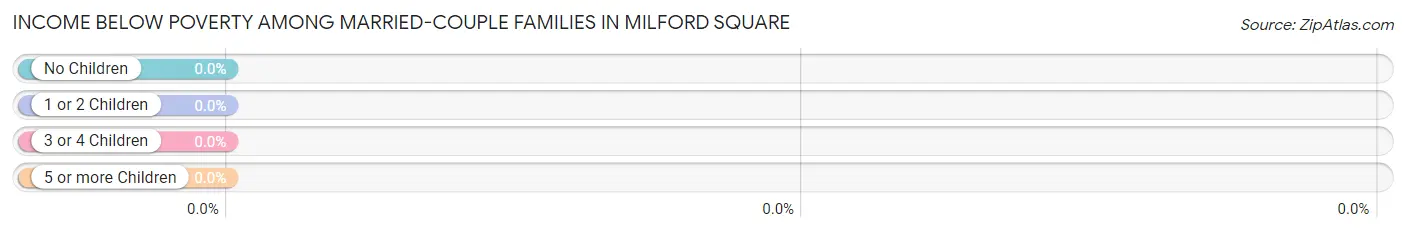
| Children | Above Poverty | Below Poverty |
| No Children | 127 (100.0%) | 0 (0.0%) |
| 1 or 2 Children | 128 (100.0%) | 0 (0.0%) |
| 3 or 4 Children | 7 (100.0%) | 0 (0.0%) |
| 5 or more Children | 0 (0.0%) | 0 (0.0%) |
| Total | 262 (100.0%) | 0 (0.0%) |
Income Below Poverty Among Single-Parent Households in Milford Square
| Children | Single Father | Single Mother |
| No Children | 0 (0.0%) | 0 (0.0%) |
| 1 or 2 Children | 0 (0.0%) | 0 (0.0%) |
| 3 or 4 Children | 0 (0.0%) | 0 (0.0%) |
| 5 or more Children | 0 (0.0%) | 0 (0.0%) |
| Total | 0 (0.0%) | 0 (0.0%) |
Income Below Poverty Among Married-Couple vs Single-Parent Households in Milford Square
| Children | Married-Couple Families | Single-Parent Households |
| No Children | 0 (0.0%) | 0 (0.0%) |
| 1 or 2 Children | 0 (0.0%) | 0 (0.0%) |
| 3 or 4 Children | 0 (0.0%) | 0 (0.0%) |
| 5 or more Children | 0 (0.0%) | 0 (0.0%) |
| Total | 0 (0.0%) | 0 (0.0%) |
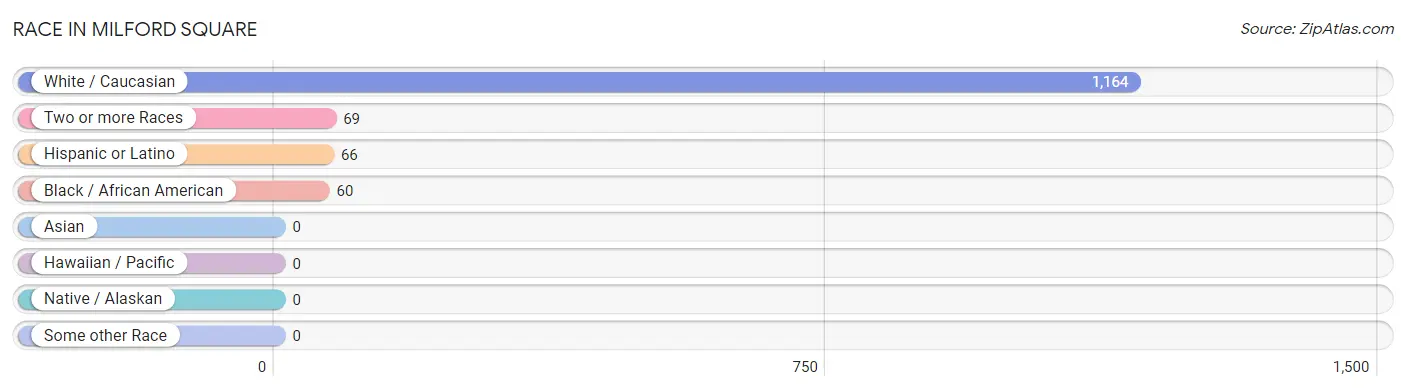
Race in Milford Square
The most populous races in Milford Square are White / Caucasian (1,164 | 90.0%), Two or more Races (69 | 5.3%), and Hispanic or Latino (66 | 5.1%).
| Race | # Population | % Population |
| Asian | 0 | 0.0% |
| Black / African American | 60 | 4.6% |
| Hawaiian / Pacific | 0 | 0.0% |
| Hispanic or Latino | 66 | 5.1% |
| Native / Alaskan | 0 | 0.0% |
| White / Caucasian | 1,164 | 90.0% |
| Two or more Races | 69 | 5.3% |
| Some other Race | 0 | 0.0% |
| Total | 1,293 | 100.0% |
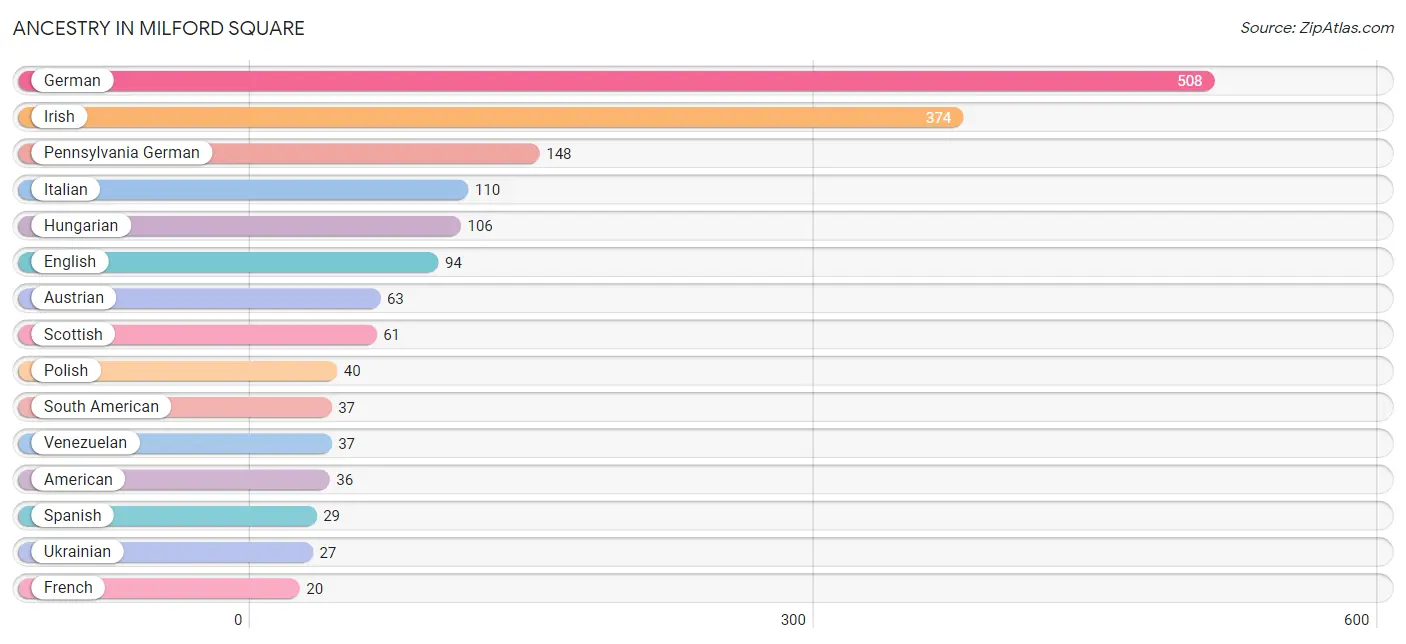
Ancestry in Milford Square
The most populous ancestries reported in Milford Square are German (508 | 39.3%), Irish (374 | 28.9%), Pennsylvania German (148 | 11.5%), Italian (110 | 8.5%), and Hungarian (106 | 8.2%), together accounting for 96.4% of all Milford Square residents.
| Ancestry | # Population | % Population |
| American | 36 | 2.8% |
| Austrian | 63 | 4.9% |
| Dutch | 14 | 1.1% |
| English | 94 | 7.3% |
| French | 20 | 1.5% |
| German | 508 | 39.3% |
| Greek | 17 | 1.3% |
| Hungarian | 106 | 8.2% |
| Irish | 374 | 28.9% |
| Italian | 110 | 8.5% |
| Pennsylvania German | 148 | 11.5% |
| Polish | 40 | 3.1% |
| Scottish | 61 | 4.7% |
| South American | 37 | 2.9% |
| Spanish | 29 | 2.2% |
| Ukrainian | 27 | 2.1% |
| Venezuelan | 37 | 2.9% | View All 17 Rows |
Immigrants in Milford Square
The most numerous immigrant groups reported in Milford Square came from , and Canada (9 | 0.7%), together accounting for 0.7% of all Milford Square residents.

| Immigration Origin | # Population | % Population |
| Canada | 9 | 0.7% | View All 1 Rows |
Sex and Age in Milford Square
Sex and Age in Milford Square
The most populous age groups in Milford Square are 45 to 49 Years (115 | 19.3%) for men and 40 to 44 Years (107 | 15.3%) for women.
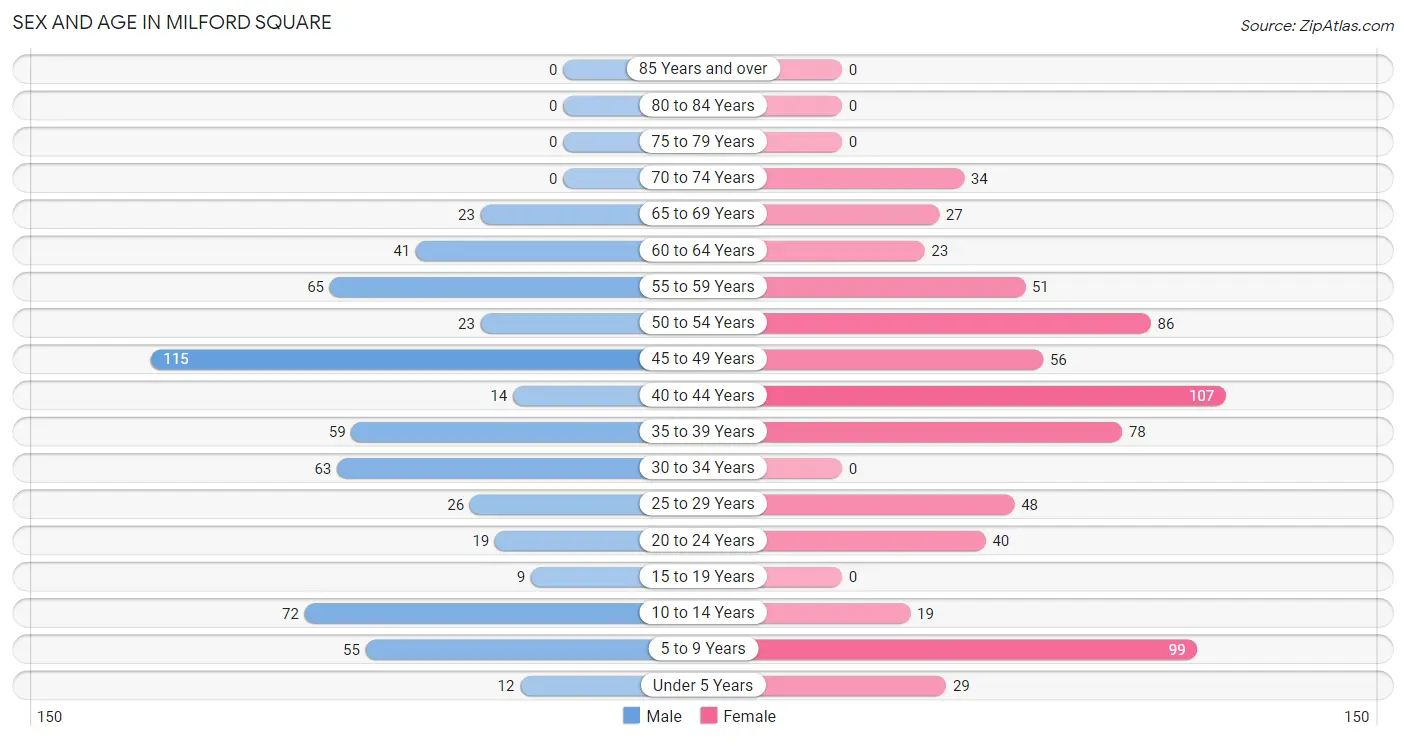
| Age Bracket | Male | Female |
| Under 5 Years | 12 (2.0%) | 29 (4.2%) |
| 5 to 9 Years | 55 (9.2%) | 99 (14.2%) |
| 10 to 14 Years | 72 (12.1%) | 19 (2.7%) |
| 15 to 19 Years | 9 (1.5%) | 0 (0.0%) |
| 20 to 24 Years | 19 (3.2%) | 40 (5.7%) |
| 25 to 29 Years | 26 (4.4%) | 48 (6.9%) |
| 30 to 34 Years | 63 (10.6%) | 0 (0.0%) |
| 35 to 39 Years | 59 (9.9%) | 78 (11.2%) |
| 40 to 44 Years | 14 (2.4%) | 107 (15.3%) |
| 45 to 49 Years | 115 (19.3%) | 56 (8.0%) |
| 50 to 54 Years | 23 (3.9%) | 86 (12.3%) |
| 55 to 59 Years | 65 (10.9%) | 51 (7.3%) |
| 60 to 64 Years | 41 (6.9%) | 23 (3.3%) |
| 65 to 69 Years | 23 (3.9%) | 27 (3.9%) |
| 70 to 74 Years | 0 (0.0%) | 34 (4.9%) |
| 75 to 79 Years | 0 (0.0%) | 0 (0.0%) |
| 80 to 84 Years | 0 (0.0%) | 0 (0.0%) |
| 85 Years and over | 0 (0.0%) | 0 (0.0%) |
| Total | 596 (100.0%) | 697 (100.0%) |
Families and Households in Milford Square
Median Family Size in Milford Square
The median family size in Milford Square is 2.83 persons per family, with married-couple families (262 | 60.7%) accounting for the largest median family size of 3.37 persons per family. On the other hand, single male/father families (74 | 17.1%) represent the smallest median family size with 1.97 persons per family.
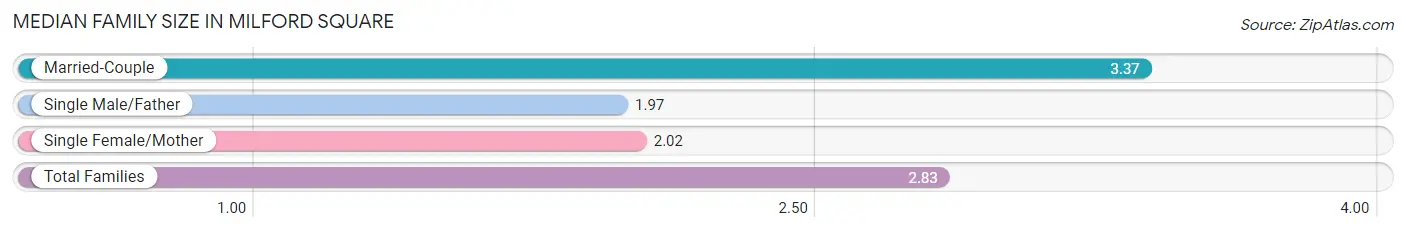
| Family Type | # Families | Family Size |
| Married-Couple | 262 (60.7%) | 3.37 |
| Single Male/Father | 74 (17.1%) | 1.97 |
| Single Female/Mother | 96 (22.2%) | 2.02 |
| Total Families | 432 (100.0%) | 2.83 |
Median Household Size in Milford Square
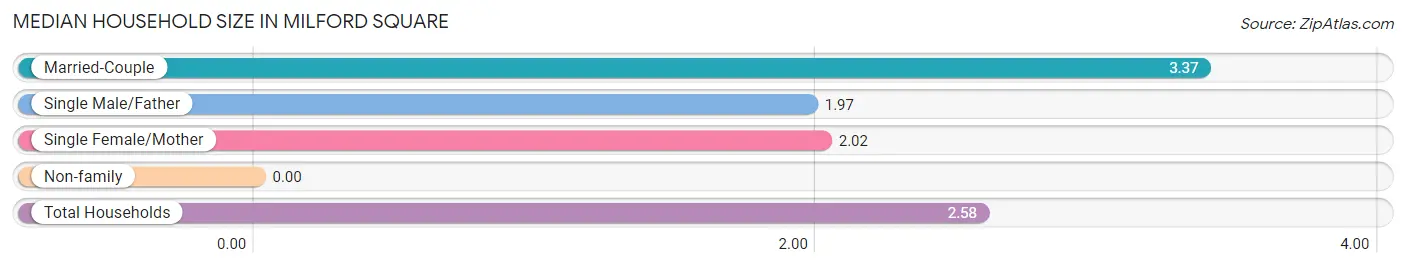
| Household Type | # Households | Household Size |
| Married-Couple | 262 (52.2%) | 3.37 |
| Single Male/Father | 74 (14.7%) | 1.97 |
| Single Female/Mother | 96 (19.1%) | 2.02 |
| Non-family | 70 (13.9%) | - |
| Total Households | 502 (100.0%) | 2.58 |
Household Size by Marriage Status in Milford Square
Out of a total of 502 households in Milford Square, 432 (86.1%) are family households, while 70 (13.9%) are nonfamily households. The most numerous type of family households are 2-person households, comprising 229, and the most common type of nonfamily households are 1-person households, comprising 70.
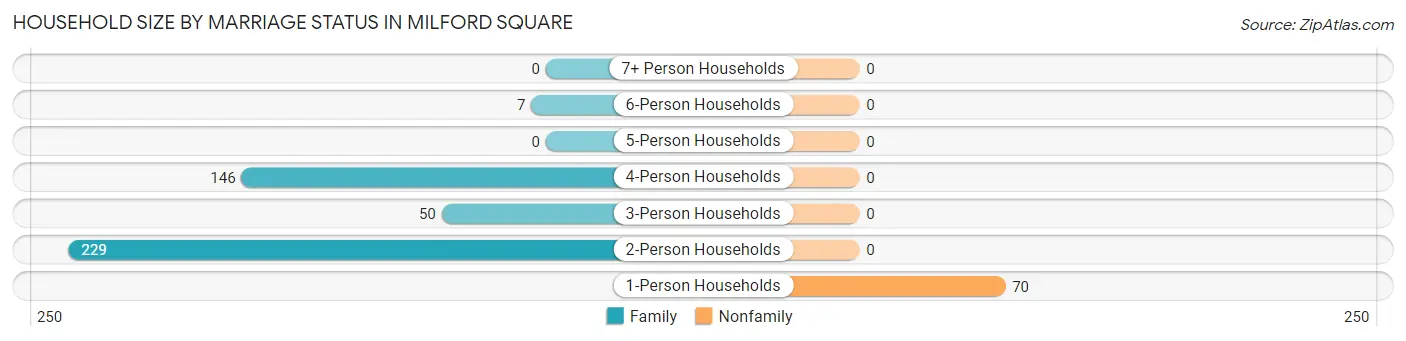
| Household Size | Family Households | Nonfamily Households |
| 1-Person Households | - | 70 (13.9%) |
| 2-Person Households | 229 (45.6%) | 0 (0.0%) |
| 3-Person Households | 50 (10.0%) | 0 (0.0%) |
| 4-Person Households | 146 (29.1%) | 0 (0.0%) |
| 5-Person Households | 0 (0.0%) | 0 (0.0%) |
| 6-Person Households | 7 (1.4%) | 0 (0.0%) |
| 7+ Person Households | 0 (0.0%) | 0 (0.0%) |
| Total | 432 (86.1%) | 70 (13.9%) |
Female Fertility in Milford Square
Fertility by Age in Milford Square
| Age Bracket | Women with Births | Births / 1,000 Women |
| 15 to 19 years | 0 (0.0%) | 0.0 |
| 20 to 34 years | 0 (0.0%) | 0.0 |
| 35 to 50 years | 0 (0.0%) | 0.0 |
| Total | 0 (0.0%) | 0.0 |
Fertility by Age by Marriage Status in Milford Square
| Age Bracket | Married | Unmarried |
| 15 to 19 years | 0 (0.0%) | 0 (0.0%) |
| 20 to 34 years | 0 (0.0%) | 0 (0.0%) |
| 35 to 50 years | 0 (0.0%) | 0 (0.0%) |
| Total | 0 (0.0%) | 0 (0.0%) |
Fertility by Education in Milford Square
| Educational Attainment | Women with Births | Births / 1,000 Women |
| Less than High School | 0 (0.0%) | 0.0 |
| High School Diploma | 0 (0.0%) | 0.0 |
| College or Associate's Degree | 0 (0.0%) | 0.0 |
| Bachelor's Degree | 0 (0.0%) | 0.0 |
| Graduate Degree | 0 (0.0%) | 0.0 |
| Total | 0 (0.0%) | 0.0 |
Fertility by Education by Marriage Status in Milford Square
| Educational Attainment | Married | Unmarried |
| Less than High School | 0 (0.0%) | 0 (0.0%) |
| High School Diploma | 0 (0.0%) | 0 (0.0%) |
| College or Associate's Degree | 0 (0.0%) | 0 (0.0%) |
| Bachelor's Degree | 0 (0.0%) | 0 (0.0%) |
| Graduate Degree | 0 (0.0%) | 0 (0.0%) |
| Total | 0 (0.0%) | 0 (0.0%) |
Employment Characteristics in Milford Square
Employment by Class of Employer in Milford Square
Among the 878 employed individuals in Milford Square, private company employees (759 | 86.5%), not-for-profit organizations (79 | 9.0%), and local government employees (22 | 2.5%) make up the most common classes of employment.
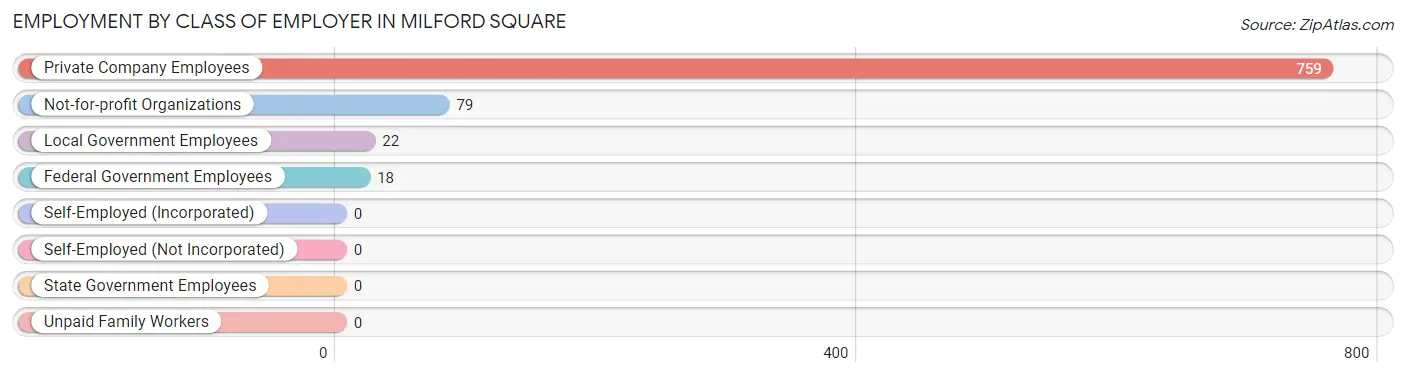
| Employer Class | # Employees | % Employees |
| Private Company Employees | 759 | 86.5% |
| Self-Employed (Incorporated) | 0 | 0.0% |
| Self-Employed (Not Incorporated) | 0 | 0.0% |
| Not-for-profit Organizations | 79 | 9.0% |
| Local Government Employees | 22 | 2.5% |
| State Government Employees | 0 | 0.0% |
| Federal Government Employees | 18 | 2.1% |
| Unpaid Family Workers | 0 | 0.0% |
| Total | 878 | 100.0% |
Employment Status by Age in Milford Square
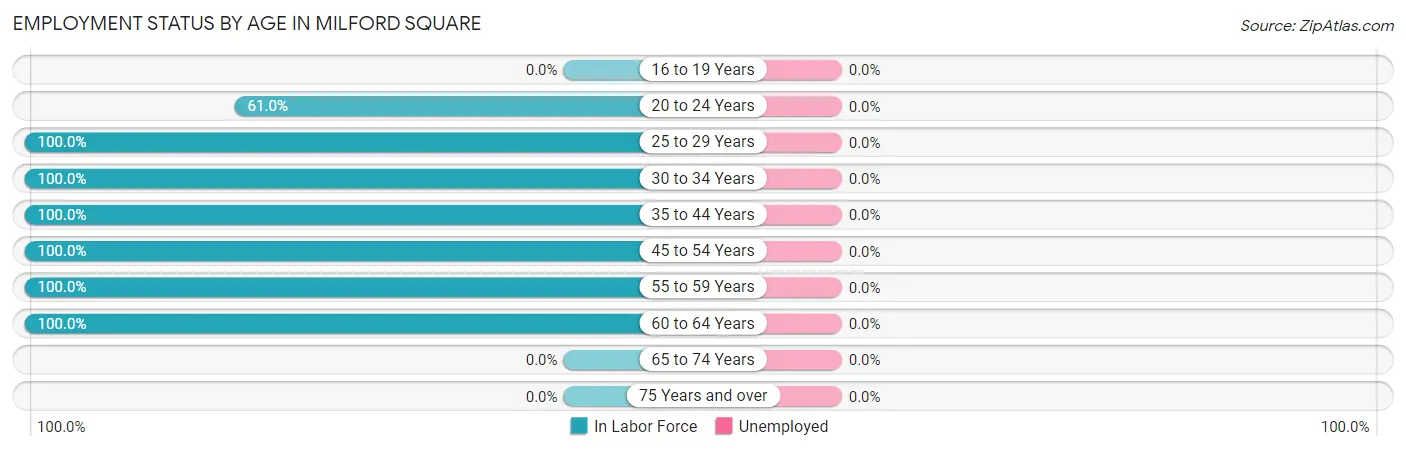
| Age Bracket | In Labor Force | Unemployed |
| 16 to 19 Years | 0 (0.0%) | 0 (0.0%) |
| 20 to 24 Years | 36 (61.0%) | 0 (0.0%) |
| 25 to 29 Years | 74 (100.0%) | 0 (0.0%) |
| 30 to 34 Years | 63 (100.0%) | 0 (0.0%) |
| 35 to 44 Years | 258 (100.0%) | 0 (0.0%) |
| 45 to 54 Years | 280 (100.0%) | 0 (0.0%) |
| 55 to 59 Years | 116 (100.0%) | 0 (0.0%) |
| 60 to 64 Years | 64 (100.0%) | 0 (0.0%) |
| 65 to 74 Years | 0 (0.0%) | 0 (0.0%) |
| 75 Years and over | 0 (0.0%) | 0 (0.0%) |
| Total | 891 (88.5%) | 0 (0.0%) |
Employment Status by Educational Attainment in Milford Square
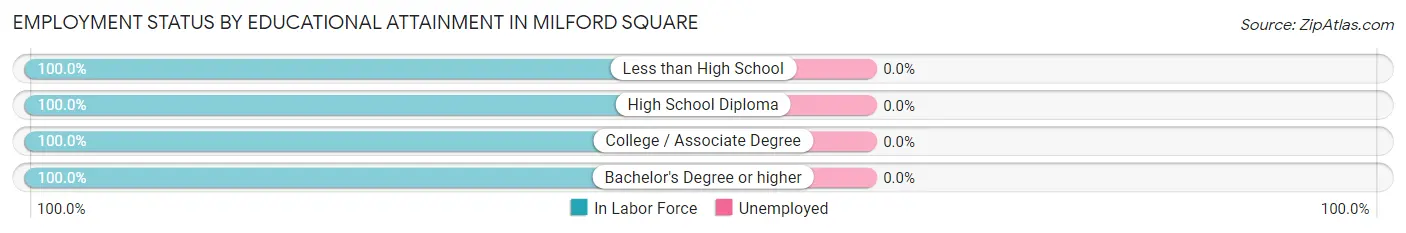
| Educational Attainment | In Labor Force | Unemployed |
| Less than High School | 23 (100.0%) | 0 (0.0%) |
| High School Diploma | 325 (100.0%) | 0 (0.0%) |
| College / Associate Degree | 164 (100.0%) | 0 (0.0%) |
| Bachelor's Degree or higher | 343 (100.0%) | 0 (0.0%) |
| Total | 855 (100.0%) | 0 (0.0%) |
Employment Occupations by Sex in Milford Square
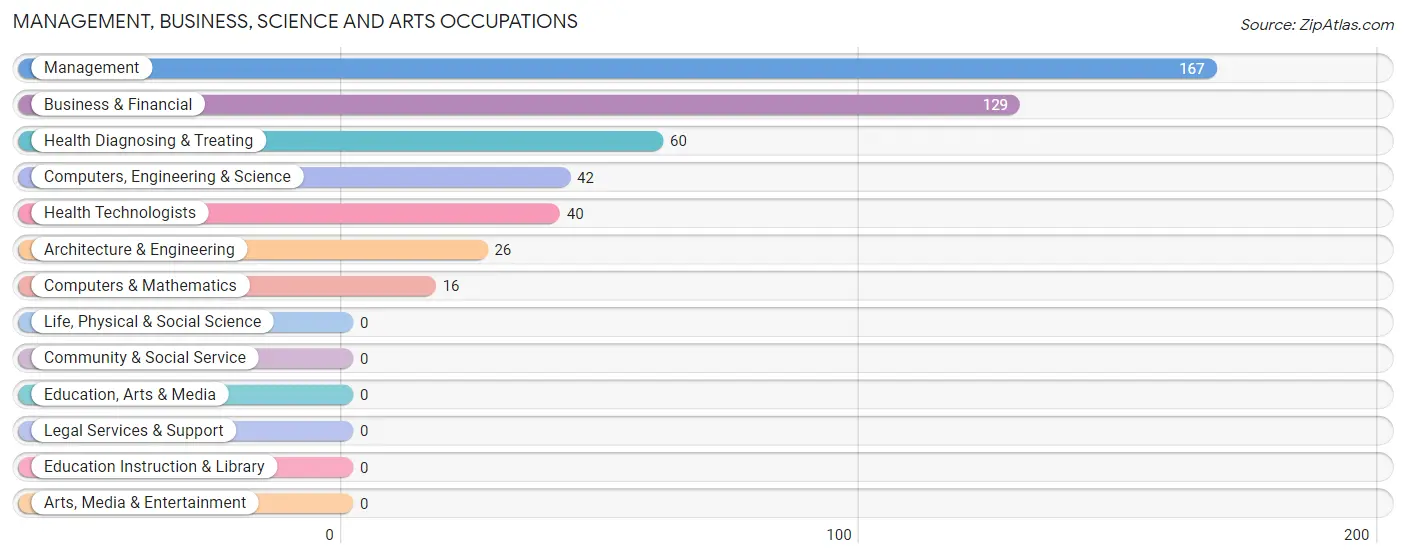
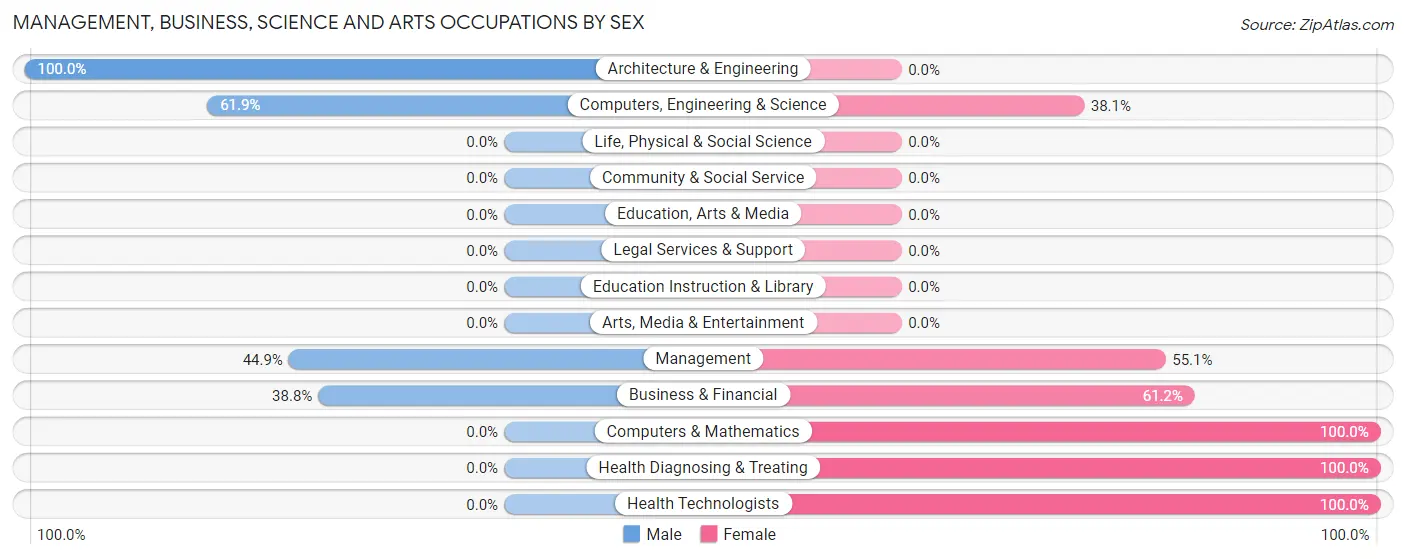
Management, Business, Science and Arts Occupations
The most common Management, Business, Science and Arts occupations in Milford Square are Management (167 | 18.7%), Business & Financial (129 | 14.5%), Health Diagnosing & Treating (60 | 6.7%), Computers, Engineering & Science (42 | 4.7%), and Health Technologists (40 | 4.5%).
Management, Business, Science and Arts Occupations by Sex
Within the Management, Business, Science and Arts occupations in Milford Square, the most male-oriented occupations are Architecture & Engineering (100.0%), Computers, Engineering & Science (61.9%), and Management (44.9%), while the most female-oriented occupations are Computers & Mathematics (100.0%), Health Diagnosing & Treating (100.0%), and Health Technologists (100.0%).
| Occupation | Male | Female |
| Management | 75 (44.9%) | 92 (55.1%) |
| Business & Financial | 50 (38.8%) | 79 (61.2%) |
| Computers, Engineering & Science | 26 (61.9%) | 16 (38.1%) |
| Computers & Mathematics | 0 (0.0%) | 16 (100.0%) |
| Architecture & Engineering | 26 (100.0%) | 0 (0.0%) |
| Life, Physical & Social Science | 0 (0.0%) | 0 (0.0%) |
| Community & Social Service | 0 (0.0%) | 0 (0.0%) |
| Education, Arts & Media | 0 (0.0%) | 0 (0.0%) |
| Legal Services & Support | 0 (0.0%) | 0 (0.0%) |
| Education Instruction & Library | 0 (0.0%) | 0 (0.0%) |
| Arts, Media & Entertainment | 0 (0.0%) | 0 (0.0%) |
| Health Diagnosing & Treating | 0 (0.0%) | 60 (100.0%) |
| Health Technologists | 0 (0.0%) | 40 (100.0%) |
| Total (Category) | 151 (37.9%) | 247 (62.1%) |
| Total (Overall) | 425 (47.7%) | 466 (52.3%) |
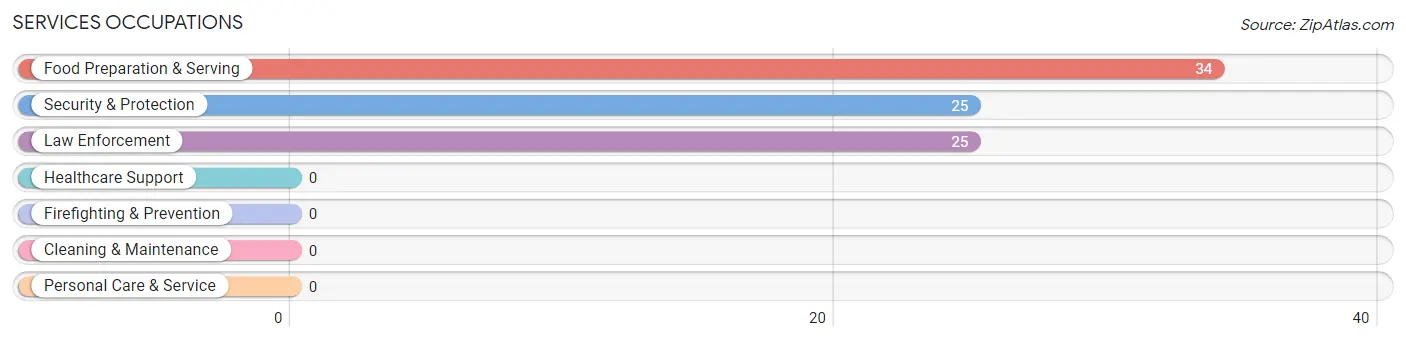
Services Occupations
The most common Services occupations in Milford Square are Food Preparation & Serving (34 | 3.8%), Security & Protection (25 | 2.8%), and Law Enforcement (25 | 2.8%).
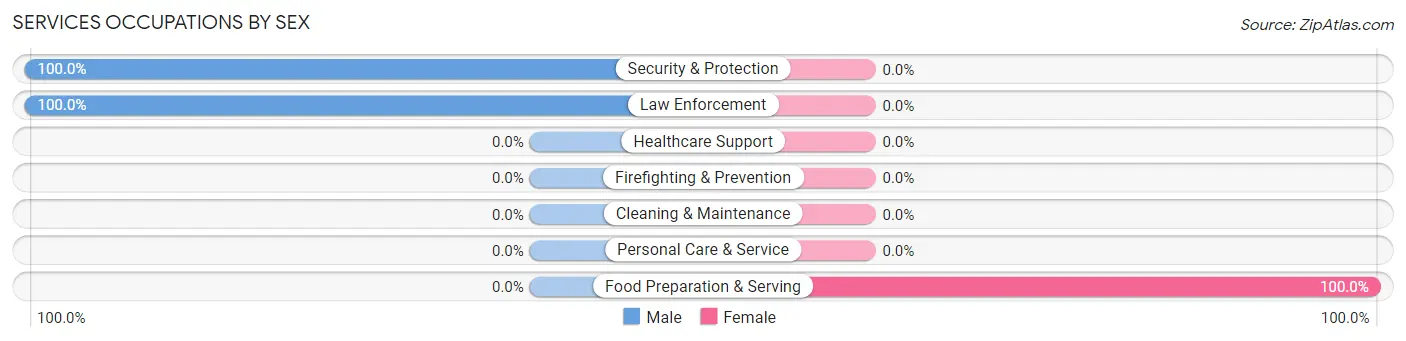
Services Occupations by Sex
| Occupation | Male | Female |
| Healthcare Support | 0 (0.0%) | 0 (0.0%) |
| Security & Protection | 25 (100.0%) | 0 (0.0%) |
| Firefighting & Prevention | 0 (0.0%) | 0 (0.0%) |
| Law Enforcement | 25 (100.0%) | 0 (0.0%) |
| Food Preparation & Serving | 0 (0.0%) | 34 (100.0%) |
| Cleaning & Maintenance | 0 (0.0%) | 0 (0.0%) |
| Personal Care & Service | 0 (0.0%) | 0 (0.0%) |
| Total (Category) | 25 (42.4%) | 34 (57.6%) |
| Total (Overall) | 425 (47.7%) | 466 (52.3%) |
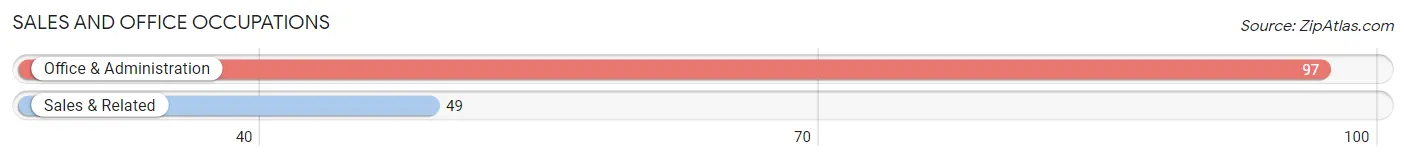
Sales and Office Occupations
The most common Sales and Office occupations in Milford Square are Office & Administration (97 | 10.9%), and Sales & Related (49 | 5.5%).
Sales and Office Occupations by Sex
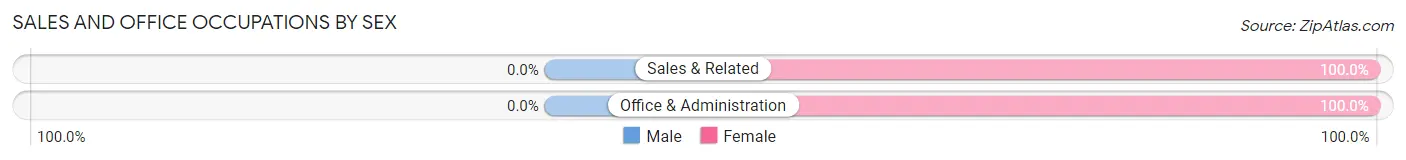
| Occupation | Male | Female |
| Sales & Related | 0 (0.0%) | 49 (100.0%) |
| Office & Administration | 0 (0.0%) | 97 (100.0%) |
| Total (Category) | 0 (0.0%) | 146 (100.0%) |
| Total (Overall) | 425 (47.7%) | 466 (52.3%) |
Natural Resources, Construction and Maintenance Occupations
The most common Natural Resources, Construction and Maintenance occupations in Milford Square are Installation, Maintenance & Repair (124 | 13.9%), and Construction & Extraction (94 | 10.5%).

Natural Resources, Construction and Maintenance Occupations by Sex
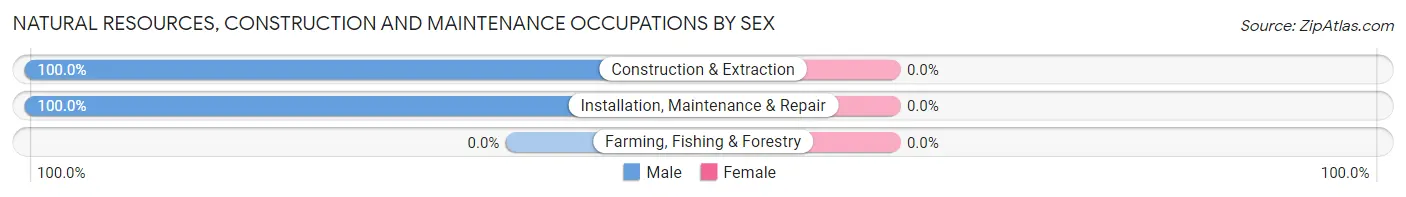
| Occupation | Male | Female |
| Farming, Fishing & Forestry | 0 (0.0%) | 0 (0.0%) |
| Construction & Extraction | 94 (100.0%) | 0 (0.0%) |
| Installation, Maintenance & Repair | 124 (100.0%) | 0 (0.0%) |
| Total (Category) | 218 (100.0%) | 0 (0.0%) |
| Total (Overall) | 425 (47.7%) | 466 (52.3%) |
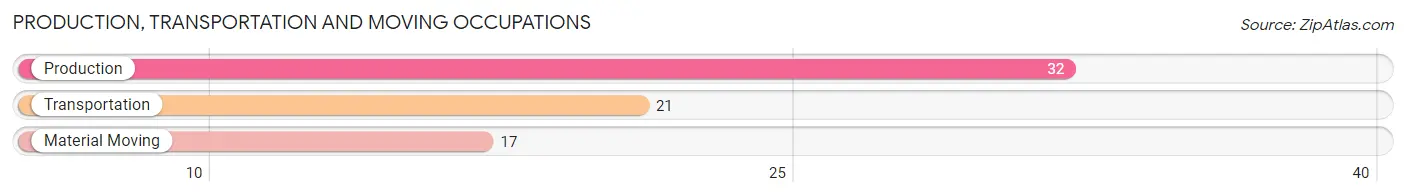
Production, Transportation and Moving Occupations
The most common Production, Transportation and Moving occupations in Milford Square are Production (32 | 3.6%), Transportation (21 | 2.4%), and Material Moving (17 | 1.9%).
Production, Transportation and Moving Occupations by Sex
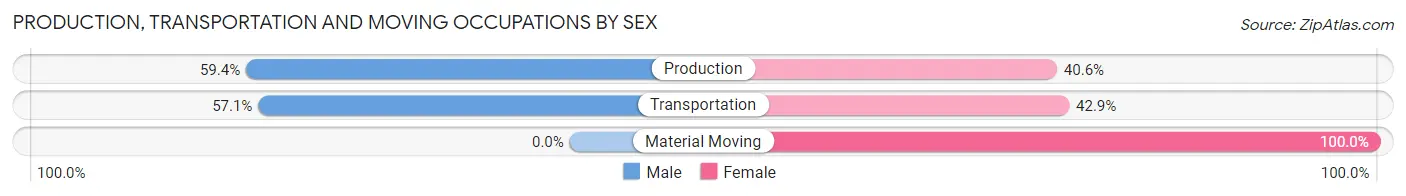
| Occupation | Male | Female |
| Production | 19 (59.4%) | 13 (40.6%) |
| Transportation | 12 (57.1%) | 9 (42.9%) |
| Material Moving | 0 (0.0%) | 17 (100.0%) |
| Total (Category) | 31 (44.3%) | 39 (55.7%) |
| Total (Overall) | 425 (47.7%) | 466 (52.3%) |
Employment Industries by Sex in Milford Square
Employment Industries in Milford Square
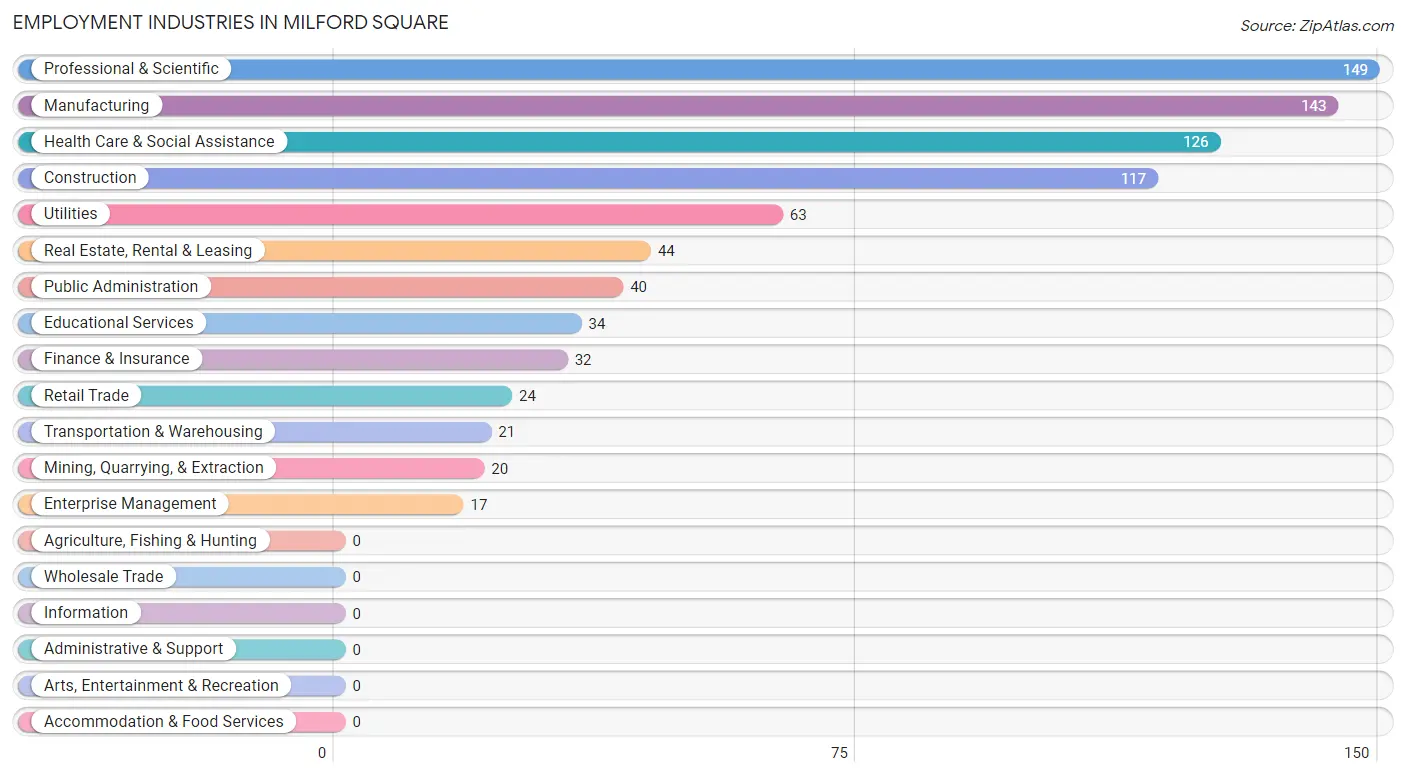
The major employment industries in Milford Square include Professional & Scientific (149 | 16.7%), Manufacturing (143 | 16.1%), Health Care & Social Assistance (126 | 14.1%), Construction (117 | 13.1%), and Utilities (63 | 7.1%).
Employment Industries by Sex in Milford Square
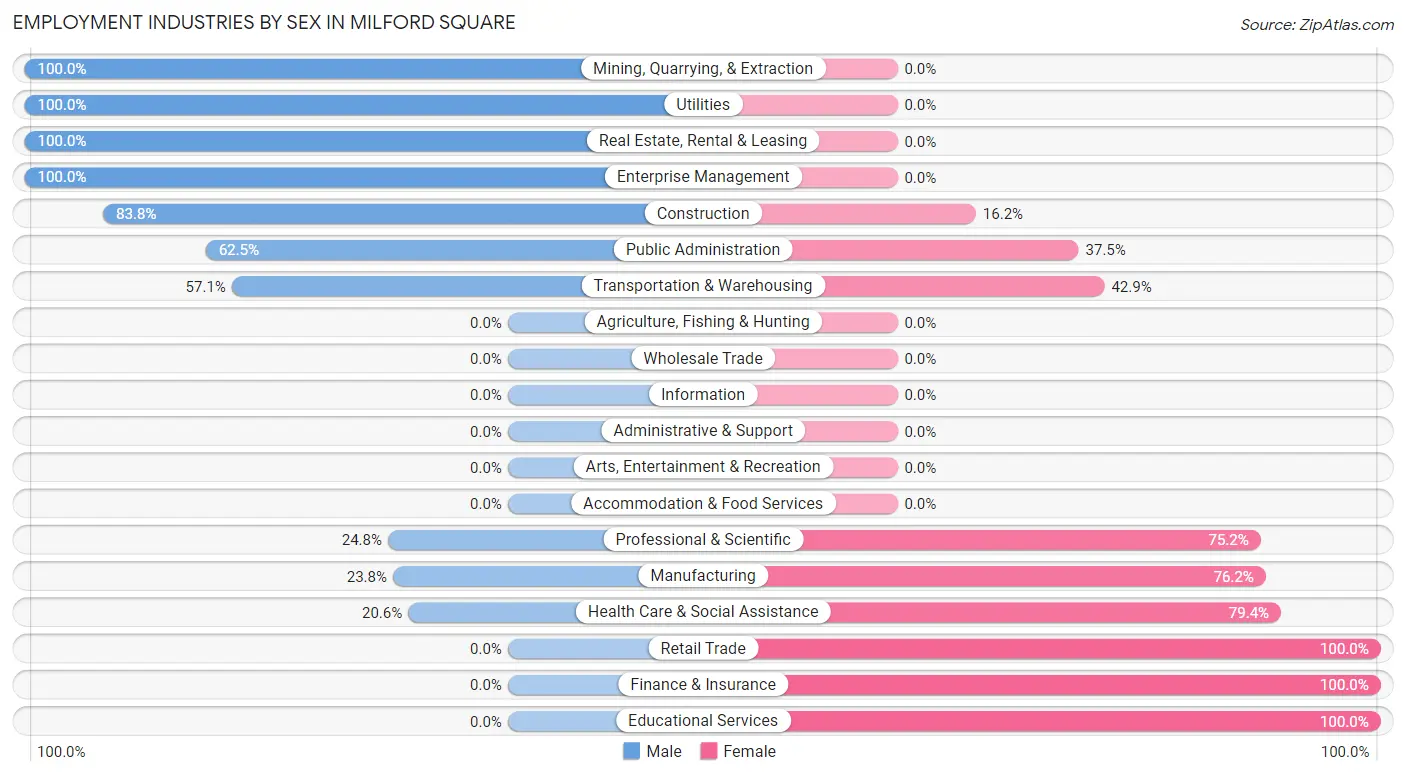
The Milford Square industries that see more men than women are Mining, Quarrying, & Extraction (100.0%), Utilities (100.0%), and Real Estate, Rental & Leasing (100.0%), whereas the industries that tend to have a higher number of women are Retail Trade (100.0%), Finance & Insurance (100.0%), and Educational Services (100.0%).
| Industry | Male | Female |
| Agriculture, Fishing & Hunting | 0 (0.0%) | 0 (0.0%) |
| Mining, Quarrying, & Extraction | 20 (100.0%) | 0 (0.0%) |
| Construction | 98 (83.8%) | 19 (16.2%) |
| Manufacturing | 34 (23.8%) | 109 (76.2%) |
| Wholesale Trade | 0 (0.0%) | 0 (0.0%) |
| Retail Trade | 0 (0.0%) | 24 (100.0%) |
| Transportation & Warehousing | 12 (57.1%) | 9 (42.9%) |
| Utilities | 63 (100.0%) | 0 (0.0%) |
| Information | 0 (0.0%) | 0 (0.0%) |
| Finance & Insurance | 0 (0.0%) | 32 (100.0%) |
| Real Estate, Rental & Leasing | 44 (100.0%) | 0 (0.0%) |
| Professional & Scientific | 37 (24.8%) | 112 (75.2%) |
| Enterprise Management | 17 (100.0%) | 0 (0.0%) |
| Administrative & Support | 0 (0.0%) | 0 (0.0%) |
| Educational Services | 0 (0.0%) | 34 (100.0%) |
| Health Care & Social Assistance | 26 (20.6%) | 100 (79.4%) |
| Arts, Entertainment & Recreation | 0 (0.0%) | 0 (0.0%) |
| Accommodation & Food Services | 0 (0.0%) | 0 (0.0%) |
| Public Administration | 25 (62.5%) | 15 (37.5%) |
| Total | 425 (47.7%) | 466 (52.3%) |
Education in Milford Square
School Enrollment in Milford Square
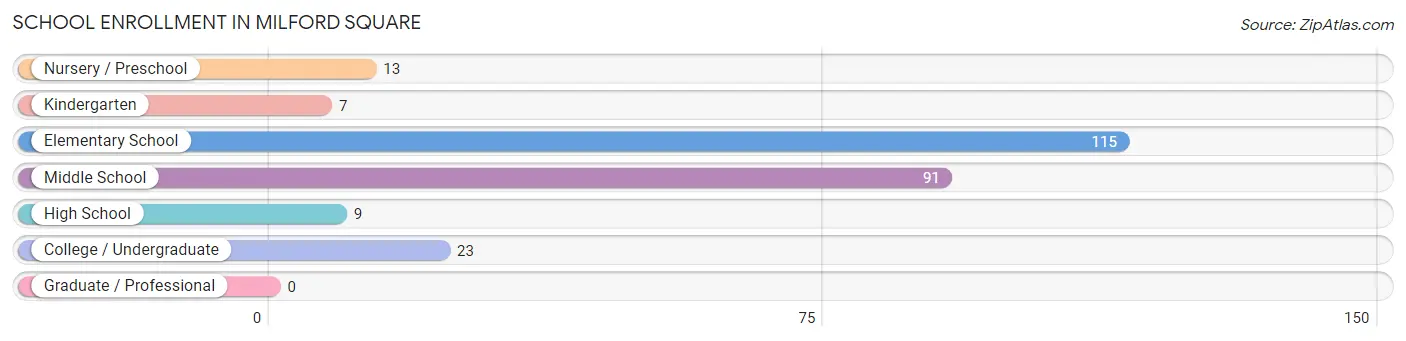
The most common levels of schooling among the 258 students in Milford Square are elementary school (115 | 44.6%), middle school (91 | 35.3%), and college / undergraduate (23 | 8.9%).
| School Level | # Students | % Students |
| Nursery / Preschool | 13 | 5.0% |
| Kindergarten | 7 | 2.7% |
| Elementary School | 115 | 44.6% |
| Middle School | 91 | 35.3% |
| High School | 9 | 3.5% |
| College / Undergraduate | 23 | 8.9% |
| Graduate / Professional | 0 | 0.0% |
| Total | 258 | 100.0% |
School Enrollment by Age by Funding Source in Milford Square
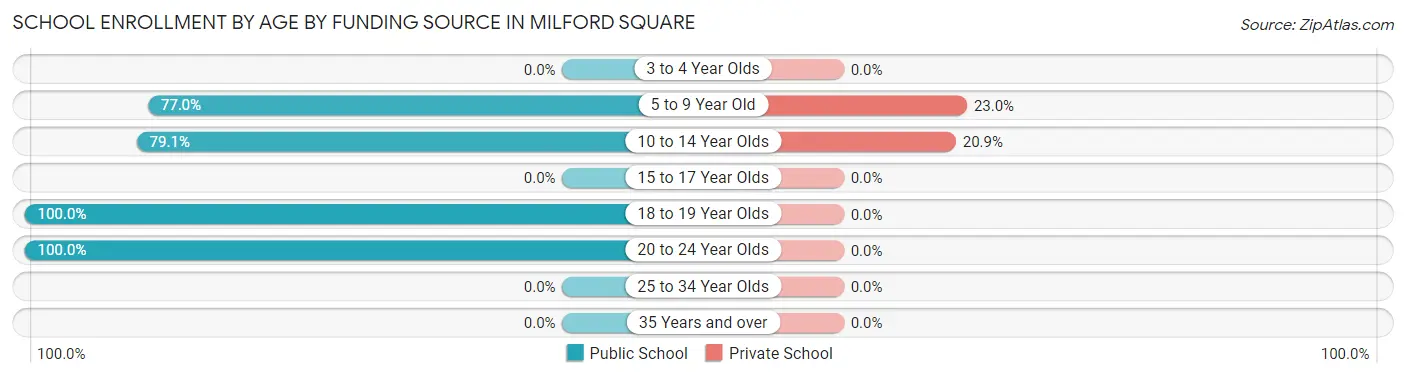
Out of a total of 258 students who are enrolled in schools in Milford Square, 50 (19.4%) attend a private institution, while the remaining 208 (80.6%) are enrolled in public schools. The age group of 5 to 9 year old has the highest likelihood of being enrolled in private schools, with 31 (23.0% in the age bracket) enrolled. Conversely, the age group of 18 to 19 year olds has the lowest likelihood of being enrolled in a private school, with 9 (100.0% in the age bracket) attending a public institution.
| Age Bracket | Public School | Private School |
| 3 to 4 Year Olds | 0 (0.0%) | 0 (0.0%) |
| 5 to 9 Year Old | 104 (77.0%) | 31 (23.0%) |
| 10 to 14 Year Olds | 72 (79.1%) | 19 (20.9%) |
| 15 to 17 Year Olds | 0 (0.0%) | 0 (0.0%) |
| 18 to 19 Year Olds | 9 (100.0%) | 0 (0.0%) |
| 20 to 24 Year Olds | 23 (100.0%) | 0 (0.0%) |
| 25 to 34 Year Olds | 0 (0.0%) | 0 (0.0%) |
| 35 Years and over | 0 (0.0%) | 0 (0.0%) |
| Total | 208 (80.6%) | 50 (19.4%) |
Educational Attainment by Field of Study in Milford Square
Bio, nature & agricultural (102 | 29.7%), psychology (59 | 17.2%), liberal arts & history (49 | 14.3%), arts & humanities (33 | 9.6%), and social sciences (24 | 7.0%) are the most common fields of study among 343 individuals in Milford Square who have obtained a bachelor's degree or higher.
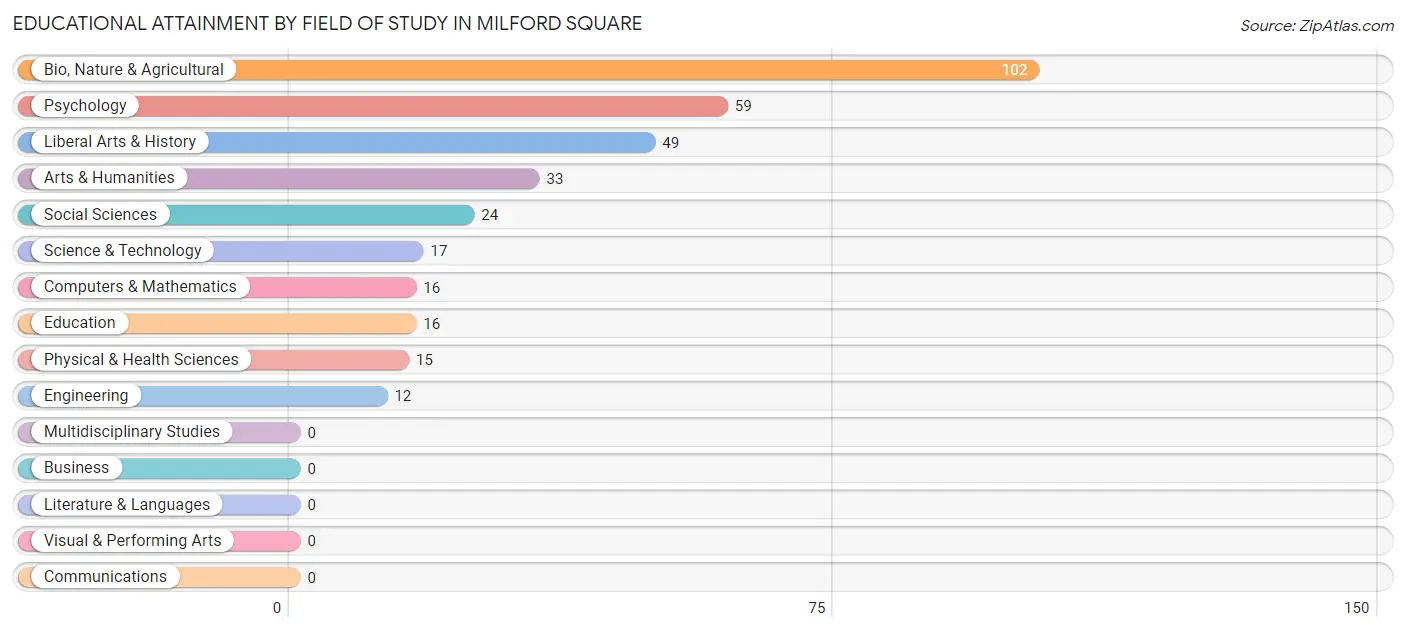
| Field of Study | # Graduates | % Graduates |
| Computers & Mathematics | 16 | 4.7% |
| Bio, Nature & Agricultural | 102 | 29.7% |
| Physical & Health Sciences | 15 | 4.4% |
| Psychology | 59 | 17.2% |
| Social Sciences | 24 | 7.0% |
| Engineering | 12 | 3.5% |
| Multidisciplinary Studies | 0 | 0.0% |
| Science & Technology | 17 | 5.0% |
| Business | 0 | 0.0% |
| Education | 16 | 4.7% |
| Literature & Languages | 0 | 0.0% |
| Liberal Arts & History | 49 | 14.3% |
| Visual & Performing Arts | 0 | 0.0% |
| Communications | 0 | 0.0% |
| Arts & Humanities | 33 | 9.6% |
| Total | 343 | 100.0% |
Transportation & Commute in Milford Square
Vehicle Availability by Sex in Milford Square
The most prevalent vehicle ownership categories in Milford Square are males with 2 vehicles (145, accounting for 34.1%) and females with 2 vehicles (91, making up 32.0%).
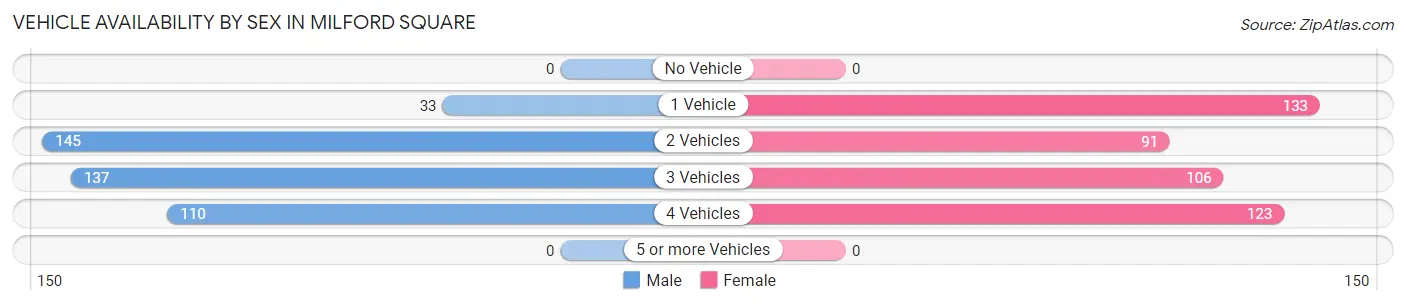
| Vehicles Available | Male | Female |
| No Vehicle | 0 (0.0%) | 0 (0.0%) |
| 1 Vehicle | 33 (7.8%) | 133 (29.4%) |
| 2 Vehicles | 145 (34.1%) | 91 (20.1%) |
| 3 Vehicles | 137 (32.2%) | 106 (23.4%) |
| 4 Vehicles | 110 (25.9%) | 123 (27.2%) |
| 5 or more Vehicles | 0 (0.0%) | 0 (0.0%) |
| Total | 425 (100.0%) | 453 (100.0%) |
Commute Time in Milford Square
The most frequently occuring commute durations in Milford Square are 25 to 29 minutes (160 commuters, 20.2%), 30 to 34 minutes (139 commuters, 17.5%), and 90 or more minutes (91 commuters, 11.5%).
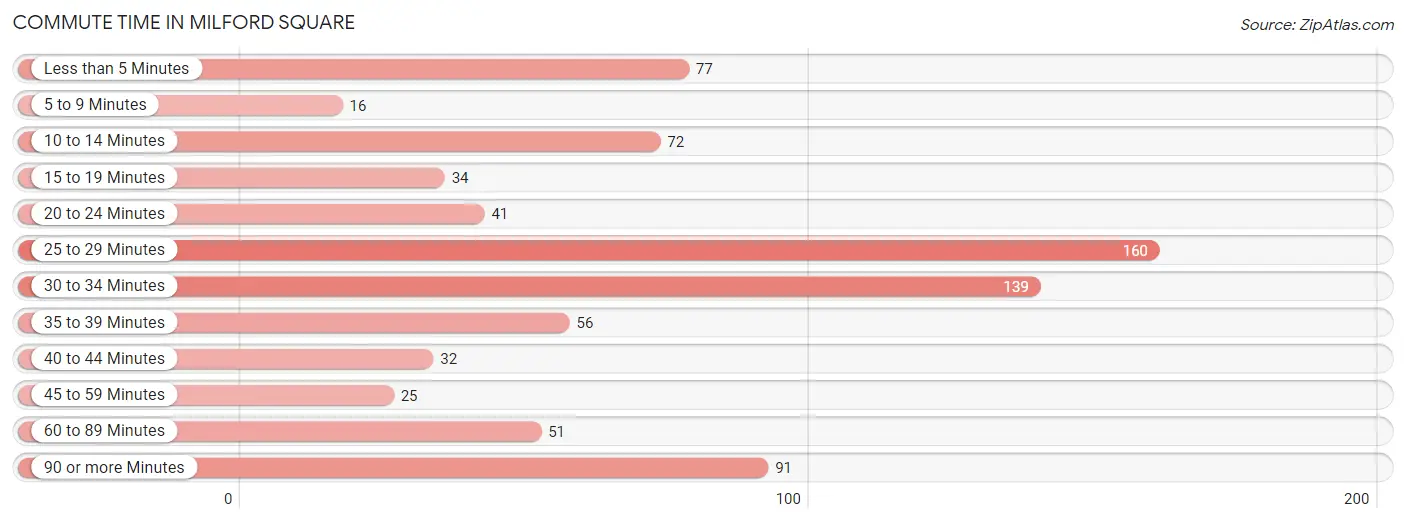
| Commute Time | # Commuters | % Commuters |
| Less than 5 Minutes | 77 | 9.7% |
| 5 to 9 Minutes | 16 | 2.0% |
| 10 to 14 Minutes | 72 | 9.1% |
| 15 to 19 Minutes | 34 | 4.3% |
| 20 to 24 Minutes | 41 | 5.2% |
| 25 to 29 Minutes | 160 | 20.2% |
| 30 to 34 Minutes | 139 | 17.5% |
| 35 to 39 Minutes | 56 | 7.0% |
| 40 to 44 Minutes | 32 | 4.0% |
| 45 to 59 Minutes | 25 | 3.2% |
| 60 to 89 Minutes | 51 | 6.4% |
| 90 or more Minutes | 91 | 11.5% |
Commute Time by Sex in Milford Square
The most common commute times in Milford Square are 90 or more minutes (75 commuters, 19.2%) for males and 30 to 34 minutes (103 commuters, 25.5%) for females.
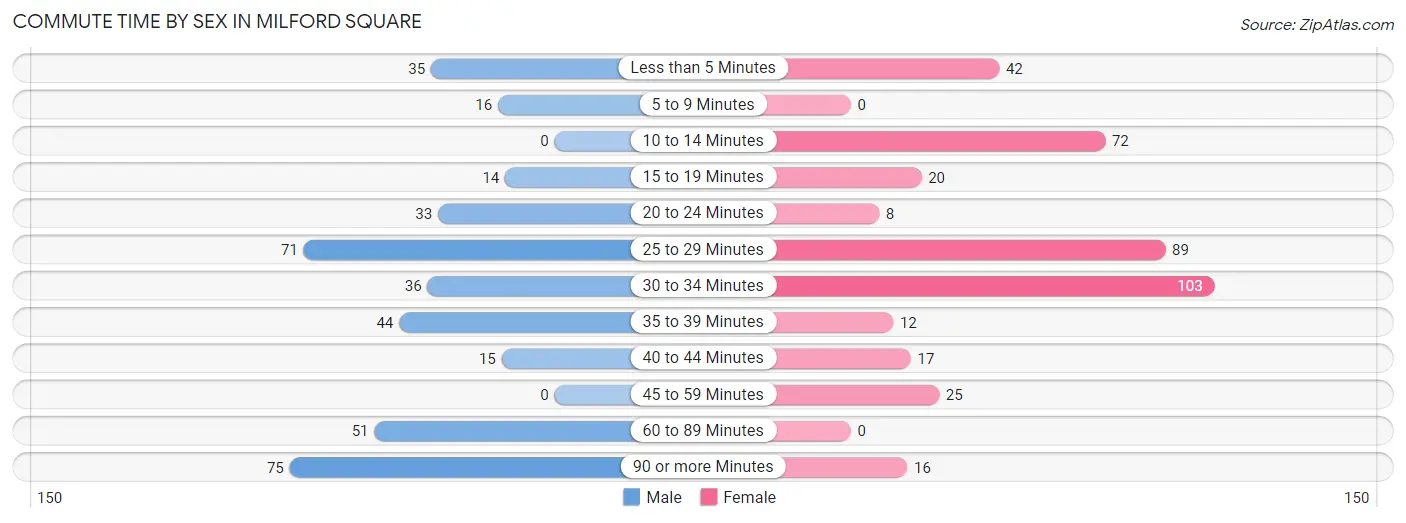
| Commute Time | Male | Female |
| Less than 5 Minutes | 35 (9.0%) | 42 (10.4%) |
| 5 to 9 Minutes | 16 (4.1%) | 0 (0.0%) |
| 10 to 14 Minutes | 0 (0.0%) | 72 (17.8%) |
| 15 to 19 Minutes | 14 (3.6%) | 20 (5.0%) |
| 20 to 24 Minutes | 33 (8.5%) | 8 (2.0%) |
| 25 to 29 Minutes | 71 (18.2%) | 89 (22.0%) |
| 30 to 34 Minutes | 36 (9.2%) | 103 (25.5%) |
| 35 to 39 Minutes | 44 (11.3%) | 12 (3.0%) |
| 40 to 44 Minutes | 15 (3.8%) | 17 (4.2%) |
| 45 to 59 Minutes | 0 (0.0%) | 25 (6.2%) |
| 60 to 89 Minutes | 51 (13.1%) | 0 (0.0%) |
| 90 or more Minutes | 75 (19.2%) | 16 (4.0%) |
Time of Departure to Work by Sex in Milford Square
The most frequent times of departure to work in Milford Square are 6:30 AM to 6:59 AM (117, 30.0%) for males and 7:30 AM to 7:59 AM (101, 25.0%) for females.
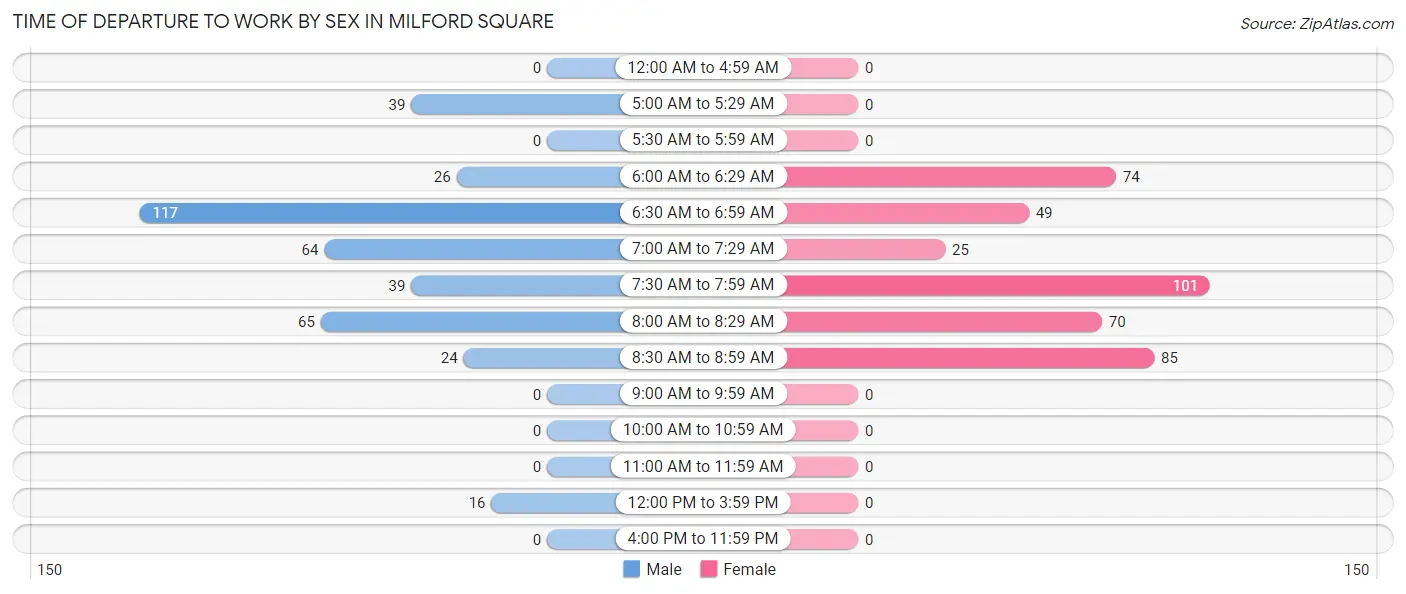
| Time of Departure | Male | Female |
| 12:00 AM to 4:59 AM | 0 (0.0%) | 0 (0.0%) |
| 5:00 AM to 5:29 AM | 39 (10.0%) | 0 (0.0%) |
| 5:30 AM to 5:59 AM | 0 (0.0%) | 0 (0.0%) |
| 6:00 AM to 6:29 AM | 26 (6.7%) | 74 (18.3%) |
| 6:30 AM to 6:59 AM | 117 (30.0%) | 49 (12.1%) |
| 7:00 AM to 7:29 AM | 64 (16.4%) | 25 (6.2%) |
| 7:30 AM to 7:59 AM | 39 (10.0%) | 101 (25.0%) |
| 8:00 AM to 8:29 AM | 65 (16.7%) | 70 (17.3%) |
| 8:30 AM to 8:59 AM | 24 (6.1%) | 85 (21.0%) |
| 9:00 AM to 9:59 AM | 0 (0.0%) | 0 (0.0%) |
| 10:00 AM to 10:59 AM | 0 (0.0%) | 0 (0.0%) |
| 11:00 AM to 11:59 AM | 0 (0.0%) | 0 (0.0%) |
| 12:00 PM to 3:59 PM | 16 (4.1%) | 0 (0.0%) |
| 4:00 PM to 11:59 PM | 0 (0.0%) | 0 (0.0%) |
| Total | 390 (100.0%) | 404 (100.0%) |
Housing Occupancy in Milford Square
Occupancy by Ownership in Milford Square
Of the total 502 dwellings in Milford Square, owner-occupied units account for 485 (96.6%), while renter-occupied units make up 17 (3.4%).
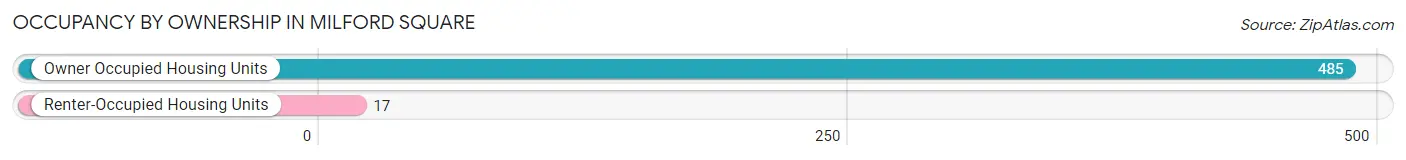
| Occupancy | # Housing Units | % Housing Units |
| Owner Occupied Housing Units | 485 | 96.6% |
| Renter-Occupied Housing Units | 17 | 3.4% |
| Total Occupied Housing Units | 502 | 100.0% |
Occupancy by Household Size in Milford Square
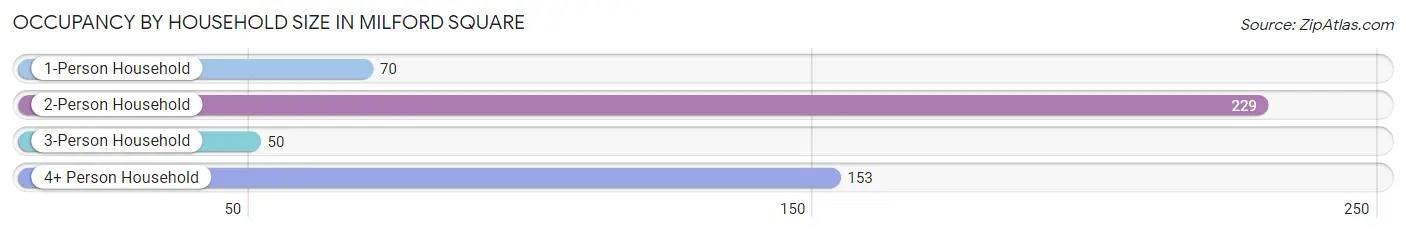
| Household Size | # Housing Units | % Housing Units |
| 1-Person Household | 70 | 13.9% |
| 2-Person Household | 229 | 45.6% |
| 3-Person Household | 50 | 10.0% |
| 4+ Person Household | 153 | 30.5% |
| Total Housing Units | 502 | 100.0% |
Occupancy by Ownership by Household Size in Milford Square
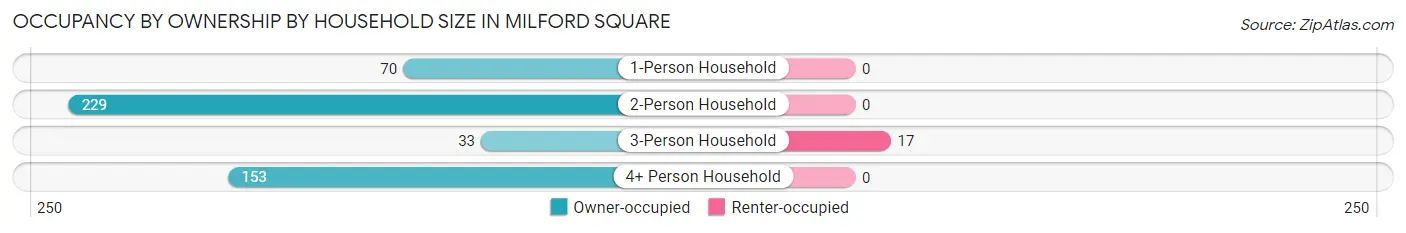
| Household Size | Owner-occupied | Renter-occupied |
| 1-Person Household | 70 (100.0%) | 0 (0.0%) |
| 2-Person Household | 229 (100.0%) | 0 (0.0%) |
| 3-Person Household | 33 (66.0%) | 17 (34.0%) |
| 4+ Person Household | 153 (100.0%) | 0 (0.0%) |
| Total Housing Units | 485 (96.6%) | 17 (3.4%) |
Occupancy by Educational Attainment in Milford Square
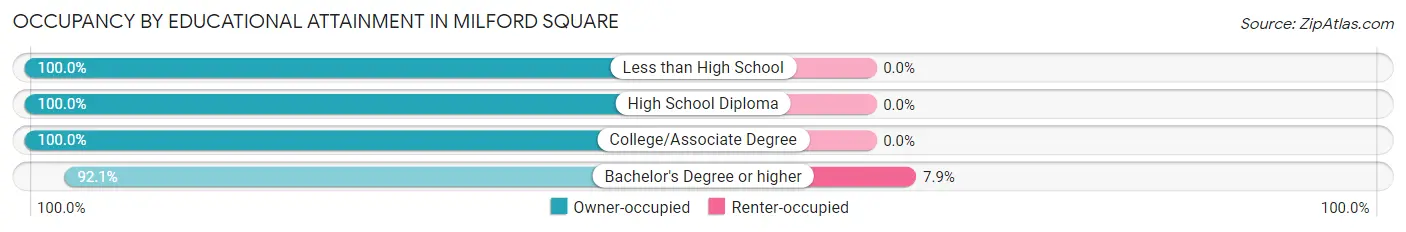
| Household Size | Owner-occupied | Renter-occupied |
| Less than High School | 23 (100.0%) | 0 (0.0%) |
| High School Diploma | 180 (100.0%) | 0 (0.0%) |
| College/Associate Degree | 84 (100.0%) | 0 (0.0%) |
| Bachelor's Degree or higher | 198 (92.1%) | 17 (7.9%) |
Occupancy by Age of Householder in Milford Square
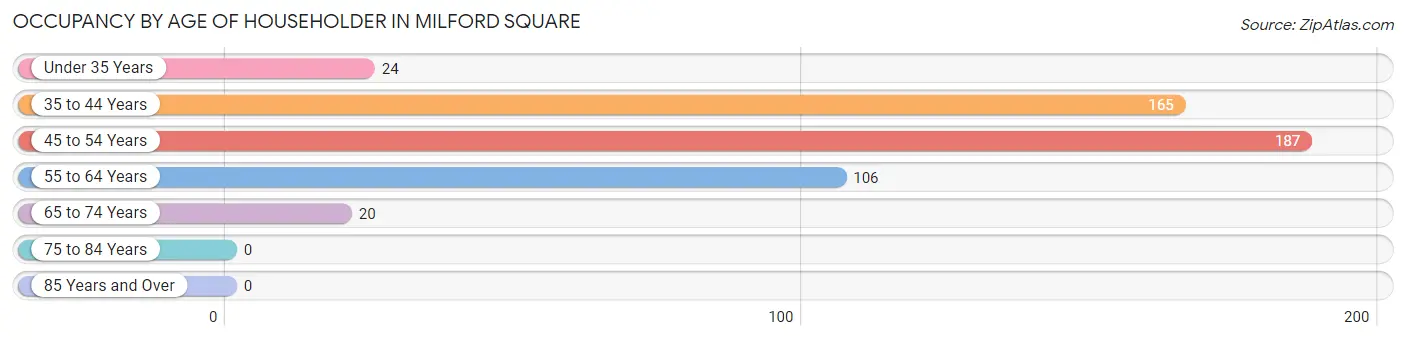
| Age Bracket | # Households | % Households |
| Under 35 Years | 24 | 4.8% |
| 35 to 44 Years | 165 | 32.9% |
| 45 to 54 Years | 187 | 37.2% |
| 55 to 64 Years | 106 | 21.1% |
| 65 to 74 Years | 20 | 4.0% |
| 75 to 84 Years | 0 | 0.0% |
| 85 Years and Over | 0 | 0.0% |
| Total | 502 | 100.0% |
Housing Finances in Milford Square
Median Income by Occupancy in Milford Square
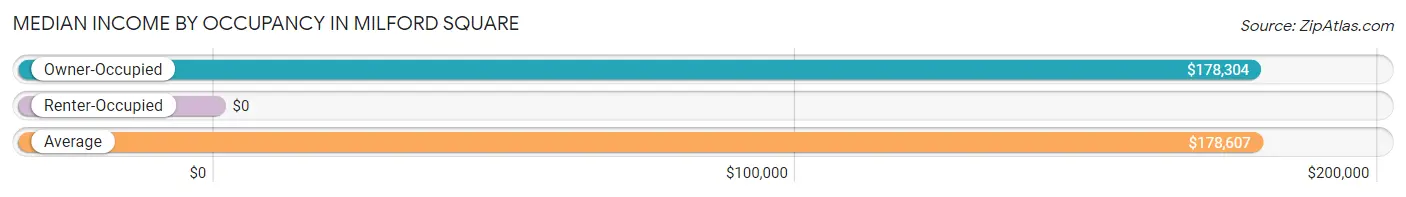
| Occupancy Type | # Households | Median Income |
| Owner-Occupied | 485 (96.6%) | $178,304 |
| Renter-Occupied | 17 (3.4%) | $0 |
| Average | 502 (100.0%) | $178,607 |
Occupancy by Householder Income Bracket in Milford Square
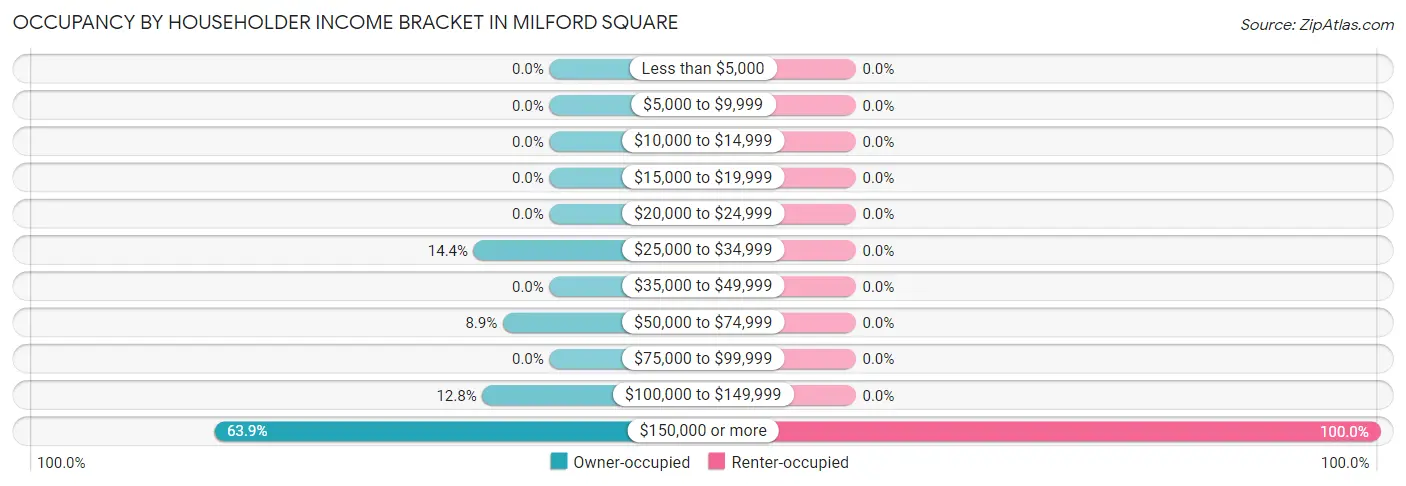
| Income Bracket | Owner-occupied | Renter-occupied |
| Less than $5,000 | 0 (0.0%) | 0 (0.0%) |
| $5,000 to $9,999 | 0 (0.0%) | 0 (0.0%) |
| $10,000 to $14,999 | 0 (0.0%) | 0 (0.0%) |
| $15,000 to $19,999 | 0 (0.0%) | 0 (0.0%) |
| $20,000 to $24,999 | 0 (0.0%) | 0 (0.0%) |
| $25,000 to $34,999 | 70 (14.4%) | 0 (0.0%) |
| $35,000 to $49,999 | 0 (0.0%) | 0 (0.0%) |
| $50,000 to $74,999 | 43 (8.9%) | 0 (0.0%) |
| $75,000 to $99,999 | 0 (0.0%) | 0 (0.0%) |
| $100,000 to $149,999 | 62 (12.8%) | 0 (0.0%) |
| $150,000 or more | 310 (63.9%) | 17 (100.0%) |
| Total | 485 (100.0%) | 17 (100.0%) |
Monthly Housing Cost Tiers in Milford Square
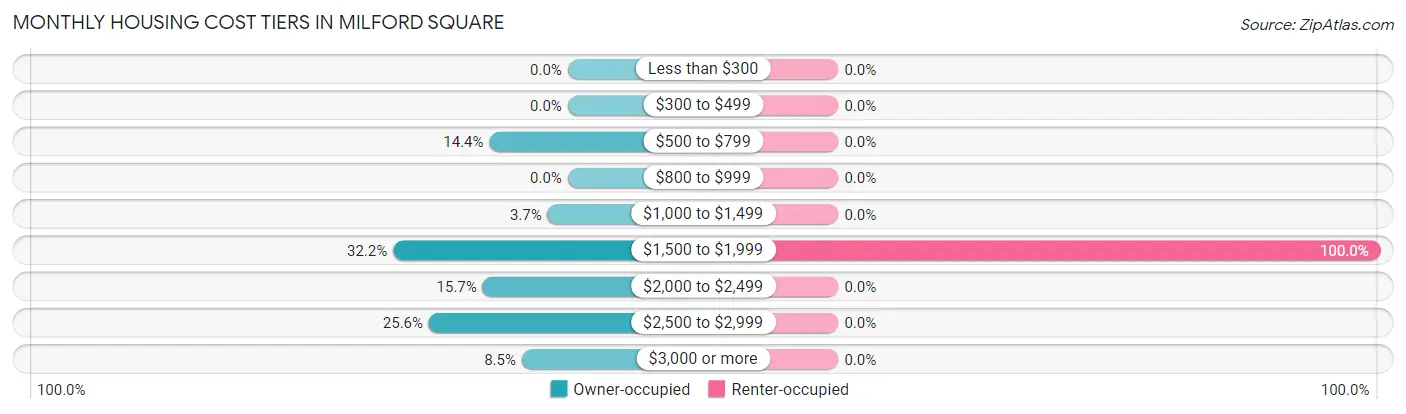
| Monthly Cost | Owner-occupied | Renter-occupied |
| Less than $300 | 0 (0.0%) | 0 (0.0%) |
| $300 to $499 | 0 (0.0%) | 0 (0.0%) |
| $500 to $799 | 70 (14.4%) | 0 (0.0%) |
| $800 to $999 | 0 (0.0%) | 0 (0.0%) |
| $1,000 to $1,499 | 18 (3.7%) | 0 (0.0%) |
| $1,500 to $1,999 | 156 (32.2%) | 17 (100.0%) |
| $2,000 to $2,499 | 76 (15.7%) | 0 (0.0%) |
| $2,500 to $2,999 | 124 (25.6%) | 0 (0.0%) |
| $3,000 or more | 41 (8.5%) | 0 (0.0%) |
| Total | 485 (100.0%) | 17 (100.0%) |
Physical Housing Characteristics in Milford Square
Housing Structures in Milford Square
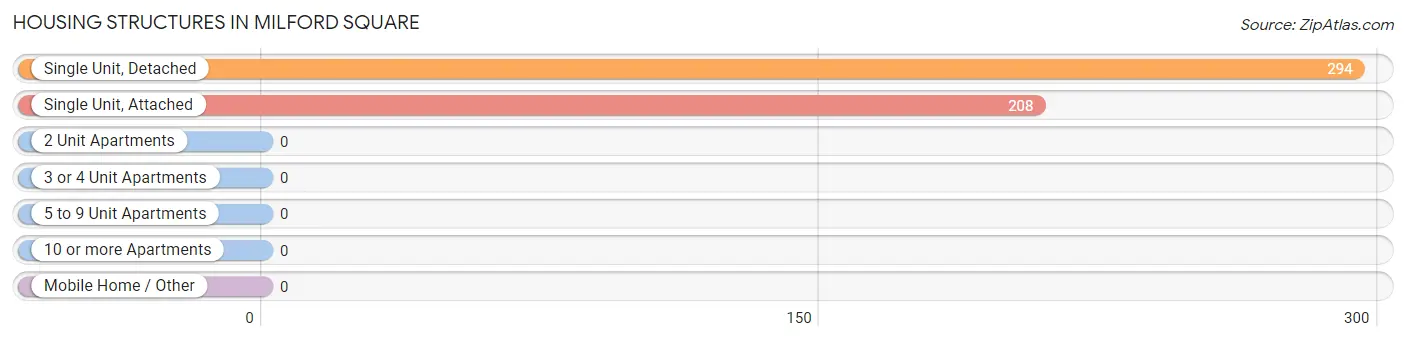
| Structure Type | # Housing Units | % Housing Units |
| Single Unit, Detached | 294 | 58.6% |
| Single Unit, Attached | 208 | 41.4% |
| 2 Unit Apartments | 0 | 0.0% |
| 3 or 4 Unit Apartments | 0 | 0.0% |
| 5 to 9 Unit Apartments | 0 | 0.0% |
| 10 or more Apartments | 0 | 0.0% |
| Mobile Home / Other | 0 | 0.0% |
| Total | 502 | 100.0% |
Housing Structures by Occupancy in Milford Square
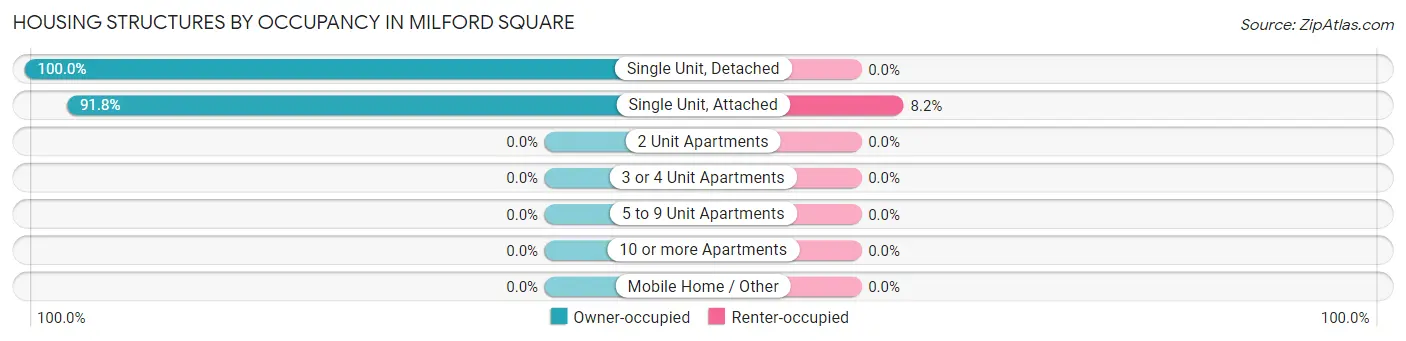
| Structure Type | Owner-occupied | Renter-occupied |
| Single Unit, Detached | 294 (100.0%) | 0 (0.0%) |
| Single Unit, Attached | 191 (91.8%) | 17 (8.2%) |
| 2 Unit Apartments | 0 (0.0%) | 0 (0.0%) |
| 3 or 4 Unit Apartments | 0 (0.0%) | 0 (0.0%) |
| 5 to 9 Unit Apartments | 0 (0.0%) | 0 (0.0%) |
| 10 or more Apartments | 0 (0.0%) | 0 (0.0%) |
| Mobile Home / Other | 0 (0.0%) | 0 (0.0%) |
| Total | 485 (96.6%) | 17 (3.4%) |
Housing Structures by Number of Rooms in Milford Square
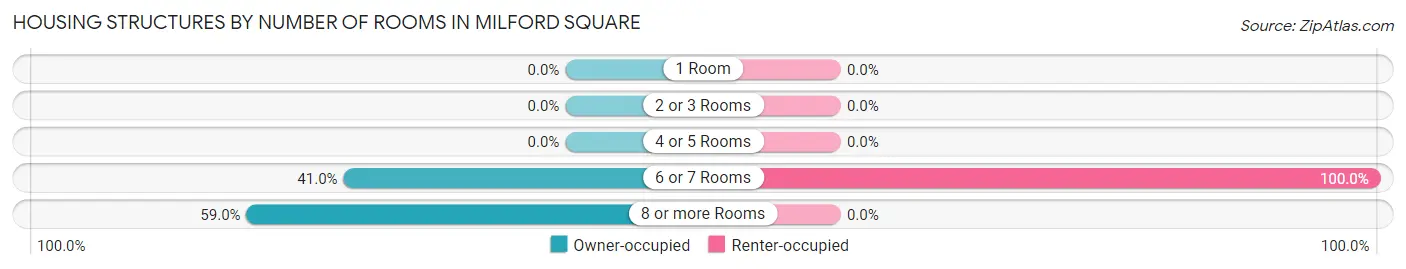
| Number of Rooms | Owner-occupied | Renter-occupied |
| 1 Room | 0 (0.0%) | 0 (0.0%) |
| 2 or 3 Rooms | 0 (0.0%) | 0 (0.0%) |
| 4 or 5 Rooms | 0 (0.0%) | 0 (0.0%) |
| 6 or 7 Rooms | 199 (41.0%) | 17 (100.0%) |
| 8 or more Rooms | 286 (59.0%) | 0 (0.0%) |
| Total | 485 (100.0%) | 17 (100.0%) |
Housing Structure by Heating Type in Milford Square
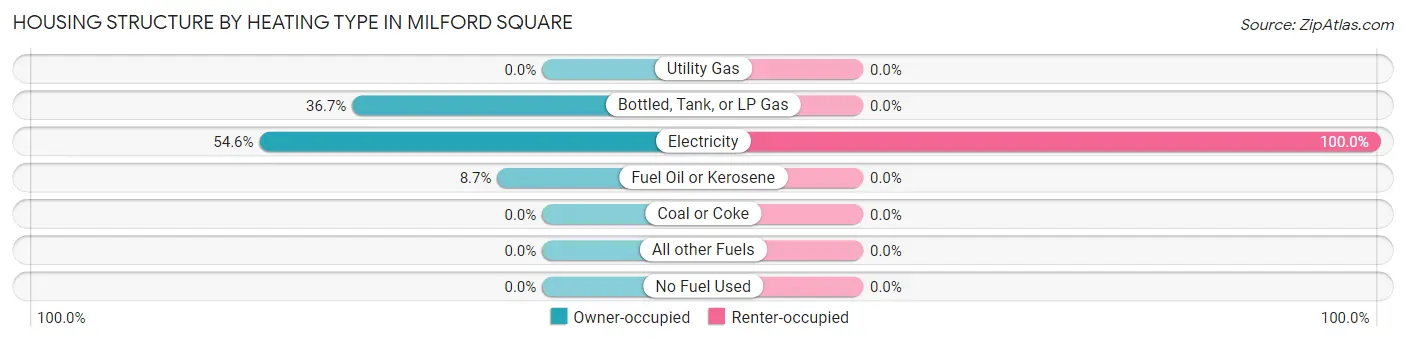
| Heating Type | Owner-occupied | Renter-occupied |
| Utility Gas | 0 (0.0%) | 0 (0.0%) |
| Bottled, Tank, or LP Gas | 178 (36.7%) | 0 (0.0%) |
| Electricity | 265 (54.6%) | 17 (100.0%) |
| Fuel Oil or Kerosene | 42 (8.7%) | 0 (0.0%) |
| Coal or Coke | 0 (0.0%) | 0 (0.0%) |
| All other Fuels | 0 (0.0%) | 0 (0.0%) |
| No Fuel Used | 0 (0.0%) | 0 (0.0%) |
| Total | 485 (100.0%) | 17 (100.0%) |
Household Vehicle Usage in Milford Square
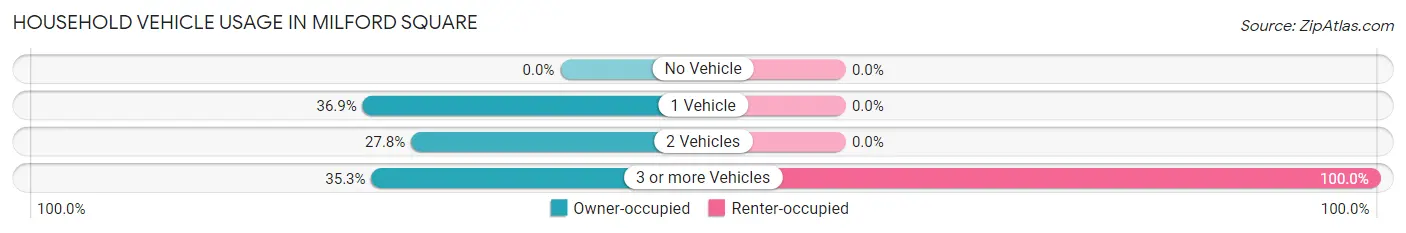
| Vehicles per Household | Owner-occupied | Renter-occupied |
| No Vehicle | 0 (0.0%) | 0 (0.0%) |
| 1 Vehicle | 179 (36.9%) | 0 (0.0%) |
| 2 Vehicles | 135 (27.8%) | 0 (0.0%) |
| 3 or more Vehicles | 171 (35.3%) | 17 (100.0%) |
| Total | 485 (100.0%) | 17 (100.0%) |
Real Estate & Mortgages in Milford Square
Real Estate and Mortgage Overview in Milford Square
| Characteristic | Without Mortgage | With Mortgage |
| Housing Units | 94 | 391 |
| Median Property Value | $247,000 | $330,200 |
| Median Household Income | $165,758 | $253 |
| Monthly Housing Costs | $738 | $41 |
| Real Estate Taxes | $4,378 | $0 |
Property Value by Mortgage Status in Milford Square
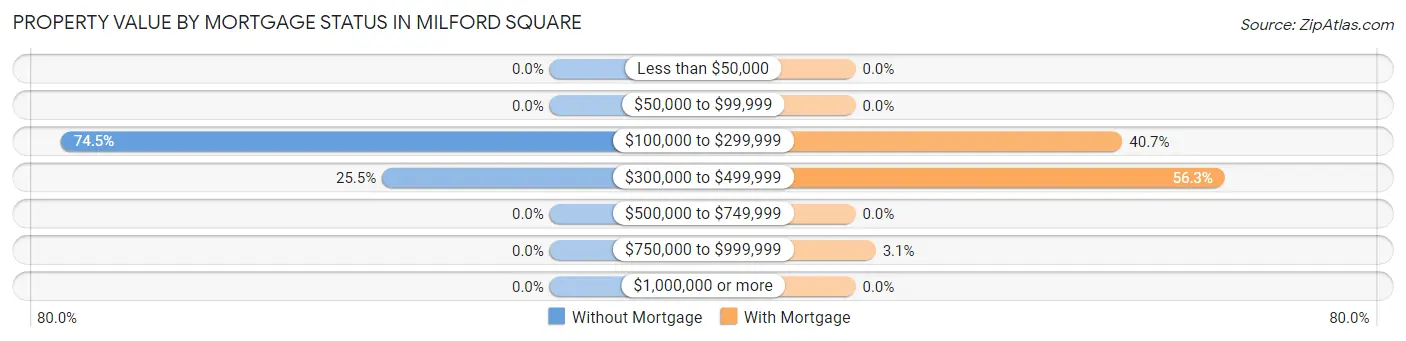
| Property Value | Without Mortgage | With Mortgage |
| Less than $50,000 | 0 (0.0%) | 0 (0.0%) |
| $50,000 to $99,999 | 0 (0.0%) | 0 (0.0%) |
| $100,000 to $299,999 | 70 (74.5%) | 159 (40.7%) |
| $300,000 to $499,999 | 24 (25.5%) | 220 (56.3%) |
| $500,000 to $749,999 | 0 (0.0%) | 0 (0.0%) |
| $750,000 to $999,999 | 0 (0.0%) | 12 (3.1%) |
| $1,000,000 or more | 0 (0.0%) | 0 (0.0%) |
| Total | 94 (100.0%) | 391 (100.0%) |
Household Income by Mortgage Status in Milford Square
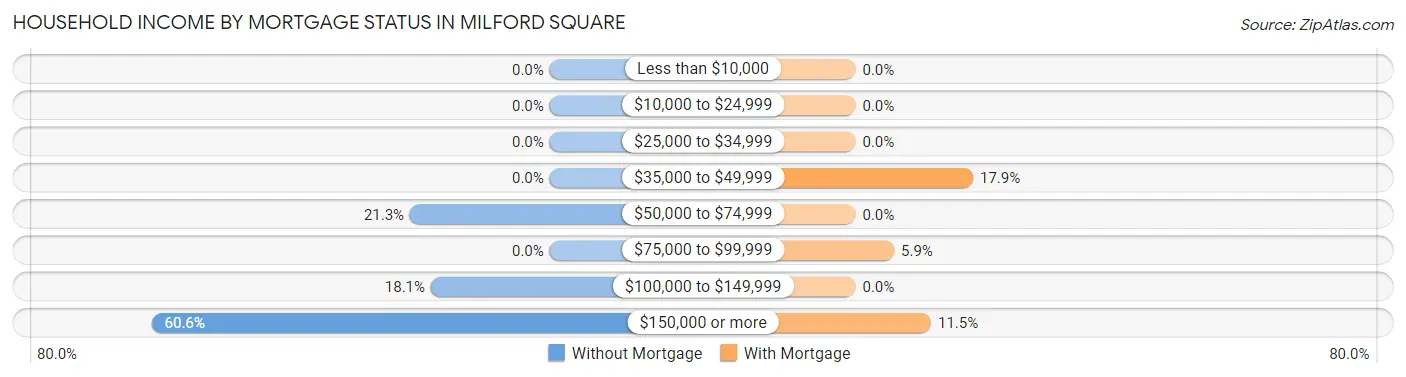
| Household Income | Without Mortgage | With Mortgage |
| Less than $10,000 | 0 (0.0%) | 0 (0.0%) |
| $10,000 to $24,999 | 0 (0.0%) | 0 (0.0%) |
| $25,000 to $34,999 | 0 (0.0%) | 0 (0.0%) |
| $35,000 to $49,999 | 0 (0.0%) | 70 (17.9%) |
| $50,000 to $74,999 | 20 (21.3%) | 0 (0.0%) |
| $75,000 to $99,999 | 0 (0.0%) | 23 (5.9%) |
| $100,000 to $149,999 | 17 (18.1%) | 0 (0.0%) |
| $150,000 or more | 57 (60.6%) | 45 (11.5%) |
| Total | 94 (100.0%) | 391 (100.0%) |
Property Value to Household Income Ratio in Milford Square
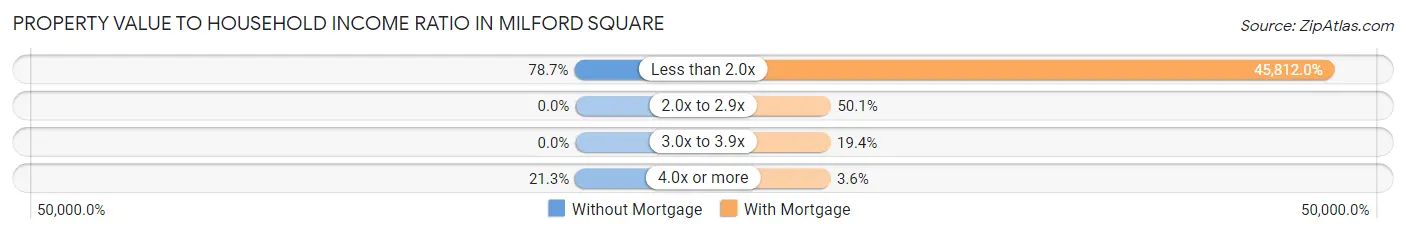
| Value-to-Income Ratio | Without Mortgage | With Mortgage |
| Less than 2.0x | 74 (78.7%) | 179,125 (45,812.0%) |
| 2.0x to 2.9x | 0 (0.0%) | 196 (50.1%) |
| 3.0x to 3.9x | 0 (0.0%) | 76 (19.4%) |
| 4.0x or more | 20 (21.3%) | 14 (3.6%) |
| Total | 94 (100.0%) | 391 (100.0%) |
Real Estate Taxes by Mortgage Status in Milford Square
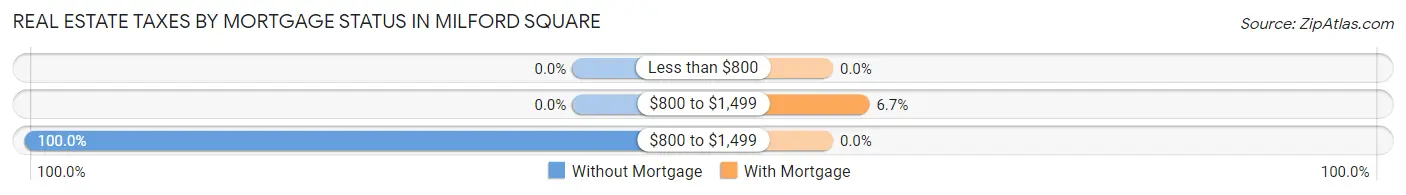
| Property Taxes | Without Mortgage | With Mortgage |
| Less than $800 | 0 (0.0%) | 0 (0.0%) |
| $800 to $1,499 | 0 (0.0%) | 26 (6.7%) |
| $800 to $1,499 | 94 (100.0%) | 0 (0.0%) |
| Total | 94 (100.0%) | 391 (100.0%) |
Health & Disability in Milford Square
Health Insurance Coverage by Age in Milford Square
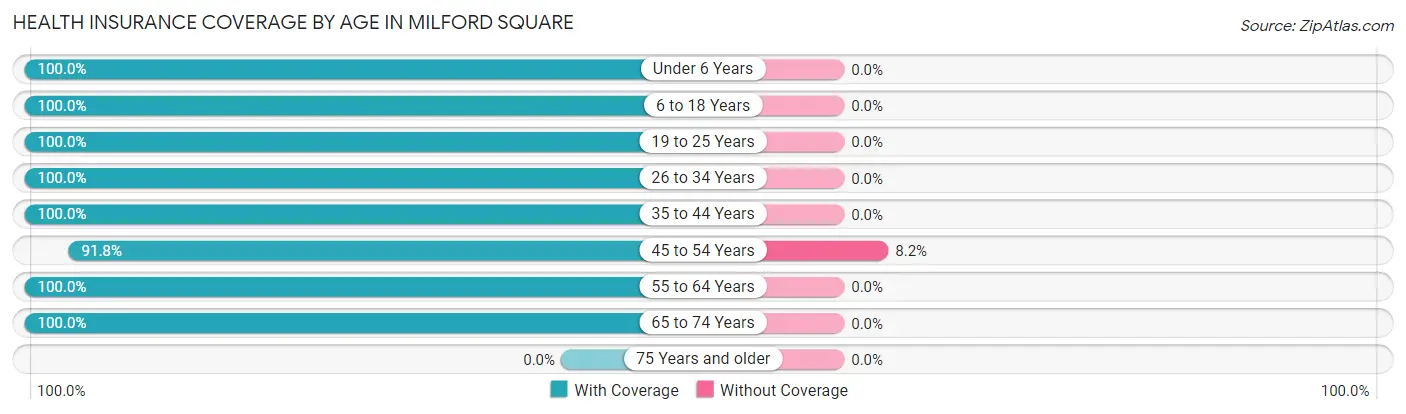
| Age Bracket | With Coverage | Without Coverage |
| Under 6 Years | 54 (100.0%) | 0 (0.0%) |
| 6 to 18 Years | 241 (100.0%) | 0 (0.0%) |
| 19 to 25 Years | 85 (100.0%) | 0 (0.0%) |
| 26 to 34 Years | 111 (100.0%) | 0 (0.0%) |
| 35 to 44 Years | 258 (100.0%) | 0 (0.0%) |
| 45 to 54 Years | 257 (91.8%) | 23 (8.2%) |
| 55 to 64 Years | 180 (100.0%) | 0 (0.0%) |
| 65 to 74 Years | 84 (100.0%) | 0 (0.0%) |
| 75 Years and older | 0 (0.0%) | 0 (0.0%) |
| Total | 1,270 (98.2%) | 23 (1.8%) |
Health Insurance Coverage by Citizenship Status in Milford Square
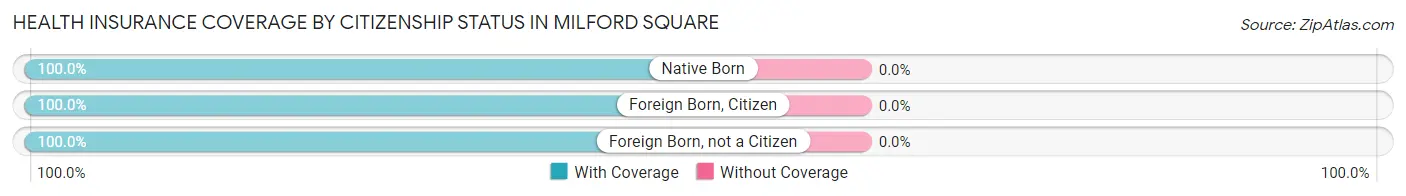
| Citizenship Status | With Coverage | Without Coverage |
| Native Born | 54 (100.0%) | 0 (0.0%) |
| Foreign Born, Citizen | 241 (100.0%) | 0 (0.0%) |
| Foreign Born, not a Citizen | 85 (100.0%) | 0 (0.0%) |
Health Insurance Coverage by Household Income in Milford Square
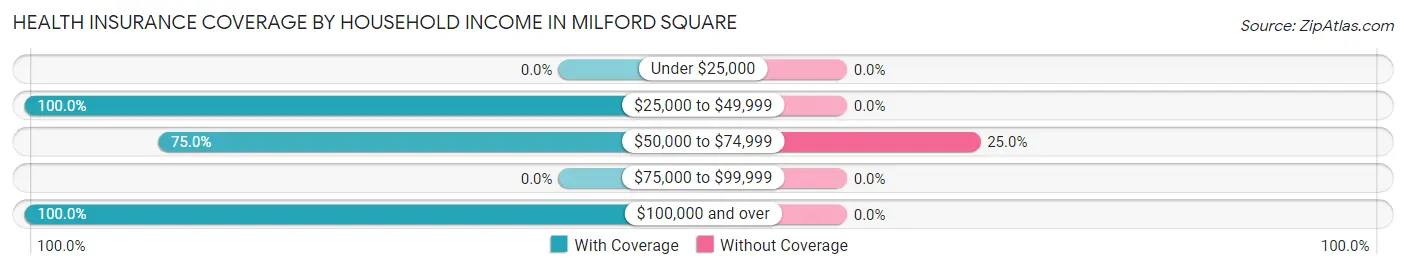
| Household Income | With Coverage | Without Coverage |
| Under $25,000 | 0 (0.0%) | 0 (0.0%) |
| $25,000 to $49,999 | 70 (100.0%) | 0 (0.0%) |
| $50,000 to $74,999 | 69 (75.0%) | 23 (25.0%) |
| $75,000 to $99,999 | 0 (0.0%) | 0 (0.0%) |
| $100,000 and over | 1,131 (100.0%) | 0 (0.0%) |
Public vs Private Health Insurance Coverage by Age in Milford Square
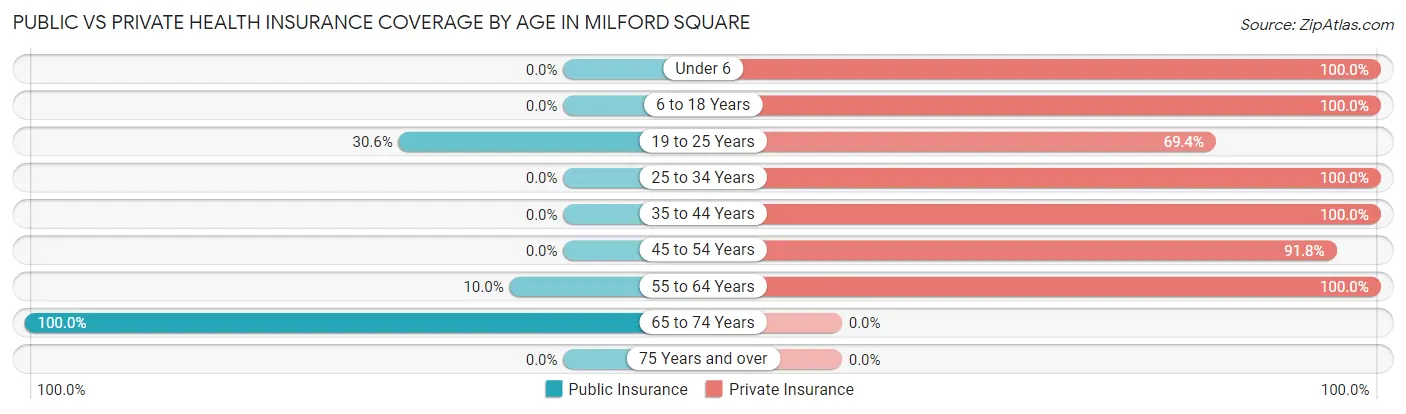
| Age Bracket | Public Insurance | Private Insurance |
| Under 6 | 0 (0.0%) | 54 (100.0%) |
| 6 to 18 Years | 0 (0.0%) | 241 (100.0%) |
| 19 to 25 Years | 26 (30.6%) | 59 (69.4%) |
| 25 to 34 Years | 0 (0.0%) | 111 (100.0%) |
| 35 to 44 Years | 0 (0.0%) | 258 (100.0%) |
| 45 to 54 Years | 0 (0.0%) | 257 (91.8%) |
| 55 to 64 Years | 18 (10.0%) | 180 (100.0%) |
| 65 to 74 Years | 84 (100.0%) | 0 (0.0%) |
| 75 Years and over | 0 (0.0%) | 0 (0.0%) |
| Total | 128 (9.9%) | 1,160 (89.7%) |
Disability Status by Sex by Age in Milford Square
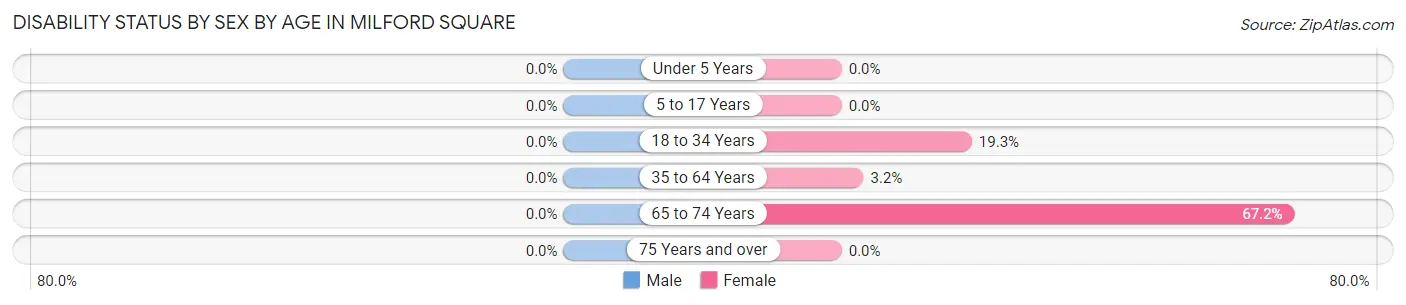
| Age Bracket | Male | Female |
| Under 5 Years | 0 (0.0%) | 0 (0.0%) |
| 5 to 17 Years | 0 (0.0%) | 0 (0.0%) |
| 18 to 34 Years | 0 (0.0%) | 17 (19.3%) |
| 35 to 64 Years | 0 (0.0%) | 13 (3.2%) |
| 65 to 74 Years | 0 (0.0%) | 41 (67.2%) |
| 75 Years and over | 0 (0.0%) | 0 (0.0%) |
Disability Class by Sex by Age in Milford Square
Disability Class: Hearing Difficulty
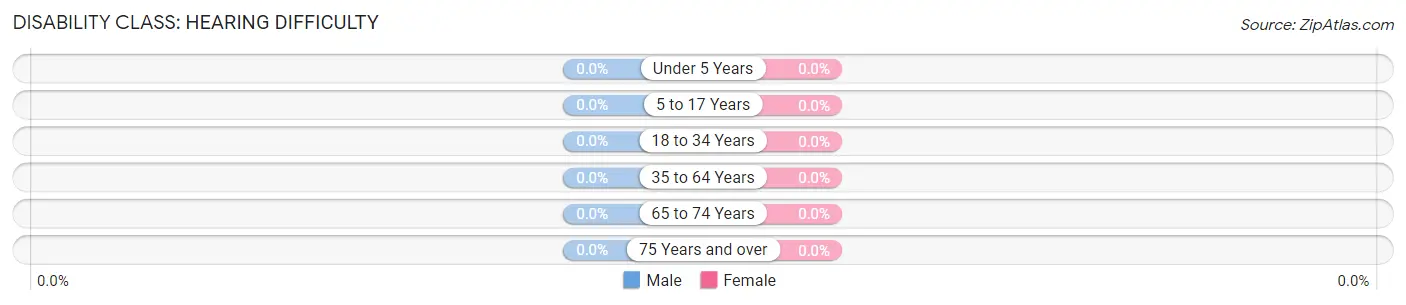
| Age Bracket | Male | Female |
| Under 5 Years | 0 (0.0%) | 0 (0.0%) |
| 5 to 17 Years | 0 (0.0%) | 0 (0.0%) |
| 18 to 34 Years | 0 (0.0%) | 0 (0.0%) |
| 35 to 64 Years | 0 (0.0%) | 0 (0.0%) |
| 65 to 74 Years | 0 (0.0%) | 0 (0.0%) |
| 75 Years and over | 0 (0.0%) | 0 (0.0%) |
Disability Class: Vision Difficulty
| Age Bracket | Male | Female |
| Under 5 Years | 0 (0.0%) | 0 (0.0%) |
| 5 to 17 Years | 0 (0.0%) | 0 (0.0%) |
| 18 to 34 Years | 0 (0.0%) | 0 (0.0%) |
| 35 to 64 Years | 0 (0.0%) | 0 (0.0%) |
| 65 to 74 Years | 0 (0.0%) | 0 (0.0%) |
| 75 Years and over | 0 (0.0%) | 0 (0.0%) |
Disability Class: Cognitive Difficulty
| Age Bracket | Male | Female |
| 5 to 17 Years | 0 (0.0%) | 0 (0.0%) |
| 18 to 34 Years | 0 (0.0%) | 17 (19.3%) |
| 35 to 64 Years | 0 (0.0%) | 0 (0.0%) |
| 65 to 74 Years | 0 (0.0%) | 0 (0.0%) |
| 75 Years and over | 0 (0.0%) | 0 (0.0%) |
Disability Class: Ambulatory Difficulty

| Age Bracket | Male | Female |
| 5 to 17 Years | 0 (0.0%) | 0 (0.0%) |
| 18 to 34 Years | 0 (0.0%) | 0 (0.0%) |
| 35 to 64 Years | 0 (0.0%) | 13 (3.2%) |
| 65 to 74 Years | 0 (0.0%) | 41 (67.2%) |
| 75 Years and over | 0 (0.0%) | 0 (0.0%) |
Disability Class: Self-Care Difficulty
| Age Bracket | Male | Female |
| 5 to 17 Years | 0 (0.0%) | 0 (0.0%) |
| 18 to 34 Years | 0 (0.0%) | 0 (0.0%) |
| 35 to 64 Years | 0 (0.0%) | 0 (0.0%) |
| 65 to 74 Years | 0 (0.0%) | 41 (67.2%) |
| 75 Years and over | 0 (0.0%) | 0 (0.0%) |
Technology Access in Milford Square
Computing Device Access in Milford Square
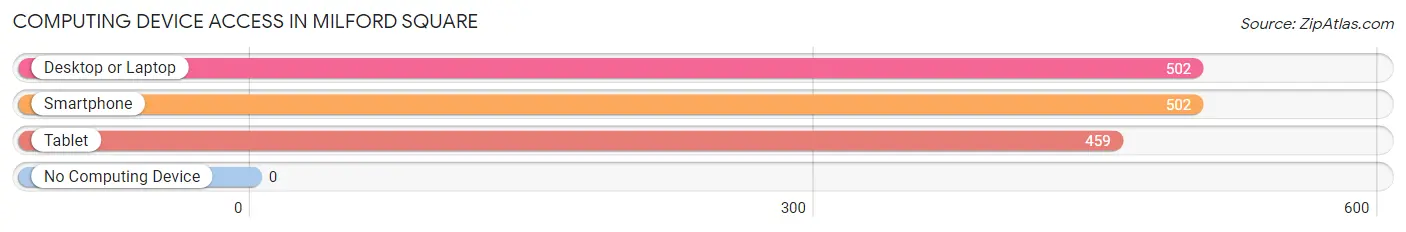
| Device Type | # Households | % Households |
| Desktop or Laptop | 502 | 100.0% |
| Smartphone | 502 | 100.0% |
| Tablet | 459 | 91.4% |
| No Computing Device | 0 | 0.0% |
| Total | 502 | 100.0% |
Internet Access in Milford Square
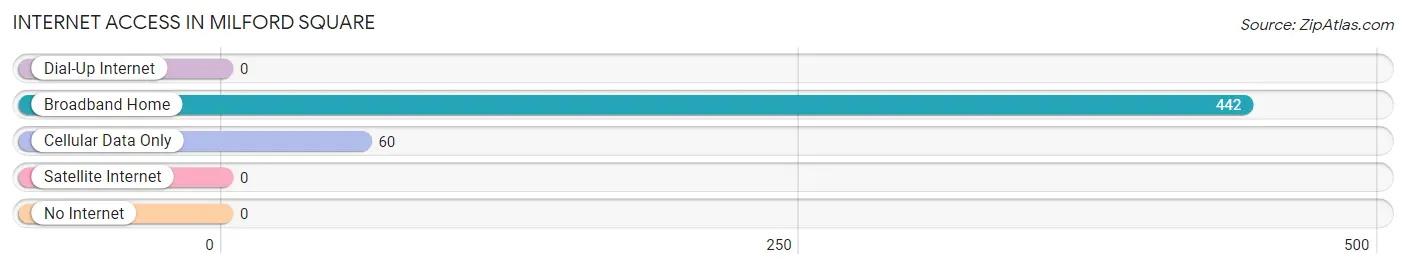
| Internet Type | # Households | % Households |
| Dial-Up Internet | 0 | 0.0% |
| Broadband Home | 442 | 88.0% |
| Cellular Data Only | 60 | 11.9% |
| Satellite Internet | 0 | 0.0% |
| No Internet | 0 | 0.0% |
| Total | 502 | 100.0% |
Milford Square Summary
Milford Square is a small unincorporated community located in Bucks County, Pennsylvania. It is situated in the northern part of the county, approximately 20 miles north of Philadelphia. The community is bordered by the townships of Richland, Haycock, and Bedminster. The population of Milford Square was estimated to be 1,845 in the 2010 census.
History
Milford Square was first settled in the late 1700s by German immigrants. The area was originally known as “Mifflin Square”, named after the nearby Mifflin Township. The name was changed to Milford Square in 1845, after the nearby Milford Township. The community was primarily an agricultural area, with many of the residents working in the nearby farms and orchards.
In the late 1800s, the area began to develop into a small village. The first post office was established in 1887, and the first school was built in 1895. The village also had a general store, a blacksmith shop, and a few other small businesses.
Geography
Milford Square is located in the northern part of Bucks County, Pennsylvania. It is situated in the Delaware Valley, approximately 20 miles north of Philadelphia. The community is bordered by the townships of Richland, Haycock, and Bedminster. The terrain is mostly flat, with some rolling hills in the area. The climate is humid continental, with hot summers and cold winters.
Economy
The economy of Milford Square is primarily based on agriculture and tourism. The area is home to several farms and orchards, which produce a variety of fruits and vegetables. The community also has several small businesses, including a general store, a blacksmith shop, and a few other small businesses.
Demographics
As of the 2010 census, the population of Milford Square was estimated to be 1,845. The racial makeup of the community was 94.3% White, 2.2% African American, 0.7% Asian, and 2.8% from other races. The median household income was $50,977, and the median family income was $60,977. The per capita income was $25,977.
Conclusion
Milford Square is a small unincorporated community located in Bucks County, Pennsylvania. It is situated in the northern part of the county, approximately 20 miles north of Philadelphia. The community is bordered by the townships of Richland, Haycock, and Bedminster. The population of Milford Square was estimated to be 1,845 in the 2010 census. The economy of Milford Square is primarily based on agriculture and tourism. The racial makeup of the community was 94.3% White, 2.2% African American, 0.7% Asian, and 2.8% from other races. The median household income was $50,977, and the median family income was $60,977. The per capita income was $25,977. Milford Square is a small, rural community with a rich history and a bright future.
Common Questions
What is Per Capita Income in Milford Square?
Per Capita income in Milford Square is $64,229.
What is the Median Family Income in Milford Square?
Median Family Income in Milford Square is $179,857.
What is the Median Household income in Milford Square?
Median Household Income in Milford Square is $178,607.
What is Income or Wage Gap in Milford Square?
Income or Wage Gap in Milford Square is 55.1%.
Women in Milford Square earn 44.9 cents for every dollar earned by a man.
What is Inequality or Gini Index in Milford Square?
Inequality or Gini Index in Milford Square is 0.28.
What is the Total Population of Milford Square?
Total Population of Milford Square is 1,293.
What is the Total Male Population of Milford Square?
Total Male Population of Milford Square is 596.
What is the Total Female Population of Milford Square?
Total Female Population of Milford Square is 697.
What is the Ratio of Males per 100 Females in Milford Square?
There are 85.51 Males per 100 Females in Milford Square.
What is the Ratio of Females per 100 Males in Milford Square?
There are 116.95 Females per 100 Males in Milford Square.
What is the Median Population Age in Milford Square?
Median Population Age in Milford Square is 41.3 Years.
What is the Average Family Size in Milford Square
Average Family Size in Milford Square is 2.8 People.
What is the Average Household Size in Milford Square
Average Household Size in Milford Square is 2.6 People.
How Large is the Labor Force in Milford Square?
There are 891 People in the Labor Forcein in Milford Square.
What is the Percentage of People in the Labor Force in Milford Square?
88.5% of People are in the Labor Force in Milford Square.