Aspinwall borough, PA Map & Demographics
Aspinwall borough Overview
$61,443
PER CAPITA INCOME
$155,795
AVG FAMILY INCOME
$107,738
AVG HOUSEHOLD INCOME
43.9%
WAGE / INCOME GAP [ % ]
56.1¢/ $1
WAGE / INCOME GAP [ $ ]
0.47
INEQUALITY / GINI INDEX
2,890
TOTAL POPULATION
1,262
MALE POPULATION
1,628
FEMALE POPULATION
77.52
MALES / 100 FEMALES
129.00
FEMALES / 100 MALES
35.8
MEDIAN AGE
3.1
AVG FAMILY SIZE
2.4
AVG HOUSEHOLD SIZE
1,528
LABOR FORCE [ PEOPLE ]
73.6%
PERCENT IN LABOR FORCE
3.0%
UNEMPLOYMENT RATE
Income in Aspinwall borough
Income Overview in Aspinwall borough
Per Capita Income in Aspinwall borough is $61,443, while median incomes of families and households are $155,795 and $107,738 respectively.
| Characteristic | Number | Measure |
| Per Capita Income | 2,890 | $61,443 |
| Median Family Income | 744 | $155,795 |
| Mean Family Income | 744 | $190,753 |
| Median Household Income | 1,222 | $107,738 |
| Mean Household Income | 1,222 | $143,604 |
| Income Deficit | 744 | $0 |
| Wage / Income Gap (%) | 2,890 | 43.86% |
| Wage / Income Gap ($) | 2,890 | 56.14¢ per $1 |
| Gini / Inequality Index | 2,890 | 0.47 |
Earnings by Sex in Aspinwall borough
Average Earnings in Aspinwall borough are $68,047, $85,954 for men and $48,255 for women, a difference of 43.9%.
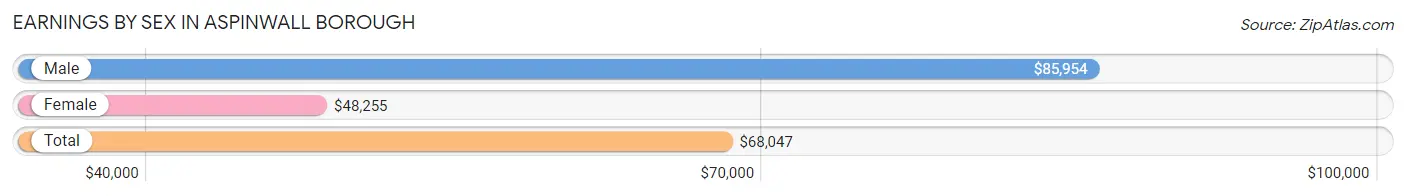
| Sex | Number | Average Earnings |
| Male | 789 (50.4%) | $85,954 |
| Female | 775 (49.5%) | $48,255 |
| Total | 1,564 (100.0%) | $68,047 |
Earnings by Sex by Income Bracket in Aspinwall borough
The most common earnings brackets in Aspinwall borough are $100,000+ for men (337 | 42.7%) and $100,000+ for women (130 | 16.8%).
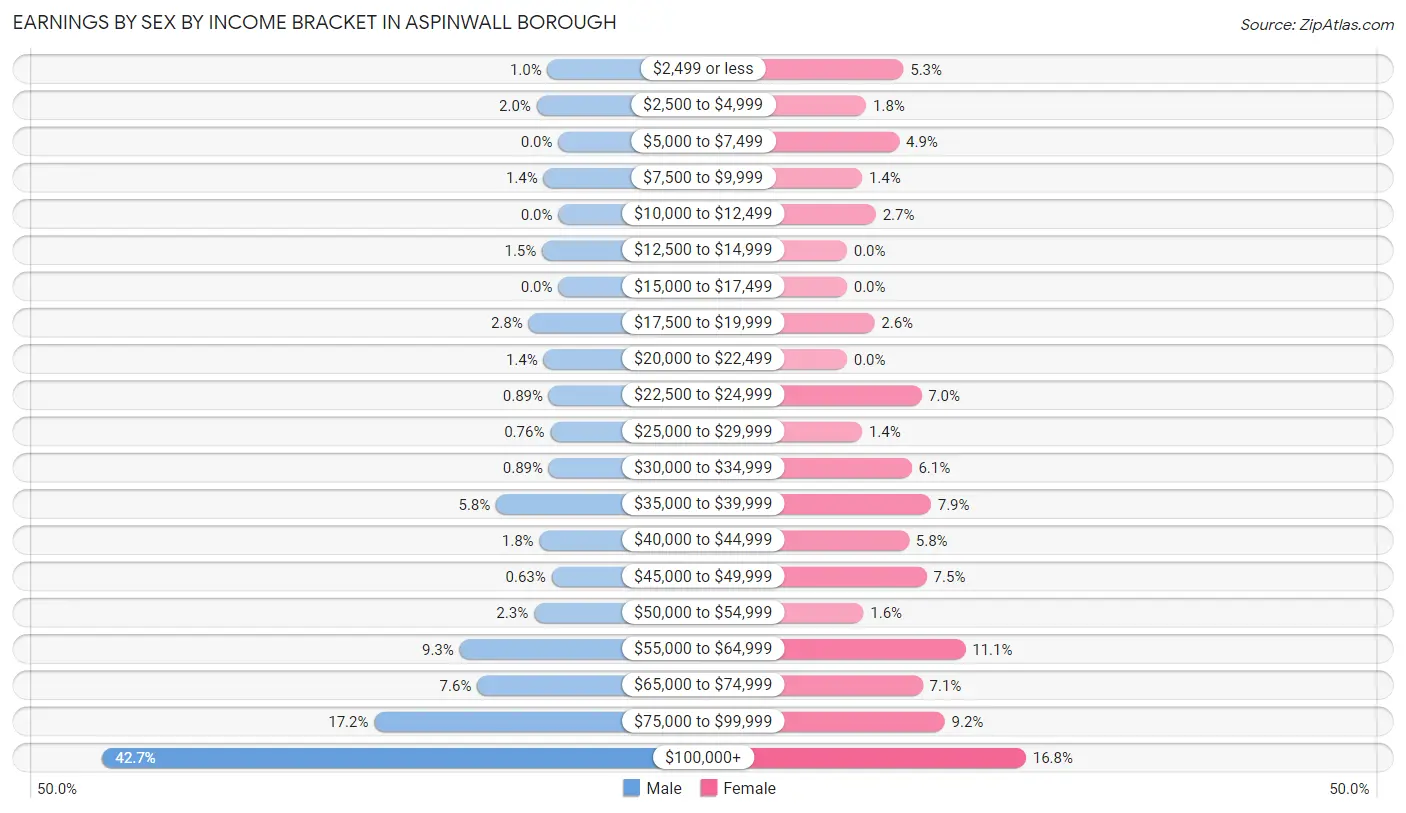
| Income | Male | Female |
| $2,499 or less | 8 (1.0%) | 41 (5.3%) |
| $2,500 to $4,999 | 16 (2.0%) | 14 (1.8%) |
| $5,000 to $7,499 | 0 (0.0%) | 38 (4.9%) |
| $7,500 to $9,999 | 11 (1.4%) | 11 (1.4%) |
| $10,000 to $12,499 | 0 (0.0%) | 21 (2.7%) |
| $12,500 to $14,999 | 12 (1.5%) | 0 (0.0%) |
| $15,000 to $17,499 | 0 (0.0%) | 0 (0.0%) |
| $17,500 to $19,999 | 22 (2.8%) | 20 (2.6%) |
| $20,000 to $22,499 | 11 (1.4%) | 0 (0.0%) |
| $22,500 to $24,999 | 7 (0.9%) | 54 (7.0%) |
| $25,000 to $29,999 | 6 (0.8%) | 11 (1.4%) |
| $30,000 to $34,999 | 7 (0.9%) | 47 (6.1%) |
| $35,000 to $39,999 | 46 (5.8%) | 61 (7.9%) |
| $40,000 to $44,999 | 14 (1.8%) | 45 (5.8%) |
| $45,000 to $49,999 | 5 (0.6%) | 58 (7.5%) |
| $50,000 to $54,999 | 18 (2.3%) | 12 (1.5%) |
| $55,000 to $64,999 | 73 (9.2%) | 86 (11.1%) |
| $65,000 to $74,999 | 60 (7.6%) | 55 (7.1%) |
| $75,000 to $99,999 | 136 (17.2%) | 71 (9.2%) |
| $100,000+ | 337 (42.7%) | 130 (16.8%) |
| Total | 789 (100.0%) | 775 (100.0%) |
Earnings by Sex by Educational Attainment in Aspinwall borough
Average earnings in Aspinwall borough are $86,480 for men and $49,505 for women, a difference of 42.8%. Men with an educational attainment of graduate degree enjoy the highest average annual earnings of $127,159, while those with bachelor's degree education earn the least with $72,128. Women with an educational attainment of graduate degree earn the most with the average annual earnings of $72,174, while those with college or associate's degree education have the smallest earnings of $35,517.
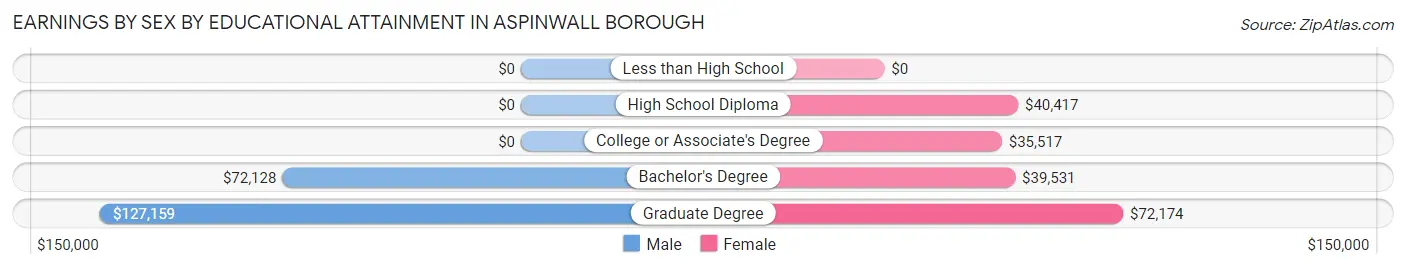
| Educational Attainment | Male Income | Female Income |
| Less than High School | - | - |
| High School Diploma | - | - |
| College or Associate's Degree | - | - |
| Bachelor's Degree | $72,128 | $39,531 |
| Graduate Degree | $127,159 | $72,174 |
| Total | $86,480 | $49,505 |
Family Income in Aspinwall borough
Family Income Brackets in Aspinwall borough
According to the Aspinwall borough family income data, there are 294 families falling into the $200,000+ income range, which is the most common income bracket and makes up 39.5% of all families.
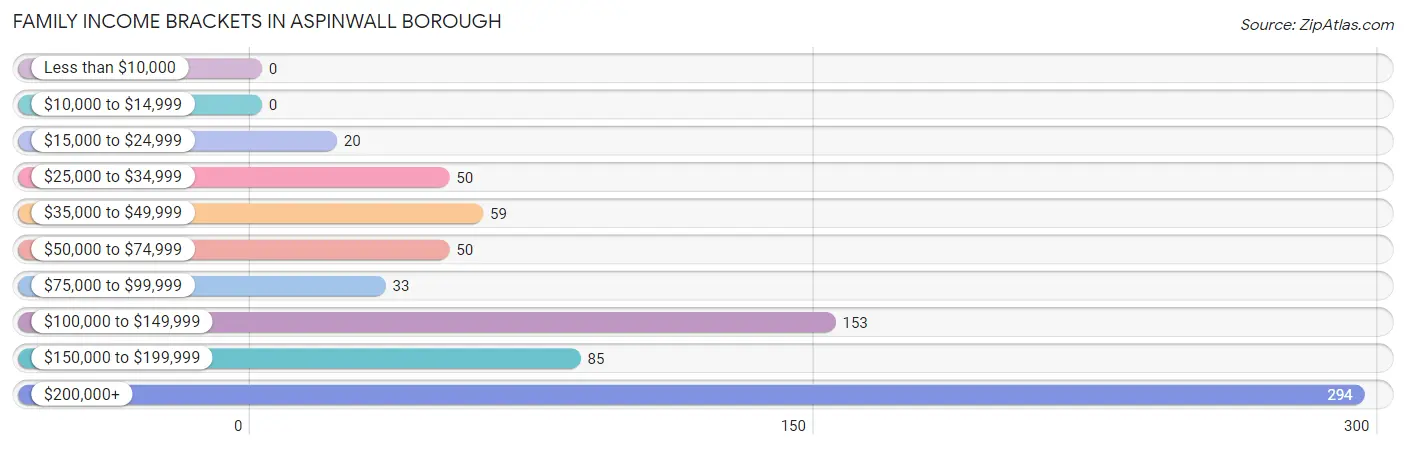
| Income Bracket | # Families | % Families |
| Less than $10,000 | 0 | 0.0% |
| $10,000 to $14,999 | 0 | 0.0% |
| $15,000 to $24,999 | 20 | 2.7% |
| $25,000 to $34,999 | 50 | 6.7% |
| $35,000 to $49,999 | 59 | 7.9% |
| $50,000 to $74,999 | 50 | 6.7% |
| $75,000 to $99,999 | 33 | 4.4% |
| $100,000 to $149,999 | 153 | 20.6% |
| $150,000 to $199,999 | 85 | 11.4% |
| $200,000+ | 294 | 39.5% |
Family Income by Famaliy Size in Aspinwall borough
5-person families (60 | 8.1%) account for the highest median family income in Aspinwall borough with $250,001 per family, while 3-person families (192 | 25.8%) have the highest median income of $68,457 per family member.
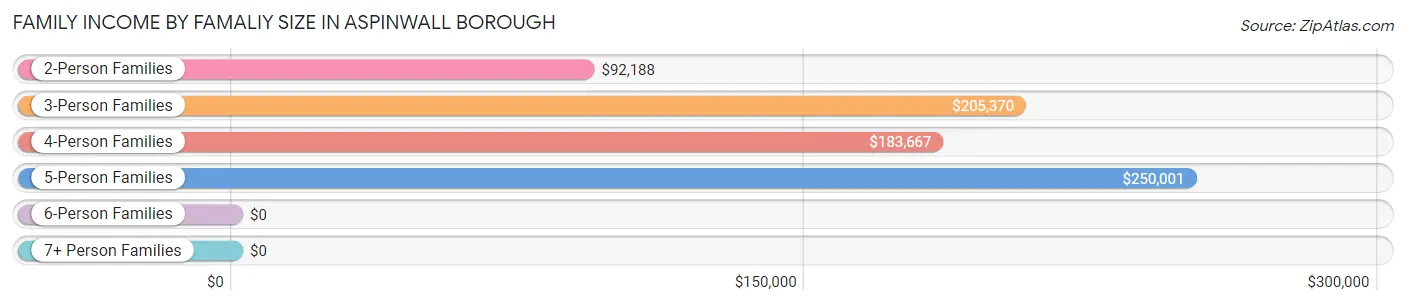
| Income Bracket | # Families | Median Income |
| 2-Person Families | 305 (41.0%) | $92,188 |
| 3-Person Families | 192 (25.8%) | $205,370 |
| 4-Person Families | 182 (24.5%) | $183,667 |
| 5-Person Families | 60 (8.1%) | $250,001 |
| 6-Person Families | 5 (0.7%) | $0 |
| 7+ Person Families | 0 (0.0%) | $0 |
| Total | 744 (100.0%) | $155,795 |
Family Income by Number of Earners in Aspinwall borough
The median family income in Aspinwall borough is $155,795, with families comprising 2 earners (298) having the highest median family income of $205,605, while families with no earners (54) have the lowest median family income of $45,313, accounting for 40.1% and 7.3% of families, respectively.
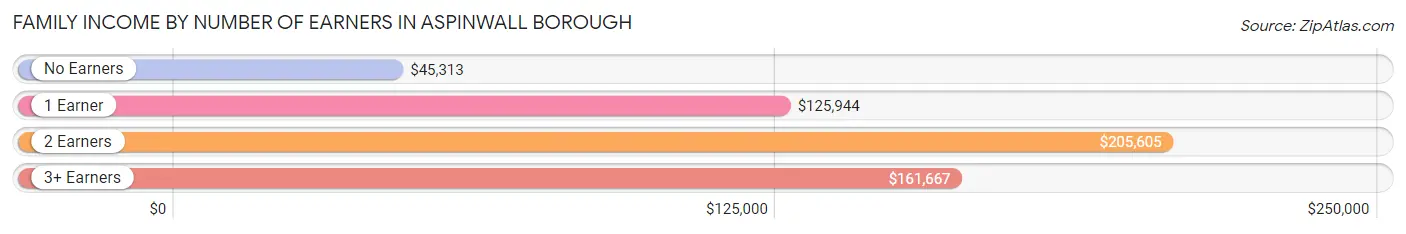
| Number of Earners | # Families | Median Income |
| No Earners | 54 (7.3%) | $45,313 |
| 1 Earner | 346 (46.5%) | $125,944 |
| 2 Earners | 298 (40.1%) | $205,605 |
| 3+ Earners | 46 (6.2%) | $161,667 |
| Total | 744 (100.0%) | $155,795 |
Household Income in Aspinwall borough
Household Income Brackets in Aspinwall borough
With 331 households falling in the category, the $200,000+ income range is the most frequent in Aspinwall borough, accounting for 27.1% of all households. In contrast, only 10 households (0.8%) fall into the $10,000 to $14,999 income bracket, making it the least populous group.
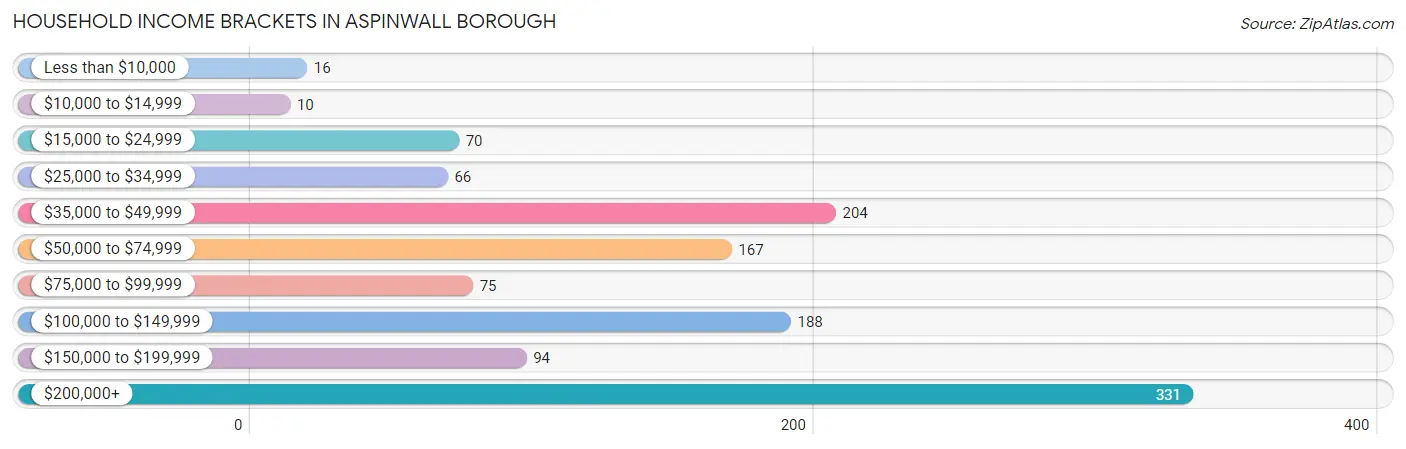
| Income Bracket | # Households | % Households |
| Less than $10,000 | 16 | 1.3% |
| $10,000 to $14,999 | 10 | 0.8% |
| $15,000 to $24,999 | 70 | 5.7% |
| $25,000 to $34,999 | 66 | 5.4% |
| $35,000 to $49,999 | 204 | 16.7% |
| $50,000 to $74,999 | 167 | 13.7% |
| $75,000 to $99,999 | 75 | 6.1% |
| $100,000 to $149,999 | 188 | 15.4% |
| $150,000 to $199,999 | 94 | 7.7% |
| $200,000+ | 331 | 27.1% |
Household Income by Householder Age in Aspinwall borough
The median household income in Aspinwall borough is $107,738, with the highest median household income of $125,909 found in the 25 to 44 years age bracket for the primary householder. A total of 532 households (43.5%) fall into this category.
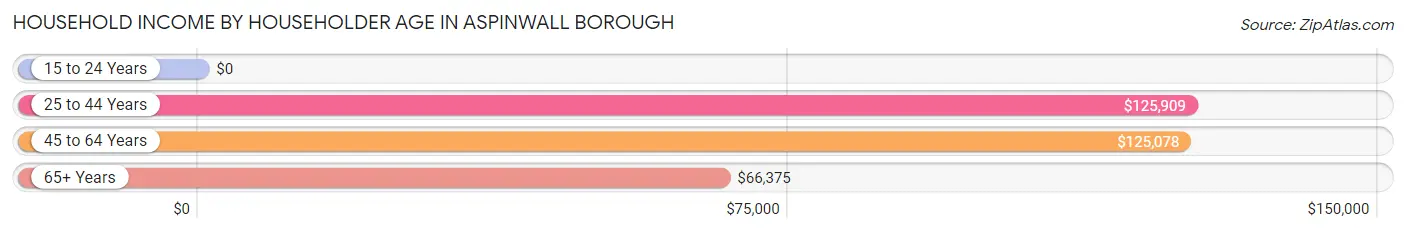
| Income Bracket | # Households | Median Income |
| 15 to 24 Years | 0 (0.0%) | $0 |
| 25 to 44 Years | 532 (43.5%) | $125,909 |
| 45 to 64 Years | 359 (29.4%) | $125,078 |
| 65+ Years | 331 (27.1%) | $66,375 |
| Total | 1,222 (100.0%) | $107,738 |
Poverty in Aspinwall borough
Income Below Poverty by Sex and Age in Aspinwall borough
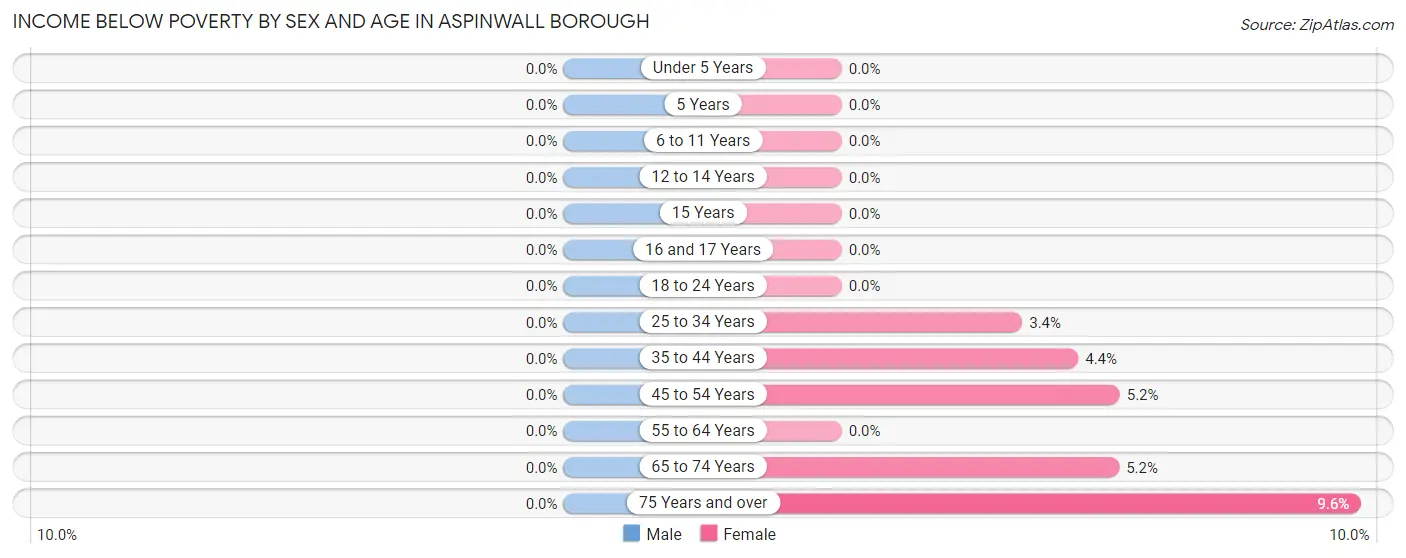
| Age Bracket | Male | Female |
| Under 5 Years | 0 (0.0%) | 0 (0.0%) |
| 5 Years | 0 (0.0%) | 0 (0.0%) |
| 6 to 11 Years | 0 (0.0%) | 0 (0.0%) |
| 12 to 14 Years | 0 (0.0%) | 0 (0.0%) |
| 15 Years | 0 (0.0%) | 0 (0.0%) |
| 16 and 17 Years | 0 (0.0%) | 0 (0.0%) |
| 18 to 24 Years | 0 (0.0%) | 0 (0.0%) |
| 25 to 34 Years | 0 (0.0%) | 8 (3.4%) |
| 35 to 44 Years | 0 (0.0%) | 14 (4.4%) |
| 45 to 54 Years | 0 (0.0%) | 8 (5.2%) |
| 55 to 64 Years | 0 (0.0%) | 0 (0.0%) |
| 65 to 74 Years | 0 (0.0%) | 10 (5.1%) |
| 75 Years and over | 0 (0.0%) | 8 (9.6%) |
| Total | 0 (0.0%) | 48 (3.0%) |
Income Above Poverty by Sex and Age in Aspinwall borough
According to the poverty statistics in Aspinwall borough, males aged under 5 years and females aged under 5 years are the age groups that are most secure financially, with 100.0% of males and 100.0% of females in these age groups living above the poverty line.
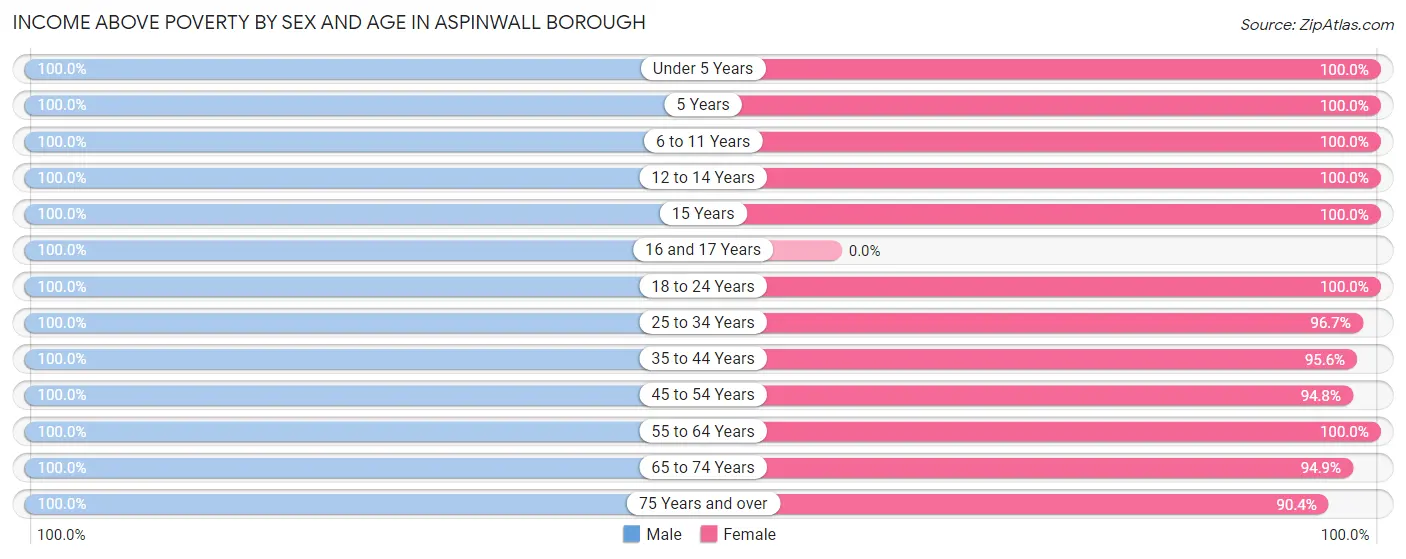
| Age Bracket | Male | Female |
| Under 5 Years | 197 (100.0%) | 131 (100.0%) |
| 5 Years | 10 (100.0%) | 64 (100.0%) |
| 6 to 11 Years | 54 (100.0%) | 145 (100.0%) |
| 12 to 14 Years | 97 (100.0%) | 84 (100.0%) |
| 15 Years | 19 (100.0%) | 6 (100.0%) |
| 16 and 17 Years | 7 (100.0%) | 0 (0.0%) |
| 18 to 24 Years | 9 (100.0%) | 48 (100.0%) |
| 25 to 34 Years | 185 (100.0%) | 231 (96.7%) |
| 35 to 44 Years | 304 (100.0%) | 305 (95.6%) |
| 45 to 54 Years | 143 (100.0%) | 147 (94.8%) |
| 55 to 64 Years | 109 (100.0%) | 153 (100.0%) |
| 65 to 74 Years | 79 (100.0%) | 184 (94.9%) |
| 75 Years and over | 49 (100.0%) | 75 (90.4%) |
| Total | 1,262 (100.0%) | 1,573 (97.0%) |
Income Below Poverty Among Married-Couple Families in Aspinwall borough
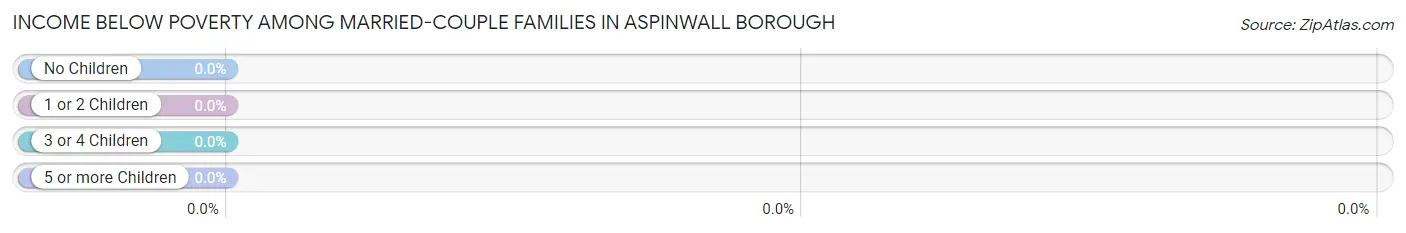
| Children | Above Poverty | Below Poverty |
| No Children | 223 (100.0%) | 0 (0.0%) |
| 1 or 2 Children | 288 (100.0%) | 0 (0.0%) |
| 3 or 4 Children | 60 (100.0%) | 0 (0.0%) |
| 5 or more Children | 0 (0.0%) | 0 (0.0%) |
| Total | 571 (100.0%) | 0 (0.0%) |
Income Below Poverty Among Single-Parent Households in Aspinwall borough
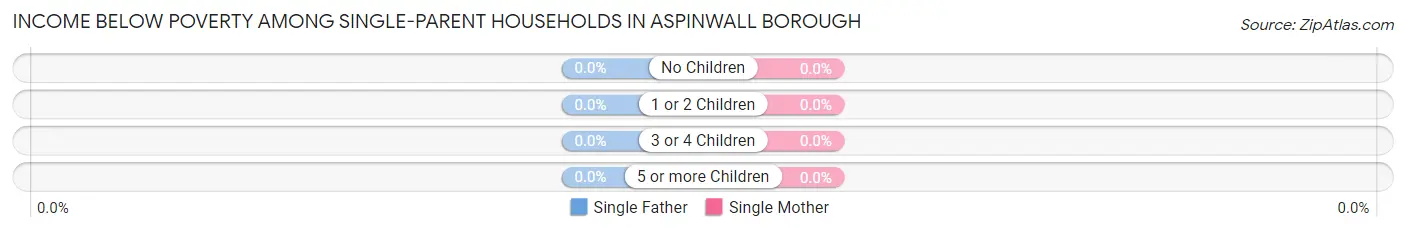
| Children | Single Father | Single Mother |
| No Children | 0 (0.0%) | 0 (0.0%) |
| 1 or 2 Children | 0 (0.0%) | 0 (0.0%) |
| 3 or 4 Children | 0 (0.0%) | 0 (0.0%) |
| 5 or more Children | 0 (0.0%) | 0 (0.0%) |
| Total | 0 (0.0%) | 0 (0.0%) |
Income Below Poverty Among Married-Couple vs Single-Parent Households in Aspinwall borough
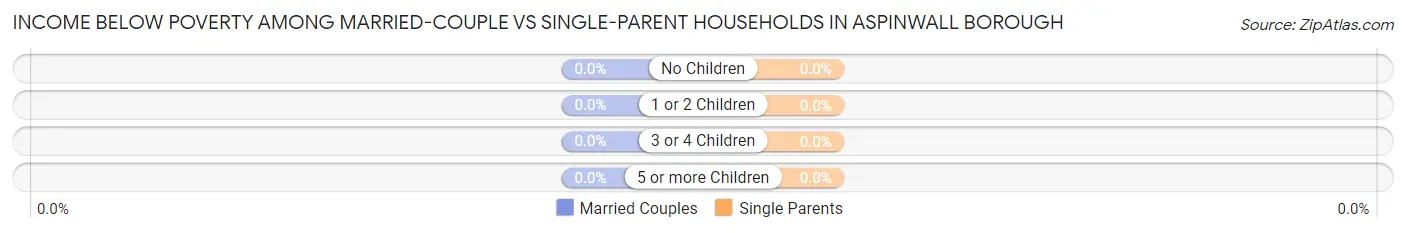
| Children | Married-Couple Families | Single-Parent Households |
| No Children | 0 (0.0%) | 0 (0.0%) |
| 1 or 2 Children | 0 (0.0%) | 0 (0.0%) |
| 3 or 4 Children | 0 (0.0%) | 0 (0.0%) |
| 5 or more Children | 0 (0.0%) | 0 (0.0%) |
| Total | 0 (0.0%) | 0 (0.0%) |
Race in Aspinwall borough
The most populous races in Aspinwall borough are White / Caucasian (2,366 | 81.9%), Asian (402 | 13.9%), and Black / African American (119 | 4.1%).
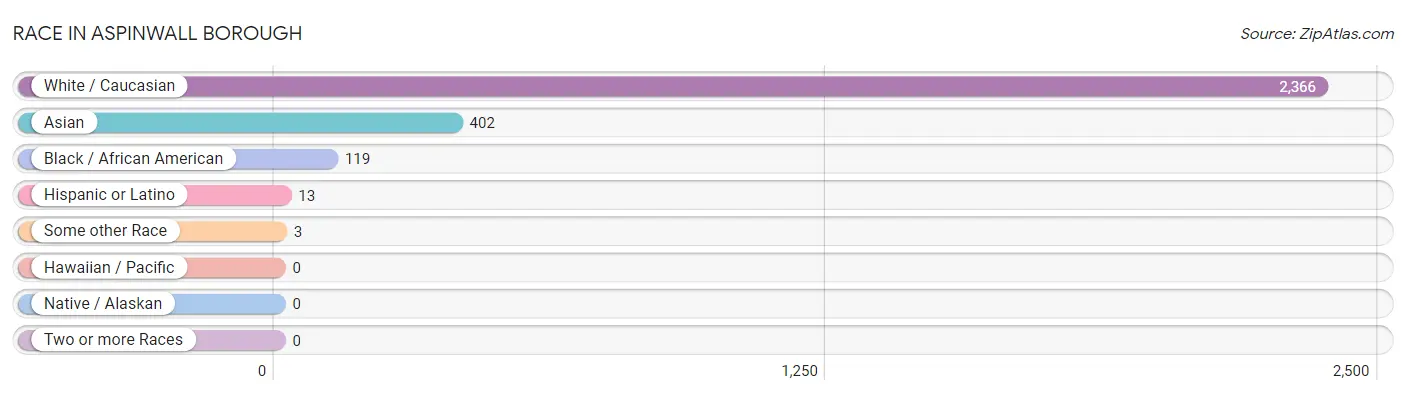
| Race | # Population | % Population |
| Asian | 402 | 13.9% |
| Black / African American | 119 | 4.1% |
| Hawaiian / Pacific | 0 | 0.0% |
| Hispanic or Latino | 13 | 0.4% |
| Native / Alaskan | 0 | 0.0% |
| White / Caucasian | 2,366 | 81.9% |
| Two or more Races | 0 | 0.0% |
| Some other Race | 3 | 0.1% |
| Total | 2,890 | 100.0% |
Ancestry in Aspinwall borough
The most populous ancestries reported in Aspinwall borough are German (617 | 21.3%), Irish (507 | 17.5%), English (460 | 15.9%), Italian (392 | 13.6%), and Indian (Asian) (194 | 6.7%), together accounting for 75.1% of all Aspinwall borough residents.
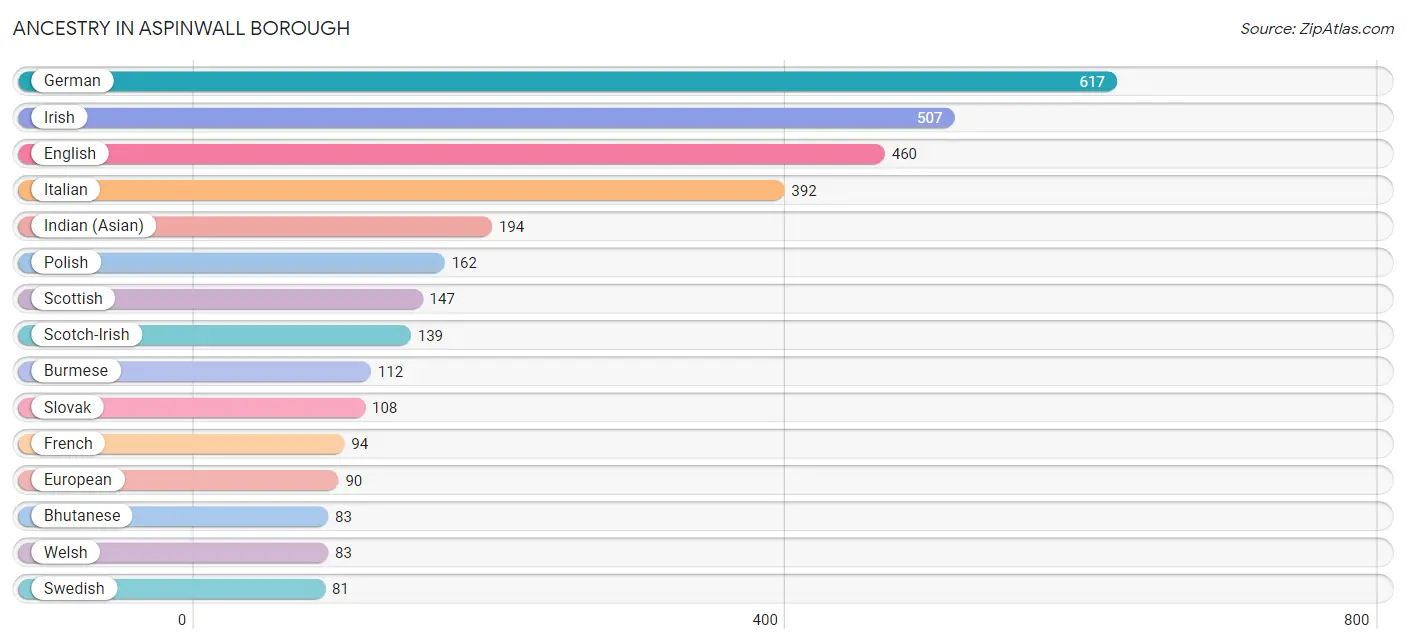
| Ancestry | # Population | % Population |
| American | 12 | 0.4% |
| Arab | 25 | 0.9% |
| Austrian | 17 | 0.6% |
| Belgian | 11 | 0.4% |
| Bhutanese | 83 | 2.9% |
| British | 11 | 0.4% |
| Burmese | 112 | 3.9% |
| Canadian | 34 | 1.2% |
| Colombian | 3 | 0.1% |
| Croatian | 10 | 0.4% |
| Dutch | 10 | 0.4% |
| Eastern European | 63 | 2.2% |
| English | 460 | 15.9% |
| European | 90 | 3.1% |
| Filipino | 6 | 0.2% |
| Finnish | 40 | 1.4% |
| French | 94 | 3.3% |
| German | 617 | 21.3% |
| Greek | 7 | 0.2% |
| Hungarian | 14 | 0.5% |
| Indian (Asian) | 194 | 6.7% |
| Irish | 507 | 17.5% |
| Italian | 392 | 13.6% |
| Jamaican | 23 | 0.8% |
| Latvian | 12 | 0.4% |
| Lithuanian | 8 | 0.3% |
| Moroccan | 7 | 0.2% |
| Northern European | 30 | 1.0% |
| Polish | 162 | 5.6% |
| Russian | 59 | 2.0% |
| Scotch-Irish | 139 | 4.8% |
| Scottish | 147 | 5.1% |
| Slovak | 108 | 3.7% |
| South American | 3 | 0.1% |
| Spaniard | 10 | 0.4% |
| Swedish | 81 | 2.8% |
| Swiss | 9 | 0.3% |
| Thai | 7 | 0.2% |
| Ukrainian | 25 | 0.9% |
| Welsh | 83 | 2.9% | View All 40 Rows |
Immigrants in Aspinwall borough
The most numerous immigrant groups reported in Aspinwall borough came from Asia (368 | 12.7%), Eastern Asia (343 | 11.9%), China (151 | 5.2%), Taiwan (139 | 4.8%), and Korea (98 | 3.4%), together accounting for 38.0% of all Aspinwall borough residents.
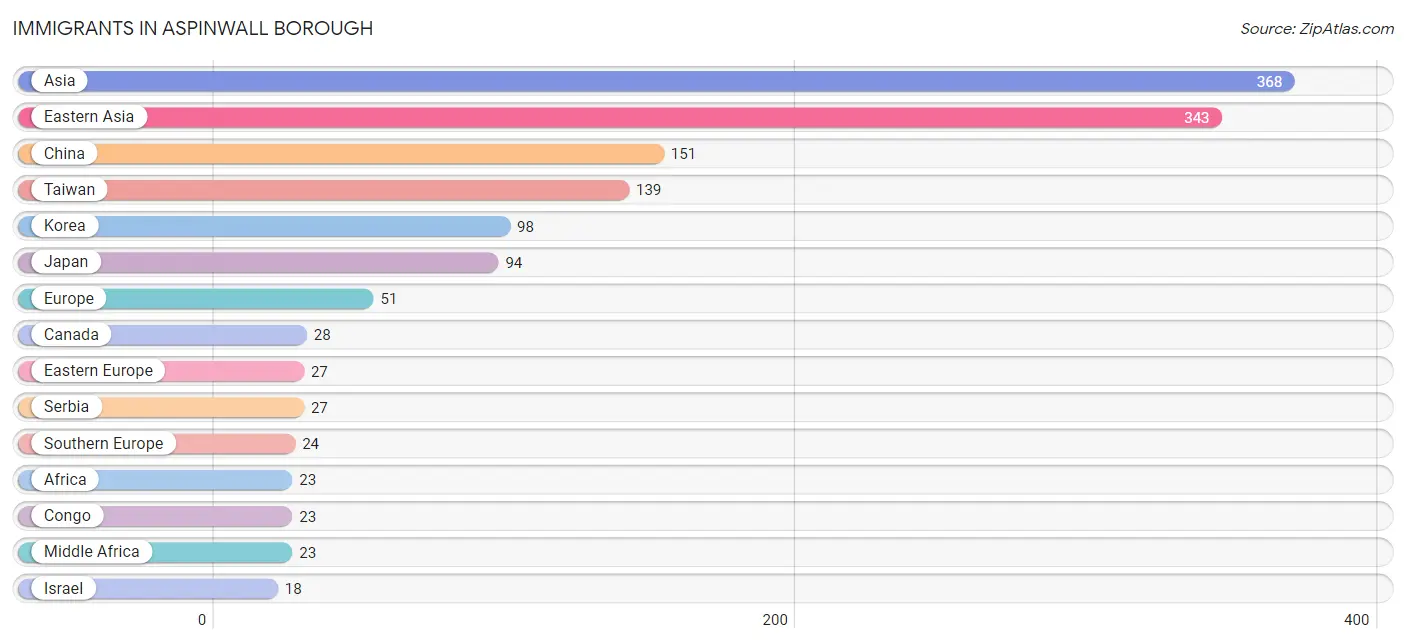
| Immigration Origin | # Population | % Population |
| Africa | 23 | 0.8% |
| Asia | 368 | 12.7% |
| Bangladesh | 7 | 0.2% |
| Canada | 28 | 1.0% |
| China | 151 | 5.2% |
| Colombia | 3 | 0.1% |
| Congo | 23 | 0.8% |
| Eastern Asia | 343 | 11.9% |
| Eastern Europe | 27 | 0.9% |
| Europe | 51 | 1.8% |
| Israel | 18 | 0.6% |
| Italy | 14 | 0.5% |
| Japan | 94 | 3.3% |
| Korea | 98 | 3.4% |
| Latin America | 3 | 0.1% |
| Middle Africa | 23 | 0.8% |
| Serbia | 27 | 0.9% |
| South America | 3 | 0.1% |
| South Central Asia | 7 | 0.2% |
| Southern Europe | 24 | 0.8% |
| Spain | 10 | 0.4% |
| Taiwan | 139 | 4.8% |
| Western Asia | 18 | 0.6% | View All 23 Rows |
Sex and Age in Aspinwall borough
Sex and Age in Aspinwall borough
The most populous age groups in Aspinwall borough are 35 to 39 Years (238 | 18.9%) for men and 35 to 39 Years (213 | 13.1%) for women.
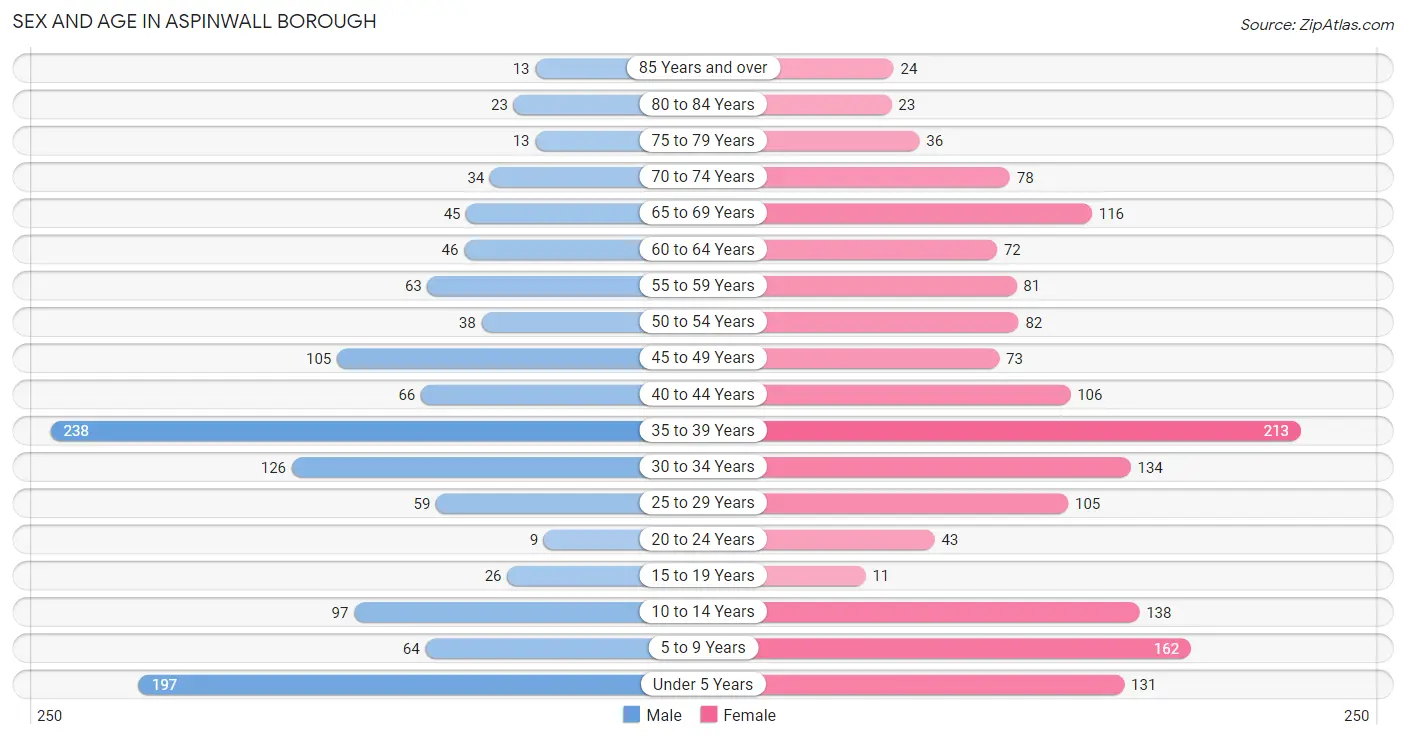
| Age Bracket | Male | Female |
| Under 5 Years | 197 (15.6%) | 131 (8.1%) |
| 5 to 9 Years | 64 (5.1%) | 162 (10.0%) |
| 10 to 14 Years | 97 (7.7%) | 138 (8.5%) |
| 15 to 19 Years | 26 (2.1%) | 11 (0.7%) |
| 20 to 24 Years | 9 (0.7%) | 43 (2.6%) |
| 25 to 29 Years | 59 (4.7%) | 105 (6.5%) |
| 30 to 34 Years | 126 (10.0%) | 134 (8.2%) |
| 35 to 39 Years | 238 (18.9%) | 213 (13.1%) |
| 40 to 44 Years | 66 (5.2%) | 106 (6.5%) |
| 45 to 49 Years | 105 (8.3%) | 73 (4.5%) |
| 50 to 54 Years | 38 (3.0%) | 82 (5.0%) |
| 55 to 59 Years | 63 (5.0%) | 81 (5.0%) |
| 60 to 64 Years | 46 (3.6%) | 72 (4.4%) |
| 65 to 69 Years | 45 (3.6%) | 116 (7.1%) |
| 70 to 74 Years | 34 (2.7%) | 78 (4.8%) |
| 75 to 79 Years | 13 (1.0%) | 36 (2.2%) |
| 80 to 84 Years | 23 (1.8%) | 23 (1.4%) |
| 85 Years and over | 13 (1.0%) | 24 (1.5%) |
| Total | 1,262 (100.0%) | 1,628 (100.0%) |
Families and Households in Aspinwall borough
Median Family Size in Aspinwall borough
The median family size in Aspinwall borough is 3.09 persons per family, with married-couple families (571 | 76.7%) accounting for the largest median family size of 3.28 persons per family. On the other hand, single female/mother families (107 | 14.4%) represent the smallest median family size with 2.32 persons per family.
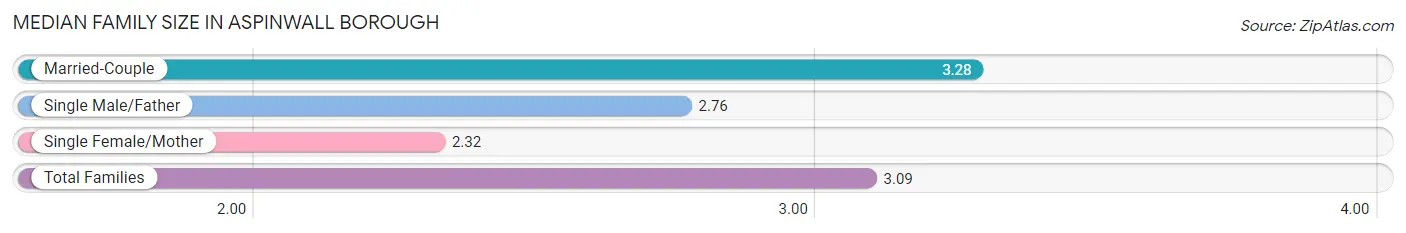
| Family Type | # Families | Family Size |
| Married-Couple | 571 (76.7%) | 3.28 |
| Single Male/Father | 66 (8.9%) | 2.76 |
| Single Female/Mother | 107 (14.4%) | 2.32 |
| Total Families | 744 (100.0%) | 3.09 |
Median Household Size in Aspinwall borough
The median household size in Aspinwall borough is 2.36 persons per household, with married-couple households (571 | 46.7%) accounting for the largest median household size of 3.28 persons per household. non-family households (478 | 39.1%) represent the smallest median household size with 1.17 persons per household.
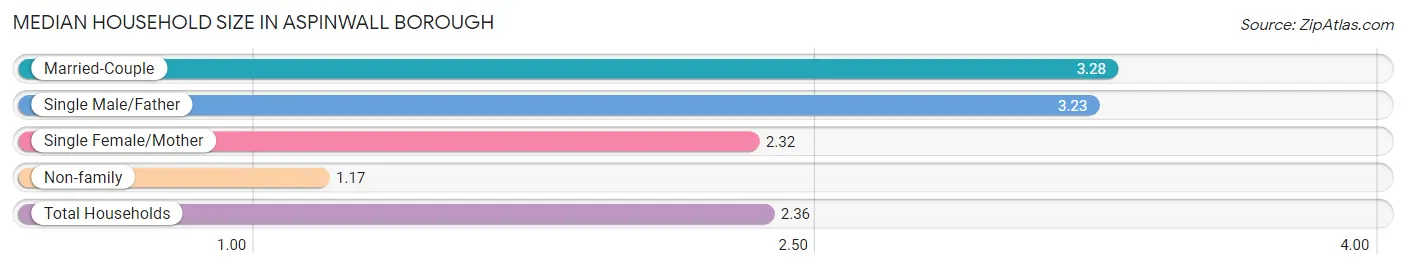
| Household Type | # Households | Household Size |
| Married-Couple | 571 (46.7%) | 3.28 |
| Single Male/Father | 66 (5.4%) | 3.23 |
| Single Female/Mother | 107 (8.8%) | 2.32 |
| Non-family | 478 (39.1%) | 1.17 |
| Total Households | 1,222 (100.0%) | 2.36 |
Household Size by Marriage Status in Aspinwall borough
Out of a total of 1,222 households in Aspinwall borough, 744 (60.9%) are family households, while 478 (39.1%) are nonfamily households. The most numerous type of family households are 2-person households, comprising 299, and the most common type of nonfamily households are 1-person households, comprising 399.
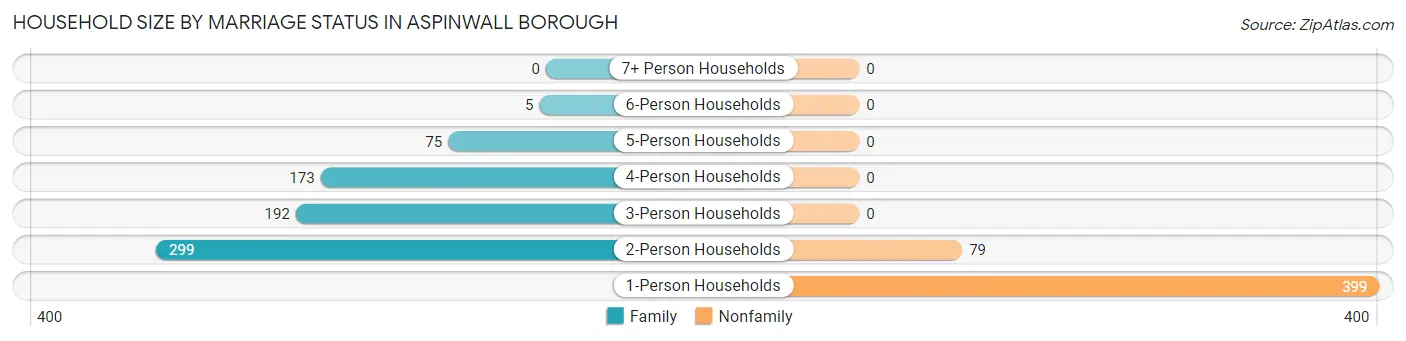
| Household Size | Family Households | Nonfamily Households |
| 1-Person Households | - | 399 (32.7%) |
| 2-Person Households | 299 (24.5%) | 79 (6.5%) |
| 3-Person Households | 192 (15.7%) | 0 (0.0%) |
| 4-Person Households | 173 (14.2%) | 0 (0.0%) |
| 5-Person Households | 75 (6.1%) | 0 (0.0%) |
| 6-Person Households | 5 (0.4%) | 0 (0.0%) |
| 7+ Person Households | 0 (0.0%) | 0 (0.0%) |
| Total | 744 (60.9%) | 478 (39.1%) |
Female Fertility in Aspinwall borough
Fertility by Age in Aspinwall borough
Average fertility rate in Aspinwall borough is 142.0 births per 1,000 women. Women in the age bracket of 20 to 34 years have the highest fertility rate with 145.0 births per 1,000 women. Women in the age bracket of 35 to 50 years acount for 57.7% of all women with births.
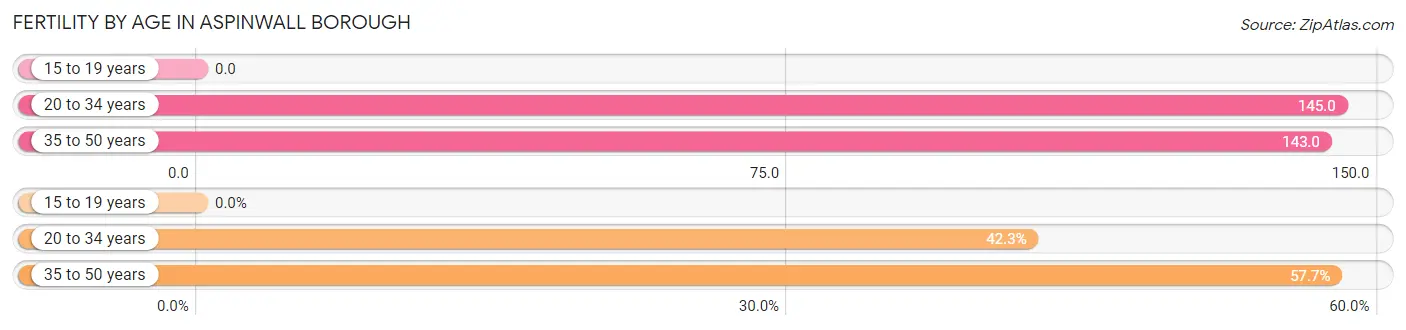
| Age Bracket | Women with Births | Births / 1,000 Women |
| 15 to 19 years | 0 (0.0%) | 0.0 |
| 20 to 34 years | 41 (42.3%) | 145.0 |
| 35 to 50 years | 56 (57.7%) | 143.0 |
| Total | 97 (100.0%) | 142.0 |
Fertility by Age by Marriage Status in Aspinwall borough
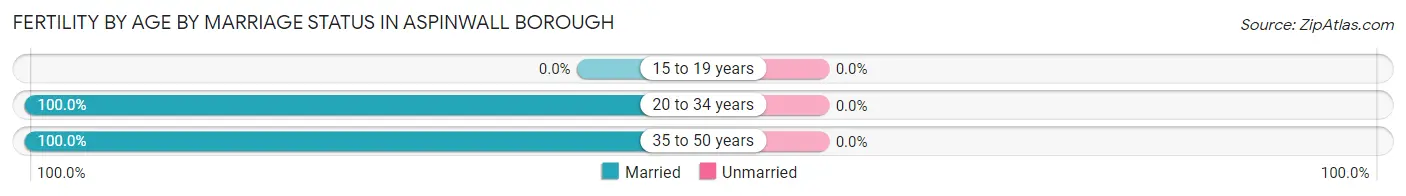
| Age Bracket | Married | Unmarried |
| 15 to 19 years | 0 (0.0%) | 0 (0.0%) |
| 20 to 34 years | 41 (100.0%) | 0 (0.0%) |
| 35 to 50 years | 56 (100.0%) | 0 (0.0%) |
| Total | 97 (100.0%) | 0 (0.0%) |
Fertility by Education in Aspinwall borough
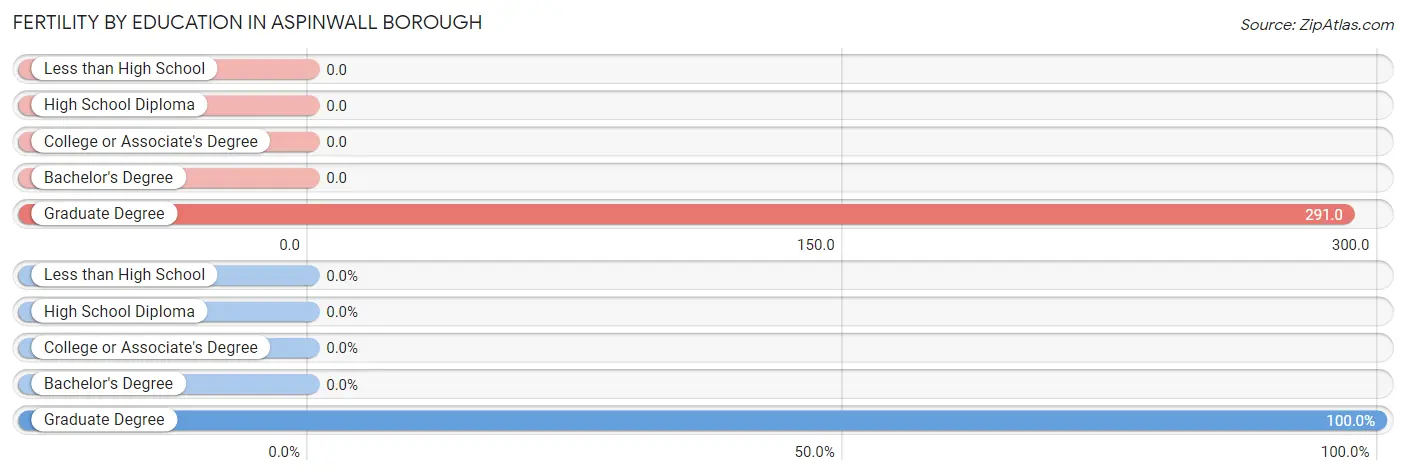
| Educational Attainment | Women with Births | Births / 1,000 Women |
| Less than High School | 0 (0.0%) | 0.0 |
| High School Diploma | 0 (0.0%) | 0.0 |
| College or Associate's Degree | 0 (0.0%) | 0.0 |
| Bachelor's Degree | 0 (0.0%) | 0.0 |
| Graduate Degree | 97 (100.0%) | 291.0 |
| Total | 97 (100.0%) | 142.0 |
Fertility by Education by Marriage Status in Aspinwall borough
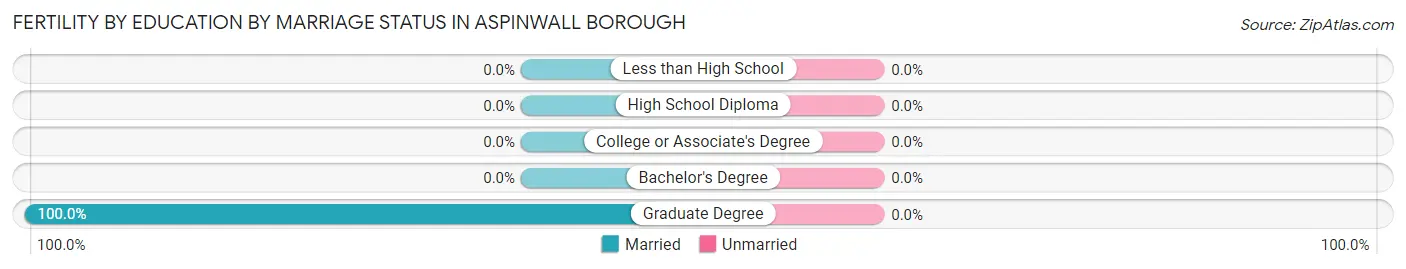
| Educational Attainment | Married | Unmarried |
| Less than High School | 0 (0.0%) | 0 (0.0%) |
| High School Diploma | 0 (0.0%) | 0 (0.0%) |
| College or Associate's Degree | 0 (0.0%) | 0 (0.0%) |
| Bachelor's Degree | 0 (0.0%) | 0 (0.0%) |
| Graduate Degree | 97 (100.0%) | 0 (0.0%) |
| Total | 97 (100.0%) | 0 (0.0%) |
Employment Characteristics in Aspinwall borough
Employment by Class of Employer in Aspinwall borough
Among the 1,456 employed individuals in Aspinwall borough, private company employees (967 | 66.4%), not-for-profit organizations (236 | 16.2%), and federal government employees (91 | 6.2%) make up the most common classes of employment.
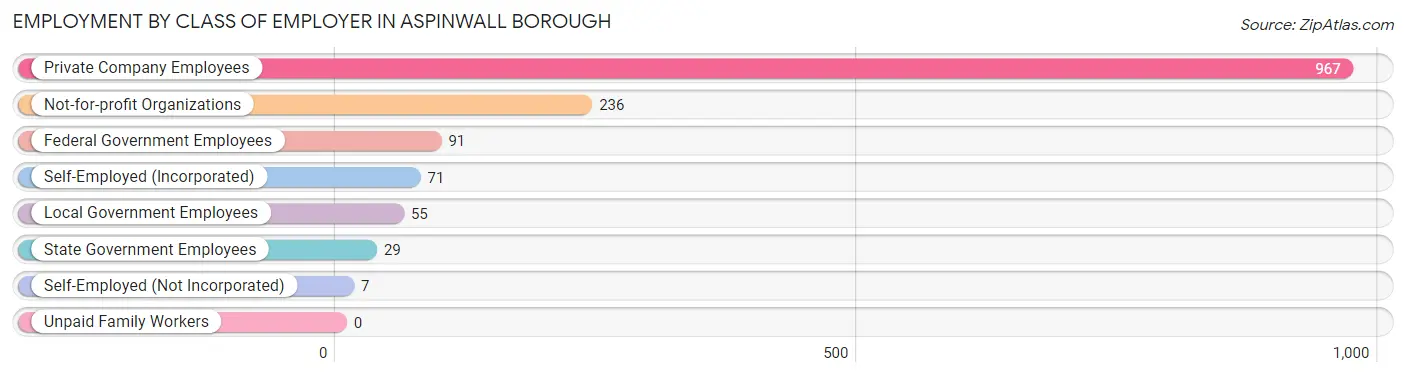
| Employer Class | # Employees | % Employees |
| Private Company Employees | 967 | 66.4% |
| Self-Employed (Incorporated) | 71 | 4.9% |
| Self-Employed (Not Incorporated) | 7 | 0.5% |
| Not-for-profit Organizations | 236 | 16.2% |
| Local Government Employees | 55 | 3.8% |
| State Government Employees | 29 | 2.0% |
| Federal Government Employees | 91 | 6.2% |
| Unpaid Family Workers | 0 | 0.0% |
| Total | 1,456 | 100.0% |
Employment Status by Age in Aspinwall borough
According to the labor force statistics for Aspinwall borough, out of the total population over 16 years of age (2,076), 73.6% or 1,528 individuals are in the labor force, with 3.0% or 46 of them unemployed. The age group with the highest labor force participation rate is 20 to 24 years, with 100.0% or 52 individuals in the labor force. Within the labor force, the 20 to 24 years age range has the highest percentage of unemployed individuals, with 26.9% or 14 of them being unemployed.
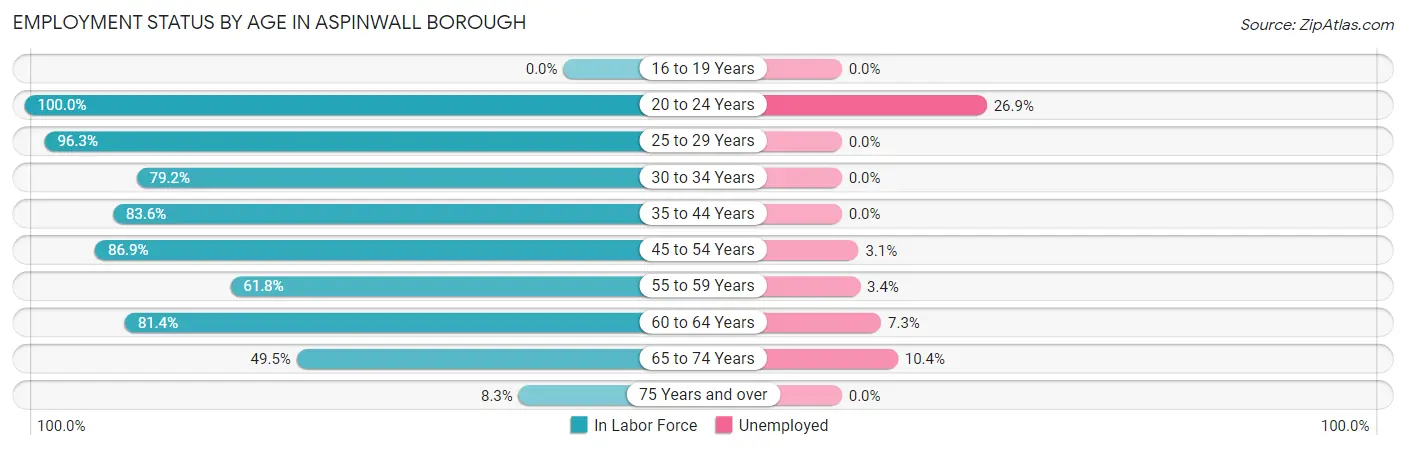
| Age Bracket | In Labor Force | Unemployed |
| 16 to 19 Years | 0 (0.0%) | 0 (0.0%) |
| 20 to 24 Years | 52 (100.0%) | 14 (26.9%) |
| 25 to 29 Years | 158 (96.3%) | 0 (0.0%) |
| 30 to 34 Years | 206 (79.2%) | 0 (0.0%) |
| 35 to 44 Years | 521 (83.6%) | 0 (0.0%) |
| 45 to 54 Years | 259 (86.9%) | 8 (3.1%) |
| 55 to 59 Years | 89 (61.8%) | 3 (3.4%) |
| 60 to 64 Years | 96 (81.4%) | 7 (7.3%) |
| 65 to 74 Years | 135 (49.5%) | 14 (10.4%) |
| 75 Years and over | 11 (8.3%) | 0 (0.0%) |
| Total | 1,528 (73.6%) | 46 (3.0%) |
Employment Status by Educational Attainment in Aspinwall borough
According to labor force statistics for Aspinwall borough, 82.7% of individuals (1,329) out of the total population between 25 and 64 years of age (1,607) are in the labor force, with 1.4% or 19 of them being unemployed. The group with the highest labor force participation rate are those with the educational attainment of less than high school, with 100.0% or 7 individuals in the labor force. Within the labor force, individuals with less than high school education have the highest percentage of unemployment, with 100.0% or 7 of them being unemployed.
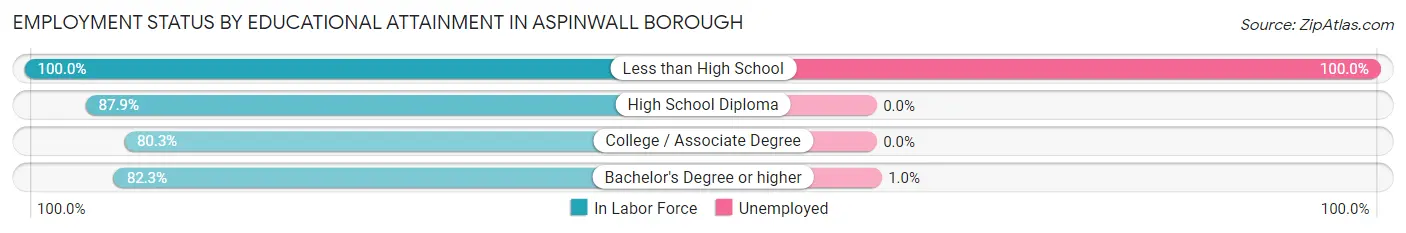
| Educational Attainment | In Labor Force | Unemployed |
| Less than High School | 7 (100.0%) | 7 (100.0%) |
| High School Diploma | 131 (87.9%) | 0 (0.0%) |
| College / Associate Degree | 118 (80.3%) | 0 (0.0%) |
| Bachelor's Degree or higher | 1,073 (82.3%) | 13 (1.0%) |
| Total | 1,329 (82.7%) | 22 (1.4%) |
Employment Occupations by Sex in Aspinwall borough
Management, Business, Science and Arts Occupations
The most common Management, Business, Science and Arts occupations in Aspinwall borough are Management (276 | 18.6%), Community & Social Service (264 | 17.8%), Computers, Engineering & Science (180 | 12.1%), Health Diagnosing & Treating (170 | 11.5%), and Health Technologists (150 | 10.1%).
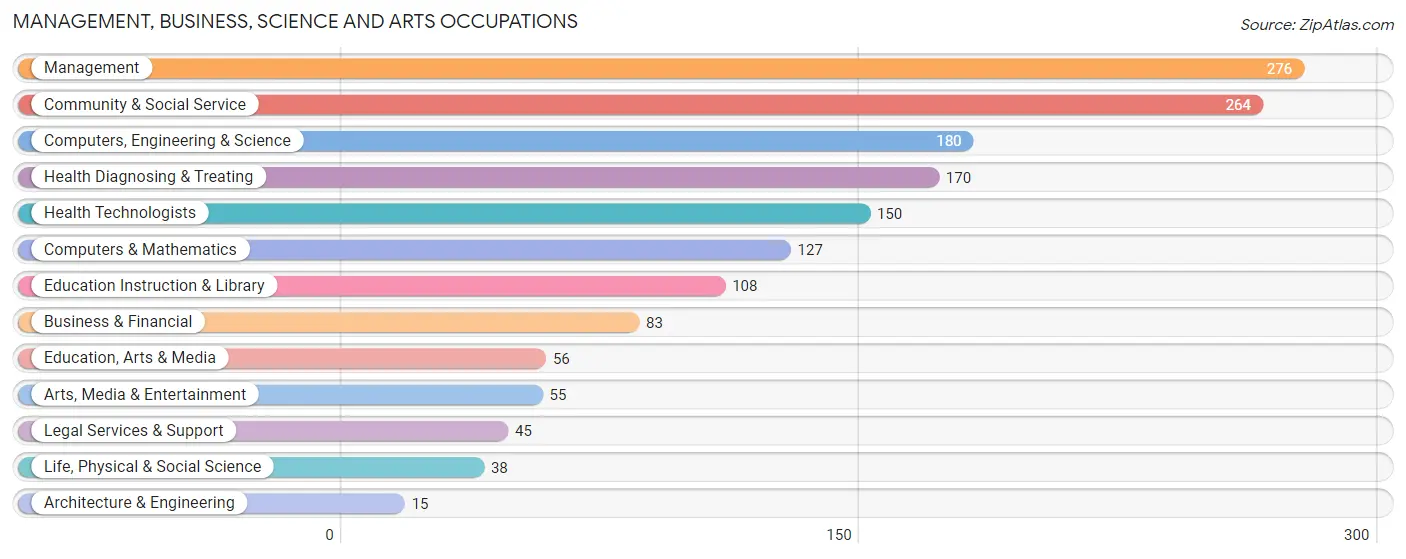
Management, Business, Science and Arts Occupations by Sex
Within the Management, Business, Science and Arts occupations in Aspinwall borough, the most male-oriented occupations are Computers & Mathematics (91.3%), Management (85.9%), and Computers, Engineering & Science (73.3%), while the most female-oriented occupations are Education, Arts & Media (100.0%), Life, Physical & Social Science (73.7%), and Health Diagnosing & Treating (69.4%).
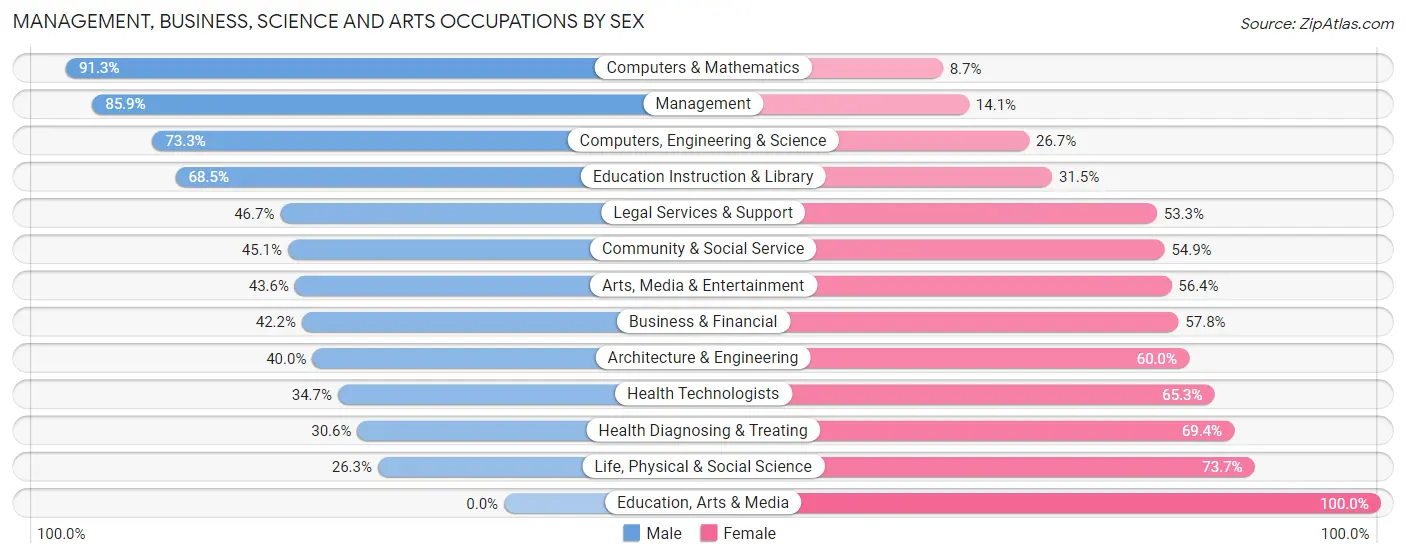
| Occupation | Male | Female |
| Management | 237 (85.9%) | 39 (14.1%) |
| Business & Financial | 35 (42.2%) | 48 (57.8%) |
| Computers, Engineering & Science | 132 (73.3%) | 48 (26.7%) |
| Computers & Mathematics | 116 (91.3%) | 11 (8.7%) |
| Architecture & Engineering | 6 (40.0%) | 9 (60.0%) |
| Life, Physical & Social Science | 10 (26.3%) | 28 (73.7%) |
| Community & Social Service | 119 (45.1%) | 145 (54.9%) |
| Education, Arts & Media | 0 (0.0%) | 56 (100.0%) |
| Legal Services & Support | 21 (46.7%) | 24 (53.3%) |
| Education Instruction & Library | 74 (68.5%) | 34 (31.5%) |
| Arts, Media & Entertainment | 24 (43.6%) | 31 (56.4%) |
| Health Diagnosing & Treating | 52 (30.6%) | 118 (69.4%) |
| Health Technologists | 52 (34.7%) | 98 (65.3%) |
| Total (Category) | 575 (59.1%) | 398 (40.9%) |
| Total (Overall) | 767 (51.8%) | 714 (48.2%) |
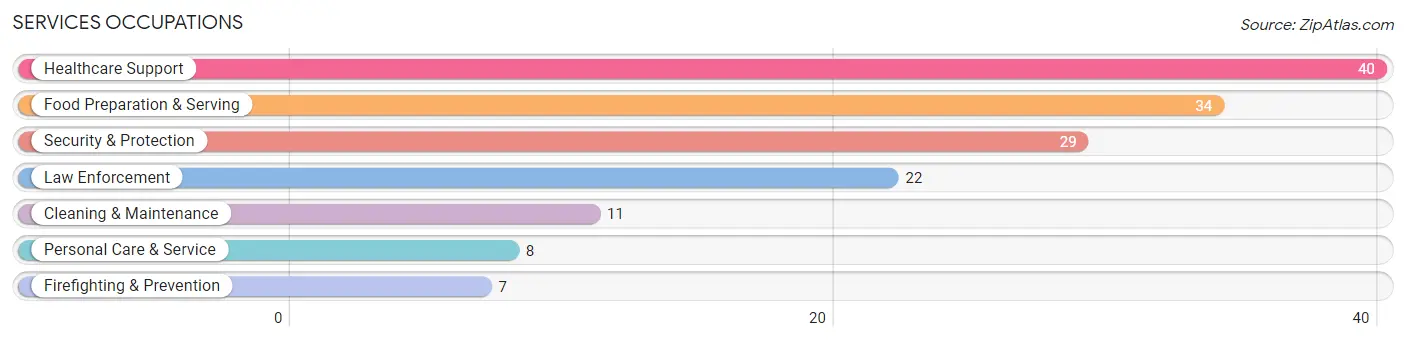
Services Occupations
The most common Services occupations in Aspinwall borough are Healthcare Support (40 | 2.7%), Food Preparation & Serving (34 | 2.3%), Security & Protection (29 | 2.0%), Law Enforcement (22 | 1.5%), and Cleaning & Maintenance (11 | 0.7%).
Services Occupations by Sex
Within the Services occupations in Aspinwall borough, the most male-oriented occupations are Security & Protection (100.0%), Firefighting & Prevention (100.0%), and Law Enforcement (100.0%), while the most female-oriented occupations are Cleaning & Maintenance (100.0%), Food Preparation & Serving (79.4%), and Healthcare Support (70.0%).
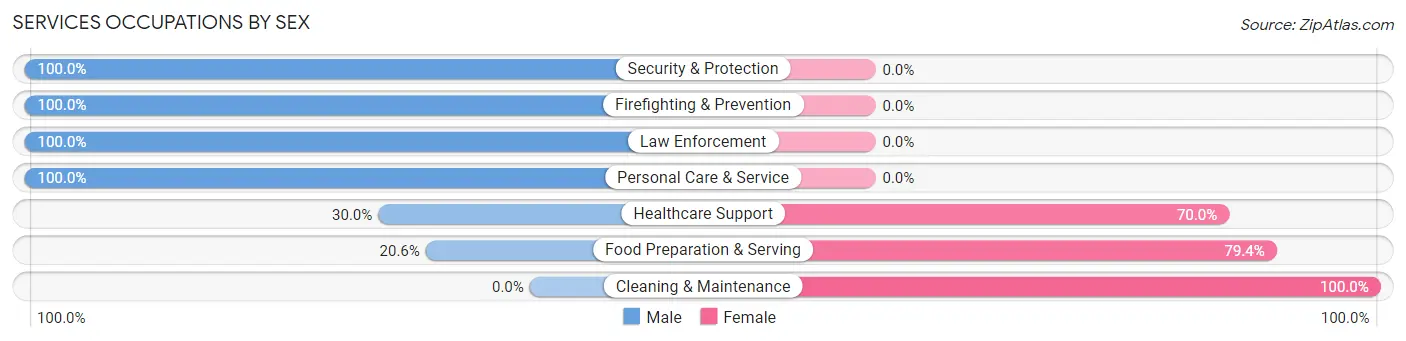
| Occupation | Male | Female |
| Healthcare Support | 12 (30.0%) | 28 (70.0%) |
| Security & Protection | 29 (100.0%) | 0 (0.0%) |
| Firefighting & Prevention | 7 (100.0%) | 0 (0.0%) |
| Law Enforcement | 22 (100.0%) | 0 (0.0%) |
| Food Preparation & Serving | 7 (20.6%) | 27 (79.4%) |
| Cleaning & Maintenance | 0 (0.0%) | 11 (100.0%) |
| Personal Care & Service | 8 (100.0%) | 0 (0.0%) |
| Total (Category) | 56 (45.9%) | 66 (54.1%) |
| Total (Overall) | 767 (51.8%) | 714 (48.2%) |
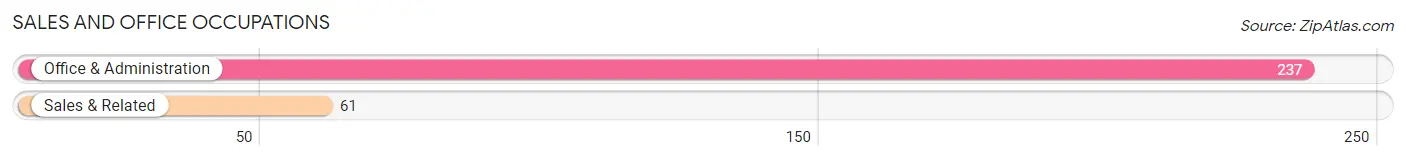
Sales and Office Occupations
The most common Sales and Office occupations in Aspinwall borough are Office & Administration (237 | 16.0%), and Sales & Related (61 | 4.1%).
Sales and Office Occupations by Sex
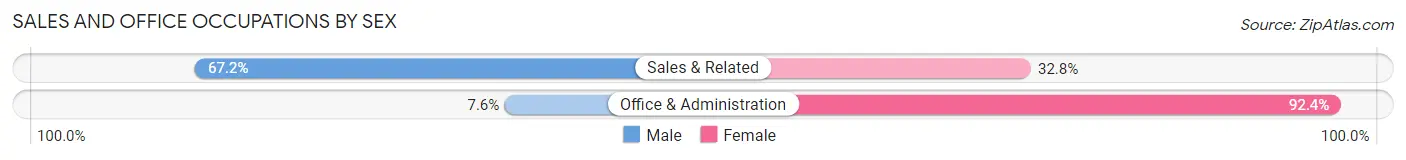
| Occupation | Male | Female |
| Sales & Related | 41 (67.2%) | 20 (32.8%) |
| Office & Administration | 18 (7.6%) | 219 (92.4%) |
| Total (Category) | 59 (19.8%) | 239 (80.2%) |
| Total (Overall) | 767 (51.8%) | 714 (48.2%) |
Natural Resources, Construction and Maintenance Occupations
The most common Natural Resources, Construction and Maintenance occupations in Aspinwall borough are Construction & Extraction (31 | 2.1%), and Installation, Maintenance & Repair (7 | 0.5%).
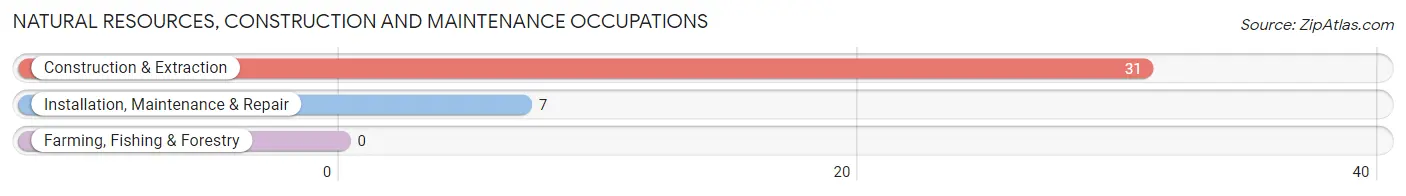
Natural Resources, Construction and Maintenance Occupations by Sex
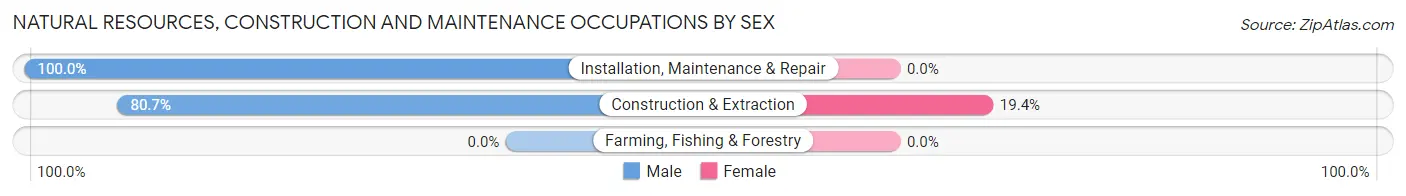
| Occupation | Male | Female |
| Farming, Fishing & Forestry | 0 (0.0%) | 0 (0.0%) |
| Construction & Extraction | 25 (80.6%) | 6 (19.4%) |
| Installation, Maintenance & Repair | 7 (100.0%) | 0 (0.0%) |
| Total (Category) | 32 (84.2%) | 6 (15.8%) |
| Total (Overall) | 767 (51.8%) | 714 (48.2%) |
Production, Transportation and Moving Occupations
The most common Production, Transportation and Moving occupations in Aspinwall borough are Production (41 | 2.8%), and Material Moving (9 | 0.6%).
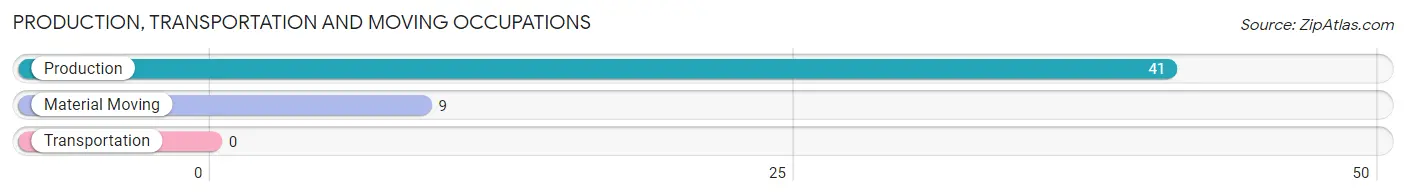
Production, Transportation and Moving Occupations by Sex
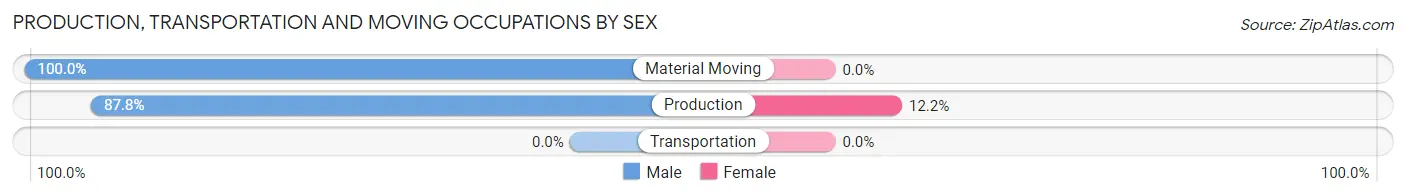
| Occupation | Male | Female |
| Production | 36 (87.8%) | 5 (12.2%) |
| Transportation | 0 (0.0%) | 0 (0.0%) |
| Material Moving | 9 (100.0%) | 0 (0.0%) |
| Total (Category) | 45 (90.0%) | 5 (10.0%) |
| Total (Overall) | 767 (51.8%) | 714 (48.2%) |
Employment Industries by Sex in Aspinwall borough
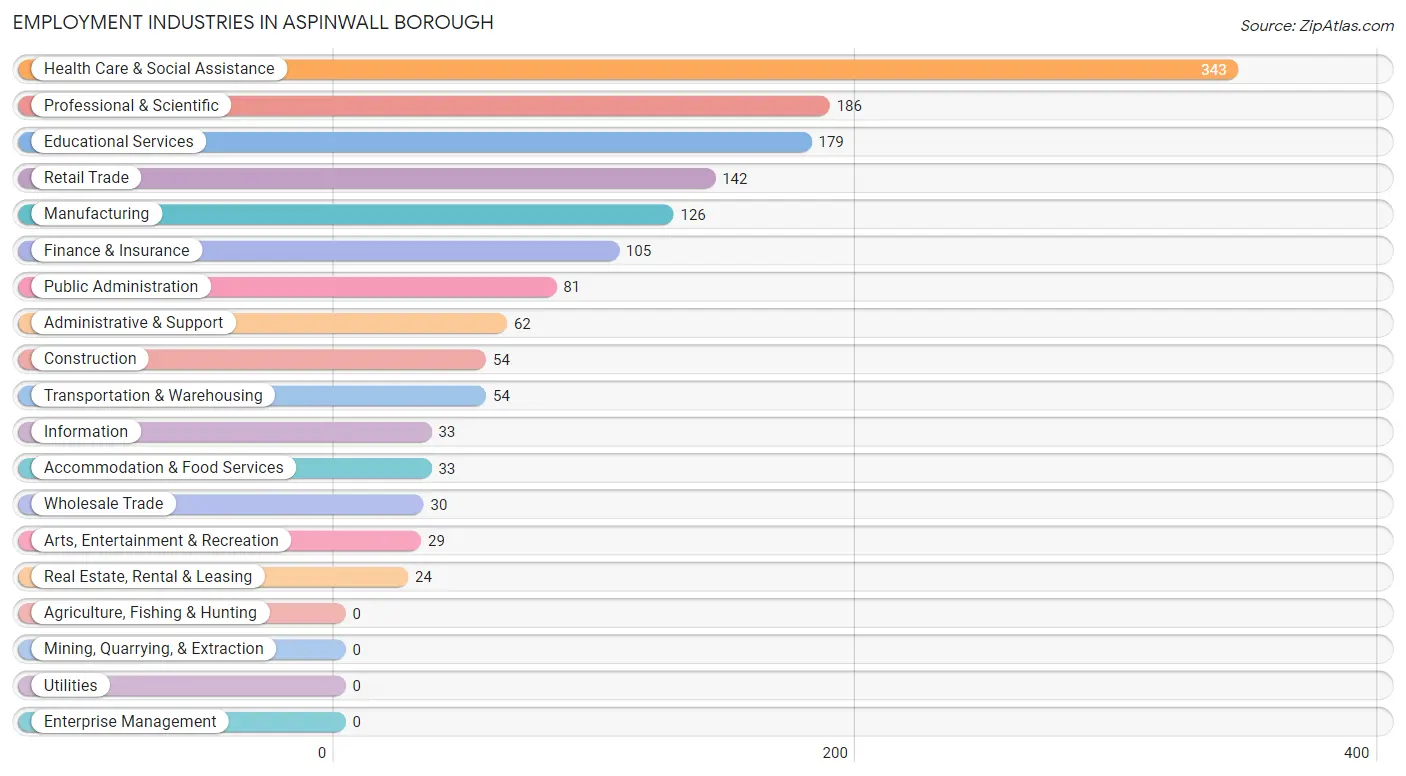
Employment Industries in Aspinwall borough
The major employment industries in Aspinwall borough include Health Care & Social Assistance (343 | 23.2%), Professional & Scientific (186 | 12.6%), Educational Services (179 | 12.1%), Retail Trade (142 | 9.6%), and Manufacturing (126 | 8.5%).
Employment Industries by Sex in Aspinwall borough
The Aspinwall borough industries that see more men than women are Manufacturing (92.9%), Construction (81.5%), and Professional & Scientific (80.6%), whereas the industries that tend to have a higher number of women are Administrative & Support (100.0%), Accommodation & Food Services (81.8%), and Health Care & Social Assistance (73.5%).
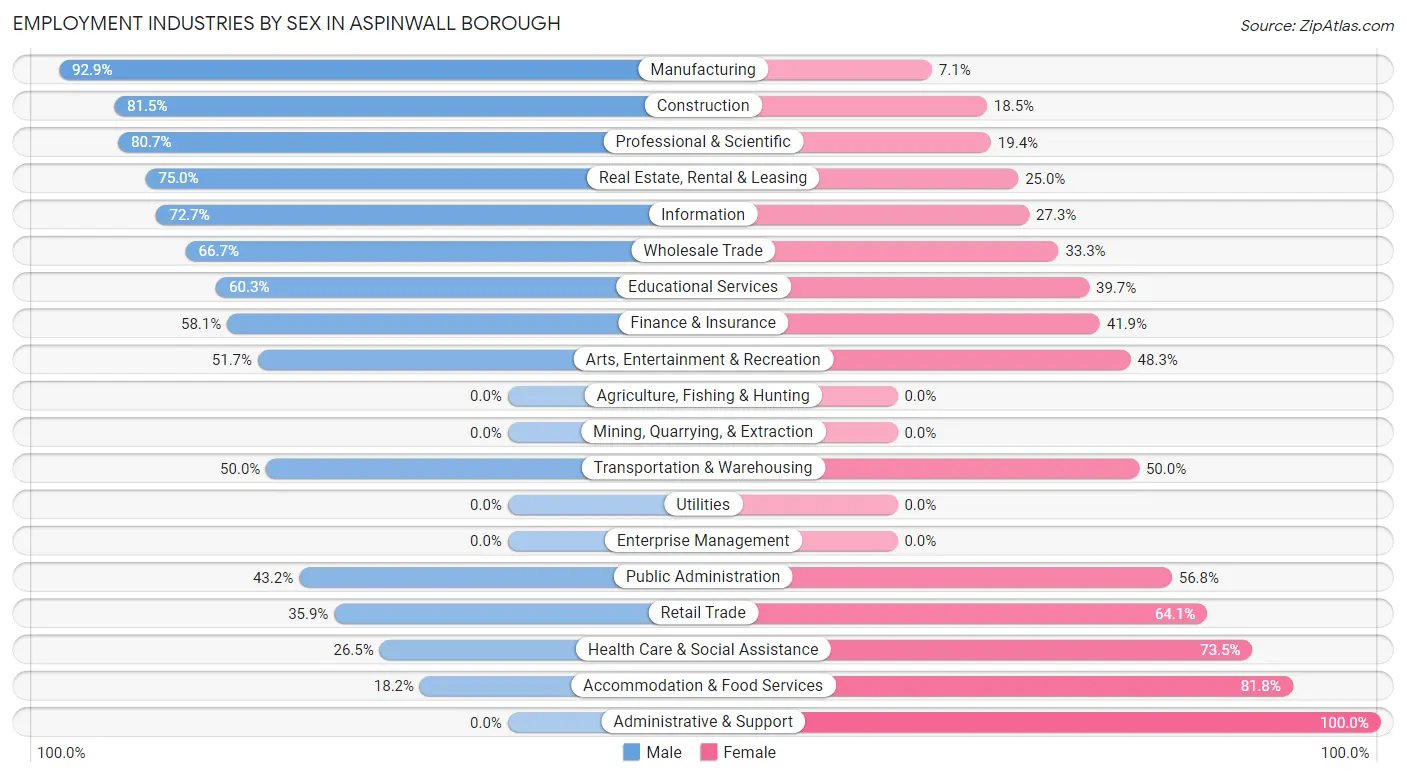
| Industry | Male | Female |
| Agriculture, Fishing & Hunting | 0 (0.0%) | 0 (0.0%) |
| Mining, Quarrying, & Extraction | 0 (0.0%) | 0 (0.0%) |
| Construction | 44 (81.5%) | 10 (18.5%) |
| Manufacturing | 117 (92.9%) | 9 (7.1%) |
| Wholesale Trade | 20 (66.7%) | 10 (33.3%) |
| Retail Trade | 51 (35.9%) | 91 (64.1%) |
| Transportation & Warehousing | 27 (50.0%) | 27 (50.0%) |
| Utilities | 0 (0.0%) | 0 (0.0%) |
| Information | 24 (72.7%) | 9 (27.3%) |
| Finance & Insurance | 61 (58.1%) | 44 (41.9%) |
| Real Estate, Rental & Leasing | 18 (75.0%) | 6 (25.0%) |
| Professional & Scientific | 150 (80.6%) | 36 (19.4%) |
| Enterprise Management | 0 (0.0%) | 0 (0.0%) |
| Administrative & Support | 0 (0.0%) | 62 (100.0%) |
| Educational Services | 108 (60.3%) | 71 (39.7%) |
| Health Care & Social Assistance | 91 (26.5%) | 252 (73.5%) |
| Arts, Entertainment & Recreation | 15 (51.7%) | 14 (48.3%) |
| Accommodation & Food Services | 6 (18.2%) | 27 (81.8%) |
| Public Administration | 35 (43.2%) | 46 (56.8%) |
| Total | 767 (51.8%) | 714 (48.2%) |
Education in Aspinwall borough
School Enrollment in Aspinwall borough
The most common levels of schooling among the 659 students in Aspinwall borough are middle school (180 | 27.3%), elementary school (139 | 21.1%), and nursery / preschool (108 | 16.4%).
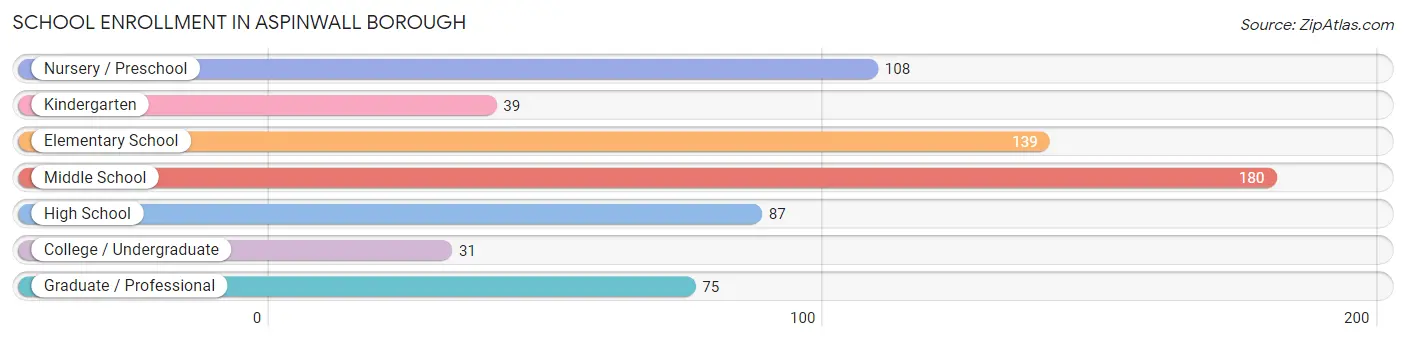
| School Level | # Students | % Students |
| Nursery / Preschool | 108 | 16.4% |
| Kindergarten | 39 | 5.9% |
| Elementary School | 139 | 21.1% |
| Middle School | 180 | 27.3% |
| High School | 87 | 13.2% |
| College / Undergraduate | 31 | 4.7% |
| Graduate / Professional | 75 | 11.4% |
| Total | 659 | 100.0% |
School Enrollment by Age by Funding Source in Aspinwall borough
Out of a total of 659 students who are enrolled in schools in Aspinwall borough, 153 (23.2%) attend a private institution, while the remaining 506 (76.8%) are enrolled in public schools. The age group of 18 to 19 year olds has the highest likelihood of being enrolled in private schools, with 5 (100.0% in the age bracket) enrolled. Conversely, the age group of 10 to 14 year olds has the lowest likelihood of being enrolled in a private school, with 235 (100.0% in the age bracket) attending a public institution.
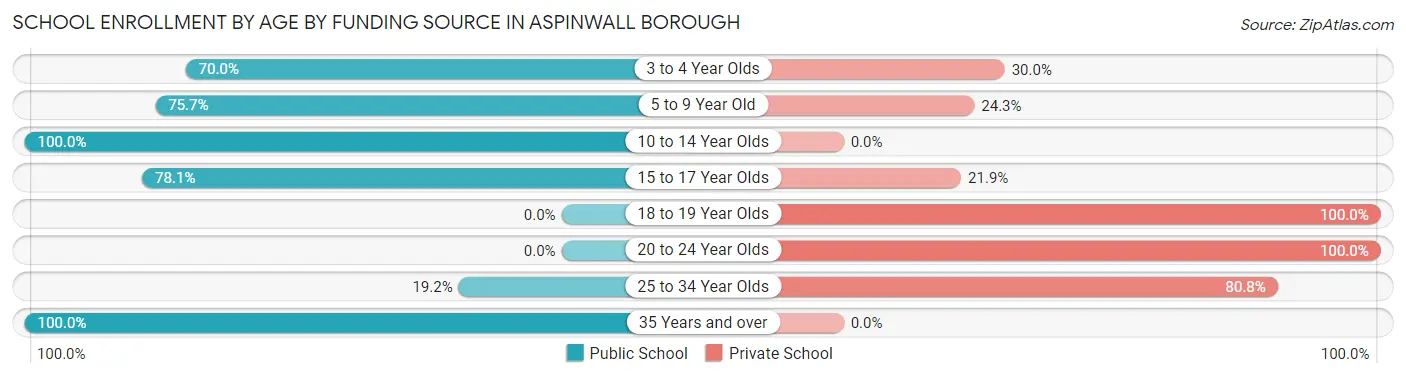
| Age Bracket | Public School | Private School |
| 3 to 4 Year Olds | 42 (70.0%) | 18 (30.0%) |
| 5 to 9 Year Old | 171 (75.7%) | 55 (24.3%) |
| 10 to 14 Year Olds | 235 (100.0%) | 0 (0.0%) |
| 15 to 17 Year Olds | 25 (78.1%) | 7 (21.9%) |
| 18 to 19 Year Olds | 0 (0.0%) | 5 (100.0%) |
| 20 to 24 Year Olds | 0 (0.0%) | 9 (100.0%) |
| 25 to 34 Year Olds | 14 (19.2%) | 59 (80.8%) |
| 35 Years and over | 19 (100.0%) | 0 (0.0%) |
| Total | 506 (76.8%) | 153 (23.2%) |
Educational Attainment by Field of Study in Aspinwall borough
Business (260 | 15.9%), education (183 | 11.2%), arts & humanities (147 | 9.0%), psychology (136 | 8.3%), and science & technology (133 | 8.1%) are the most common fields of study among 1,639 individuals in Aspinwall borough who have obtained a bachelor's degree or higher.
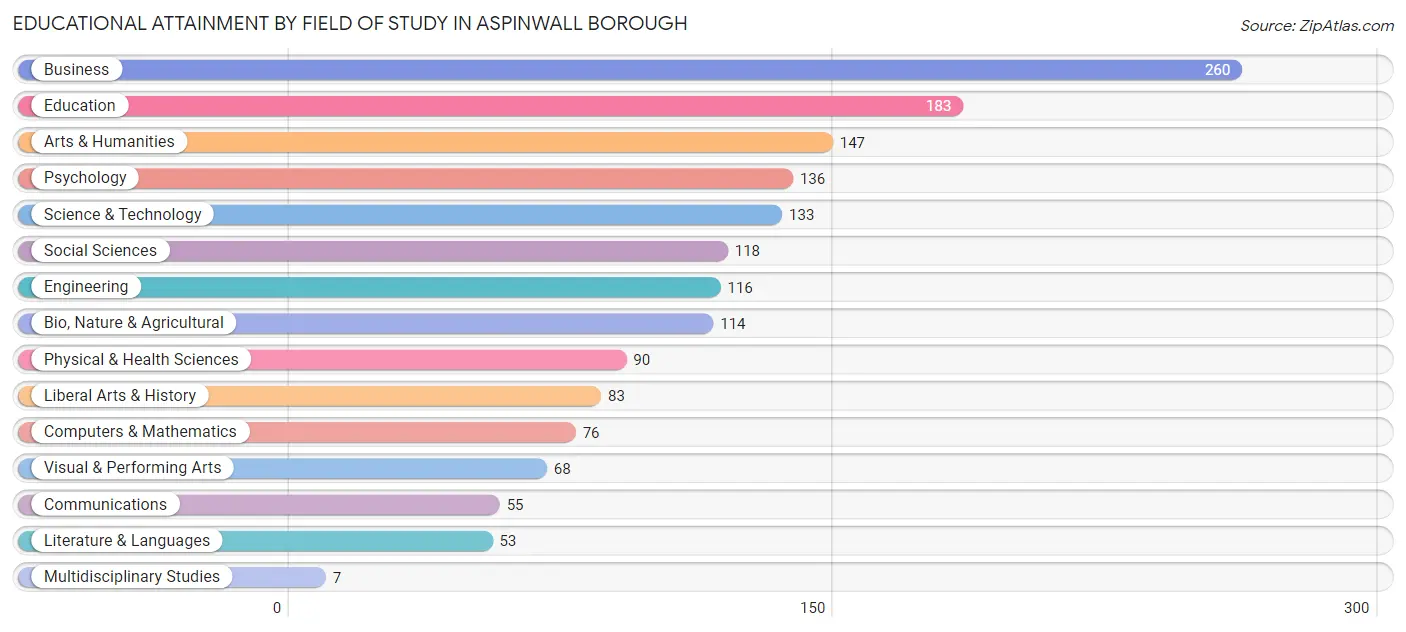
| Field of Study | # Graduates | % Graduates |
| Computers & Mathematics | 76 | 4.6% |
| Bio, Nature & Agricultural | 114 | 7.0% |
| Physical & Health Sciences | 90 | 5.5% |
| Psychology | 136 | 8.3% |
| Social Sciences | 118 | 7.2% |
| Engineering | 116 | 7.1% |
| Multidisciplinary Studies | 7 | 0.4% |
| Science & Technology | 133 | 8.1% |
| Business | 260 | 15.9% |
| Education | 183 | 11.2% |
| Literature & Languages | 53 | 3.2% |
| Liberal Arts & History | 83 | 5.1% |
| Visual & Performing Arts | 68 | 4.2% |
| Communications | 55 | 3.4% |
| Arts & Humanities | 147 | 9.0% |
| Total | 1,639 | 100.0% |
Transportation & Commute in Aspinwall borough
Vehicle Availability by Sex in Aspinwall borough
The most prevalent vehicle ownership categories in Aspinwall borough are males with 2 vehicles (445, accounting for 58.6%) and females with 2 vehicles (406, making up 63.9%).
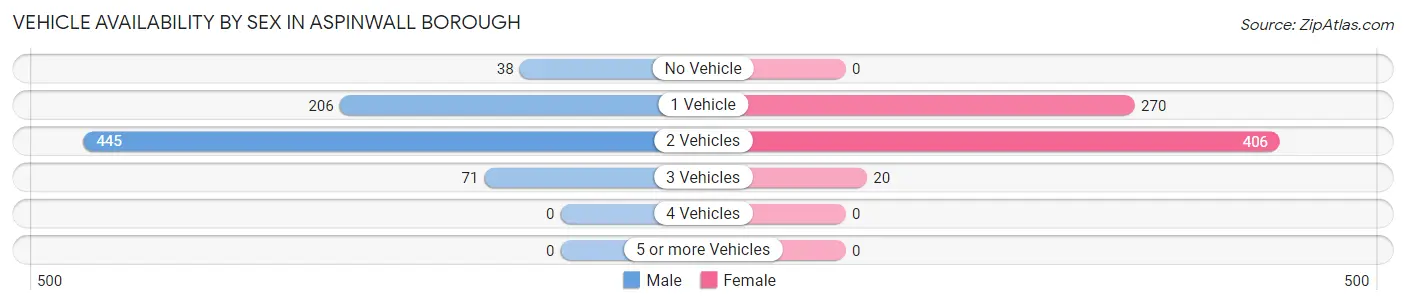
| Vehicles Available | Male | Female |
| No Vehicle | 38 (5.0%) | 0 (0.0%) |
| 1 Vehicle | 206 (27.1%) | 270 (38.8%) |
| 2 Vehicles | 445 (58.6%) | 406 (58.3%) |
| 3 Vehicles | 71 (9.3%) | 20 (2.9%) |
| 4 Vehicles | 0 (0.0%) | 0 (0.0%) |
| 5 or more Vehicles | 0 (0.0%) | 0 (0.0%) |
| Total | 760 (100.0%) | 696 (100.0%) |
Commute Time in Aspinwall borough
The most frequently occuring commute durations in Aspinwall borough are 20 to 24 minutes (243 commuters, 21.7%), 10 to 14 minutes (157 commuters, 14.0%), and 15 to 19 minutes (138 commuters, 12.3%).
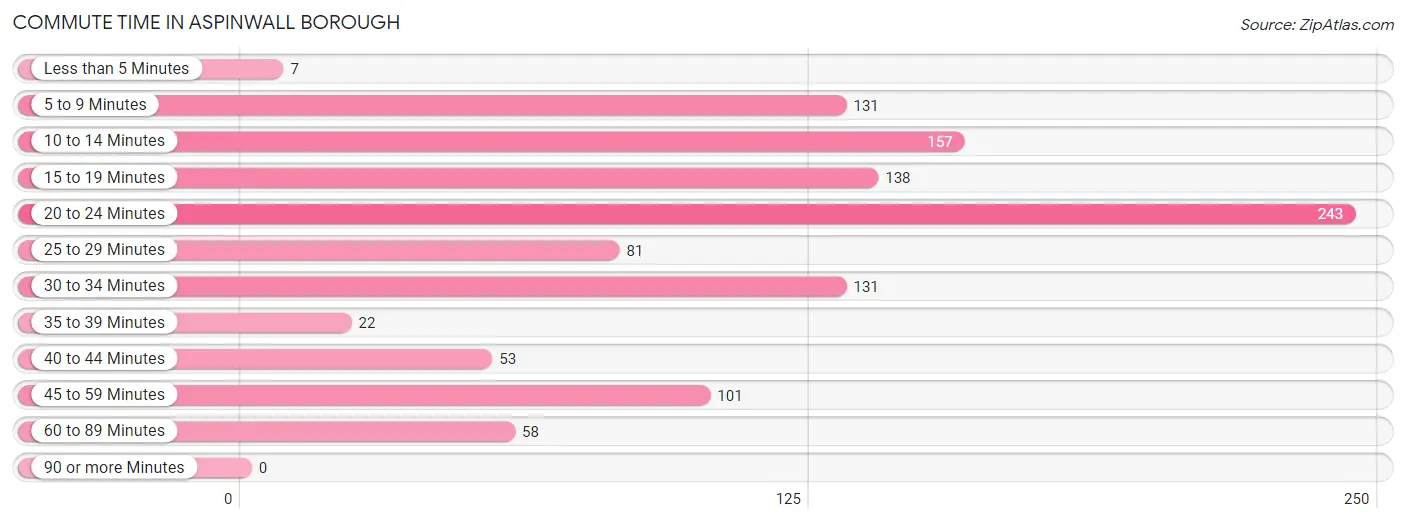
| Commute Time | # Commuters | % Commuters |
| Less than 5 Minutes | 7 | 0.6% |
| 5 to 9 Minutes | 131 | 11.7% |
| 10 to 14 Minutes | 157 | 14.0% |
| 15 to 19 Minutes | 138 | 12.3% |
| 20 to 24 Minutes | 243 | 21.7% |
| 25 to 29 Minutes | 81 | 7.2% |
| 30 to 34 Minutes | 131 | 11.7% |
| 35 to 39 Minutes | 22 | 2.0% |
| 40 to 44 Minutes | 53 | 4.7% |
| 45 to 59 Minutes | 101 | 9.0% |
| 60 to 89 Minutes | 58 | 5.2% |
| 90 or more Minutes | 0 | 0.0% |
Commute Time by Sex in Aspinwall borough
The most common commute times in Aspinwall borough are 10 to 14 minutes (93 commuters, 15.7%) for males and 20 to 24 minutes (165 commuters, 31.2%) for females.
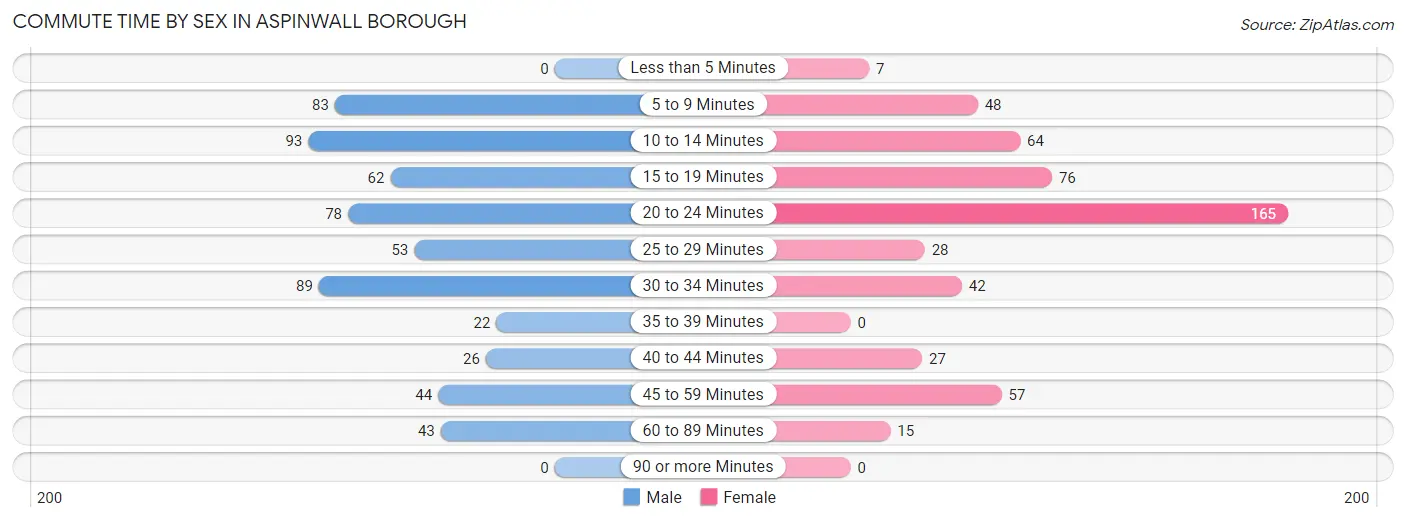
| Commute Time | Male | Female |
| Less than 5 Minutes | 0 (0.0%) | 7 (1.3%) |
| 5 to 9 Minutes | 83 (14.0%) | 48 (9.1%) |
| 10 to 14 Minutes | 93 (15.7%) | 64 (12.1%) |
| 15 to 19 Minutes | 62 (10.5%) | 76 (14.4%) |
| 20 to 24 Minutes | 78 (13.2%) | 165 (31.2%) |
| 25 to 29 Minutes | 53 (8.9%) | 28 (5.3%) |
| 30 to 34 Minutes | 89 (15.0%) | 42 (7.9%) |
| 35 to 39 Minutes | 22 (3.7%) | 0 (0.0%) |
| 40 to 44 Minutes | 26 (4.4%) | 27 (5.1%) |
| 45 to 59 Minutes | 44 (7.4%) | 57 (10.8%) |
| 60 to 89 Minutes | 43 (7.2%) | 15 (2.8%) |
| 90 or more Minutes | 0 (0.0%) | 0 (0.0%) |
Time of Departure to Work by Sex in Aspinwall borough
The most frequent times of departure to work in Aspinwall borough are 7:30 AM to 7:59 AM (128, 21.6%) for males and 7:30 AM to 7:59 AM (109, 20.6%) for females.
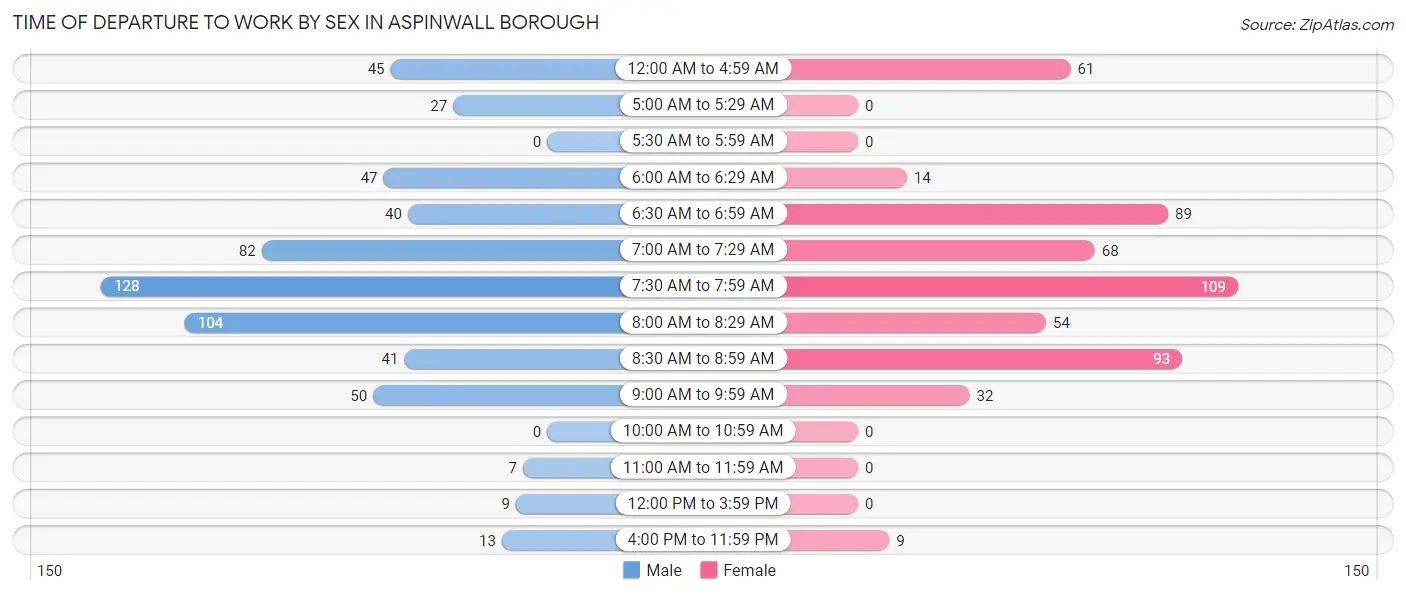
| Time of Departure | Male | Female |
| 12:00 AM to 4:59 AM | 45 (7.6%) | 61 (11.5%) |
| 5:00 AM to 5:29 AM | 27 (4.5%) | 0 (0.0%) |
| 5:30 AM to 5:59 AM | 0 (0.0%) | 0 (0.0%) |
| 6:00 AM to 6:29 AM | 47 (7.9%) | 14 (2.6%) |
| 6:30 AM to 6:59 AM | 40 (6.8%) | 89 (16.8%) |
| 7:00 AM to 7:29 AM | 82 (13.8%) | 68 (12.9%) |
| 7:30 AM to 7:59 AM | 128 (21.6%) | 109 (20.6%) |
| 8:00 AM to 8:29 AM | 104 (17.5%) | 54 (10.2%) |
| 8:30 AM to 8:59 AM | 41 (6.9%) | 93 (17.6%) |
| 9:00 AM to 9:59 AM | 50 (8.4%) | 32 (6.0%) |
| 10:00 AM to 10:59 AM | 0 (0.0%) | 0 (0.0%) |
| 11:00 AM to 11:59 AM | 7 (1.2%) | 0 (0.0%) |
| 12:00 PM to 3:59 PM | 9 (1.5%) | 0 (0.0%) |
| 4:00 PM to 11:59 PM | 13 (2.2%) | 9 (1.7%) |
| Total | 593 (100.0%) | 529 (100.0%) |
Housing Occupancy in Aspinwall borough
Occupancy by Ownership in Aspinwall borough
Of the total 1,222 dwellings in Aspinwall borough, owner-occupied units account for 711 (58.2%), while renter-occupied units make up 511 (41.8%).
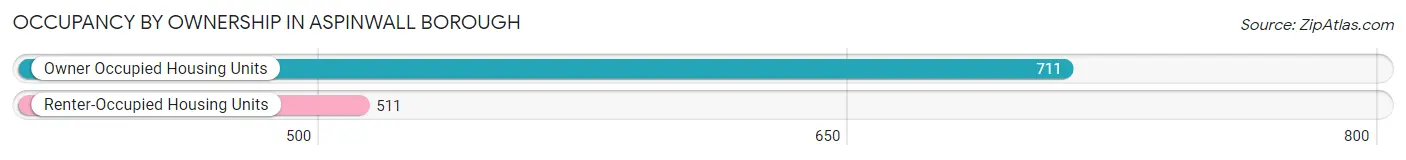
| Occupancy | # Housing Units | % Housing Units |
| Owner Occupied Housing Units | 711 | 58.2% |
| Renter-Occupied Housing Units | 511 | 41.8% |
| Total Occupied Housing Units | 1,222 | 100.0% |
Occupancy by Household Size in Aspinwall borough
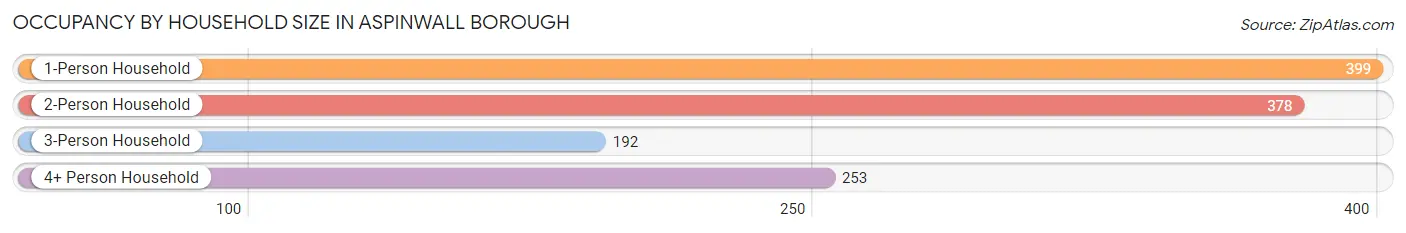
| Household Size | # Housing Units | % Housing Units |
| 1-Person Household | 399 | 32.7% |
| 2-Person Household | 378 | 30.9% |
| 3-Person Household | 192 | 15.7% |
| 4+ Person Household | 253 | 20.7% |
| Total Housing Units | 1,222 | 100.0% |
Occupancy by Ownership by Household Size in Aspinwall borough
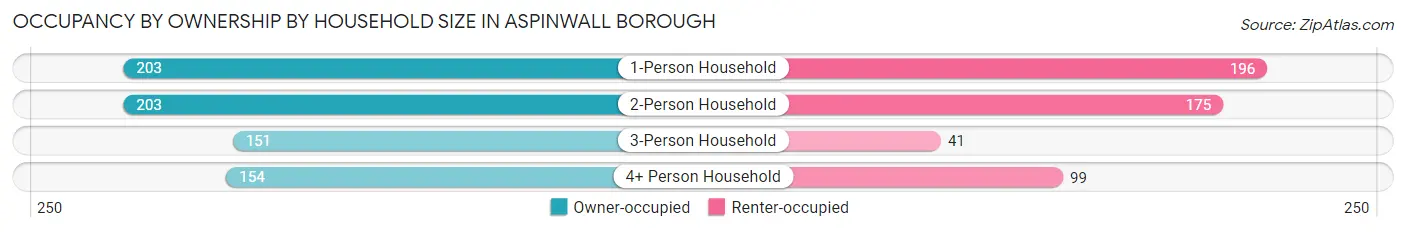
| Household Size | Owner-occupied | Renter-occupied |
| 1-Person Household | 203 (50.9%) | 196 (49.1%) |
| 2-Person Household | 203 (53.7%) | 175 (46.3%) |
| 3-Person Household | 151 (78.6%) | 41 (21.3%) |
| 4+ Person Household | 154 (60.9%) | 99 (39.1%) |
| Total Housing Units | 711 (58.2%) | 511 (41.8%) |
Occupancy by Educational Attainment in Aspinwall borough
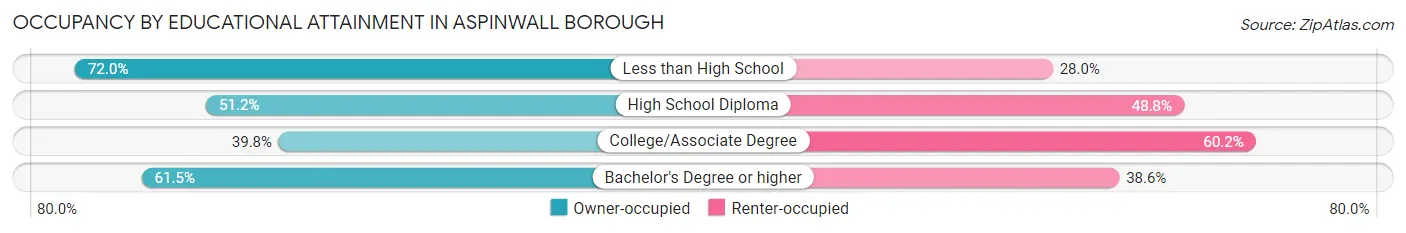
| Household Size | Owner-occupied | Renter-occupied |
| Less than High School | 18 (72.0%) | 7 (28.0%) |
| High School Diploma | 85 (51.2%) | 81 (48.8%) |
| College/Associate Degree | 47 (39.8%) | 71 (60.2%) |
| Bachelor's Degree or higher | 561 (61.5%) | 352 (38.6%) |
Occupancy by Age of Householder in Aspinwall borough
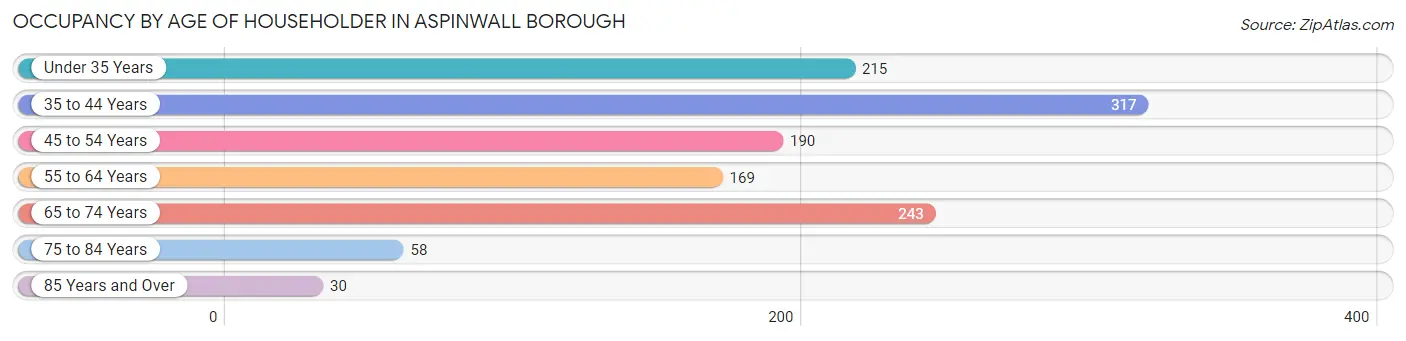
| Age Bracket | # Households | % Households |
| Under 35 Years | 215 | 17.6% |
| 35 to 44 Years | 317 | 25.9% |
| 45 to 54 Years | 190 | 15.5% |
| 55 to 64 Years | 169 | 13.8% |
| 65 to 74 Years | 243 | 19.9% |
| 75 to 84 Years | 58 | 4.8% |
| 85 Years and Over | 30 | 2.5% |
| Total | 1,222 | 100.0% |
Housing Finances in Aspinwall borough
Median Income by Occupancy in Aspinwall borough
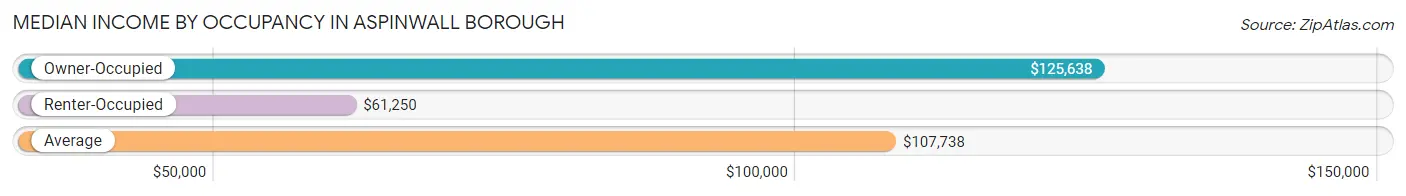
| Occupancy Type | # Households | Median Income |
| Owner-Occupied | 711 (58.2%) | $125,638 |
| Renter-Occupied | 511 (41.8%) | $61,250 |
| Average | 1,222 (100.0%) | $107,738 |
Occupancy by Householder Income Bracket in Aspinwall borough
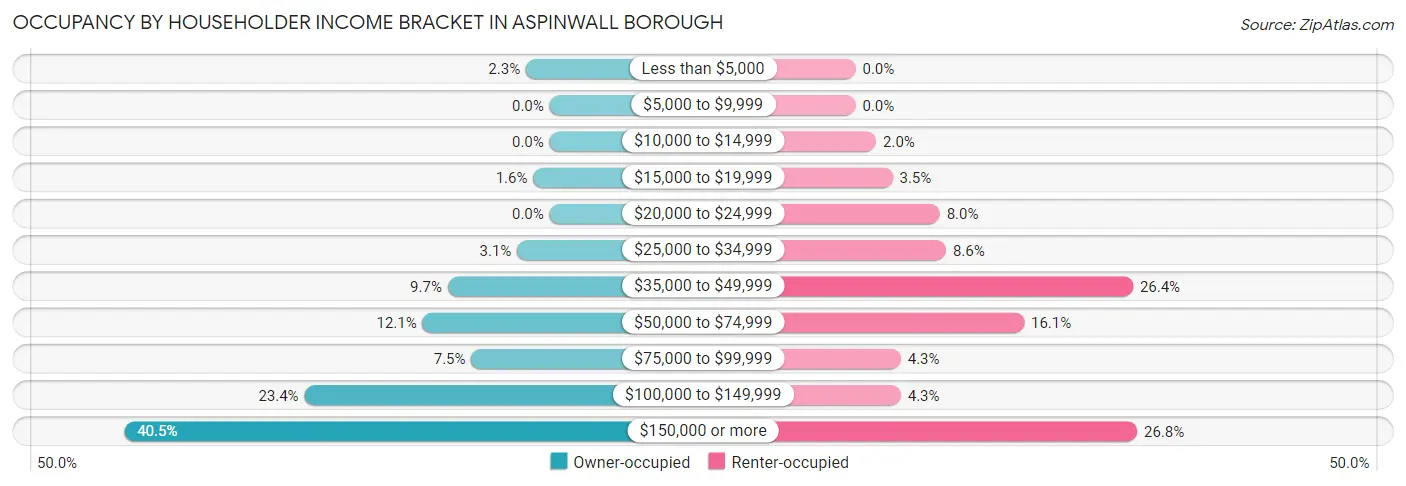
| Income Bracket | Owner-occupied | Renter-occupied |
| Less than $5,000 | 16 (2.2%) | 0 (0.0%) |
| $5,000 to $9,999 | 0 (0.0%) | 0 (0.0%) |
| $10,000 to $14,999 | 0 (0.0%) | 10 (2.0%) |
| $15,000 to $19,999 | 11 (1.5%) | 18 (3.5%) |
| $20,000 to $24,999 | 0 (0.0%) | 41 (8.0%) |
| $25,000 to $34,999 | 22 (3.1%) | 44 (8.6%) |
| $35,000 to $49,999 | 69 (9.7%) | 135 (26.4%) |
| $50,000 to $74,999 | 86 (12.1%) | 82 (16.1%) |
| $75,000 to $99,999 | 53 (7.4%) | 22 (4.3%) |
| $100,000 to $149,999 | 166 (23.4%) | 22 (4.3%) |
| $150,000 or more | 288 (40.5%) | 137 (26.8%) |
| Total | 711 (100.0%) | 511 (100.0%) |
Monthly Housing Cost Tiers in Aspinwall borough
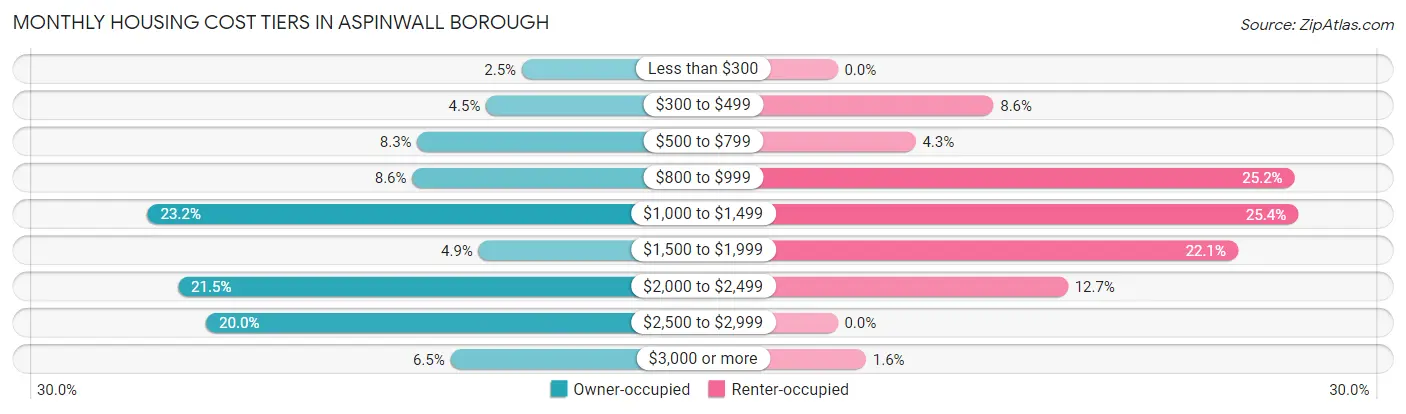
| Monthly Cost | Owner-occupied | Renter-occupied |
| Less than $300 | 18 (2.5%) | 0 (0.0%) |
| $300 to $499 | 32 (4.5%) | 44 (8.6%) |
| $500 to $799 | 59 (8.3%) | 22 (4.3%) |
| $800 to $999 | 61 (8.6%) | 129 (25.2%) |
| $1,000 to $1,499 | 165 (23.2%) | 130 (25.4%) |
| $1,500 to $1,999 | 35 (4.9%) | 113 (22.1%) |
| $2,000 to $2,499 | 153 (21.5%) | 65 (12.7%) |
| $2,500 to $2,999 | 142 (20.0%) | 0 (0.0%) |
| $3,000 or more | 46 (6.5%) | 8 (1.6%) |
| Total | 711 (100.0%) | 511 (100.0%) |
Physical Housing Characteristics in Aspinwall borough
Housing Structures in Aspinwall borough
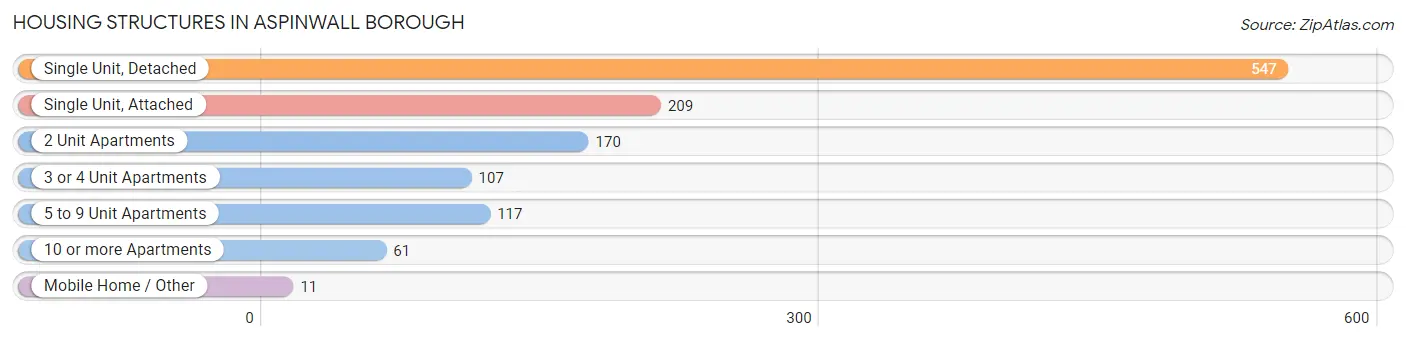
| Structure Type | # Housing Units | % Housing Units |
| Single Unit, Detached | 547 | 44.8% |
| Single Unit, Attached | 209 | 17.1% |
| 2 Unit Apartments | 170 | 13.9% |
| 3 or 4 Unit Apartments | 107 | 8.8% |
| 5 to 9 Unit Apartments | 117 | 9.6% |
| 10 or more Apartments | 61 | 5.0% |
| Mobile Home / Other | 11 | 0.9% |
| Total | 1,222 | 100.0% |
Housing Structures by Occupancy in Aspinwall borough
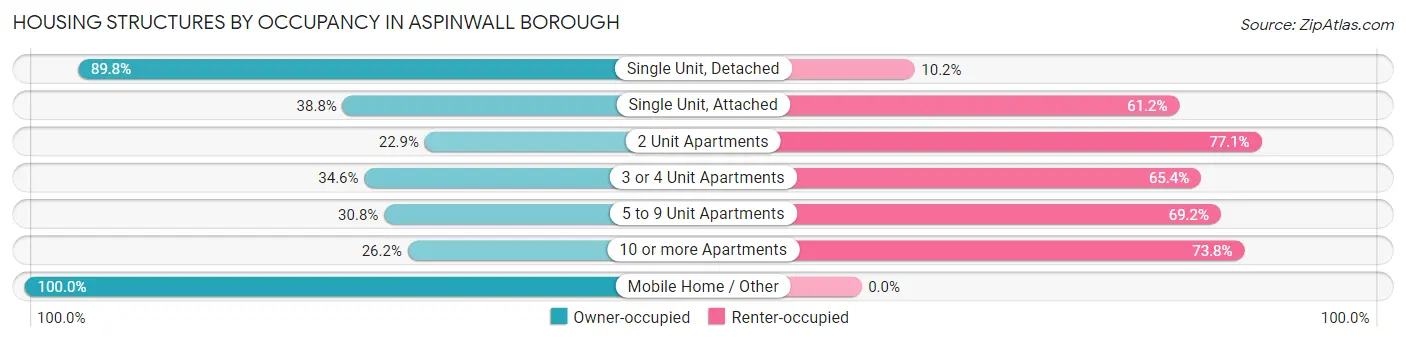
| Structure Type | Owner-occupied | Renter-occupied |
| Single Unit, Detached | 491 (89.8%) | 56 (10.2%) |
| Single Unit, Attached | 81 (38.8%) | 128 (61.2%) |
| 2 Unit Apartments | 39 (22.9%) | 131 (77.1%) |
| 3 or 4 Unit Apartments | 37 (34.6%) | 70 (65.4%) |
| 5 to 9 Unit Apartments | 36 (30.8%) | 81 (69.2%) |
| 10 or more Apartments | 16 (26.2%) | 45 (73.8%) |
| Mobile Home / Other | 11 (100.0%) | 0 (0.0%) |
| Total | 711 (58.2%) | 511 (41.8%) |
Housing Structures by Number of Rooms in Aspinwall borough
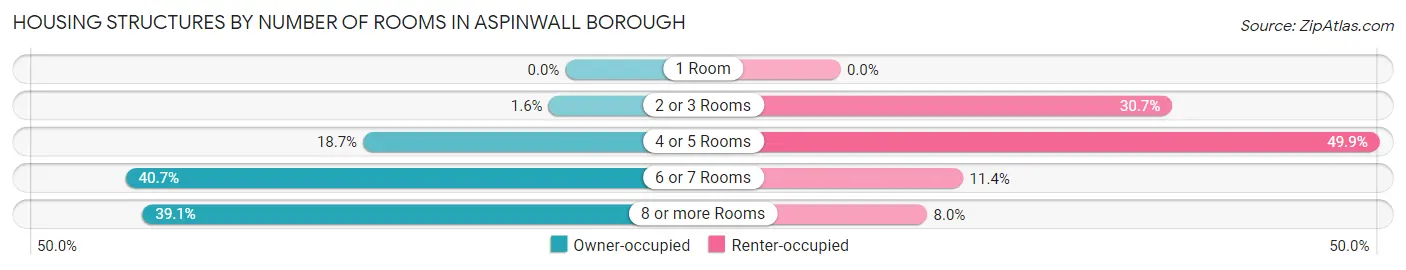
| Number of Rooms | Owner-occupied | Renter-occupied |
| 1 Room | 0 (0.0%) | 0 (0.0%) |
| 2 or 3 Rooms | 11 (1.5%) | 157 (30.7%) |
| 4 or 5 Rooms | 133 (18.7%) | 255 (49.9%) |
| 6 or 7 Rooms | 289 (40.6%) | 58 (11.4%) |
| 8 or more Rooms | 278 (39.1%) | 41 (8.0%) |
| Total | 711 (100.0%) | 511 (100.0%) |
Housing Structure by Heating Type in Aspinwall borough
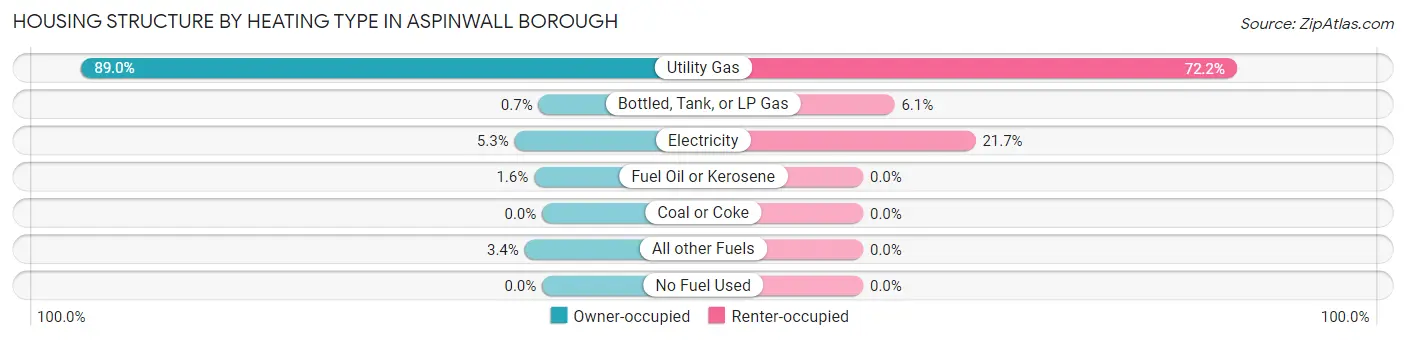
| Heating Type | Owner-occupied | Renter-occupied |
| Utility Gas | 633 (89.0%) | 369 (72.2%) |
| Bottled, Tank, or LP Gas | 5 (0.7%) | 31 (6.1%) |
| Electricity | 38 (5.3%) | 111 (21.7%) |
| Fuel Oil or Kerosene | 11 (1.5%) | 0 (0.0%) |
| Coal or Coke | 0 (0.0%) | 0 (0.0%) |
| All other Fuels | 24 (3.4%) | 0 (0.0%) |
| No Fuel Used | 0 (0.0%) | 0 (0.0%) |
| Total | 711 (100.0%) | 511 (100.0%) |
Household Vehicle Usage in Aspinwall borough
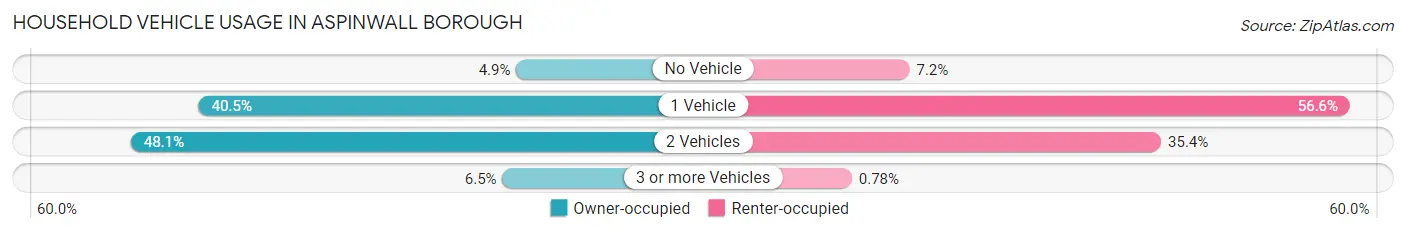
| Vehicles per Household | Owner-occupied | Renter-occupied |
| No Vehicle | 35 (4.9%) | 37 (7.2%) |
| 1 Vehicle | 288 (40.5%) | 289 (56.6%) |
| 2 Vehicles | 342 (48.1%) | 181 (35.4%) |
| 3 or more Vehicles | 46 (6.5%) | 4 (0.8%) |
| Total | 711 (100.0%) | 511 (100.0%) |
Real Estate & Mortgages in Aspinwall borough
Real Estate and Mortgage Overview in Aspinwall borough
| Characteristic | Without Mortgage | With Mortgage |
| Housing Units | 234 | 477 |
| Median Property Value | $351,800 | $373,800 |
| Median Household Income | $112,813 | $228 |
| Monthly Housing Costs | $829 | $46 |
| Real Estate Taxes | $5,524 | $0 |
Property Value by Mortgage Status in Aspinwall borough
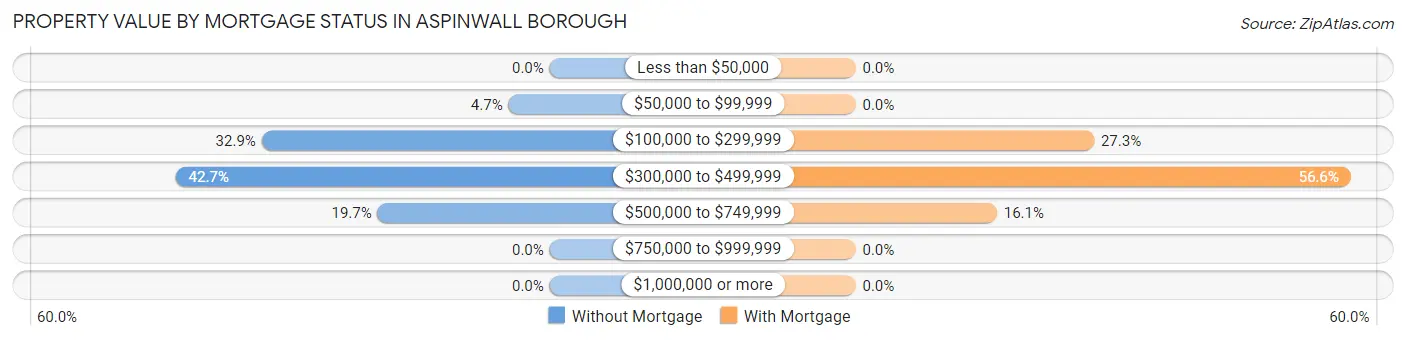
| Property Value | Without Mortgage | With Mortgage |
| Less than $50,000 | 0 (0.0%) | 0 (0.0%) |
| $50,000 to $99,999 | 11 (4.7%) | 0 (0.0%) |
| $100,000 to $299,999 | 77 (32.9%) | 130 (27.3%) |
| $300,000 to $499,999 | 100 (42.7%) | 270 (56.6%) |
| $500,000 to $749,999 | 46 (19.7%) | 77 (16.1%) |
| $750,000 to $999,999 | 0 (0.0%) | 0 (0.0%) |
| $1,000,000 or more | 0 (0.0%) | 0 (0.0%) |
| Total | 234 (100.0%) | 477 (100.0%) |
Household Income by Mortgage Status in Aspinwall borough
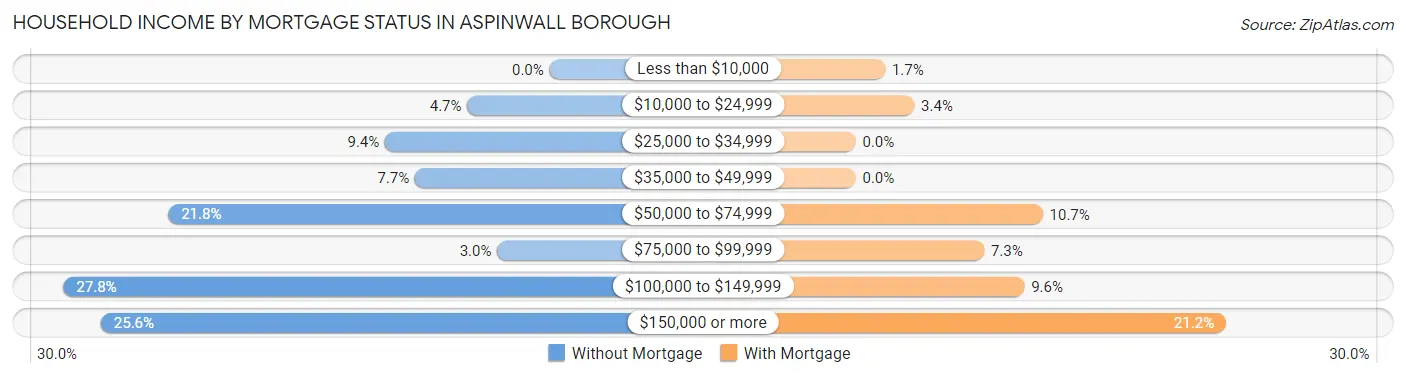
| Household Income | Without Mortgage | With Mortgage |
| Less than $10,000 | 0 (0.0%) | 8 (1.7%) |
| $10,000 to $24,999 | 11 (4.7%) | 16 (3.4%) |
| $25,000 to $34,999 | 22 (9.4%) | 0 (0.0%) |
| $35,000 to $49,999 | 18 (7.7%) | 0 (0.0%) |
| $50,000 to $74,999 | 51 (21.8%) | 51 (10.7%) |
| $75,000 to $99,999 | 7 (3.0%) | 35 (7.3%) |
| $100,000 to $149,999 | 65 (27.8%) | 46 (9.6%) |
| $150,000 or more | 60 (25.6%) | 101 (21.2%) |
| Total | 234 (100.0%) | 477 (100.0%) |
Property Value to Household Income Ratio in Aspinwall borough
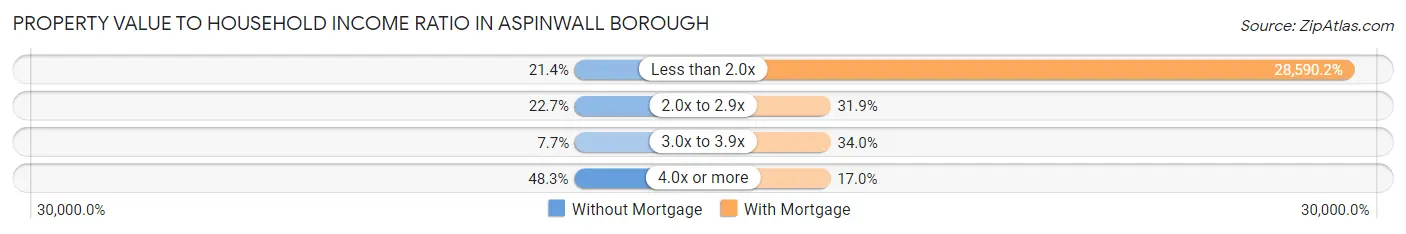
| Value-to-Income Ratio | Without Mortgage | With Mortgage |
| Less than 2.0x | 50 (21.4%) | 136,375 (28,590.1%) |
| 2.0x to 2.9x | 53 (22.7%) | 152 (31.9%) |
| 3.0x to 3.9x | 18 (7.7%) | 162 (34.0%) |
| 4.0x or more | 113 (48.3%) | 81 (17.0%) |
| Total | 234 (100.0%) | 477 (100.0%) |
Real Estate Taxes by Mortgage Status in Aspinwall borough
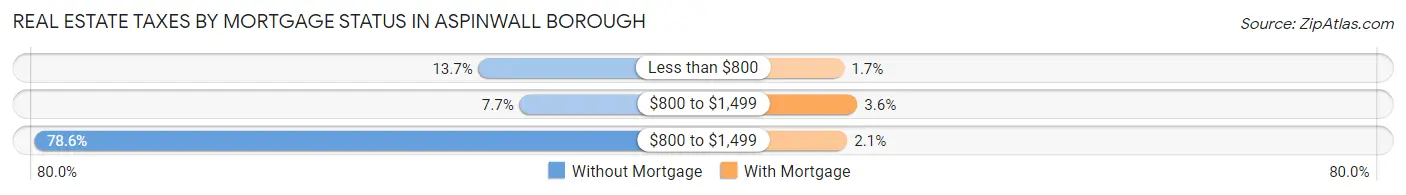
| Property Taxes | Without Mortgage | With Mortgage |
| Less than $800 | 32 (13.7%) | 8 (1.7%) |
| $800 to $1,499 | 18 (7.7%) | 17 (3.6%) |
| $800 to $1,499 | 184 (78.6%) | 10 (2.1%) |
| Total | 234 (100.0%) | 477 (100.0%) |
Health & Disability in Aspinwall borough
Health Insurance Coverage by Age in Aspinwall borough
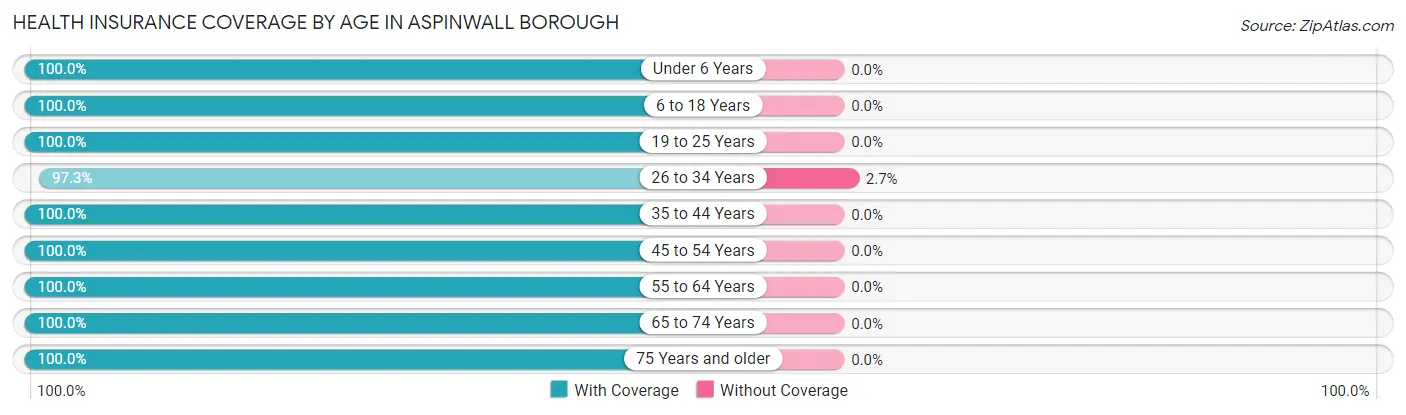
| Age Bracket | With Coverage | Without Coverage |
| Under 6 Years | 402 (100.0%) | 0 (0.0%) |
| 6 to 18 Years | 419 (100.0%) | 0 (0.0%) |
| 19 to 25 Years | 75 (100.0%) | 0 (0.0%) |
| 26 to 34 Years | 395 (97.3%) | 11 (2.7%) |
| 35 to 44 Years | 623 (100.0%) | 0 (0.0%) |
| 45 to 54 Years | 298 (100.0%) | 0 (0.0%) |
| 55 to 64 Years | 262 (100.0%) | 0 (0.0%) |
| 65 to 74 Years | 273 (100.0%) | 0 (0.0%) |
| 75 Years and older | 132 (100.0%) | 0 (0.0%) |
| Total | 2,879 (99.6%) | 11 (0.4%) |
Health Insurance Coverage by Citizenship Status in Aspinwall borough
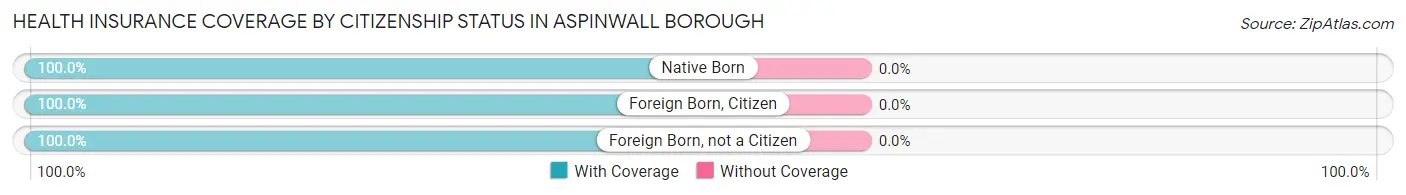
| Citizenship Status | With Coverage | Without Coverage |
| Native Born | 402 (100.0%) | 0 (0.0%) |
| Foreign Born, Citizen | 419 (100.0%) | 0 (0.0%) |
| Foreign Born, not a Citizen | 75 (100.0%) | 0 (0.0%) |
Health Insurance Coverage by Household Income in Aspinwall borough
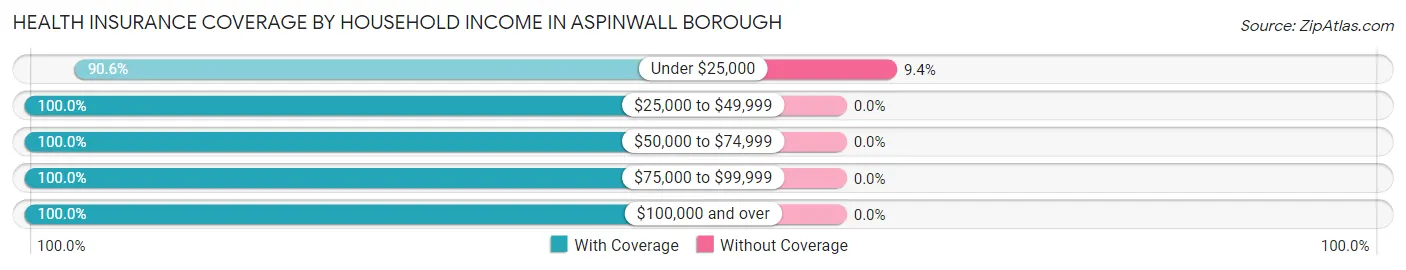
| Household Income | With Coverage | Without Coverage |
| Under $25,000 | 106 (90.6%) | 11 (9.4%) |
| $25,000 to $49,999 | 430 (100.0%) | 0 (0.0%) |
| $50,000 to $74,999 | 266 (100.0%) | 0 (0.0%) |
| $75,000 to $99,999 | 144 (100.0%) | 0 (0.0%) |
| $100,000 and over | 1,933 (100.0%) | 0 (0.0%) |
Public vs Private Health Insurance Coverage by Age in Aspinwall borough
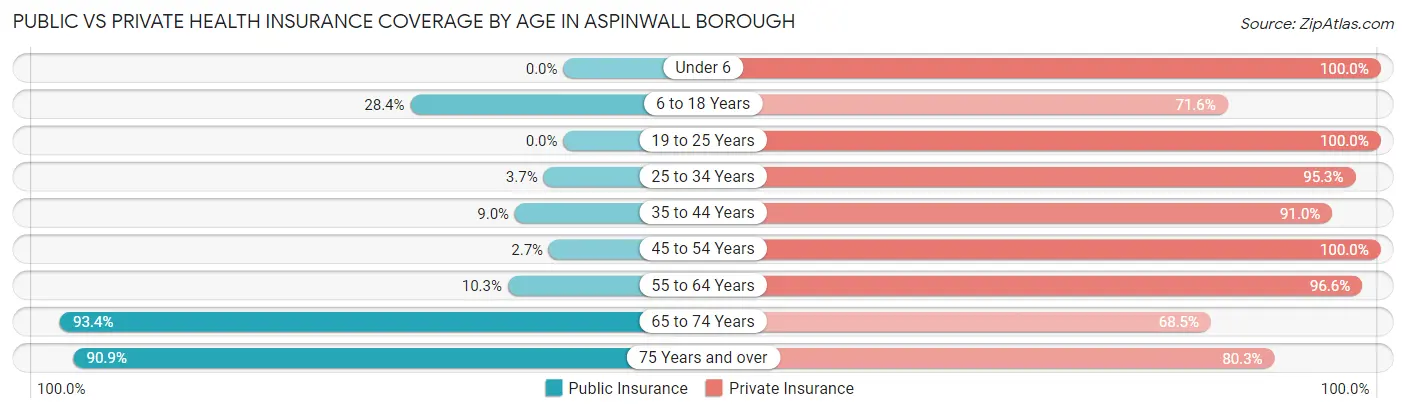
| Age Bracket | Public Insurance | Private Insurance |
| Under 6 | 0 (0.0%) | 402 (100.0%) |
| 6 to 18 Years | 119 (28.4%) | 300 (71.6%) |
| 19 to 25 Years | 0 (0.0%) | 75 (100.0%) |
| 25 to 34 Years | 15 (3.7%) | 387 (95.3%) |
| 35 to 44 Years | 56 (9.0%) | 567 (91.0%) |
| 45 to 54 Years | 8 (2.7%) | 298 (100.0%) |
| 55 to 64 Years | 27 (10.3%) | 253 (96.6%) |
| 65 to 74 Years | 255 (93.4%) | 187 (68.5%) |
| 75 Years and over | 120 (90.9%) | 106 (80.3%) |
| Total | 600 (20.8%) | 2,575 (89.1%) |
Disability Status by Sex by Age in Aspinwall borough
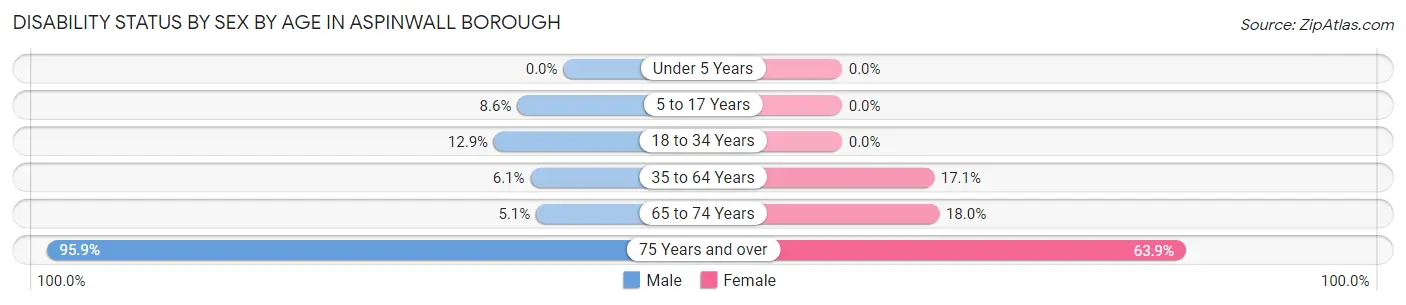
| Age Bracket | Male | Female |
| Under 5 Years | 0 (0.0%) | 0 (0.0%) |
| 5 to 17 Years | 16 (8.6%) | 0 (0.0%) |
| 18 to 34 Years | 25 (12.9%) | 0 (0.0%) |
| 35 to 64 Years | 34 (6.1%) | 107 (17.1%) |
| 65 to 74 Years | 4 (5.1%) | 35 (18.0%) |
| 75 Years and over | 47 (95.9%) | 53 (63.9%) |
Disability Class by Sex by Age in Aspinwall borough
Disability Class: Hearing Difficulty
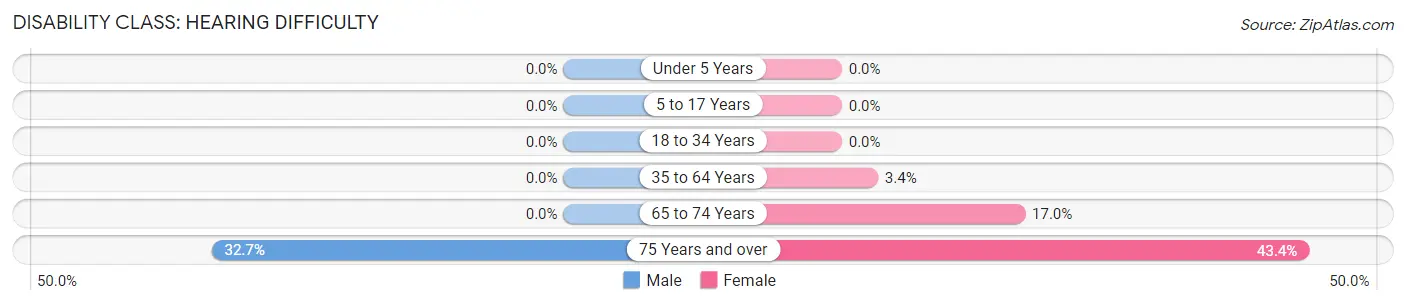
| Age Bracket | Male | Female |
| Under 5 Years | 0 (0.0%) | 0 (0.0%) |
| 5 to 17 Years | 0 (0.0%) | 0 (0.0%) |
| 18 to 34 Years | 0 (0.0%) | 0 (0.0%) |
| 35 to 64 Years | 0 (0.0%) | 21 (3.4%) |
| 65 to 74 Years | 0 (0.0%) | 33 (17.0%) |
| 75 Years and over | 16 (32.7%) | 36 (43.4%) |
Disability Class: Vision Difficulty
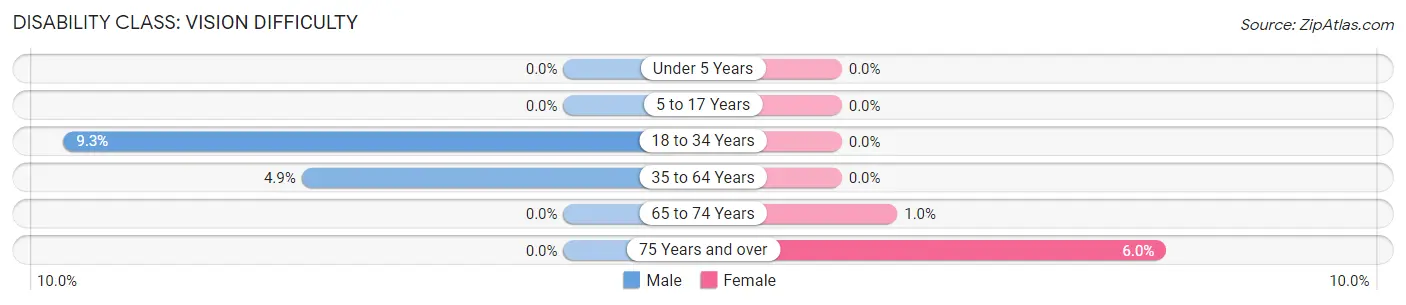
| Age Bracket | Male | Female |
| Under 5 Years | 0 (0.0%) | 0 (0.0%) |
| 5 to 17 Years | 0 (0.0%) | 0 (0.0%) |
| 18 to 34 Years | 18 (9.3%) | 0 (0.0%) |
| 35 to 64 Years | 27 (4.9%) | 0 (0.0%) |
| 65 to 74 Years | 0 (0.0%) | 2 (1.0%) |
| 75 Years and over | 0 (0.0%) | 5 (6.0%) |
Disability Class: Cognitive Difficulty
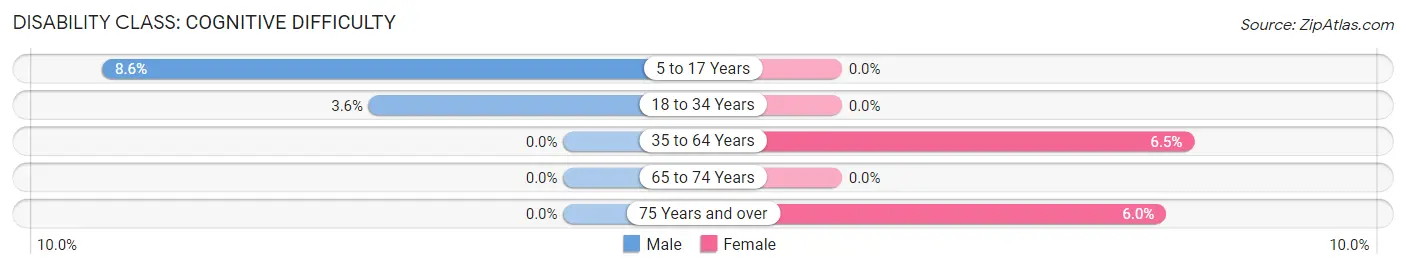
| Age Bracket | Male | Female |
| 5 to 17 Years | 16 (8.6%) | 0 (0.0%) |
| 18 to 34 Years | 7 (3.6%) | 0 (0.0%) |
| 35 to 64 Years | 0 (0.0%) | 41 (6.5%) |
| 65 to 74 Years | 0 (0.0%) | 0 (0.0%) |
| 75 Years and over | 0 (0.0%) | 5 (6.0%) |
Disability Class: Ambulatory Difficulty
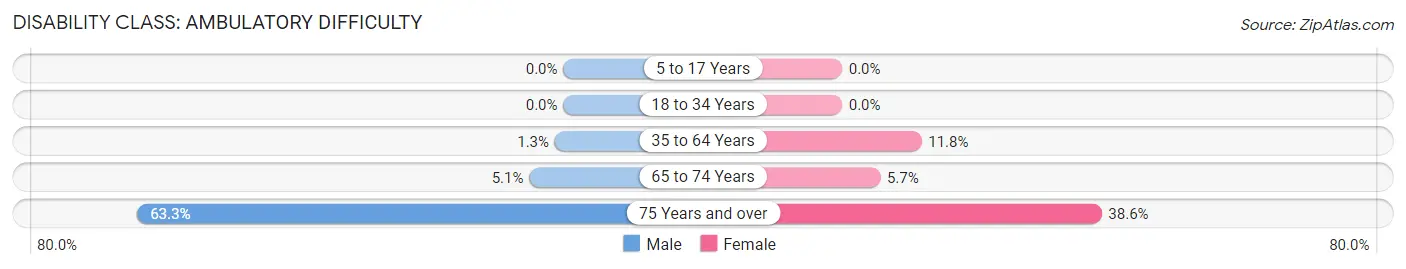
| Age Bracket | Male | Female |
| 5 to 17 Years | 0 (0.0%) | 0 (0.0%) |
| 18 to 34 Years | 0 (0.0%) | 0 (0.0%) |
| 35 to 64 Years | 7 (1.3%) | 74 (11.8%) |
| 65 to 74 Years | 4 (5.1%) | 11 (5.7%) |
| 75 Years and over | 31 (63.3%) | 32 (38.6%) |
Disability Class: Self-Care Difficulty
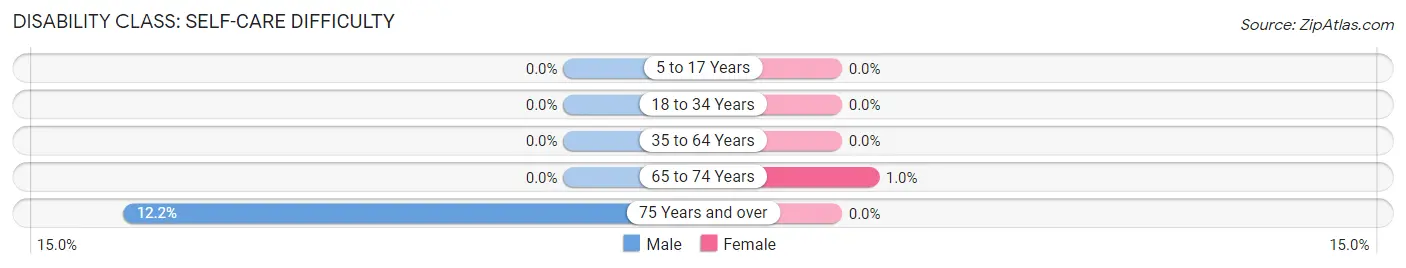
| Age Bracket | Male | Female |
| 5 to 17 Years | 0 (0.0%) | 0 (0.0%) |
| 18 to 34 Years | 0 (0.0%) | 0 (0.0%) |
| 35 to 64 Years | 0 (0.0%) | 0 (0.0%) |
| 65 to 74 Years | 0 (0.0%) | 2 (1.0%) |
| 75 Years and over | 6 (12.2%) | 0 (0.0%) |
Technology Access in Aspinwall borough
Computing Device Access in Aspinwall borough
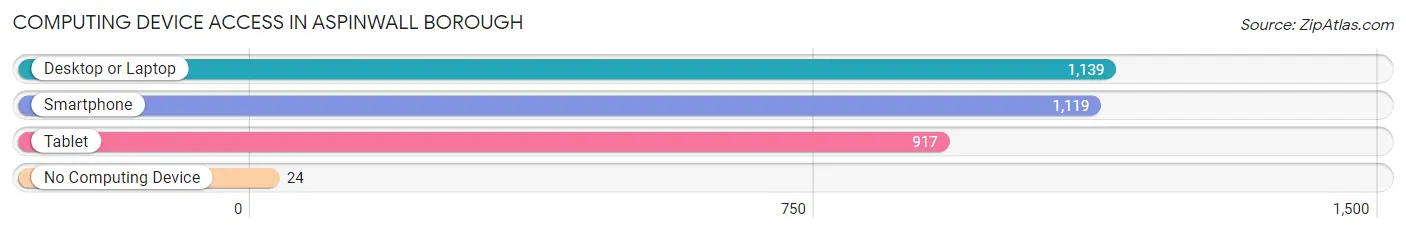
| Device Type | # Households | % Households |
| Desktop or Laptop | 1,139 | 93.2% |
| Smartphone | 1,119 | 91.6% |
| Tablet | 917 | 75.0% |
| No Computing Device | 24 | 2.0% |
| Total | 1,222 | 100.0% |
Internet Access in Aspinwall borough
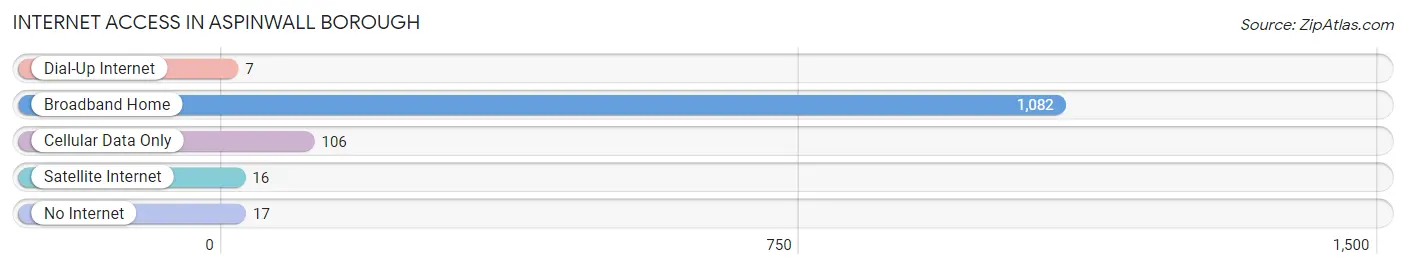
| Internet Type | # Households | % Households |
| Dial-Up Internet | 7 | 0.6% |
| Broadband Home | 1,082 | 88.5% |
| Cellular Data Only | 106 | 8.7% |
| Satellite Internet | 16 | 1.3% |
| No Internet | 17 | 1.4% |
| Total | 1,222 | 100.0% |
Aspinwall borough Summary
Aspinwall Borough is a small borough located in Allegheny County, Pennsylvania. It is situated along the Allegheny River, just north of the City of Pittsburgh. Aspinwall is a small, residential community with a population of just over 2,000 people.
History
Aspinwall Borough was founded in 1892 by William Aspinwall, a wealthy Pittsburgh businessman. He purchased the land from the local Native American tribes and named the area after himself. Aspinwall was originally a farming community, but it quickly grew into a residential area as the population of Pittsburgh increased. In the early 1900s, Aspinwall was a popular summer destination for wealthy Pittsburghers. The borough was incorporated in 1906 and has remained a small, residential community ever since.
Geography
Aspinwall Borough is located in Allegheny County, Pennsylvania. It is situated along the Allegheny River, just north of the City of Pittsburgh. The borough is bordered by the boroughs of Sharpsburg and Etna, as well as the townships of O’Hara and Indiana. Aspinwall is a small, residential community with a total area of 0.7 square miles. The terrain is mostly flat, with some hills in the northern part of the borough.
Economy
Aspinwall Borough has a small, local economy. The majority of the borough’s residents are employed in the service industry, with many working in the nearby City of Pittsburgh. There are also a few small businesses located in the borough, including restaurants, retail stores, and professional services.
Demographics
As of the 2010 census, Aspinwall Borough had a population of 2,072 people. The racial makeup of the borough was 94.3% White, 2.3% African American, 0.3% Native American, 0.7% Asian, and 2.4% from other races. The median household income was $50,945, and the median family income was $60,945. The per capita income was $25,945.
Conclusion
Aspinwall Borough is a small, residential community located in Allegheny County, Pennsylvania. It was founded in 1892 by William Aspinwall and has remained a small, residential community ever since. Aspinwall is situated along the Allegheny River, just north of the City of Pittsburgh. The borough has a small, local economy and a population of just over 2,000 people. The majority of the borough’s residents are employed in the service industry, with many working in the nearby City of Pittsburgh.
Common Questions
What is Per Capita Income in Aspinwall borough?
Per Capita income in Aspinwall borough is $61,443.
What is the Median Family Income in Aspinwall borough?
Median Family Income in Aspinwall borough is $155,795.
What is the Median Household income in Aspinwall borough?
Median Household Income in Aspinwall borough is $107,738.
What is Income or Wage Gap in Aspinwall borough?
Income or Wage Gap in Aspinwall borough is 43.9%.
Women in Aspinwall borough earn 56.1 cents for every dollar earned by a man.
What is Inequality or Gini Index in Aspinwall borough?
Inequality or Gini Index in Aspinwall borough is 0.47.
What is the Total Population of Aspinwall borough?
Total Population of Aspinwall borough is 2,890.
What is the Total Male Population of Aspinwall borough?
Total Male Population of Aspinwall borough is 1,262.
What is the Total Female Population of Aspinwall borough?
Total Female Population of Aspinwall borough is 1,628.
What is the Ratio of Males per 100 Females in Aspinwall borough?
There are 77.52 Males per 100 Females in Aspinwall borough.
What is the Ratio of Females per 100 Males in Aspinwall borough?
There are 129.00 Females per 100 Males in Aspinwall borough.
What is the Median Population Age in Aspinwall borough?
Median Population Age in Aspinwall borough is 35.8 Years.
What is the Average Family Size in Aspinwall borough
Average Family Size in Aspinwall borough is 3.1 People.
What is the Average Household Size in Aspinwall borough
Average Household Size in Aspinwall borough is 2.4 People.
How Large is the Labor Force in Aspinwall borough?
There are 1,528 People in the Labor Forcein in Aspinwall borough.
What is the Percentage of People in the Labor Force in Aspinwall borough?
73.6% of People are in the Labor Force in Aspinwall borough.
What is the Unemployment Rate in Aspinwall borough?
Unemployment Rate in Aspinwall borough is 3.0%.