Hatfield borough, PA Map & Demographics
Hatfield borough Overview
$32,035
PER CAPITA INCOME
$89,286
AVG FAMILY INCOME
$65,257
AVG HOUSEHOLD INCOME
16.4%
WAGE / INCOME GAP [ % ]
83.6¢/ $1
WAGE / INCOME GAP [ $ ]
0.41
INEQUALITY / GINI INDEX
3,490
TOTAL POPULATION
1,571
MALE POPULATION
1,919
FEMALE POPULATION
81.87
MALES / 100 FEMALES
122.15
FEMALES / 100 MALES
35.0
MEDIAN AGE
3.3
AVG FAMILY SIZE
2.5
AVG HOUSEHOLD SIZE
1,996
LABOR FORCE [ PEOPLE ]
71.7%
PERCENT IN LABOR FORCE
4.2%
UNEMPLOYMENT RATE
Income in Hatfield borough
Income Overview in Hatfield borough
Per Capita Income in Hatfield borough is $32,035, while median incomes of families and households are $89,286 and $65,257 respectively.
| Characteristic | Number | Measure |
| Per Capita Income | 3,490 | $32,035 |
| Median Family Income | 794 | $89,286 |
| Mean Family Income | 794 | $100,300 |
| Median Household Income | 1,407 | $65,257 |
| Mean Household Income | 1,407 | $80,569 |
| Income Deficit | 794 | $0 |
| Wage / Income Gap (%) | 3,490 | 16.37% |
| Wage / Income Gap ($) | 3,490 | 83.63¢ per $1 |
| Gini / Inequality Index | 3,490 | 0.41 |
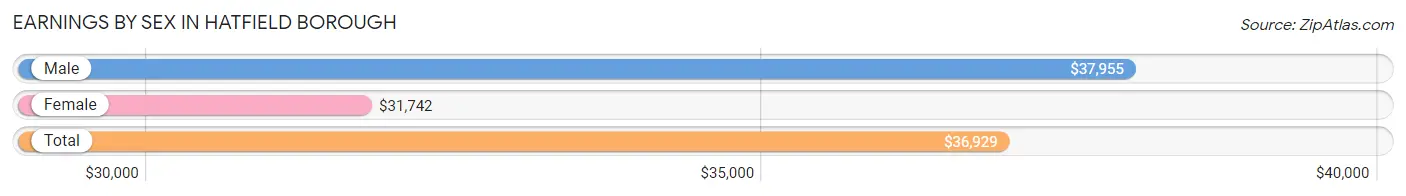
Earnings by Sex in Hatfield borough
Average Earnings in Hatfield borough are $36,929, $37,955 for men and $31,742 for women, a difference of 16.4%.
| Sex | Number | Average Earnings |
| Male | 1,066 (52.1%) | $37,955 |
| Female | 979 (47.9%) | $31,742 |
| Total | 2,045 (100.0%) | $36,929 |
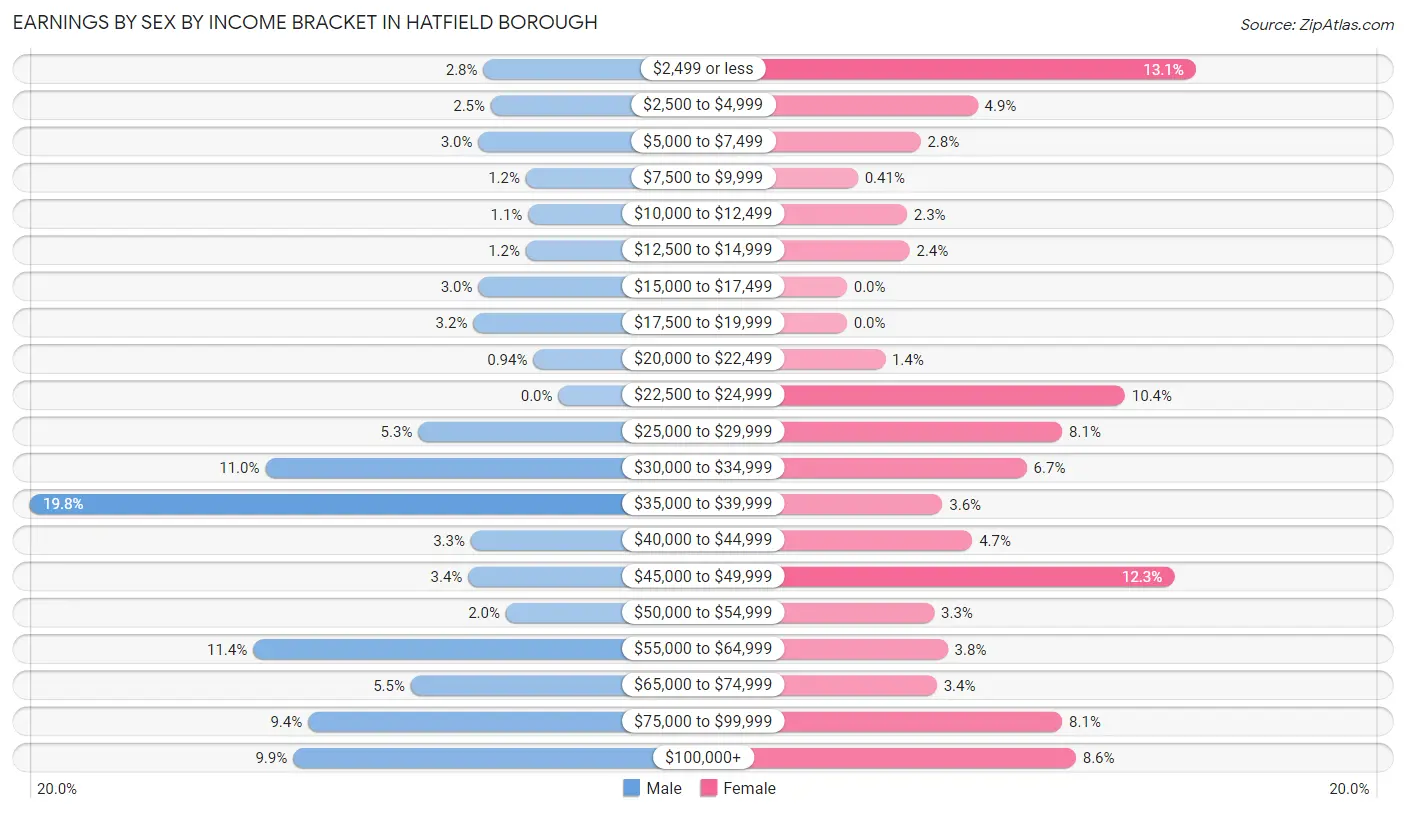
Earnings by Sex by Income Bracket in Hatfield borough
The most common earnings brackets in Hatfield borough are $35,000 to $39,999 for men (211 | 19.8%) and $2,499 or less for women (128 | 13.1%).
| Income | Male | Female |
| $2,499 or less | 30 (2.8%) | 128 (13.1%) |
| $2,500 to $4,999 | 27 (2.5%) | 48 (4.9%) |
| $5,000 to $7,499 | 32 (3.0%) | 27 (2.8%) |
| $7,500 to $9,999 | 13 (1.2%) | 4 (0.4%) |
| $10,000 to $12,499 | 12 (1.1%) | 22 (2.2%) |
| $12,500 to $14,999 | 13 (1.2%) | 23 (2.4%) |
| $15,000 to $17,499 | 32 (3.0%) | 0 (0.0%) |
| $17,500 to $19,999 | 34 (3.2%) | 0 (0.0%) |
| $20,000 to $22,499 | 10 (0.9%) | 14 (1.4%) |
| $22,500 to $24,999 | 0 (0.0%) | 102 (10.4%) |
| $25,000 to $29,999 | 56 (5.2%) | 79 (8.1%) |
| $30,000 to $34,999 | 117 (11.0%) | 66 (6.7%) |
| $35,000 to $39,999 | 211 (19.8%) | 35 (3.6%) |
| $40,000 to $44,999 | 35 (3.3%) | 46 (4.7%) |
| $45,000 to $49,999 | 36 (3.4%) | 120 (12.3%) |
| $50,000 to $54,999 | 21 (2.0%) | 32 (3.3%) |
| $55,000 to $64,999 | 122 (11.4%) | 37 (3.8%) |
| $65,000 to $74,999 | 59 (5.5%) | 33 (3.4%) |
| $75,000 to $99,999 | 100 (9.4%) | 79 (8.1%) |
| $100,000+ | 106 (9.9%) | 84 (8.6%) |
| Total | 1,066 (100.0%) | 979 (100.0%) |
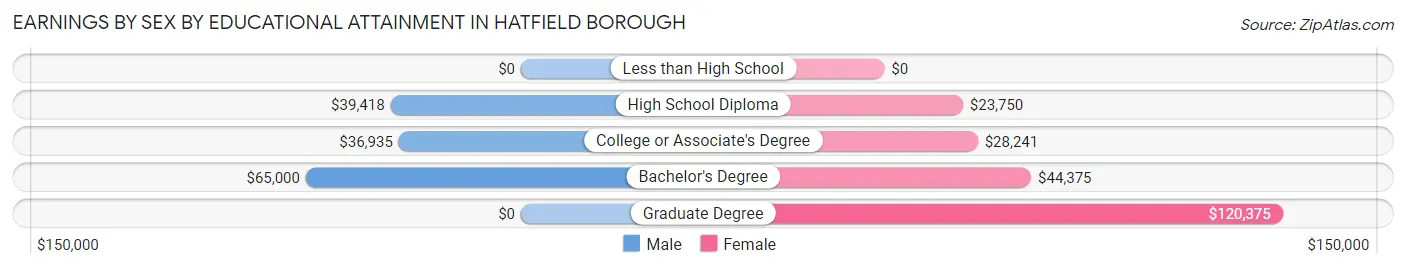
Earnings by Sex by Educational Attainment in Hatfield borough
Average earnings in Hatfield borough are $39,508 for men and $39,107 for women, a difference of 1.0%. Men with an educational attainment of bachelor's degree enjoy the highest average annual earnings of $65,000, while those with college or associate's degree education earn the least with $36,935. Women with an educational attainment of graduate degree earn the most with the average annual earnings of $120,375, while those with high school diploma education have the smallest earnings of $23,750.
| Educational Attainment | Male Income | Female Income |
| Less than High School | - | - |
| High School Diploma | $39,418 | $23,750 |
| College or Associate's Degree | $36,935 | $28,241 |
| Bachelor's Degree | $65,000 | $44,375 |
| Graduate Degree | - | - |
| Total | $39,508 | $39,107 |
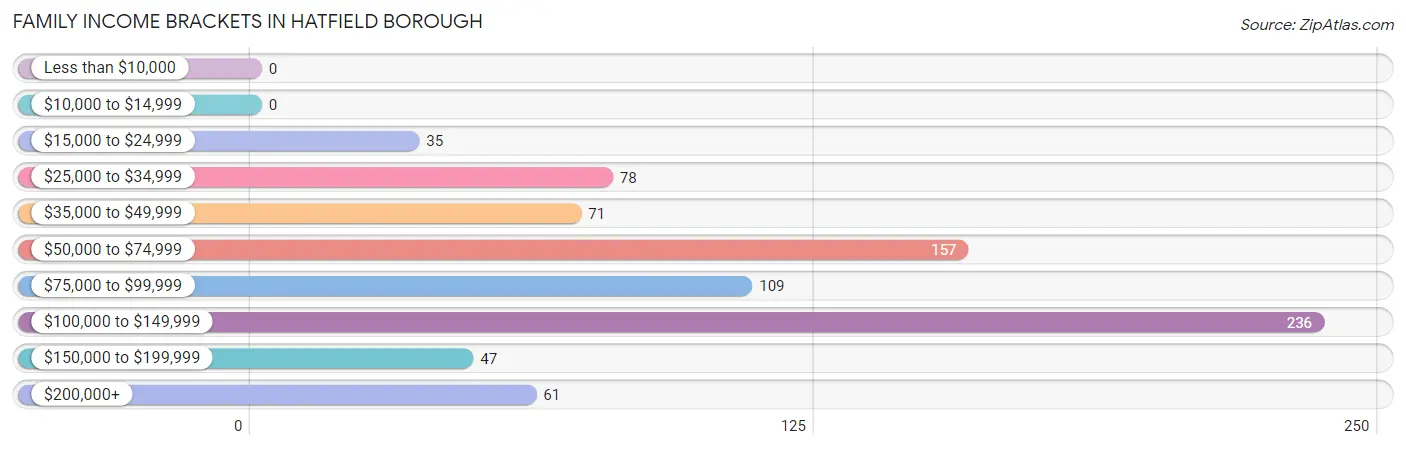
Family Income in Hatfield borough
Family Income Brackets in Hatfield borough
According to the Hatfield borough family income data, there are 236 families falling into the $100,000 to $149,999 income range, which is the most common income bracket and makes up 29.7% of all families.
| Income Bracket | # Families | % Families |
| Less than $10,000 | 0 | 0.0% |
| $10,000 to $14,999 | 0 | 0.0% |
| $15,000 to $24,999 | 35 | 4.4% |
| $25,000 to $34,999 | 78 | 9.8% |
| $35,000 to $49,999 | 71 | 8.9% |
| $50,000 to $74,999 | 157 | 19.8% |
| $75,000 to $99,999 | 109 | 13.7% |
| $100,000 to $149,999 | 236 | 29.7% |
| $150,000 to $199,999 | 47 | 5.9% |
| $200,000+ | 61 | 7.7% |
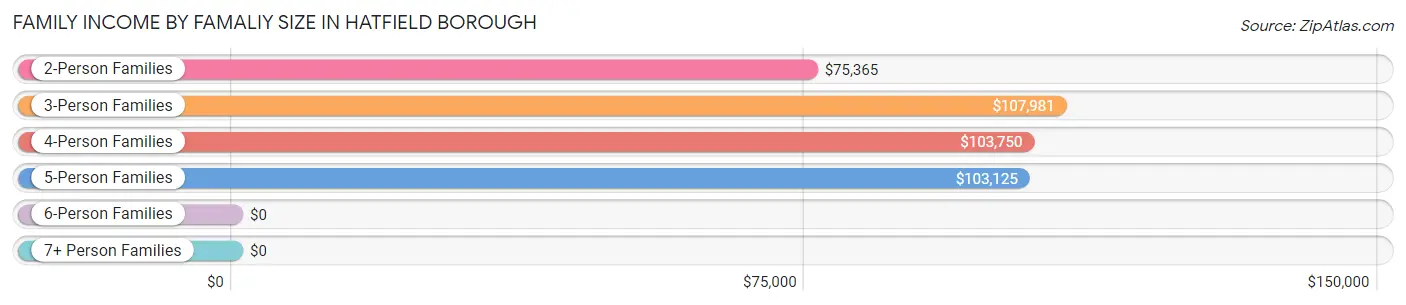
Family Income by Famaliy Size in Hatfield borough
3-person families (85 | 10.7%) account for the highest median family income in Hatfield borough with $107,981 per family, while 2-person families (317 | 39.9%) have the highest median income of $37,682 per family member.
| Income Bracket | # Families | Median Income |
| 2-Person Families | 317 (39.9%) | $75,365 |
| 3-Person Families | 85 (10.7%) | $107,981 |
| 4-Person Families | 332 (41.8%) | $103,750 |
| 5-Person Families | 60 (7.6%) | $103,125 |
| 6-Person Families | 0 (0.0%) | $0 |
| 7+ Person Families | 0 (0.0%) | $0 |
| Total | 794 (100.0%) | $89,286 |
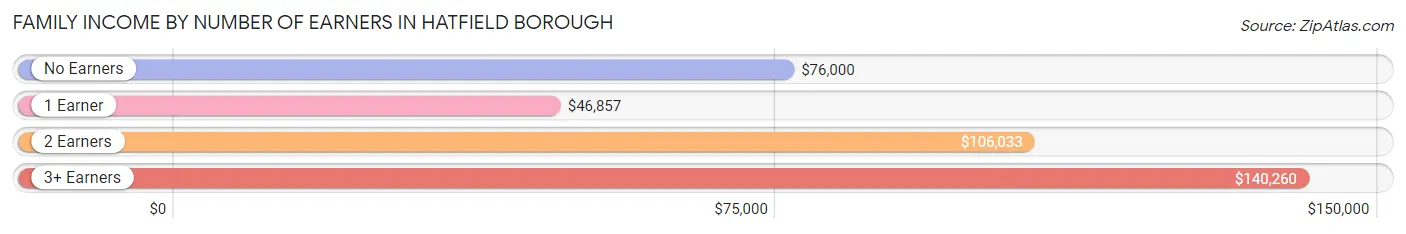
Family Income by Number of Earners in Hatfield borough
The median family income in Hatfield borough is $89,286, with families comprising 3+ earners (105) having the highest median family income of $140,260, while families with 1 earner (270) have the lowest median family income of $46,857, accounting for 13.2% and 34.0% of families, respectively.
| Number of Earners | # Families | Median Income |
| No Earners | 22 (2.8%) | $76,000 |
| 1 Earner | 270 (34.0%) | $46,857 |
| 2 Earners | 397 (50.0%) | $106,033 |
| 3+ Earners | 105 (13.2%) | $140,260 |
| Total | 794 (100.0%) | $89,286 |
Household Income in Hatfield borough
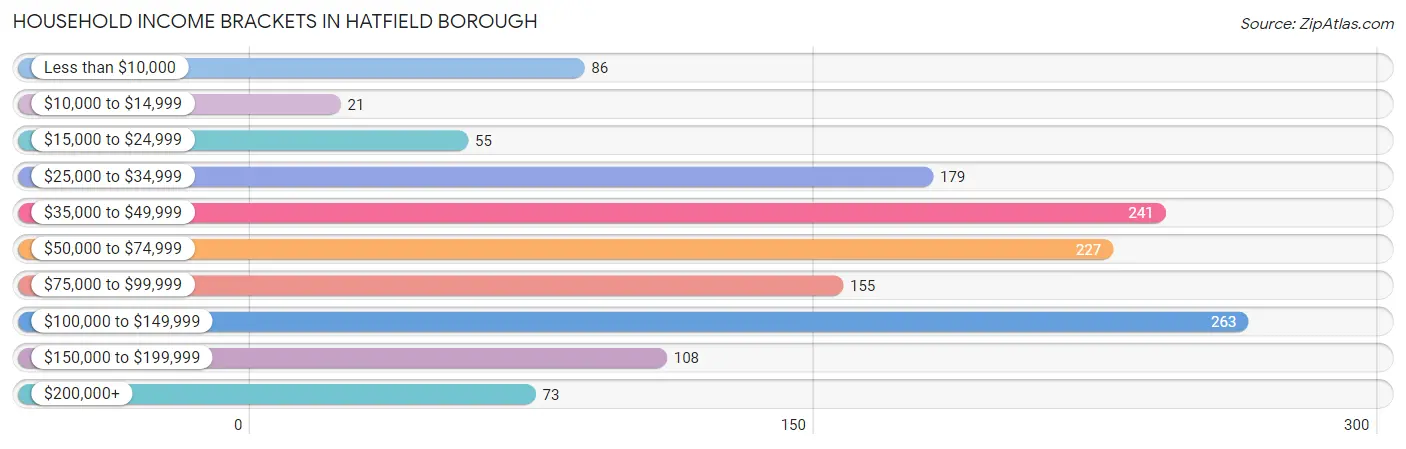
Household Income Brackets in Hatfield borough
With 263 households falling in the category, the $100,000 to $149,999 income range is the most frequent in Hatfield borough, accounting for 18.7% of all households. In contrast, only 21 households (1.5%) fall into the $10,000 to $14,999 income bracket, making it the least populous group.
| Income Bracket | # Households | % Households |
| Less than $10,000 | 86 | 6.1% |
| $10,000 to $14,999 | 21 | 1.5% |
| $15,000 to $24,999 | 55 | 3.9% |
| $25,000 to $34,999 | 179 | 12.7% |
| $35,000 to $49,999 | 241 | 17.1% |
| $50,000 to $74,999 | 227 | 16.1% |
| $75,000 to $99,999 | 155 | 11.0% |
| $100,000 to $149,999 | 263 | 18.7% |
| $150,000 to $199,999 | 108 | 7.7% |
| $200,000+ | 73 | 5.2% |
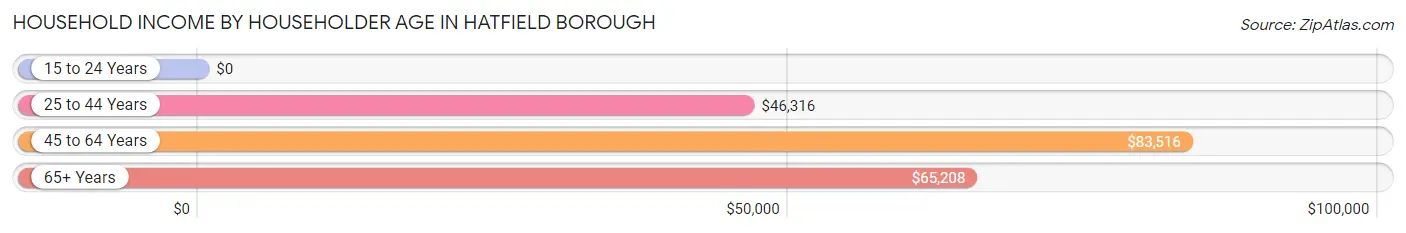
Household Income by Householder Age in Hatfield borough
The median household income in Hatfield borough is $65,257, with the highest median household income of $83,516 found in the 45 to 64 years age bracket for the primary householder. A total of 463 households (32.9%) fall into this category. Meanwhile, the 15 to 24 years age bracket for the primary householder has the lowest median household income of $0, with 9 households (0.6%) in this group.
| Income Bracket | # Households | Median Income |
| 15 to 24 Years | 9 (0.6%) | $0 |
| 25 to 44 Years | 662 (47.0%) | $46,316 |
| 45 to 64 Years | 463 (32.9%) | $83,516 |
| 65+ Years | 273 (19.4%) | $65,208 |
| Total | 1,407 (100.0%) | $65,257 |
Poverty in Hatfield borough
Income Below Poverty by Sex and Age in Hatfield borough
With 3.9% poverty level for males and 9.2% for females among the residents of Hatfield borough, 55 to 64 year old males and 75 year old and over females are the most vulnerable to poverty, with 35 males (18.6%) and 10 females (21.7%) in their respective age groups living below the poverty level.
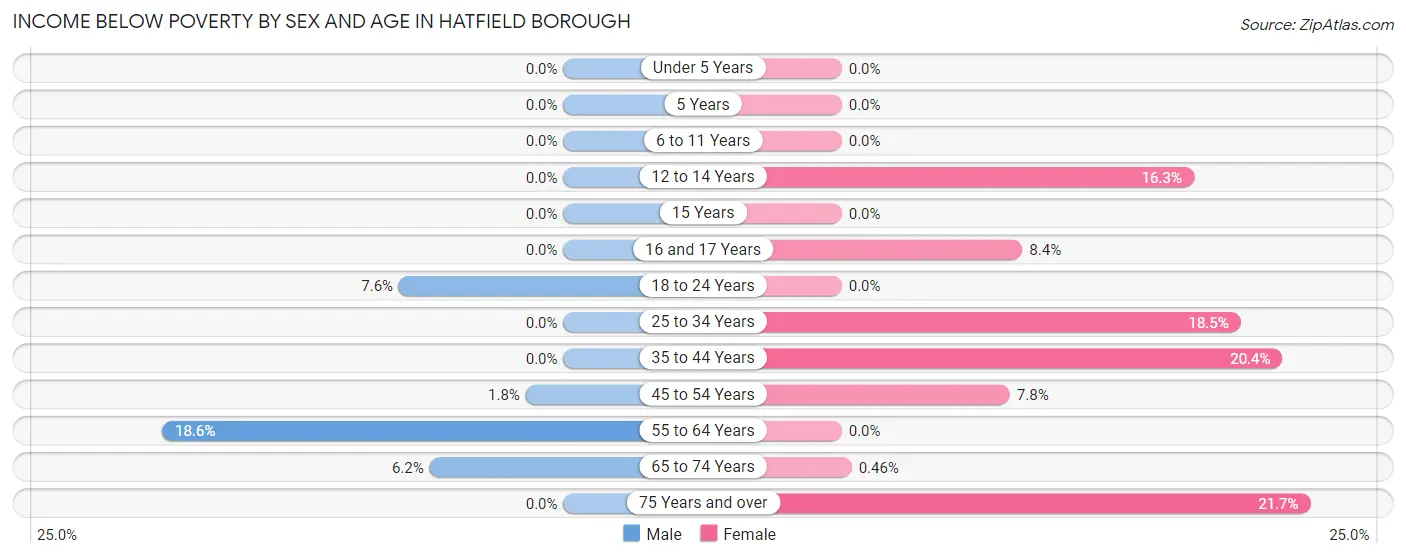
| Age Bracket | Male | Female |
| Under 5 Years | 0 (0.0%) | 0 (0.0%) |
| 5 Years | 0 (0.0%) | 0 (0.0%) |
| 6 to 11 Years | 0 (0.0%) | 0 (0.0%) |
| 12 to 14 Years | 0 (0.0%) | 32 (16.3%) |
| 15 Years | 0 (0.0%) | 0 (0.0%) |
| 16 and 17 Years | 0 (0.0%) | 16 (8.4%) |
| 18 to 24 Years | 9 (7.6%) | 0 (0.0%) |
| 25 to 34 Years | 0 (0.0%) | 64 (18.5%) |
| 35 to 44 Years | 0 (0.0%) | 37 (20.4%) |
| 45 to 54 Years | 4 (1.8%) | 17 (7.8%) |
| 55 to 64 Years | 35 (18.6%) | 0 (0.0%) |
| 65 to 74 Years | 10 (6.2%) | 1 (0.5%) |
| 75 Years and over | 0 (0.0%) | 10 (21.7%) |
| Total | 58 (3.9%) | 177 (9.2%) |
Income Above Poverty by Sex and Age in Hatfield borough
According to the poverty statistics in Hatfield borough, males aged under 5 years and females aged under 5 years are the age groups that are most secure financially, with 100.0% of males and 100.0% of females in these age groups living above the poverty line.
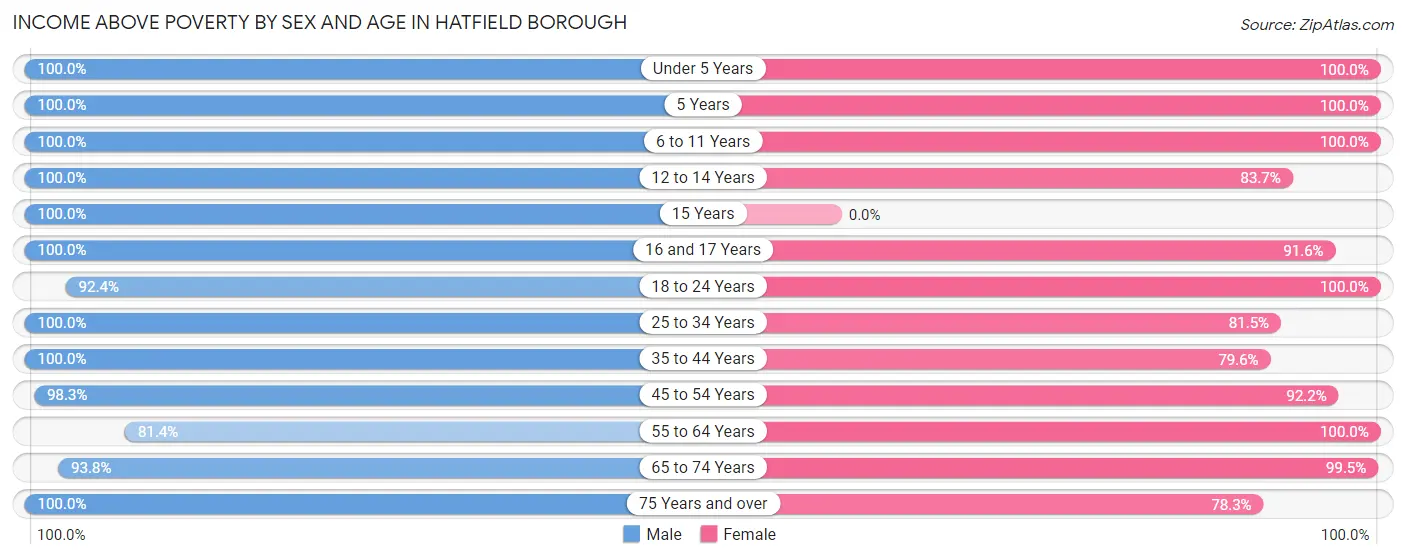
| Age Bracket | Male | Female |
| Under 5 Years | 24 (100.0%) | 97 (100.0%) |
| 5 Years | 44 (100.0%) | 4 (100.0%) |
| 6 to 11 Years | 72 (100.0%) | 145 (100.0%) |
| 12 to 14 Years | 45 (100.0%) | 164 (83.7%) |
| 15 Years | 15 (100.0%) | 0 (0.0%) |
| 16 and 17 Years | 5 (100.0%) | 175 (91.6%) |
| 18 to 24 Years | 109 (92.4%) | 102 (100.0%) |
| 25 to 34 Years | 278 (100.0%) | 282 (81.5%) |
| 35 to 44 Years | 253 (100.0%) | 144 (79.6%) |
| 45 to 54 Years | 224 (98.3%) | 201 (92.2%) |
| 55 to 64 Years | 153 (81.4%) | 174 (100.0%) |
| 65 to 74 Years | 151 (93.8%) | 218 (99.5%) |
| 75 Years and over | 71 (100.0%) | 36 (78.3%) |
| Total | 1,444 (96.1%) | 1,742 (90.8%) |
Income Below Poverty Among Married-Couple Families in Hatfield borough
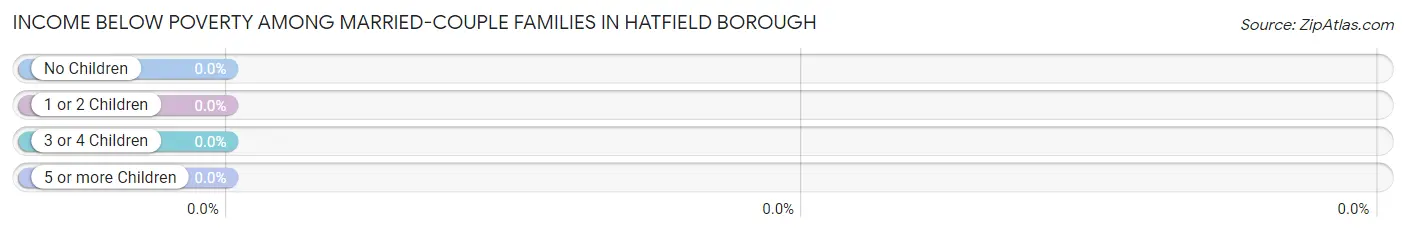
| Children | Above Poverty | Below Poverty |
| No Children | 280 (100.0%) | 0 (0.0%) |
| 1 or 2 Children | 243 (100.0%) | 0 (0.0%) |
| 3 or 4 Children | 24 (100.0%) | 0 (0.0%) |
| 5 or more Children | 0 (0.0%) | 0 (0.0%) |
| Total | 547 (100.0%) | 0 (0.0%) |
Income Below Poverty Among Single-Parent Households in Hatfield borough
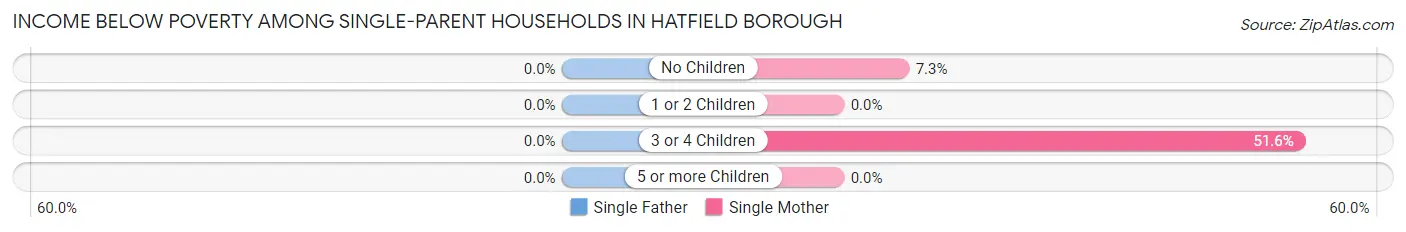
| Children | Single Father | Single Mother |
| No Children | 0 (0.0%) | 4 (7.3%) |
| 1 or 2 Children | 0 (0.0%) | 0 (0.0%) |
| 3 or 4 Children | 0 (0.0%) | 16 (51.6%) |
| 5 or more Children | 0 (0.0%) | 0 (0.0%) |
| Total | 0 (0.0%) | 20 (14.3%) |
Income Below Poverty Among Married-Couple vs Single-Parent Households in Hatfield borough
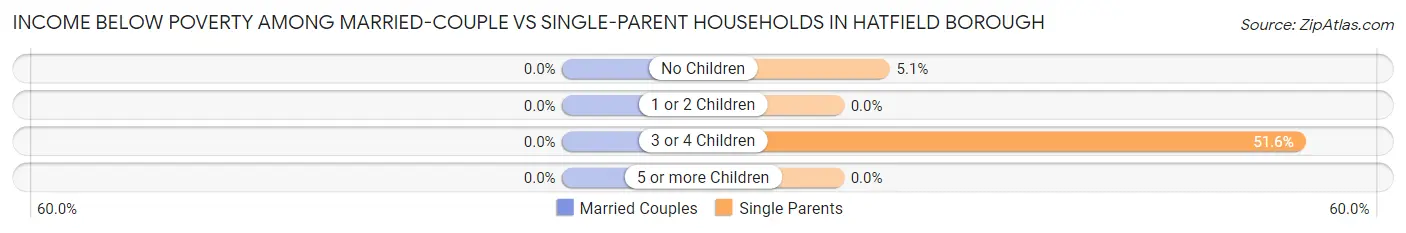
| Children | Married-Couple Families | Single-Parent Households |
| No Children | 0 (0.0%) | 4 (5.1%) |
| 1 or 2 Children | 0 (0.0%) | 0 (0.0%) |
| 3 or 4 Children | 0 (0.0%) | 16 (51.6%) |
| 5 or more Children | 0 (0.0%) | 0 (0.0%) |
| Total | 0 (0.0%) | 20 (8.1%) |
Race in Hatfield borough
The most populous races in Hatfield borough are White / Caucasian (2,058 | 59.0%), Asian (915 | 26.2%), and Two or more Races (278 | 8.0%).
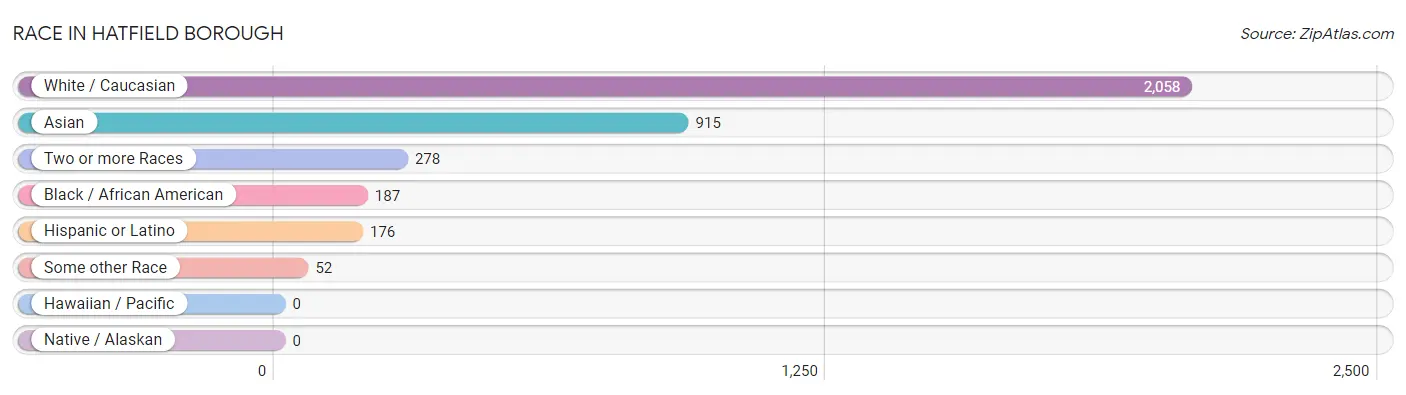
| Race | # Population | % Population |
| Asian | 915 | 26.2% |
| Black / African American | 187 | 5.4% |
| Hawaiian / Pacific | 0 | 0.0% |
| Hispanic or Latino | 176 | 5.0% |
| Native / Alaskan | 0 | 0.0% |
| White / Caucasian | 2,058 | 59.0% |
| Two or more Races | 278 | 8.0% |
| Some other Race | 52 | 1.5% |
| Total | 3,490 | 100.0% |
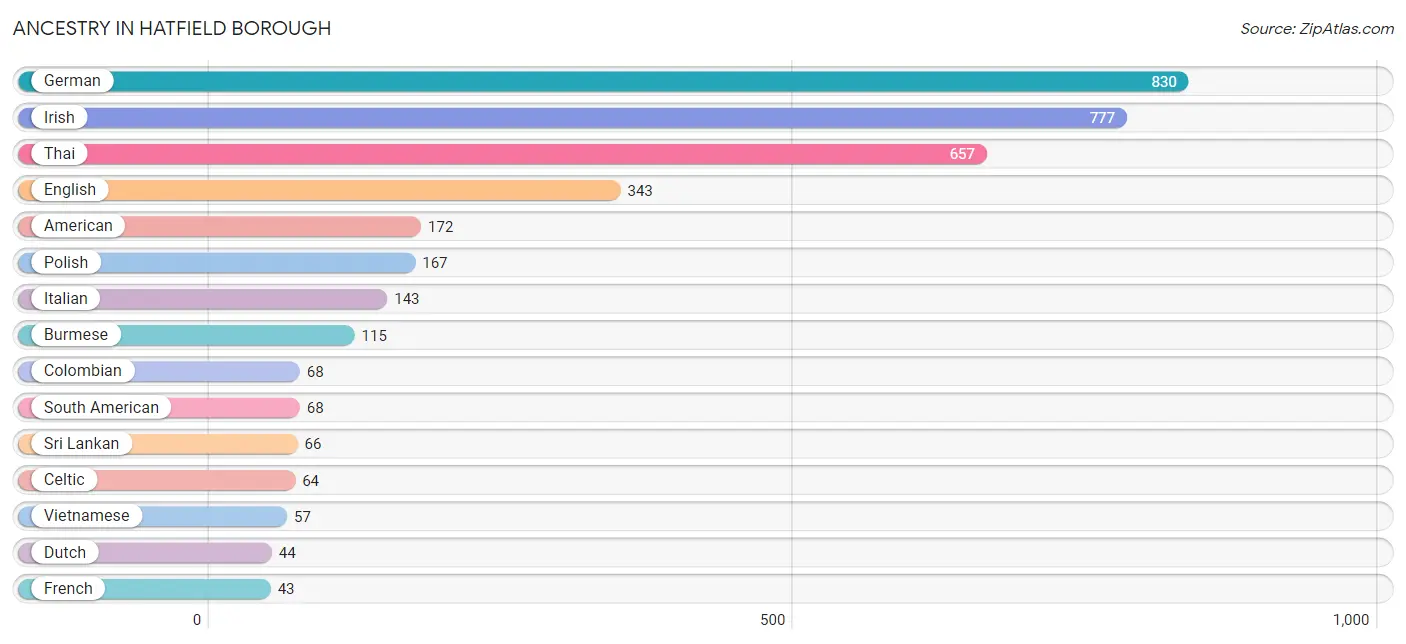
Ancestry in Hatfield borough
The most populous ancestries reported in Hatfield borough are German (830 | 23.8%), Irish (777 | 22.3%), Thai (657 | 18.8%), English (343 | 9.8%), and American (172 | 4.9%), together accounting for 79.6% of all Hatfield borough residents.
| Ancestry | # Population | % Population |
| African | 3 | 0.1% |
| American | 172 | 4.9% |
| Burmese | 115 | 3.3% |
| Celtic | 64 | 1.8% |
| Colombian | 68 | 1.9% |
| Cuban | 32 | 0.9% |
| Dominican | 14 | 0.4% |
| Dutch | 44 | 1.3% |
| English | 343 | 9.8% |
| French | 43 | 1.2% |
| German | 830 | 23.8% |
| Greek | 5 | 0.1% |
| Hungarian | 13 | 0.4% |
| Irish | 777 | 22.3% |
| Italian | 143 | 4.1% |
| Latvian | 12 | 0.3% |
| Lithuanian | 5 | 0.1% |
| Mexican | 14 | 0.4% |
| Nigerian | 23 | 0.7% |
| Pennsylvania German | 6 | 0.2% |
| Polish | 167 | 4.8% |
| Puerto Rican | 43 | 1.2% |
| Russian | 12 | 0.3% |
| Scotch-Irish | 12 | 0.3% |
| Scottish | 38 | 1.1% |
| Slovak | 13 | 0.4% |
| South American | 68 | 1.9% |
| Sri Lankan | 66 | 1.9% |
| Subsaharan African | 26 | 0.7% |
| Swedish | 9 | 0.3% |
| Thai | 657 | 18.8% |
| Ukrainian | 14 | 0.4% |
| Vietnamese | 57 | 1.6% | View All 33 Rows |
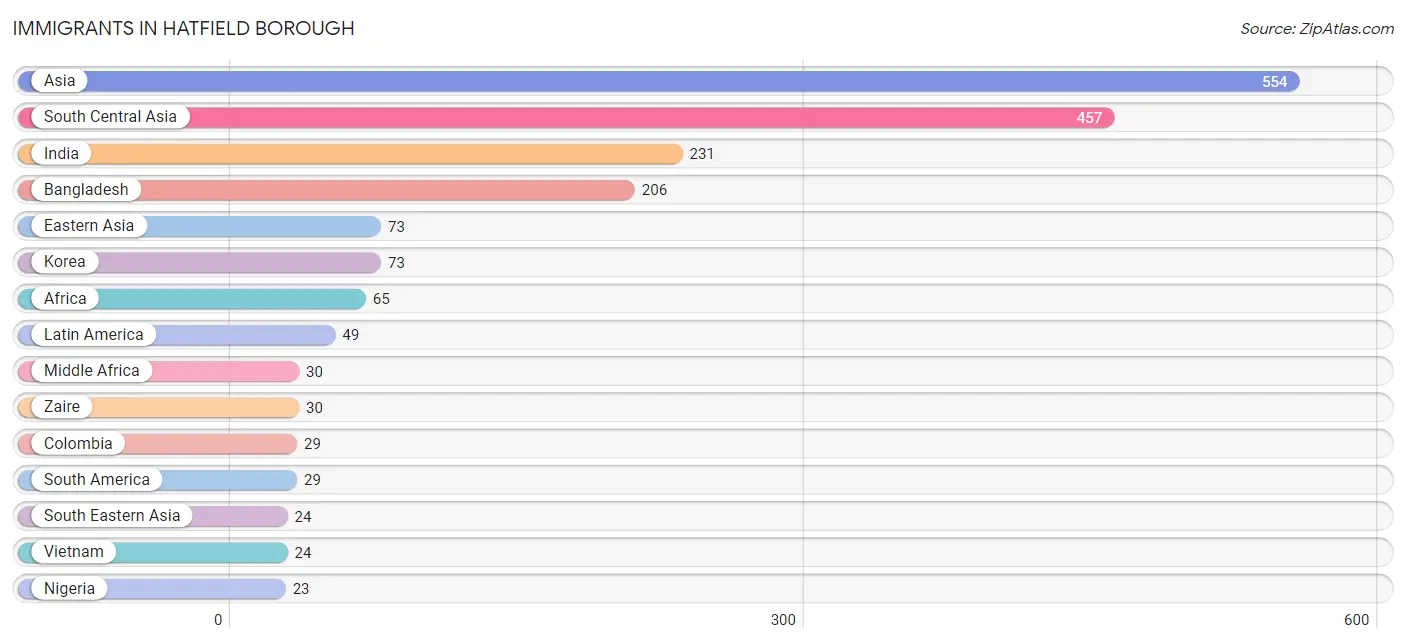
Immigrants in Hatfield borough
The most numerous immigrant groups reported in Hatfield borough came from Asia (554 | 15.9%), South Central Asia (457 | 13.1%), India (231 | 6.6%), Bangladesh (206 | 5.9%), and Eastern Asia (73 | 2.1%), together accounting for 43.6% of all Hatfield borough residents.
| Immigration Origin | # Population | % Population |
| Africa | 65 | 1.9% |
| Asia | 554 | 15.9% |
| Bangladesh | 206 | 5.9% |
| Caribbean | 14 | 0.4% |
| Central America | 6 | 0.2% |
| Colombia | 29 | 0.8% |
| Dominican Republic | 14 | 0.4% |
| Eastern Asia | 73 | 2.1% |
| Eastern Europe | 12 | 0.3% |
| Europe | 12 | 0.3% |
| India | 231 | 6.6% |
| Korea | 73 | 2.1% |
| Latin America | 49 | 1.4% |
| Latvia | 12 | 0.3% |
| Mexico | 6 | 0.2% |
| Middle Africa | 30 | 0.9% |
| Nigeria | 23 | 0.7% |
| Northern Africa | 12 | 0.3% |
| Pakistan | 20 | 0.6% |
| South America | 29 | 0.8% |
| South Central Asia | 457 | 13.1% |
| South Eastern Asia | 24 | 0.7% |
| Vietnam | 24 | 0.7% |
| Western Africa | 23 | 0.7% |
| Zaire | 30 | 0.9% | View All 25 Rows |
Sex and Age in Hatfield borough
Sex and Age in Hatfield borough
The most populous age groups in Hatfield borough are 30 to 34 Years (158 | 10.1%) for men and 15 to 19 Years (245 | 12.8%) for women.
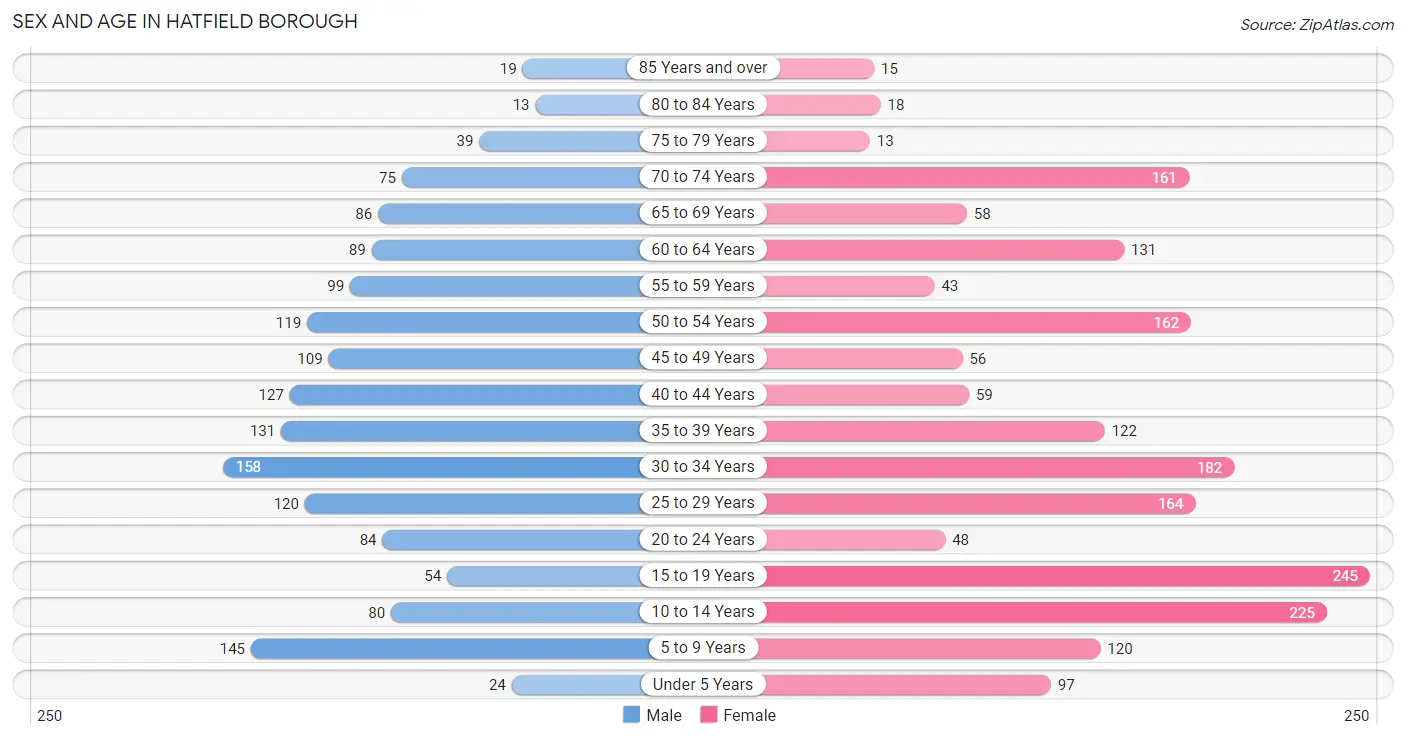
| Age Bracket | Male | Female |
| Under 5 Years | 24 (1.5%) | 97 (5.1%) |
| 5 to 9 Years | 145 (9.2%) | 120 (6.2%) |
| 10 to 14 Years | 80 (5.1%) | 225 (11.7%) |
| 15 to 19 Years | 54 (3.4%) | 245 (12.8%) |
| 20 to 24 Years | 84 (5.3%) | 48 (2.5%) |
| 25 to 29 Years | 120 (7.6%) | 164 (8.6%) |
| 30 to 34 Years | 158 (10.1%) | 182 (9.5%) |
| 35 to 39 Years | 131 (8.3%) | 122 (6.4%) |
| 40 to 44 Years | 127 (8.1%) | 59 (3.1%) |
| 45 to 49 Years | 109 (6.9%) | 56 (2.9%) |
| 50 to 54 Years | 119 (7.6%) | 162 (8.4%) |
| 55 to 59 Years | 99 (6.3%) | 43 (2.2%) |
| 60 to 64 Years | 89 (5.7%) | 131 (6.8%) |
| 65 to 69 Years | 86 (5.5%) | 58 (3.0%) |
| 70 to 74 Years | 75 (4.8%) | 161 (8.4%) |
| 75 to 79 Years | 39 (2.5%) | 13 (0.7%) |
| 80 to 84 Years | 13 (0.8%) | 18 (0.9%) |
| 85 Years and over | 19 (1.2%) | 15 (0.8%) |
| Total | 1,571 (100.0%) | 1,919 (100.0%) |
Families and Households in Hatfield borough
Median Family Size in Hatfield borough
The median family size in Hatfield borough is 3.29 persons per family, with single male/father families (107 | 13.5%) accounting for the largest median family size of 3.83 persons per family. On the other hand, single female/mother families (140 | 17.6%) represent the smallest median family size with 2.86 persons per family.
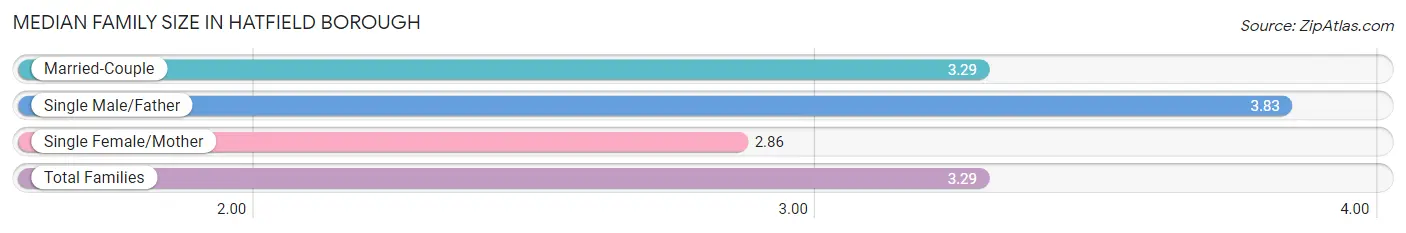
| Family Type | # Families | Family Size |
| Married-Couple | 547 (68.9%) | 3.29 |
| Single Male/Father | 107 (13.5%) | 3.83 |
| Single Female/Mother | 140 (17.6%) | 2.86 |
| Total Families | 794 (100.0%) | 3.29 |
Median Household Size in Hatfield borough
The median household size in Hatfield borough is 2.47 persons per household, with single male/father households (107 | 7.6%) accounting for the largest median household size of 4.02 persons per household. non-family households (613 | 43.6%) represent the smallest median household size with 1.13 persons per household.
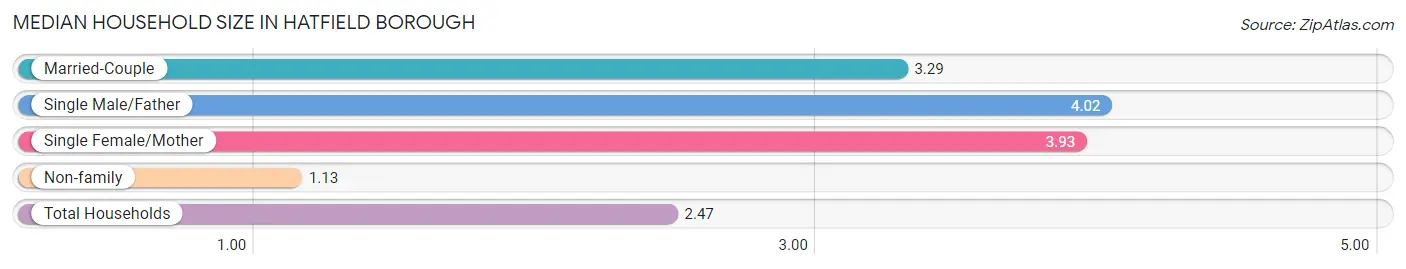
| Household Type | # Households | Household Size |
| Married-Couple | 547 (38.9%) | 3.29 |
| Single Male/Father | 107 (7.6%) | 4.02 |
| Single Female/Mother | 140 (10.0%) | 3.93 |
| Non-family | 613 (43.6%) | 1.13 |
| Total Households | 1,407 (100.0%) | 2.47 |
Household Size by Marriage Status in Hatfield borough
Out of a total of 1,407 households in Hatfield borough, 794 (56.4%) are family households, while 613 (43.6%) are nonfamily households. The most numerous type of family households are 4-person households, comprising 350, and the most common type of nonfamily households are 1-person households, comprising 560.
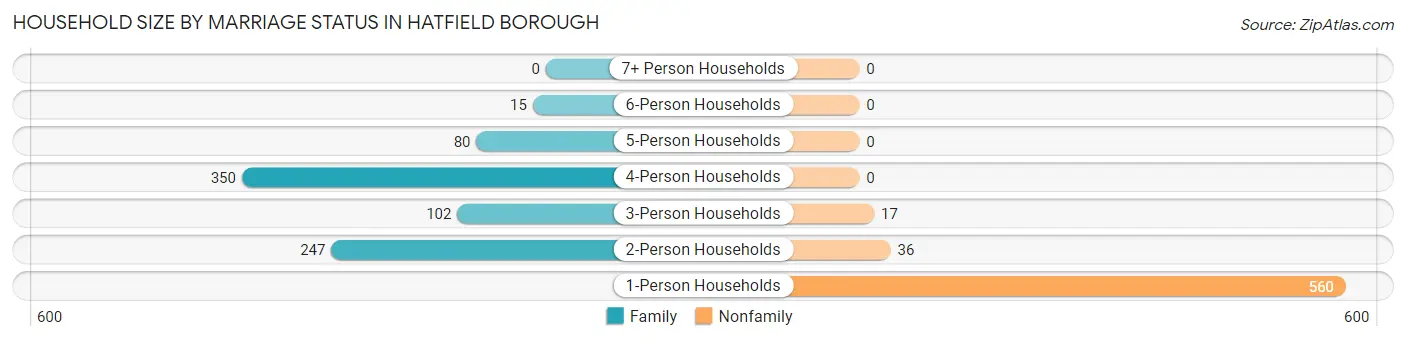
| Household Size | Family Households | Nonfamily Households |
| 1-Person Households | - | 560 (39.8%) |
| 2-Person Households | 247 (17.6%) | 36 (2.6%) |
| 3-Person Households | 102 (7.2%) | 17 (1.2%) |
| 4-Person Households | 350 (24.9%) | 0 (0.0%) |
| 5-Person Households | 80 (5.7%) | 0 (0.0%) |
| 6-Person Households | 15 (1.1%) | 0 (0.0%) |
| 7+ Person Households | 0 (0.0%) | 0 (0.0%) |
| Total | 794 (56.4%) | 613 (43.6%) |
Female Fertility in Hatfield borough
Fertility by Age in Hatfield borough
Average fertility rate in Hatfield borough is 79.0 births per 1,000 women. Women in the age bracket of 20 to 34 years have the highest fertility rate with 157.0 births per 1,000 women. Women in the age bracket of 20 to 34 years acount for 83.8% of all women with births.
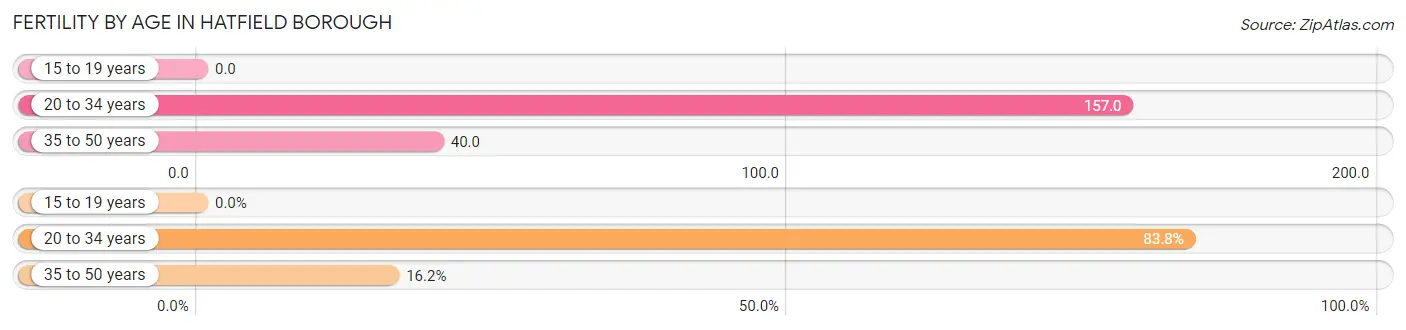
| Age Bracket | Women with Births | Births / 1,000 Women |
| 15 to 19 years | 0 (0.0%) | 0.0 |
| 20 to 34 years | 62 (83.8%) | 157.0 |
| 35 to 50 years | 12 (16.2%) | 40.0 |
| Total | 74 (100.0%) | 79.0 |
Fertility by Age by Marriage Status in Hatfield borough
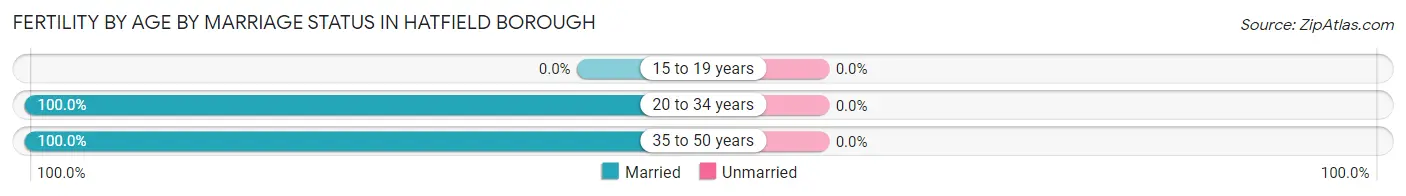
| Age Bracket | Married | Unmarried |
| 15 to 19 years | 0 (0.0%) | 0 (0.0%) |
| 20 to 34 years | 62 (100.0%) | 0 (0.0%) |
| 35 to 50 years | 12 (100.0%) | 0 (0.0%) |
| Total | 74 (100.0%) | 0 (0.0%) |
Fertility by Education in Hatfield borough
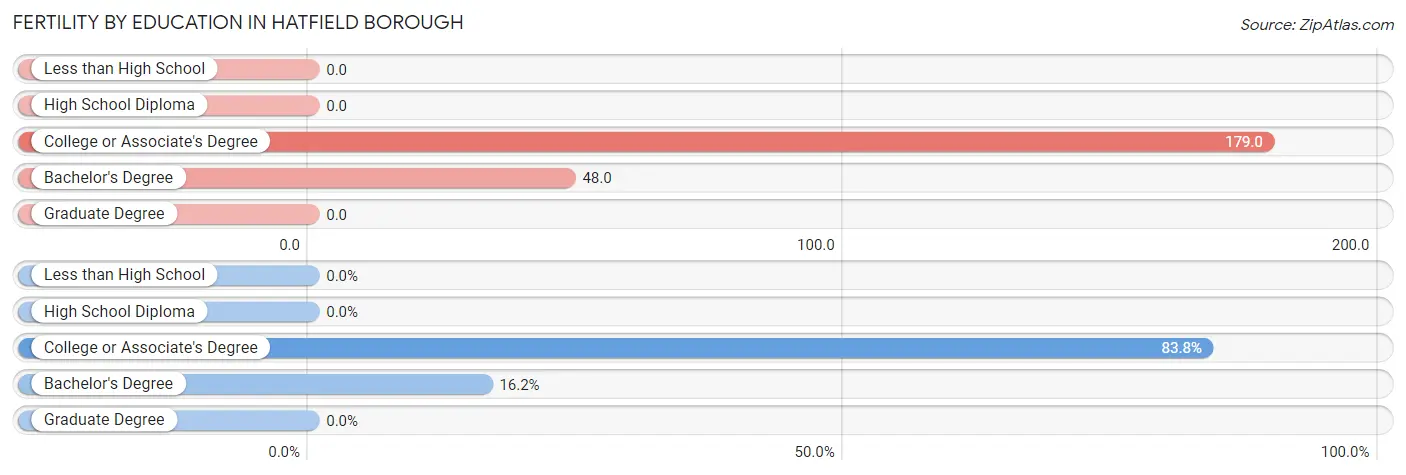
| Educational Attainment | Women with Births | Births / 1,000 Women |
| Less than High School | 0 (0.0%) | 0.0 |
| High School Diploma | 0 (0.0%) | 0.0 |
| College or Associate's Degree | 62 (83.8%) | 179.0 |
| Bachelor's Degree | 12 (16.2%) | 48.0 |
| Graduate Degree | 0 (0.0%) | 0.0 |
| Total | 74 (100.0%) | 79.0 |
Fertility by Education by Marriage Status in Hatfield borough
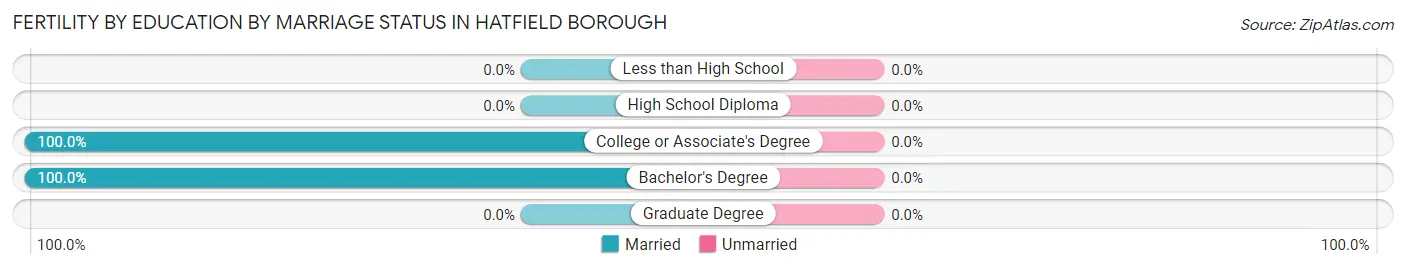
| Educational Attainment | Married | Unmarried |
| Less than High School | 0 (0.0%) | 0 (0.0%) |
| High School Diploma | 0 (0.0%) | 0 (0.0%) |
| College or Associate's Degree | 62 (100.0%) | 0 (0.0%) |
| Bachelor's Degree | 12 (100.0%) | 0 (0.0%) |
| Graduate Degree | 0 (0.0%) | 0 (0.0%) |
| Total | 74 (100.0%) | 0 (0.0%) |
Employment Characteristics in Hatfield borough
Employment by Class of Employer in Hatfield borough
Among the 1,914 employed individuals in Hatfield borough, private company employees (1,471 | 76.8%), not-for-profit organizations (155 | 8.1%), and self-employed (not incorporated) (78 | 4.1%) make up the most common classes of employment.
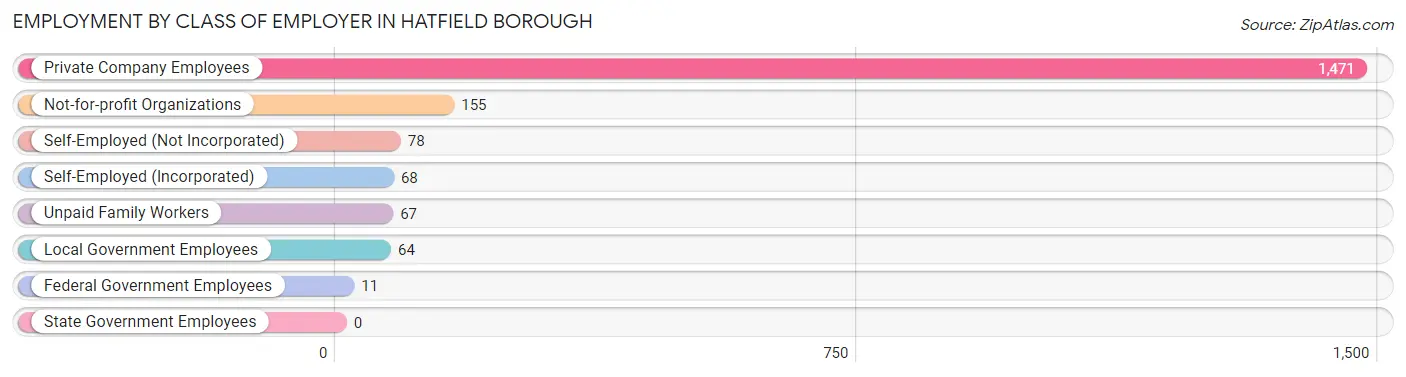
| Employer Class | # Employees | % Employees |
| Private Company Employees | 1,471 | 76.8% |
| Self-Employed (Incorporated) | 68 | 3.5% |
| Self-Employed (Not Incorporated) | 78 | 4.1% |
| Not-for-profit Organizations | 155 | 8.1% |
| Local Government Employees | 64 | 3.3% |
| State Government Employees | 0 | 0.0% |
| Federal Government Employees | 11 | 0.6% |
| Unpaid Family Workers | 67 | 3.5% |
| Total | 1,914 | 100.0% |
Employment Status by Age in Hatfield borough
According to the labor force statistics for Hatfield borough, out of the total population over 16 years of age (2,784), 71.7% or 1,996 individuals are in the labor force, with 4.2% or 84 of them unemployed. The age group with the highest labor force participation rate is 30 to 34 years, with 100.0% or 340 individuals in the labor force. Within the labor force, the 20 to 24 years age range has the highest percentage of unemployed individuals, with 26.0% or 32 of them being unemployed.
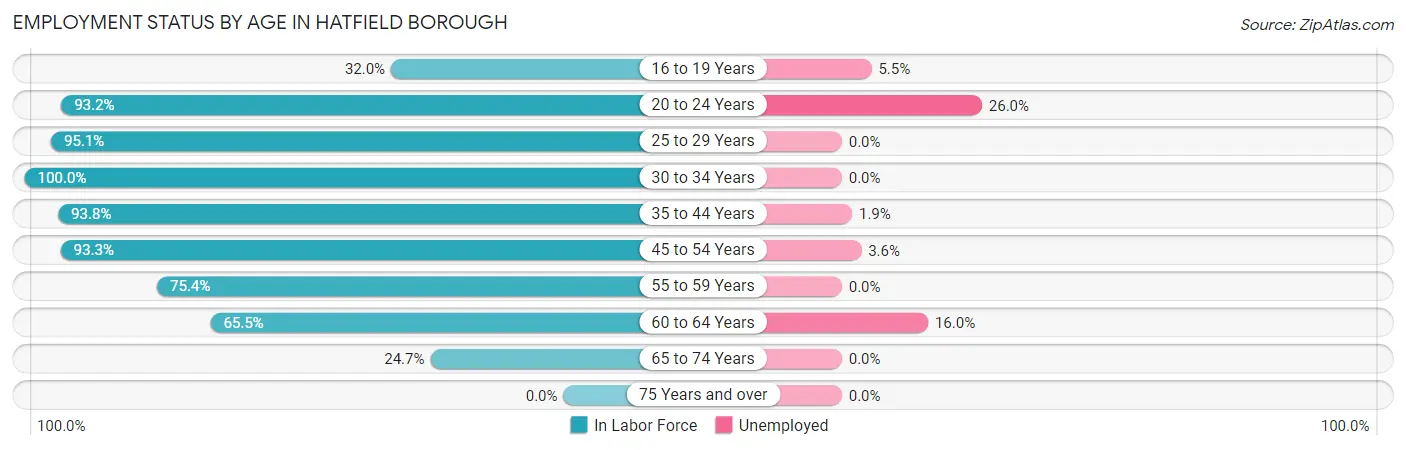
| Age Bracket | In Labor Force | Unemployed |
| 16 to 19 Years | 91 (32.0%) | 5 (5.5%) |
| 20 to 24 Years | 123 (93.2%) | 32 (26.0%) |
| 25 to 29 Years | 270 (95.1%) | 0 (0.0%) |
| 30 to 34 Years | 340 (100.0%) | 0 (0.0%) |
| 35 to 44 Years | 412 (93.8%) | 8 (1.9%) |
| 45 to 54 Years | 416 (93.3%) | 15 (3.6%) |
| 55 to 59 Years | 107 (75.4%) | 0 (0.0%) |
| 60 to 64 Years | 144 (65.5%) | 23 (16.0%) |
| 65 to 74 Years | 94 (24.7%) | 0 (0.0%) |
| 75 Years and over | 0 (0.0%) | 0 (0.0%) |
| Total | 1,996 (71.7%) | 84 (4.2%) |
Employment Status by Educational Attainment in Hatfield borough
According to labor force statistics for Hatfield borough, 90.3% of individuals (1,690) out of the total population between 25 and 64 years of age (1,871) are in the labor force, with 2.7% or 46 of them being unemployed. The group with the highest labor force participation rate are those with the educational attainment of college / associate degree, with 94.0% or 679 individuals in the labor force. Within the labor force, individuals with high school diploma education have the highest percentage of unemployment, with 10.3% or 31 of them being unemployed.
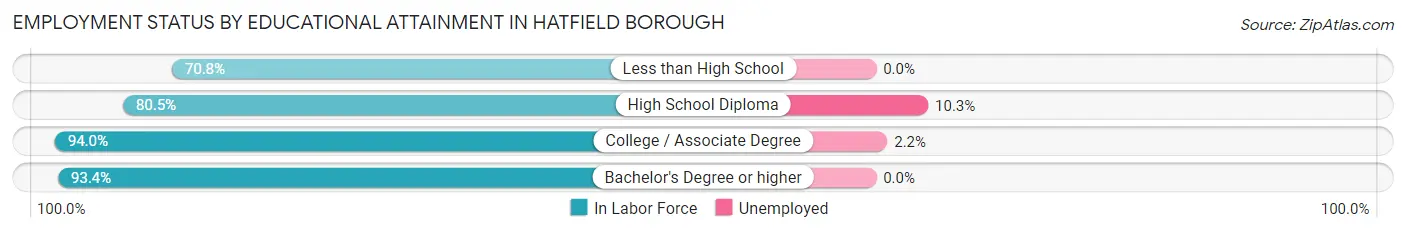
| Educational Attainment | In Labor Force | Unemployed |
| Less than High School | 46 (70.8%) | 0 (0.0%) |
| High School Diploma | 301 (80.5%) | 39 (10.3%) |
| College / Associate Degree | 679 (94.0%) | 16 (2.2%) |
| Bachelor's Degree or higher | 663 (93.4%) | 0 (0.0%) |
| Total | 1,690 (90.3%) | 51 (2.7%) |
Employment Occupations by Sex in Hatfield borough
Management, Business, Science and Arts Occupations
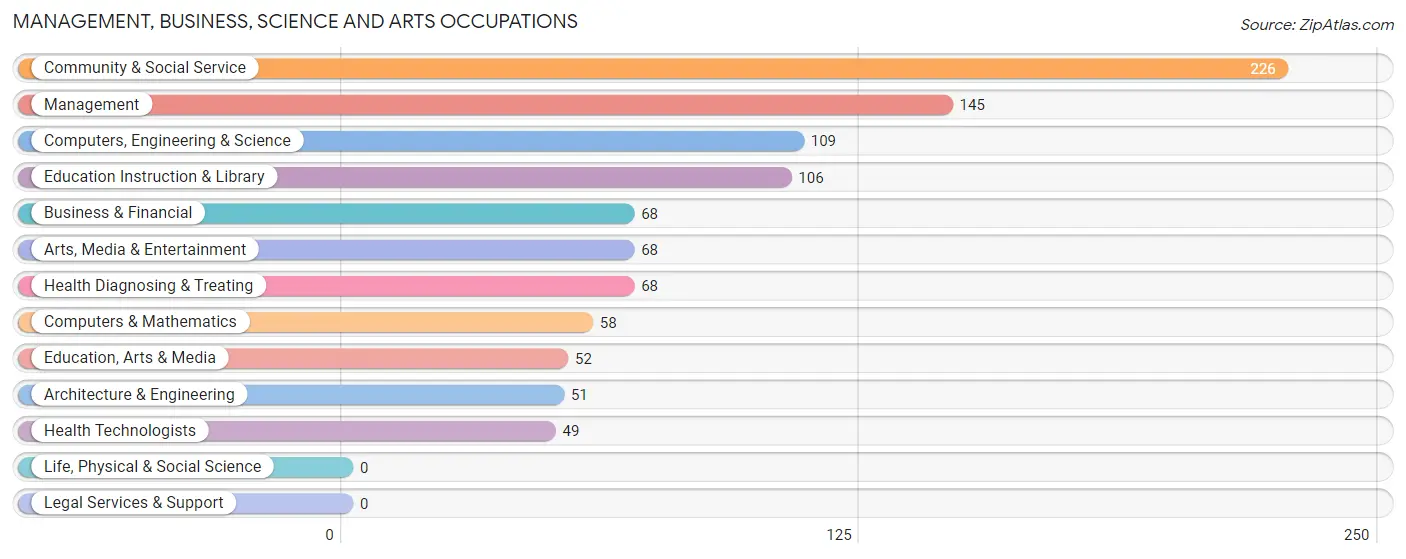
The most common Management, Business, Science and Arts occupations in Hatfield borough are Community & Social Service (226 | 11.8%), Management (145 | 7.6%), Computers, Engineering & Science (109 | 5.7%), Education Instruction & Library (106 | 5.5%), and Business & Financial (68 | 3.5%).
Management, Business, Science and Arts Occupations by Sex
Within the Management, Business, Science and Arts occupations in Hatfield borough, the most male-oriented occupations are Architecture & Engineering (88.2%), Education, Arts & Media (71.2%), and Computers, Engineering & Science (56.0%), while the most female-oriented occupations are Health Diagnosing & Treating (92.6%), Health Technologists (89.8%), and Education Instruction & Library (84.0%).
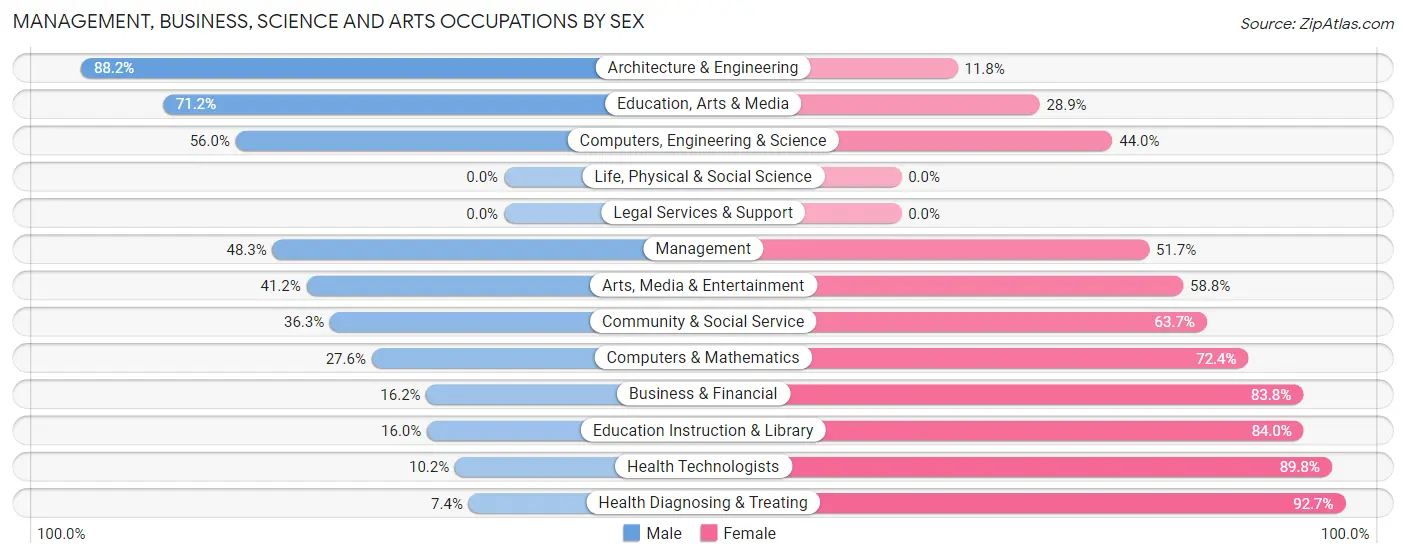
| Occupation | Male | Female |
| Management | 70 (48.3%) | 75 (51.7%) |
| Business & Financial | 11 (16.2%) | 57 (83.8%) |
| Computers, Engineering & Science | 61 (56.0%) | 48 (44.0%) |
| Computers & Mathematics | 16 (27.6%) | 42 (72.4%) |
| Architecture & Engineering | 45 (88.2%) | 6 (11.8%) |
| Life, Physical & Social Science | 0 (0.0%) | 0 (0.0%) |
| Community & Social Service | 82 (36.3%) | 144 (63.7%) |
| Education, Arts & Media | 37 (71.2%) | 15 (28.8%) |
| Legal Services & Support | 0 (0.0%) | 0 (0.0%) |
| Education Instruction & Library | 17 (16.0%) | 89 (84.0%) |
| Arts, Media & Entertainment | 28 (41.2%) | 40 (58.8%) |
| Health Diagnosing & Treating | 5 (7.3%) | 63 (92.6%) |
| Health Technologists | 5 (10.2%) | 44 (89.8%) |
| Total (Category) | 229 (37.2%) | 387 (62.8%) |
| Total (Overall) | 980 (51.2%) | 934 (48.8%) |
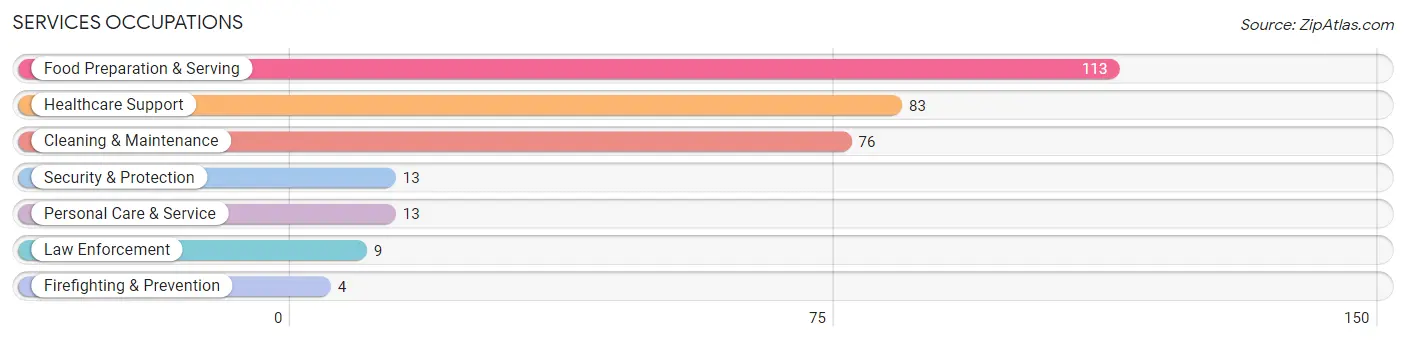
Services Occupations
The most common Services occupations in Hatfield borough are Food Preparation & Serving (113 | 5.9%), Healthcare Support (83 | 4.3%), Cleaning & Maintenance (76 | 4.0%), Security & Protection (13 | 0.7%), and Personal Care & Service (13 | 0.7%).
Services Occupations by Sex
Within the Services occupations in Hatfield borough, the most male-oriented occupations are Security & Protection (100.0%), Firefighting & Prevention (100.0%), and Law Enforcement (100.0%), while the most female-oriented occupations are Healthcare Support (95.2%), Personal Care & Service (53.8%), and Food Preparation & Serving (21.2%).
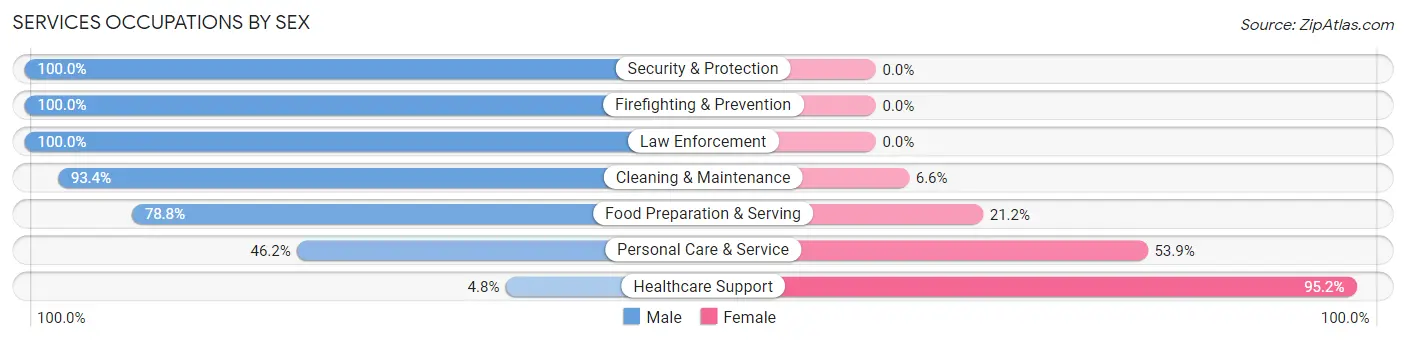
| Occupation | Male | Female |
| Healthcare Support | 4 (4.8%) | 79 (95.2%) |
| Security & Protection | 13 (100.0%) | 0 (0.0%) |
| Firefighting & Prevention | 4 (100.0%) | 0 (0.0%) |
| Law Enforcement | 9 (100.0%) | 0 (0.0%) |
| Food Preparation & Serving | 89 (78.8%) | 24 (21.2%) |
| Cleaning & Maintenance | 71 (93.4%) | 5 (6.6%) |
| Personal Care & Service | 6 (46.2%) | 7 (53.8%) |
| Total (Category) | 183 (61.4%) | 115 (38.6%) |
| Total (Overall) | 980 (51.2%) | 934 (48.8%) |
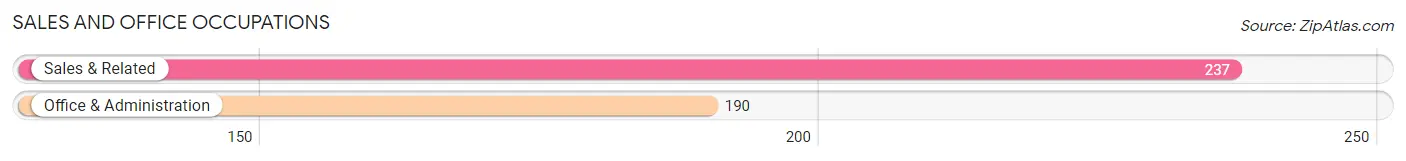
Sales and Office Occupations
The most common Sales and Office occupations in Hatfield borough are Sales & Related (237 | 12.4%), and Office & Administration (190 | 9.9%).
Sales and Office Occupations by Sex
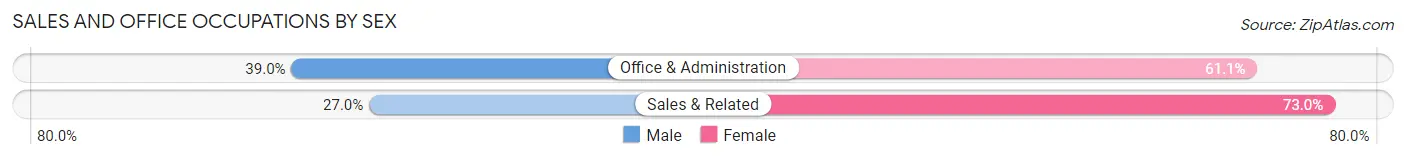
| Occupation | Male | Female |
| Sales & Related | 64 (27.0%) | 173 (73.0%) |
| Office & Administration | 74 (39.0%) | 116 (61.1%) |
| Total (Category) | 138 (32.3%) | 289 (67.7%) |
| Total (Overall) | 980 (51.2%) | 934 (48.8%) |
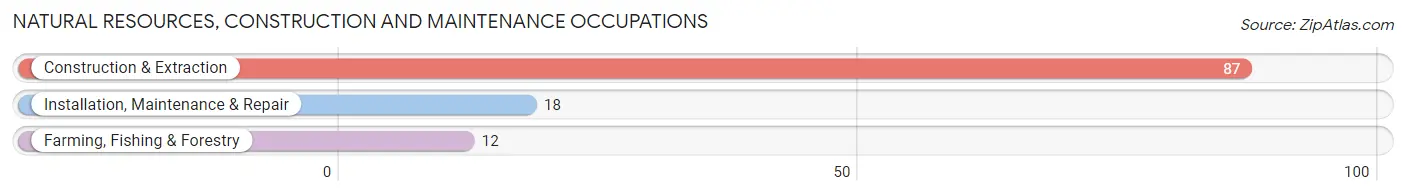
Natural Resources, Construction and Maintenance Occupations
The most common Natural Resources, Construction and Maintenance occupations in Hatfield borough are Construction & Extraction (87 | 4.5%), Installation, Maintenance & Repair (18 | 0.9%), and Farming, Fishing & Forestry (12 | 0.6%).
Natural Resources, Construction and Maintenance Occupations by Sex
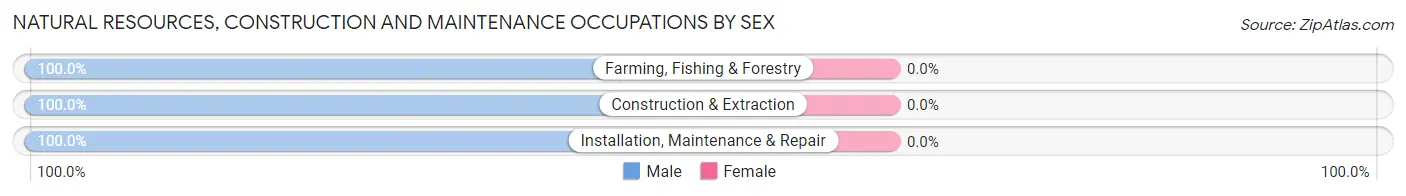
| Occupation | Male | Female |
| Farming, Fishing & Forestry | 12 (100.0%) | 0 (0.0%) |
| Construction & Extraction | 87 (100.0%) | 0 (0.0%) |
| Installation, Maintenance & Repair | 18 (100.0%) | 0 (0.0%) |
| Total (Category) | 117 (100.0%) | 0 (0.0%) |
| Total (Overall) | 980 (51.2%) | 934 (48.8%) |
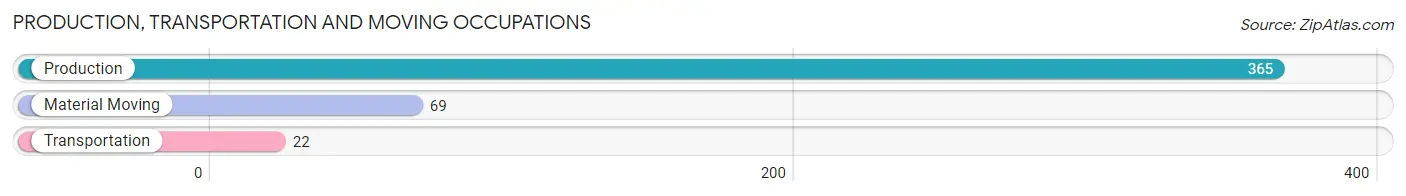
Production, Transportation and Moving Occupations
The most common Production, Transportation and Moving occupations in Hatfield borough are Production (365 | 19.1%), Material Moving (69 | 3.6%), and Transportation (22 | 1.1%).
Production, Transportation and Moving Occupations by Sex
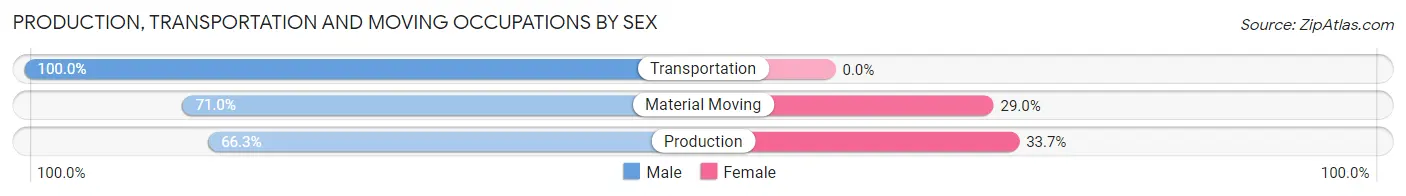
| Occupation | Male | Female |
| Production | 242 (66.3%) | 123 (33.7%) |
| Transportation | 22 (100.0%) | 0 (0.0%) |
| Material Moving | 49 (71.0%) | 20 (29.0%) |
| Total (Category) | 313 (68.6%) | 143 (31.4%) |
| Total (Overall) | 980 (51.2%) | 934 (48.8%) |
Employment Industries by Sex in Hatfield borough
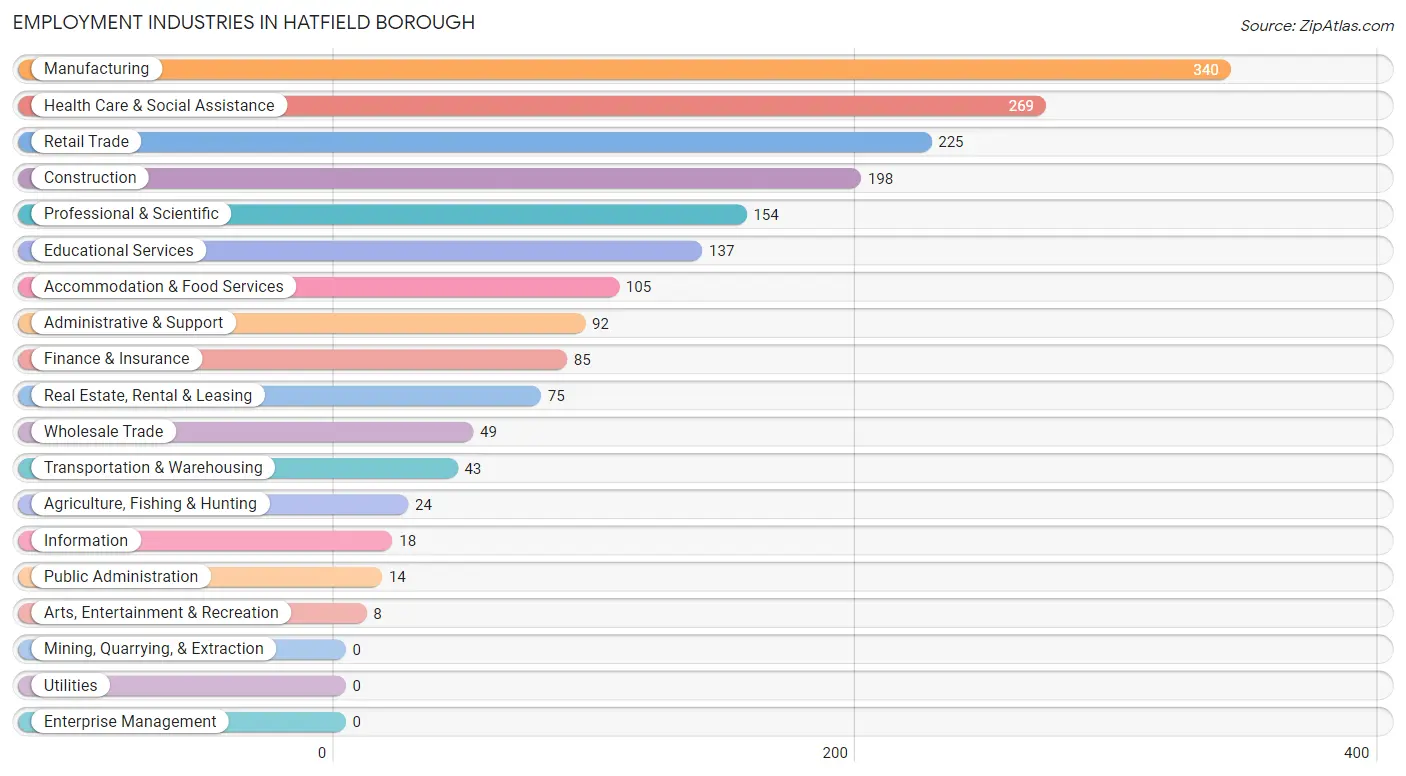
Employment Industries in Hatfield borough
The major employment industries in Hatfield borough include Manufacturing (340 | 17.8%), Health Care & Social Assistance (269 | 14.1%), Retail Trade (225 | 11.8%), Construction (198 | 10.3%), and Professional & Scientific (154 | 8.1%).
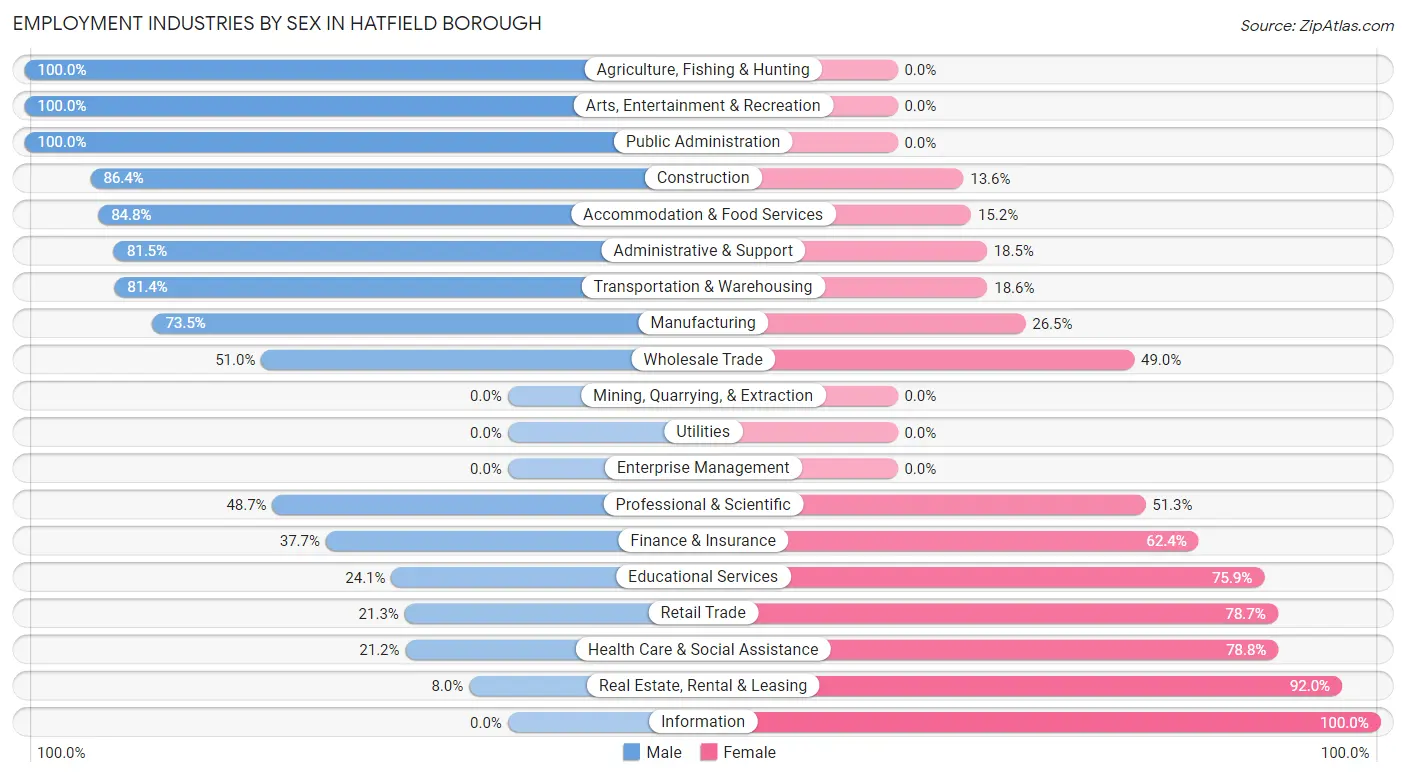
Employment Industries by Sex in Hatfield borough
The Hatfield borough industries that see more men than women are Agriculture, Fishing & Hunting (100.0%), Arts, Entertainment & Recreation (100.0%), and Public Administration (100.0%), whereas the industries that tend to have a higher number of women are Information (100.0%), Real Estate, Rental & Leasing (92.0%), and Health Care & Social Assistance (78.8%).
| Industry | Male | Female |
| Agriculture, Fishing & Hunting | 24 (100.0%) | 0 (0.0%) |
| Mining, Quarrying, & Extraction | 0 (0.0%) | 0 (0.0%) |
| Construction | 171 (86.4%) | 27 (13.6%) |
| Manufacturing | 250 (73.5%) | 90 (26.5%) |
| Wholesale Trade | 25 (51.0%) | 24 (49.0%) |
| Retail Trade | 48 (21.3%) | 177 (78.7%) |
| Transportation & Warehousing | 35 (81.4%) | 8 (18.6%) |
| Utilities | 0 (0.0%) | 0 (0.0%) |
| Information | 0 (0.0%) | 18 (100.0%) |
| Finance & Insurance | 32 (37.7%) | 53 (62.4%) |
| Real Estate, Rental & Leasing | 6 (8.0%) | 69 (92.0%) |
| Professional & Scientific | 75 (48.7%) | 79 (51.3%) |
| Enterprise Management | 0 (0.0%) | 0 (0.0%) |
| Administrative & Support | 75 (81.5%) | 17 (18.5%) |
| Educational Services | 33 (24.1%) | 104 (75.9%) |
| Health Care & Social Assistance | 57 (21.2%) | 212 (78.8%) |
| Arts, Entertainment & Recreation | 8 (100.0%) | 0 (0.0%) |
| Accommodation & Food Services | 89 (84.8%) | 16 (15.2%) |
| Public Administration | 14 (100.0%) | 0 (0.0%) |
| Total | 980 (51.2%) | 934 (48.8%) |
Education in Hatfield borough
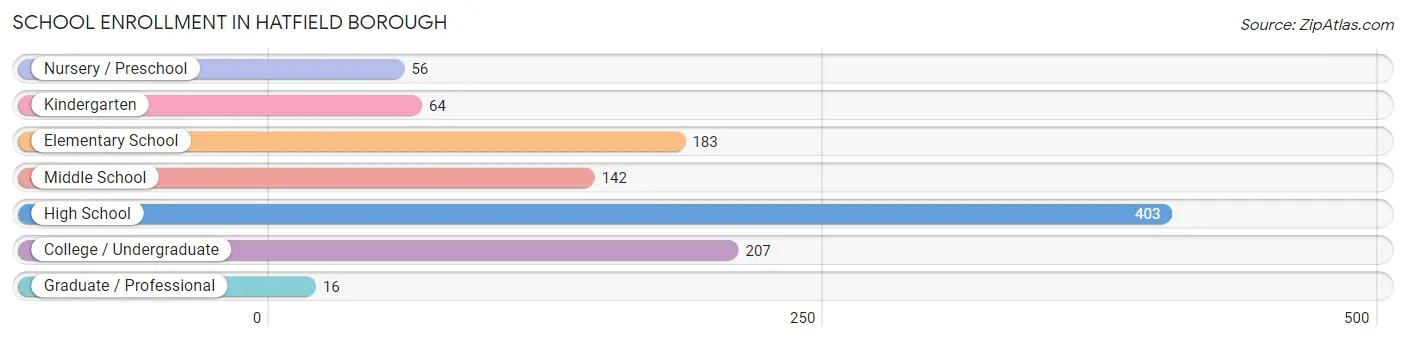
School Enrollment in Hatfield borough
The most common levels of schooling among the 1,071 students in Hatfield borough are high school (403 | 37.6%), college / undergraduate (207 | 19.3%), and elementary school (183 | 17.1%).
| School Level | # Students | % Students |
| Nursery / Preschool | 56 | 5.2% |
| Kindergarten | 64 | 6.0% |
| Elementary School | 183 | 17.1% |
| Middle School | 142 | 13.3% |
| High School | 403 | 37.6% |
| College / Undergraduate | 207 | 19.3% |
| Graduate / Professional | 16 | 1.5% |
| Total | 1,071 | 100.0% |
School Enrollment by Age by Funding Source in Hatfield borough
Out of a total of 1,071 students who are enrolled in schools in Hatfield borough, 94 (8.8%) attend a private institution, while the remaining 977 (91.2%) are enrolled in public schools. The age group of 3 to 4 year olds has the highest likelihood of being enrolled in private schools, with 12 (100.0% in the age bracket) enrolled. Conversely, the age group of 18 to 19 year olds has the lowest likelihood of being enrolled in a private school, with 75 (100.0% in the age bracket) attending a public institution.
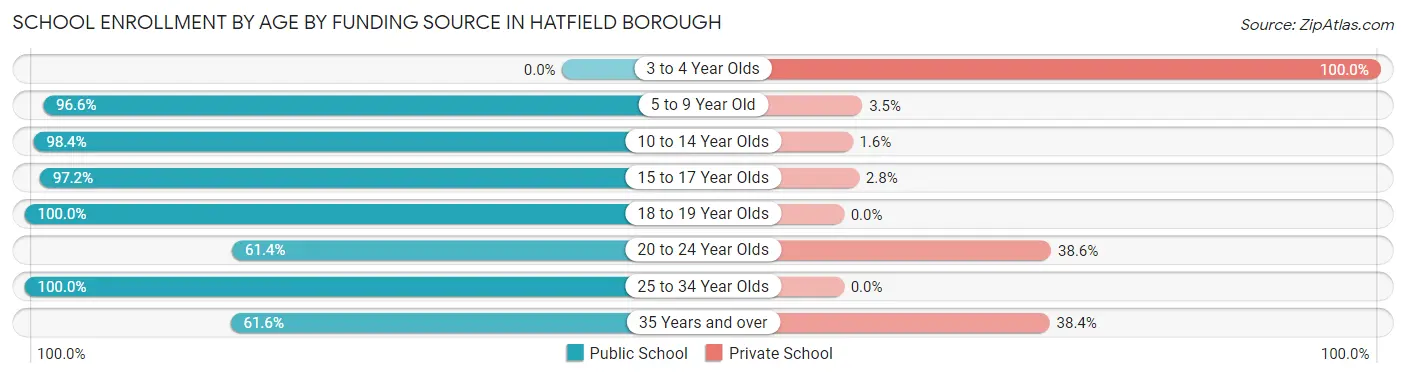
| Age Bracket | Public School | Private School |
| 3 to 4 Year Olds | 0 (0.0%) | 12 (100.0%) |
| 5 to 9 Year Old | 252 (96.6%) | 9 (3.5%) |
| 10 to 14 Year Olds | 300 (98.4%) | 5 (1.6%) |
| 15 to 17 Year Olds | 205 (97.2%) | 6 (2.8%) |
| 18 to 19 Year Olds | 75 (100.0%) | 0 (0.0%) |
| 20 to 24 Year Olds | 54 (61.4%) | 34 (38.6%) |
| 25 to 34 Year Olds | 46 (100.0%) | 0 (0.0%) |
| 35 Years and over | 45 (61.6%) | 28 (38.4%) |
| Total | 977 (91.2%) | 94 (8.8%) |
Educational Attainment by Field of Study in Hatfield borough
Business (268 | 30.8%), science & technology (123 | 14.1%), literature & languages (73 | 8.4%), bio, nature & agricultural (72 | 8.3%), and social sciences (69 | 7.9%) are the most common fields of study among 869 individuals in Hatfield borough who have obtained a bachelor's degree or higher.
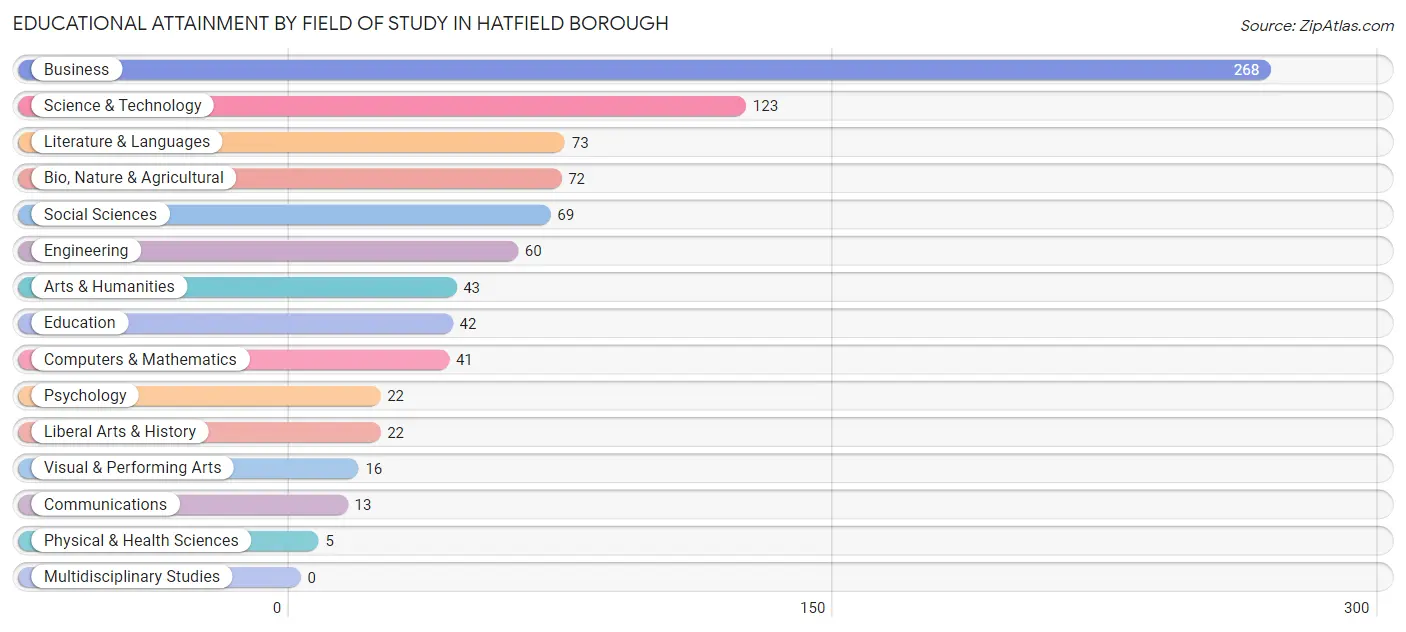
| Field of Study | # Graduates | % Graduates |
| Computers & Mathematics | 41 | 4.7% |
| Bio, Nature & Agricultural | 72 | 8.3% |
| Physical & Health Sciences | 5 | 0.6% |
| Psychology | 22 | 2.5% |
| Social Sciences | 69 | 7.9% |
| Engineering | 60 | 6.9% |
| Multidisciplinary Studies | 0 | 0.0% |
| Science & Technology | 123 | 14.1% |
| Business | 268 | 30.8% |
| Education | 42 | 4.8% |
| Literature & Languages | 73 | 8.4% |
| Liberal Arts & History | 22 | 2.5% |
| Visual & Performing Arts | 16 | 1.8% |
| Communications | 13 | 1.5% |
| Arts & Humanities | 43 | 5.0% |
| Total | 869 | 100.0% |
Transportation & Commute in Hatfield borough
Vehicle Availability by Sex in Hatfield borough
The most prevalent vehicle ownership categories in Hatfield borough are males with 1 vehicle (375, accounting for 38.3%) and females with 1 vehicle (247, making up 40.2%).
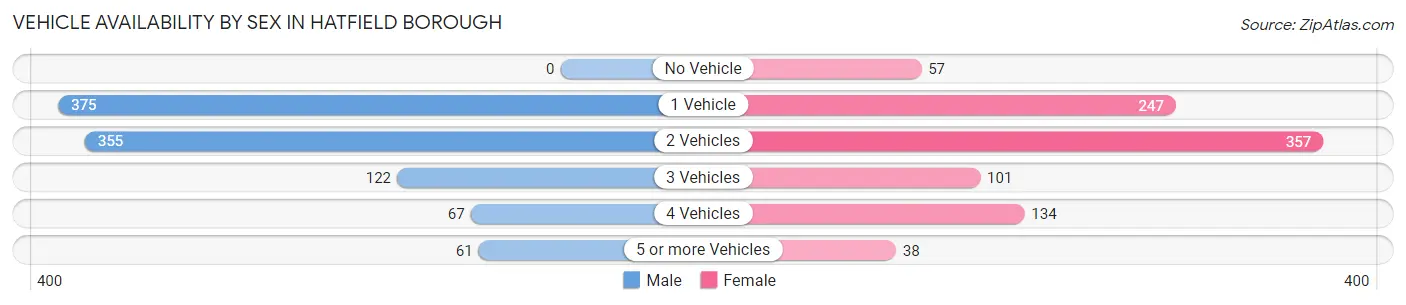
| Vehicles Available | Male | Female |
| No Vehicle | 0 (0.0%) | 57 (6.1%) |
| 1 Vehicle | 375 (38.3%) | 247 (26.5%) |
| 2 Vehicles | 355 (36.2%) | 357 (38.2%) |
| 3 Vehicles | 122 (12.4%) | 101 (10.8%) |
| 4 Vehicles | 67 (6.8%) | 134 (14.3%) |
| 5 or more Vehicles | 61 (6.2%) | 38 (4.1%) |
| Total | 980 (100.0%) | 934 (100.0%) |
Commute Time in Hatfield borough
The most frequently occuring commute durations in Hatfield borough are 10 to 14 minutes (386 commuters, 22.4%), 5 to 9 minutes (266 commuters, 15.4%), and 30 to 34 minutes (245 commuters, 14.2%).
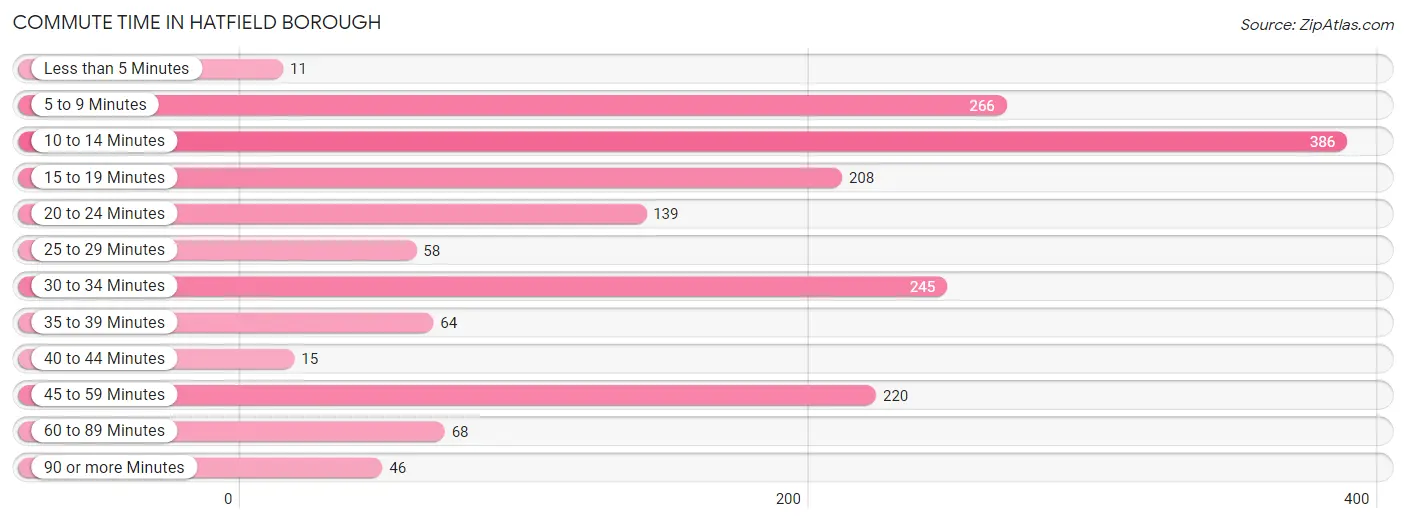
| Commute Time | # Commuters | % Commuters |
| Less than 5 Minutes | 11 | 0.6% |
| 5 to 9 Minutes | 266 | 15.4% |
| 10 to 14 Minutes | 386 | 22.4% |
| 15 to 19 Minutes | 208 | 12.0% |
| 20 to 24 Minutes | 139 | 8.1% |
| 25 to 29 Minutes | 58 | 3.4% |
| 30 to 34 Minutes | 245 | 14.2% |
| 35 to 39 Minutes | 64 | 3.7% |
| 40 to 44 Minutes | 15 | 0.9% |
| 45 to 59 Minutes | 220 | 12.8% |
| 60 to 89 Minutes | 68 | 3.9% |
| 90 or more Minutes | 46 | 2.7% |
Commute Time by Sex in Hatfield borough
The most common commute times in Hatfield borough are 45 to 59 minutes (203 commuters, 22.1%) for males and 10 to 14 minutes (229 commuters, 28.3%) for females.
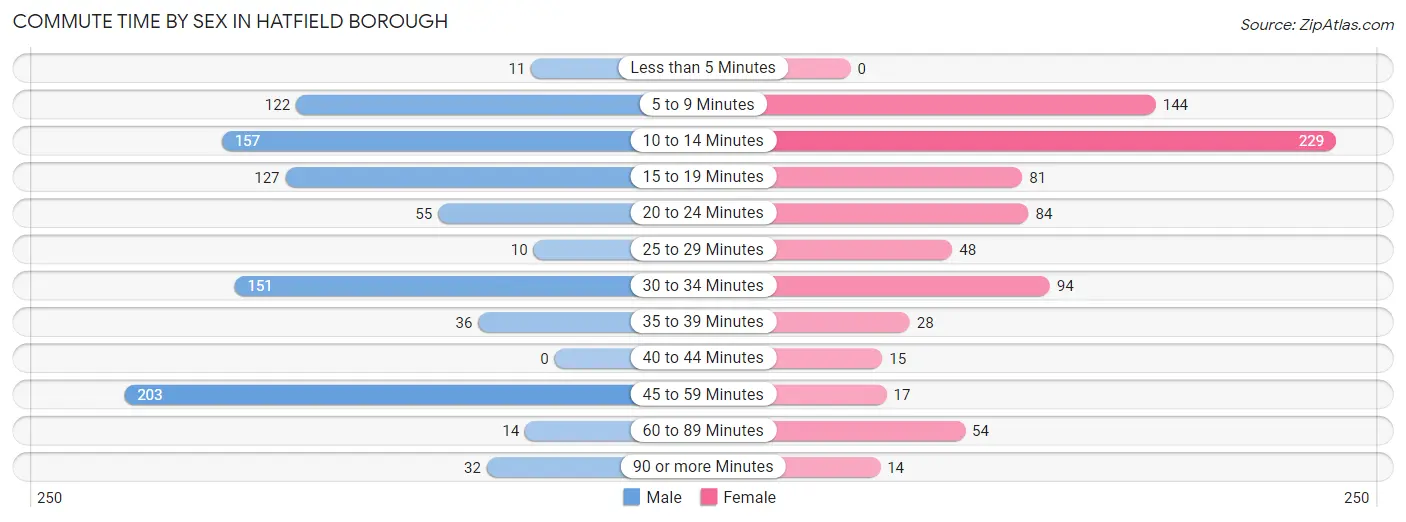
| Commute Time | Male | Female |
| Less than 5 Minutes | 11 (1.2%) | 0 (0.0%) |
| 5 to 9 Minutes | 122 (13.3%) | 144 (17.8%) |
| 10 to 14 Minutes | 157 (17.1%) | 229 (28.3%) |
| 15 to 19 Minutes | 127 (13.8%) | 81 (10.0%) |
| 20 to 24 Minutes | 55 (6.0%) | 84 (10.4%) |
| 25 to 29 Minutes | 10 (1.1%) | 48 (5.9%) |
| 30 to 34 Minutes | 151 (16.5%) | 94 (11.6%) |
| 35 to 39 Minutes | 36 (3.9%) | 28 (3.5%) |
| 40 to 44 Minutes | 0 (0.0%) | 15 (1.9%) |
| 45 to 59 Minutes | 203 (22.1%) | 17 (2.1%) |
| 60 to 89 Minutes | 14 (1.5%) | 54 (6.7%) |
| 90 or more Minutes | 32 (3.5%) | 14 (1.7%) |
Time of Departure to Work by Sex in Hatfield borough
The most frequent times of departure to work in Hatfield borough are 6:30 AM to 6:59 AM (210, 22.9%) for males and 7:00 AM to 7:29 AM (155, 19.2%) for females.
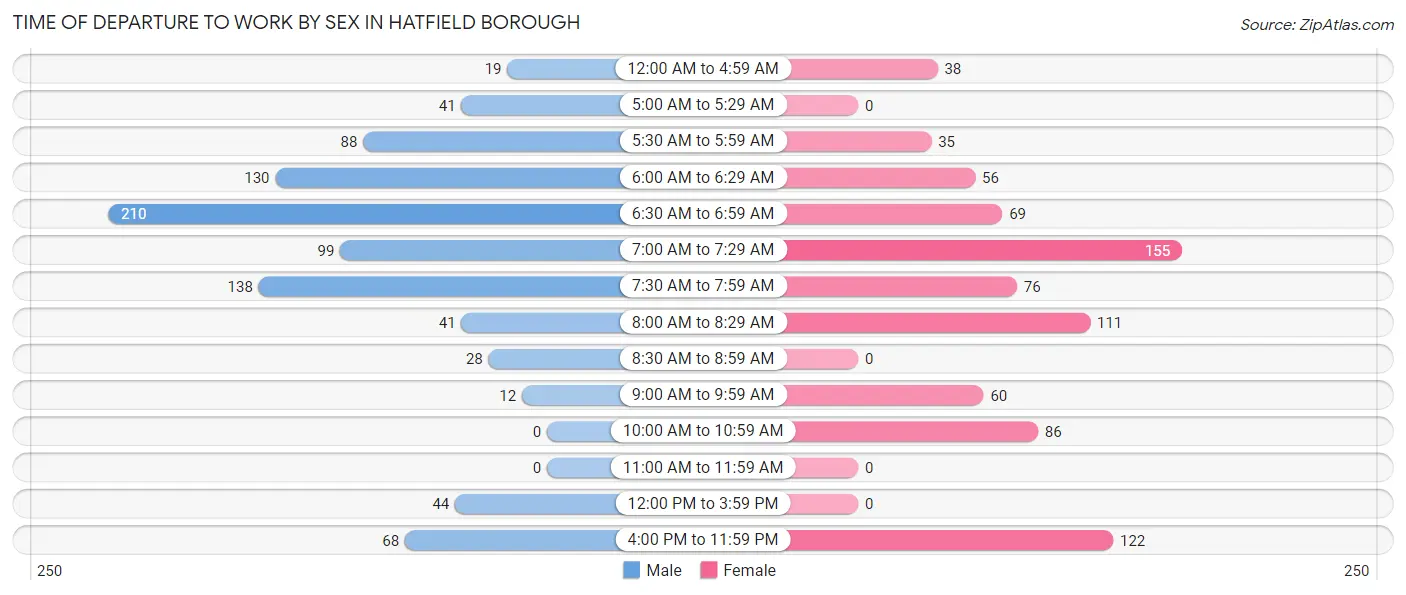
| Time of Departure | Male | Female |
| 12:00 AM to 4:59 AM | 19 (2.1%) | 38 (4.7%) |
| 5:00 AM to 5:29 AM | 41 (4.5%) | 0 (0.0%) |
| 5:30 AM to 5:59 AM | 88 (9.6%) | 35 (4.3%) |
| 6:00 AM to 6:29 AM | 130 (14.2%) | 56 (6.9%) |
| 6:30 AM to 6:59 AM | 210 (22.9%) | 69 (8.5%) |
| 7:00 AM to 7:29 AM | 99 (10.8%) | 155 (19.2%) |
| 7:30 AM to 7:59 AM | 138 (15.0%) | 76 (9.4%) |
| 8:00 AM to 8:29 AM | 41 (4.5%) | 111 (13.7%) |
| 8:30 AM to 8:59 AM | 28 (3.0%) | 0 (0.0%) |
| 9:00 AM to 9:59 AM | 12 (1.3%) | 60 (7.4%) |
| 10:00 AM to 10:59 AM | 0 (0.0%) | 86 (10.6%) |
| 11:00 AM to 11:59 AM | 0 (0.0%) | 0 (0.0%) |
| 12:00 PM to 3:59 PM | 44 (4.8%) | 0 (0.0%) |
| 4:00 PM to 11:59 PM | 68 (7.4%) | 122 (15.1%) |
| Total | 918 (100.0%) | 808 (100.0%) |
Housing Occupancy in Hatfield borough
Occupancy by Ownership in Hatfield borough
Of the total 1,407 dwellings in Hatfield borough, owner-occupied units account for 629 (44.7%), while renter-occupied units make up 778 (55.3%).
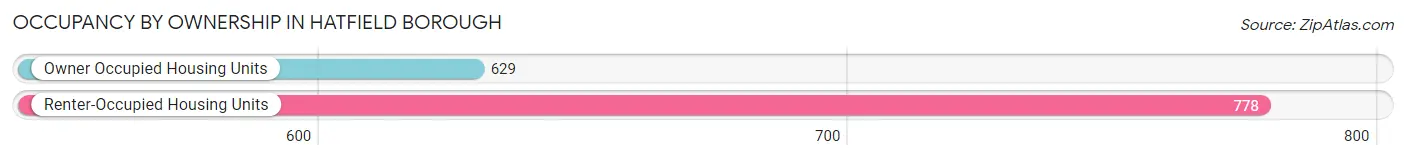
| Occupancy | # Housing Units | % Housing Units |
| Owner Occupied Housing Units | 629 | 44.7% |
| Renter-Occupied Housing Units | 778 | 55.3% |
| Total Occupied Housing Units | 1,407 | 100.0% |
Occupancy by Household Size in Hatfield borough
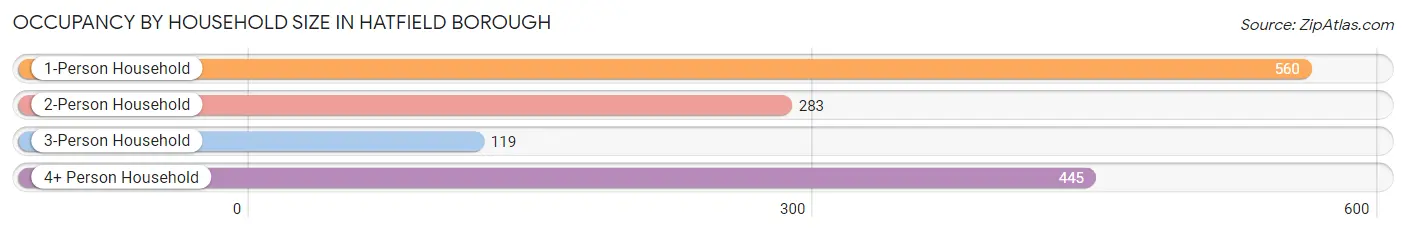
| Household Size | # Housing Units | % Housing Units |
| 1-Person Household | 560 | 39.8% |
| 2-Person Household | 283 | 20.1% |
| 3-Person Household | 119 | 8.5% |
| 4+ Person Household | 445 | 31.6% |
| Total Housing Units | 1,407 | 100.0% |
Occupancy by Ownership by Household Size in Hatfield borough
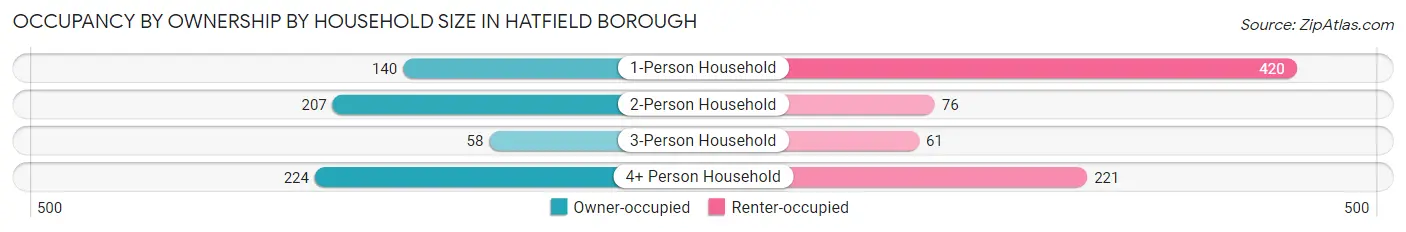
| Household Size | Owner-occupied | Renter-occupied |
| 1-Person Household | 140 (25.0%) | 420 (75.0%) |
| 2-Person Household | 207 (73.1%) | 76 (26.9%) |
| 3-Person Household | 58 (48.7%) | 61 (51.3%) |
| 4+ Person Household | 224 (50.3%) | 221 (49.7%) |
| Total Housing Units | 629 (44.7%) | 778 (55.3%) |
Occupancy by Educational Attainment in Hatfield borough
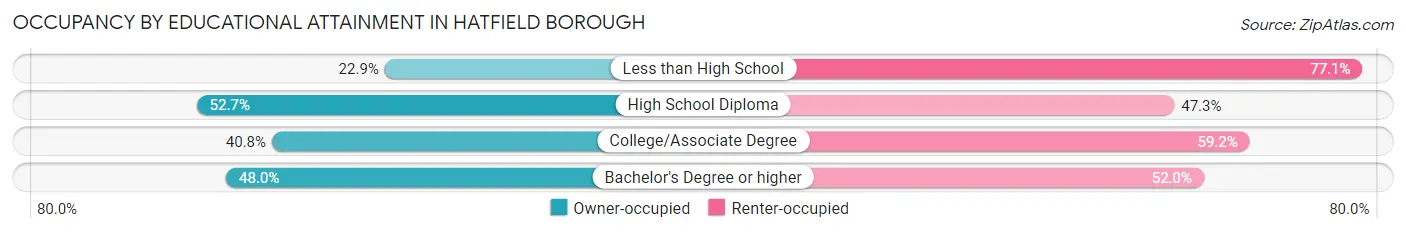
| Household Size | Owner-occupied | Renter-occupied |
| Less than High School | 19 (22.9%) | 64 (77.1%) |
| High School Diploma | 146 (52.7%) | 131 (47.3%) |
| College/Associate Degree | 219 (40.8%) | 318 (59.2%) |
| Bachelor's Degree or higher | 245 (48.0%) | 265 (52.0%) |
Occupancy by Age of Householder in Hatfield borough
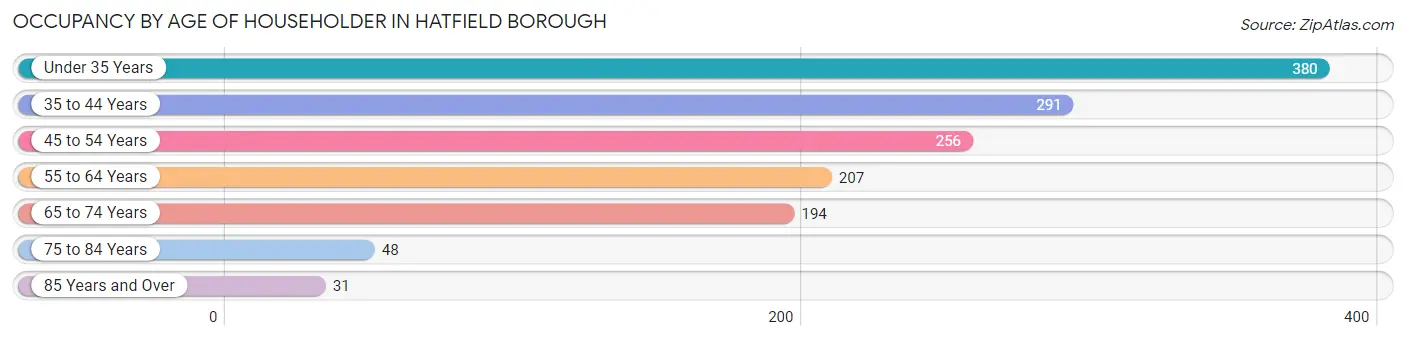
| Age Bracket | # Households | % Households |
| Under 35 Years | 380 | 27.0% |
| 35 to 44 Years | 291 | 20.7% |
| 45 to 54 Years | 256 | 18.2% |
| 55 to 64 Years | 207 | 14.7% |
| 65 to 74 Years | 194 | 13.8% |
| 75 to 84 Years | 48 | 3.4% |
| 85 Years and Over | 31 | 2.2% |
| Total | 1,407 | 100.0% |
Housing Finances in Hatfield borough
Median Income by Occupancy in Hatfield borough
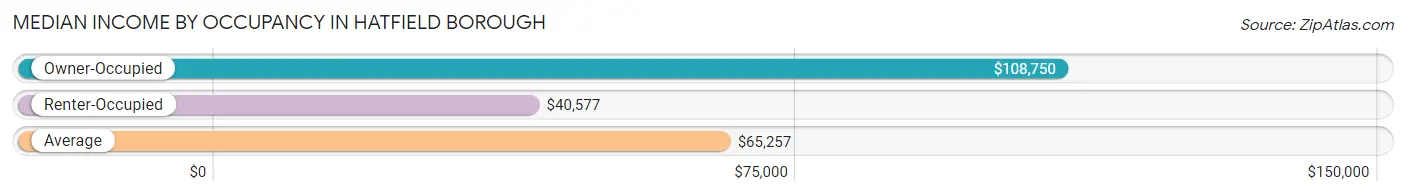
| Occupancy Type | # Households | Median Income |
| Owner-Occupied | 629 (44.7%) | $108,750 |
| Renter-Occupied | 778 (55.3%) | $40,577 |
| Average | 1,407 (100.0%) | $65,257 |
Occupancy by Householder Income Bracket in Hatfield borough
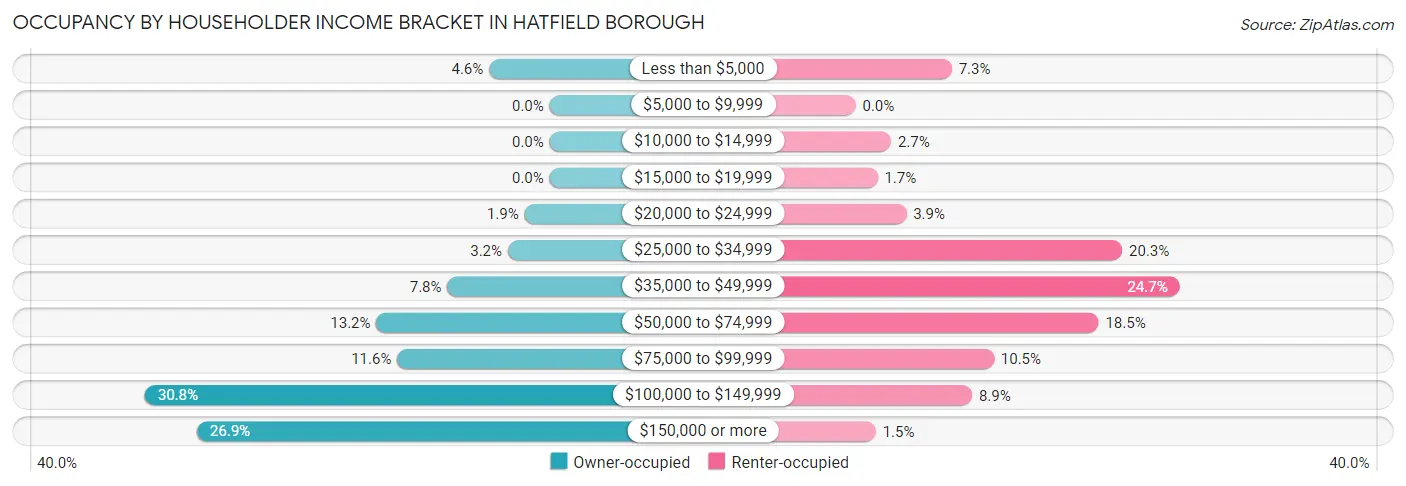
| Income Bracket | Owner-occupied | Renter-occupied |
| Less than $5,000 | 29 (4.6%) | 57 (7.3%) |
| $5,000 to $9,999 | 0 (0.0%) | 0 (0.0%) |
| $10,000 to $14,999 | 0 (0.0%) | 21 (2.7%) |
| $15,000 to $19,999 | 0 (0.0%) | 13 (1.7%) |
| $20,000 to $24,999 | 12 (1.9%) | 30 (3.9%) |
| $25,000 to $34,999 | 20 (3.2%) | 158 (20.3%) |
| $35,000 to $49,999 | 49 (7.8%) | 192 (24.7%) |
| $50,000 to $74,999 | 83 (13.2%) | 144 (18.5%) |
| $75,000 to $99,999 | 73 (11.6%) | 82 (10.5%) |
| $100,000 to $149,999 | 194 (30.8%) | 69 (8.9%) |
| $150,000 or more | 169 (26.9%) | 12 (1.5%) |
| Total | 629 (100.0%) | 778 (100.0%) |
Monthly Housing Cost Tiers in Hatfield borough
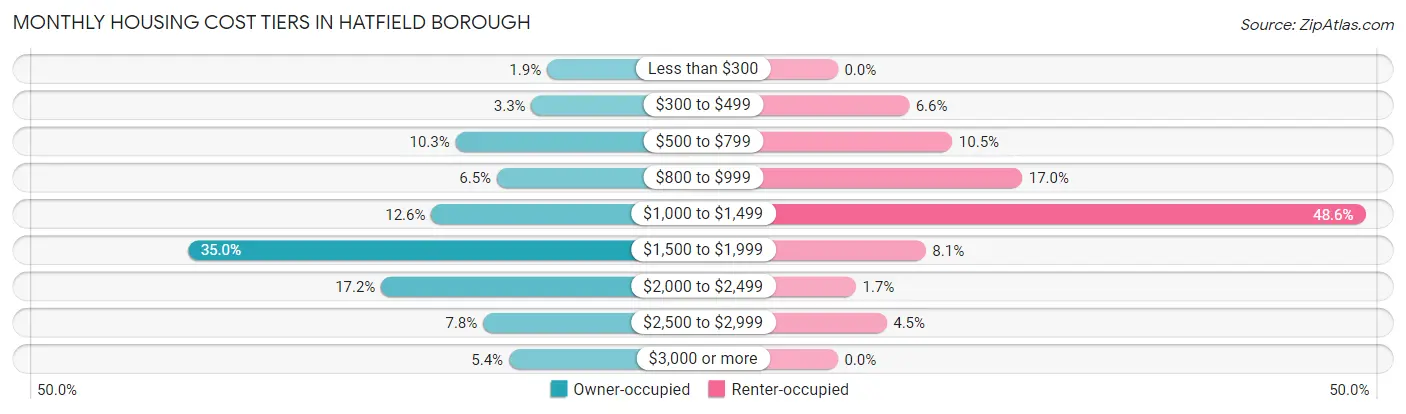
| Monthly Cost | Owner-occupied | Renter-occupied |
| Less than $300 | 12 (1.9%) | 0 (0.0%) |
| $300 to $499 | 21 (3.3%) | 51 (6.6%) |
| $500 to $799 | 65 (10.3%) | 82 (10.5%) |
| $800 to $999 | 41 (6.5%) | 132 (17.0%) |
| $1,000 to $1,499 | 79 (12.6%) | 378 (48.6%) |
| $1,500 to $1,999 | 220 (35.0%) | 63 (8.1%) |
| $2,000 to $2,499 | 108 (17.2%) | 13 (1.7%) |
| $2,500 to $2,999 | 49 (7.8%) | 35 (4.5%) |
| $3,000 or more | 34 (5.4%) | 0 (0.0%) |
| Total | 629 (100.0%) | 778 (100.0%) |
Physical Housing Characteristics in Hatfield borough
Housing Structures in Hatfield borough
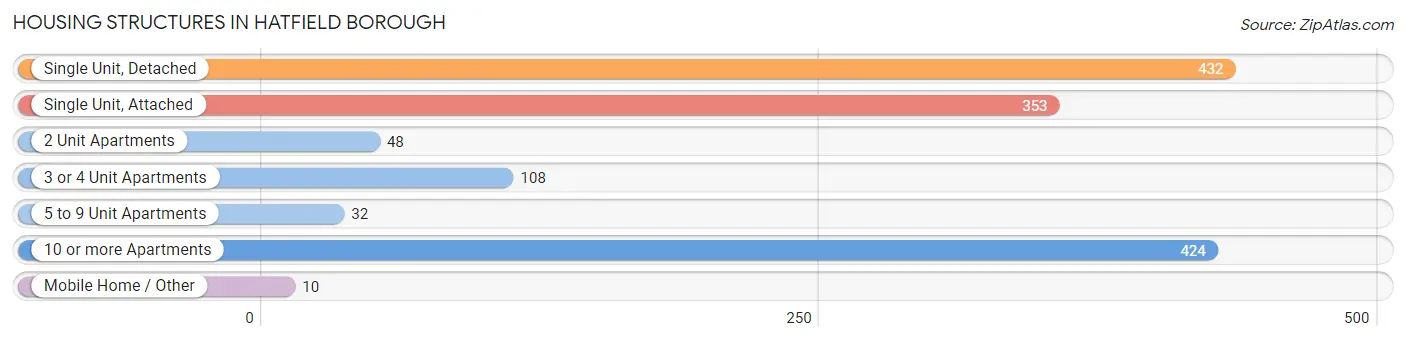
| Structure Type | # Housing Units | % Housing Units |
| Single Unit, Detached | 432 | 30.7% |
| Single Unit, Attached | 353 | 25.1% |
| 2 Unit Apartments | 48 | 3.4% |
| 3 or 4 Unit Apartments | 108 | 7.7% |
| 5 to 9 Unit Apartments | 32 | 2.3% |
| 10 or more Apartments | 424 | 30.1% |
| Mobile Home / Other | 10 | 0.7% |
| Total | 1,407 | 100.0% |
Housing Structures by Occupancy in Hatfield borough
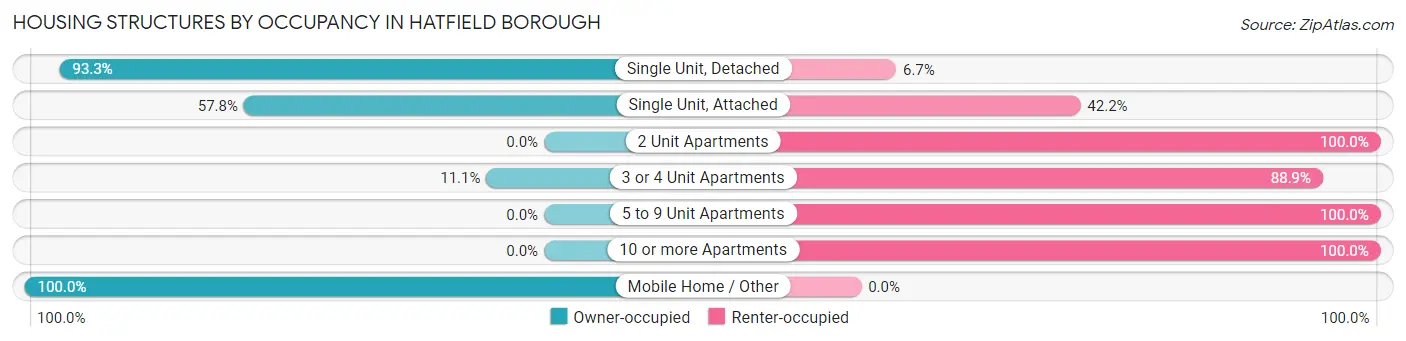
| Structure Type | Owner-occupied | Renter-occupied |
| Single Unit, Detached | 403 (93.3%) | 29 (6.7%) |
| Single Unit, Attached | 204 (57.8%) | 149 (42.2%) |
| 2 Unit Apartments | 0 (0.0%) | 48 (100.0%) |
| 3 or 4 Unit Apartments | 12 (11.1%) | 96 (88.9%) |
| 5 to 9 Unit Apartments | 0 (0.0%) | 32 (100.0%) |
| 10 or more Apartments | 0 (0.0%) | 424 (100.0%) |
| Mobile Home / Other | 10 (100.0%) | 0 (0.0%) |
| Total | 629 (44.7%) | 778 (55.3%) |
Housing Structures by Number of Rooms in Hatfield borough
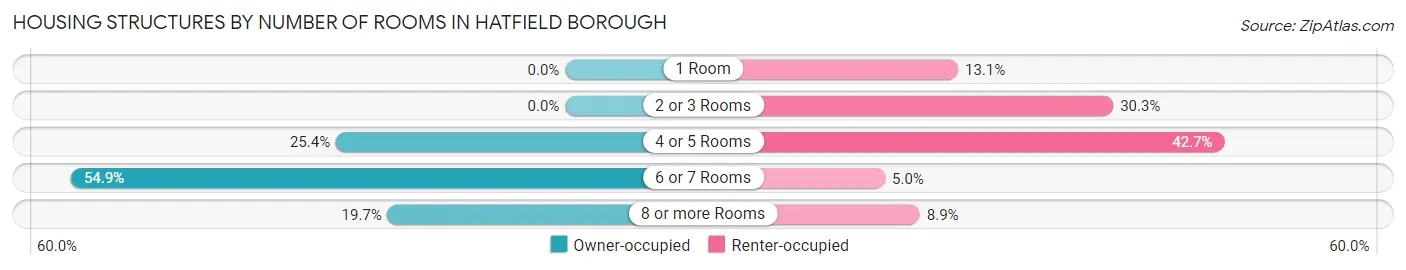
| Number of Rooms | Owner-occupied | Renter-occupied |
| 1 Room | 0 (0.0%) | 102 (13.1%) |
| 2 or 3 Rooms | 0 (0.0%) | 236 (30.3%) |
| 4 or 5 Rooms | 160 (25.4%) | 332 (42.7%) |
| 6 or 7 Rooms | 345 (54.8%) | 39 (5.0%) |
| 8 or more Rooms | 124 (19.7%) | 69 (8.9%) |
| Total | 629 (100.0%) | 778 (100.0%) |
Housing Structure by Heating Type in Hatfield borough
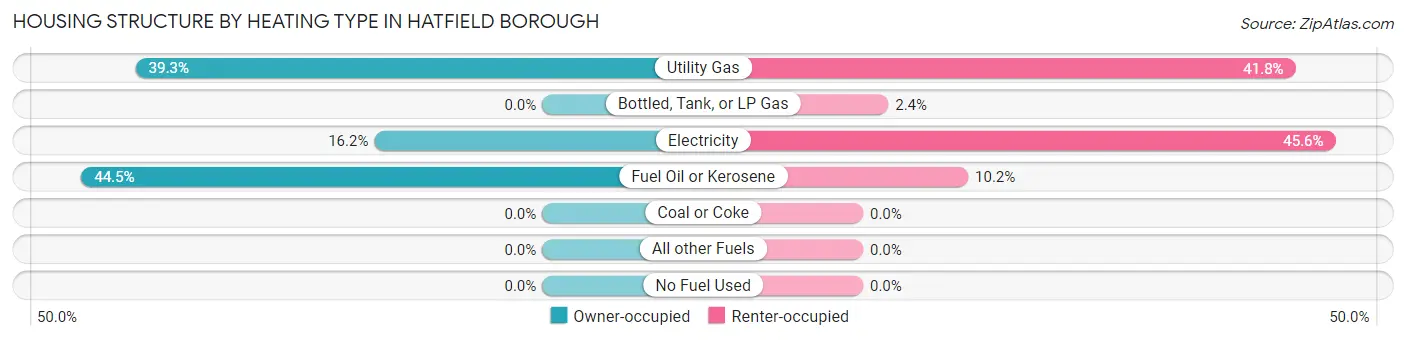
| Heating Type | Owner-occupied | Renter-occupied |
| Utility Gas | 247 (39.3%) | 325 (41.8%) |
| Bottled, Tank, or LP Gas | 0 (0.0%) | 19 (2.4%) |
| Electricity | 102 (16.2%) | 355 (45.6%) |
| Fuel Oil or Kerosene | 280 (44.5%) | 79 (10.2%) |
| Coal or Coke | 0 (0.0%) | 0 (0.0%) |
| All other Fuels | 0 (0.0%) | 0 (0.0%) |
| No Fuel Used | 0 (0.0%) | 0 (0.0%) |
| Total | 629 (100.0%) | 778 (100.0%) |
Household Vehicle Usage in Hatfield borough
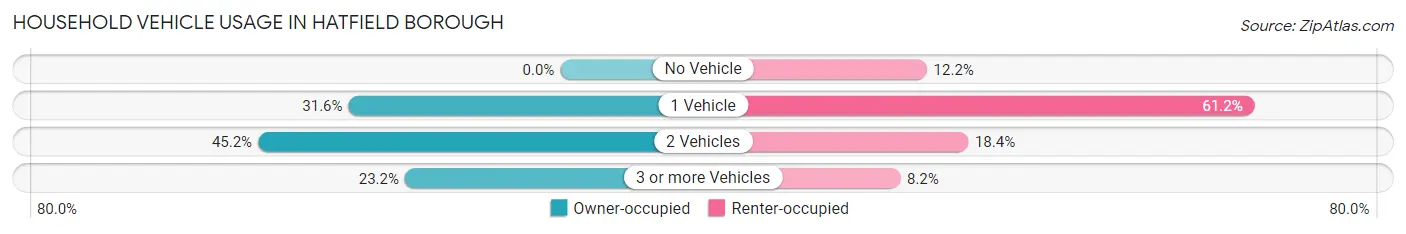
| Vehicles per Household | Owner-occupied | Renter-occupied |
| No Vehicle | 0 (0.0%) | 95 (12.2%) |
| 1 Vehicle | 199 (31.6%) | 476 (61.2%) |
| 2 Vehicles | 284 (45.2%) | 143 (18.4%) |
| 3 or more Vehicles | 146 (23.2%) | 64 (8.2%) |
| Total | 629 (100.0%) | 778 (100.0%) |
Real Estate & Mortgages in Hatfield borough
Real Estate and Mortgage Overview in Hatfield borough
| Characteristic | Without Mortgage | With Mortgage |
| Housing Units | 134 | 495 |
| Median Property Value | $277,500 | $305,800 |
| Median Household Income | $71,111 | $153 |
| Monthly Housing Costs | $629 | $34 |
| Real Estate Taxes | $3,619 | $0 |
Property Value by Mortgage Status in Hatfield borough
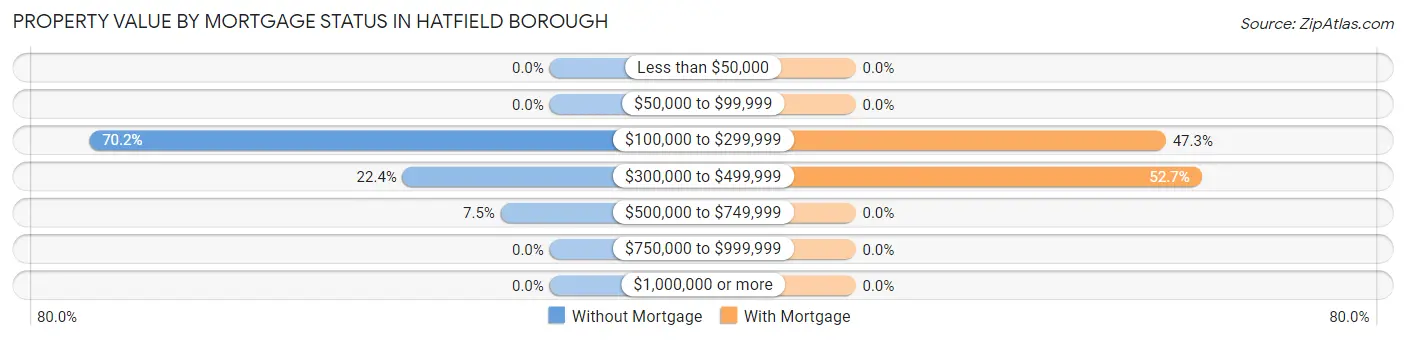
| Property Value | Without Mortgage | With Mortgage |
| Less than $50,000 | 0 (0.0%) | 0 (0.0%) |
| $50,000 to $99,999 | 0 (0.0%) | 0 (0.0%) |
| $100,000 to $299,999 | 94 (70.2%) | 234 (47.3%) |
| $300,000 to $499,999 | 30 (22.4%) | 261 (52.7%) |
| $500,000 to $749,999 | 10 (7.5%) | 0 (0.0%) |
| $750,000 to $999,999 | 0 (0.0%) | 0 (0.0%) |
| $1,000,000 or more | 0 (0.0%) | 0 (0.0%) |
| Total | 134 (100.0%) | 495 (100.0%) |
Household Income by Mortgage Status in Hatfield borough
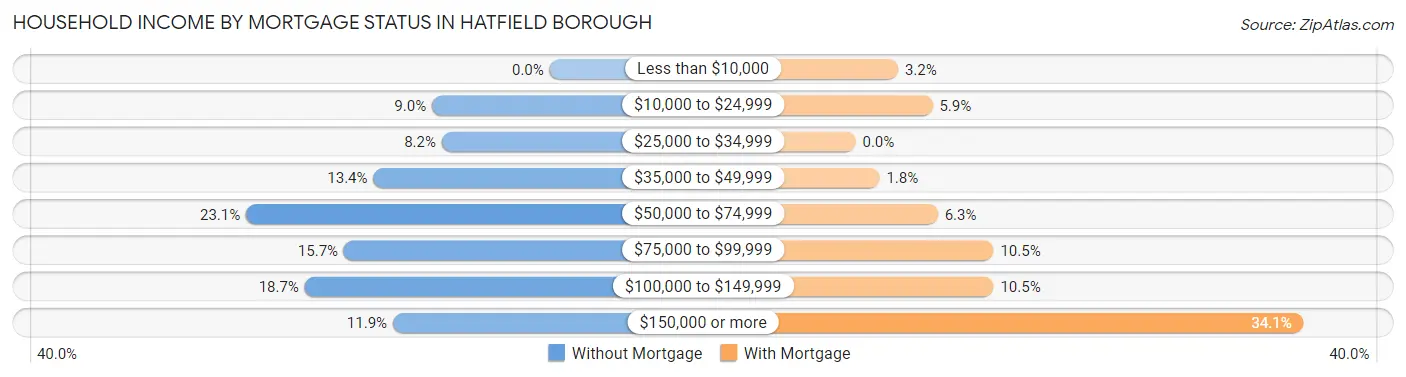
| Household Income | Without Mortgage | With Mortgage |
| Less than $10,000 | 0 (0.0%) | 16 (3.2%) |
| $10,000 to $24,999 | 12 (9.0%) | 29 (5.9%) |
| $25,000 to $34,999 | 11 (8.2%) | 0 (0.0%) |
| $35,000 to $49,999 | 18 (13.4%) | 9 (1.8%) |
| $50,000 to $74,999 | 31 (23.1%) | 31 (6.3%) |
| $75,000 to $99,999 | 21 (15.7%) | 52 (10.5%) |
| $100,000 to $149,999 | 25 (18.7%) | 52 (10.5%) |
| $150,000 or more | 16 (11.9%) | 169 (34.1%) |
| Total | 134 (100.0%) | 495 (100.0%) |
Property Value to Household Income Ratio in Hatfield borough
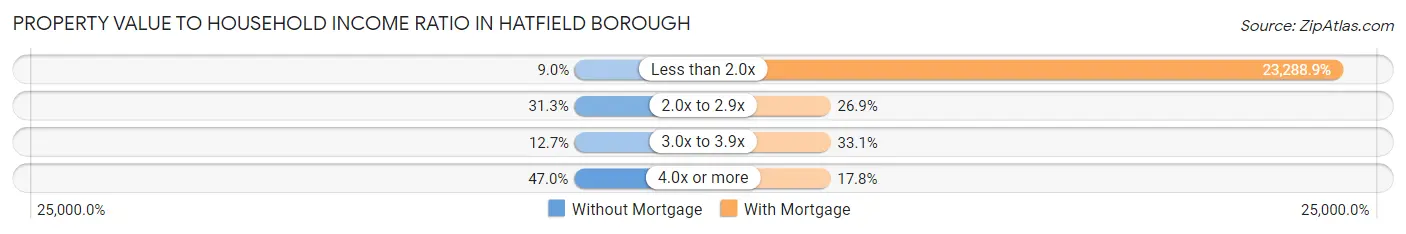
| Value-to-Income Ratio | Without Mortgage | With Mortgage |
| Less than 2.0x | 12 (9.0%) | 115,280 (23,288.9%) |
| 2.0x to 2.9x | 42 (31.3%) | 133 (26.9%) |
| 3.0x to 3.9x | 17 (12.7%) | 164 (33.1%) |
| 4.0x or more | 63 (47.0%) | 88 (17.8%) |
| Total | 134 (100.0%) | 495 (100.0%) |
Real Estate Taxes by Mortgage Status in Hatfield borough
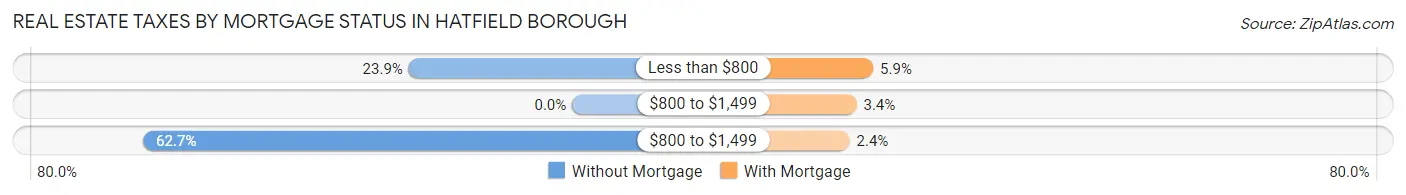
| Property Taxes | Without Mortgage | With Mortgage |
| Less than $800 | 32 (23.9%) | 29 (5.9%) |
| $800 to $1,499 | 0 (0.0%) | 17 (3.4%) |
| $800 to $1,499 | 84 (62.7%) | 12 (2.4%) |
| Total | 134 (100.0%) | 495 (100.0%) |
Health & Disability in Hatfield borough
Health Insurance Coverage by Age in Hatfield borough
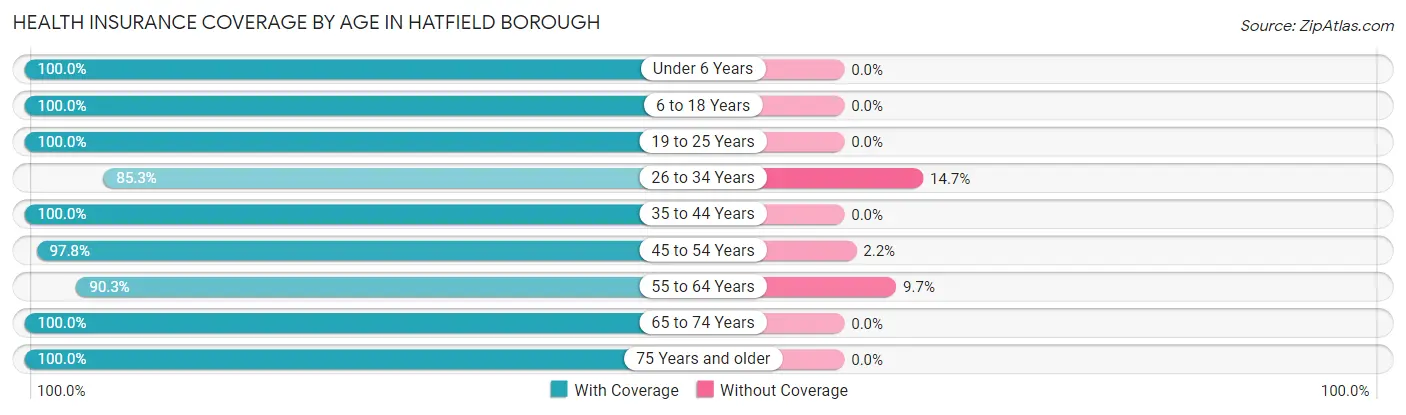
| Age Bracket | With Coverage | Without Coverage |
| Under 6 Years | 201 (100.0%) | 0 (0.0%) |
| 6 to 18 Years | 760 (100.0%) | 0 (0.0%) |
| 19 to 25 Years | 302 (100.0%) | 0 (0.0%) |
| 26 to 34 Years | 412 (85.3%) | 71 (14.7%) |
| 35 to 44 Years | 434 (100.0%) | 0 (0.0%) |
| 45 to 54 Years | 436 (97.8%) | 10 (2.2%) |
| 55 to 64 Years | 327 (90.3%) | 35 (9.7%) |
| 65 to 74 Years | 380 (100.0%) | 0 (0.0%) |
| 75 Years and older | 117 (100.0%) | 0 (0.0%) |
| Total | 3,369 (96.7%) | 116 (3.3%) |
Health Insurance Coverage by Citizenship Status in Hatfield borough
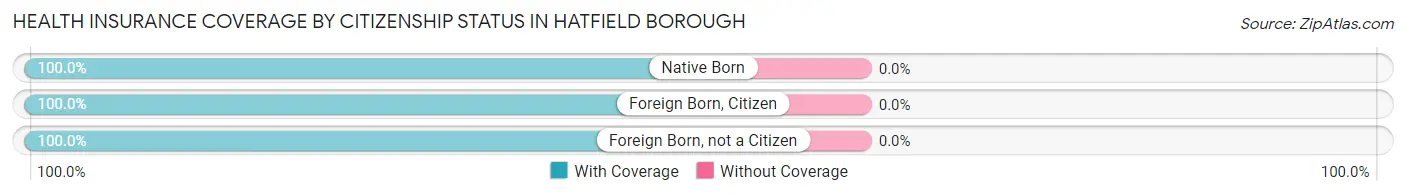
| Citizenship Status | With Coverage | Without Coverage |
| Native Born | 201 (100.0%) | 0 (0.0%) |
| Foreign Born, Citizen | 760 (100.0%) | 0 (0.0%) |
| Foreign Born, not a Citizen | 302 (100.0%) | 0 (0.0%) |
Health Insurance Coverage by Household Income in Hatfield borough
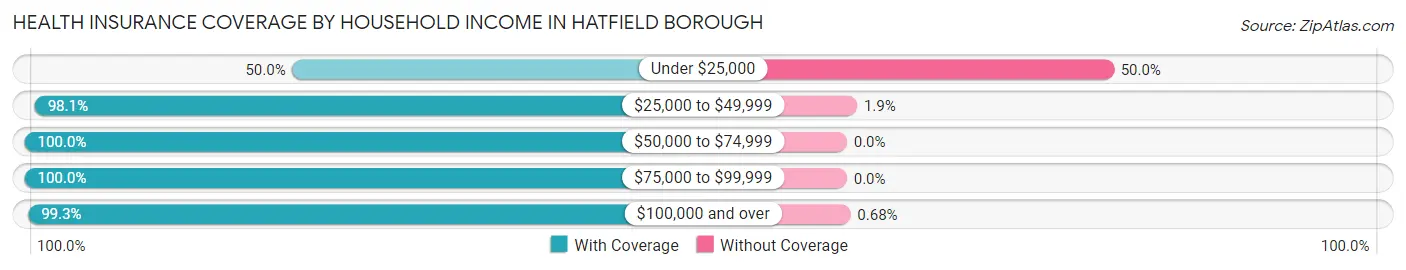
| Household Income | With Coverage | Without Coverage |
| Under $25,000 | 92 (50.0%) | 92 (50.0%) |
| $25,000 to $49,999 | 720 (98.1%) | 14 (1.9%) |
| $50,000 to $74,999 | 731 (100.0%) | 0 (0.0%) |
| $75,000 to $99,999 | 346 (100.0%) | 0 (0.0%) |
| $100,000 and over | 1,467 (99.3%) | 10 (0.7%) |
Public vs Private Health Insurance Coverage by Age in Hatfield borough
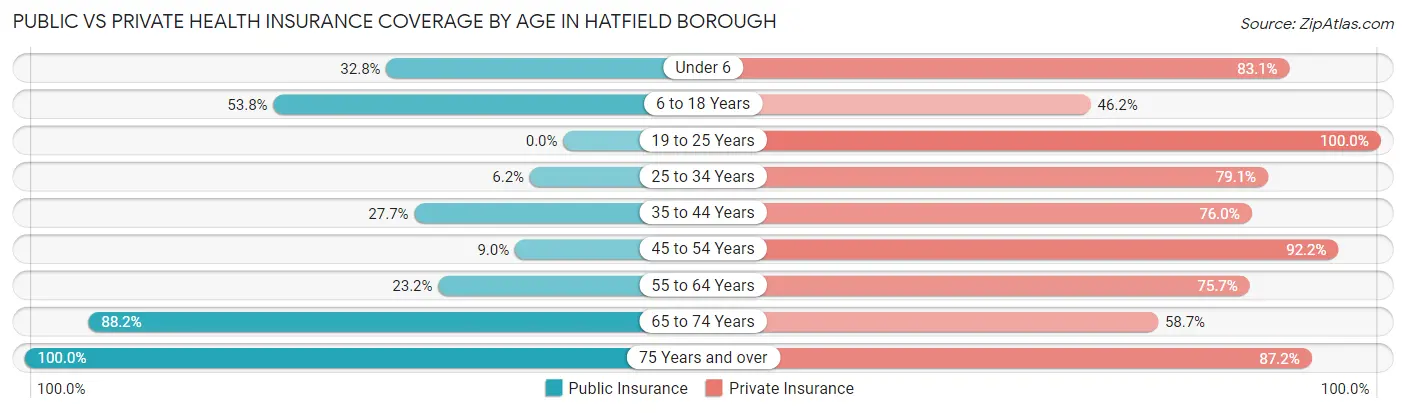
| Age Bracket | Public Insurance | Private Insurance |
| Under 6 | 66 (32.8%) | 167 (83.1%) |
| 6 to 18 Years | 409 (53.8%) | 351 (46.2%) |
| 19 to 25 Years | 0 (0.0%) | 302 (100.0%) |
| 25 to 34 Years | 30 (6.2%) | 382 (79.1%) |
| 35 to 44 Years | 120 (27.7%) | 330 (76.0%) |
| 45 to 54 Years | 40 (9.0%) | 411 (92.1%) |
| 55 to 64 Years | 84 (23.2%) | 274 (75.7%) |
| 65 to 74 Years | 335 (88.2%) | 223 (58.7%) |
| 75 Years and over | 117 (100.0%) | 102 (87.2%) |
| Total | 1,201 (34.5%) | 2,542 (72.9%) |
Disability Status by Sex by Age in Hatfield borough
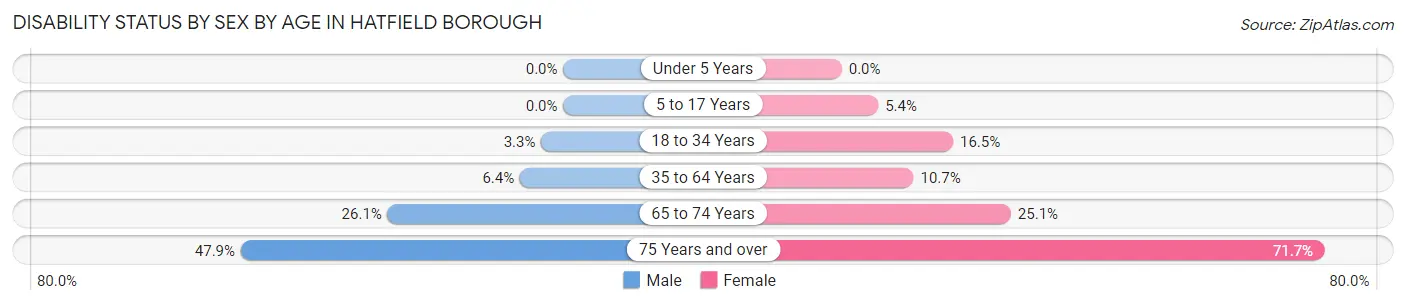
| Age Bracket | Male | Female |
| Under 5 Years | 0 (0.0%) | 0 (0.0%) |
| 5 to 17 Years | 0 (0.0%) | 29 (5.4%) |
| 18 to 34 Years | 13 (3.3%) | 74 (16.5%) |
| 35 to 64 Years | 43 (6.4%) | 61 (10.6%) |
| 65 to 74 Years | 42 (26.1%) | 55 (25.1%) |
| 75 Years and over | 34 (47.9%) | 33 (71.7%) |
Disability Class by Sex by Age in Hatfield borough
Disability Class: Hearing Difficulty
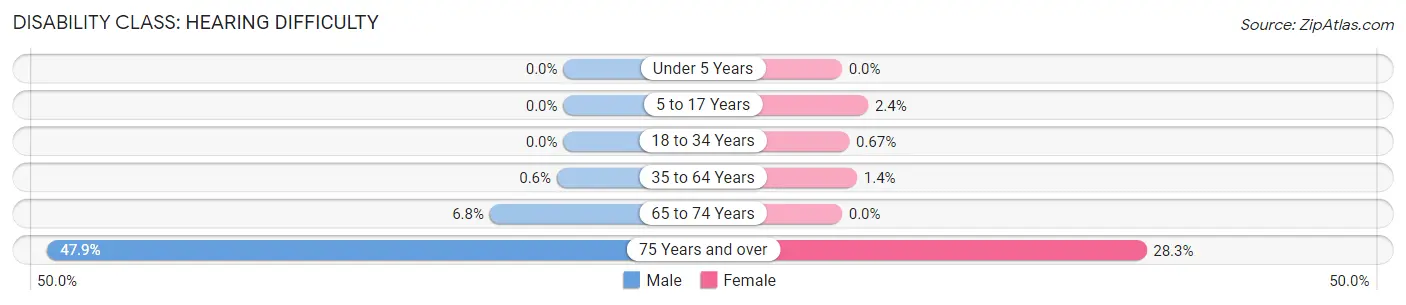
| Age Bracket | Male | Female |
| Under 5 Years | 0 (0.0%) | 0 (0.0%) |
| 5 to 17 Years | 0 (0.0%) | 13 (2.4%) |
| 18 to 34 Years | 0 (0.0%) | 3 (0.7%) |
| 35 to 64 Years | 4 (0.6%) | 8 (1.4%) |
| 65 to 74 Years | 11 (6.8%) | 0 (0.0%) |
| 75 Years and over | 34 (47.9%) | 13 (28.3%) |
Disability Class: Vision Difficulty
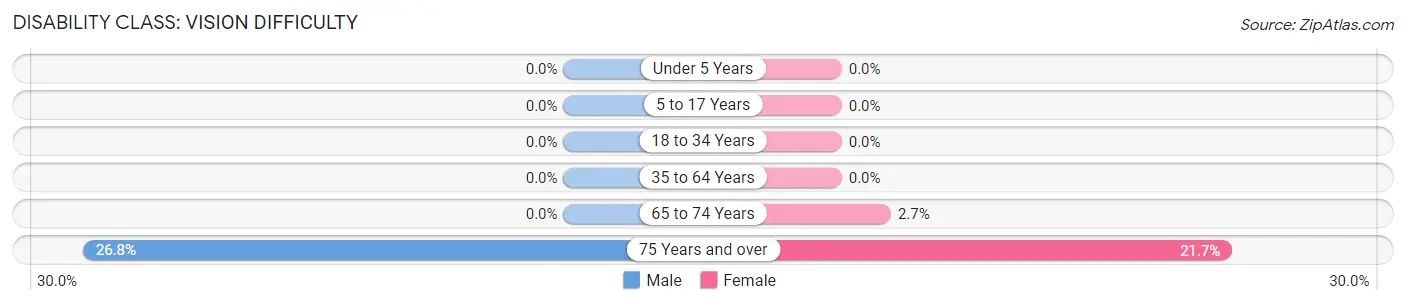
| Age Bracket | Male | Female |
| Under 5 Years | 0 (0.0%) | 0 (0.0%) |
| 5 to 17 Years | 0 (0.0%) | 0 (0.0%) |
| 18 to 34 Years | 0 (0.0%) | 0 (0.0%) |
| 35 to 64 Years | 0 (0.0%) | 0 (0.0%) |
| 65 to 74 Years | 0 (0.0%) | 6 (2.7%) |
| 75 Years and over | 19 (26.8%) | 10 (21.7%) |
Disability Class: Cognitive Difficulty
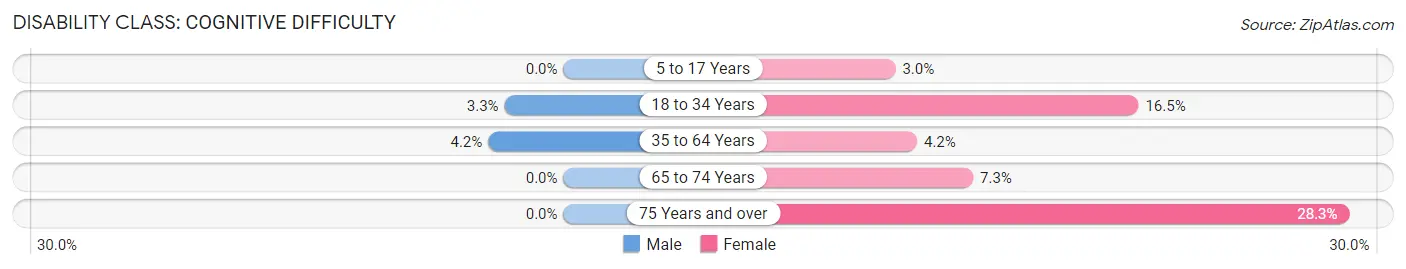
| Age Bracket | Male | Female |
| 5 to 17 Years | 0 (0.0%) | 16 (3.0%) |
| 18 to 34 Years | 13 (3.3%) | 74 (16.5%) |
| 35 to 64 Years | 28 (4.2%) | 24 (4.2%) |
| 65 to 74 Years | 0 (0.0%) | 16 (7.3%) |
| 75 Years and over | 0 (0.0%) | 13 (28.3%) |
Disability Class: Ambulatory Difficulty
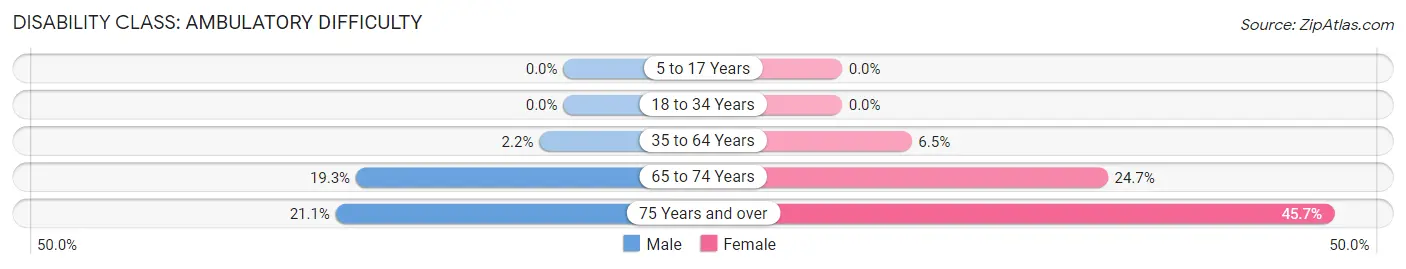
| Age Bracket | Male | Female |
| 5 to 17 Years | 0 (0.0%) | 0 (0.0%) |
| 18 to 34 Years | 0 (0.0%) | 0 (0.0%) |
| 35 to 64 Years | 15 (2.2%) | 37 (6.5%) |
| 65 to 74 Years | 31 (19.3%) | 54 (24.7%) |
| 75 Years and over | 15 (21.1%) | 21 (45.7%) |
Disability Class: Self-Care Difficulty
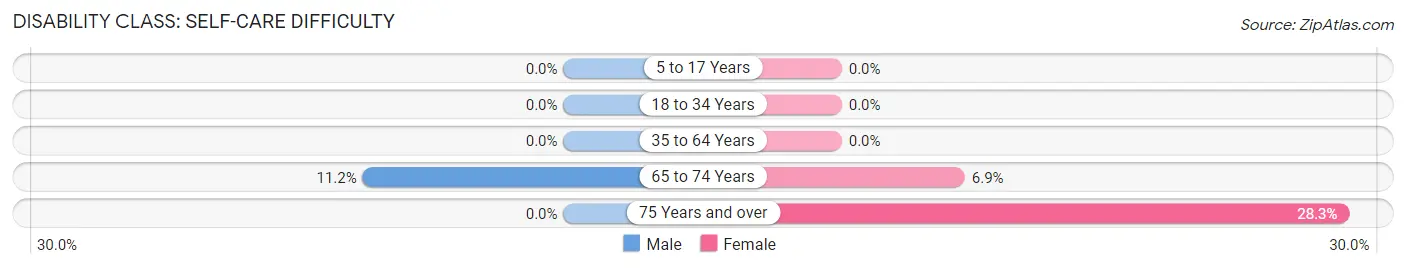
| Age Bracket | Male | Female |
| 5 to 17 Years | 0 (0.0%) | 0 (0.0%) |
| 18 to 34 Years | 0 (0.0%) | 0 (0.0%) |
| 35 to 64 Years | 0 (0.0%) | 0 (0.0%) |
| 65 to 74 Years | 18 (11.2%) | 15 (6.9%) |
| 75 Years and over | 0 (0.0%) | 13 (28.3%) |
Technology Access in Hatfield borough
Computing Device Access in Hatfield borough
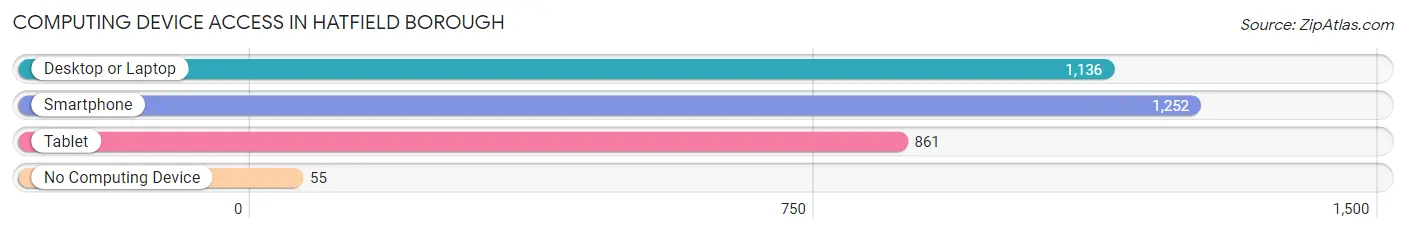
| Device Type | # Households | % Households |
| Desktop or Laptop | 1,136 | 80.7% |
| Smartphone | 1,252 | 89.0% |
| Tablet | 861 | 61.2% |
| No Computing Device | 55 | 3.9% |
| Total | 1,407 | 100.0% |
Internet Access in Hatfield borough
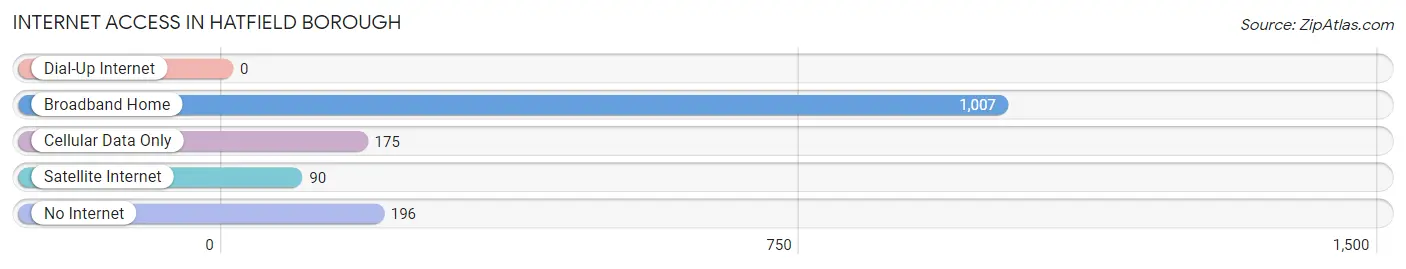
| Internet Type | # Households | % Households |
| Dial-Up Internet | 0 | 0.0% |
| Broadband Home | 1,007 | 71.6% |
| Cellular Data Only | 175 | 12.4% |
| Satellite Internet | 90 | 6.4% |
| No Internet | 196 | 13.9% |
| Total | 1,407 | 100.0% |
Hatfield borough Summary
Hatfield Borough is a small borough located in Montgomery County, Pennsylvania. It is situated in the southeastern part of the county, approximately 20 miles north of Philadelphia. The borough is bordered by the townships of Hatfield, Franconia, and Towamencin. As of the 2010 census, the population of Hatfield Borough was 3,290.
History
Hatfield Borough was first settled in the early 1700s by German immigrants. The area was originally known as “Germantown” and was part of the larger Germantown Township. In 1836, the area was incorporated as a borough and was renamed Hatfield in honor of the Hatfield family, who were prominent landowners in the area.
The borough was primarily an agricultural community until the late 19th century, when the North Penn Railroad was built through the area. This allowed for the development of industry and commerce in the area, and the population of the borough began to grow. By the early 20th century, Hatfield had become a thriving industrial center, with several factories and businesses located in the borough.
Geography
Hatfield Borough is located at 40°14'N 75°17'W (40.23, -75.29). According to the United States Census Bureau, the borough has a total area of 1.2 square miles (3.1 km2), all of it land.
The borough is located in the southeastern part of Montgomery County, approximately 20 miles north of Philadelphia. It is bordered by the townships of Hatfield, Franconia, and Towamencin. The borough is situated on the banks of the Skippack Creek, which flows through the center of the borough.
Economy
Hatfield Borough has a diverse economy, with a mix of industrial, commercial, and residential businesses. The borough is home to several manufacturing and industrial businesses, including a paper mill, a printing company, and a plastics factory. The borough also has several retail businesses, including a grocery store, a hardware store, and several restaurants.
The borough is also home to several small businesses, including a bakery, a florist, and a pet store. The borough is also home to several professional services, including a law firm, an accounting firm, and a real estate agency.
Demographics
As of the 2010 census, there were 3,290 people, 1,232 households, and 845 families residing in the borough. The population density was 2,743.3 people per square mile (1,058.2/km2). There were 1,323 housing units at an average density of 1,093.3 per square mile (422.2/km2). The racial makeup of the borough was 94.2% White, 1.2% African American, 0.2% Native American, 1.7% Asian, 0.7% from other races, and 2.0% from two or more races. Hispanic or Latino of any race were 3.2% of the population.
There were 1,232 households, out of which 33.2% had children under the age of 18 living with them, 51.2% were married couples living together, 11.7% had a female householder with no husband present, and 32.2% were non-families. 26.7% of all households were made up of individuals, and 10.2% had someone living alone who was 65 years of age or older. The average household size was 2.64 and the average family size was 3.22.
In the borough, the population was spread out, with 25.2% under the age of 18, 7.2% from 18 to 24, 32.2% from 25 to 44, 21.3% from 45 to 64, and 14.1% who were 65 years of age or older. The median age was 36 years. For every 100 females, there were 94.2 males. For every 100 females age 18 and over, there were 91.2 males.
The median income for a household in the borough was $50,938, and the median income for a family was $60,938. Males had a median income of $41,938 versus $30,938 for females. The per capita income for the borough was $23,938. About 4.2% of families and 5.2% of the population were below the poverty line, including 6.2% of those under age 18 and 4.2% of those age 65 or over.
Common Questions
What is Per Capita Income in Hatfield borough?
Per Capita income in Hatfield borough is $32,035.
What is the Median Family Income in Hatfield borough?
Median Family Income in Hatfield borough is $89,286.
What is the Median Household income in Hatfield borough?
Median Household Income in Hatfield borough is $65,257.
What is Income or Wage Gap in Hatfield borough?
Income or Wage Gap in Hatfield borough is 16.4%.
Women in Hatfield borough earn 83.6 cents for every dollar earned by a man.
What is Inequality or Gini Index in Hatfield borough?
Inequality or Gini Index in Hatfield borough is 0.41.
What is the Total Population of Hatfield borough?
Total Population of Hatfield borough is 3,490.
What is the Total Male Population of Hatfield borough?
Total Male Population of Hatfield borough is 1,571.
What is the Total Female Population of Hatfield borough?
Total Female Population of Hatfield borough is 1,919.
What is the Ratio of Males per 100 Females in Hatfield borough?
There are 81.87 Males per 100 Females in Hatfield borough.
What is the Ratio of Females per 100 Males in Hatfield borough?
There are 122.15 Females per 100 Males in Hatfield borough.
What is the Median Population Age in Hatfield borough?
Median Population Age in Hatfield borough is 35.0 Years.
What is the Average Family Size in Hatfield borough
Average Family Size in Hatfield borough is 3.3 People.
What is the Average Household Size in Hatfield borough
Average Household Size in Hatfield borough is 2.5 People.
How Large is the Labor Force in Hatfield borough?
There are 1,996 People in the Labor Forcein in Hatfield borough.
What is the Percentage of People in the Labor Force in Hatfield borough?
71.7% of People are in the Labor Force in Hatfield borough.
What is the Unemployment Rate in Hatfield borough?
Unemployment Rate in Hatfield borough is 4.2%.