Eagleville CDP Montgomery County, PA Map & Demographics
Eagleville CDP Montgomery County Overview
$33,426
PER CAPITA INCOME
$115,417
AVG FAMILY INCOME
$111,574
AVG HOUSEHOLD INCOME
47.6%
WAGE / INCOME GAP [ % ]
52.4¢/ $1
WAGE / INCOME GAP [ $ ]
0.41
INEQUALITY / GINI INDEX
5,162
TOTAL POPULATION
2,936
MALE POPULATION
2,226
FEMALE POPULATION
131.90
MALES / 100 FEMALES
75.82
FEMALES / 100 MALES
38.1
MEDIAN AGE
3.2
AVG FAMILY SIZE
2.8
AVG HOUSEHOLD SIZE
2,073
LABOR FORCE [ PEOPLE ]
46.9%
PERCENT IN LABOR FORCE
7.0%
UNEMPLOYMENT RATE
Income in Eagleville CDP Montgomery County
Income Overview in Eagleville CDP Montgomery County
Per Capita Income in Eagleville CDP Montgomery County is $33,426, while median incomes of families and households are $115,417 and $111,574 respectively.
| Characteristic | Number | Measure |
| Per Capita Income | 5,162 | $33,426 |
| Median Family Income | 982 | $115,417 |
| Mean Family Income | 982 | $137,701 |
| Median Household Income | 1,306 | $111,574 |
| Mean Household Income | 1,306 | $126,219 |
| Income Deficit | 982 | $0 |
| Wage / Income Gap (%) | 5,162 | 47.55% |
| Wage / Income Gap ($) | 5,162 | 52.45¢ per $1 |
| Gini / Inequality Index | 5,162 | 0.41 |
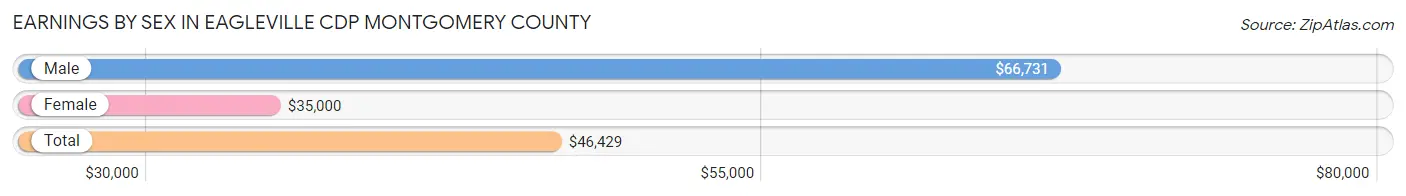
Earnings by Sex in Eagleville CDP Montgomery County
Average Earnings in Eagleville CDP Montgomery County are $46,429, $66,731 for men and $35,000 for women, a difference of 47.5%.
| Sex | Number | Average Earnings |
| Male | 1,162 (50.6%) | $66,731 |
| Female | 1,132 (49.3%) | $35,000 |
| Total | 2,294 (100.0%) | $46,429 |
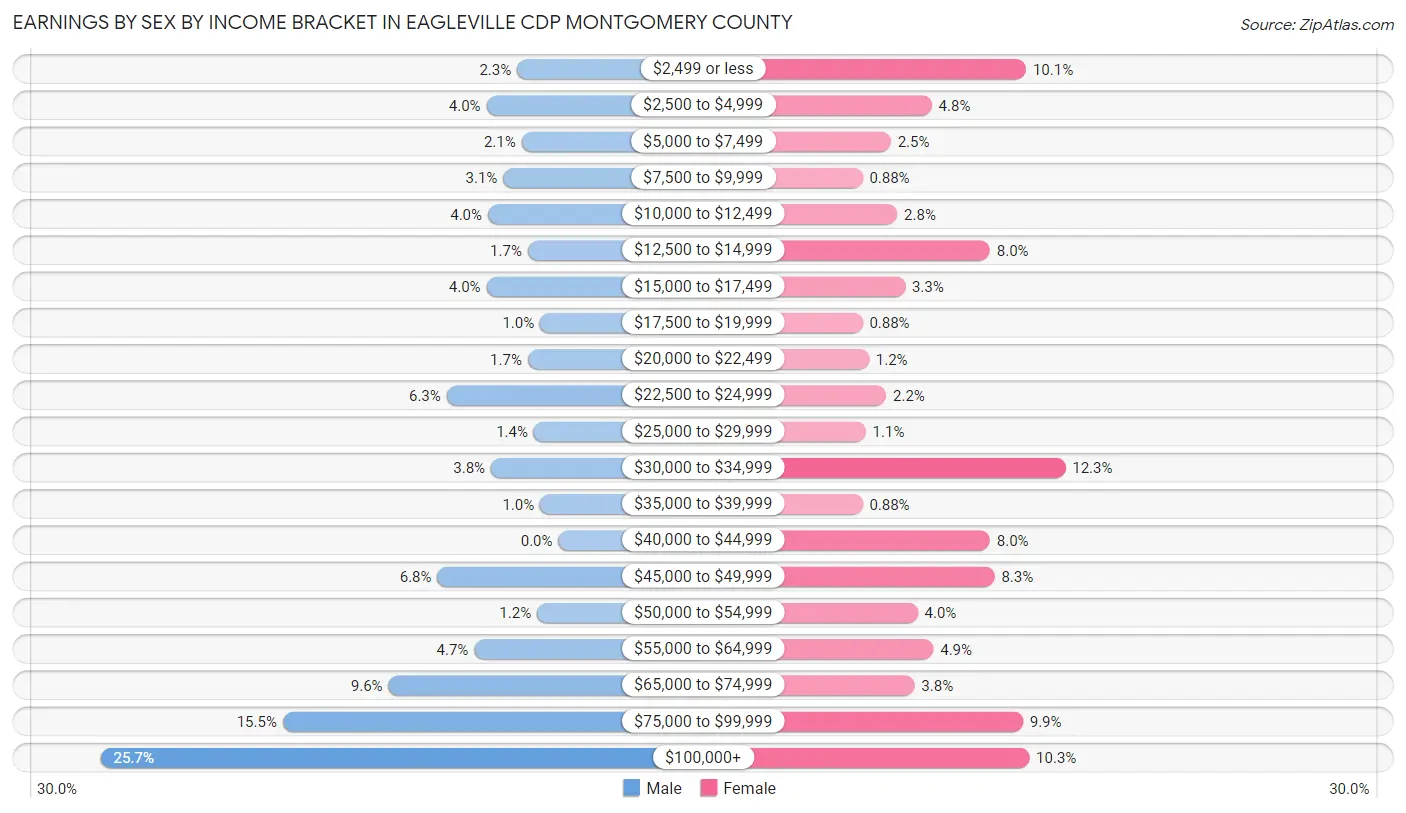
Earnings by Sex by Income Bracket in Eagleville CDP Montgomery County
The most common earnings brackets in Eagleville CDP Montgomery County are $100,000+ for men (299 | 25.7%) and $30,000 to $34,999 for women (139 | 12.3%).
| Income | Male | Female |
| $2,499 or less | 27 (2.3%) | 114 (10.1%) |
| $2,500 to $4,999 | 47 (4.0%) | 54 (4.8%) |
| $5,000 to $7,499 | 24 (2.1%) | 28 (2.5%) |
| $7,500 to $9,999 | 36 (3.1%) | 10 (0.9%) |
| $10,000 to $12,499 | 46 (4.0%) | 32 (2.8%) |
| $12,500 to $14,999 | 20 (1.7%) | 91 (8.0%) |
| $15,000 to $17,499 | 47 (4.0%) | 37 (3.3%) |
| $17,500 to $19,999 | 12 (1.0%) | 10 (0.9%) |
| $20,000 to $22,499 | 20 (1.7%) | 14 (1.2%) |
| $22,500 to $24,999 | 73 (6.3%) | 25 (2.2%) |
| $25,000 to $29,999 | 16 (1.4%) | 12 (1.1%) |
| $30,000 to $34,999 | 44 (3.8%) | 139 (12.3%) |
| $35,000 to $39,999 | 12 (1.0%) | 10 (0.9%) |
| $40,000 to $44,999 | 0 (0.0%) | 91 (8.0%) |
| $45,000 to $49,999 | 79 (6.8%) | 94 (8.3%) |
| $50,000 to $54,999 | 14 (1.2%) | 45 (4.0%) |
| $55,000 to $64,999 | 55 (4.7%) | 55 (4.9%) |
| $65,000 to $74,999 | 111 (9.6%) | 43 (3.8%) |
| $75,000 to $99,999 | 180 (15.5%) | 112 (9.9%) |
| $100,000+ | 299 (25.7%) | 116 (10.2%) |
| Total | 1,162 (100.0%) | 1,132 (100.0%) |
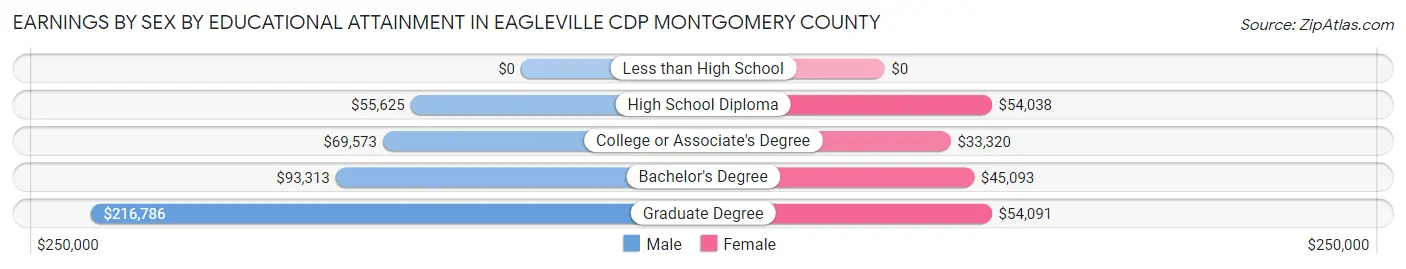
Earnings by Sex by Educational Attainment in Eagleville CDP Montgomery County
Average earnings in Eagleville CDP Montgomery County are $69,224 for men and $42,266 for women, a difference of 38.9%. Men with an educational attainment of graduate degree enjoy the highest average annual earnings of $216,786, while those with high school diploma education earn the least with $55,625. Women with an educational attainment of graduate degree earn the most with the average annual earnings of $54,091, while those with college or associate's degree education have the smallest earnings of $33,320.
| Educational Attainment | Male Income | Female Income |
| Less than High School | - | - |
| High School Diploma | $55,625 | $54,038 |
| College or Associate's Degree | $69,573 | $33,320 |
| Bachelor's Degree | $93,313 | $45,093 |
| Graduate Degree | $216,786 | $54,091 |
| Total | $69,224 | $42,266 |
Family Income in Eagleville CDP Montgomery County
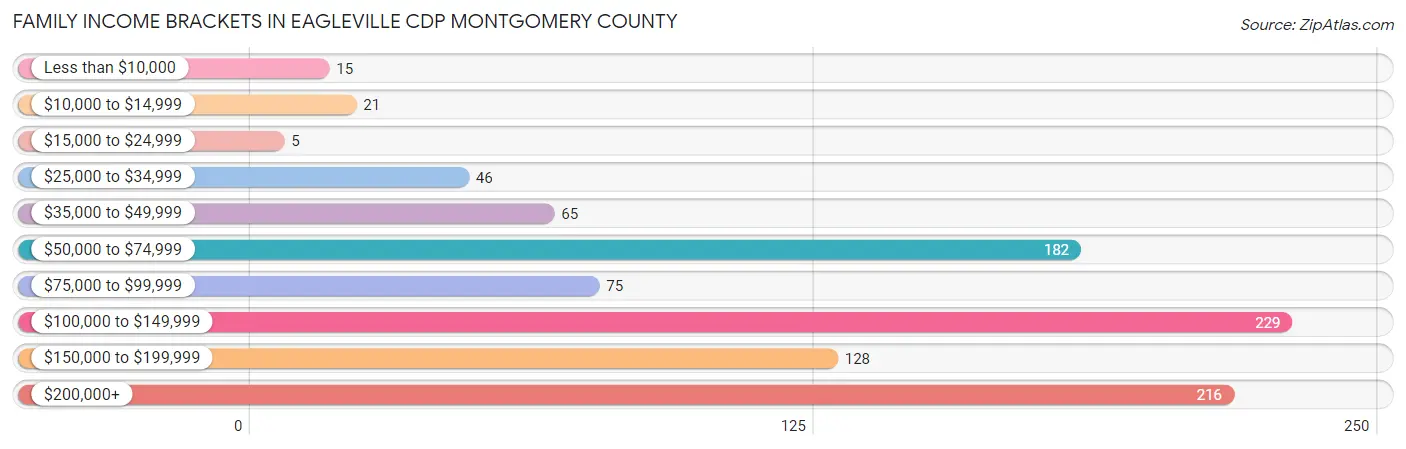
Family Income Brackets in Eagleville CDP Montgomery County
According to the Eagleville CDP Montgomery County family income data, there are 229 families falling into the $100,000 to $149,999 income range, which is the most common income bracket and makes up 23.3% of all families. Conversely, the $15,000 to $24,999 income bracket is the least frequent group with only 5 families (0.5%) belonging to this category.
| Income Bracket | # Families | % Families |
| Less than $10,000 | 15 | 1.5% |
| $10,000 to $14,999 | 21 | 2.1% |
| $15,000 to $24,999 | 5 | 0.5% |
| $25,000 to $34,999 | 46 | 4.7% |
| $35,000 to $49,999 | 65 | 6.6% |
| $50,000 to $74,999 | 182 | 18.5% |
| $75,000 to $99,999 | 75 | 7.6% |
| $100,000 to $149,999 | 229 | 23.3% |
| $150,000 to $199,999 | 128 | 13.0% |
| $200,000+ | 216 | 22.0% |
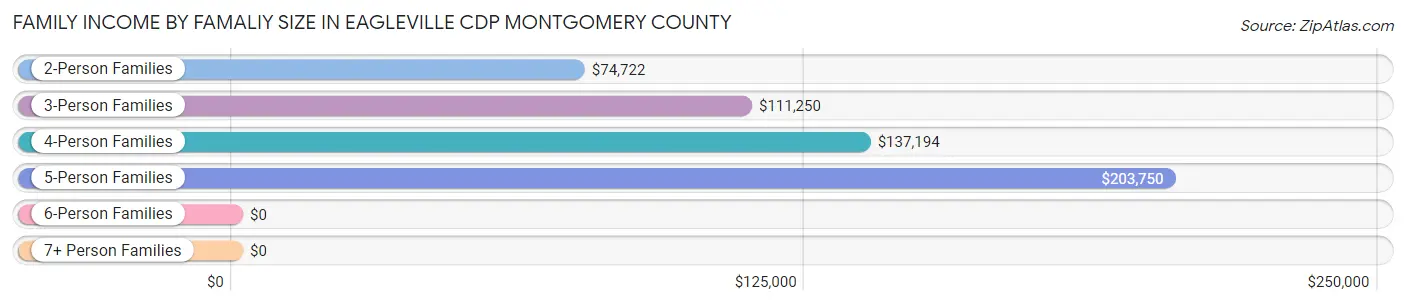
Family Income by Famaliy Size in Eagleville CDP Montgomery County
5-person families (39 | 4.0%) account for the highest median family income in Eagleville CDP Montgomery County with $203,750 per family, while 5-person families (39 | 4.0%) have the highest median income of $40,750 per family member.
| Income Bracket | # Families | Median Income |
| 2-Person Families | 452 (46.0%) | $74,722 |
| 3-Person Families | 164 (16.7%) | $111,250 |
| 4-Person Families | 279 (28.4%) | $137,194 |
| 5-Person Families | 39 (4.0%) | $203,750 |
| 6-Person Families | 48 (4.9%) | $0 |
| 7+ Person Families | 0 (0.0%) | $0 |
| Total | 982 (100.0%) | $115,417 |
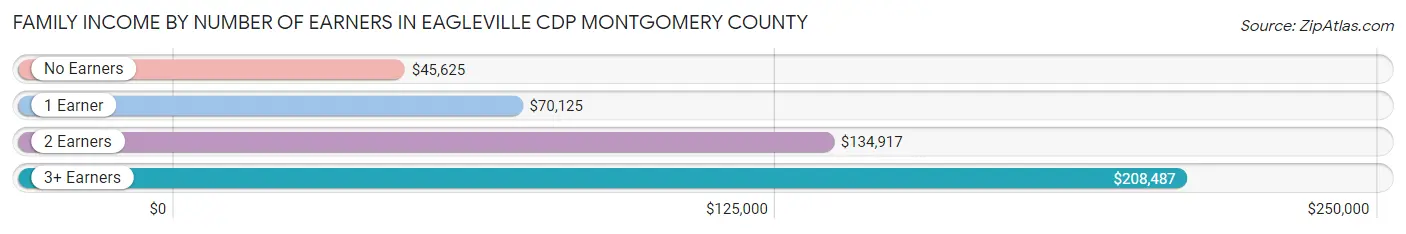
Family Income by Number of Earners in Eagleville CDP Montgomery County
The median family income in Eagleville CDP Montgomery County is $115,417, with families comprising 3+ earners (198) having the highest median family income of $208,487, while families with no earners (125) have the lowest median family income of $45,625, accounting for 20.2% and 12.7% of families, respectively.
| Number of Earners | # Families | Median Income |
| No Earners | 125 (12.7%) | $45,625 |
| 1 Earner | 261 (26.6%) | $70,125 |
| 2 Earners | 398 (40.5%) | $134,917 |
| 3+ Earners | 198 (20.2%) | $208,487 |
| Total | 982 (100.0%) | $115,417 |
Household Income in Eagleville CDP Montgomery County
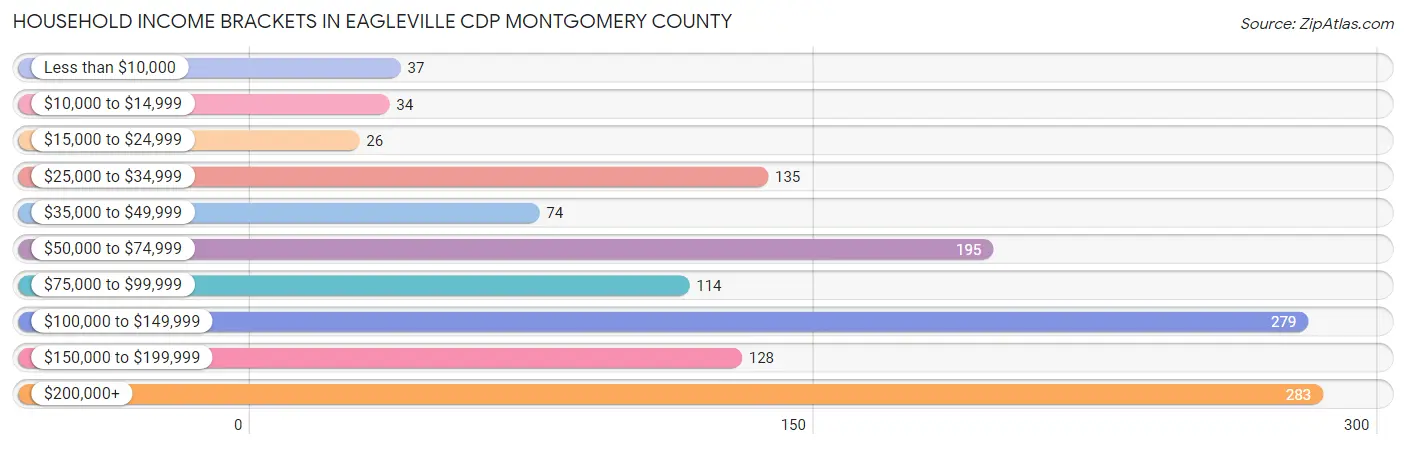
Household Income Brackets in Eagleville CDP Montgomery County
With 283 households falling in the category, the $200,000+ income range is the most frequent in Eagleville CDP Montgomery County, accounting for 21.7% of all households. In contrast, only 26 households (2.0%) fall into the $15,000 to $24,999 income bracket, making it the least populous group.
| Income Bracket | # Households | % Households |
| Less than $10,000 | 37 | 2.8% |
| $10,000 to $14,999 | 34 | 2.6% |
| $15,000 to $24,999 | 26 | 2.0% |
| $25,000 to $34,999 | 135 | 10.3% |
| $35,000 to $49,999 | 74 | 5.7% |
| $50,000 to $74,999 | 195 | 14.9% |
| $75,000 to $99,999 | 114 | 8.7% |
| $100,000 to $149,999 | 279 | 21.4% |
| $150,000 to $199,999 | 128 | 9.8% |
| $200,000+ | 283 | 21.7% |
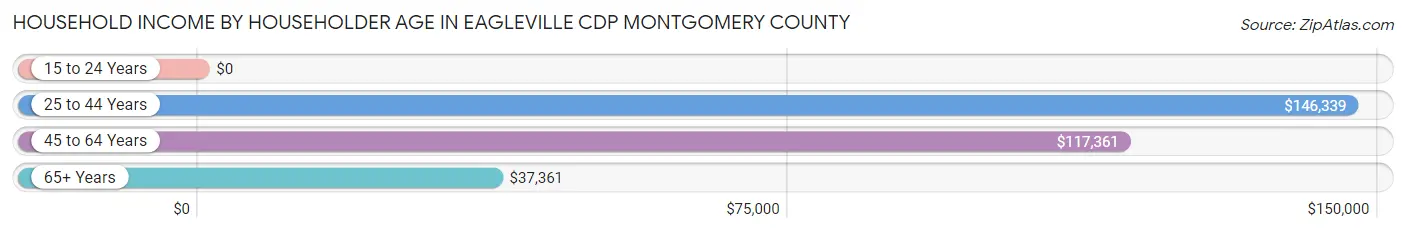
Household Income by Householder Age in Eagleville CDP Montgomery County
The median household income in Eagleville CDP Montgomery County is $111,574, with the highest median household income of $146,339 found in the 25 to 44 years age bracket for the primary householder. A total of 361 households (27.6%) fall into this category. Meanwhile, the 15 to 24 years age bracket for the primary householder has the lowest median household income of $0, with 12 households (0.9%) in this group.
| Income Bracket | # Households | Median Income |
| 15 to 24 Years | 12 (0.9%) | $0 |
| 25 to 44 Years | 361 (27.6%) | $146,339 |
| 45 to 64 Years | 642 (49.2%) | $117,361 |
| 65+ Years | 291 (22.3%) | $37,361 |
| Total | 1,306 (100.0%) | $111,574 |
Poverty in Eagleville CDP Montgomery County
Income Below Poverty by Sex and Age in Eagleville CDP Montgomery County
With 5.2% poverty level for males and 9.5% for females among the residents of Eagleville CDP Montgomery County, 65 to 74 year old males and 12 to 14 year old females are the most vulnerable to poverty, with 27 males (18.8%) and 22 females (34.9%) in their respective age groups living below the poverty level.
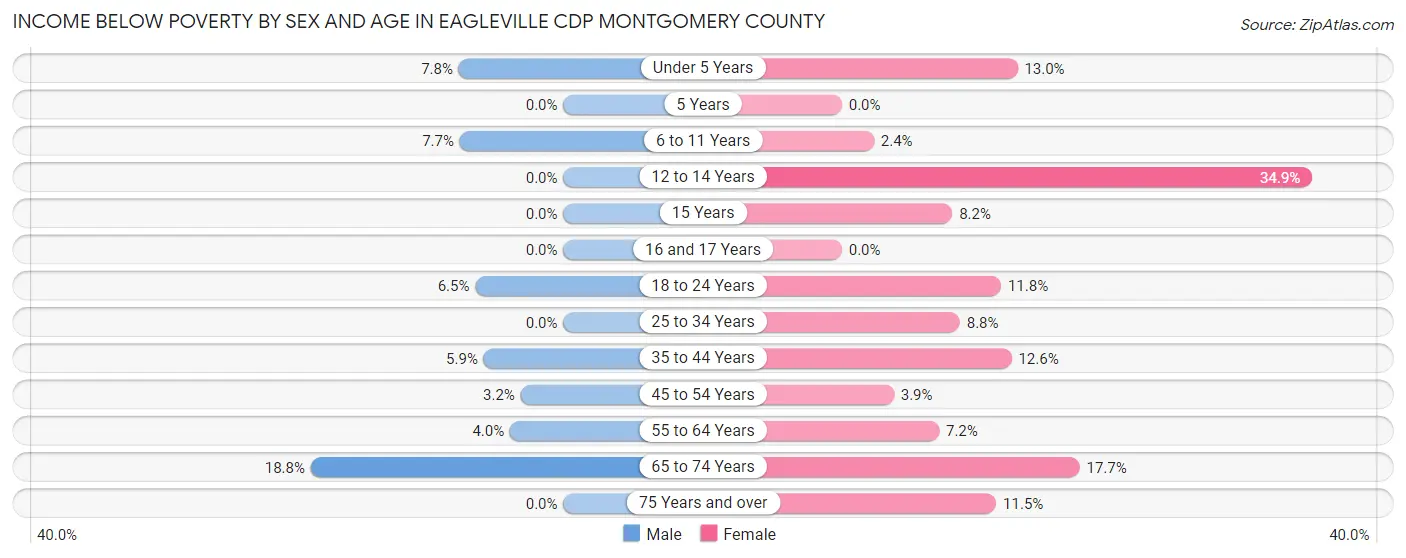
| Age Bracket | Male | Female |
| Under 5 Years | 9 (7.8%) | 6 (13.0%) |
| 5 Years | 0 (0.0%) | 0 (0.0%) |
| 6 to 11 Years | 13 (7.7%) | 5 (2.4%) |
| 12 to 14 Years | 0 (0.0%) | 22 (34.9%) |
| 15 Years | 0 (0.0%) | 5 (8.2%) |
| 16 and 17 Years | 0 (0.0%) | 0 (0.0%) |
| 18 to 24 Years | 10 (6.5%) | 13 (11.8%) |
| 25 to 34 Years | 0 (0.0%) | 24 (8.8%) |
| 35 to 44 Years | 14 (5.9%) | 33 (12.6%) |
| 45 to 54 Years | 8 (3.2%) | 11 (3.9%) |
| 55 to 64 Years | 11 (4.0%) | 19 (7.2%) |
| 65 to 74 Years | 27 (18.8%) | 36 (17.6%) |
| 75 Years and over | 0 (0.0%) | 11 (11.5%) |
| Total | 92 (5.2%) | 185 (9.5%) |
Income Above Poverty by Sex and Age in Eagleville CDP Montgomery County
According to the poverty statistics in Eagleville CDP Montgomery County, males aged 12 to 14 years and females aged 5 years are the age groups that are most secure financially, with 100.0% of males and 100.0% of females in these age groups living above the poverty line.
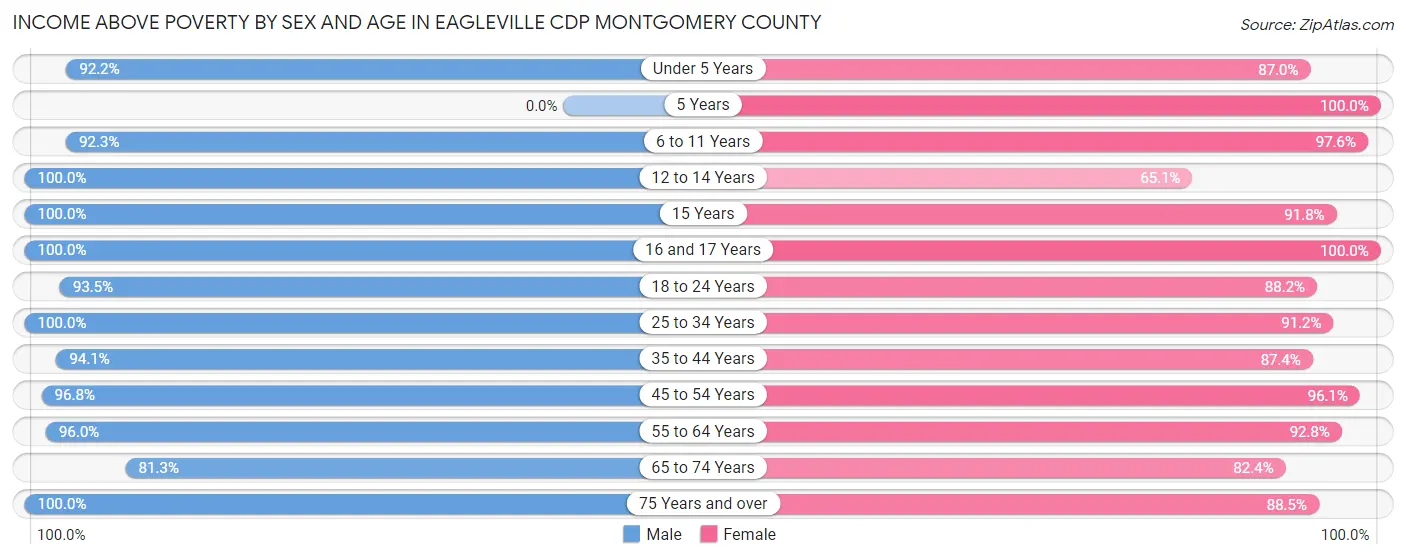
| Age Bracket | Male | Female |
| Under 5 Years | 107 (92.2%) | 40 (87.0%) |
| 5 Years | 0 (0.0%) | 22 (100.0%) |
| 6 to 11 Years | 156 (92.3%) | 205 (97.6%) |
| 12 to 14 Years | 46 (100.0%) | 41 (65.1%) |
| 15 Years | 9 (100.0%) | 56 (91.8%) |
| 16 and 17 Years | 26 (100.0%) | 52 (100.0%) |
| 18 to 24 Years | 143 (93.5%) | 97 (88.2%) |
| 25 to 34 Years | 251 (100.0%) | 250 (91.2%) |
| 35 to 44 Years | 223 (94.1%) | 229 (87.4%) |
| 45 to 54 Years | 244 (96.8%) | 274 (96.1%) |
| 55 to 64 Years | 267 (96.0%) | 244 (92.8%) |
| 65 to 74 Years | 117 (81.2%) | 168 (82.4%) |
| 75 Years and over | 87 (100.0%) | 85 (88.5%) |
| Total | 1,676 (94.8%) | 1,763 (90.5%) |
Income Below Poverty Among Married-Couple Families in Eagleville CDP Montgomery County
The poverty statistics for married-couple families in Eagleville CDP Montgomery County show that 2.7% or 20 of the total 752 families live below the poverty line. Families with 3 or 4 children have the highest poverty rate of 100.0%, comprising of 5 families. On the other hand, families with no children have the lowest poverty rate of 0.0%, which includes 0 families.
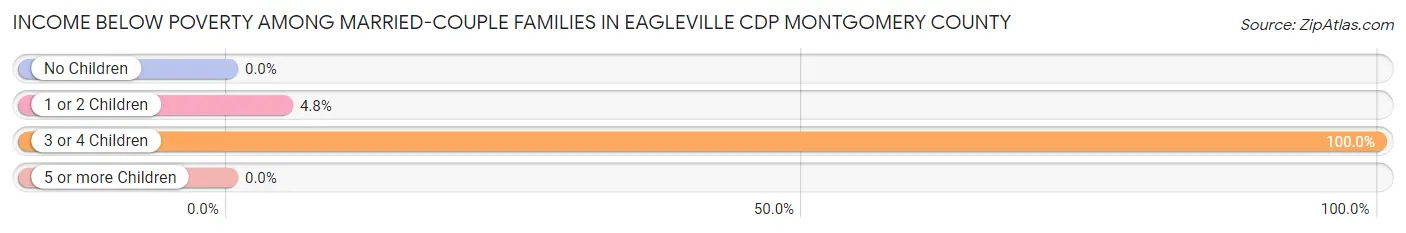
| Children | Above Poverty | Below Poverty |
| No Children | 433 (100.0%) | 0 (0.0%) |
| 1 or 2 Children | 299 (95.2%) | 15 (4.8%) |
| 3 or 4 Children | 0 (0.0%) | 5 (100.0%) |
| 5 or more Children | 0 (0.0%) | 0 (0.0%) |
| Total | 732 (97.3%) | 20 (2.7%) |
Income Below Poverty Among Single-Parent Households in Eagleville CDP Montgomery County
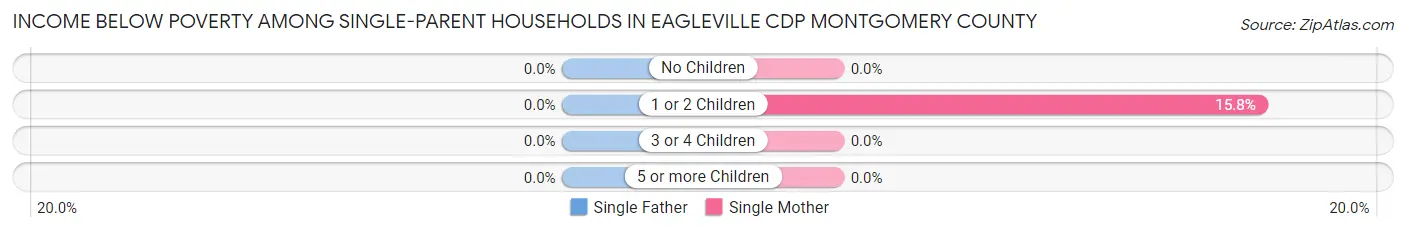
| Children | Single Father | Single Mother |
| No Children | 0 (0.0%) | 0 (0.0%) |
| 1 or 2 Children | 0 (0.0%) | 21 (15.8%) |
| 3 or 4 Children | 0 (0.0%) | 0 (0.0%) |
| 5 or more Children | 0 (0.0%) | 0 (0.0%) |
| Total | 0 (0.0%) | 21 (12.7%) |
Income Below Poverty Among Married-Couple vs Single-Parent Households in Eagleville CDP Montgomery County
The poverty data for Eagleville CDP Montgomery County shows that 20 of the married-couple family households (2.7%) and 21 of the single-parent households (9.1%) are living below the poverty level. Within the married-couple family households, those with 3 or 4 children have the highest poverty rate, with 5 households (100.0%) falling below the poverty line. Among the single-parent households, those with 1 or 2 children have the highest poverty rate, with 21 household (13.2%) living below poverty.
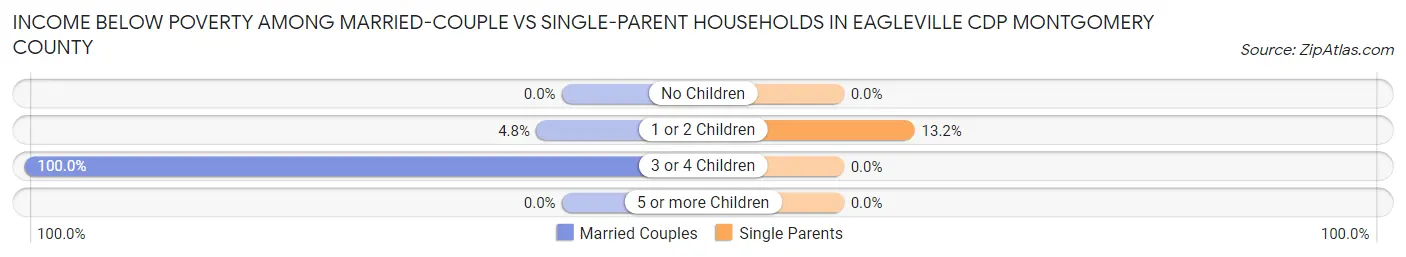
| Children | Married-Couple Families | Single-Parent Households |
| No Children | 0 (0.0%) | 0 (0.0%) |
| 1 or 2 Children | 15 (4.8%) | 21 (13.2%) |
| 3 or 4 Children | 5 (100.0%) | 0 (0.0%) |
| 5 or more Children | 0 (0.0%) | 0 (0.0%) |
| Total | 20 (2.7%) | 21 (9.1%) |
Race in Eagleville CDP Montgomery County
The most populous races in Eagleville CDP Montgomery County are White / Caucasian (3,260 | 63.1%), Black / African American (966 | 18.7%), and Asian (488 | 9.5%).
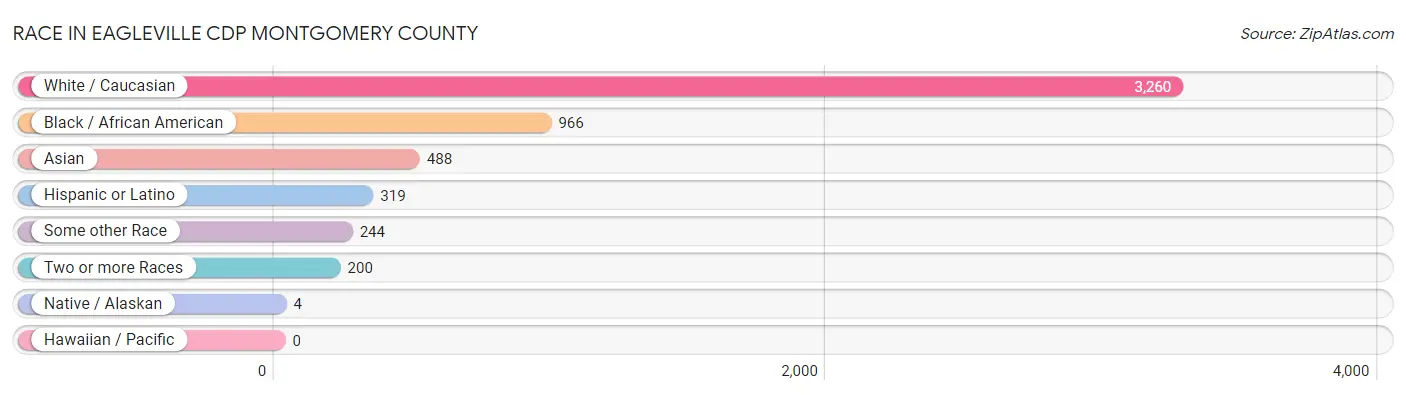
| Race | # Population | % Population |
| Asian | 488 | 9.5% |
| Black / African American | 966 | 18.7% |
| Hawaiian / Pacific | 0 | 0.0% |
| Hispanic or Latino | 319 | 6.2% |
| Native / Alaskan | 4 | 0.1% |
| White / Caucasian | 3,260 | 63.1% |
| Two or more Races | 200 | 3.9% |
| Some other Race | 244 | 4.7% |
| Total | 5,162 | 100.0% |
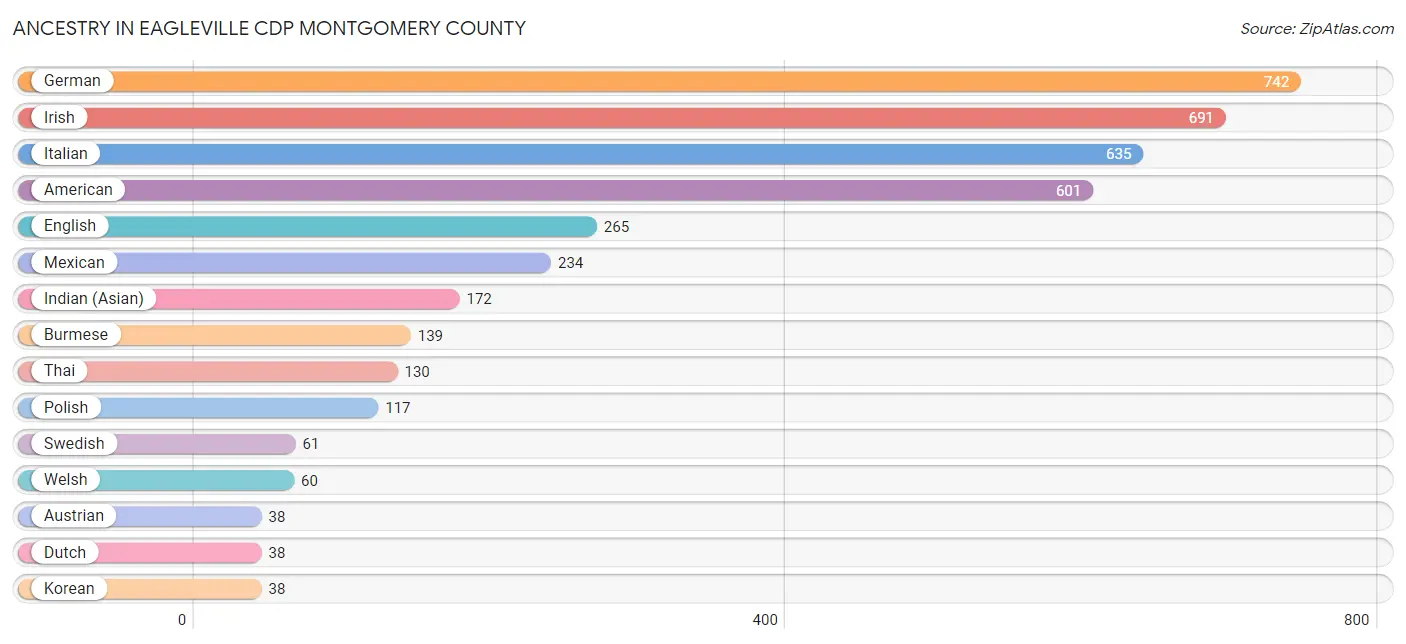
Ancestry in Eagleville CDP Montgomery County
The most populous ancestries reported in Eagleville CDP Montgomery County are German (742 | 14.4%), Irish (691 | 13.4%), Italian (635 | 12.3%), American (601 | 11.6%), and English (265 | 5.1%), together accounting for 56.8% of all Eagleville CDP Montgomery County residents.
| Ancestry | # Population | % Population |
| African | 22 | 0.4% |
| American | 601 | 11.6% |
| Arab | 5 | 0.1% |
| Austrian | 38 | 0.7% |
| Bhutanese | 13 | 0.3% |
| Burmese | 139 | 2.7% |
| Colombian | 14 | 0.3% |
| Czech | 10 | 0.2% |
| Danish | 18 | 0.4% |
| Dutch | 38 | 0.7% |
| Eastern European | 20 | 0.4% |
| Ecuadorian | 5 | 0.1% |
| English | 265 | 5.1% |
| European | 15 | 0.3% |
| French | 20 | 0.4% |
| German | 742 | 14.4% |
| Haitian | 31 | 0.6% |
| Hungarian | 10 | 0.2% |
| Indian (Asian) | 172 | 3.3% |
| Irish | 691 | 13.4% |
| Italian | 635 | 12.3% |
| Korean | 38 | 0.7% |
| Lithuanian | 32 | 0.6% |
| Mexican | 234 | 4.5% |
| Native Hawaiian | 13 | 0.3% |
| Pennsylvania German | 34 | 0.7% |
| Polish | 117 | 2.3% |
| Puerto Rican | 32 | 0.6% |
| Russian | 26 | 0.5% |
| Scotch-Irish | 26 | 0.5% |
| Scottish | 36 | 0.7% |
| Slovak | 27 | 0.5% |
| South American | 19 | 0.4% |
| South American Indian | 14 | 0.3% |
| Subsaharan African | 22 | 0.4% |
| Swedish | 61 | 1.2% |
| Thai | 130 | 2.5% |
| Ukrainian | 26 | 0.5% |
| Welsh | 60 | 1.2% | View All 39 Rows |
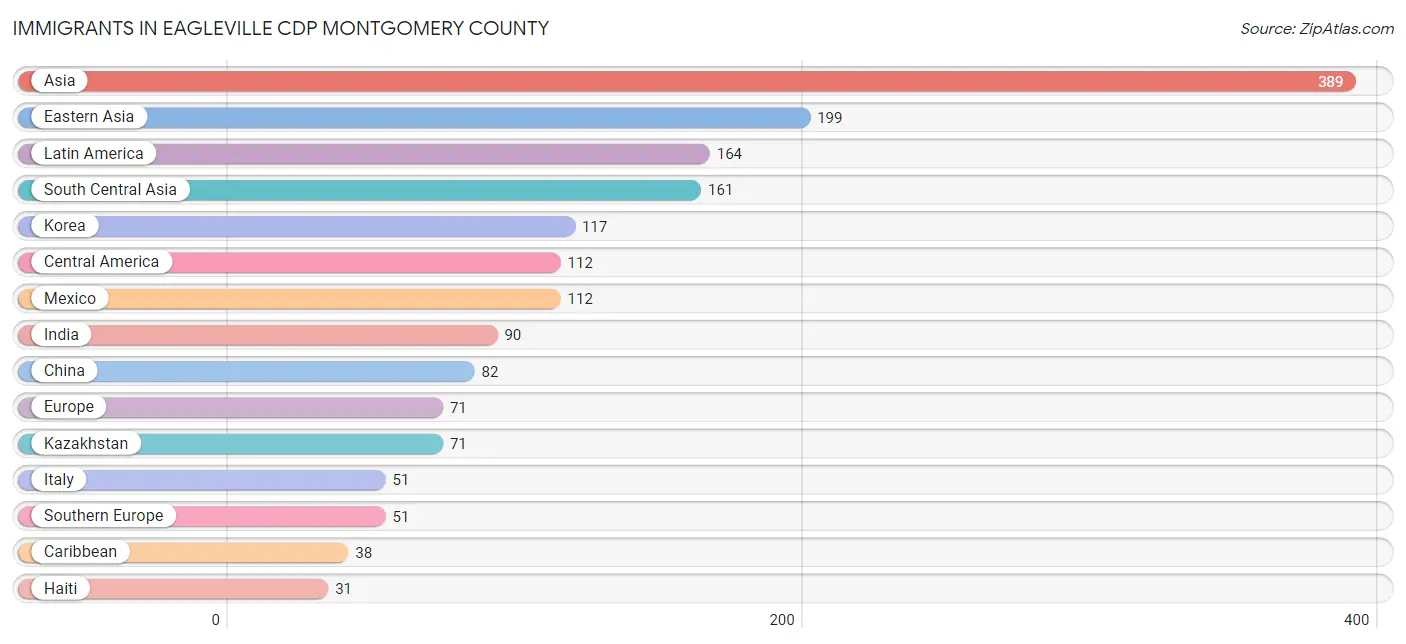
Immigrants in Eagleville CDP Montgomery County
The most numerous immigrant groups reported in Eagleville CDP Montgomery County came from Asia (389 | 7.5%), Eastern Asia (199 | 3.9%), Latin America (164 | 3.2%), South Central Asia (161 | 3.1%), and Korea (117 | 2.3%), together accounting for 20.0% of all Eagleville CDP Montgomery County residents.
| Immigration Origin | # Population | % Population |
| Africa | 13 | 0.3% |
| Asia | 389 | 7.5% |
| Cambodia | 17 | 0.3% |
| Caribbean | 38 | 0.7% |
| Central America | 112 | 2.2% |
| China | 82 | 1.6% |
| Colombia | 14 | 0.3% |
| Dominican Republic | 7 | 0.1% |
| Eastern Asia | 199 | 3.9% |
| Egypt | 8 | 0.2% |
| Europe | 71 | 1.4% |
| Germany | 10 | 0.2% |
| Haiti | 31 | 0.6% |
| India | 90 | 1.7% |
| Italy | 51 | 1.0% |
| Kazakhstan | 71 | 1.4% |
| Korea | 117 | 2.3% |
| Latin America | 164 | 3.2% |
| Mexico | 112 | 2.2% |
| Northern Africa | 13 | 0.3% |
| Northern Europe | 10 | 0.2% |
| Philippines | 12 | 0.2% |
| South America | 14 | 0.3% |
| South Central Asia | 161 | 3.1% |
| South Eastern Asia | 29 | 0.6% |
| Southern Europe | 51 | 1.0% |
| Taiwan | 22 | 0.4% |
| Western Europe | 10 | 0.2% | View All 28 Rows |
Sex and Age in Eagleville CDP Montgomery County
Sex and Age in Eagleville CDP Montgomery County
The most populous age groups in Eagleville CDP Montgomery County are 25 to 29 Years (340 | 11.6%) for men and 25 to 29 Years (216 | 9.7%) for women.
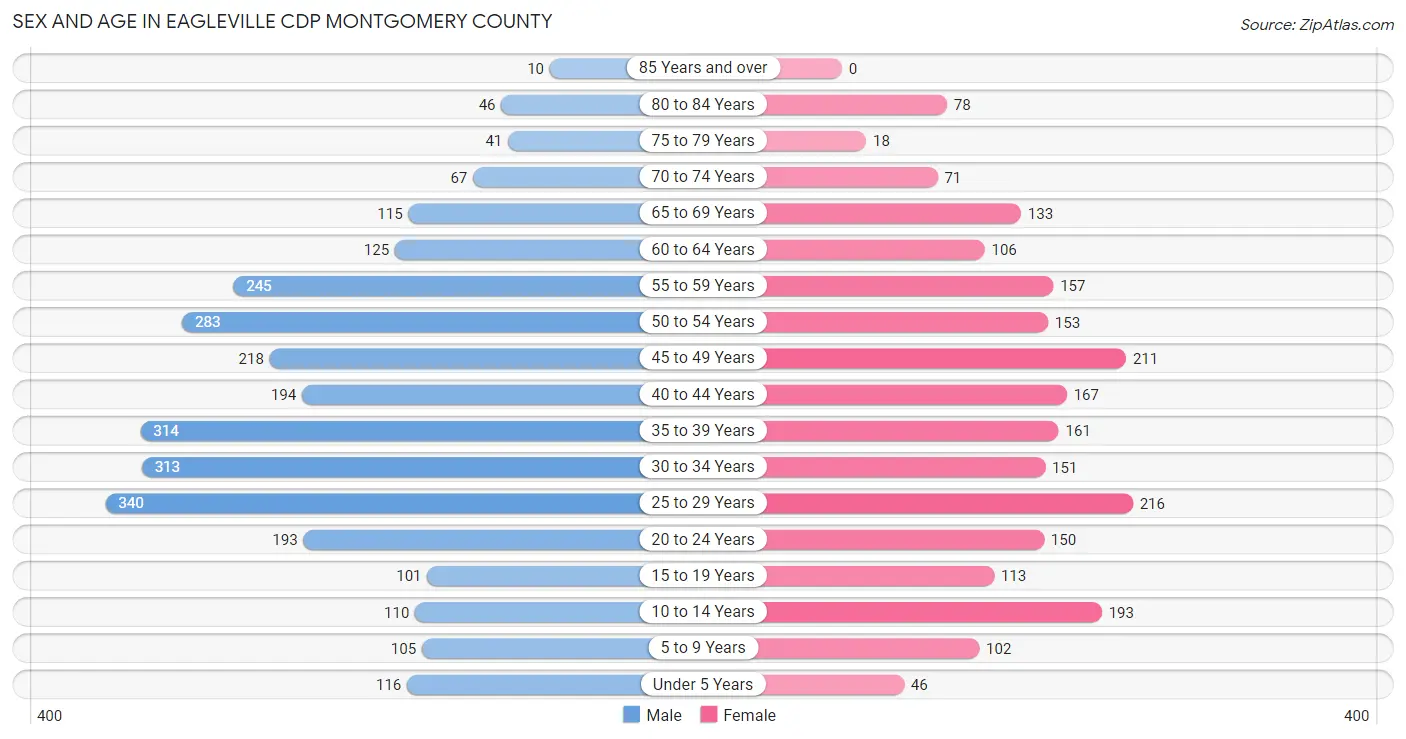
| Age Bracket | Male | Female |
| Under 5 Years | 116 (4.0%) | 46 (2.1%) |
| 5 to 9 Years | 105 (3.6%) | 102 (4.6%) |
| 10 to 14 Years | 110 (3.7%) | 193 (8.7%) |
| 15 to 19 Years | 101 (3.4%) | 113 (5.1%) |
| 20 to 24 Years | 193 (6.6%) | 150 (6.7%) |
| 25 to 29 Years | 340 (11.6%) | 216 (9.7%) |
| 30 to 34 Years | 313 (10.7%) | 151 (6.8%) |
| 35 to 39 Years | 314 (10.7%) | 161 (7.2%) |
| 40 to 44 Years | 194 (6.6%) | 167 (7.5%) |
| 45 to 49 Years | 218 (7.4%) | 211 (9.5%) |
| 50 to 54 Years | 283 (9.6%) | 153 (6.9%) |
| 55 to 59 Years | 245 (8.3%) | 157 (7.0%) |
| 60 to 64 Years | 125 (4.3%) | 106 (4.8%) |
| 65 to 69 Years | 115 (3.9%) | 133 (6.0%) |
| 70 to 74 Years | 67 (2.3%) | 71 (3.2%) |
| 75 to 79 Years | 41 (1.4%) | 18 (0.8%) |
| 80 to 84 Years | 46 (1.6%) | 78 (3.5%) |
| 85 Years and over | 10 (0.3%) | 0 (0.0%) |
| Total | 2,936 (100.0%) | 2,226 (100.0%) |
Families and Households in Eagleville CDP Montgomery County
Median Family Size in Eagleville CDP Montgomery County
The median family size in Eagleville CDP Montgomery County is 3.25 persons per family, with married-couple families (752 | 76.6%) accounting for the largest median family size of 3.41 persons per family. On the other hand, single male/father families (64 | 6.5%) represent the smallest median family size with 2.41 persons per family.
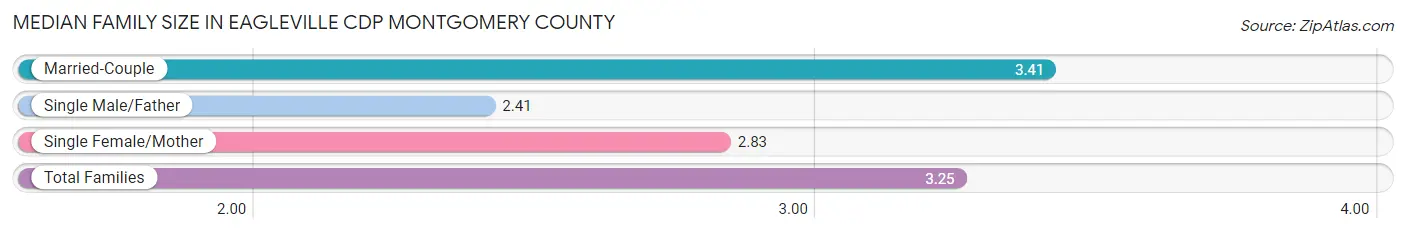
| Family Type | # Families | Family Size |
| Married-Couple | 752 (76.6%) | 3.41 |
| Single Male/Father | 64 (6.5%) | 2.41 |
| Single Female/Mother | 166 (16.9%) | 2.83 |
| Total Families | 982 (100.0%) | 3.25 |
Median Household Size in Eagleville CDP Montgomery County
The median household size in Eagleville CDP Montgomery County is 2.84 persons per household, with married-couple households (752 | 57.6%) accounting for the largest median household size of 3.41 persons per household. non-family households (324 | 24.8%) represent the smallest median household size with 1.47 persons per household.
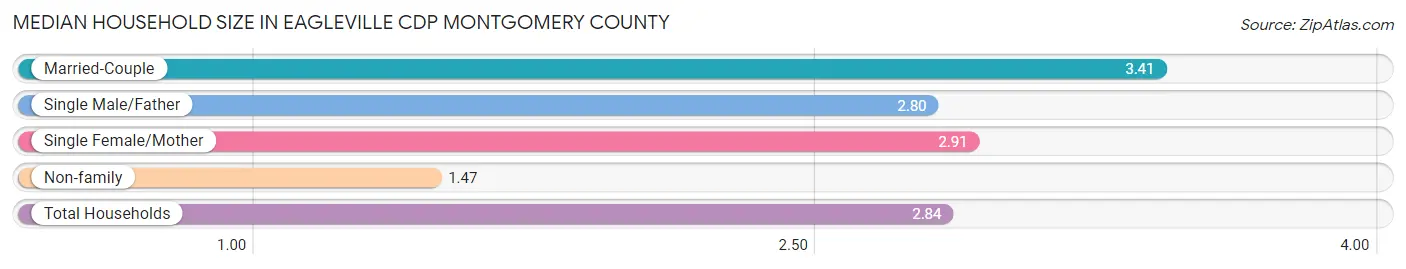
| Household Type | # Households | Household Size |
| Married-Couple | 752 (57.6%) | 3.41 |
| Single Male/Father | 64 (4.9%) | 2.80 |
| Single Female/Mother | 166 (12.7%) | 2.91 |
| Non-family | 324 (24.8%) | 1.47 |
| Total Households | 1,306 (100.0%) | 2.84 |
Household Size by Marriage Status in Eagleville CDP Montgomery County
Out of a total of 1,306 households in Eagleville CDP Montgomery County, 982 (75.2%) are family households, while 324 (24.8%) are nonfamily households. The most numerous type of family households are 2-person households, comprising 416, and the most common type of nonfamily households are 1-person households, comprising 210.
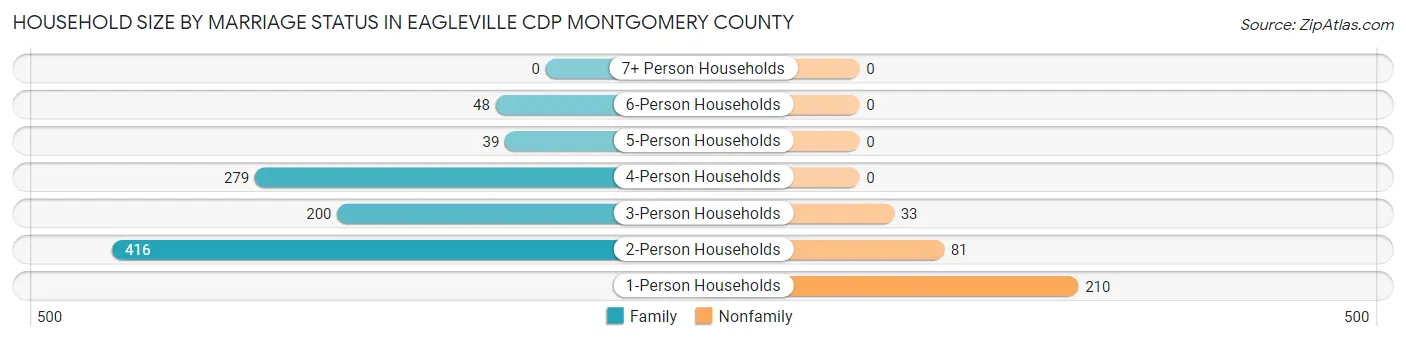
| Household Size | Family Households | Nonfamily Households |
| 1-Person Households | - | 210 (16.1%) |
| 2-Person Households | 416 (31.9%) | 81 (6.2%) |
| 3-Person Households | 200 (15.3%) | 33 (2.5%) |
| 4-Person Households | 279 (21.4%) | 0 (0.0%) |
| 5-Person Households | 39 (3.0%) | 0 (0.0%) |
| 6-Person Households | 48 (3.7%) | 0 (0.0%) |
| 7+ Person Households | 0 (0.0%) | 0 (0.0%) |
| Total | 982 (75.2%) | 324 (24.8%) |
Female Fertility in Eagleville CDP Montgomery County
Fertility by Age in Eagleville CDP Montgomery County
Average fertility rate in Eagleville CDP Montgomery County is 47.0 births per 1,000 women. Women in the age bracket of 20 to 34 years have the highest fertility rate with 85.0 births per 1,000 women. Women in the age bracket of 20 to 34 years acount for 75.9% of all women with births.
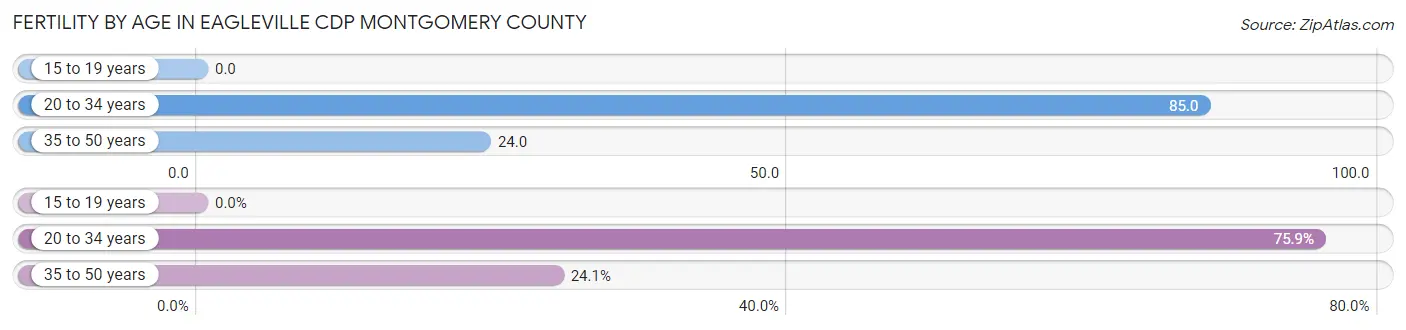
| Age Bracket | Women with Births | Births / 1,000 Women |
| 15 to 19 years | 0 (0.0%) | 0.0 |
| 20 to 34 years | 44 (75.9%) | 85.0 |
| 35 to 50 years | 14 (24.1%) | 24.0 |
| Total | 58 (100.0%) | 47.0 |
Fertility by Age by Marriage Status in Eagleville CDP Montgomery County
39.7% of women with births (58) in Eagleville CDP Montgomery County are married. The highest percentage of unmarried women with births falls into 20 to 34 years age bracket with 79.5% of them unmarried at the time of birth, while the lowest percentage of unmarried women with births belong to 35 to 50 years age bracket with 0.0% of them unmarried.
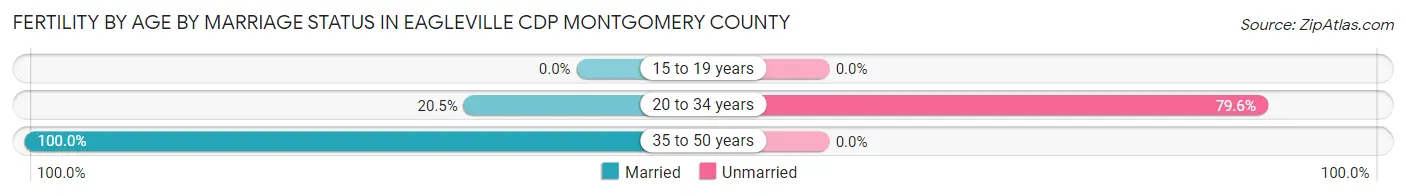
| Age Bracket | Married | Unmarried |
| 15 to 19 years | 0 (0.0%) | 0 (0.0%) |
| 20 to 34 years | 9 (20.4%) | 35 (79.5%) |
| 35 to 50 years | 14 (100.0%) | 0 (0.0%) |
| Total | 23 (39.7%) | 35 (60.3%) |
Fertility by Education in Eagleville CDP Montgomery County
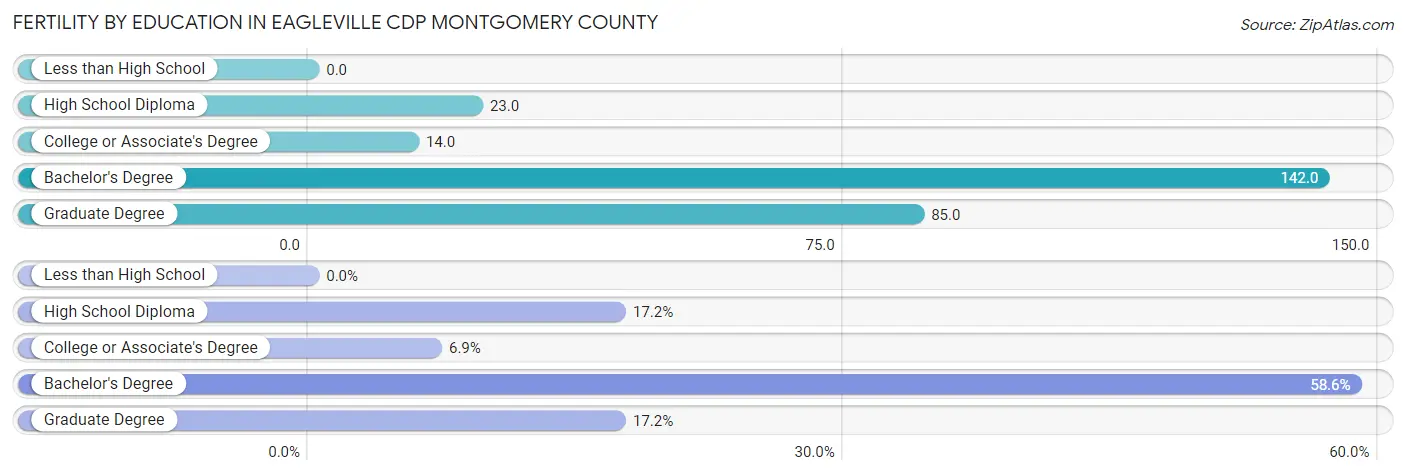
| Educational Attainment | Women with Births | Births / 1,000 Women |
| Less than High School | 0 (0.0%) | 0.0 |
| High School Diploma | 10 (17.2%) | 23.0 |
| College or Associate's Degree | 4 (6.9%) | 14.0 |
| Bachelor's Degree | 34 (58.6%) | 142.0 |
| Graduate Degree | 10 (17.2%) | 85.0 |
| Total | 58 (100.0%) | 47.0 |
Fertility by Education by Marriage Status in Eagleville CDP Montgomery County
60.3% of women with births in Eagleville CDP Montgomery County are unmarried. Women with the educational attainment of college or associate's degree are most likely to be married with 100.0% of them married at childbirth, while women with the educational attainment of high school diploma are least likely to be married with 100.0% of them unmarried at childbirth.
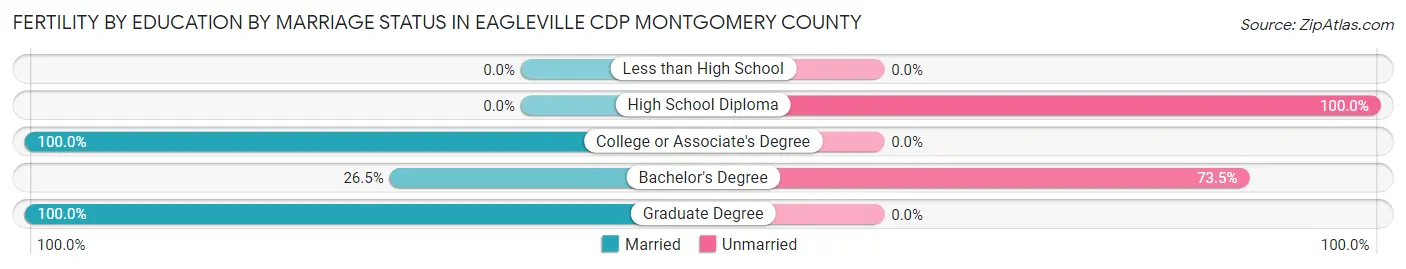
| Educational Attainment | Married | Unmarried |
| Less than High School | 0 (0.0%) | 0 (0.0%) |
| High School Diploma | 0 (0.0%) | 10 (100.0%) |
| College or Associate's Degree | 4 (100.0%) | 0 (0.0%) |
| Bachelor's Degree | 9 (26.5%) | 25 (73.5%) |
| Graduate Degree | 10 (100.0%) | 0 (0.0%) |
| Total | 23 (39.7%) | 35 (60.3%) |
Employment Characteristics in Eagleville CDP Montgomery County
Employment by Class of Employer in Eagleville CDP Montgomery County
Among the 1,911 employed individuals in Eagleville CDP Montgomery County, private company employees (1,484 | 77.7%), not-for-profit organizations (115 | 6.0%), and self-employed (not incorporated) (96 | 5.0%) make up the most common classes of employment.
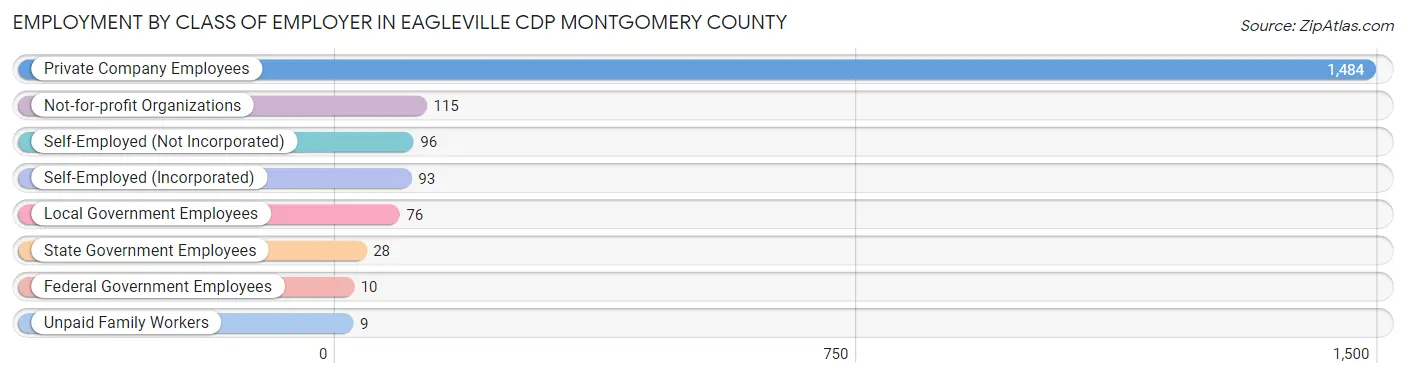
| Employer Class | # Employees | % Employees |
| Private Company Employees | 1,484 | 77.7% |
| Self-Employed (Incorporated) | 93 | 4.9% |
| Self-Employed (Not Incorporated) | 96 | 5.0% |
| Not-for-profit Organizations | 115 | 6.0% |
| Local Government Employees | 76 | 4.0% |
| State Government Employees | 28 | 1.5% |
| Federal Government Employees | 10 | 0.5% |
| Unpaid Family Workers | 9 | 0.5% |
| Total | 1,911 | 100.0% |
Employment Status by Age in Eagleville CDP Montgomery County
According to the labor force statistics for Eagleville CDP Montgomery County, out of the total population over 16 years of age (4,420), 46.9% or 2,073 individuals are in the labor force, with 7.0% or 145 of them unemployed. The age group with the highest labor force participation rate is 16 to 19 years, with 65.3% or 94 individuals in the labor force. Within the labor force, the 20 to 24 years age range has the highest percentage of unemployed individuals, with 33.1% or 51 of them being unemployed.
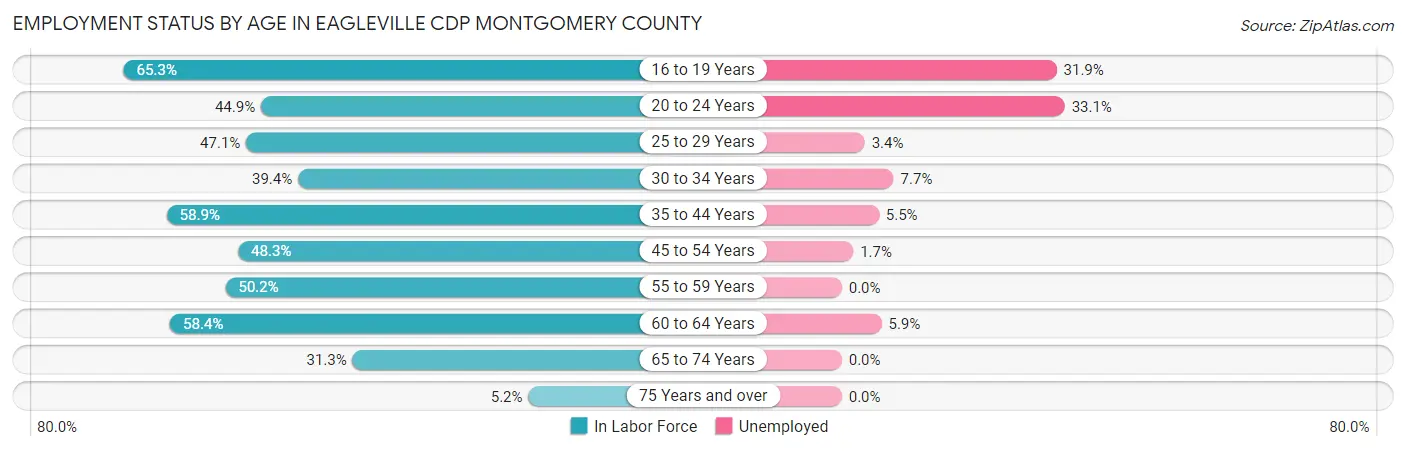
| Age Bracket | In Labor Force | Unemployed |
| 16 to 19 Years | 94 (65.3%) | 30 (31.9%) |
| 20 to 24 Years | 154 (44.9%) | 51 (33.1%) |
| 25 to 29 Years | 262 (47.1%) | 9 (3.4%) |
| 30 to 34 Years | 183 (39.4%) | 14 (7.7%) |
| 35 to 44 Years | 492 (58.9%) | 27 (5.5%) |
| 45 to 54 Years | 418 (48.3%) | 7 (1.7%) |
| 55 to 59 Years | 202 (50.2%) | 0 (0.0%) |
| 60 to 64 Years | 135 (58.4%) | 8 (5.9%) |
| 65 to 74 Years | 121 (31.3%) | 0 (0.0%) |
| 75 Years and over | 10 (5.2%) | 0 (0.0%) |
| Total | 2,073 (46.9%) | 145 (7.0%) |
Employment Status by Educational Attainment in Eagleville CDP Montgomery County
According to labor force statistics for Eagleville CDP Montgomery County, 50.4% of individuals (1,690) out of the total population between 25 and 64 years of age (3,354) are in the labor force, with 3.8% or 64 of them being unemployed. The group with the highest labor force participation rate are those with the educational attainment of bachelor's degree or higher, with 83.6% or 757 individuals in the labor force. Within the labor force, individuals with less than high school education have the highest percentage of unemployment, with 15.6% or 5 of them being unemployed.
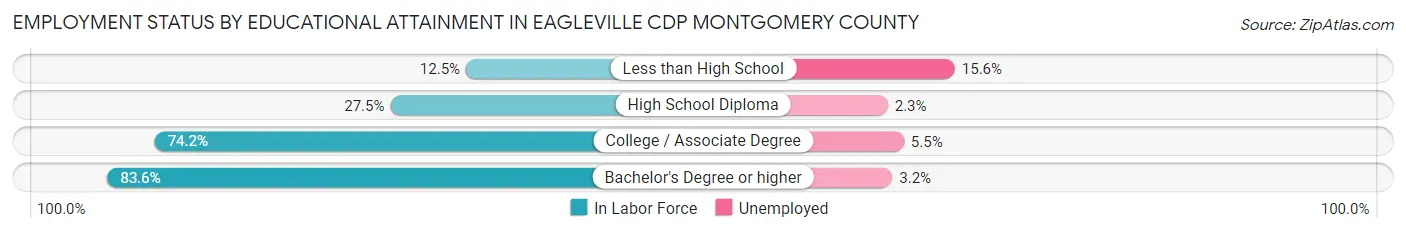
| Educational Attainment | In Labor Force | Unemployed |
| Less than High School | 32 (12.5%) | 40 (15.6%) |
| High School Diploma | 426 (27.5%) | 36 (2.3%) |
| College / Associate Degree | 477 (74.2%) | 35 (5.5%) |
| Bachelor's Degree or higher | 757 (83.6%) | 29 (3.2%) |
| Total | 1,690 (50.4%) | 127 (3.8%) |
Employment Occupations by Sex in Eagleville CDP Montgomery County
Management, Business, Science and Arts Occupations
The most common Management, Business, Science and Arts occupations in Eagleville CDP Montgomery County are Computers, Engineering & Science (191 | 9.9%), Management (165 | 8.6%), Community & Social Service (160 | 8.3%), Health Diagnosing & Treating (133 | 6.9%), and Computers & Mathematics (126 | 6.6%).
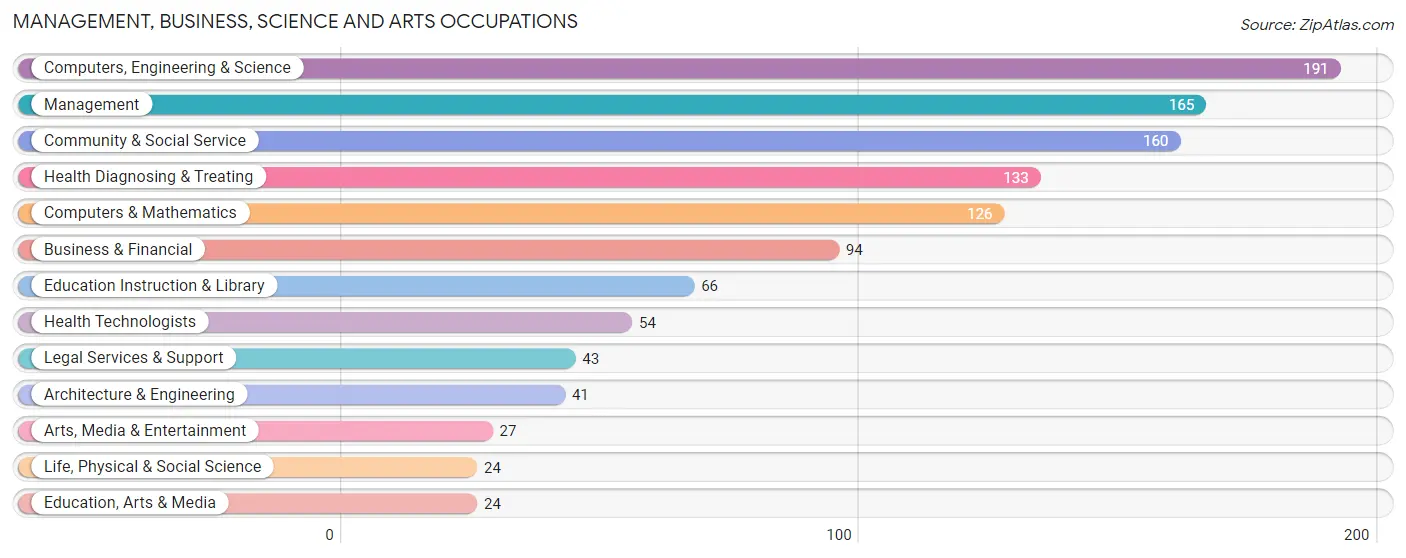
Management, Business, Science and Arts Occupations by Sex
Within the Management, Business, Science and Arts occupations in Eagleville CDP Montgomery County, the most male-oriented occupations are Architecture & Engineering (100.0%), Legal Services & Support (81.4%), and Management (73.9%), while the most female-oriented occupations are Life, Physical & Social Science (100.0%), Education Instruction & Library (100.0%), and Arts, Media & Entertainment (100.0%).
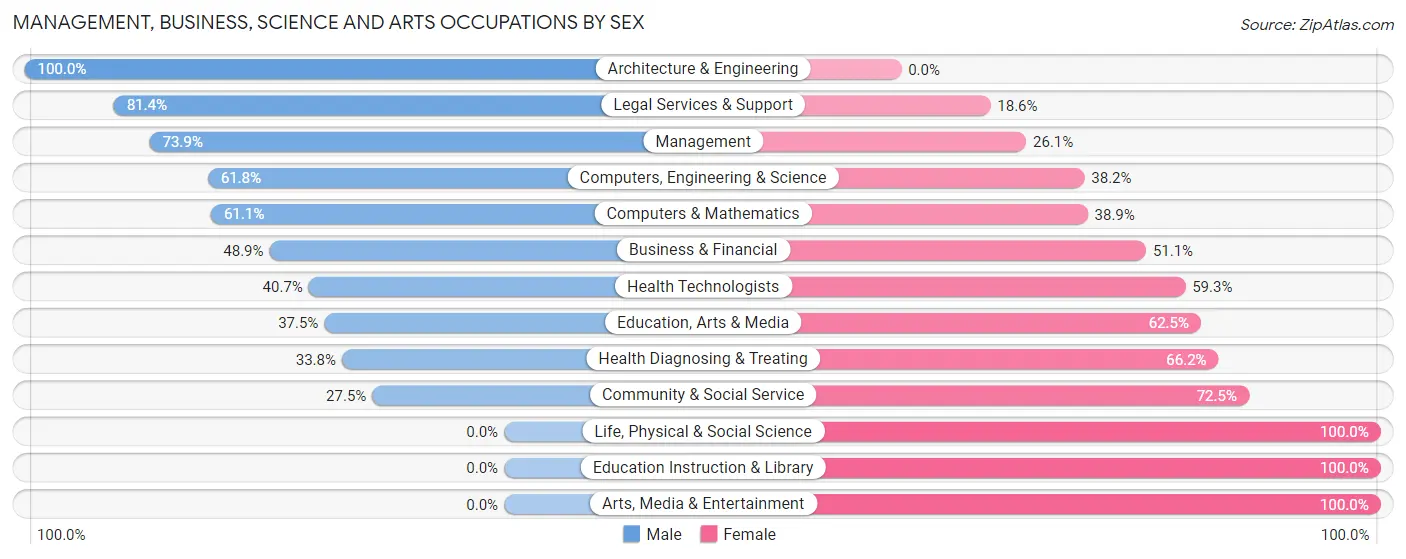
| Occupation | Male | Female |
| Management | 122 (73.9%) | 43 (26.1%) |
| Business & Financial | 46 (48.9%) | 48 (51.1%) |
| Computers, Engineering & Science | 118 (61.8%) | 73 (38.2%) |
| Computers & Mathematics | 77 (61.1%) | 49 (38.9%) |
| Architecture & Engineering | 41 (100.0%) | 0 (0.0%) |
| Life, Physical & Social Science | 0 (0.0%) | 24 (100.0%) |
| Community & Social Service | 44 (27.5%) | 116 (72.5%) |
| Education, Arts & Media | 9 (37.5%) | 15 (62.5%) |
| Legal Services & Support | 35 (81.4%) | 8 (18.6%) |
| Education Instruction & Library | 0 (0.0%) | 66 (100.0%) |
| Arts, Media & Entertainment | 0 (0.0%) | 27 (100.0%) |
| Health Diagnosing & Treating | 45 (33.8%) | 88 (66.2%) |
| Health Technologists | 22 (40.7%) | 32 (59.3%) |
| Total (Category) | 375 (50.5%) | 368 (49.5%) |
| Total (Overall) | 937 (48.7%) | 988 (51.3%) |
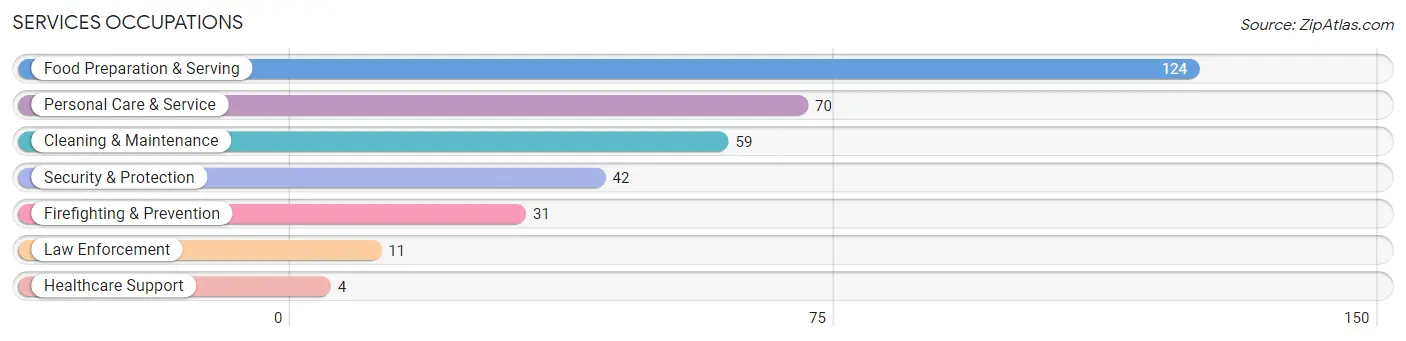
Services Occupations
The most common Services occupations in Eagleville CDP Montgomery County are Food Preparation & Serving (124 | 6.4%), Personal Care & Service (70 | 3.6%), Cleaning & Maintenance (59 | 3.1%), Security & Protection (42 | 2.2%), and Firefighting & Prevention (31 | 1.6%).
Services Occupations by Sex
Within the Services occupations in Eagleville CDP Montgomery County, the most male-oriented occupations are Firefighting & Prevention (100.0%), Cleaning & Maintenance (83.1%), and Security & Protection (73.8%), while the most female-oriented occupations are Healthcare Support (100.0%), Law Enforcement (100.0%), and Personal Care & Service (100.0%).
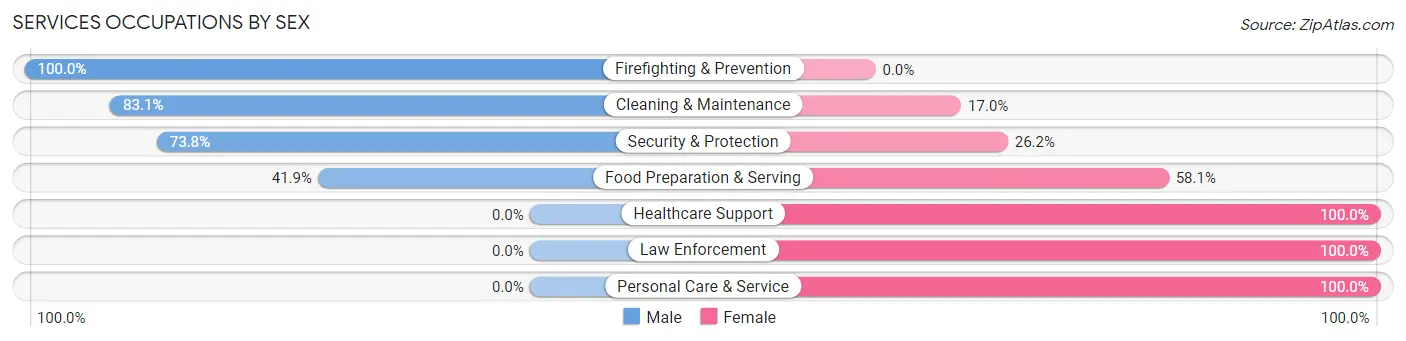
| Occupation | Male | Female |
| Healthcare Support | 0 (0.0%) | 4 (100.0%) |
| Security & Protection | 31 (73.8%) | 11 (26.2%) |
| Firefighting & Prevention | 31 (100.0%) | 0 (0.0%) |
| Law Enforcement | 0 (0.0%) | 11 (100.0%) |
| Food Preparation & Serving | 52 (41.9%) | 72 (58.1%) |
| Cleaning & Maintenance | 49 (83.1%) | 10 (17.0%) |
| Personal Care & Service | 0 (0.0%) | 70 (100.0%) |
| Total (Category) | 132 (44.2%) | 167 (55.8%) |
| Total (Overall) | 937 (48.7%) | 988 (51.3%) |
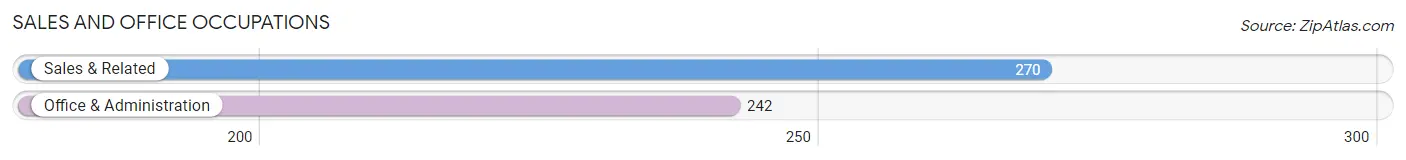
Sales and Office Occupations
The most common Sales and Office occupations in Eagleville CDP Montgomery County are Sales & Related (270 | 14.0%), and Office & Administration (242 | 12.6%).
Sales and Office Occupations by Sex
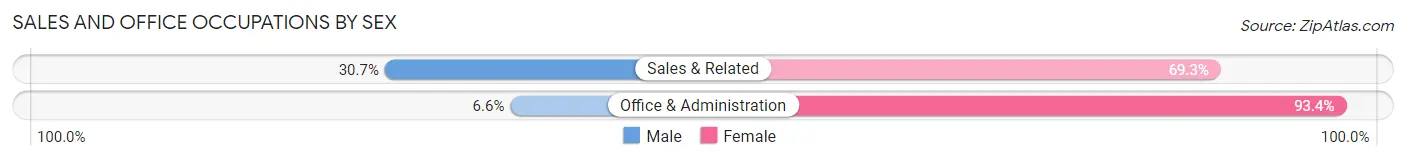
| Occupation | Male | Female |
| Sales & Related | 83 (30.7%) | 187 (69.3%) |
| Office & Administration | 16 (6.6%) | 226 (93.4%) |
| Total (Category) | 99 (19.3%) | 413 (80.7%) |
| Total (Overall) | 937 (48.7%) | 988 (51.3%) |
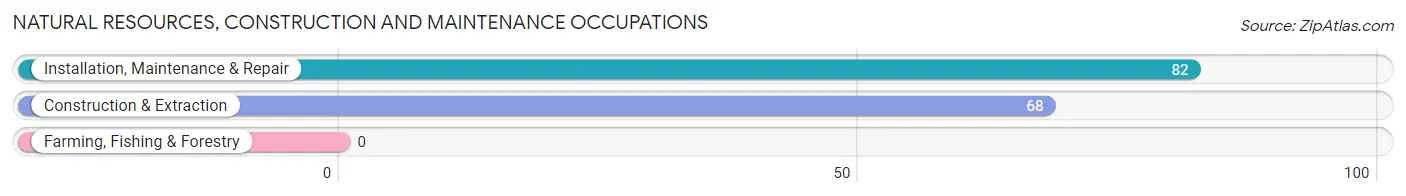
Natural Resources, Construction and Maintenance Occupations
The most common Natural Resources, Construction and Maintenance occupations in Eagleville CDP Montgomery County are Installation, Maintenance & Repair (82 | 4.3%), and Construction & Extraction (68 | 3.5%).
Natural Resources, Construction and Maintenance Occupations by Sex
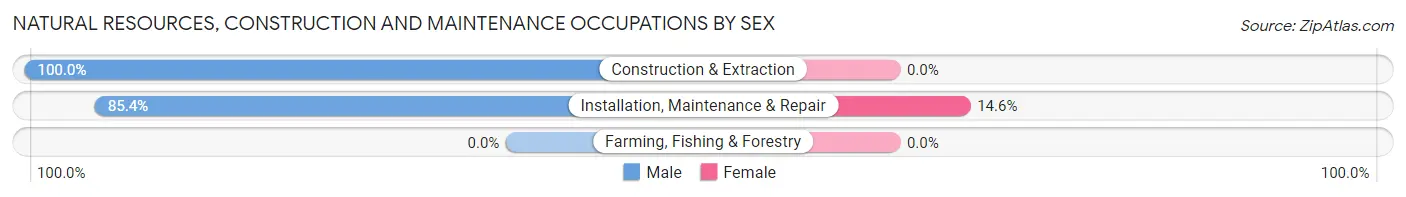
| Occupation | Male | Female |
| Farming, Fishing & Forestry | 0 (0.0%) | 0 (0.0%) |
| Construction & Extraction | 68 (100.0%) | 0 (0.0%) |
| Installation, Maintenance & Repair | 70 (85.4%) | 12 (14.6%) |
| Total (Category) | 138 (92.0%) | 12 (8.0%) |
| Total (Overall) | 937 (48.7%) | 988 (51.3%) |
Production, Transportation and Moving Occupations
The most common Production, Transportation and Moving occupations in Eagleville CDP Montgomery County are Production (90 | 4.7%), Transportation (72 | 3.7%), and Material Moving (59 | 3.1%).
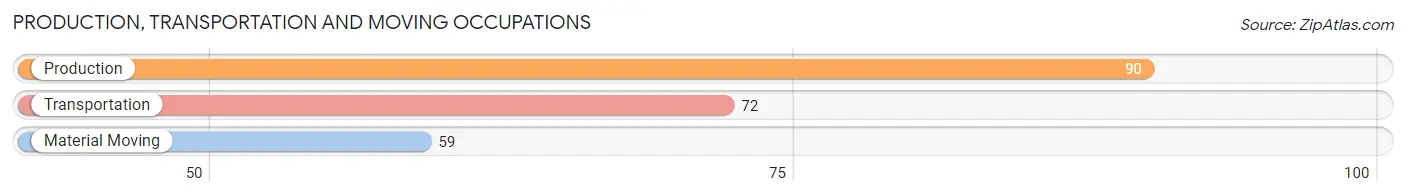
Production, Transportation and Moving Occupations by Sex
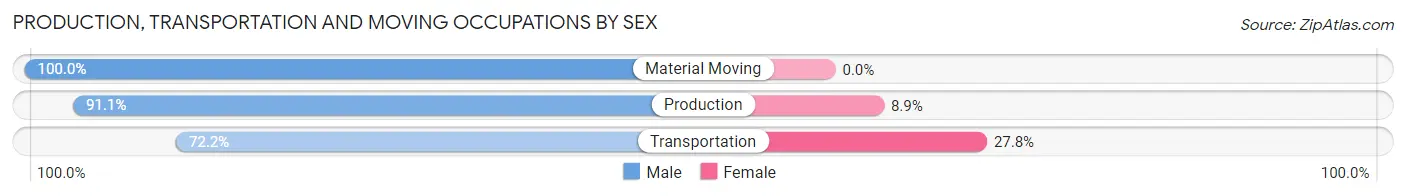
| Occupation | Male | Female |
| Production | 82 (91.1%) | 8 (8.9%) |
| Transportation | 52 (72.2%) | 20 (27.8%) |
| Material Moving | 59 (100.0%) | 0 (0.0%) |
| Total (Category) | 193 (87.3%) | 28 (12.7%) |
| Total (Overall) | 937 (48.7%) | 988 (51.3%) |
Employment Industries by Sex in Eagleville CDP Montgomery County
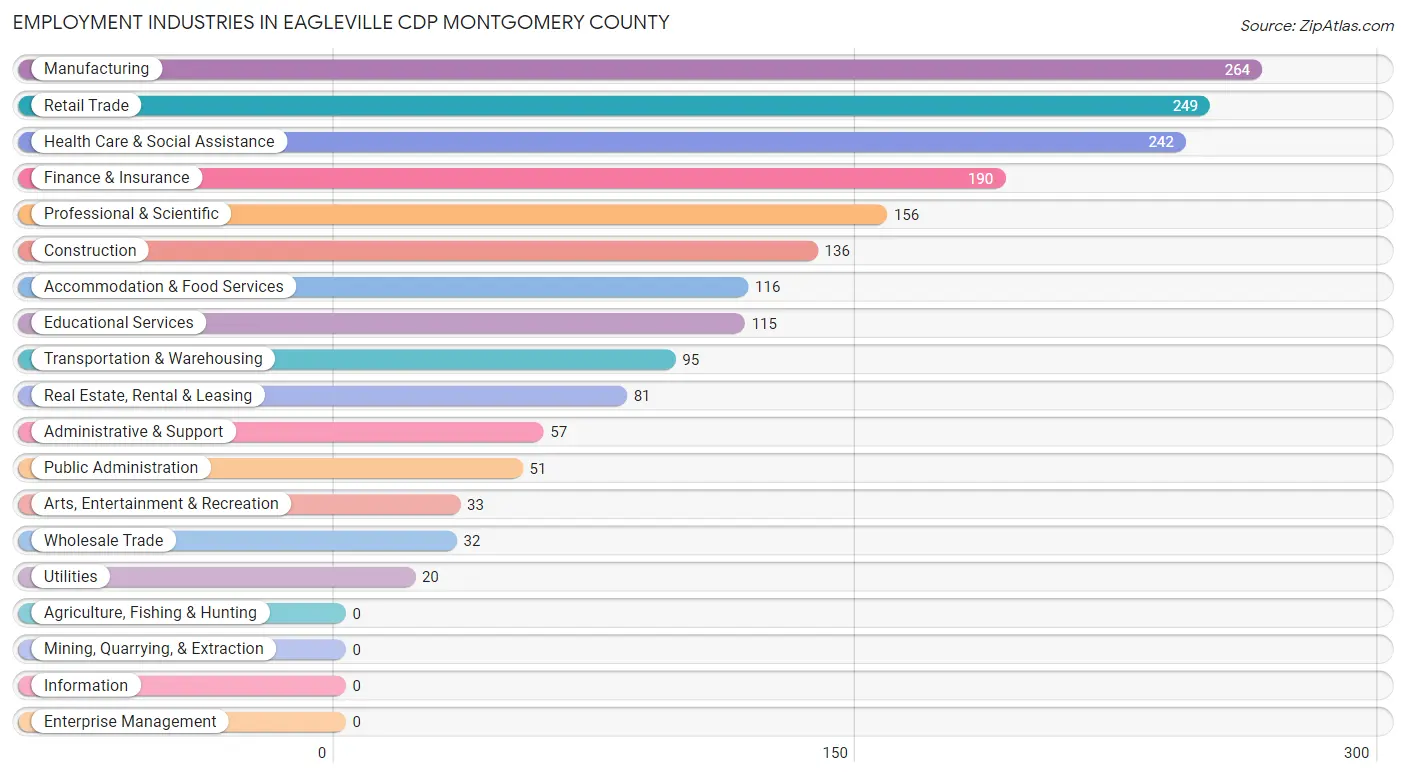
Employment Industries in Eagleville CDP Montgomery County
The major employment industries in Eagleville CDP Montgomery County include Manufacturing (264 | 13.7%), Retail Trade (249 | 12.9%), Health Care & Social Assistance (242 | 12.6%), Finance & Insurance (190 | 9.9%), and Professional & Scientific (156 | 8.1%).
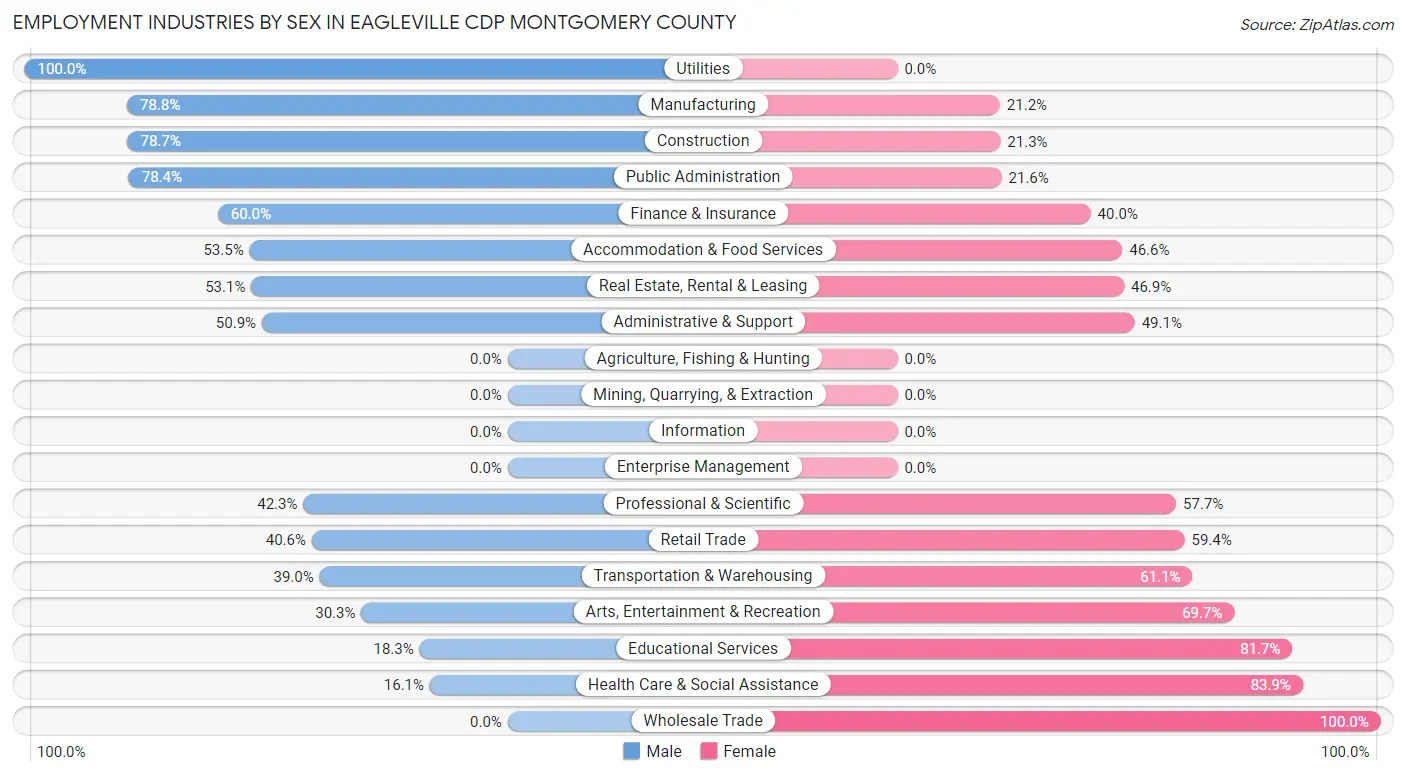
Employment Industries by Sex in Eagleville CDP Montgomery County
The Eagleville CDP Montgomery County industries that see more men than women are Utilities (100.0%), Manufacturing (78.8%), and Construction (78.7%), whereas the industries that tend to have a higher number of women are Wholesale Trade (100.0%), Health Care & Social Assistance (83.9%), and Educational Services (81.7%).
| Industry | Male | Female |
| Agriculture, Fishing & Hunting | 0 (0.0%) | 0 (0.0%) |
| Mining, Quarrying, & Extraction | 0 (0.0%) | 0 (0.0%) |
| Construction | 107 (78.7%) | 29 (21.3%) |
| Manufacturing | 208 (78.8%) | 56 (21.2%) |
| Wholesale Trade | 0 (0.0%) | 32 (100.0%) |
| Retail Trade | 101 (40.6%) | 148 (59.4%) |
| Transportation & Warehousing | 37 (39.0%) | 58 (61.1%) |
| Utilities | 20 (100.0%) | 0 (0.0%) |
| Information | 0 (0.0%) | 0 (0.0%) |
| Finance & Insurance | 114 (60.0%) | 76 (40.0%) |
| Real Estate, Rental & Leasing | 43 (53.1%) | 38 (46.9%) |
| Professional & Scientific | 66 (42.3%) | 90 (57.7%) |
| Enterprise Management | 0 (0.0%) | 0 (0.0%) |
| Administrative & Support | 29 (50.9%) | 28 (49.1%) |
| Educational Services | 21 (18.3%) | 94 (81.7%) |
| Health Care & Social Assistance | 39 (16.1%) | 203 (83.9%) |
| Arts, Entertainment & Recreation | 10 (30.3%) | 23 (69.7%) |
| Accommodation & Food Services | 62 (53.4%) | 54 (46.6%) |
| Public Administration | 40 (78.4%) | 11 (21.6%) |
| Total | 937 (48.7%) | 988 (51.3%) |
Education in Eagleville CDP Montgomery County
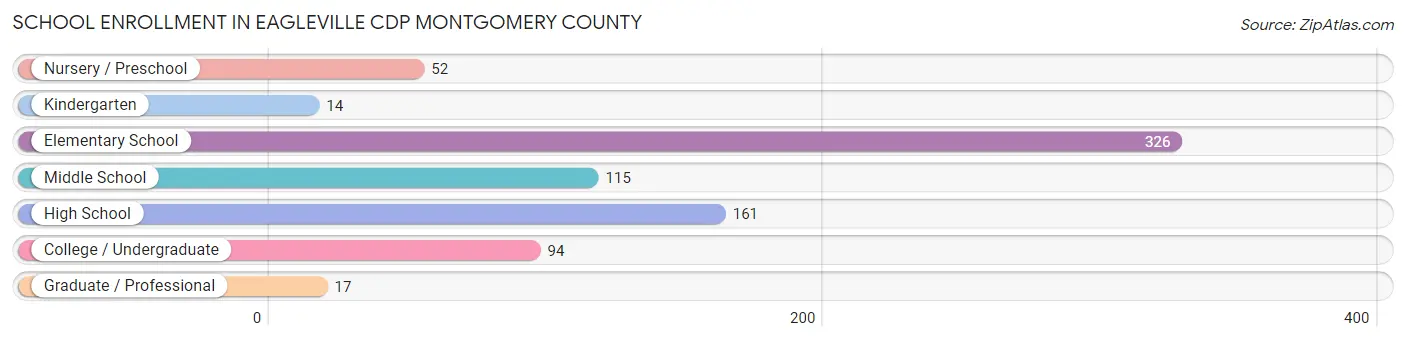
School Enrollment in Eagleville CDP Montgomery County
The most common levels of schooling among the 779 students in Eagleville CDP Montgomery County are elementary school (326 | 41.8%), high school (161 | 20.7%), and middle school (115 | 14.8%).
| School Level | # Students | % Students |
| Nursery / Preschool | 52 | 6.7% |
| Kindergarten | 14 | 1.8% |
| Elementary School | 326 | 41.8% |
| Middle School | 115 | 14.8% |
| High School | 161 | 20.7% |
| College / Undergraduate | 94 | 12.1% |
| Graduate / Professional | 17 | 2.2% |
| Total | 779 | 100.0% |
School Enrollment by Age by Funding Source in Eagleville CDP Montgomery County
Out of a total of 779 students who are enrolled in schools in Eagleville CDP Montgomery County, 59 (7.6%) attend a private institution, while the remaining 720 (92.4%) are enrolled in public schools. The age group of 20 to 24 year olds has the highest likelihood of being enrolled in private schools, with 30 (62.5% in the age bracket) enrolled. Conversely, the age group of 3 to 4 year olds has the lowest likelihood of being enrolled in a private school, with 30 (100.0% in the age bracket) attending a public institution.
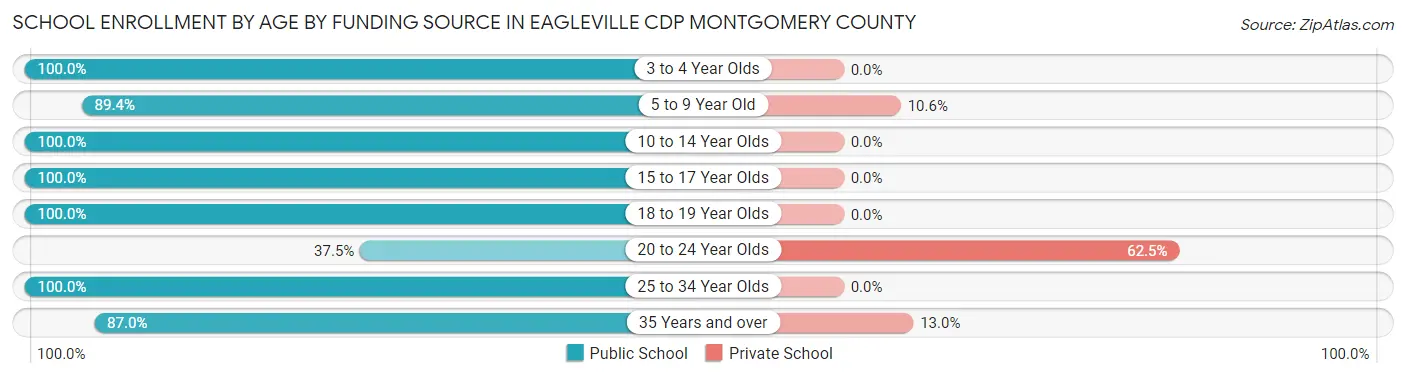
| Age Bracket | Public School | Private School |
| 3 to 4 Year Olds | 30 (100.0%) | 0 (0.0%) |
| 5 to 9 Year Old | 185 (89.4%) | 22 (10.6%) |
| 10 to 14 Year Olds | 303 (100.0%) | 0 (0.0%) |
| 15 to 17 Year Olds | 104 (100.0%) | 0 (0.0%) |
| 18 to 19 Year Olds | 24 (100.0%) | 0 (0.0%) |
| 20 to 24 Year Olds | 18 (37.5%) | 30 (62.5%) |
| 25 to 34 Year Olds | 9 (100.0%) | 0 (0.0%) |
| 35 Years and over | 47 (87.0%) | 7 (13.0%) |
| Total | 720 (92.4%) | 59 (7.6%) |
Educational Attainment by Field of Study in Eagleville CDP Montgomery County
Science & technology (194 | 17.1%), business (178 | 15.7%), engineering (125 | 11.0%), education (95 | 8.4%), and computers & mathematics (80 | 7.0%) are the most common fields of study among 1,137 individuals in Eagleville CDP Montgomery County who have obtained a bachelor's degree or higher.
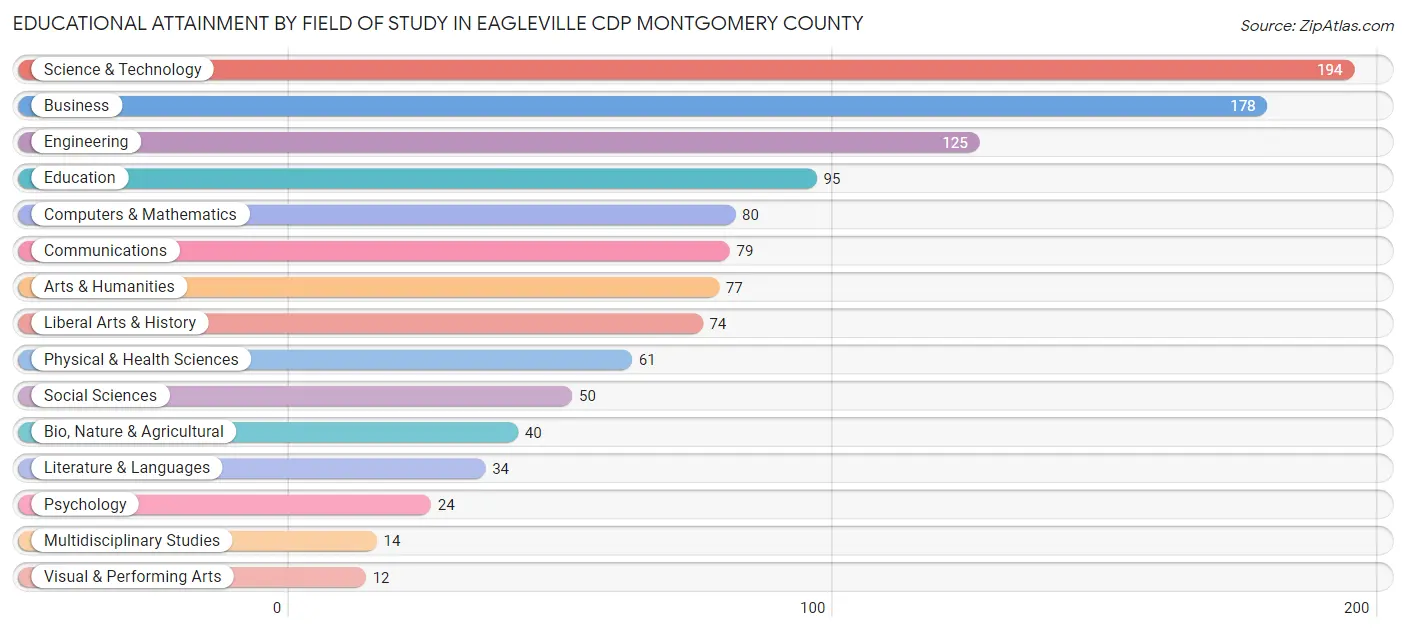
| Field of Study | # Graduates | % Graduates |
| Computers & Mathematics | 80 | 7.0% |
| Bio, Nature & Agricultural | 40 | 3.5% |
| Physical & Health Sciences | 61 | 5.4% |
| Psychology | 24 | 2.1% |
| Social Sciences | 50 | 4.4% |
| Engineering | 125 | 11.0% |
| Multidisciplinary Studies | 14 | 1.2% |
| Science & Technology | 194 | 17.1% |
| Business | 178 | 15.7% |
| Education | 95 | 8.4% |
| Literature & Languages | 34 | 3.0% |
| Liberal Arts & History | 74 | 6.5% |
| Visual & Performing Arts | 12 | 1.1% |
| Communications | 79 | 7.0% |
| Arts & Humanities | 77 | 6.8% |
| Total | 1,137 | 100.0% |
Transportation & Commute in Eagleville CDP Montgomery County
Vehicle Availability by Sex in Eagleville CDP Montgomery County
The most prevalent vehicle ownership categories in Eagleville CDP Montgomery County are males with 2 vehicles (388, accounting for 41.9%) and females with 2 vehicles (422, making up 39.4%).
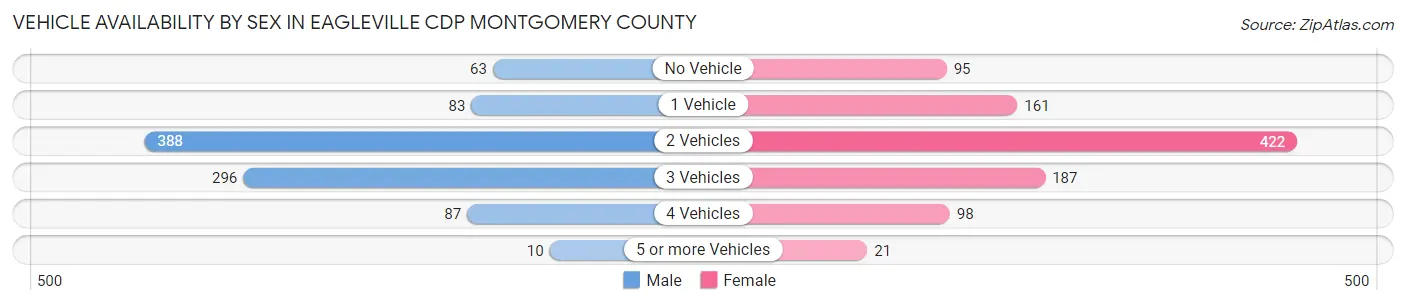
| Vehicles Available | Male | Female |
| No Vehicle | 63 (6.8%) | 95 (9.7%) |
| 1 Vehicle | 83 (8.9%) | 161 (16.4%) |
| 2 Vehicles | 388 (41.9%) | 422 (42.9%) |
| 3 Vehicles | 296 (31.9%) | 187 (19.0%) |
| 4 Vehicles | 87 (9.4%) | 98 (10.0%) |
| 5 or more Vehicles | 10 (1.1%) | 21 (2.1%) |
| Total | 927 (100.0%) | 984 (100.0%) |
Commute Time in Eagleville CDP Montgomery County
The most frequently occuring commute durations in Eagleville CDP Montgomery County are 30 to 34 minutes (317 commuters, 20.2%), 10 to 14 minutes (225 commuters, 14.3%), and 15 to 19 minutes (194 commuters, 12.4%).
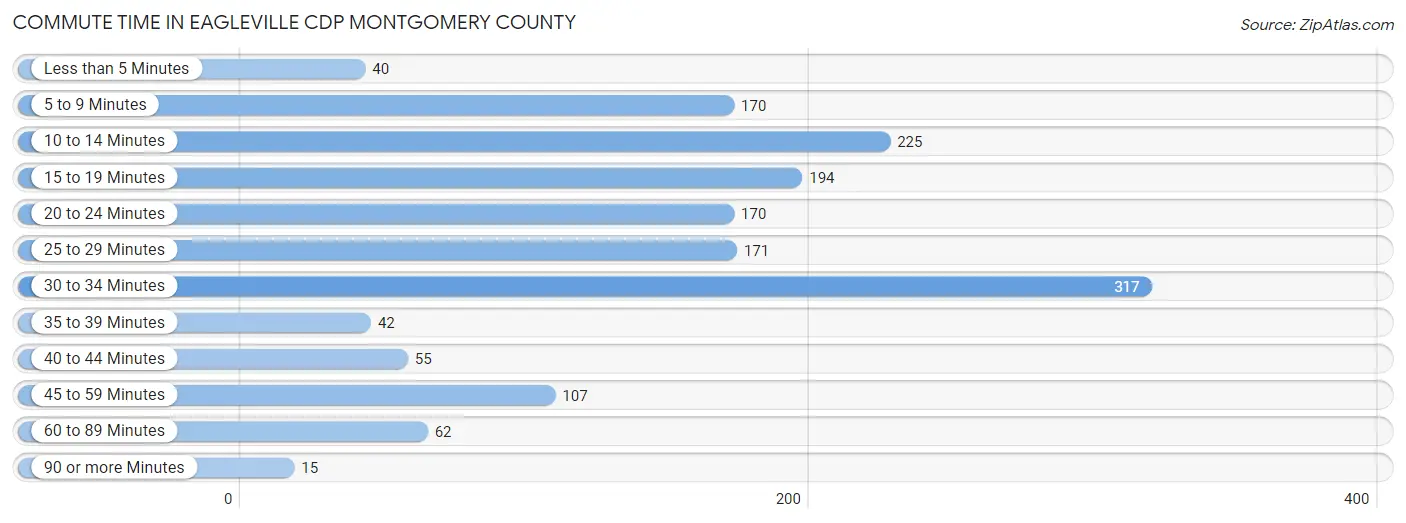
| Commute Time | # Commuters | % Commuters |
| Less than 5 Minutes | 40 | 2.5% |
| 5 to 9 Minutes | 170 | 10.8% |
| 10 to 14 Minutes | 225 | 14.3% |
| 15 to 19 Minutes | 194 | 12.4% |
| 20 to 24 Minutes | 170 | 10.8% |
| 25 to 29 Minutes | 171 | 10.9% |
| 30 to 34 Minutes | 317 | 20.2% |
| 35 to 39 Minutes | 42 | 2.7% |
| 40 to 44 Minutes | 55 | 3.5% |
| 45 to 59 Minutes | 107 | 6.8% |
| 60 to 89 Minutes | 62 | 4.0% |
| 90 or more Minutes | 15 | 1.0% |
Commute Time by Sex in Eagleville CDP Montgomery County
The most common commute times in Eagleville CDP Montgomery County are 30 to 34 minutes (158 commuters, 21.5%) for males and 30 to 34 minutes (159 commuters, 19.1%) for females.
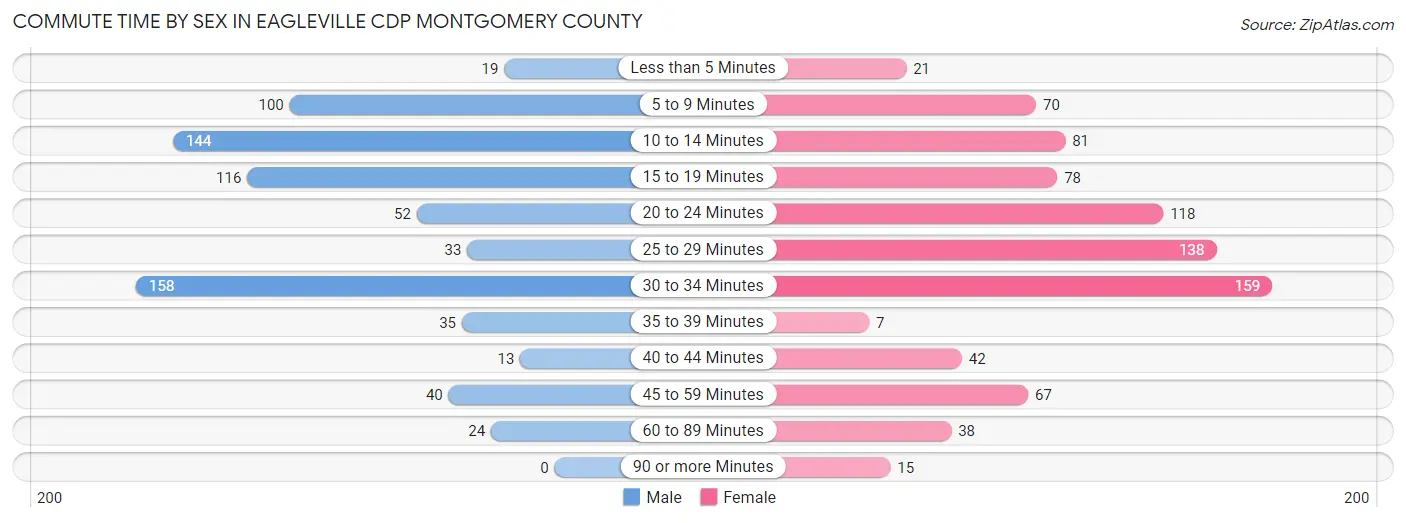
| Commute Time | Male | Female |
| Less than 5 Minutes | 19 (2.6%) | 21 (2.5%) |
| 5 to 9 Minutes | 100 (13.6%) | 70 (8.4%) |
| 10 to 14 Minutes | 144 (19.6%) | 81 (9.7%) |
| 15 to 19 Minutes | 116 (15.8%) | 78 (9.3%) |
| 20 to 24 Minutes | 52 (7.1%) | 118 (14.1%) |
| 25 to 29 Minutes | 33 (4.5%) | 138 (16.6%) |
| 30 to 34 Minutes | 158 (21.5%) | 159 (19.1%) |
| 35 to 39 Minutes | 35 (4.8%) | 7 (0.8%) |
| 40 to 44 Minutes | 13 (1.8%) | 42 (5.0%) |
| 45 to 59 Minutes | 40 (5.4%) | 67 (8.0%) |
| 60 to 89 Minutes | 24 (3.3%) | 38 (4.6%) |
| 90 or more Minutes | 0 (0.0%) | 15 (1.8%) |
Time of Departure to Work by Sex in Eagleville CDP Montgomery County
The most frequent times of departure to work in Eagleville CDP Montgomery County are 7:30 AM to 7:59 AM (182, 24.8%) for males and 7:00 AM to 7:29 AM (235, 28.2%) for females.
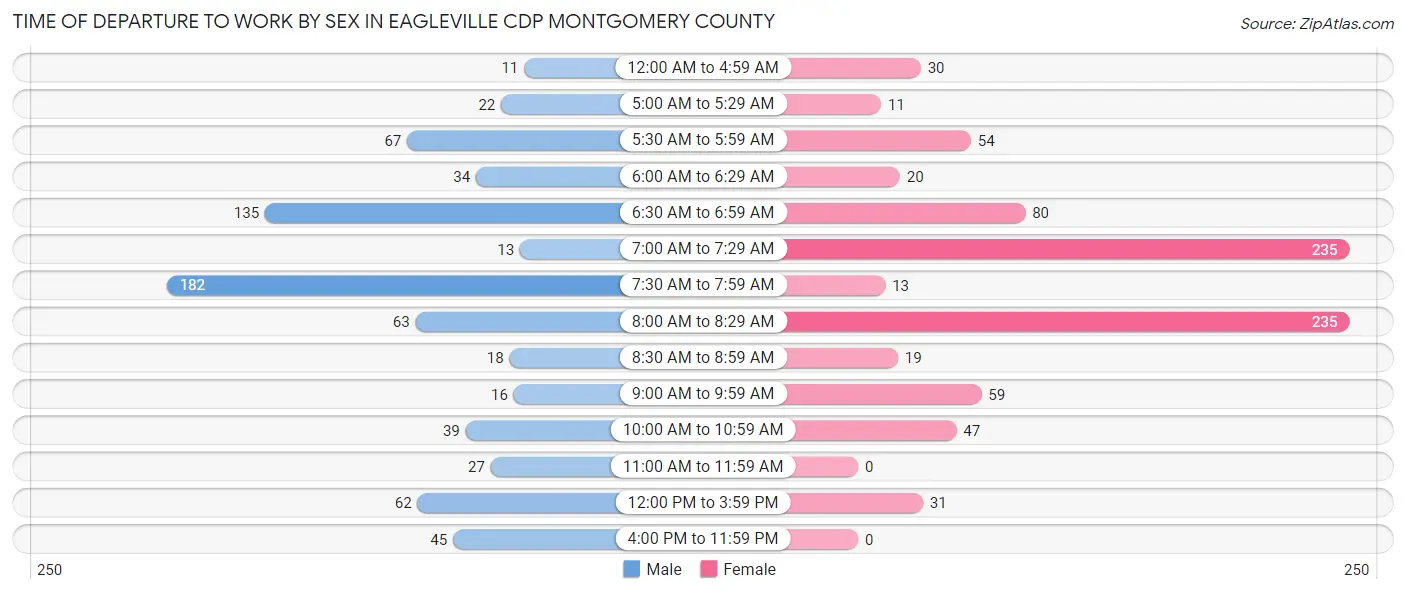
| Time of Departure | Male | Female |
| 12:00 AM to 4:59 AM | 11 (1.5%) | 30 (3.6%) |
| 5:00 AM to 5:29 AM | 22 (3.0%) | 11 (1.3%) |
| 5:30 AM to 5:59 AM | 67 (9.1%) | 54 (6.5%) |
| 6:00 AM to 6:29 AM | 34 (4.6%) | 20 (2.4%) |
| 6:30 AM to 6:59 AM | 135 (18.4%) | 80 (9.6%) |
| 7:00 AM to 7:29 AM | 13 (1.8%) | 235 (28.2%) |
| 7:30 AM to 7:59 AM | 182 (24.8%) | 13 (1.6%) |
| 8:00 AM to 8:29 AM | 63 (8.6%) | 235 (28.2%) |
| 8:30 AM to 8:59 AM | 18 (2.5%) | 19 (2.3%) |
| 9:00 AM to 9:59 AM | 16 (2.2%) | 59 (7.1%) |
| 10:00 AM to 10:59 AM | 39 (5.3%) | 47 (5.6%) |
| 11:00 AM to 11:59 AM | 27 (3.7%) | 0 (0.0%) |
| 12:00 PM to 3:59 PM | 62 (8.5%) | 31 (3.7%) |
| 4:00 PM to 11:59 PM | 45 (6.1%) | 0 (0.0%) |
| Total | 734 (100.0%) | 834 (100.0%) |
Housing Occupancy in Eagleville CDP Montgomery County
Occupancy by Ownership in Eagleville CDP Montgomery County
Of the total 1,306 dwellings in Eagleville CDP Montgomery County, owner-occupied units account for 785 (60.1%), while renter-occupied units make up 521 (39.9%).
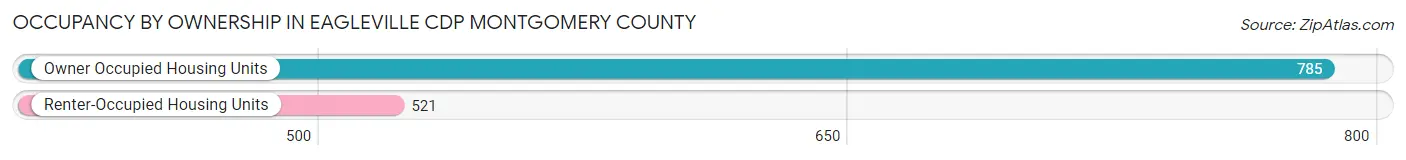
| Occupancy | # Housing Units | % Housing Units |
| Owner Occupied Housing Units | 785 | 60.1% |
| Renter-Occupied Housing Units | 521 | 39.9% |
| Total Occupied Housing Units | 1,306 | 100.0% |
Occupancy by Household Size in Eagleville CDP Montgomery County
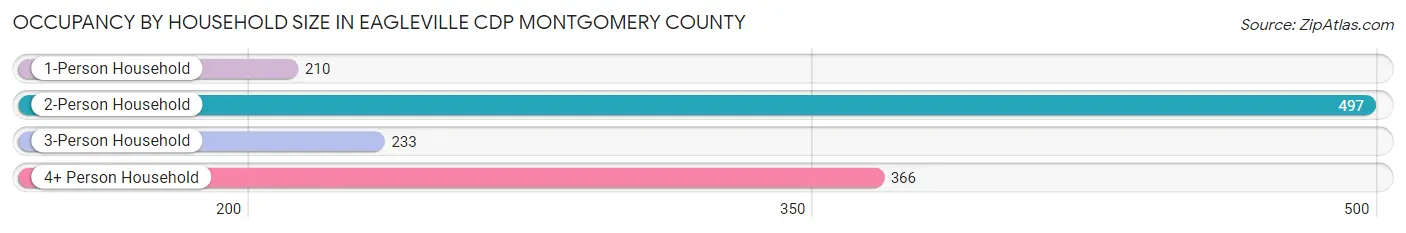
| Household Size | # Housing Units | % Housing Units |
| 1-Person Household | 210 | 16.1% |
| 2-Person Household | 497 | 38.1% |
| 3-Person Household | 233 | 17.8% |
| 4+ Person Household | 366 | 28.0% |
| Total Housing Units | 1,306 | 100.0% |
Occupancy by Ownership by Household Size in Eagleville CDP Montgomery County
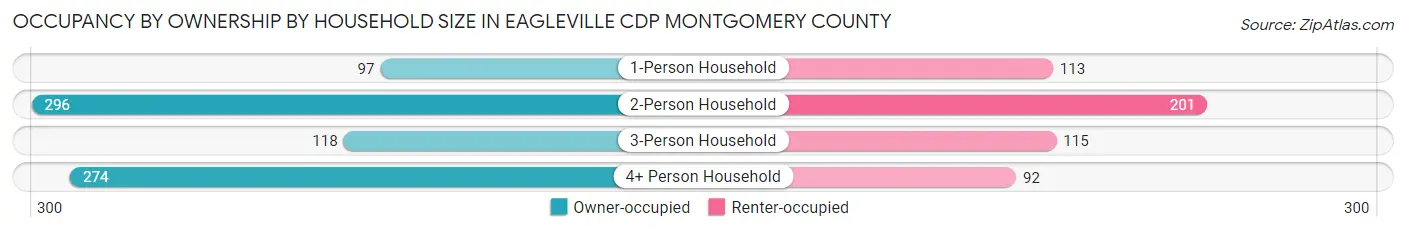
| Household Size | Owner-occupied | Renter-occupied |
| 1-Person Household | 97 (46.2%) | 113 (53.8%) |
| 2-Person Household | 296 (59.6%) | 201 (40.4%) |
| 3-Person Household | 118 (50.6%) | 115 (49.4%) |
| 4+ Person Household | 274 (74.9%) | 92 (25.1%) |
| Total Housing Units | 785 (60.1%) | 521 (39.9%) |
Occupancy by Educational Attainment in Eagleville CDP Montgomery County
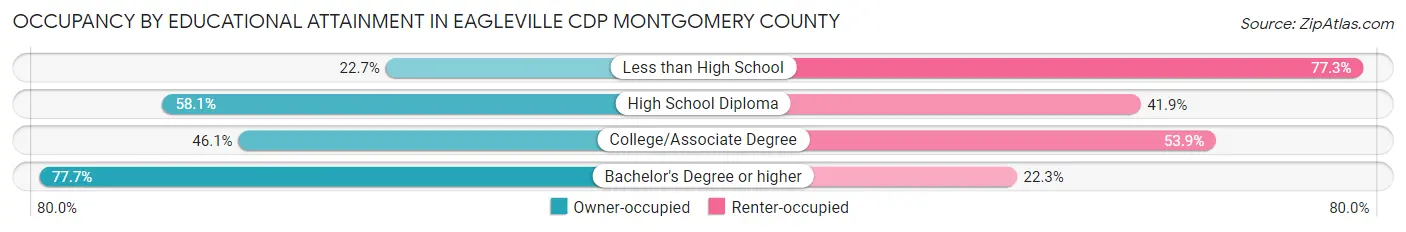
| Household Size | Owner-occupied | Renter-occupied |
| Less than High School | 25 (22.7%) | 85 (77.3%) |
| High School Diploma | 179 (58.1%) | 129 (41.9%) |
| College/Associate Degree | 159 (46.1%) | 186 (53.9%) |
| Bachelor's Degree or higher | 422 (77.7%) | 121 (22.3%) |
Occupancy by Age of Householder in Eagleville CDP Montgomery County
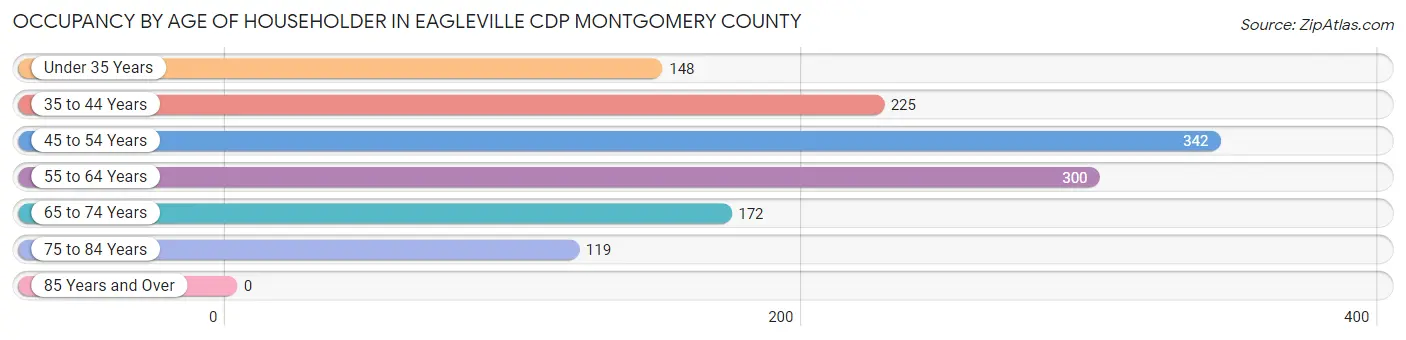
| Age Bracket | # Households | % Households |
| Under 35 Years | 148 | 11.3% |
| 35 to 44 Years | 225 | 17.2% |
| 45 to 54 Years | 342 | 26.2% |
| 55 to 64 Years | 300 | 23.0% |
| 65 to 74 Years | 172 | 13.2% |
| 75 to 84 Years | 119 | 9.1% |
| 85 Years and Over | 0 | 0.0% |
| Total | 1,306 | 100.0% |
Housing Finances in Eagleville CDP Montgomery County
Median Income by Occupancy in Eagleville CDP Montgomery County
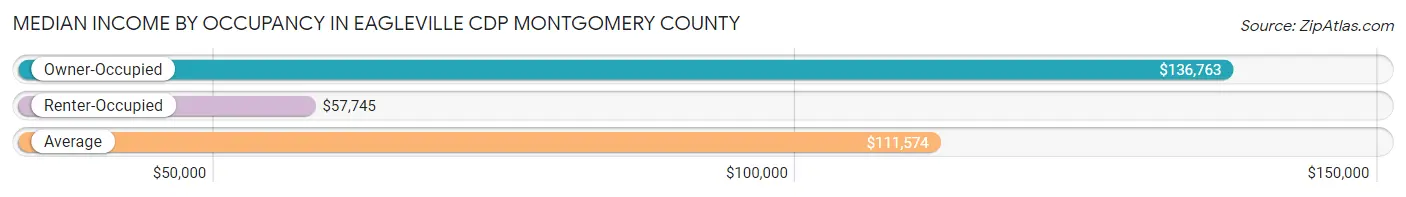
| Occupancy Type | # Households | Median Income |
| Owner-Occupied | 785 (60.1%) | $136,763 |
| Renter-Occupied | 521 (39.9%) | $57,745 |
| Average | 1,306 (100.0%) | $111,574 |
Occupancy by Householder Income Bracket in Eagleville CDP Montgomery County
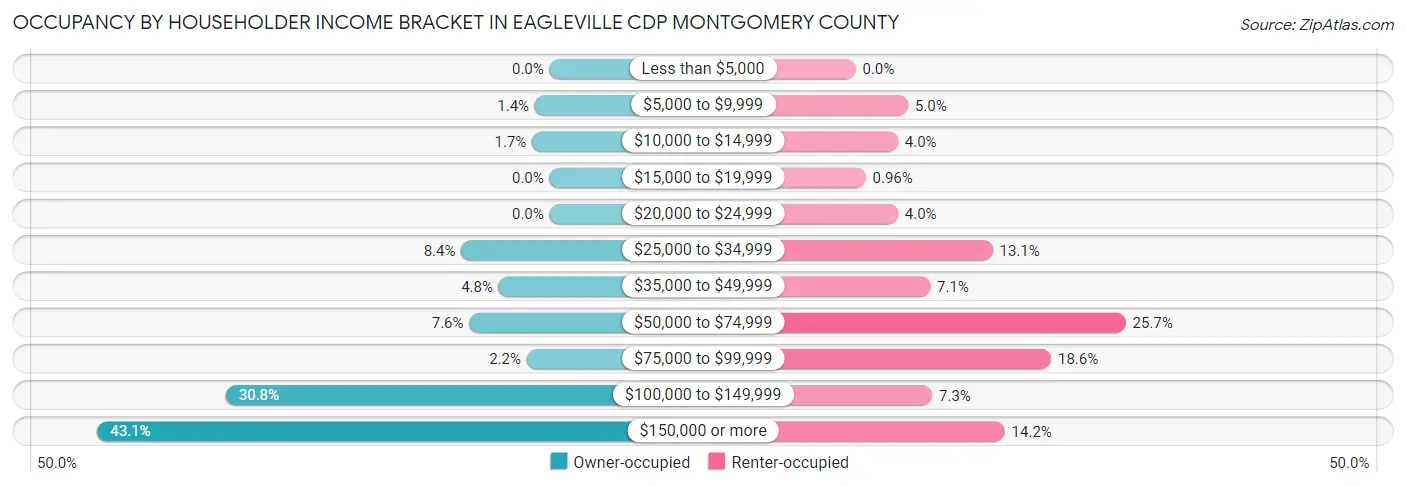
| Income Bracket | Owner-occupied | Renter-occupied |
| Less than $5,000 | 0 (0.0%) | 0 (0.0%) |
| $5,000 to $9,999 | 11 (1.4%) | 26 (5.0%) |
| $10,000 to $14,999 | 13 (1.7%) | 21 (4.0%) |
| $15,000 to $19,999 | 0 (0.0%) | 5 (1.0%) |
| $20,000 to $24,999 | 0 (0.0%) | 21 (4.0%) |
| $25,000 to $34,999 | 66 (8.4%) | 68 (13.1%) |
| $35,000 to $49,999 | 38 (4.8%) | 37 (7.1%) |
| $50,000 to $74,999 | 60 (7.6%) | 134 (25.7%) |
| $75,000 to $99,999 | 17 (2.2%) | 97 (18.6%) |
| $100,000 to $149,999 | 242 (30.8%) | 38 (7.3%) |
| $150,000 or more | 338 (43.1%) | 74 (14.2%) |
| Total | 785 (100.0%) | 521 (100.0%) |
Monthly Housing Cost Tiers in Eagleville CDP Montgomery County
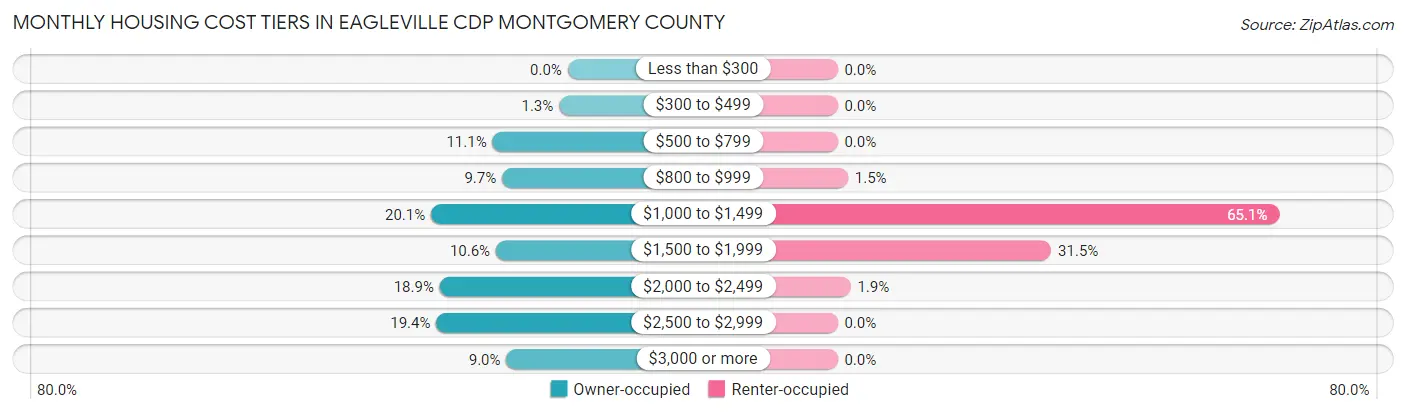
| Monthly Cost | Owner-occupied | Renter-occupied |
| Less than $300 | 0 (0.0%) | 0 (0.0%) |
| $300 to $499 | 10 (1.3%) | 0 (0.0%) |
| $500 to $799 | 87 (11.1%) | 0 (0.0%) |
| $800 to $999 | 76 (9.7%) | 8 (1.5%) |
| $1,000 to $1,499 | 158 (20.1%) | 339 (65.1%) |
| $1,500 to $1,999 | 83 (10.6%) | 164 (31.5%) |
| $2,000 to $2,499 | 148 (18.9%) | 10 (1.9%) |
| $2,500 to $2,999 | 152 (19.4%) | 0 (0.0%) |
| $3,000 or more | 71 (9.0%) | 0 (0.0%) |
| Total | 785 (100.0%) | 521 (100.0%) |
Physical Housing Characteristics in Eagleville CDP Montgomery County
Housing Structures in Eagleville CDP Montgomery County
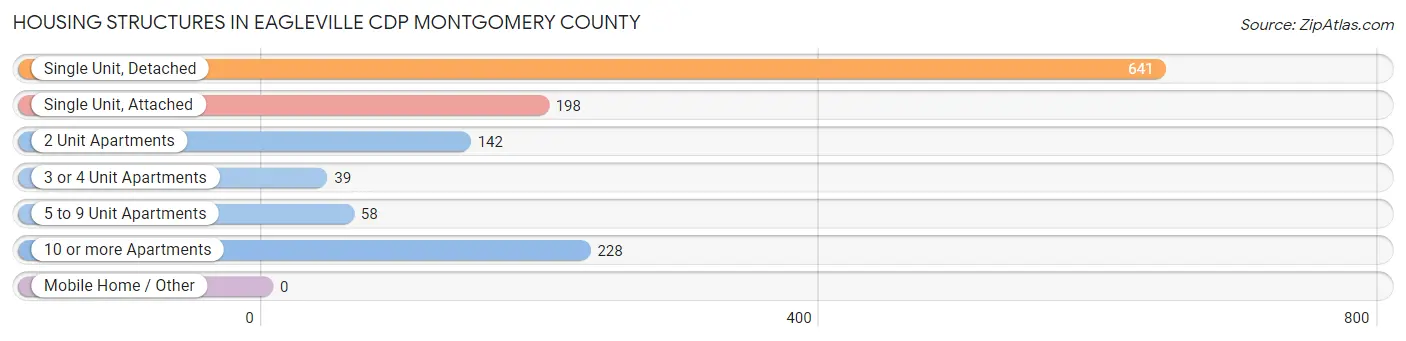
| Structure Type | # Housing Units | % Housing Units |
| Single Unit, Detached | 641 | 49.1% |
| Single Unit, Attached | 198 | 15.2% |
| 2 Unit Apartments | 142 | 10.9% |
| 3 or 4 Unit Apartments | 39 | 3.0% |
| 5 to 9 Unit Apartments | 58 | 4.4% |
| 10 or more Apartments | 228 | 17.5% |
| Mobile Home / Other | 0 | 0.0% |
| Total | 1,306 | 100.0% |
Housing Structures by Occupancy in Eagleville CDP Montgomery County
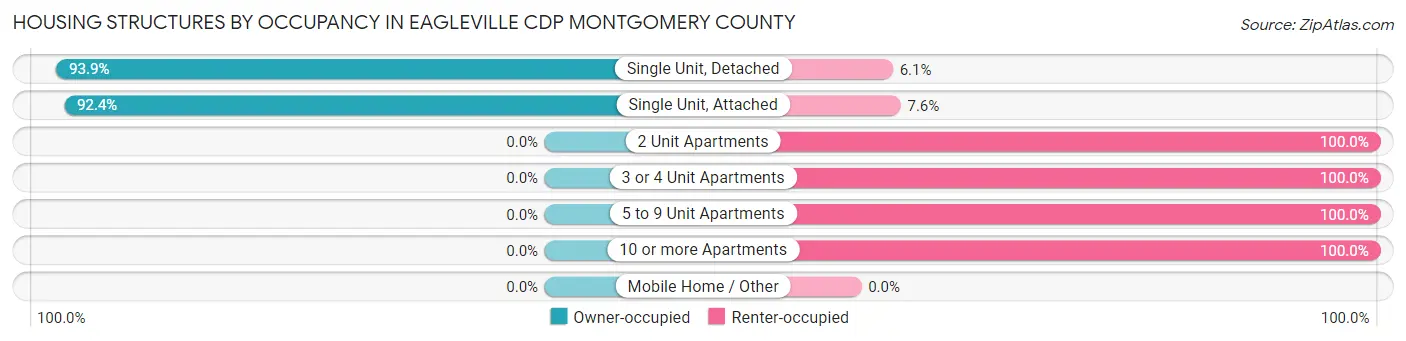
| Structure Type | Owner-occupied | Renter-occupied |
| Single Unit, Detached | 602 (93.9%) | 39 (6.1%) |
| Single Unit, Attached | 183 (92.4%) | 15 (7.6%) |
| 2 Unit Apartments | 0 (0.0%) | 142 (100.0%) |
| 3 or 4 Unit Apartments | 0 (0.0%) | 39 (100.0%) |
| 5 to 9 Unit Apartments | 0 (0.0%) | 58 (100.0%) |
| 10 or more Apartments | 0 (0.0%) | 228 (100.0%) |
| Mobile Home / Other | 0 (0.0%) | 0 (0.0%) |
| Total | 785 (60.1%) | 521 (39.9%) |
Housing Structures by Number of Rooms in Eagleville CDP Montgomery County
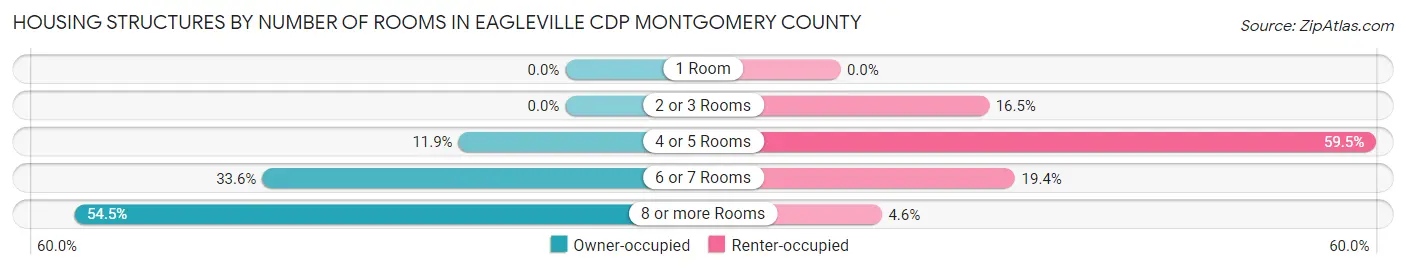
| Number of Rooms | Owner-occupied | Renter-occupied |
| 1 Room | 0 (0.0%) | 0 (0.0%) |
| 2 or 3 Rooms | 0 (0.0%) | 86 (16.5%) |
| 4 or 5 Rooms | 93 (11.8%) | 310 (59.5%) |
| 6 or 7 Rooms | 264 (33.6%) | 101 (19.4%) |
| 8 or more Rooms | 428 (54.5%) | 24 (4.6%) |
| Total | 785 (100.0%) | 521 (100.0%) |
Housing Structure by Heating Type in Eagleville CDP Montgomery County
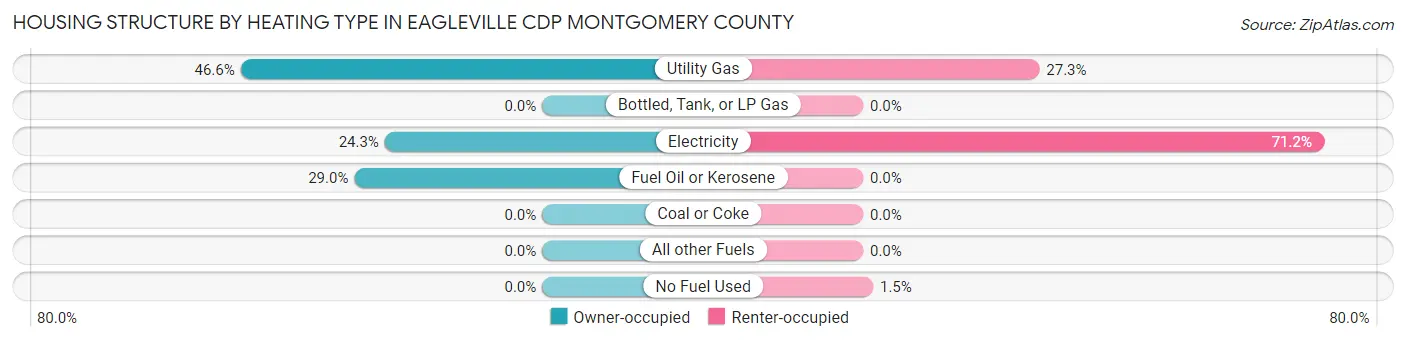
| Heating Type | Owner-occupied | Renter-occupied |
| Utility Gas | 366 (46.6%) | 142 (27.3%) |
| Bottled, Tank, or LP Gas | 0 (0.0%) | 0 (0.0%) |
| Electricity | 191 (24.3%) | 371 (71.2%) |
| Fuel Oil or Kerosene | 228 (29.0%) | 0 (0.0%) |
| Coal or Coke | 0 (0.0%) | 0 (0.0%) |
| All other Fuels | 0 (0.0%) | 0 (0.0%) |
| No Fuel Used | 0 (0.0%) | 8 (1.5%) |
| Total | 785 (100.0%) | 521 (100.0%) |
Household Vehicle Usage in Eagleville CDP Montgomery County
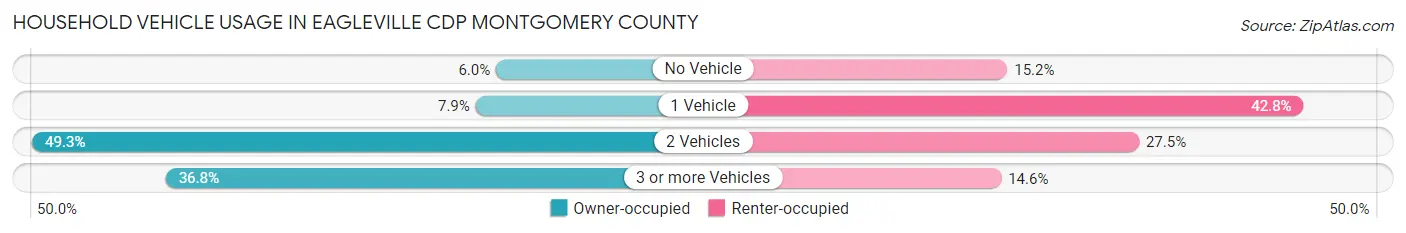
| Vehicles per Household | Owner-occupied | Renter-occupied |
| No Vehicle | 47 (6.0%) | 79 (15.2%) |
| 1 Vehicle | 62 (7.9%) | 223 (42.8%) |
| 2 Vehicles | 387 (49.3%) | 143 (27.5%) |
| 3 or more Vehicles | 289 (36.8%) | 76 (14.6%) |
| Total | 785 (100.0%) | 521 (100.0%) |
Real Estate & Mortgages in Eagleville CDP Montgomery County
Real Estate and Mortgage Overview in Eagleville CDP Montgomery County
| Characteristic | Without Mortgage | With Mortgage |
| Housing Units | 216 | 569 |
| Median Property Value | $287,700 | $349,300 |
| Median Household Income | $134,375 | $299 |
| Monthly Housing Costs | $828 | $71 |
| Real Estate Taxes | $5,342 | $20 |
Property Value by Mortgage Status in Eagleville CDP Montgomery County
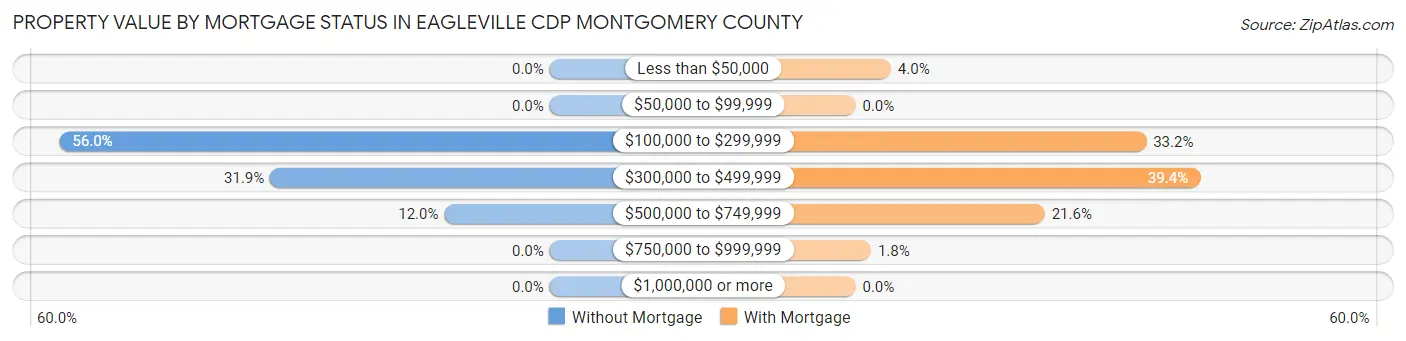
| Property Value | Without Mortgage | With Mortgage |
| Less than $50,000 | 0 (0.0%) | 23 (4.0%) |
| $50,000 to $99,999 | 0 (0.0%) | 0 (0.0%) |
| $100,000 to $299,999 | 121 (56.0%) | 189 (33.2%) |
| $300,000 to $499,999 | 69 (31.9%) | 224 (39.4%) |
| $500,000 to $749,999 | 26 (12.0%) | 123 (21.6%) |
| $750,000 to $999,999 | 0 (0.0%) | 10 (1.8%) |
| $1,000,000 or more | 0 (0.0%) | 0 (0.0%) |
| Total | 216 (100.0%) | 569 (100.0%) |
Household Income by Mortgage Status in Eagleville CDP Montgomery County
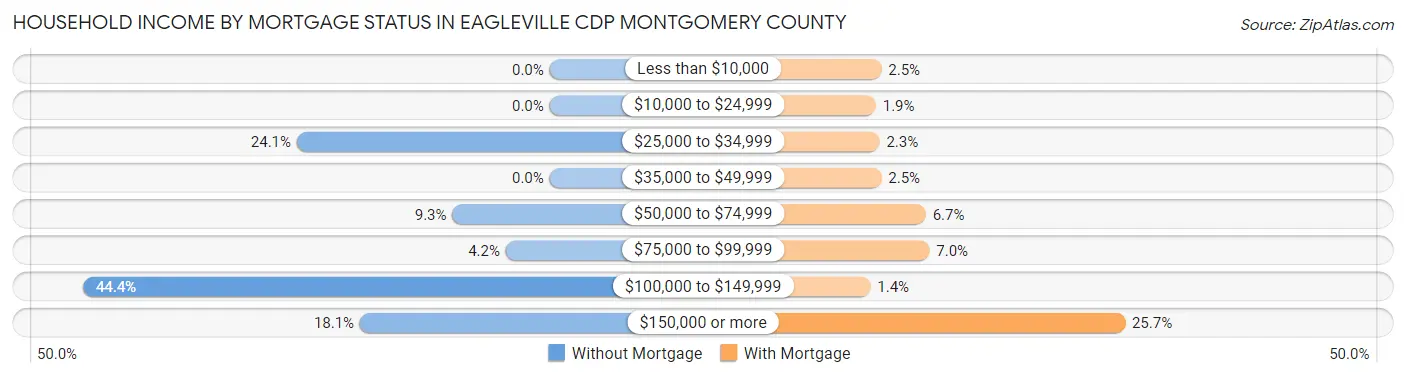
| Household Income | Without Mortgage | With Mortgage |
| Less than $10,000 | 0 (0.0%) | 14 (2.5%) |
| $10,000 to $24,999 | 0 (0.0%) | 11 (1.9%) |
| $25,000 to $34,999 | 52 (24.1%) | 13 (2.3%) |
| $35,000 to $49,999 | 0 (0.0%) | 14 (2.5%) |
| $50,000 to $74,999 | 20 (9.3%) | 38 (6.7%) |
| $75,000 to $99,999 | 9 (4.2%) | 40 (7.0%) |
| $100,000 to $149,999 | 96 (44.4%) | 8 (1.4%) |
| $150,000 or more | 39 (18.1%) | 146 (25.7%) |
| Total | 216 (100.0%) | 569 (100.0%) |
Property Value to Household Income Ratio in Eagleville CDP Montgomery County
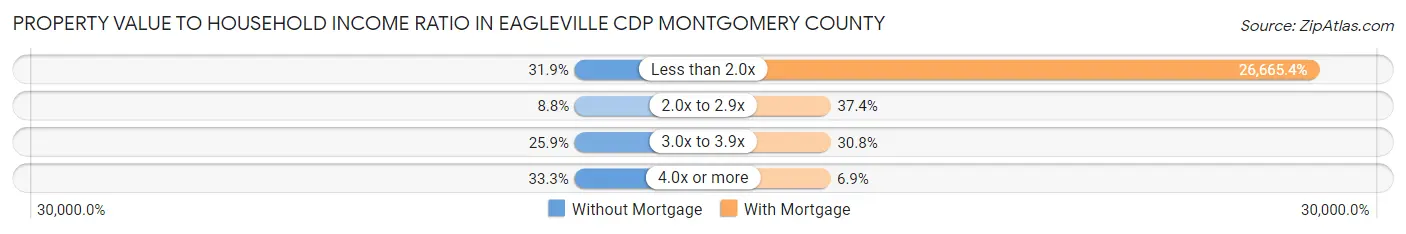
| Value-to-Income Ratio | Without Mortgage | With Mortgage |
| Less than 2.0x | 69 (31.9%) | 151,726 (26,665.4%) |
| 2.0x to 2.9x | 19 (8.8%) | 213 (37.4%) |
| 3.0x to 3.9x | 56 (25.9%) | 175 (30.8%) |
| 4.0x or more | 72 (33.3%) | 39 (6.9%) |
| Total | 216 (100.0%) | 569 (100.0%) |
Real Estate Taxes by Mortgage Status in Eagleville CDP Montgomery County
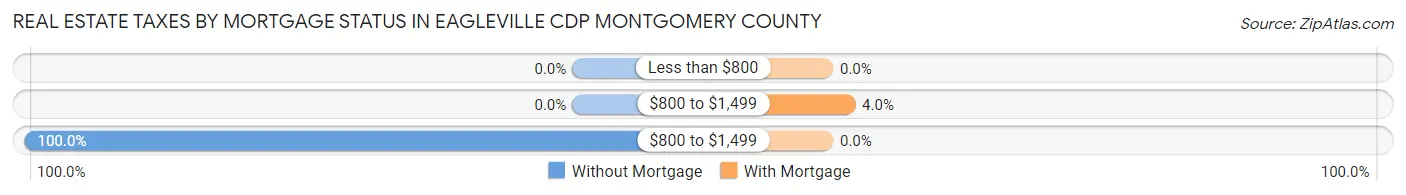
| Property Taxes | Without Mortgage | With Mortgage |
| Less than $800 | 0 (0.0%) | 0 (0.0%) |
| $800 to $1,499 | 0 (0.0%) | 23 (4.0%) |
| $800 to $1,499 | 216 (100.0%) | 0 (0.0%) |
| Total | 216 (100.0%) | 569 (100.0%) |
Health & Disability in Eagleville CDP Montgomery County
Health Insurance Coverage by Age in Eagleville CDP Montgomery County
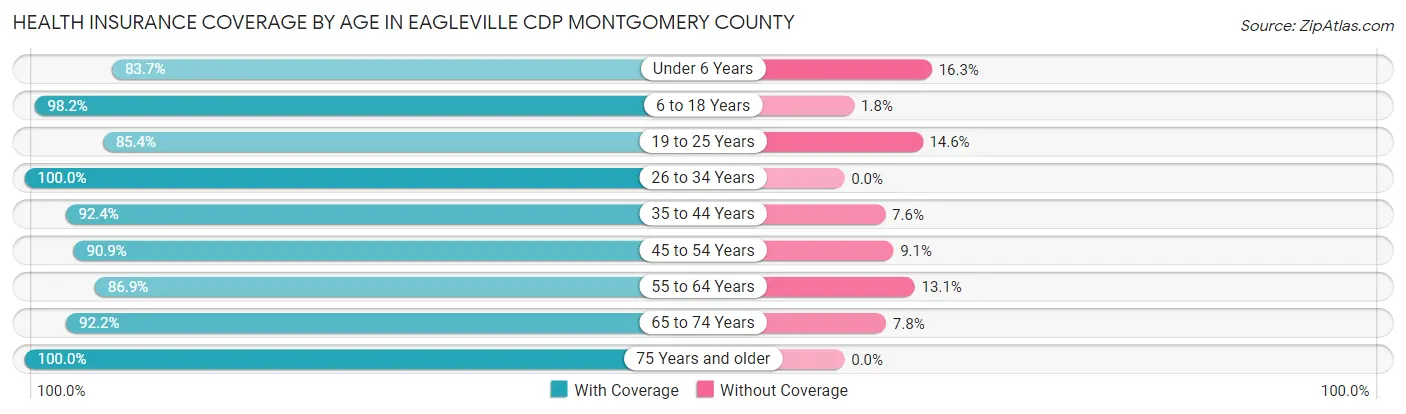
| Age Bracket | With Coverage | Without Coverage |
| Under 6 Years | 154 (83.7%) | 30 (16.3%) |
| 6 to 18 Years | 639 (98.2%) | 12 (1.8%) |
| 19 to 25 Years | 217 (85.4%) | 37 (14.6%) |
| 26 to 34 Years | 519 (100.0%) | 0 (0.0%) |
| 35 to 44 Years | 461 (92.4%) | 38 (7.6%) |
| 45 to 54 Years | 488 (90.9%) | 49 (9.1%) |
| 55 to 64 Years | 470 (86.9%) | 71 (13.1%) |
| 65 to 74 Years | 321 (92.2%) | 27 (7.8%) |
| 75 Years and older | 183 (100.0%) | 0 (0.0%) |
| Total | 3,452 (92.9%) | 264 (7.1%) |
Health Insurance Coverage by Citizenship Status in Eagleville CDP Montgomery County
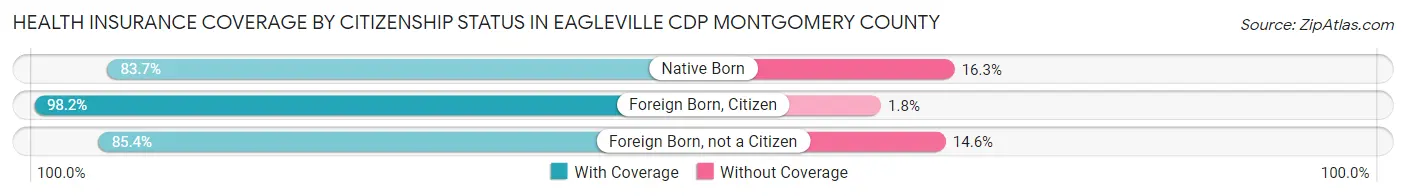
| Citizenship Status | With Coverage | Without Coverage |
| Native Born | 154 (83.7%) | 30 (16.3%) |
| Foreign Born, Citizen | 639 (98.2%) | 12 (1.8%) |
| Foreign Born, not a Citizen | 217 (85.4%) | 37 (14.6%) |
Health Insurance Coverage by Household Income in Eagleville CDP Montgomery County
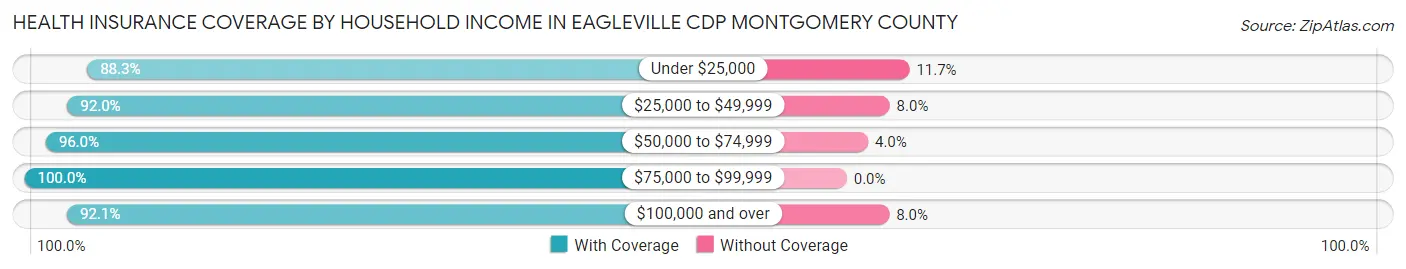
| Household Income | With Coverage | Without Coverage |
| Under $25,000 | 203 (88.3%) | 27 (11.7%) |
| $25,000 to $49,999 | 332 (92.0%) | 29 (8.0%) |
| $50,000 to $74,999 | 458 (96.0%) | 19 (4.0%) |
| $75,000 to $99,999 | 260 (100.0%) | 0 (0.0%) |
| $100,000 and over | 2,187 (92.0%) | 189 (8.0%) |
Public vs Private Health Insurance Coverage by Age in Eagleville CDP Montgomery County
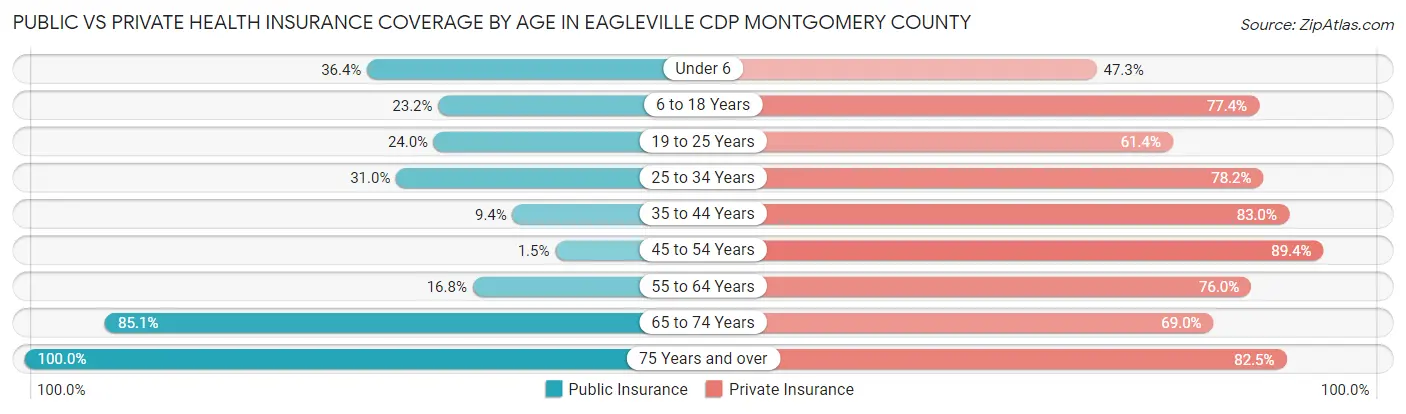
| Age Bracket | Public Insurance | Private Insurance |
| Under 6 | 67 (36.4%) | 87 (47.3%) |
| 6 to 18 Years | 151 (23.2%) | 504 (77.4%) |
| 19 to 25 Years | 61 (24.0%) | 156 (61.4%) |
| 25 to 34 Years | 161 (31.0%) | 406 (78.2%) |
| 35 to 44 Years | 47 (9.4%) | 414 (83.0%) |
| 45 to 54 Years | 8 (1.5%) | 480 (89.4%) |
| 55 to 64 Years | 91 (16.8%) | 411 (76.0%) |
| 65 to 74 Years | 296 (85.1%) | 240 (69.0%) |
| 75 Years and over | 183 (100.0%) | 151 (82.5%) |
| Total | 1,065 (28.7%) | 2,849 (76.7%) |
Disability Status by Sex by Age in Eagleville CDP Montgomery County
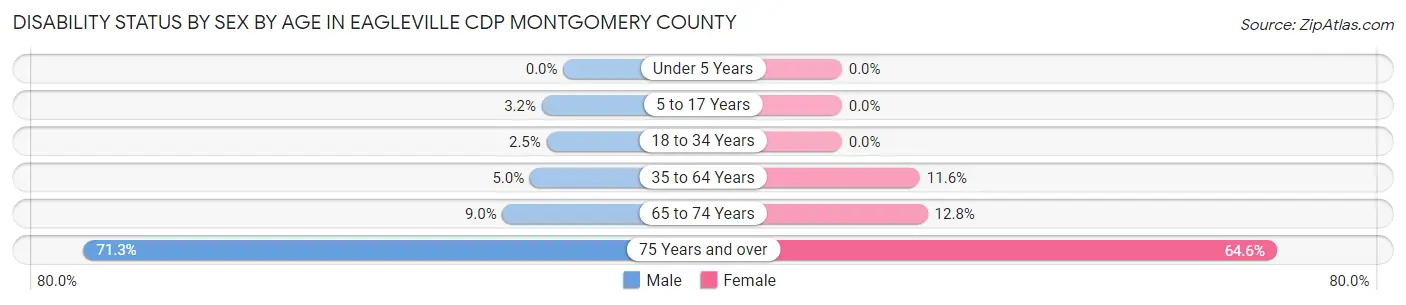
| Age Bracket | Male | Female |
| Under 5 Years | 0 (0.0%) | 0 (0.0%) |
| 5 to 17 Years | 8 (3.2%) | 0 (0.0%) |
| 18 to 34 Years | 10 (2.5%) | 0 (0.0%) |
| 35 to 64 Years | 38 (5.0%) | 94 (11.6%) |
| 65 to 74 Years | 13 (9.0%) | 26 (12.8%) |
| 75 Years and over | 62 (71.3%) | 62 (64.6%) |
Disability Class by Sex by Age in Eagleville CDP Montgomery County
Disability Class: Hearing Difficulty
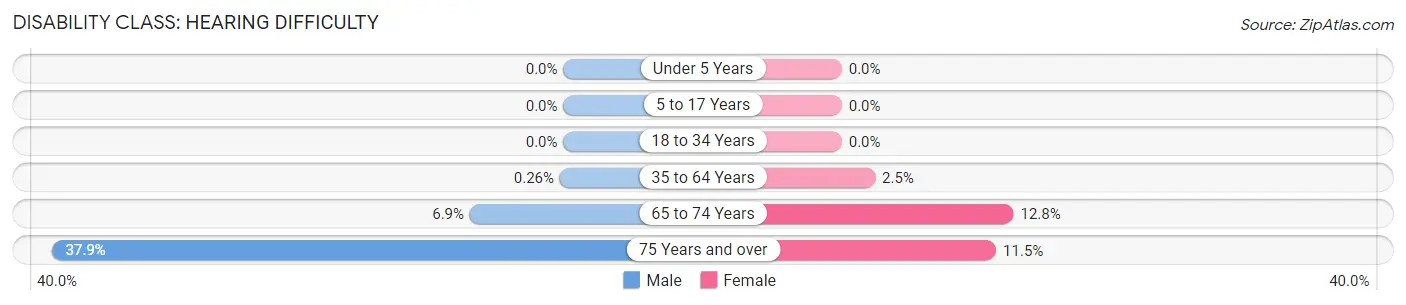
| Age Bracket | Male | Female |
| Under 5 Years | 0 (0.0%) | 0 (0.0%) |
| 5 to 17 Years | 0 (0.0%) | 0 (0.0%) |
| 18 to 34 Years | 0 (0.0%) | 0 (0.0%) |
| 35 to 64 Years | 2 (0.3%) | 20 (2.5%) |
| 65 to 74 Years | 10 (6.9%) | 26 (12.8%) |
| 75 Years and over | 33 (37.9%) | 11 (11.5%) |
Disability Class: Vision Difficulty
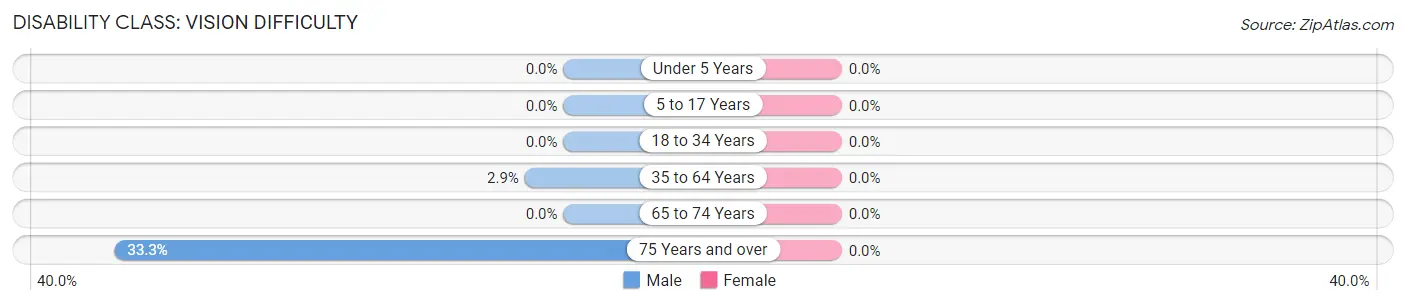
| Age Bracket | Male | Female |
| Under 5 Years | 0 (0.0%) | 0 (0.0%) |
| 5 to 17 Years | 0 (0.0%) | 0 (0.0%) |
| 18 to 34 Years | 0 (0.0%) | 0 (0.0%) |
| 35 to 64 Years | 22 (2.9%) | 0 (0.0%) |
| 65 to 74 Years | 0 (0.0%) | 0 (0.0%) |
| 75 Years and over | 29 (33.3%) | 0 (0.0%) |
Disability Class: Cognitive Difficulty
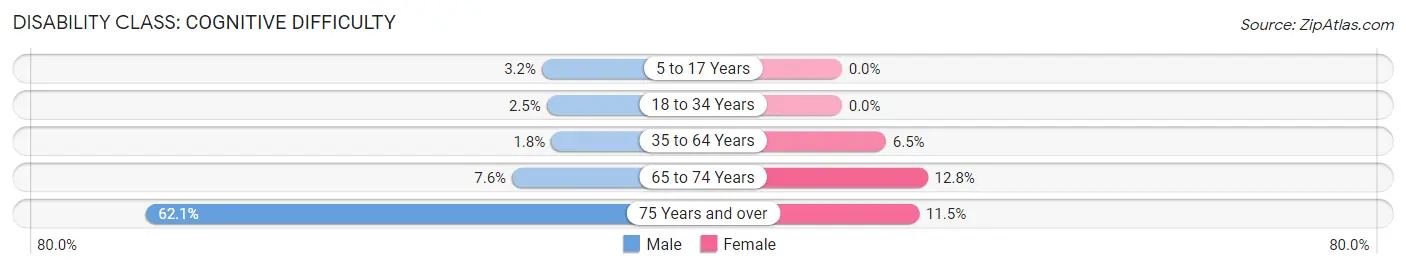
| Age Bracket | Male | Female |
| 5 to 17 Years | 8 (3.2%) | 0 (0.0%) |
| 18 to 34 Years | 10 (2.5%) | 0 (0.0%) |
| 35 to 64 Years | 14 (1.8%) | 53 (6.5%) |
| 65 to 74 Years | 11 (7.6%) | 26 (12.8%) |
| 75 Years and over | 54 (62.1%) | 11 (11.5%) |
Disability Class: Ambulatory Difficulty
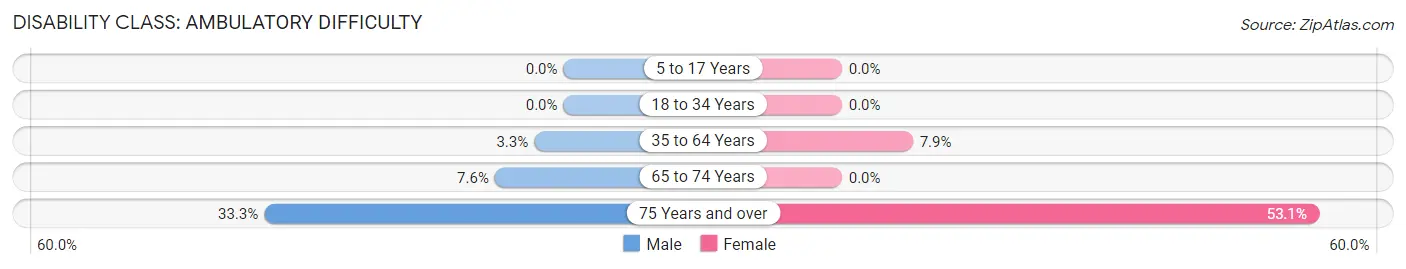
| Age Bracket | Male | Female |
| 5 to 17 Years | 0 (0.0%) | 0 (0.0%) |
| 18 to 34 Years | 0 (0.0%) | 0 (0.0%) |
| 35 to 64 Years | 25 (3.3%) | 64 (7.9%) |
| 65 to 74 Years | 11 (7.6%) | 0 (0.0%) |
| 75 Years and over | 29 (33.3%) | 51 (53.1%) |
Disability Class: Self-Care Difficulty
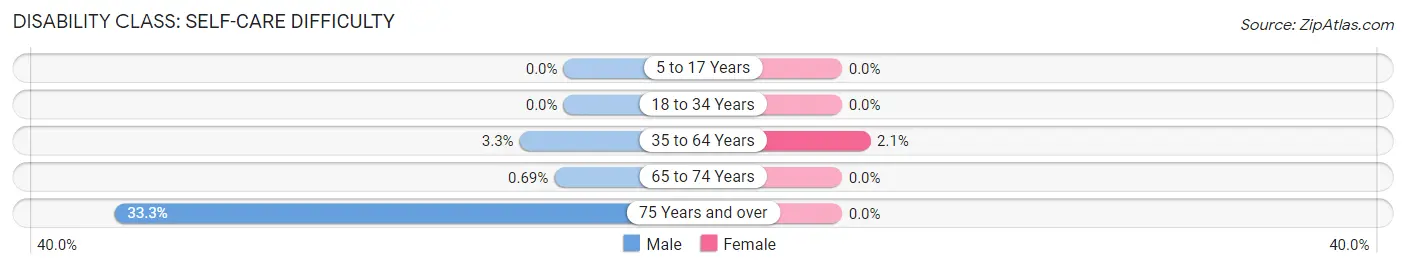
| Age Bracket | Male | Female |
| 5 to 17 Years | 0 (0.0%) | 0 (0.0%) |
| 18 to 34 Years | 0 (0.0%) | 0 (0.0%) |
| 35 to 64 Years | 25 (3.3%) | 17 (2.1%) |
| 65 to 74 Years | 1 (0.7%) | 0 (0.0%) |
| 75 Years and over | 29 (33.3%) | 0 (0.0%) |
Technology Access in Eagleville CDP Montgomery County
Computing Device Access in Eagleville CDP Montgomery County
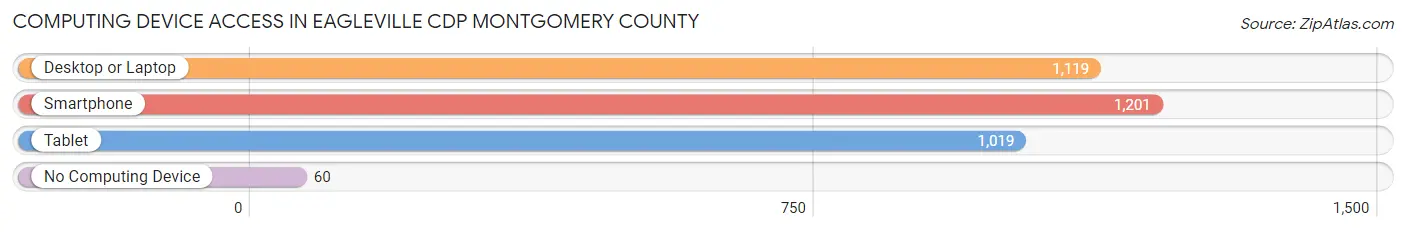
| Device Type | # Households | % Households |
| Desktop or Laptop | 1,119 | 85.7% |
| Smartphone | 1,201 | 92.0% |
| Tablet | 1,019 | 78.0% |
| No Computing Device | 60 | 4.6% |
| Total | 1,306 | 100.0% |
Internet Access in Eagleville CDP Montgomery County
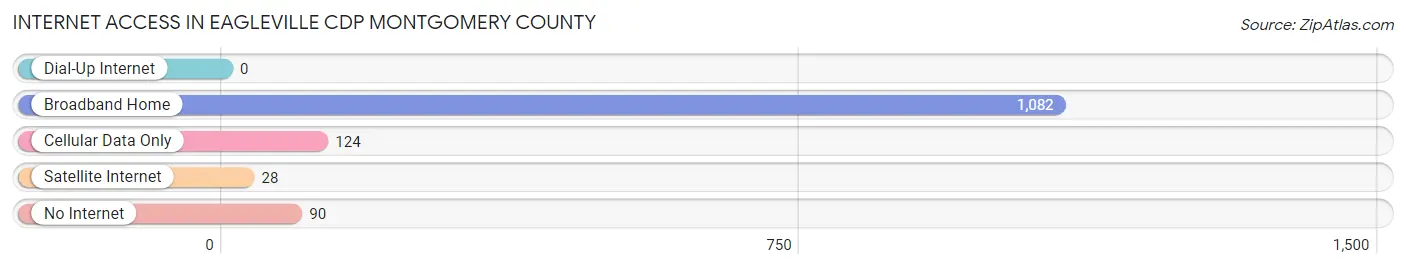
| Internet Type | # Households | % Households |
| Dial-Up Internet | 0 | 0.0% |
| Broadband Home | 1,082 | 82.9% |
| Cellular Data Only | 124 | 9.5% |
| Satellite Internet | 28 | 2.1% |
| No Internet | 90 | 6.9% |
| Total | 1,306 | 100.0% |
Eagleville CDP Montgomery County Summary
Eagleville Cdp is a census-designated place (CDP) located in Montgomery County, Pennsylvania. It is situated in the southeastern part of the county, approximately 20 miles northwest of Philadelphia. As of the 2010 census, the population of Eagleville Cdp was 4,890.
Geography
Eagleville Cdp is located at 40°7'25" North, 75°20'25" West (40.123611, -75.340278). It has an area of 1.7 square miles, all of which is land. The CDP is bordered by the boroughs of Norristown and Bridgeport to the north, the borough of Trooper to the east, the borough of Audubon to the south, and the borough of West Norriton to the west.
Demographics
As of the 2010 census, there were 4,890 people, 1,845 households, and 1,288 families residing in the CDP. The population density was 2,876.5 people per square mile. The racial makeup of the CDP was 87.2% White, 8.2% African American, 0.2% Native American, 1.7% Asian, 0.7% from other races, and 2.0% from two or more races. Hispanic or Latino of any race were 2.7% of the population.
There were 1,845 households, out of which 33.2% had children under the age of 18 living with them, 51.2% were married couples living together, 12.7% had a female householder with no husband present, and 30.7% were non-families. 25.2% of all households were made up of individuals, and 10.2% had someone living alone who was 65 years of age or older. The average household size was 2.64 and the average family size was 3.17.
In the CDP, the population was spread out, with 25.2% under the age of 18, 7.2% from 18 to 24, 30.2% from 25 to 44, 23.2% from 45 to 64, and 14.2% who were 65 years of age or older. The median age was 37 years. For every 100 females, there were 93.2 males. For every 100 females age 18 and over, there were 90.2 males.
The median income for a household in the CDP was $60,938, and the median income for a family was $68,958. Males had a median income of $45,938 versus $35,938 for females. The per capita income for the CDP was $25,938. About 3.2% of families and 4.2% of the population were below the poverty line, including 5.2% of those under age 18 and 4.2% of those age 65 or over.
Economy
Eagleville Cdp is home to several businesses, including a variety of retail stores, restaurants, and professional services. The largest employer in the CDP is the Montgomery County government, which employs over 1,000 people. Other major employers include the Eagleville Hospital, the Montgomery County Community College, and the Montgomery County Public Schools.
The CDP is also home to several industrial parks, including the Eagleville Industrial Park, the Montgomery County Industrial Park, and the Norristown Industrial Park. These parks are home to a variety of businesses, including manufacturing, warehousing, and distribution companies.
Conclusion
Eagleville Cdp is a census-designated place located in Montgomery County, Pennsylvania. It is situated in the southeastern part of the county, approximately 20 miles northwest of Philadelphia. As of the 2010 census, the population of Eagleville Cdp was 4,890. The CDP is home to several businesses, including a variety of retail stores, restaurants, and professional services. The largest employer in the CDP is the Montgomery County government, which employs over 1,000 people. Other major employers include the Eagleville Hospital, the Montgomery County Community College, and the Montgomery County Public Schools. The CDP is also home to several industrial parks, including the Eagleville Industrial Park, the Montgomery County Industrial Park, and the Norristown Industrial Park. These parks are home to a variety of businesses, including manufacturing, warehousing, and distribution companies.
Common Questions
What is Per Capita Income in Eagleville CDP Montgomery County?
Per Capita income in Eagleville CDP Montgomery County is $33,426.
What is the Median Family Income in Eagleville CDP Montgomery County?
Median Family Income in Eagleville CDP Montgomery County is $115,417.
What is the Median Household income in Eagleville CDP Montgomery County?
Median Household Income in Eagleville CDP Montgomery County is $111,574.
What is Income or Wage Gap in Eagleville CDP Montgomery County?
Income or Wage Gap in Eagleville CDP Montgomery County is 47.6%.
Women in Eagleville CDP Montgomery County earn 52.4 cents for every dollar earned by a man.
What is Inequality or Gini Index in Eagleville CDP Montgomery County?
Inequality or Gini Index in Eagleville CDP Montgomery County is 0.41.
What is the Total Population of Eagleville CDP Montgomery County?
Total Population of Eagleville CDP Montgomery County is 5,162.
What is the Total Male Population of Eagleville CDP Montgomery County?
Total Male Population of Eagleville CDP Montgomery County is 2,936.
What is the Total Female Population of Eagleville CDP Montgomery County?
Total Female Population of Eagleville CDP Montgomery County is 2,226.
What is the Ratio of Males per 100 Females in Eagleville CDP Montgomery County?
There are 131.90 Males per 100 Females in Eagleville CDP Montgomery County.
What is the Ratio of Females per 100 Males in Eagleville CDP Montgomery County?
There are 75.82 Females per 100 Males in Eagleville CDP Montgomery County.
What is the Median Population Age in Eagleville CDP Montgomery County?
Median Population Age in Eagleville CDP Montgomery County is 38.1 Years.
What is the Average Family Size in Eagleville CDP Montgomery County
Average Family Size in Eagleville CDP Montgomery County is 3.2 People.
What is the Average Household Size in Eagleville CDP Montgomery County
Average Household Size in Eagleville CDP Montgomery County is 2.8 People.
How Large is the Labor Force in Eagleville CDP Montgomery County?
There are 2,073 People in the Labor Forcein in Eagleville CDP Montgomery County.
What is the Percentage of People in the Labor Force in Eagleville CDP Montgomery County?
46.9% of People are in the Labor Force in Eagleville CDP Montgomery County.
What is the Unemployment Rate in Eagleville CDP Montgomery County?
Unemployment Rate in Eagleville CDP Montgomery County is 7.0%.