Table Rock, PA Map & Demographics
Table Rock Map
Table Rock Overview
$39,770
PER CAPITA INCOME
$50,000
AVG HOUSEHOLD INCOME
0.45
INEQUALITY / GINI INDEX
100
TOTAL POPULATION
41
MALE POPULATION
59
FEMALE POPULATION
69.49
MALES / 100 FEMALES
143.90
FEMALES / 100 MALES
58.6
MEDIAN AGE
3.2
AVG FAMILY SIZE
2.5
AVG HOUSEHOLD SIZE
49
LABOR FORCE [ PEOPLE ]
51.6%
PERCENT IN LABOR FORCE
Income in Table Rock
Income Overview in Table Rock
| Characteristic | Number | Measure |
| Per Capita Income | 100 | $39,770 |
| Median Family Income | 24 | $0 |
| Mean Family Income | 24 | $114,058 |
| Median Household Income | 40 | $50,000 |
| Mean Household Income | 40 | $84,925 |
| Income Deficit | 24 | $0 |
| Wage / Income Gap (%) | 100 | 0.00% |
| Wage / Income Gap ($) | 100 | 100.00¢ per $1 |
| Gini / Inequality Index | 100 | 0.45 |
Earnings by Sex in Table Rock
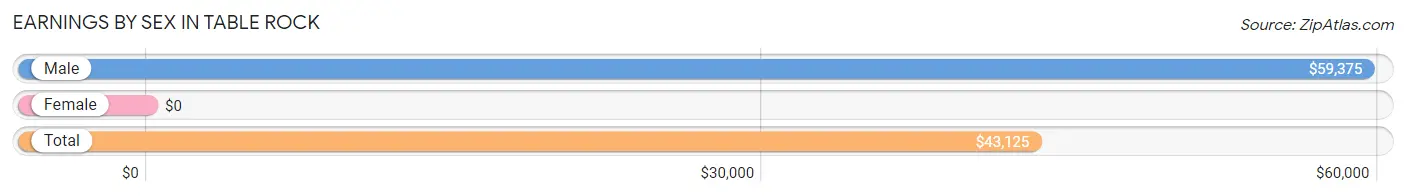
| Sex | Number | Average Earnings |
| Male | 21 (42.9%) | $59,375 |
| Female | 28 (57.1%) | $0 |
| Total | 49 (100.0%) | $43,125 |
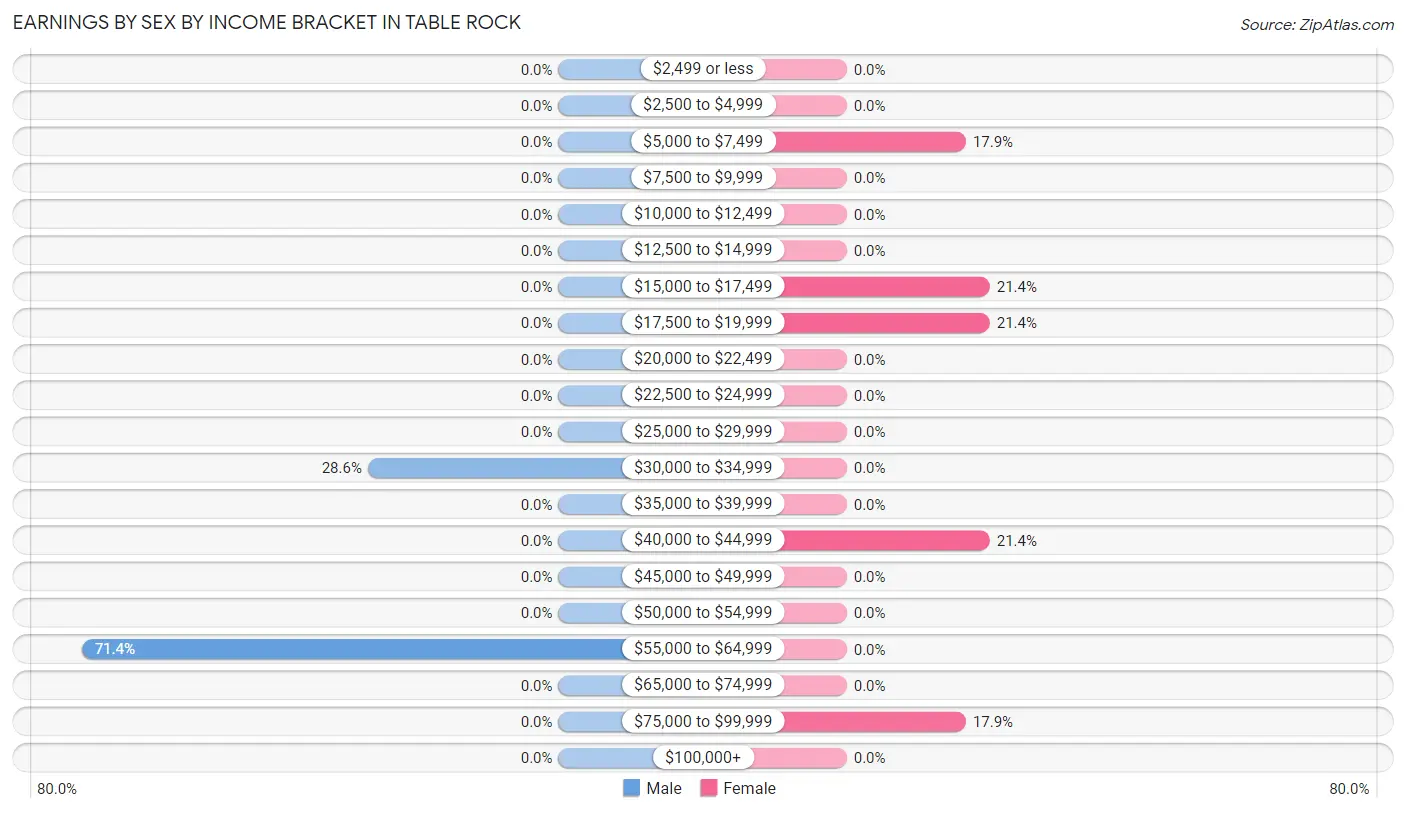
Earnings by Sex by Income Bracket in Table Rock
The most common earnings brackets in Table Rock are $55,000 to $64,999 for men (15 | 71.4%) and $15,000 to $17,499 for women (6 | 21.4%).
| Income | Male | Female |
| $2,499 or less | 0 (0.0%) | 0 (0.0%) |
| $2,500 to $4,999 | 0 (0.0%) | 0 (0.0%) |
| $5,000 to $7,499 | 0 (0.0%) | 5 (17.9%) |
| $7,500 to $9,999 | 0 (0.0%) | 0 (0.0%) |
| $10,000 to $12,499 | 0 (0.0%) | 0 (0.0%) |
| $12,500 to $14,999 | 0 (0.0%) | 0 (0.0%) |
| $15,000 to $17,499 | 0 (0.0%) | 6 (21.4%) |
| $17,500 to $19,999 | 0 (0.0%) | 6 (21.4%) |
| $20,000 to $22,499 | 0 (0.0%) | 0 (0.0%) |
| $22,500 to $24,999 | 0 (0.0%) | 0 (0.0%) |
| $25,000 to $29,999 | 0 (0.0%) | 0 (0.0%) |
| $30,000 to $34,999 | 6 (28.6%) | 0 (0.0%) |
| $35,000 to $39,999 | 0 (0.0%) | 0 (0.0%) |
| $40,000 to $44,999 | 0 (0.0%) | 6 (21.4%) |
| $45,000 to $49,999 | 0 (0.0%) | 0 (0.0%) |
| $50,000 to $54,999 | 0 (0.0%) | 0 (0.0%) |
| $55,000 to $64,999 | 15 (71.4%) | 0 (0.0%) |
| $65,000 to $74,999 | 0 (0.0%) | 0 (0.0%) |
| $75,000 to $99,999 | 0 (0.0%) | 5 (17.9%) |
| $100,000+ | 0 (0.0%) | 0 (0.0%) |
| Total | 21 (100.0%) | 28 (100.0%) |
Earnings by Sex by Educational Attainment in Table Rock
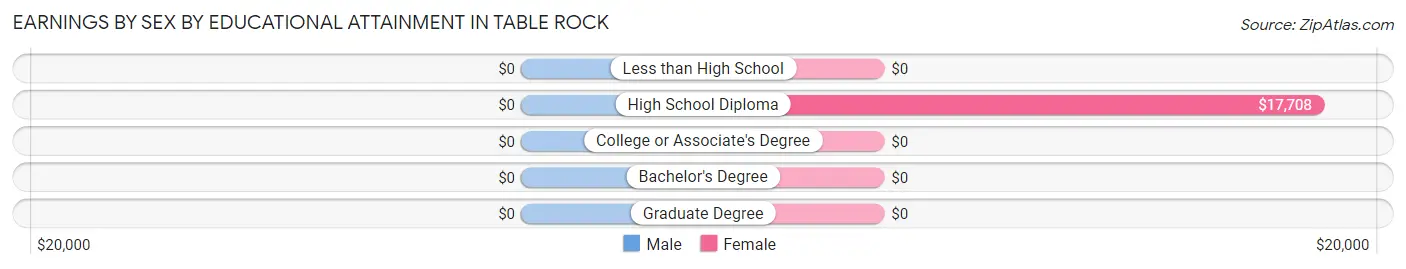
| Educational Attainment | Male Income | Female Income |
| Less than High School | - | - |
| High School Diploma | - | - |
| College or Associate's Degree | - | - |
| Bachelor's Degree | - | - |
| Graduate Degree | - | - |
| Total | $59,375 | $0 |
Family Income in Table Rock
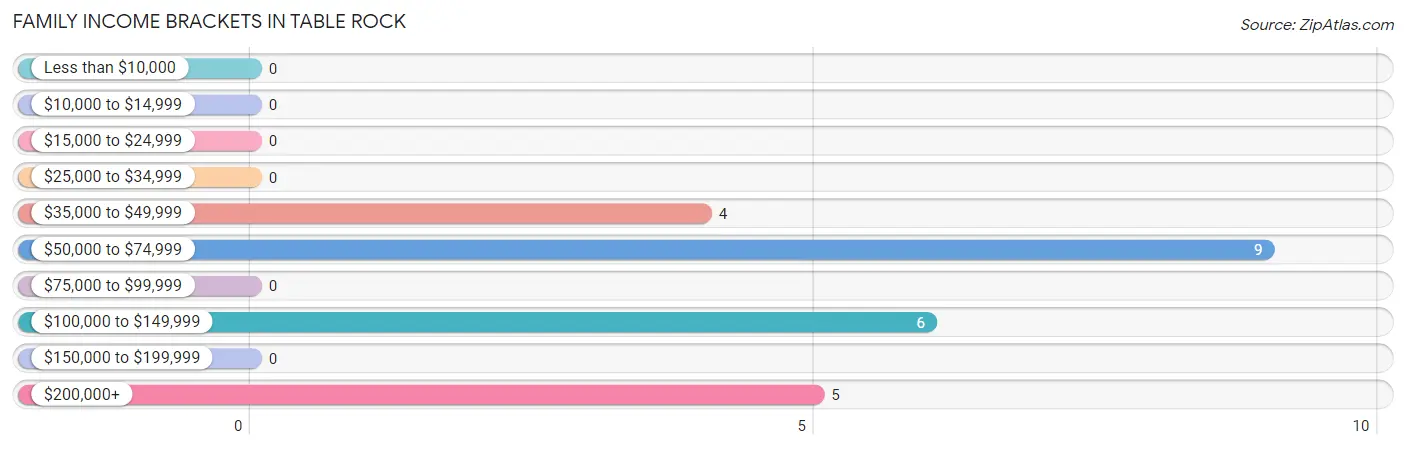
Family Income Brackets in Table Rock
According to the Table Rock family income data, there are 9 families falling into the $50,000 to $74,999 income range, which is the most common income bracket and makes up 37.5% of all families.
| Income Bracket | # Families | % Families |
| Less than $10,000 | 0 | 0.0% |
| $10,000 to $14,999 | 0 | 0.0% |
| $15,000 to $24,999 | 0 | 0.0% |
| $25,000 to $34,999 | 0 | 0.0% |
| $35,000 to $49,999 | 4 | 16.7% |
| $50,000 to $74,999 | 9 | 37.5% |
| $75,000 to $99,999 | 0 | 0.0% |
| $100,000 to $149,999 | 6 | 25.0% |
| $150,000 to $199,999 | 0 | 0.0% |
| $200,000+ | 5 | 20.8% |
Family Income by Famaliy Size in Table Rock
| Income Bracket | # Families | Median Income |
| 2-Person Families | 19 (79.2%) | $0 |
| 3-Person Families | 0 (0.0%) | $0 |
| 4-Person Families | 0 (0.0%) | $0 |
| 5-Person Families | 0 (0.0%) | $0 |
| 6-Person Families | 5 (20.8%) | $0 |
| 7+ Person Families | 0 (0.0%) | $0 |
| Total | 24 (100.0%) | $0 |
Family Income by Number of Earners in Table Rock

| Number of Earners | # Families | Median Income |
| No Earners | 8 (33.3%) | $0 |
| 1 Earner | 5 (20.8%) | $0 |
| 2 Earners | 11 (45.8%) | $0 |
| 3+ Earners | 0 (0.0%) | $0 |
| Total | 24 (100.0%) | $0 |
Household Income in Table Rock
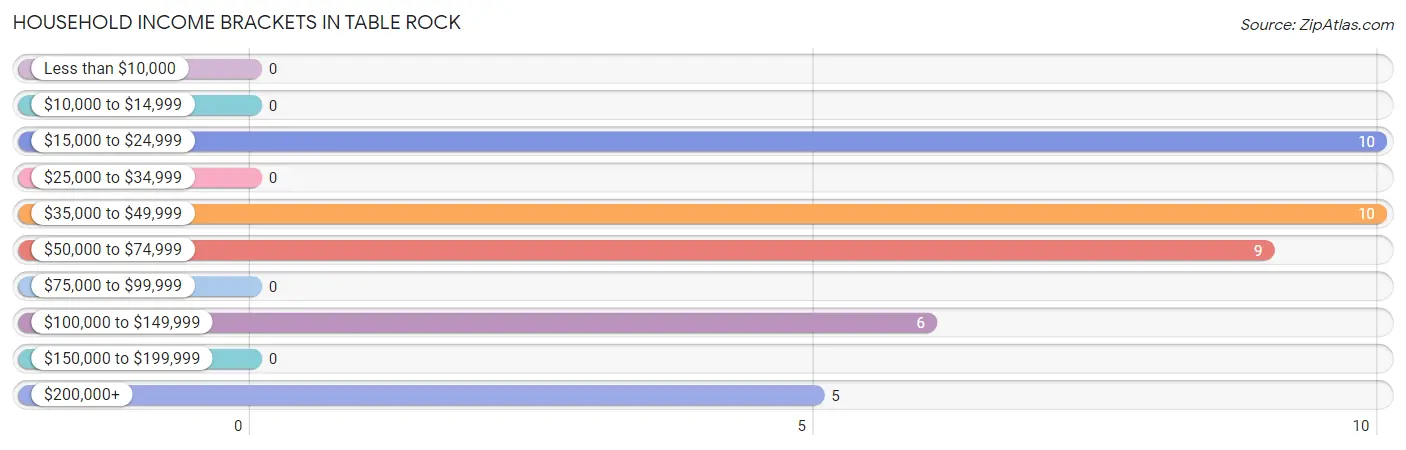
Household Income Brackets in Table Rock
With 10 households falling in the category, the $15,000 to $24,999 income range is the most frequent in Table Rock, accounting for 25.0% of all households.
| Income Bracket | # Households | % Households |
| Less than $10,000 | 0 | 0.0% |
| $10,000 to $14,999 | 0 | 0.0% |
| $15,000 to $24,999 | 10 | 25.0% |
| $25,000 to $34,999 | 0 | 0.0% |
| $35,000 to $49,999 | 10 | 25.0% |
| $50,000 to $74,999 | 9 | 22.5% |
| $75,000 to $99,999 | 0 | 0.0% |
| $100,000 to $149,999 | 6 | 15.0% |
| $150,000 to $199,999 | 0 | 0.0% |
| $200,000+ | 5 | 12.5% |
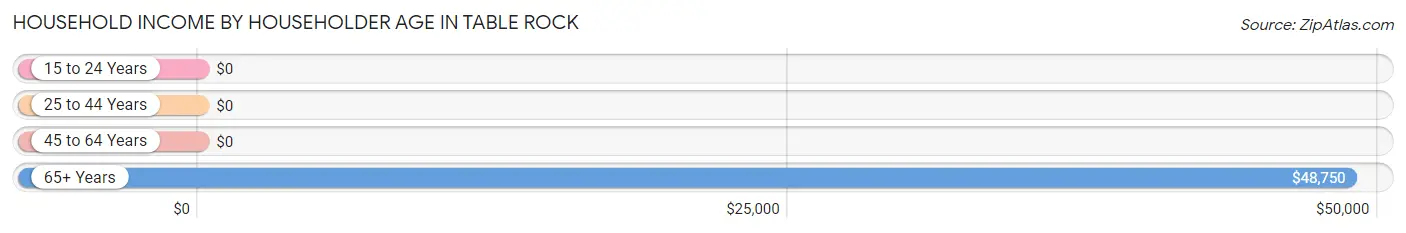
Household Income by Householder Age in Table Rock
The median household income in Table Rock is $50,000, with the highest median household income of $48,750 found in the 65+ years age bracket for the primary householder. A total of 12 households (30.0%) fall into this category.
| Income Bracket | # Households | Median Income |
| 15 to 24 Years | 0 (0.0%) | $0 |
| 25 to 44 Years | 0 (0.0%) | $0 |
| 45 to 64 Years | 28 (70.0%) | $0 |
| 65+ Years | 12 (30.0%) | $48,750 |
| Total | 40 (100.0%) | $50,000 |
Poverty in Table Rock
Income Below Poverty by Sex and Age in Table Rock
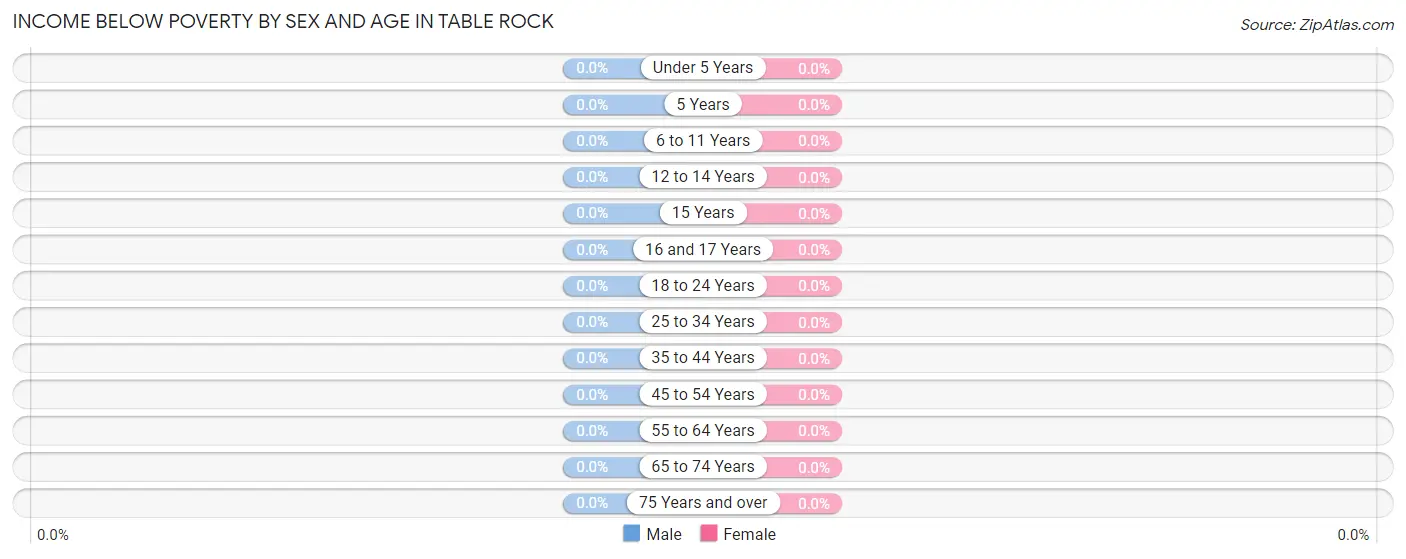
| Age Bracket | Male | Female |
| Under 5 Years | 0 (0.0%) | 0 (0.0%) |
| 5 Years | 0 (0.0%) | 0 (0.0%) |
| 6 to 11 Years | 0 (0.0%) | 0 (0.0%) |
| 12 to 14 Years | 0 (0.0%) | 0 (0.0%) |
| 15 Years | 0 (0.0%) | 0 (0.0%) |
| 16 and 17 Years | 0 (0.0%) | 0 (0.0%) |
| 18 to 24 Years | 0 (0.0%) | 0 (0.0%) |
| 25 to 34 Years | 0 (0.0%) | 0 (0.0%) |
| 35 to 44 Years | 0 (0.0%) | 0 (0.0%) |
| 45 to 54 Years | 0 (0.0%) | 0 (0.0%) |
| 55 to 64 Years | 0 (0.0%) | 0 (0.0%) |
| 65 to 74 Years | 0 (0.0%) | 0 (0.0%) |
| 75 Years and over | 0 (0.0%) | 0 (0.0%) |
| Total | 0 (0.0%) | 0 (0.0%) |
Income Above Poverty by Sex and Age in Table Rock
According to the poverty statistics in Table Rock, males aged 12 to 14 years and females aged 16 and 17 years are the age groups that are most secure financially, with 100.0% of males and 100.0% of females in these age groups living above the poverty line.
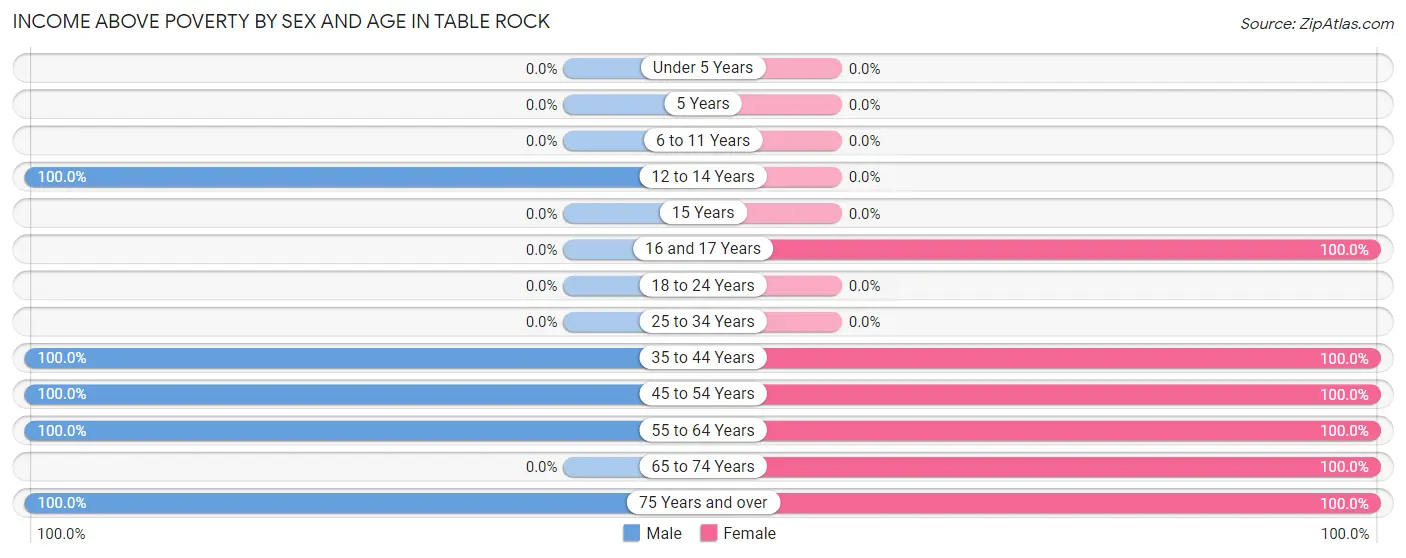
| Age Bracket | Male | Female |
| Under 5 Years | 0 (0.0%) | 0 (0.0%) |
| 5 Years | 0 (0.0%) | 0 (0.0%) |
| 6 to 11 Years | 0 (0.0%) | 0 (0.0%) |
| 12 to 14 Years | 5 (100.0%) | 0 (0.0%) |
| 15 Years | 0 (0.0%) | 0 (0.0%) |
| 16 and 17 Years | 0 (0.0%) | 4 (100.0%) |
| 18 to 24 Years | 0 (0.0%) | 0 (0.0%) |
| 25 to 34 Years | 0 (0.0%) | 0 (0.0%) |
| 35 to 44 Years | 6 (100.0%) | 6 (100.0%) |
| 45 to 54 Years | 6 (100.0%) | 11 (100.0%) |
| 55 to 64 Years | 16 (100.0%) | 22 (100.0%) |
| 65 to 74 Years | 0 (0.0%) | 4 (100.0%) |
| 75 Years and over | 8 (100.0%) | 12 (100.0%) |
| Total | 41 (100.0%) | 59 (100.0%) |
Income Below Poverty Among Married-Couple Families in Table Rock
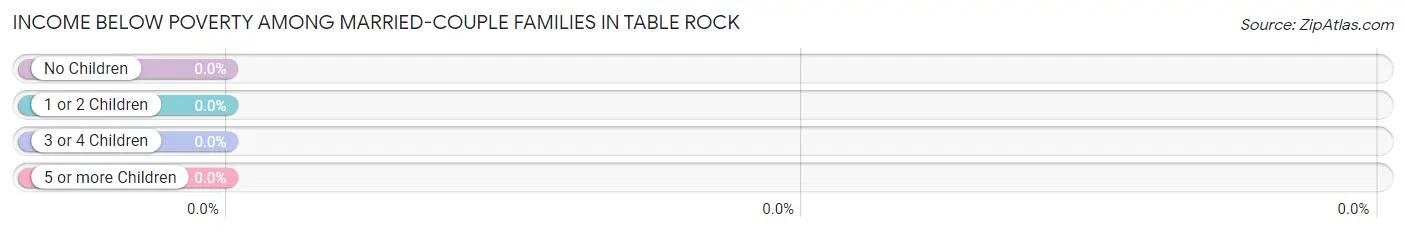
| Children | Above Poverty | Below Poverty |
| No Children | 15 (100.0%) | 0 (0.0%) |
| 1 or 2 Children | 5 (100.0%) | 0 (0.0%) |
| 3 or 4 Children | 0 (0.0%) | 0 (0.0%) |
| 5 or more Children | 0 (0.0%) | 0 (0.0%) |
| Total | 20 (100.0%) | 0 (0.0%) |
Income Below Poverty Among Single-Parent Households in Table Rock
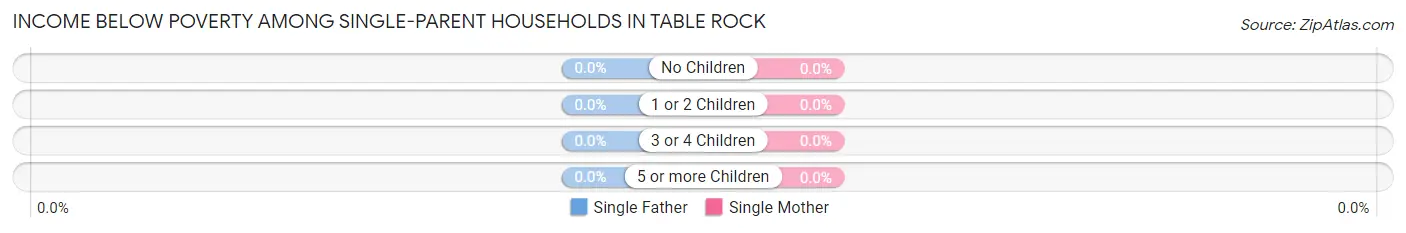
| Children | Single Father | Single Mother |
| No Children | 0 (0.0%) | 0 (0.0%) |
| 1 or 2 Children | 0 (0.0%) | 0 (0.0%) |
| 3 or 4 Children | 0 (0.0%) | 0 (0.0%) |
| 5 or more Children | 0 (0.0%) | 0 (0.0%) |
| Total | 0 (0.0%) | 0 (0.0%) |
Income Below Poverty Among Married-Couple vs Single-Parent Households in Table Rock
| Children | Married-Couple Families | Single-Parent Households |
| No Children | 0 (0.0%) | 0 (0.0%) |
| 1 or 2 Children | 0 (0.0%) | 0 (0.0%) |
| 3 or 4 Children | 0 (0.0%) | 0 (0.0%) |
| 5 or more Children | 0 (0.0%) | 0 (0.0%) |
| Total | 0 (0.0%) | 0 (0.0%) |
Race in Table Rock
The most populous races in Table Rock are White / Caucasian (84 | 84.0%), Asian (9 | 9.0%), and Hispanic or Latino (9 | 9.0%).
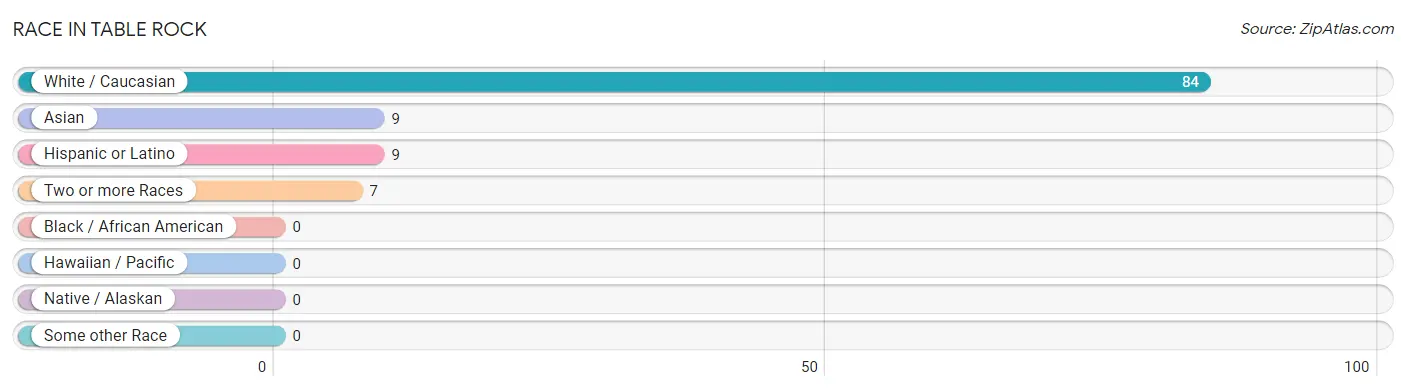
| Race | # Population | % Population |
| Asian | 9 | 9.0% |
| Black / African American | 0 | 0.0% |
| Hawaiian / Pacific | 0 | 0.0% |
| Hispanic or Latino | 9 | 9.0% |
| Native / Alaskan | 0 | 0.0% |
| White / Caucasian | 84 | 84.0% |
| Two or more Races | 7 | 7.0% |
| Some other Race | 0 | 0.0% |
| Total | 100 | 100.0% |
Ancestry in Table Rock
The most populous ancestries reported in Table Rock are Bhutanese (16 | 16.0%), American (12 | 12.0%), German (12 | 12.0%), Irish (11 | 11.0%), and English (9 | 9.0%), together accounting for 60.0% of all Table Rock residents.
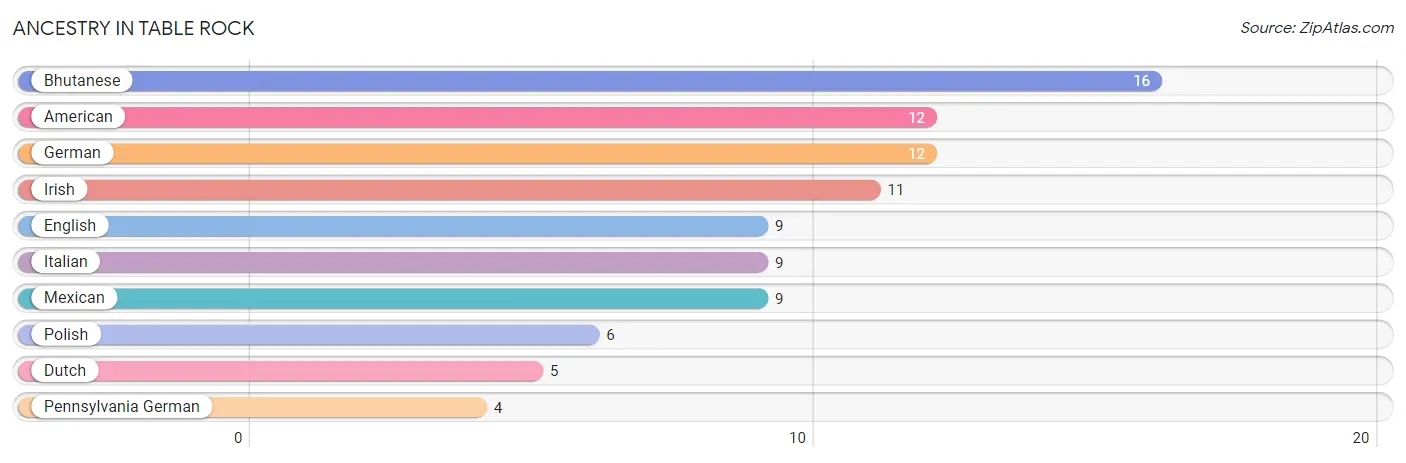
| Ancestry | # Population | % Population |
| American | 12 | 12.0% |
| Bhutanese | 16 | 16.0% |
| Dutch | 5 | 5.0% |
| English | 9 | 9.0% |
| German | 12 | 12.0% |
| Irish | 11 | 11.0% |
| Italian | 9 | 9.0% |
| Mexican | 9 | 9.0% |
| Pennsylvania German | 4 | 4.0% |
| Polish | 6 | 6.0% | View All 10 Rows |
Immigrants in Table Rock
The most numerous immigrant groups reported in Table Rock came from Asia (9 | 9.0%), Eastern Asia (9 | 9.0%), Japan (9 | 9.0%), Europe (7 | 7.0%), and France (7 | 7.0%), together accounting for 41.0% of all Table Rock residents.
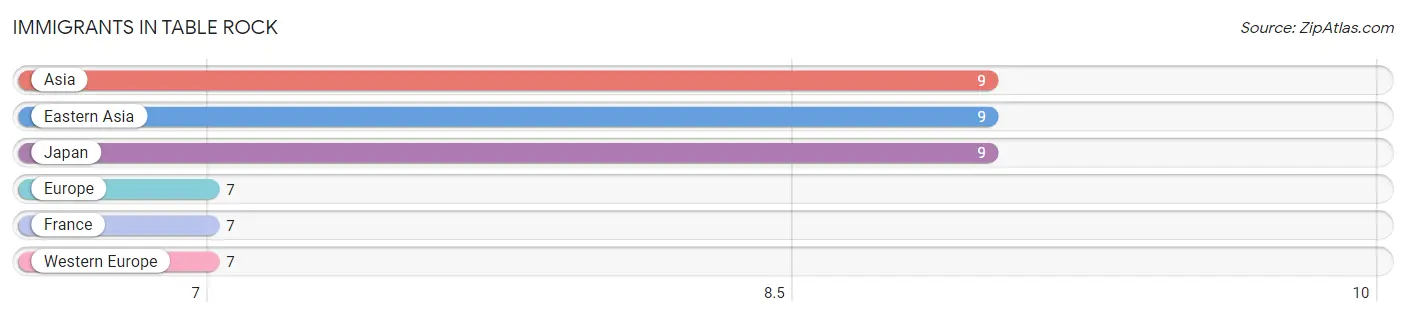
| Immigration Origin | # Population | % Population |
| Asia | 9 | 9.0% |
| Eastern Asia | 9 | 9.0% |
| Europe | 7 | 7.0% |
| France | 7 | 7.0% |
| Japan | 9 | 9.0% |
| Western Europe | 7 | 7.0% | View All 6 Rows |
Sex and Age in Table Rock
Sex and Age in Table Rock
The most populous age groups in Table Rock are 55 to 59 Years (9 | 22.0%) for men and 55 to 59 Years (16 | 27.1%) for women.
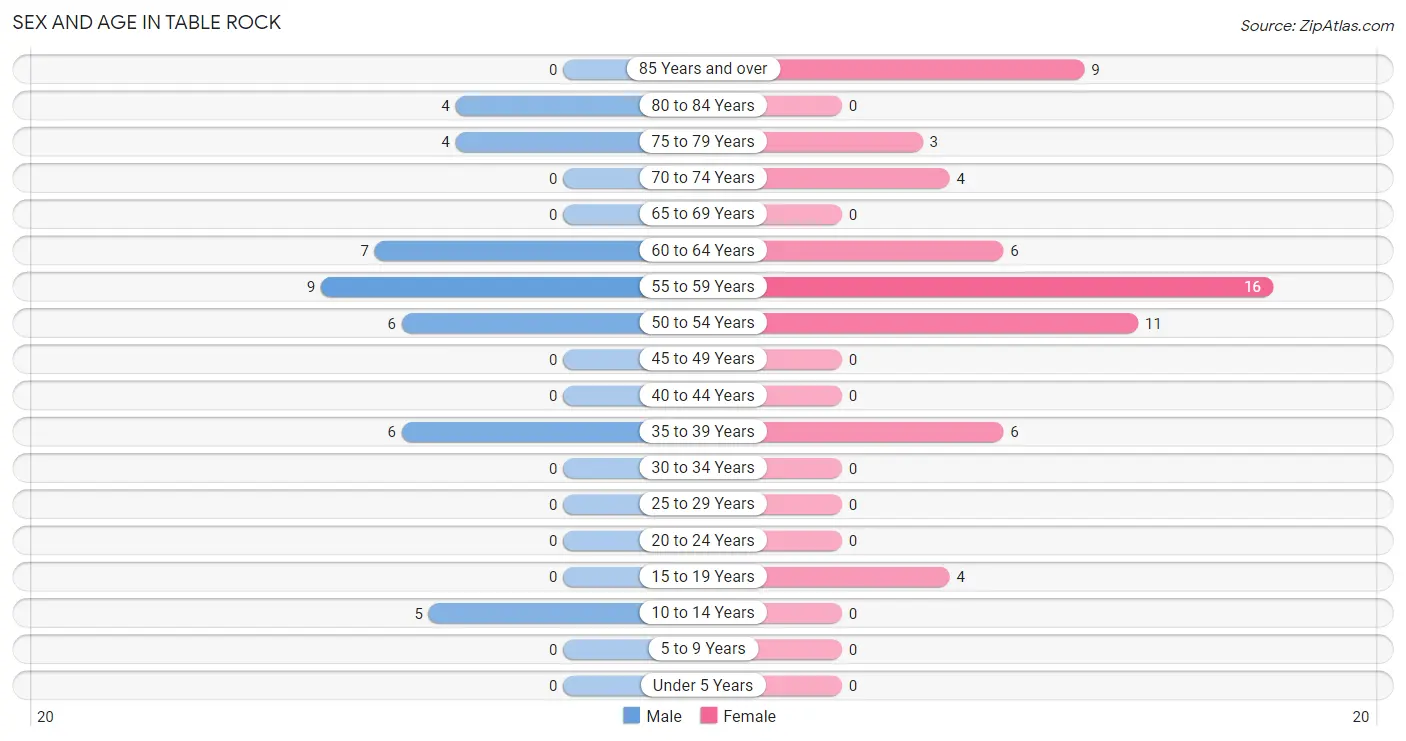
| Age Bracket | Male | Female |
| Under 5 Years | 0 (0.0%) | 0 (0.0%) |
| 5 to 9 Years | 0 (0.0%) | 0 (0.0%) |
| 10 to 14 Years | 5 (12.2%) | 0 (0.0%) |
| 15 to 19 Years | 0 (0.0%) | 4 (6.8%) |
| 20 to 24 Years | 0 (0.0%) | 0 (0.0%) |
| 25 to 29 Years | 0 (0.0%) | 0 (0.0%) |
| 30 to 34 Years | 0 (0.0%) | 0 (0.0%) |
| 35 to 39 Years | 6 (14.6%) | 6 (10.2%) |
| 40 to 44 Years | 0 (0.0%) | 0 (0.0%) |
| 45 to 49 Years | 0 (0.0%) | 0 (0.0%) |
| 50 to 54 Years | 6 (14.6%) | 11 (18.6%) |
| 55 to 59 Years | 9 (22.0%) | 16 (27.1%) |
| 60 to 64 Years | 7 (17.1%) | 6 (10.2%) |
| 65 to 69 Years | 0 (0.0%) | 0 (0.0%) |
| 70 to 74 Years | 0 (0.0%) | 4 (6.8%) |
| 75 to 79 Years | 4 (9.8%) | 3 (5.1%) |
| 80 to 84 Years | 4 (9.8%) | 0 (0.0%) |
| 85 Years and over | 0 (0.0%) | 9 (15.2%) |
| Total | 41 (100.0%) | 59 (100.0%) |
Families and Households in Table Rock
Median Family Size in Table Rock
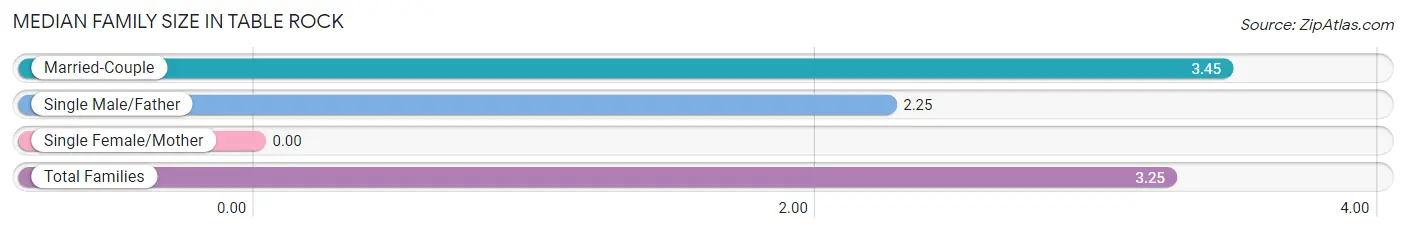
| Family Type | # Families | Family Size |
| Married-Couple | 20 (83.3%) | 3.45 |
| Single Male/Father | 4 (16.7%) | 2.25 |
| Single Female/Mother | 0 (0.0%) | - |
| Total Families | 24 (100.0%) | 3.25 |
Median Household Size in Table Rock
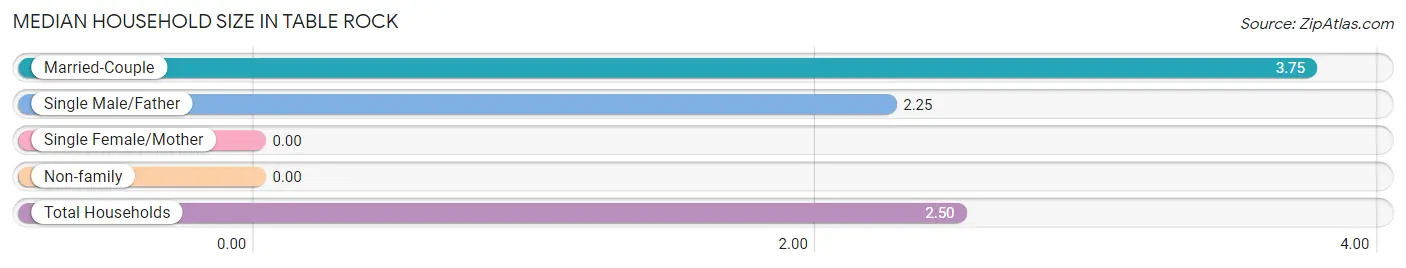
| Household Type | # Households | Household Size |
| Married-Couple | 20 (50.0%) | 3.75 |
| Single Male/Father | 4 (10.0%) | 2.25 |
| Single Female/Mother | 0 (0.0%) | - |
| Non-family | 16 (40.0%) | - |
| Total Households | 40 (100.0%) | 2.50 |
Household Size by Marriage Status in Table Rock
Out of a total of 40 households in Table Rock, 24 (60.0%) are family households, while 16 (40.0%) are nonfamily households. The most numerous type of family households are 2-person households, comprising 19, and the most common type of nonfamily households are 1-person households, comprising 16.
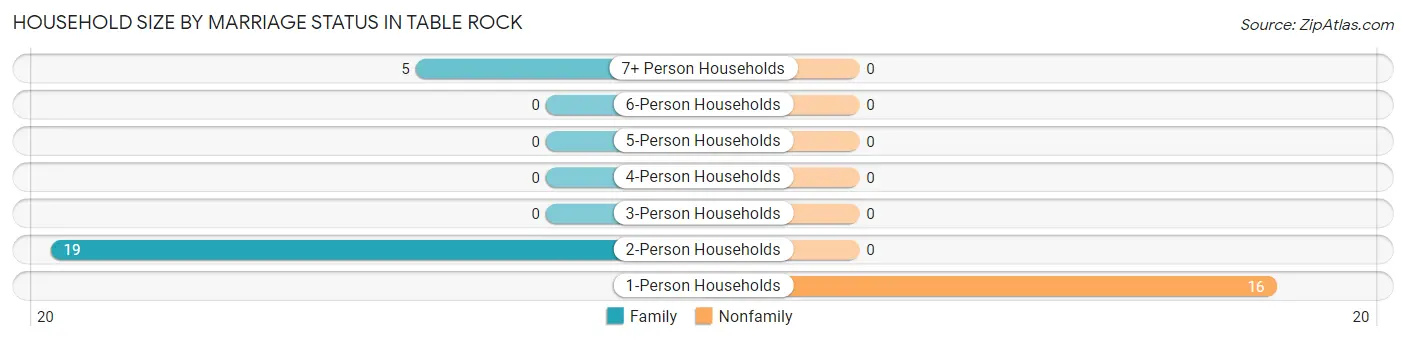
| Household Size | Family Households | Nonfamily Households |
| 1-Person Households | - | 16 (40.0%) |
| 2-Person Households | 19 (47.5%) | 0 (0.0%) |
| 3-Person Households | 0 (0.0%) | 0 (0.0%) |
| 4-Person Households | 0 (0.0%) | 0 (0.0%) |
| 5-Person Households | 0 (0.0%) | 0 (0.0%) |
| 6-Person Households | 0 (0.0%) | 0 (0.0%) |
| 7+ Person Households | 5 (12.5%) | 0 (0.0%) |
| Total | 24 (60.0%) | 16 (40.0%) |
Female Fertility in Table Rock
Fertility by Age in Table Rock
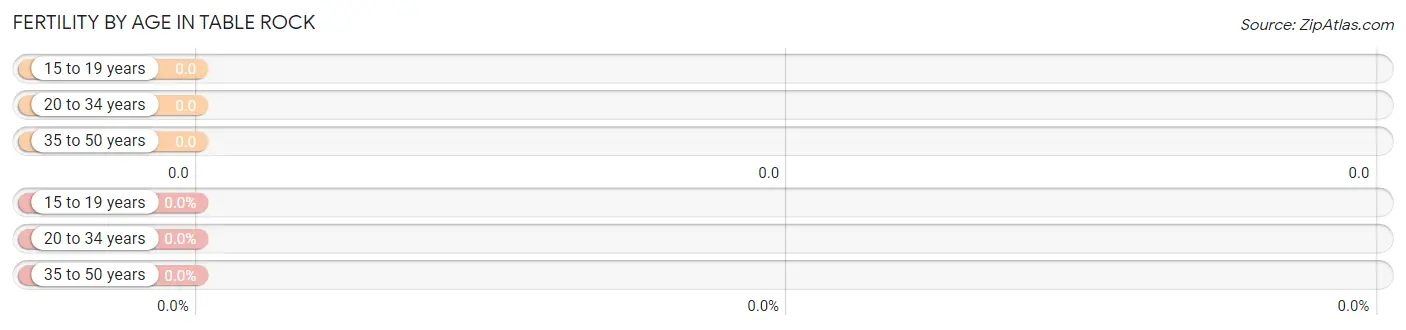
| Age Bracket | Women with Births | Births / 1,000 Women |
| 15 to 19 years | 0 (0.0%) | 0.0 |
| 20 to 34 years | 0 (0.0%) | 0.0 |
| 35 to 50 years | 0 (0.0%) | 0.0 |
| Total | 0 (0.0%) | 0.0 |
Fertility by Age by Marriage Status in Table Rock
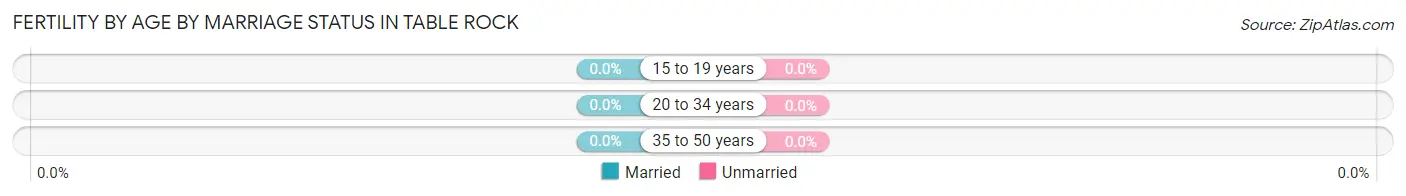
| Age Bracket | Married | Unmarried |
| 15 to 19 years | 0 (0.0%) | 0 (0.0%) |
| 20 to 34 years | 0 (0.0%) | 0 (0.0%) |
| 35 to 50 years | 0 (0.0%) | 0 (0.0%) |
| Total | 0 (0.0%) | 0 (0.0%) |
Fertility by Education in Table Rock
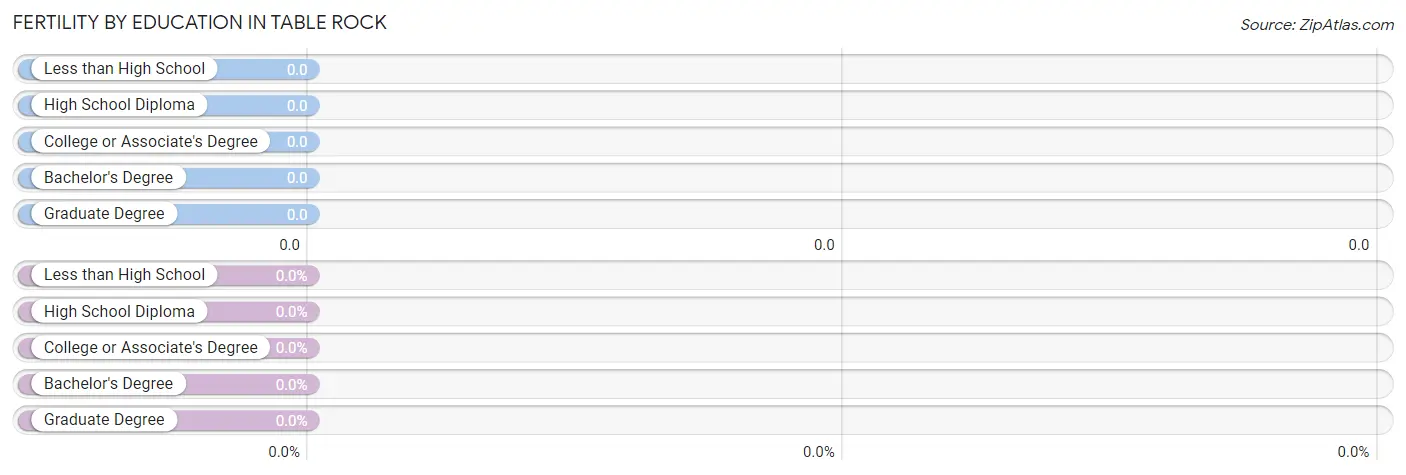
| Educational Attainment | Women with Births | Births / 1,000 Women |
| Less than High School | 0 (0.0%) | 0.0 |
| High School Diploma | 0 (0.0%) | 0.0 |
| College or Associate's Degree | 0 (0.0%) | 0.0 |
| Bachelor's Degree | 0 (0.0%) | 0.0 |
| Graduate Degree | 0 (0.0%) | 0.0 |
| Total | 0 (0.0%) | 0.0 |
Fertility by Education by Marriage Status in Table Rock
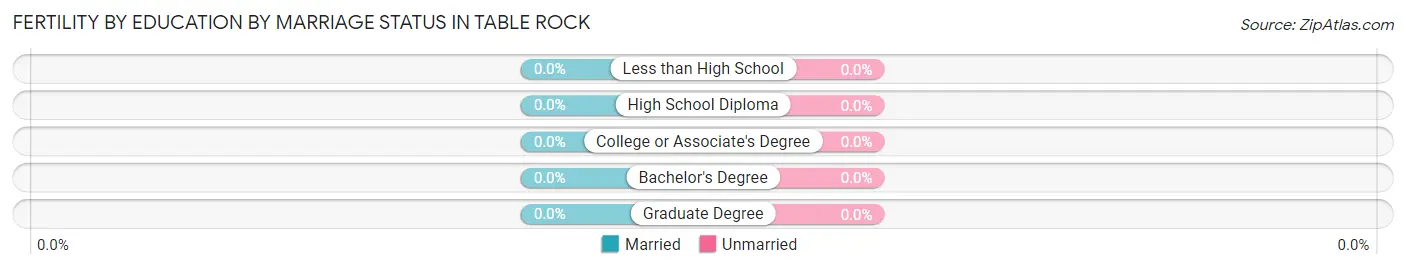
| Educational Attainment | Married | Unmarried |
| Less than High School | 0 (0.0%) | 0 (0.0%) |
| High School Diploma | 0 (0.0%) | 0 (0.0%) |
| College or Associate's Degree | 0 (0.0%) | 0 (0.0%) |
| Bachelor's Degree | 0 (0.0%) | 0 (0.0%) |
| Graduate Degree | 0 (0.0%) | 0 (0.0%) |
| Total | 0 (0.0%) | 0 (0.0%) |
Employment Characteristics in Table Rock
Employment by Class of Employer in Table Rock
Among the 49 employed individuals in Table Rock, private company employees (32 | 65.3%), self-employed (not incorporated) (6 | 12.2%), and not-for-profit organizations (6 | 12.2%) make up the most common classes of employment.
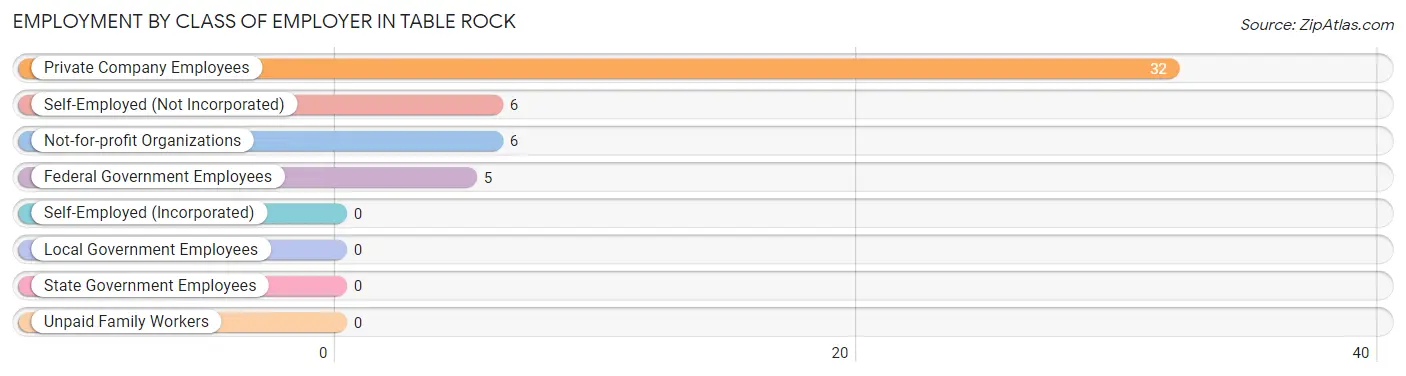
| Employer Class | # Employees | % Employees |
| Private Company Employees | 32 | 65.3% |
| Self-Employed (Incorporated) | 0 | 0.0% |
| Self-Employed (Not Incorporated) | 6 | 12.2% |
| Not-for-profit Organizations | 6 | 12.2% |
| Local Government Employees | 0 | 0.0% |
| State Government Employees | 0 | 0.0% |
| Federal Government Employees | 5 | 10.2% |
| Unpaid Family Workers | 0 | 0.0% |
| Total | 49 | 100.0% |
Employment Status by Age in Table Rock
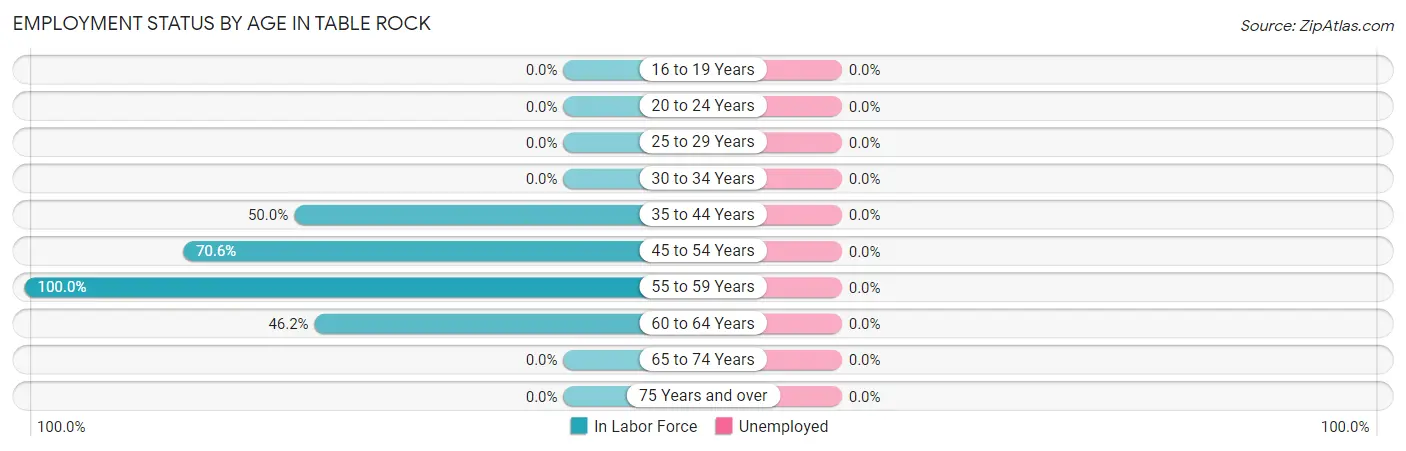
| Age Bracket | In Labor Force | Unemployed |
| 16 to 19 Years | 0 (0.0%) | 0 (0.0%) |
| 20 to 24 Years | 0 (0.0%) | 0 (0.0%) |
| 25 to 29 Years | 0 (0.0%) | 0 (0.0%) |
| 30 to 34 Years | 0 (0.0%) | 0 (0.0%) |
| 35 to 44 Years | 6 (50.0%) | 0 (0.0%) |
| 45 to 54 Years | 12 (70.6%) | 0 (0.0%) |
| 55 to 59 Years | 25 (100.0%) | 0 (0.0%) |
| 60 to 64 Years | 6 (46.2%) | 0 (0.0%) |
| 65 to 74 Years | 0 (0.0%) | 0 (0.0%) |
| 75 Years and over | 0 (0.0%) | 0 (0.0%) |
| Total | 49 (51.6%) | 0 (0.0%) |
Employment Status by Educational Attainment in Table Rock
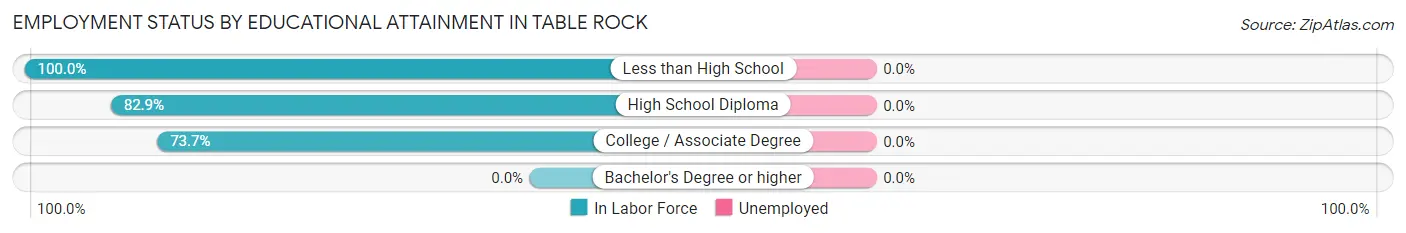
| Educational Attainment | In Labor Force | Unemployed |
| Less than High School | 6 (100.0%) | 0 (0.0%) |
| High School Diploma | 29 (82.9%) | 0 (0.0%) |
| College / Associate Degree | 14 (73.7%) | 0 (0.0%) |
| Bachelor's Degree or higher | 0 (0.0%) | 0 (0.0%) |
| Total | 49 (73.1%) | 0 (0.0%) |
Employment Occupations by Sex in Table Rock
Management, Business, Science and Arts Occupations
The most common Management, Business, Science and Arts occupations in Table Rock are Management (6 | 12.2%), Community & Social Service (6 | 12.2%), and Education Instruction & Library (6 | 12.2%).
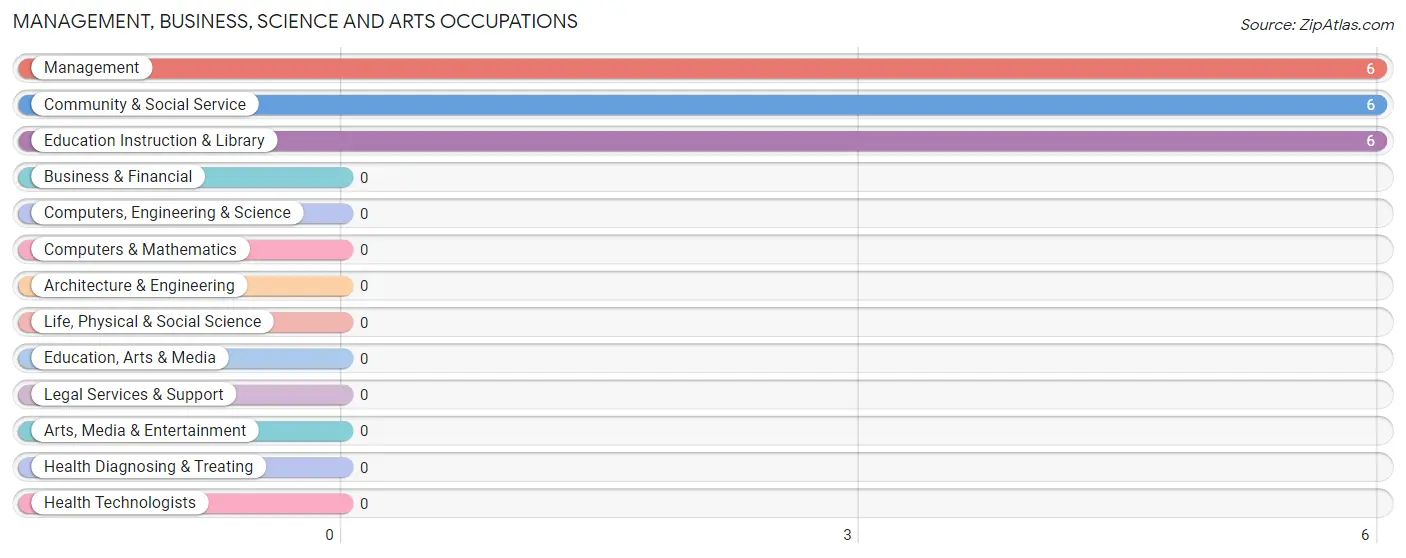
Management, Business, Science and Arts Occupations by Sex
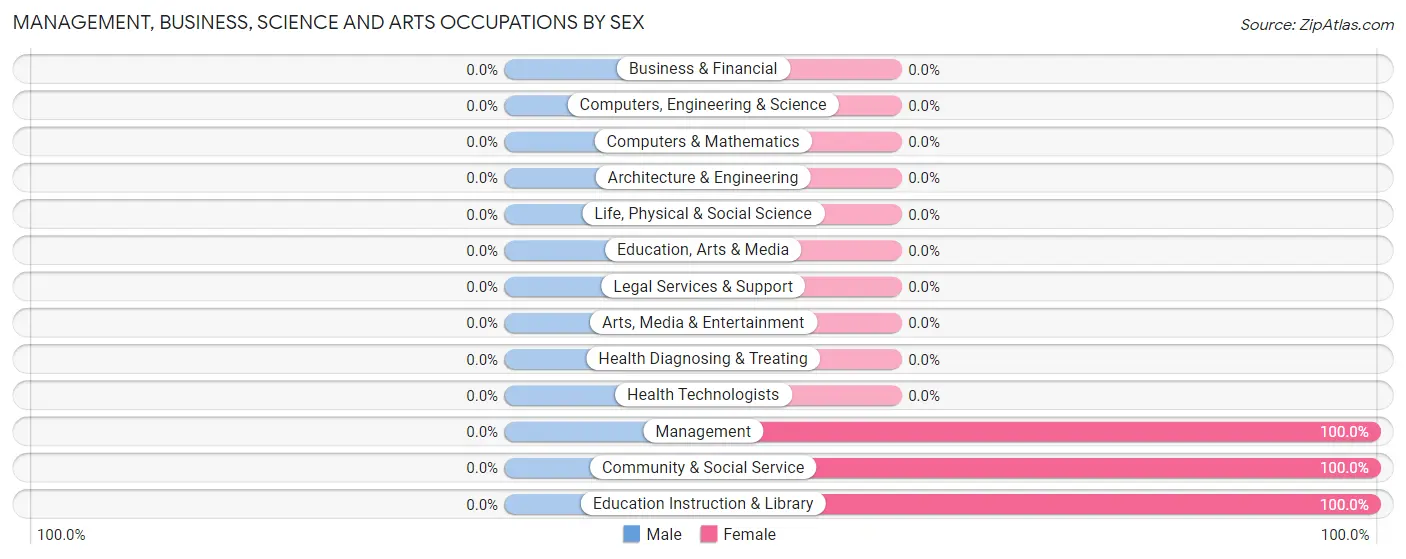
| Occupation | Male | Female |
| Management | 0 (0.0%) | 6 (100.0%) |
| Business & Financial | 0 (0.0%) | 0 (0.0%) |
| Computers, Engineering & Science | 0 (0.0%) | 0 (0.0%) |
| Computers & Mathematics | 0 (0.0%) | 0 (0.0%) |
| Architecture & Engineering | 0 (0.0%) | 0 (0.0%) |
| Life, Physical & Social Science | 0 (0.0%) | 0 (0.0%) |
| Community & Social Service | 0 (0.0%) | 6 (100.0%) |
| Education, Arts & Media | 0 (0.0%) | 0 (0.0%) |
| Legal Services & Support | 0 (0.0%) | 0 (0.0%) |
| Education Instruction & Library | 0 (0.0%) | 6 (100.0%) |
| Arts, Media & Entertainment | 0 (0.0%) | 0 (0.0%) |
| Health Diagnosing & Treating | 0 (0.0%) | 0 (0.0%) |
| Health Technologists | 0 (0.0%) | 0 (0.0%) |
| Total (Category) | 0 (0.0%) | 12 (100.0%) |
| Total (Overall) | 21 (42.9%) | 28 (57.1%) |
Services Occupations
The most common Services occupations in Table Rock are , and Food Preparation & Serving (5 | 10.2%).
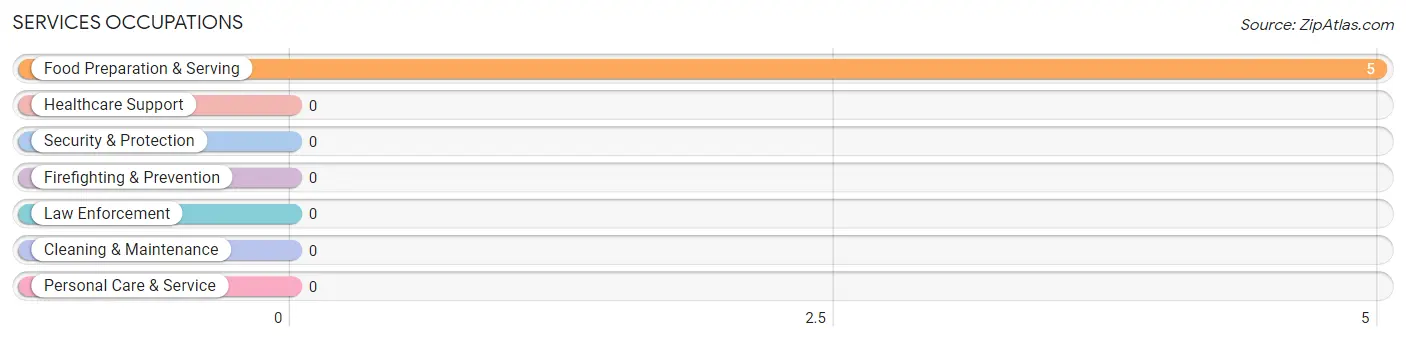
Services Occupations by Sex
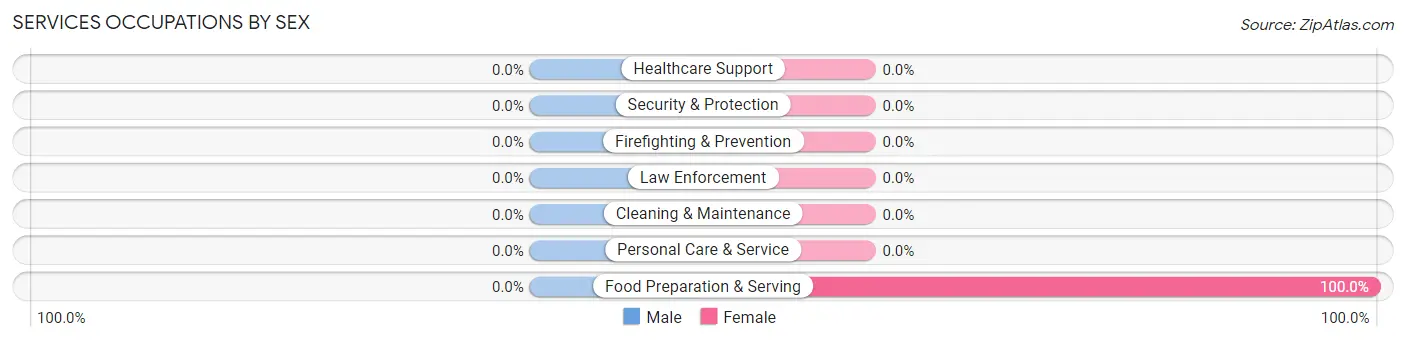
| Occupation | Male | Female |
| Healthcare Support | 0 (0.0%) | 0 (0.0%) |
| Security & Protection | 0 (0.0%) | 0 (0.0%) |
| Firefighting & Prevention | 0 (0.0%) | 0 (0.0%) |
| Law Enforcement | 0 (0.0%) | 0 (0.0%) |
| Food Preparation & Serving | 0 (0.0%) | 5 (100.0%) |
| Cleaning & Maintenance | 0 (0.0%) | 0 (0.0%) |
| Personal Care & Service | 0 (0.0%) | 0 (0.0%) |
| Total (Category) | 0 (0.0%) | 5 (100.0%) |
| Total (Overall) | 21 (42.9%) | 28 (57.1%) |
Sales and Office Occupations
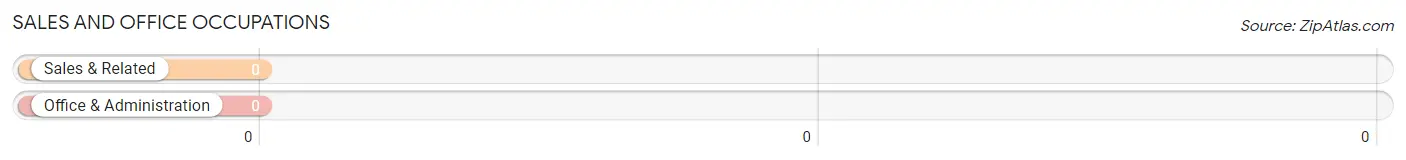
Sales and Office Occupations by Sex
| Occupation | Male | Female |
| Sales & Related | 0 (0.0%) | 0 (0.0%) |
| Office & Administration | 0 (0.0%) | 0 (0.0%) |
| Total (Category) | 0 (0.0%) | 0 (0.0%) |
| Total (Overall) | 21 (42.9%) | 28 (57.1%) |
Natural Resources, Construction and Maintenance Occupations
The most common Natural Resources, Construction and Maintenance occupations in Table Rock are Construction & Extraction (15 | 30.6%), and Installation, Maintenance & Repair (5 | 10.2%).
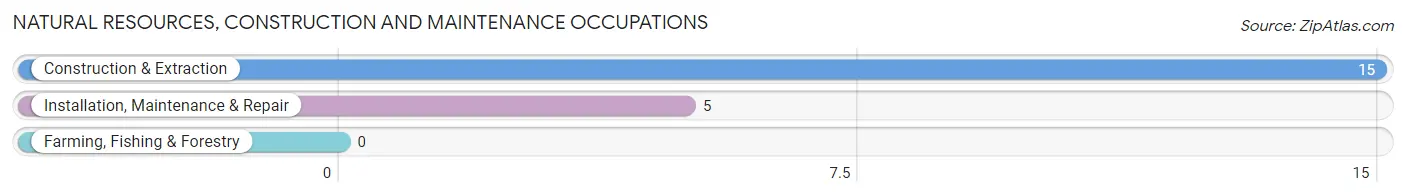
Natural Resources, Construction and Maintenance Occupations by Sex
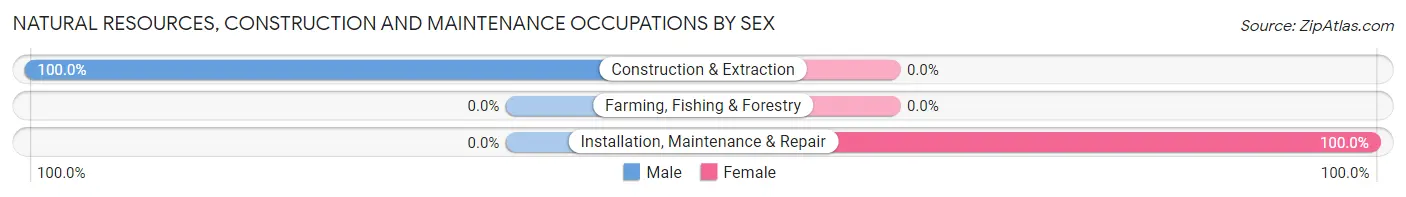
| Occupation | Male | Female |
| Farming, Fishing & Forestry | 0 (0.0%) | 0 (0.0%) |
| Construction & Extraction | 15 (100.0%) | 0 (0.0%) |
| Installation, Maintenance & Repair | 0 (0.0%) | 5 (100.0%) |
| Total (Category) | 15 (75.0%) | 5 (25.0%) |
| Total (Overall) | 21 (42.9%) | 28 (57.1%) |
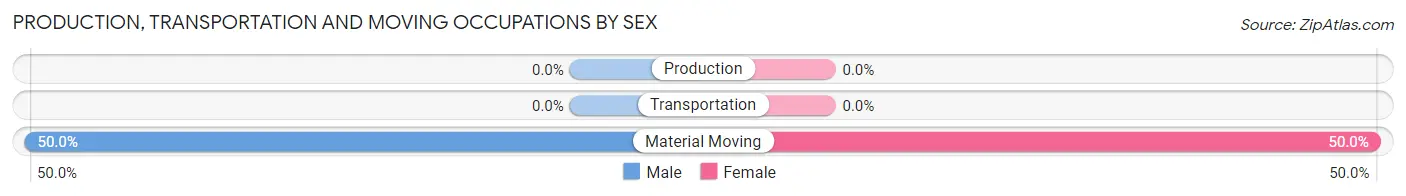
Production, Transportation and Moving Occupations
The most common Production, Transportation and Moving occupations in Table Rock are , and Material Moving (12 | 24.5%).
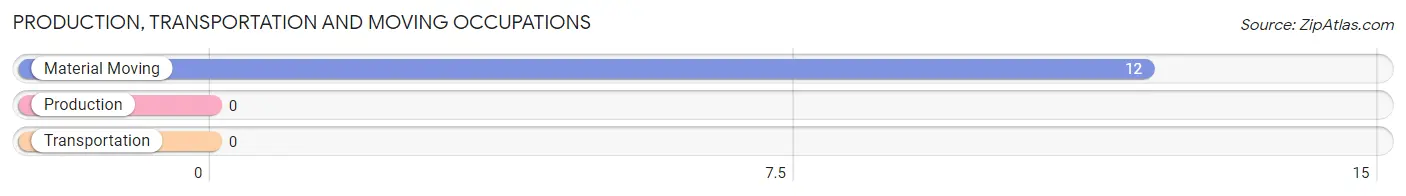
Production, Transportation and Moving Occupations by Sex
| Occupation | Male | Female |
| Production | 0 (0.0%) | 0 (0.0%) |
| Transportation | 0 (0.0%) | 0 (0.0%) |
| Material Moving | 6 (50.0%) | 6 (50.0%) |
| Total (Category) | 6 (50.0%) | 6 (50.0%) |
| Total (Overall) | 21 (42.9%) | 28 (57.1%) |
Employment Industries by Sex in Table Rock
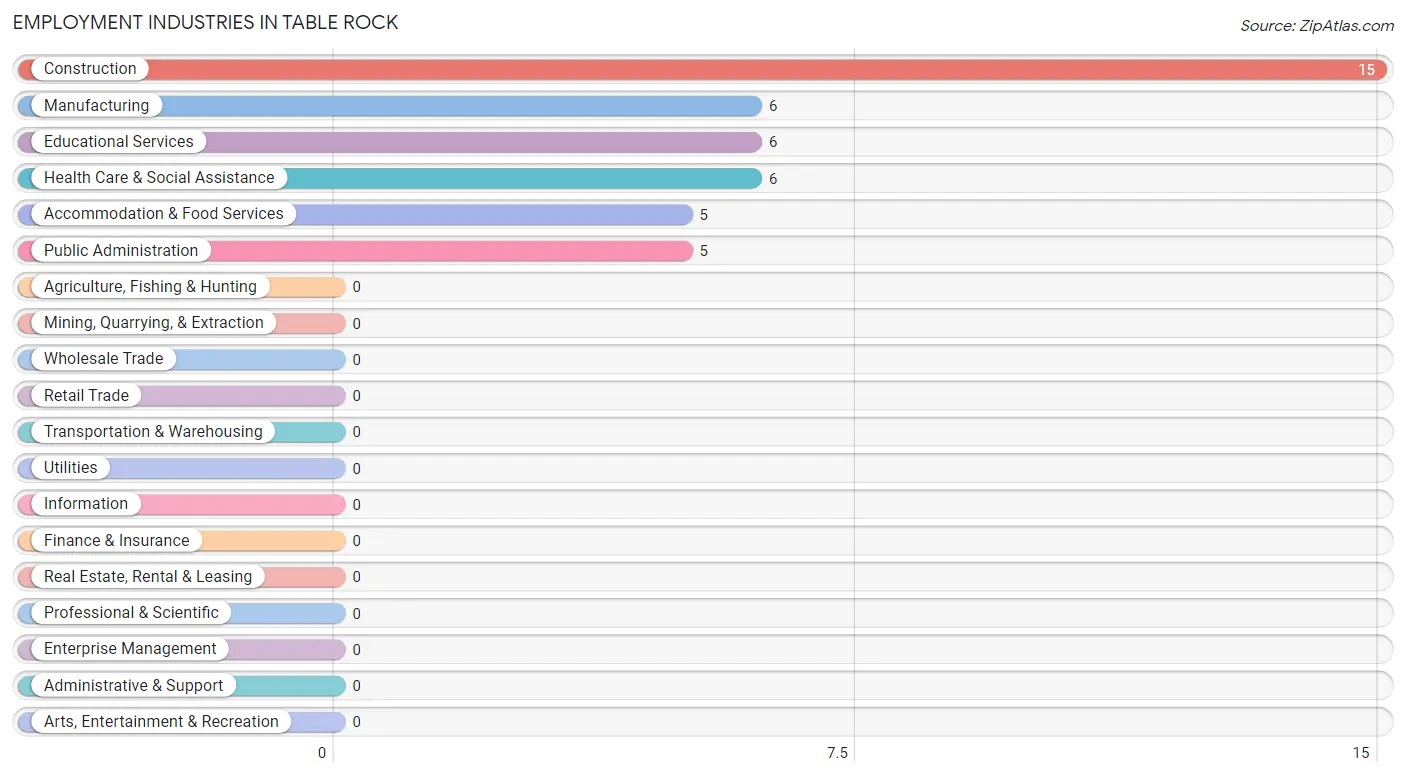
Employment Industries in Table Rock
The major employment industries in Table Rock include Construction (15 | 30.6%), Manufacturing (6 | 12.2%), Educational Services (6 | 12.2%), Health Care & Social Assistance (6 | 12.2%), and Accommodation & Food Services (5 | 10.2%).
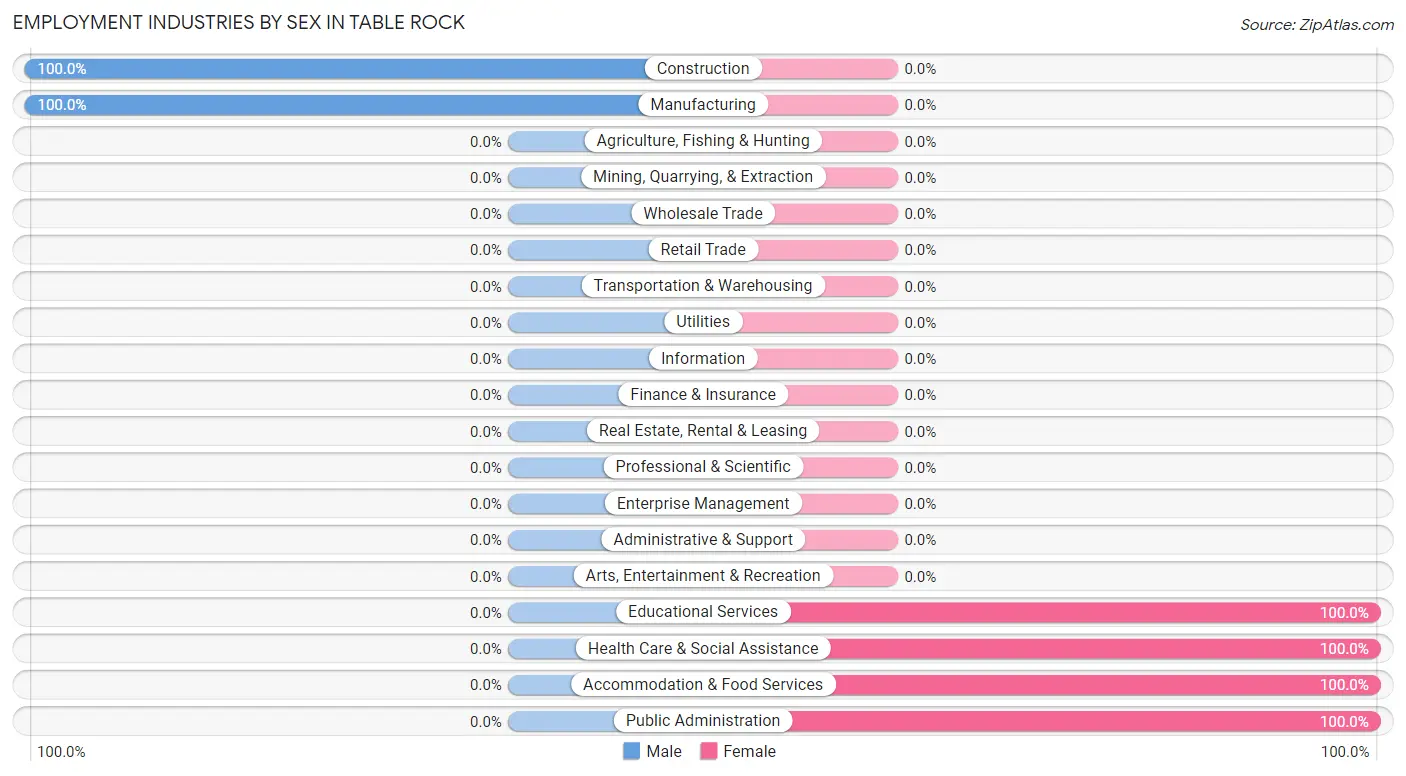
Employment Industries by Sex in Table Rock
The Table Rock industries that see more men than women are Construction (100.0%), and Manufacturing (100.0%), whereas the industries that tend to have a higher number of women are Educational Services (100.0%), Health Care & Social Assistance (100.0%), and Accommodation & Food Services (100.0%).
| Industry | Male | Female |
| Agriculture, Fishing & Hunting | 0 (0.0%) | 0 (0.0%) |
| Mining, Quarrying, & Extraction | 0 (0.0%) | 0 (0.0%) |
| Construction | 15 (100.0%) | 0 (0.0%) |
| Manufacturing | 6 (100.0%) | 0 (0.0%) |
| Wholesale Trade | 0 (0.0%) | 0 (0.0%) |
| Retail Trade | 0 (0.0%) | 0 (0.0%) |
| Transportation & Warehousing | 0 (0.0%) | 0 (0.0%) |
| Utilities | 0 (0.0%) | 0 (0.0%) |
| Information | 0 (0.0%) | 0 (0.0%) |
| Finance & Insurance | 0 (0.0%) | 0 (0.0%) |
| Real Estate, Rental & Leasing | 0 (0.0%) | 0 (0.0%) |
| Professional & Scientific | 0 (0.0%) | 0 (0.0%) |
| Enterprise Management | 0 (0.0%) | 0 (0.0%) |
| Administrative & Support | 0 (0.0%) | 0 (0.0%) |
| Educational Services | 0 (0.0%) | 6 (100.0%) |
| Health Care & Social Assistance | 0 (0.0%) | 6 (100.0%) |
| Arts, Entertainment & Recreation | 0 (0.0%) | 0 (0.0%) |
| Accommodation & Food Services | 0 (0.0%) | 5 (100.0%) |
| Public Administration | 0 (0.0%) | 5 (100.0%) |
| Total | 21 (42.9%) | 28 (57.1%) |
Education in Table Rock
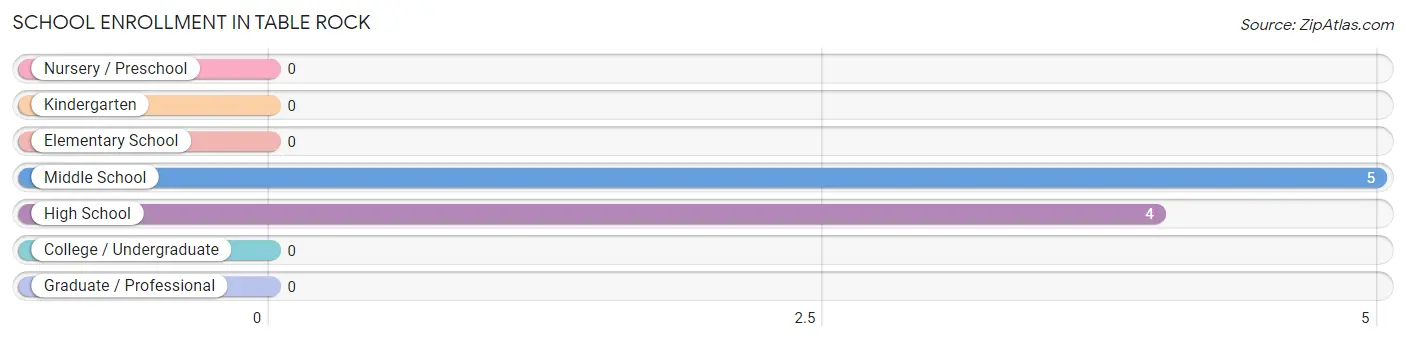
School Enrollment in Table Rock
The most common levels of schooling among the 9 students in Table Rock are middle school (5 | 55.6%), and high school (4 | 44.4%).
| School Level | # Students | % Students |
| Nursery / Preschool | 0 | 0.0% |
| Kindergarten | 0 | 0.0% |
| Elementary School | 0 | 0.0% |
| Middle School | 5 | 55.6% |
| High School | 4 | 44.4% |
| College / Undergraduate | 0 | 0.0% |
| Graduate / Professional | 0 | 0.0% |
| Total | 9 | 100.0% |
School Enrollment by Age by Funding Source in Table Rock
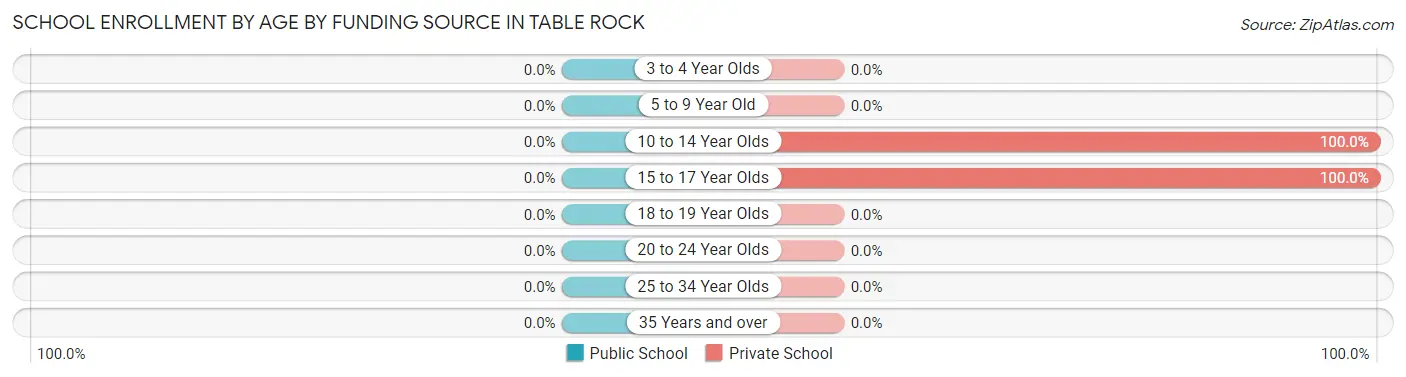
| Age Bracket | Public School | Private School |
| 3 to 4 Year Olds | 0 (0.0%) | 0 (0.0%) |
| 5 to 9 Year Old | 0 (0.0%) | 0 (0.0%) |
| 10 to 14 Year Olds | 0 (0.0%) | 5 (100.0%) |
| 15 to 17 Year Olds | 0 (0.0%) | 4 (100.0%) |
| 18 to 19 Year Olds | 0 (0.0%) | 0 (0.0%) |
| 20 to 24 Year Olds | 0 (0.0%) | 0 (0.0%) |
| 25 to 34 Year Olds | 0 (0.0%) | 0 (0.0%) |
| 35 Years and over | 0 (0.0%) | 0 (0.0%) |
| Total | 0 (0.0%) | 9 (100.0%) |
Educational Attainment by Field of Study in Table Rock
, and engineering (7 | 100.0%) are the most common fields of study among 7 individuals in Table Rock who have obtained a bachelor's degree or higher.
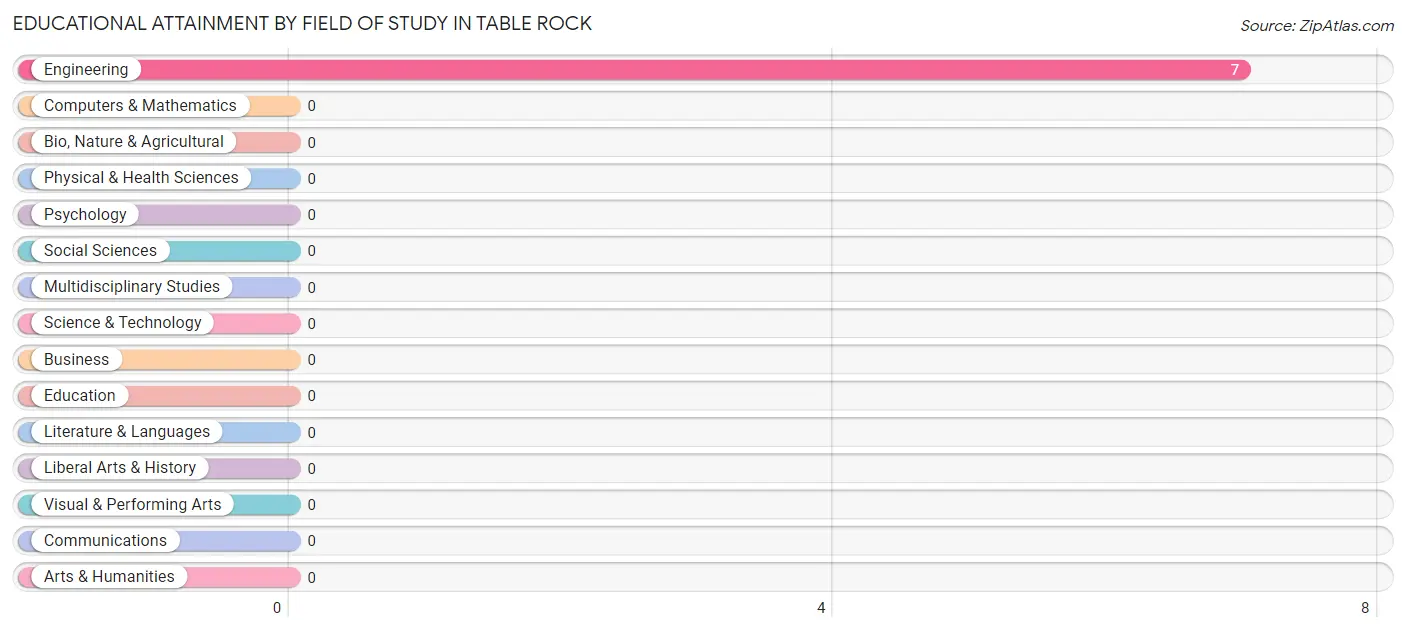
| Field of Study | # Graduates | % Graduates |
| Computers & Mathematics | 0 | 0.0% |
| Bio, Nature & Agricultural | 0 | 0.0% |
| Physical & Health Sciences | 0 | 0.0% |
| Psychology | 0 | 0.0% |
| Social Sciences | 0 | 0.0% |
| Engineering | 7 | 100.0% |
| Multidisciplinary Studies | 0 | 0.0% |
| Science & Technology | 0 | 0.0% |
| Business | 0 | 0.0% |
| Education | 0 | 0.0% |
| Literature & Languages | 0 | 0.0% |
| Liberal Arts & History | 0 | 0.0% |
| Visual & Performing Arts | 0 | 0.0% |
| Communications | 0 | 0.0% |
| Arts & Humanities | 0 | 0.0% |
| Total | 7 | 100.0% |
Transportation & Commute in Table Rock
Vehicle Availability by Sex in Table Rock
The most prevalent vehicle ownership categories in Table Rock are males with 2 vehicles (9, accounting for 42.9%) and females with 2 vehicles (17, making up 32.1%).
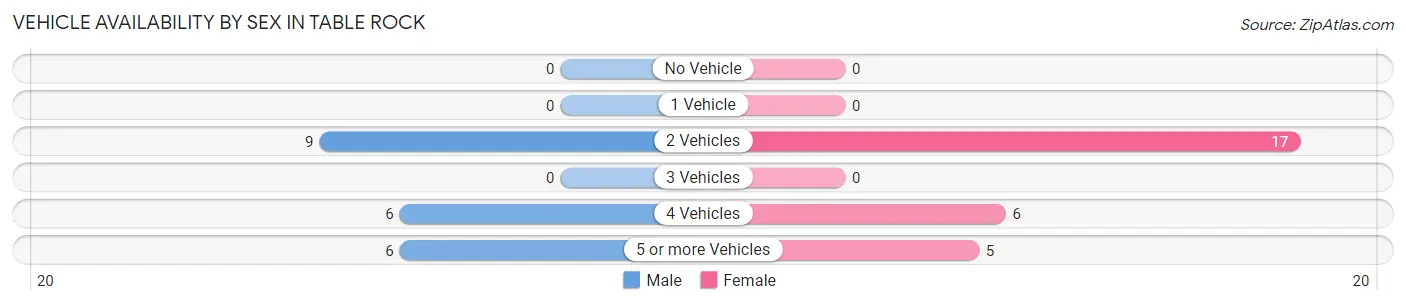
| Vehicles Available | Male | Female |
| No Vehicle | 0 (0.0%) | 0 (0.0%) |
| 1 Vehicle | 0 (0.0%) | 0 (0.0%) |
| 2 Vehicles | 9 (42.9%) | 17 (60.7%) |
| 3 Vehicles | 0 (0.0%) | 0 (0.0%) |
| 4 Vehicles | 6 (28.6%) | 6 (21.4%) |
| 5 or more Vehicles | 6 (28.6%) | 5 (17.9%) |
| Total | 21 (100.0%) | 28 (100.0%) |
Commute Time in Table Rock
The most frequently occuring commute durations in Table Rock are 10 to 14 minutes (18 commuters, 41.9%), 60 to 89 minutes (9 commuters, 20.9%), and 30 to 34 minutes (6 commuters, 14.0%).
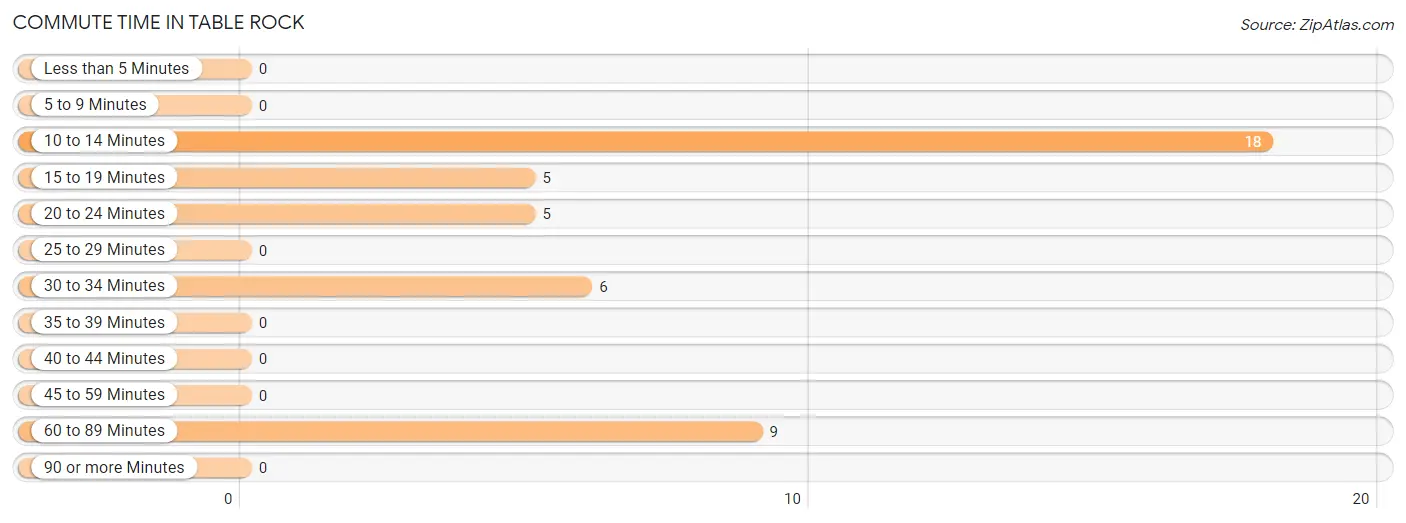
| Commute Time | # Commuters | % Commuters |
| Less than 5 Minutes | 0 | 0.0% |
| 5 to 9 Minutes | 0 | 0.0% |
| 10 to 14 Minutes | 18 | 41.9% |
| 15 to 19 Minutes | 5 | 11.6% |
| 20 to 24 Minutes | 5 | 11.6% |
| 25 to 29 Minutes | 0 | 0.0% |
| 30 to 34 Minutes | 6 | 14.0% |
| 35 to 39 Minutes | 0 | 0.0% |
| 40 to 44 Minutes | 0 | 0.0% |
| 45 to 59 Minutes | 0 | 0.0% |
| 60 to 89 Minutes | 9 | 20.9% |
| 90 or more Minutes | 0 | 0.0% |
Commute Time by Sex in Table Rock
The most common commute times in Table Rock are 60 to 89 minutes (9 commuters, 42.9%) for males and 10 to 14 minutes (12 commuters, 54.5%) for females.
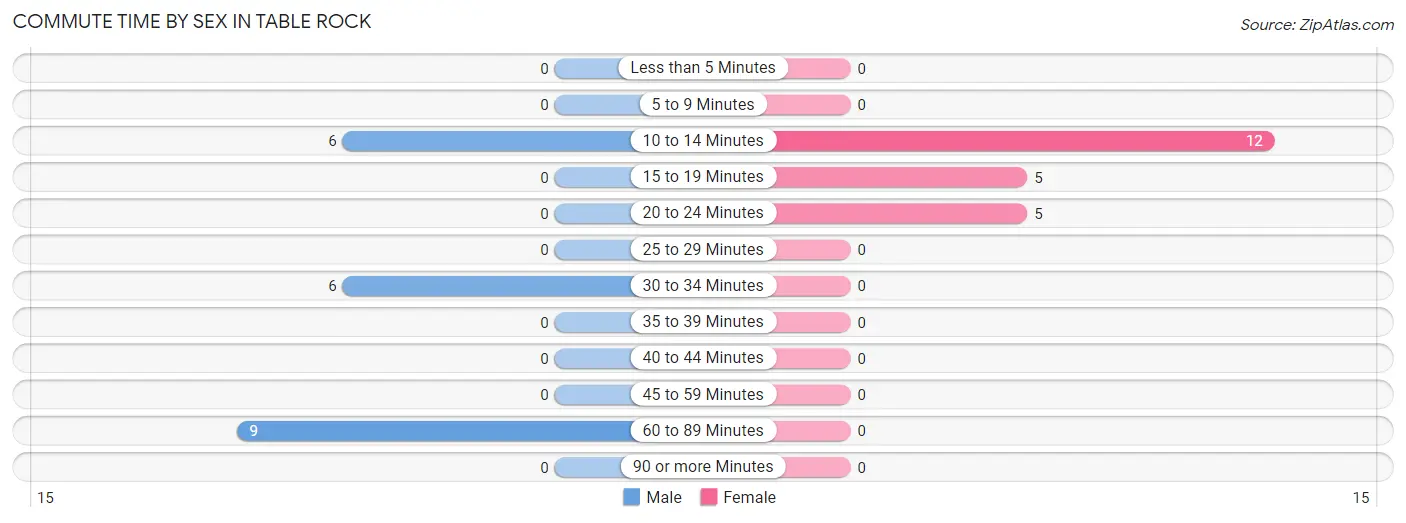
| Commute Time | Male | Female |
| Less than 5 Minutes | 0 (0.0%) | 0 (0.0%) |
| 5 to 9 Minutes | 0 (0.0%) | 0 (0.0%) |
| 10 to 14 Minutes | 6 (28.6%) | 12 (54.5%) |
| 15 to 19 Minutes | 0 (0.0%) | 5 (22.7%) |
| 20 to 24 Minutes | 0 (0.0%) | 5 (22.7%) |
| 25 to 29 Minutes | 0 (0.0%) | 0 (0.0%) |
| 30 to 34 Minutes | 6 (28.6%) | 0 (0.0%) |
| 35 to 39 Minutes | 0 (0.0%) | 0 (0.0%) |
| 40 to 44 Minutes | 0 (0.0%) | 0 (0.0%) |
| 45 to 59 Minutes | 0 (0.0%) | 0 (0.0%) |
| 60 to 89 Minutes | 9 (42.9%) | 0 (0.0%) |
| 90 or more Minutes | 0 (0.0%) | 0 (0.0%) |
Time of Departure to Work by Sex in Table Rock
The most frequent times of departure to work in Table Rock are 5:00 AM to 5:29 AM (9, 42.9%) for males and 7:30 AM to 7:59 AM (6, 27.3%) for females.
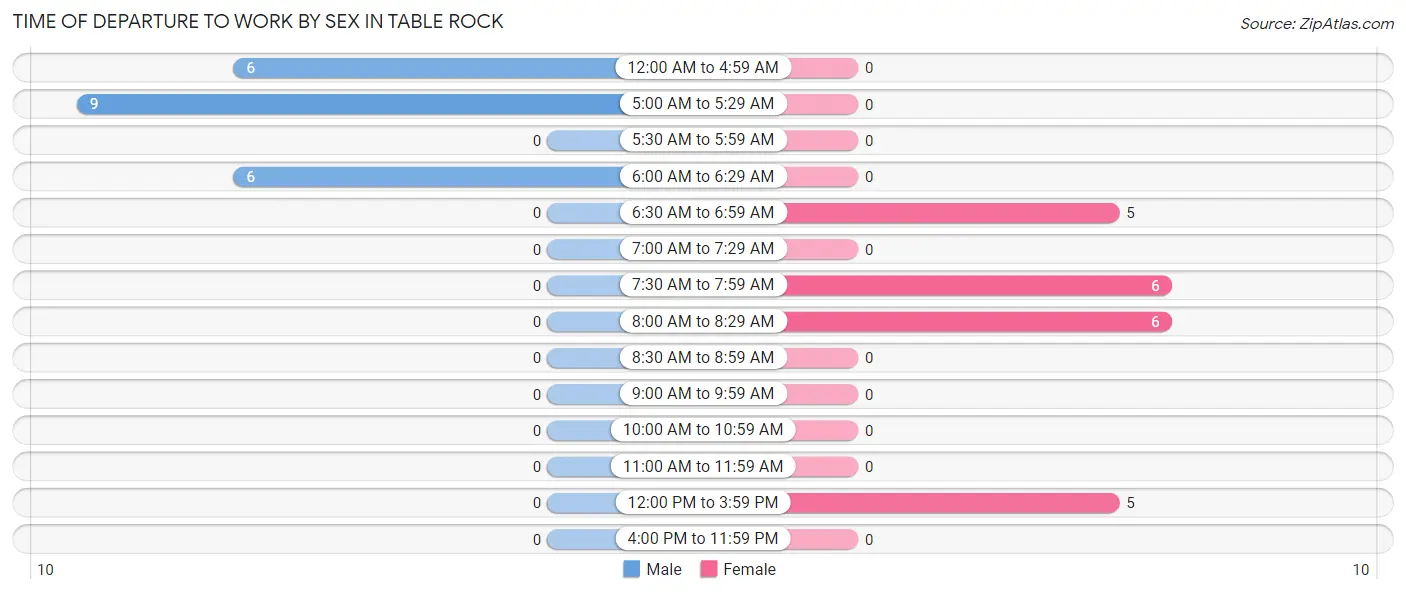
| Time of Departure | Male | Female |
| 12:00 AM to 4:59 AM | 6 (28.6%) | 0 (0.0%) |
| 5:00 AM to 5:29 AM | 9 (42.9%) | 0 (0.0%) |
| 5:30 AM to 5:59 AM | 0 (0.0%) | 0 (0.0%) |
| 6:00 AM to 6:29 AM | 6 (28.6%) | 0 (0.0%) |
| 6:30 AM to 6:59 AM | 0 (0.0%) | 5 (22.7%) |
| 7:00 AM to 7:29 AM | 0 (0.0%) | 0 (0.0%) |
| 7:30 AM to 7:59 AM | 0 (0.0%) | 6 (27.3%) |
| 8:00 AM to 8:29 AM | 0 (0.0%) | 6 (27.3%) |
| 8:30 AM to 8:59 AM | 0 (0.0%) | 0 (0.0%) |
| 9:00 AM to 9:59 AM | 0 (0.0%) | 0 (0.0%) |
| 10:00 AM to 10:59 AM | 0 (0.0%) | 0 (0.0%) |
| 11:00 AM to 11:59 AM | 0 (0.0%) | 0 (0.0%) |
| 12:00 PM to 3:59 PM | 0 (0.0%) | 5 (22.7%) |
| 4:00 PM to 11:59 PM | 0 (0.0%) | 0 (0.0%) |
| Total | 21 (100.0%) | 22 (100.0%) |
Housing Occupancy in Table Rock
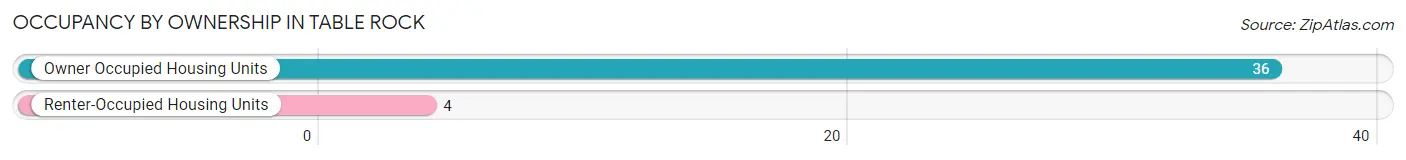
Occupancy by Ownership in Table Rock
Of the total 40 dwellings in Table Rock, owner-occupied units account for 36 (90.0%), while renter-occupied units make up 4 (10.0%).
| Occupancy | # Housing Units | % Housing Units |
| Owner Occupied Housing Units | 36 | 90.0% |
| Renter-Occupied Housing Units | 4 | 10.0% |
| Total Occupied Housing Units | 40 | 100.0% |
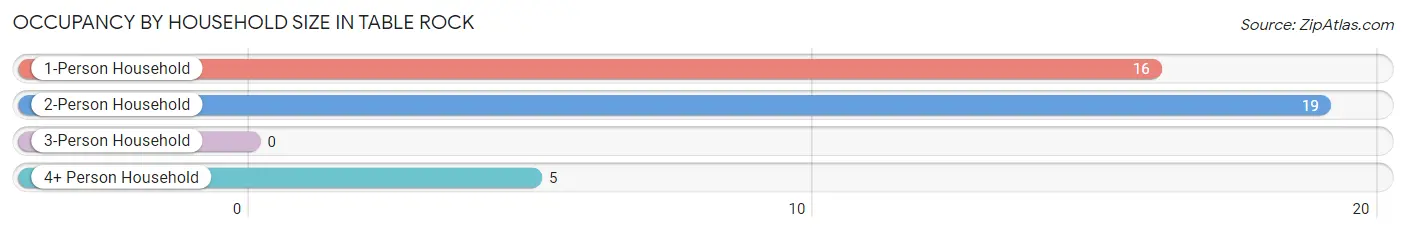
Occupancy by Household Size in Table Rock
| Household Size | # Housing Units | % Housing Units |
| 1-Person Household | 16 | 40.0% |
| 2-Person Household | 19 | 47.5% |
| 3-Person Household | 0 | 0.0% |
| 4+ Person Household | 5 | 12.5% |
| Total Housing Units | 40 | 100.0% |
Occupancy by Ownership by Household Size in Table Rock
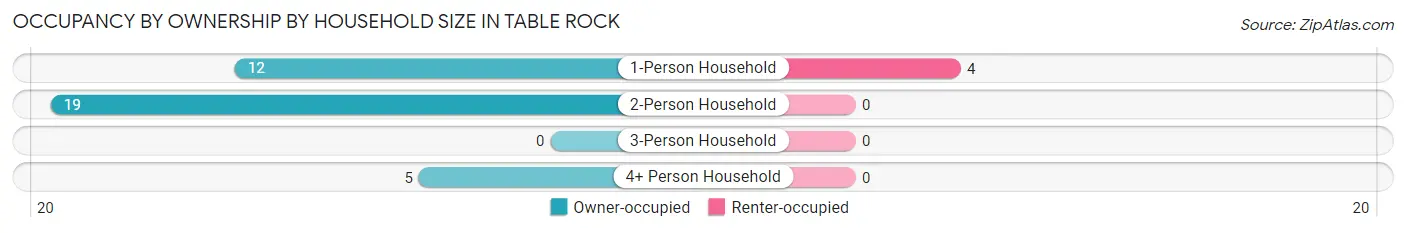
| Household Size | Owner-occupied | Renter-occupied |
| 1-Person Household | 12 (75.0%) | 4 (25.0%) |
| 2-Person Household | 19 (100.0%) | 0 (0.0%) |
| 3-Person Household | 0 (0.0%) | 0 (0.0%) |
| 4+ Person Household | 5 (100.0%) | 0 (0.0%) |
| Total Housing Units | 36 (90.0%) | 4 (10.0%) |
Occupancy by Educational Attainment in Table Rock
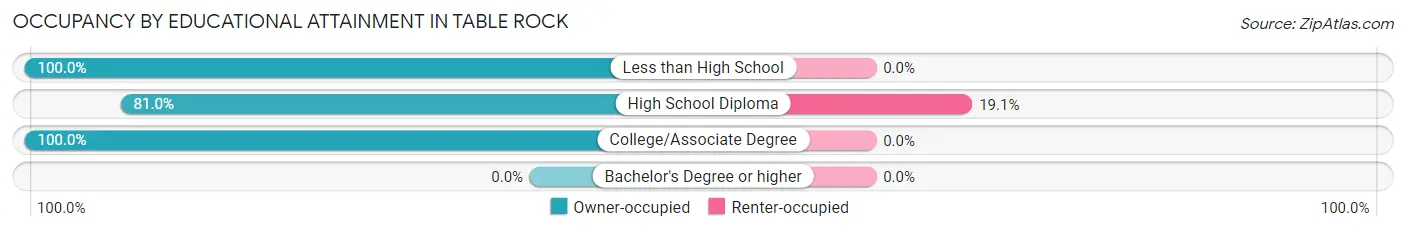
| Household Size | Owner-occupied | Renter-occupied |
| Less than High School | 14 (100.0%) | 0 (0.0%) |
| High School Diploma | 17 (80.9%) | 4 (19.1%) |
| College/Associate Degree | 5 (100.0%) | 0 (0.0%) |
| Bachelor's Degree or higher | 0 (0.0%) | 0 (0.0%) |
Occupancy by Age of Householder in Table Rock
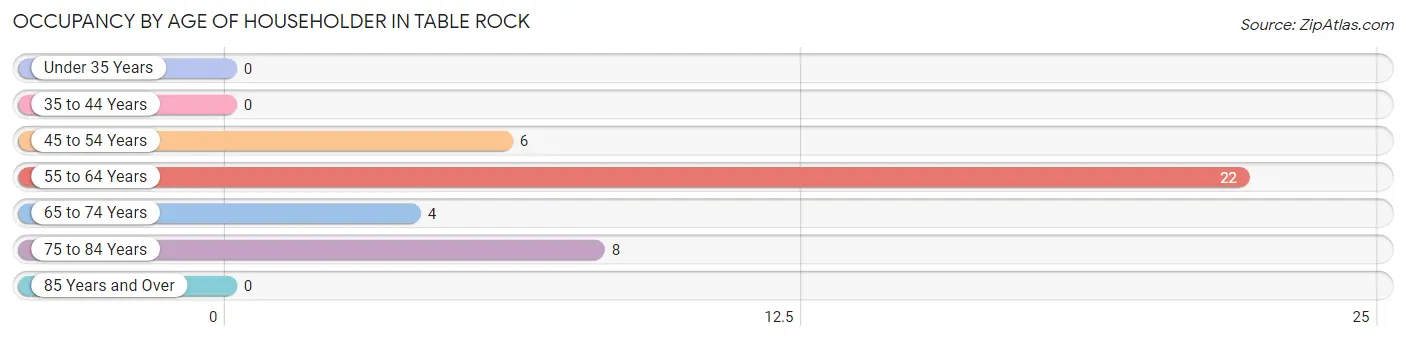
| Age Bracket | # Households | % Households |
| Under 35 Years | 0 | 0.0% |
| 35 to 44 Years | 0 | 0.0% |
| 45 to 54 Years | 6 | 15.0% |
| 55 to 64 Years | 22 | 55.0% |
| 65 to 74 Years | 4 | 10.0% |
| 75 to 84 Years | 8 | 20.0% |
| 85 Years and Over | 0 | 0.0% |
| Total | 40 | 100.0% |
Housing Finances in Table Rock
Median Income by Occupancy in Table Rock
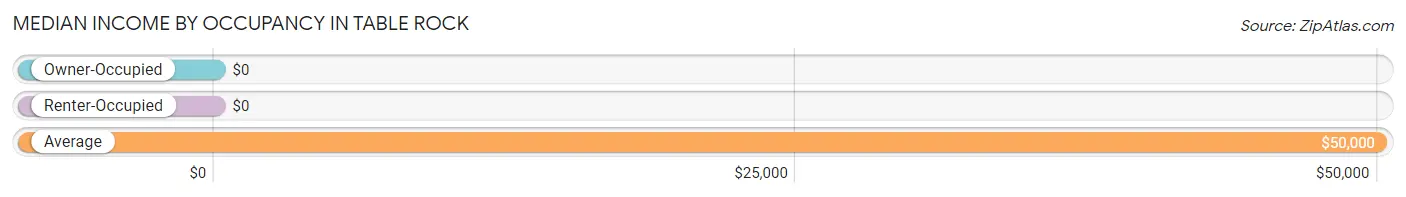
| Occupancy Type | # Households | Median Income |
| Owner-Occupied | 36 (90.0%) | $0 |
| Renter-Occupied | 4 (10.0%) | $0 |
| Average | 40 (100.0%) | $50,000 |
Occupancy by Householder Income Bracket in Table Rock
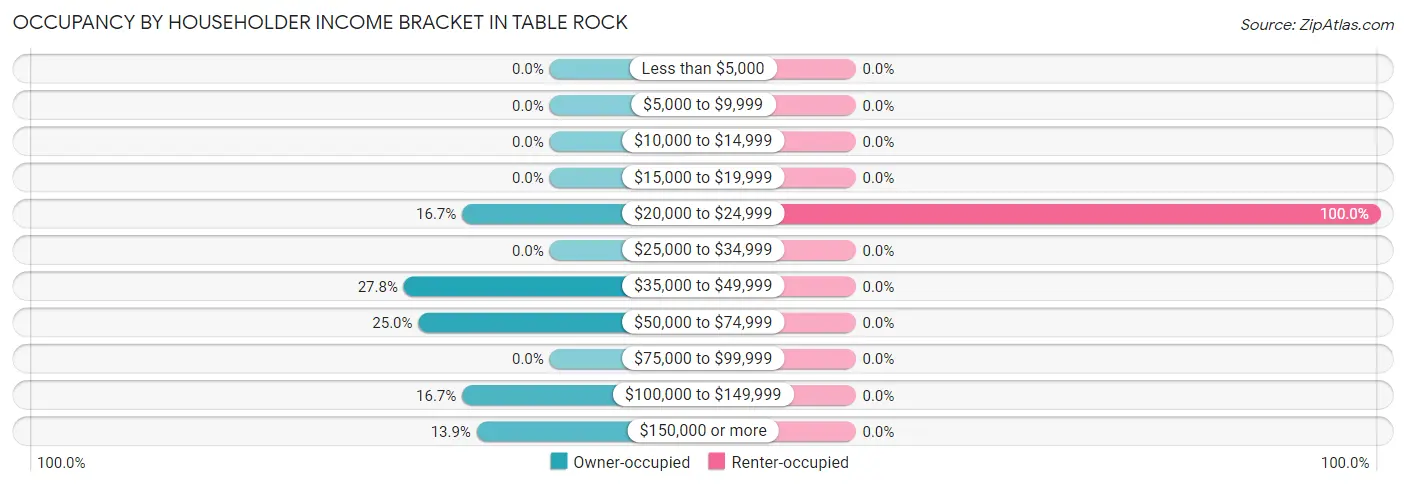
| Income Bracket | Owner-occupied | Renter-occupied |
| Less than $5,000 | 0 (0.0%) | 0 (0.0%) |
| $5,000 to $9,999 | 0 (0.0%) | 0 (0.0%) |
| $10,000 to $14,999 | 0 (0.0%) | 0 (0.0%) |
| $15,000 to $19,999 | 0 (0.0%) | 0 (0.0%) |
| $20,000 to $24,999 | 6 (16.7%) | 4 (100.0%) |
| $25,000 to $34,999 | 0 (0.0%) | 0 (0.0%) |
| $35,000 to $49,999 | 10 (27.8%) | 0 (0.0%) |
| $50,000 to $74,999 | 9 (25.0%) | 0 (0.0%) |
| $75,000 to $99,999 | 0 (0.0%) | 0 (0.0%) |
| $100,000 to $149,999 | 6 (16.7%) | 0 (0.0%) |
| $150,000 or more | 5 (13.9%) | 0 (0.0%) |
| Total | 36 (100.0%) | 4 (100.0%) |
Monthly Housing Cost Tiers in Table Rock
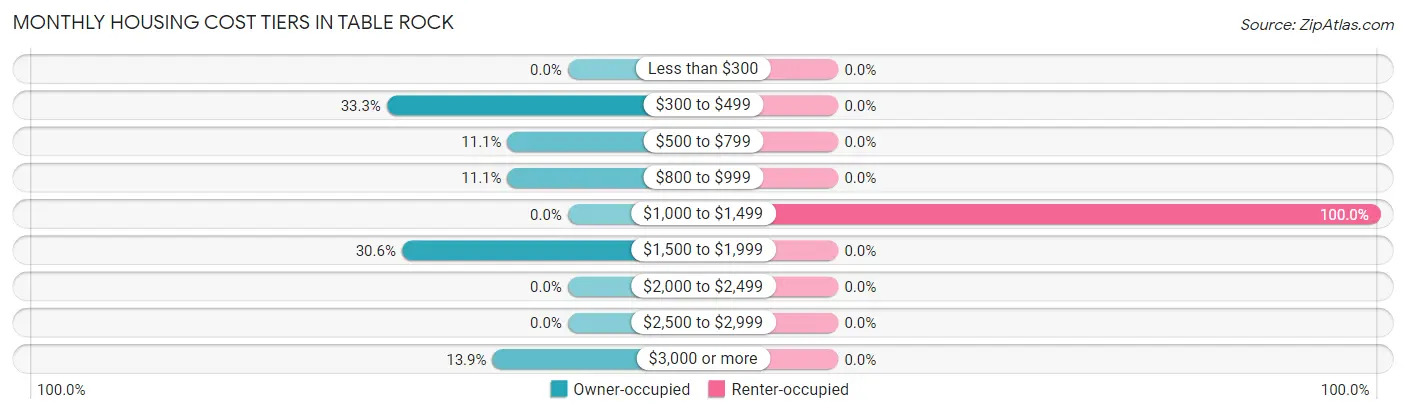
| Monthly Cost | Owner-occupied | Renter-occupied |
| Less than $300 | 0 (0.0%) | 0 (0.0%) |
| $300 to $499 | 12 (33.3%) | 0 (0.0%) |
| $500 to $799 | 4 (11.1%) | 0 (0.0%) |
| $800 to $999 | 4 (11.1%) | 0 (0.0%) |
| $1,000 to $1,499 | 0 (0.0%) | 4 (100.0%) |
| $1,500 to $1,999 | 11 (30.6%) | 0 (0.0%) |
| $2,000 to $2,499 | 0 (0.0%) | 0 (0.0%) |
| $2,500 to $2,999 | 0 (0.0%) | 0 (0.0%) |
| $3,000 or more | 5 (13.9%) | 0 (0.0%) |
| Total | 36 (100.0%) | 4 (100.0%) |
Physical Housing Characteristics in Table Rock
Housing Structures in Table Rock
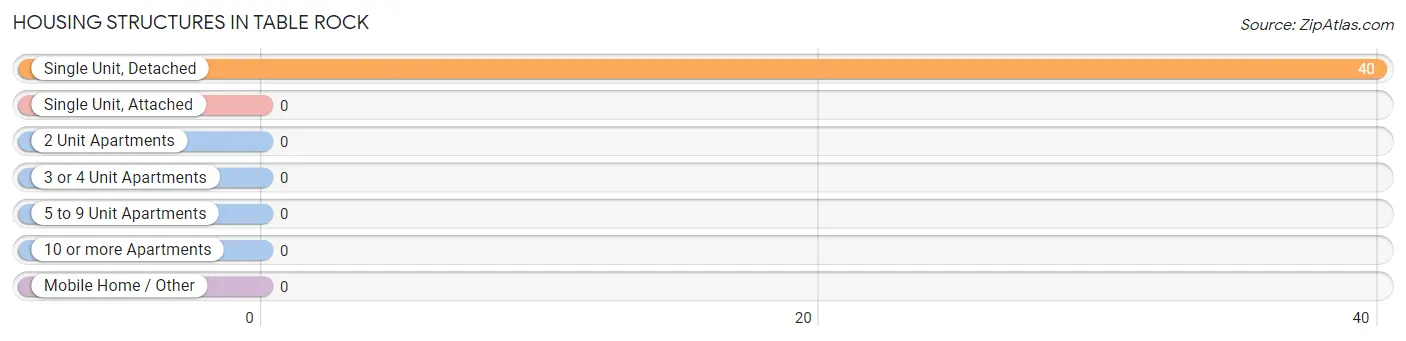
| Structure Type | # Housing Units | % Housing Units |
| Single Unit, Detached | 40 | 100.0% |
| Single Unit, Attached | 0 | 0.0% |
| 2 Unit Apartments | 0 | 0.0% |
| 3 or 4 Unit Apartments | 0 | 0.0% |
| 5 to 9 Unit Apartments | 0 | 0.0% |
| 10 or more Apartments | 0 | 0.0% |
| Mobile Home / Other | 0 | 0.0% |
| Total | 40 | 100.0% |
Housing Structures by Occupancy in Table Rock
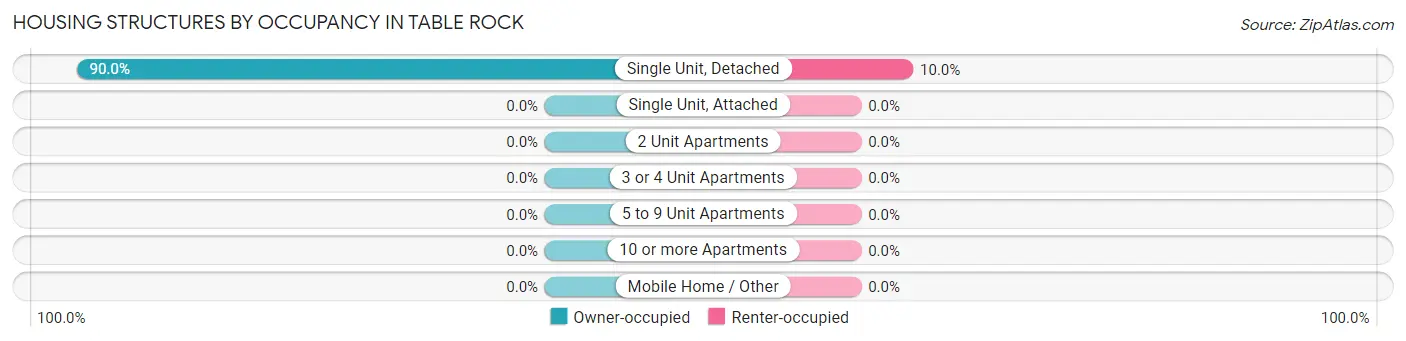
| Structure Type | Owner-occupied | Renter-occupied |
| Single Unit, Detached | 36 (90.0%) | 4 (10.0%) |
| Single Unit, Attached | 0 (0.0%) | 0 (0.0%) |
| 2 Unit Apartments | 0 (0.0%) | 0 (0.0%) |
| 3 or 4 Unit Apartments | 0 (0.0%) | 0 (0.0%) |
| 5 to 9 Unit Apartments | 0 (0.0%) | 0 (0.0%) |
| 10 or more Apartments | 0 (0.0%) | 0 (0.0%) |
| Mobile Home / Other | 0 (0.0%) | 0 (0.0%) |
| Total | 36 (90.0%) | 4 (10.0%) |
Housing Structures by Number of Rooms in Table Rock
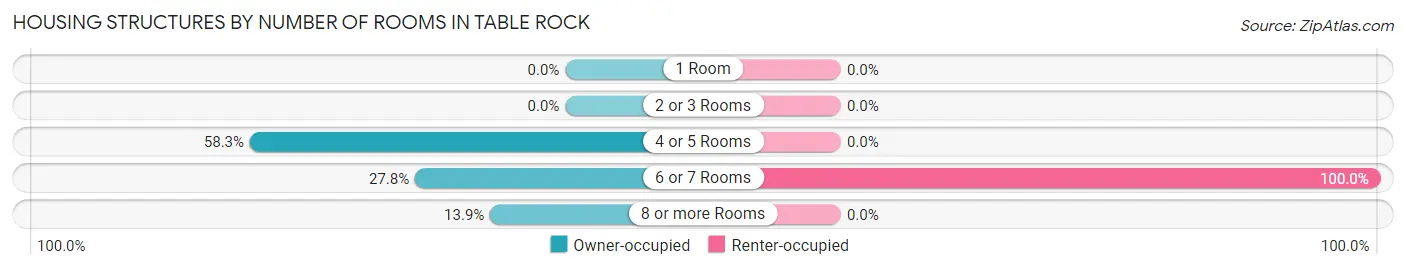
| Number of Rooms | Owner-occupied | Renter-occupied |
| 1 Room | 0 (0.0%) | 0 (0.0%) |
| 2 or 3 Rooms | 0 (0.0%) | 0 (0.0%) |
| 4 or 5 Rooms | 21 (58.3%) | 0 (0.0%) |
| 6 or 7 Rooms | 10 (27.8%) | 4 (100.0%) |
| 8 or more Rooms | 5 (13.9%) | 0 (0.0%) |
| Total | 36 (100.0%) | 4 (100.0%) |
Housing Structure by Heating Type in Table Rock
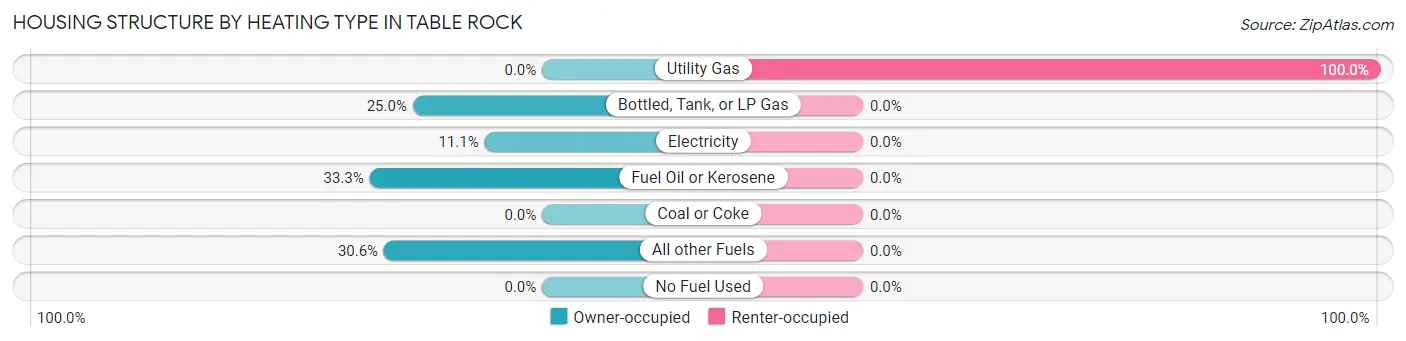
| Heating Type | Owner-occupied | Renter-occupied |
| Utility Gas | 0 (0.0%) | 4 (100.0%) |
| Bottled, Tank, or LP Gas | 9 (25.0%) | 0 (0.0%) |
| Electricity | 4 (11.1%) | 0 (0.0%) |
| Fuel Oil or Kerosene | 12 (33.3%) | 0 (0.0%) |
| Coal or Coke | 0 (0.0%) | 0 (0.0%) |
| All other Fuels | 11 (30.6%) | 0 (0.0%) |
| No Fuel Used | 0 (0.0%) | 0 (0.0%) |
| Total | 36 (100.0%) | 4 (100.0%) |
Household Vehicle Usage in Table Rock
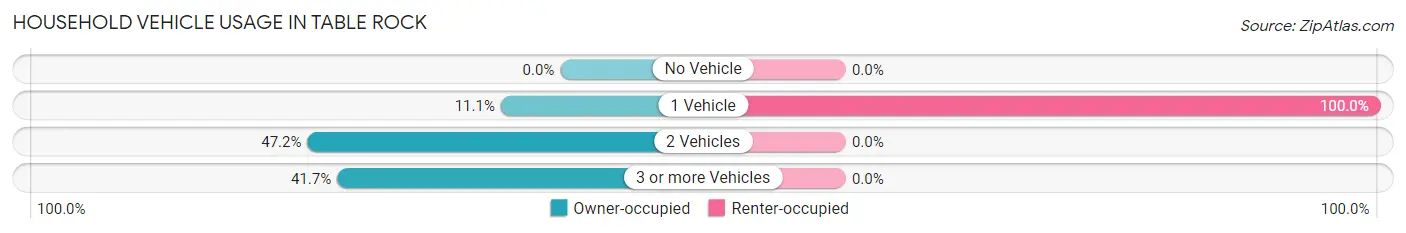
| Vehicles per Household | Owner-occupied | Renter-occupied |
| No Vehicle | 0 (0.0%) | 0 (0.0%) |
| 1 Vehicle | 4 (11.1%) | 4 (100.0%) |
| 2 Vehicles | 17 (47.2%) | 0 (0.0%) |
| 3 or more Vehicles | 15 (41.7%) | 0 (0.0%) |
| Total | 36 (100.0%) | 4 (100.0%) |
Real Estate & Mortgages in Table Rock
Real Estate and Mortgage Overview in Table Rock
| Characteristic | Without Mortgage | With Mortgage |
| Housing Units | 20 | 16 |
| Median Property Value | $150,000 | $450,000 |
| Median Household Income | - | - |
| Monthly Housing Costs | - | - |
| Real Estate Taxes | - | - |
Property Value by Mortgage Status in Table Rock
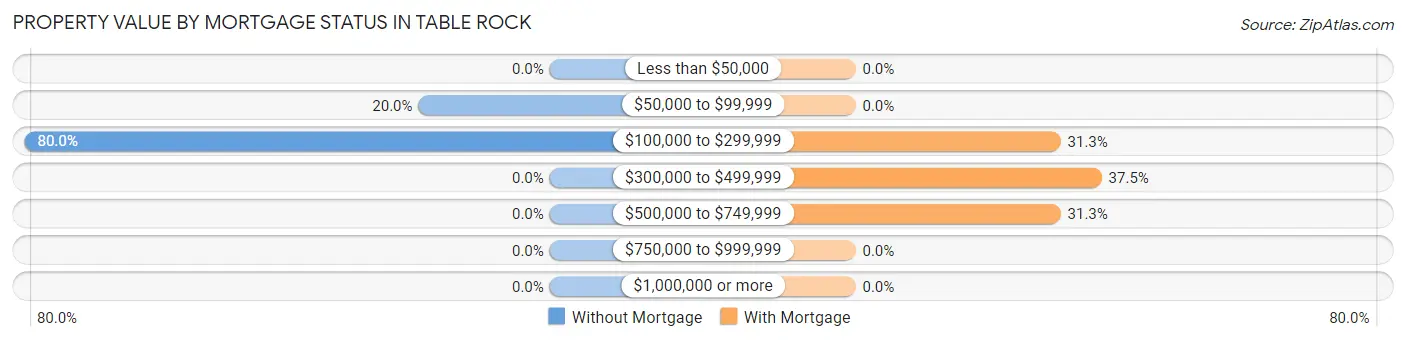
| Property Value | Without Mortgage | With Mortgage |
| Less than $50,000 | 0 (0.0%) | 0 (0.0%) |
| $50,000 to $99,999 | 4 (20.0%) | 0 (0.0%) |
| $100,000 to $299,999 | 16 (80.0%) | 5 (31.2%) |
| $300,000 to $499,999 | 0 (0.0%) | 6 (37.5%) |
| $500,000 to $749,999 | 0 (0.0%) | 5 (31.2%) |
| $750,000 to $999,999 | 0 (0.0%) | 0 (0.0%) |
| $1,000,000 or more | 0 (0.0%) | 0 (0.0%) |
| Total | 20 (100.0%) | 16 (100.0%) |
Household Income by Mortgage Status in Table Rock
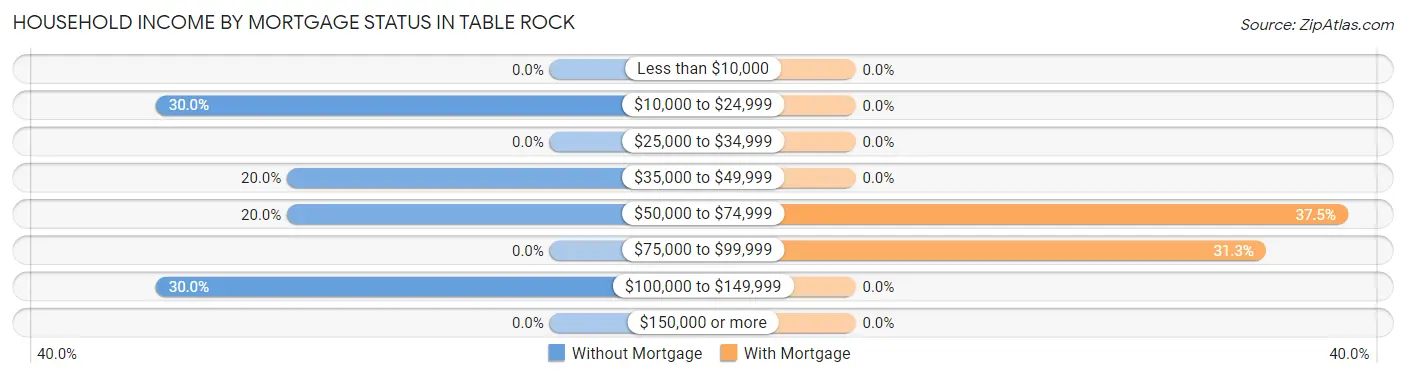
| Household Income | Without Mortgage | With Mortgage |
| Less than $10,000 | 0 (0.0%) | 0 (0.0%) |
| $10,000 to $24,999 | 6 (30.0%) | 0 (0.0%) |
| $25,000 to $34,999 | 0 (0.0%) | 0 (0.0%) |
| $35,000 to $49,999 | 4 (20.0%) | 0 (0.0%) |
| $50,000 to $74,999 | 4 (20.0%) | 6 (37.5%) |
| $75,000 to $99,999 | 0 (0.0%) | 5 (31.2%) |
| $100,000 to $149,999 | 6 (30.0%) | 0 (0.0%) |
| $150,000 or more | 0 (0.0%) | 0 (0.0%) |
| Total | 20 (100.0%) | 16 (100.0%) |
Property Value to Household Income Ratio in Table Rock
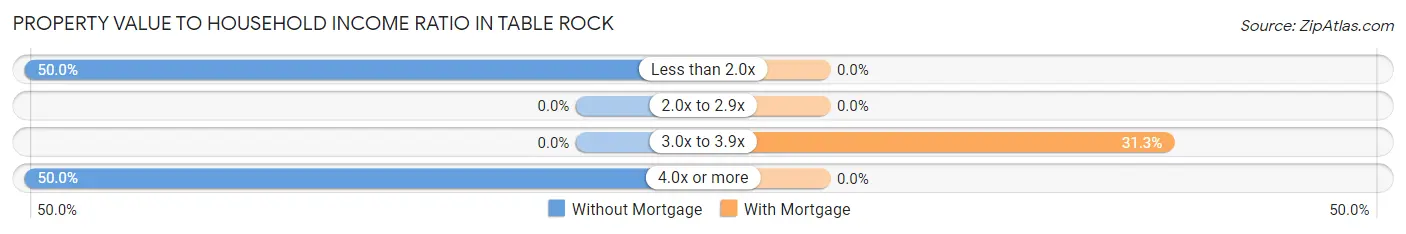
| Value-to-Income Ratio | Without Mortgage | With Mortgage |
| Less than 2.0x | 10 (50.0%) | 0 (0.0%) |
| 2.0x to 2.9x | 0 (0.0%) | 0 (0.0%) |
| 3.0x to 3.9x | 0 (0.0%) | 5 (31.2%) |
| 4.0x or more | 10 (50.0%) | 0 (0.0%) |
| Total | 20 (100.0%) | 16 (100.0%) |
Real Estate Taxes by Mortgage Status in Table Rock
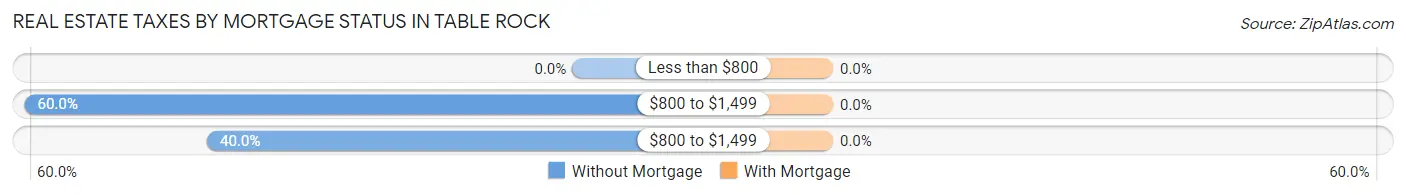
| Property Taxes | Without Mortgage | With Mortgage |
| Less than $800 | 0 (0.0%) | 0 (0.0%) |
| $800 to $1,499 | 12 (60.0%) | 0 (0.0%) |
| $800 to $1,499 | 8 (40.0%) | 0 (0.0%) |
| Total | 20 (100.0%) | 16 (100.0%) |
Health & Disability in Table Rock
Health Insurance Coverage by Age in Table Rock
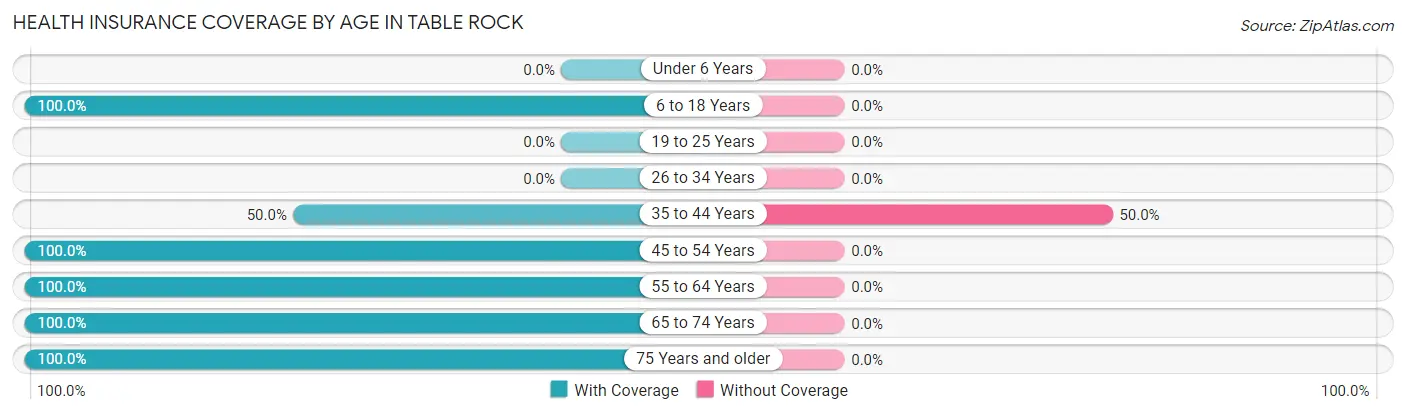
| Age Bracket | With Coverage | Without Coverage |
| Under 6 Years | 0 (0.0%) | 0 (0.0%) |
| 6 to 18 Years | 9 (100.0%) | 0 (0.0%) |
| 19 to 25 Years | 0 (0.0%) | 0 (0.0%) |
| 26 to 34 Years | 0 (0.0%) | 0 (0.0%) |
| 35 to 44 Years | 6 (50.0%) | 6 (50.0%) |
| 45 to 54 Years | 17 (100.0%) | 0 (0.0%) |
| 55 to 64 Years | 38 (100.0%) | 0 (0.0%) |
| 65 to 74 Years | 4 (100.0%) | 0 (0.0%) |
| 75 Years and older | 20 (100.0%) | 0 (0.0%) |
| Total | 94 (94.0%) | 6 (6.0%) |
Health Insurance Coverage by Citizenship Status in Table Rock
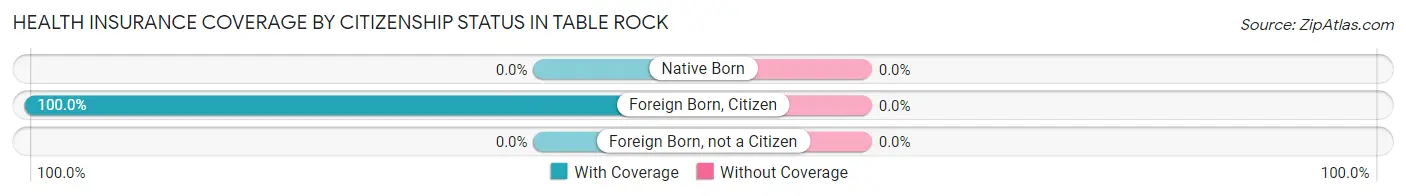
| Citizenship Status | With Coverage | Without Coverage |
| Native Born | 0 (0.0%) | 0 (0.0%) |
| Foreign Born, Citizen | 9 (100.0%) | 0 (0.0%) |
| Foreign Born, not a Citizen | 0 (0.0%) | 0 (0.0%) |
Health Insurance Coverage by Household Income in Table Rock
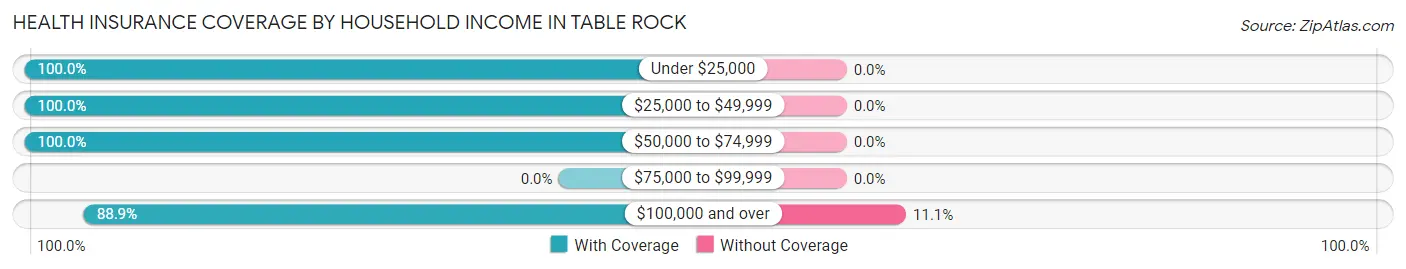
| Household Income | With Coverage | Without Coverage |
| Under $25,000 | 10 (100.0%) | 0 (0.0%) |
| $25,000 to $49,999 | 15 (100.0%) | 0 (0.0%) |
| $50,000 to $74,999 | 21 (100.0%) | 0 (0.0%) |
| $75,000 to $99,999 | 0 (0.0%) | 0 (0.0%) |
| $100,000 and over | 48 (88.9%) | 6 (11.1%) |
Public vs Private Health Insurance Coverage by Age in Table Rock
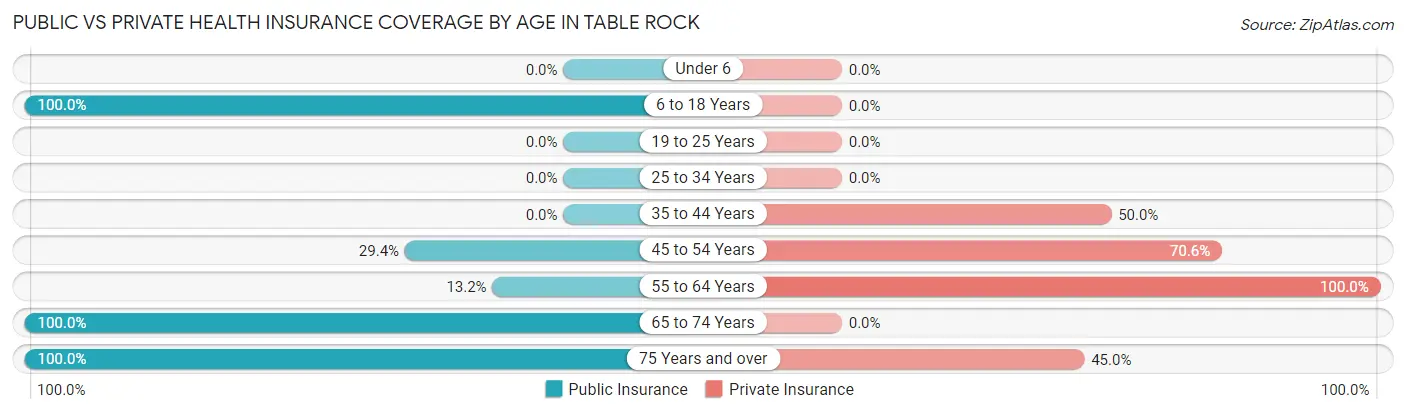
| Age Bracket | Public Insurance | Private Insurance |
| Under 6 | 0 (0.0%) | 0 (0.0%) |
| 6 to 18 Years | 9 (100.0%) | 0 (0.0%) |
| 19 to 25 Years | 0 (0.0%) | 0 (0.0%) |
| 25 to 34 Years | 0 (0.0%) | 0 (0.0%) |
| 35 to 44 Years | 0 (0.0%) | 6 (50.0%) |
| 45 to 54 Years | 5 (29.4%) | 12 (70.6%) |
| 55 to 64 Years | 5 (13.2%) | 38 (100.0%) |
| 65 to 74 Years | 4 (100.0%) | 0 (0.0%) |
| 75 Years and over | 20 (100.0%) | 9 (45.0%) |
| Total | 43 (43.0%) | 65 (65.0%) |
Disability Status by Sex by Age in Table Rock
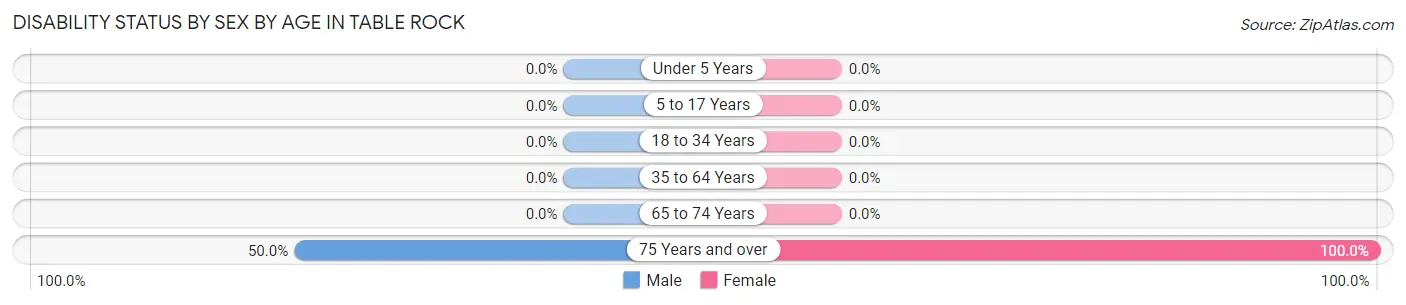
| Age Bracket | Male | Female |
| Under 5 Years | 0 (0.0%) | 0 (0.0%) |
| 5 to 17 Years | 0 (0.0%) | 0 (0.0%) |
| 18 to 34 Years | 0 (0.0%) | 0 (0.0%) |
| 35 to 64 Years | 0 (0.0%) | 0 (0.0%) |
| 65 to 74 Years | 0 (0.0%) | 0 (0.0%) |
| 75 Years and over | 4 (50.0%) | 12 (100.0%) |
Disability Class by Sex by Age in Table Rock
Disability Class: Hearing Difficulty
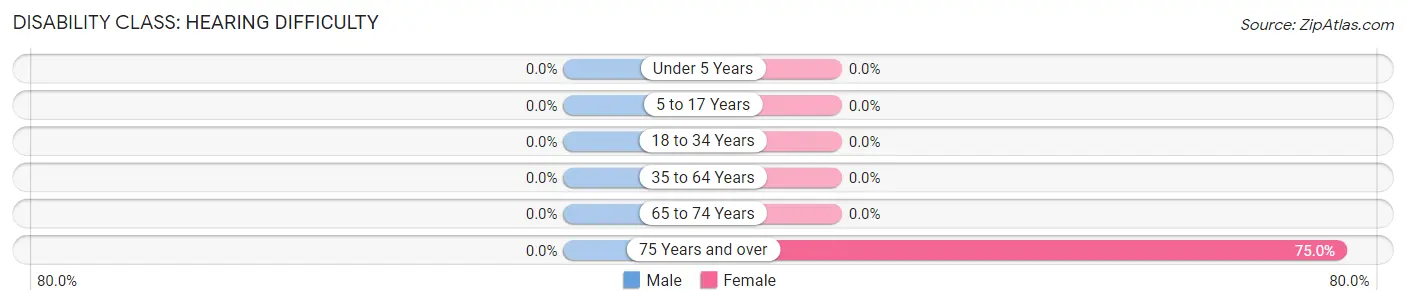
| Age Bracket | Male | Female |
| Under 5 Years | 0 (0.0%) | 0 (0.0%) |
| 5 to 17 Years | 0 (0.0%) | 0 (0.0%) |
| 18 to 34 Years | 0 (0.0%) | 0 (0.0%) |
| 35 to 64 Years | 0 (0.0%) | 0 (0.0%) |
| 65 to 74 Years | 0 (0.0%) | 0 (0.0%) |
| 75 Years and over | 0 (0.0%) | 9 (75.0%) |
Disability Class: Vision Difficulty
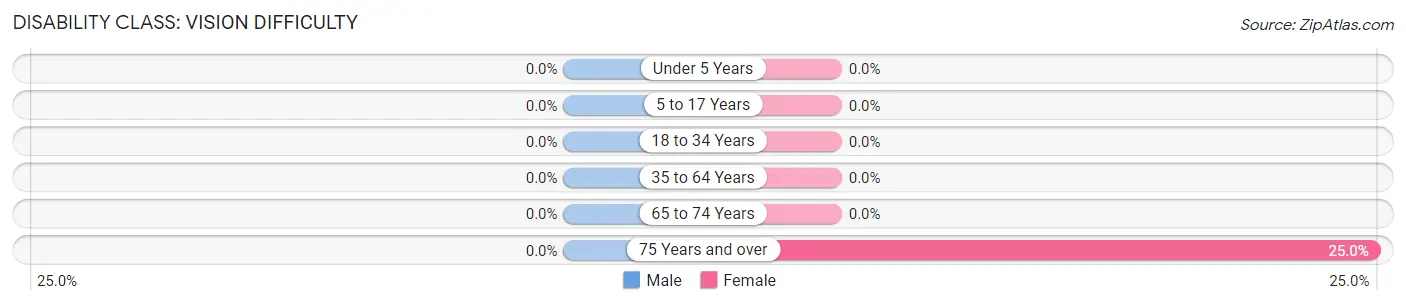
| Age Bracket | Male | Female |
| Under 5 Years | 0 (0.0%) | 0 (0.0%) |
| 5 to 17 Years | 0 (0.0%) | 0 (0.0%) |
| 18 to 34 Years | 0 (0.0%) | 0 (0.0%) |
| 35 to 64 Years | 0 (0.0%) | 0 (0.0%) |
| 65 to 74 Years | 0 (0.0%) | 0 (0.0%) |
| 75 Years and over | 0 (0.0%) | 3 (25.0%) |
Disability Class: Cognitive Difficulty
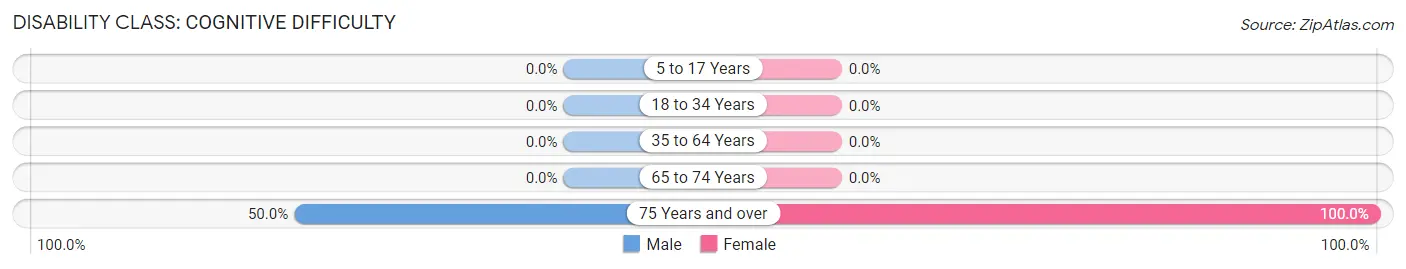
| Age Bracket | Male | Female |
| 5 to 17 Years | 0 (0.0%) | 0 (0.0%) |
| 18 to 34 Years | 0 (0.0%) | 0 (0.0%) |
| 35 to 64 Years | 0 (0.0%) | 0 (0.0%) |
| 65 to 74 Years | 0 (0.0%) | 0 (0.0%) |
| 75 Years and over | 4 (50.0%) | 12 (100.0%) |
Disability Class: Ambulatory Difficulty
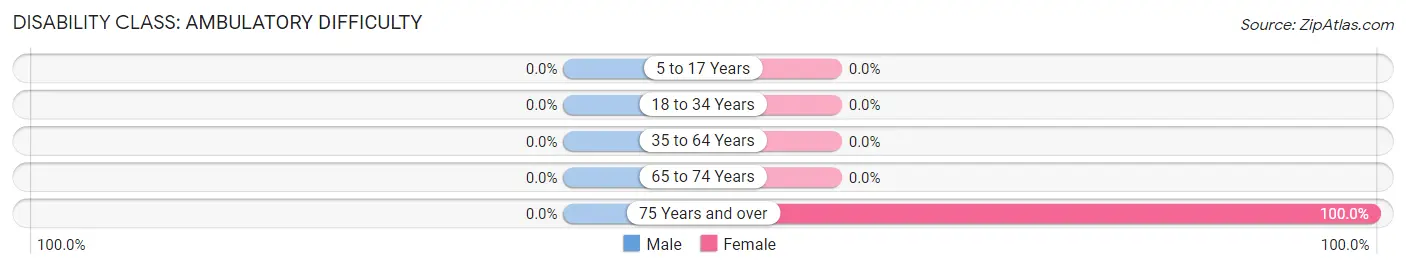
| Age Bracket | Male | Female |
| 5 to 17 Years | 0 (0.0%) | 0 (0.0%) |
| 18 to 34 Years | 0 (0.0%) | 0 (0.0%) |
| 35 to 64 Years | 0 (0.0%) | 0 (0.0%) |
| 65 to 74 Years | 0 (0.0%) | 0 (0.0%) |
| 75 Years and over | 0 (0.0%) | 12 (100.0%) |
Disability Class: Self-Care Difficulty
| Age Bracket | Male | Female |
| 5 to 17 Years | 0 (0.0%) | 0 (0.0%) |
| 18 to 34 Years | 0 (0.0%) | 0 (0.0%) |
| 35 to 64 Years | 0 (0.0%) | 0 (0.0%) |
| 65 to 74 Years | 0 (0.0%) | 0 (0.0%) |
| 75 Years and over | 0 (0.0%) | 0 (0.0%) |
Technology Access in Table Rock
Computing Device Access in Table Rock
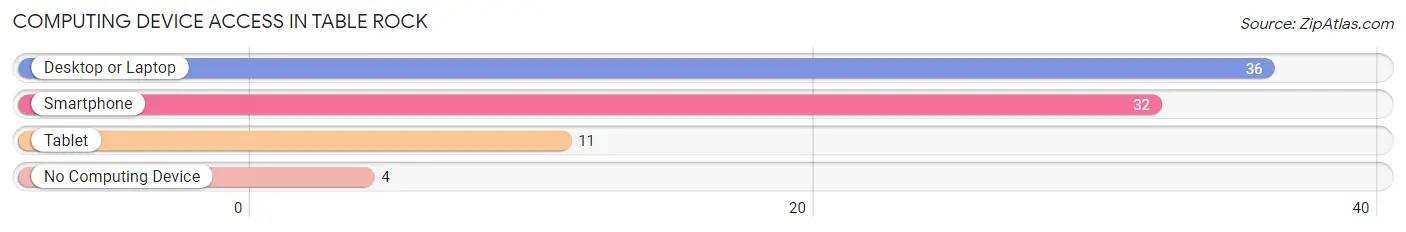
| Device Type | # Households | % Households |
| Desktop or Laptop | 36 | 90.0% |
| Smartphone | 32 | 80.0% |
| Tablet | 11 | 27.5% |
| No Computing Device | 4 | 10.0% |
| Total | 40 | 100.0% |
Internet Access in Table Rock
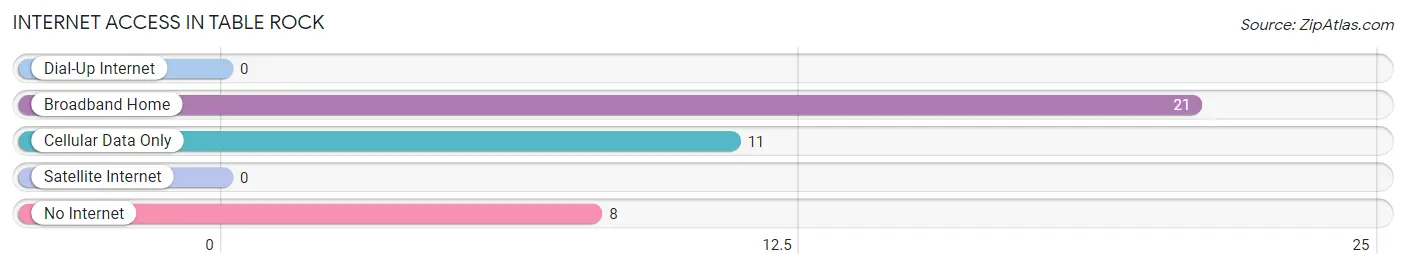
| Internet Type | # Households | % Households |
| Dial-Up Internet | 0 | 0.0% |
| Broadband Home | 21 | 52.5% |
| Cellular Data Only | 11 | 27.5% |
| Satellite Internet | 0 | 0.0% |
| No Internet | 8 | 20.0% |
| Total | 40 | 100.0% |
Table Rock Summary
Table Rock is a small unincorporated community located in the western part of Schuylkill County, Pennsylvania. It is situated in the Appalachian Mountains, approximately two miles east of the borough of Tamaqua. The community is located in the Mahanoy Creek watershed and is surrounded by the townships of Rush, Walker, and West Penn.
History
Table Rock was first settled in the early 1800s by German immigrants. The community was named after a large flat rock located near the Mahanoy Creek. The rock was used as a gathering place for the local residents and was also used as a marker for the area.
In 1845, the first post office was established in Table Rock. The post office was located in the home of the postmaster, John Kline. The post office was closed in 1876.
In 1854, the Table Rock Methodist Episcopal Church was established. The church was built on land donated by the Kline family. The church is still active today and is the oldest church in the area.
In 1872, the Table Rock School was built. The school was a one-room schoolhouse and served the local community until it closed in the 1950s.
Geography
Table Rock is located in the Appalachian Mountains of Schuylkill County, Pennsylvania. It is situated in the Mahanoy Creek watershed and is surrounded by the townships of Rush, Walker, and West Penn. The community is located approximately two miles east of the borough of Tamaqua.
The terrain of Table Rock is mostly hilly and wooded. The Mahanoy Creek runs through the community and is a popular spot for fishing and swimming. The area is also home to a variety of wildlife, including deer, bear, and wild turkey.
Economy
Table Rock is a small, rural community with a limited economy. The primary industry in the area is agriculture. The community is home to several small farms that produce a variety of crops, including corn, soybeans, and hay.
The community also has a few small businesses, including a general store, a gas station, and a restaurant. The local economy is supplemented by tourism, as the area is a popular destination for outdoor recreation.
Demographics
As of the 2010 census, the population of Table Rock was 545. The population is primarily white (97.3%) and the median age is 44. The median household income is $45,000 and the median home value is $125,000.
Conclusion
Table Rock is a small, rural community located in the western part of Schuylkill County, Pennsylvania. It is situated in the Appalachian Mountains and is surrounded by the townships of Rush, Walker, and West Penn. The community is home to a variety of wildlife and is a popular destination for outdoor recreation. The primary industry in the area is agriculture and the local economy is supplemented by tourism. The population of Table Rock is primarily white and the median age is 44.
Common Questions
What is Per Capita Income in Table Rock?
Per Capita income in Table Rock is $39,770.
What is the Median Household income in Table Rock?
Median Household Income in Table Rock is $50,000.
What is Inequality or Gini Index in Table Rock?
Inequality or Gini Index in Table Rock is 0.45.
What is the Total Population of Table Rock?
Total Population of Table Rock is 100.
What is the Total Male Population of Table Rock?
Total Male Population of Table Rock is 41.
What is the Total Female Population of Table Rock?
Total Female Population of Table Rock is 59.
What is the Ratio of Males per 100 Females in Table Rock?
There are 69.49 Males per 100 Females in Table Rock.
What is the Ratio of Females per 100 Males in Table Rock?
There are 143.90 Females per 100 Males in Table Rock.
What is the Median Population Age in Table Rock?
Median Population Age in Table Rock is 58.6 Years.
What is the Average Family Size in Table Rock
Average Family Size in Table Rock is 3.2 People.
What is the Average Household Size in Table Rock
Average Household Size in Table Rock is 2.5 People.
How Large is the Labor Force in Table Rock?
There are 49 People in the Labor Forcein in Table Rock.
What is the Percentage of People in the Labor Force in Table Rock?
51.6% of People are in the Labor Force in Table Rock.