Fountain Springs, PA Map & Demographics
Fountain Springs Map
Fountain Springs Overview
$40,475
PER CAPITA INCOME
$108,651
AVG FAMILY INCOME
0.43
INEQUALITY / GINI INDEX
261
TOTAL POPULATION
109
MALE POPULATION
152
FEMALE POPULATION
71.71
MALES / 100 FEMALES
139.45
FEMALES / 100 MALES
44.5
MEDIAN AGE
2.1
AVG FAMILY SIZE
1.7
AVG HOUSEHOLD SIZE
127
LABOR FORCE [ PEOPLE ]
58.3%
PERCENT IN LABOR FORCE
9.4%
UNEMPLOYMENT RATE
Income in Fountain Springs
Income Overview in Fountain Springs
| Characteristic | Number | Measure |
| Per Capita Income | 261 | $40,475 |
| Median Family Income | 63 | $108,651 |
| Mean Family Income | 63 | $128,419 |
| Median Household Income | 121 | $0 |
| Mean Household Income | 121 | $82,572 |
| Income Deficit | 63 | $0 |
| Wage / Income Gap (%) | 261 | 0.00% |
| Wage / Income Gap ($) | 261 | 100.00¢ per $1 |
| Gini / Inequality Index | 261 | 0.43 |
Earnings by Sex in Fountain Springs
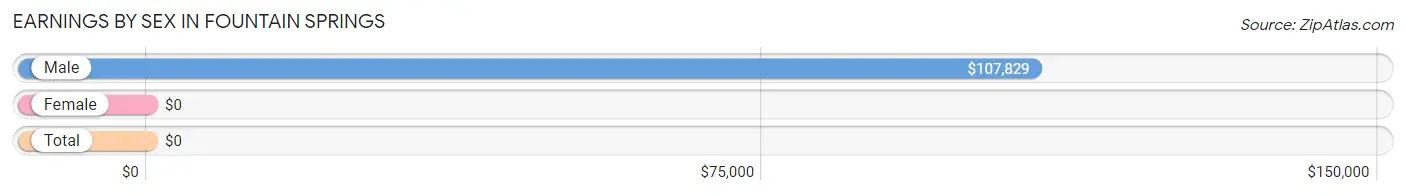
| Sex | Number | Average Earnings |
| Male | 66 (57.4%) | $107,829 |
| Female | 49 (42.6%) | $0 |
| Total | 115 (100.0%) | $0 |
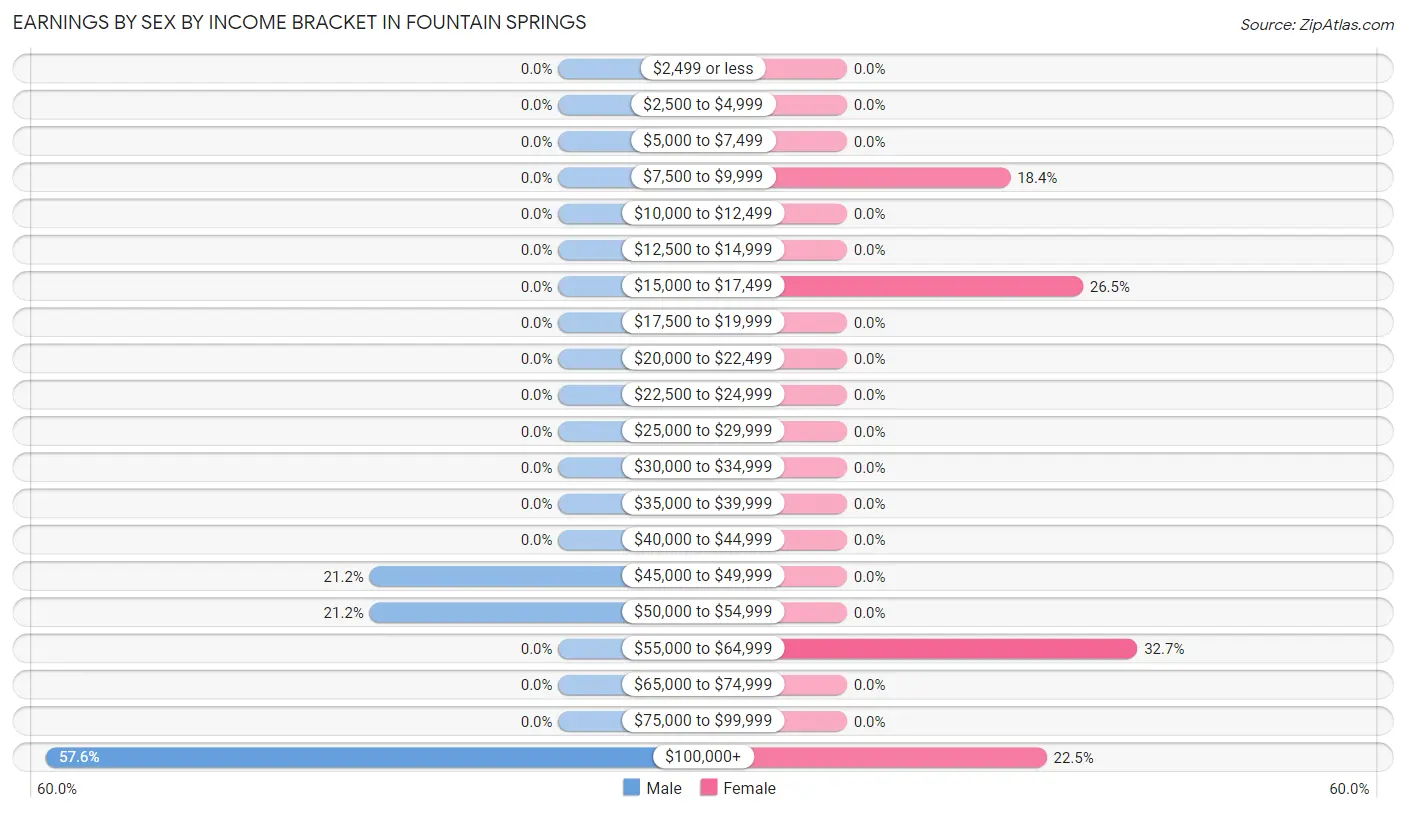
Earnings by Sex by Income Bracket in Fountain Springs
The most common earnings brackets in Fountain Springs are $100,000+ for men (38 | 57.6%) and $55,000 to $64,999 for women (16 | 32.7%).
| Income | Male | Female |
| $2,499 or less | 0 (0.0%) | 0 (0.0%) |
| $2,500 to $4,999 | 0 (0.0%) | 0 (0.0%) |
| $5,000 to $7,499 | 0 (0.0%) | 0 (0.0%) |
| $7,500 to $9,999 | 0 (0.0%) | 9 (18.4%) |
| $10,000 to $12,499 | 0 (0.0%) | 0 (0.0%) |
| $12,500 to $14,999 | 0 (0.0%) | 0 (0.0%) |
| $15,000 to $17,499 | 0 (0.0%) | 13 (26.5%) |
| $17,500 to $19,999 | 0 (0.0%) | 0 (0.0%) |
| $20,000 to $22,499 | 0 (0.0%) | 0 (0.0%) |
| $22,500 to $24,999 | 0 (0.0%) | 0 (0.0%) |
| $25,000 to $29,999 | 0 (0.0%) | 0 (0.0%) |
| $30,000 to $34,999 | 0 (0.0%) | 0 (0.0%) |
| $35,000 to $39,999 | 0 (0.0%) | 0 (0.0%) |
| $40,000 to $44,999 | 0 (0.0%) | 0 (0.0%) |
| $45,000 to $49,999 | 14 (21.2%) | 0 (0.0%) |
| $50,000 to $54,999 | 14 (21.2%) | 0 (0.0%) |
| $55,000 to $64,999 | 0 (0.0%) | 16 (32.7%) |
| $65,000 to $74,999 | 0 (0.0%) | 0 (0.0%) |
| $75,000 to $99,999 | 0 (0.0%) | 0 (0.0%) |
| $100,000+ | 38 (57.6%) | 11 (22.5%) |
| Total | 66 (100.0%) | 49 (100.0%) |
Earnings by Sex by Educational Attainment in Fountain Springs
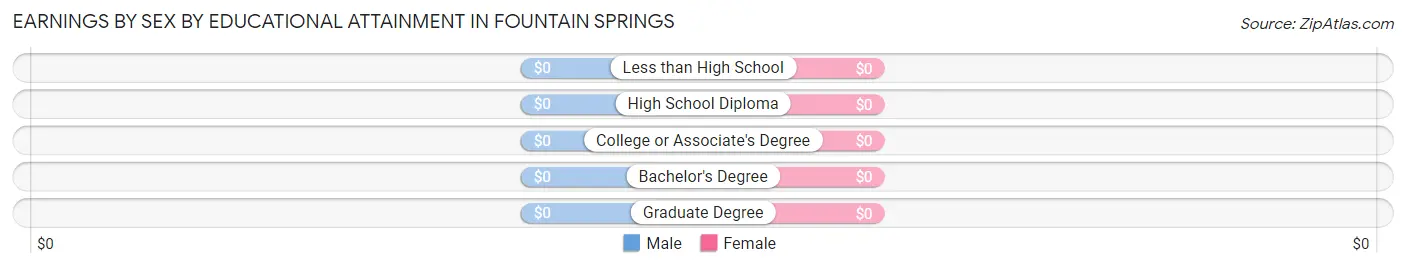
| Educational Attainment | Male Income | Female Income |
| Less than High School | - | - |
| High School Diploma | - | - |
| College or Associate's Degree | - | - |
| Bachelor's Degree | - | - |
| Graduate Degree | - | - |
| Total | $107,829 | $0 |
Family Income in Fountain Springs
Family Income Brackets in Fountain Springs
According to the Fountain Springs family income data, there are 38 families falling into the $100,000 to $149,999 income range, which is the most common income bracket and makes up 60.3% of all families.
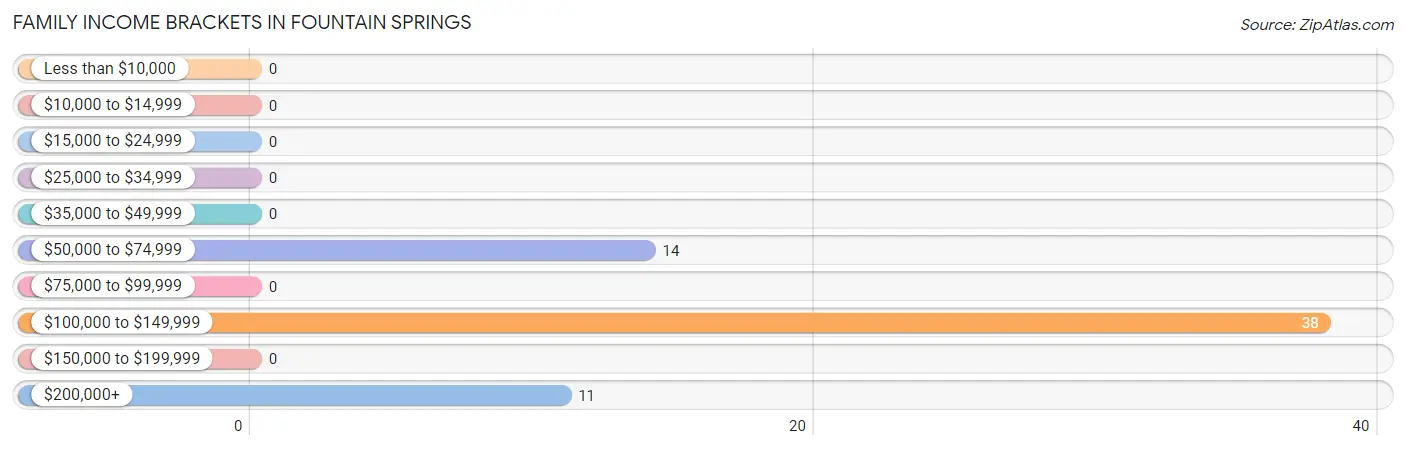
| Income Bracket | # Families | % Families |
| Less than $10,000 | 0 | 0.0% |
| $10,000 to $14,999 | 0 | 0.0% |
| $15,000 to $24,999 | 0 | 0.0% |
| $25,000 to $34,999 | 0 | 0.0% |
| $35,000 to $49,999 | 0 | 0.0% |
| $50,000 to $74,999 | 14 | 22.2% |
| $75,000 to $99,999 | 0 | 0.0% |
| $100,000 to $149,999 | 38 | 60.3% |
| $150,000 to $199,999 | 0 | 0.0% |
| $200,000+ | 11 | 17.5% |
Family Income by Famaliy Size in Fountain Springs
2-person families (63 | 100.0%) account for the highest median family income in Fountain Springs with $108,651 per family, while 2-person families (63 | 100.0%) have the highest median income of $54,326 per family member.
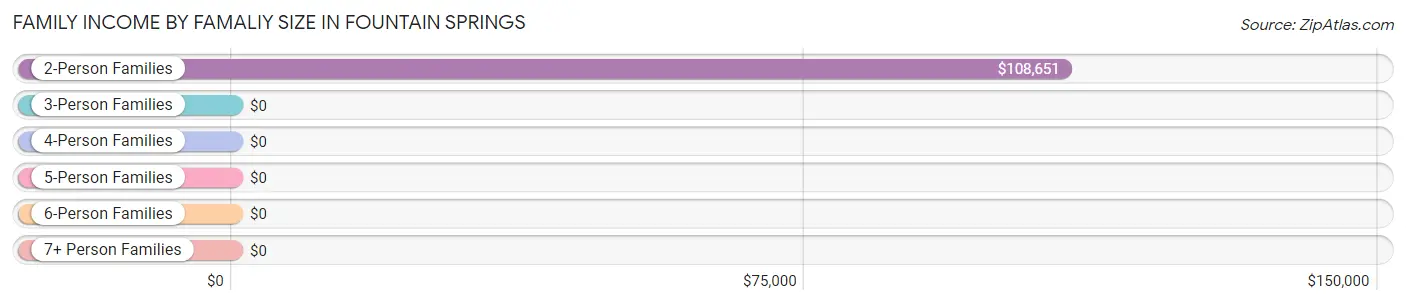
| Income Bracket | # Families | Median Income |
| 2-Person Families | 63 (100.0%) | $108,651 |
| 3-Person Families | 0 (0.0%) | $0 |
| 4-Person Families | 0 (0.0%) | $0 |
| 5-Person Families | 0 (0.0%) | $0 |
| 6-Person Families | 0 (0.0%) | $0 |
| 7+ Person Families | 0 (0.0%) | $0 |
| Total | 63 (100.0%) | $108,651 |
Family Income by Number of Earners in Fountain Springs
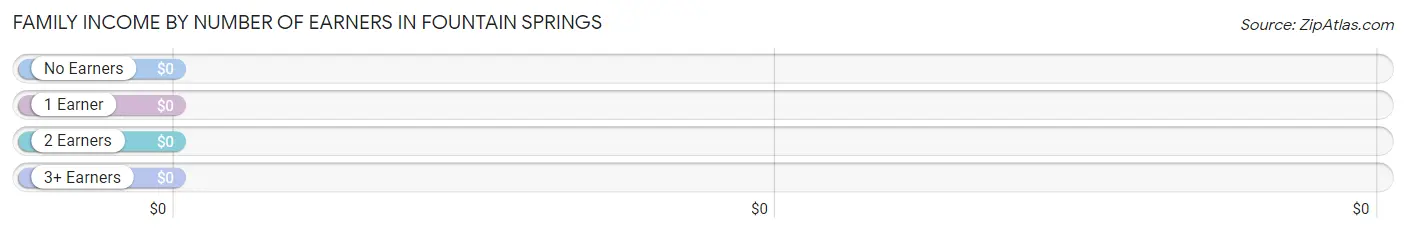
| Number of Earners | # Families | Median Income |
| No Earners | 0 (0.0%) | $0 |
| 1 Earner | 38 (60.3%) | $0 |
| 2 Earners | 25 (39.7%) | $0 |
| 3+ Earners | 0 (0.0%) | $0 |
| Total | 63 (100.0%) | $108,651 |
Household Income in Fountain Springs
Household Income Brackets in Fountain Springs
With 38 households falling in the category, the $100,000 to $149,999 income range is the most frequent in Fountain Springs, accounting for 31.4% of all households.
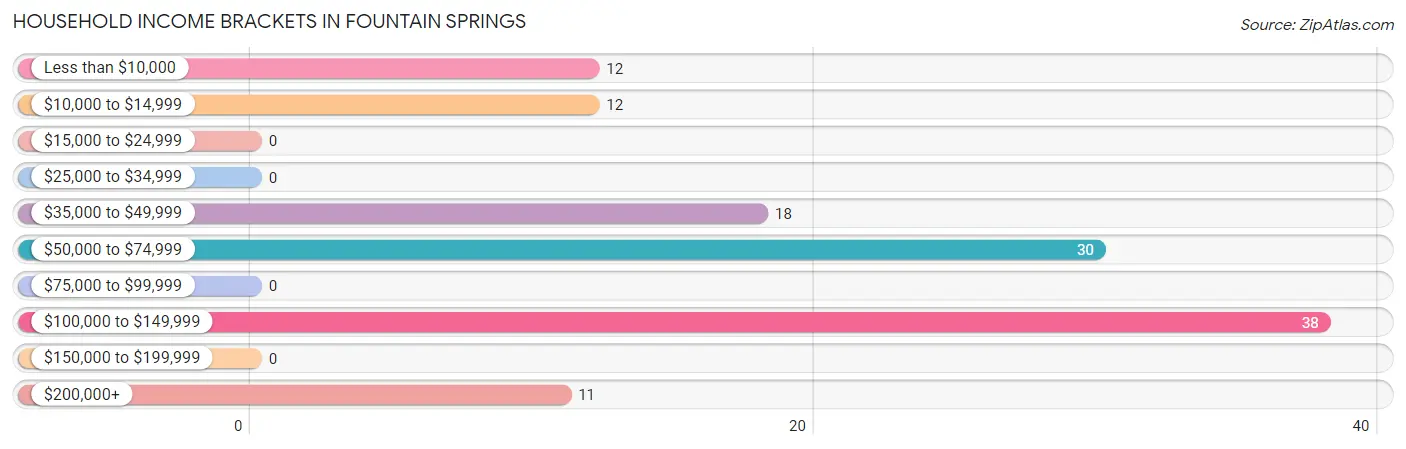
| Income Bracket | # Households | % Households |
| Less than $10,000 | 12 | 9.9% |
| $10,000 to $14,999 | 12 | 9.9% |
| $15,000 to $24,999 | 0 | 0.0% |
| $25,000 to $34,999 | 0 | 0.0% |
| $35,000 to $49,999 | 18 | 14.9% |
| $50,000 to $74,999 | 30 | 24.8% |
| $75,000 to $99,999 | 0 | 0.0% |
| $100,000 to $149,999 | 38 | 31.4% |
| $150,000 to $199,999 | 0 | 0.0% |
| $200,000+ | 11 | 9.1% |
Household Income by Householder Age in Fountain Springs
The median household income in Fountain Springs is $0, with the highest median household income of $107,829 found in the 45 to 64 years age bracket for the primary householder. A total of 66 households (54.5%) fall into this category.
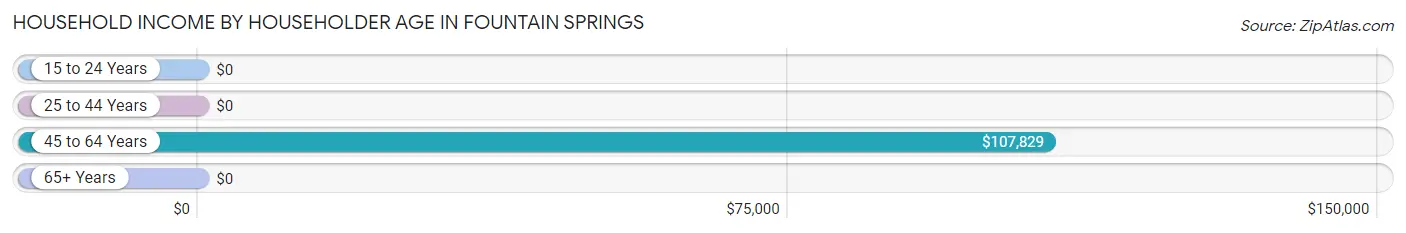
| Income Bracket | # Households | Median Income |
| 15 to 24 Years | 0 (0.0%) | $0 |
| 25 to 44 Years | 37 (30.6%) | $0 |
| 45 to 64 Years | 66 (54.5%) | $107,829 |
| 65+ Years | 18 (14.9%) | $0 |
| Total | 121 (100.0%) | $0 |
Poverty in Fountain Springs
Income Below Poverty by Sex and Age in Fountain Springs
With 31.2% poverty level for males and 33.3% for females among the residents of Fountain Springs, 65 to 74 year old males and 45 to 54 year old females are the most vulnerable to poverty, with 10 males (52.6%) and 14 females (100.0%) in their respective age groups living below the poverty level.
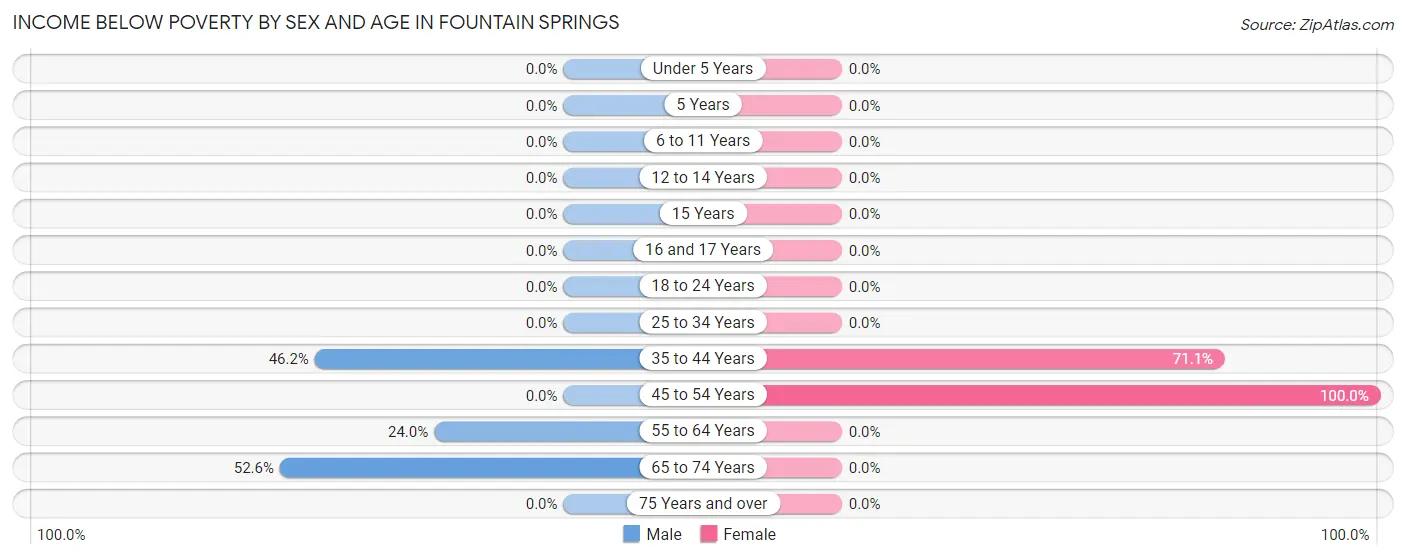
| Age Bracket | Male | Female |
| Under 5 Years | 0 (0.0%) | 0 (0.0%) |
| 5 Years | 0 (0.0%) | 0 (0.0%) |
| 6 to 11 Years | 0 (0.0%) | 0 (0.0%) |
| 12 to 14 Years | 0 (0.0%) | 0 (0.0%) |
| 15 Years | 0 (0.0%) | 0 (0.0%) |
| 16 and 17 Years | 0 (0.0%) | 0 (0.0%) |
| 18 to 24 Years | 0 (0.0%) | 0 (0.0%) |
| 25 to 34 Years | 0 (0.0%) | 0 (0.0%) |
| 35 to 44 Years | 12 (46.2%) | 32 (71.1%) |
| 45 to 54 Years | 0 (0.0%) | 14 (100.0%) |
| 55 to 64 Years | 12 (24.0%) | 0 (0.0%) |
| 65 to 74 Years | 10 (52.6%) | 0 (0.0%) |
| 75 Years and over | 0 (0.0%) | 0 (0.0%) |
| Total | 34 (31.2%) | 46 (33.3%) |
Income Above Poverty by Sex and Age in Fountain Springs
According to the poverty statistics in Fountain Springs, males aged 25 to 34 years and females aged 12 to 14 years are the age groups that are most secure financially, with 100.0% of males and 100.0% of females in these age groups living above the poverty line.
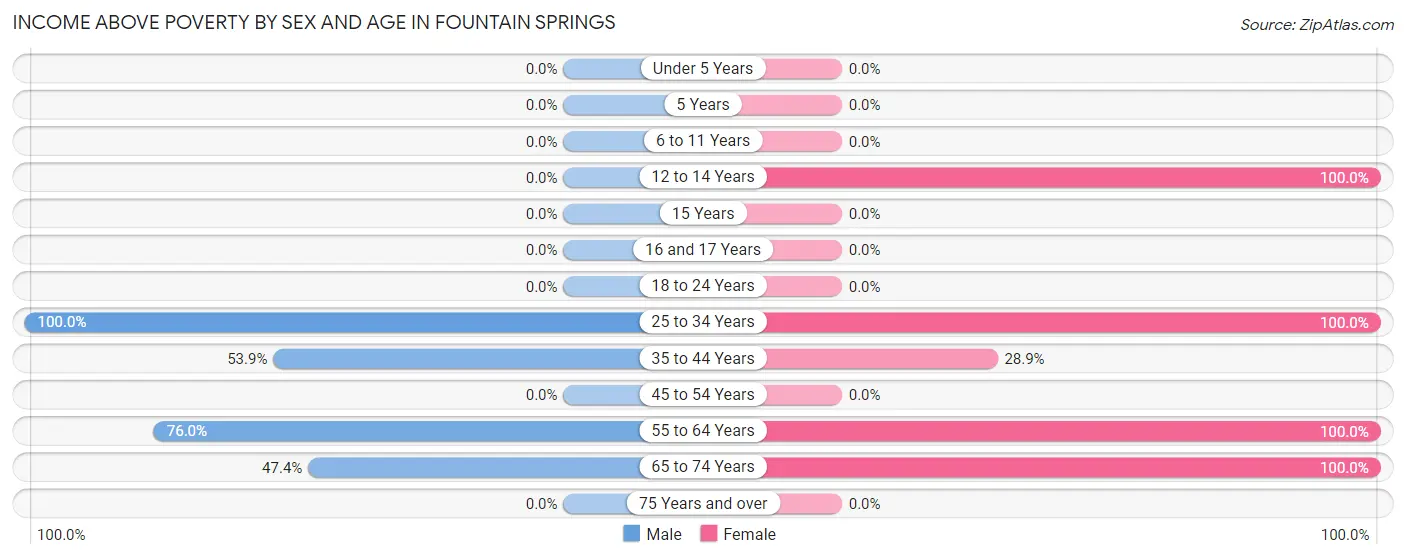
| Age Bracket | Male | Female |
| Under 5 Years | 0 (0.0%) | 0 (0.0%) |
| 5 Years | 0 (0.0%) | 0 (0.0%) |
| 6 to 11 Years | 0 (0.0%) | 0 (0.0%) |
| 12 to 14 Years | 0 (0.0%) | 43 (100.0%) |
| 15 Years | 0 (0.0%) | 0 (0.0%) |
| 16 and 17 Years | 0 (0.0%) | 0 (0.0%) |
| 18 to 24 Years | 0 (0.0%) | 0 (0.0%) |
| 25 to 34 Years | 14 (100.0%) | 11 (100.0%) |
| 35 to 44 Years | 14 (53.8%) | 13 (28.9%) |
| 45 to 54 Years | 0 (0.0%) | 0 (0.0%) |
| 55 to 64 Years | 38 (76.0%) | 16 (100.0%) |
| 65 to 74 Years | 9 (47.4%) | 9 (100.0%) |
| 75 Years and over | 0 (0.0%) | 0 (0.0%) |
| Total | 75 (68.8%) | 92 (66.7%) |
Income Below Poverty Among Married-Couple Families in Fountain Springs
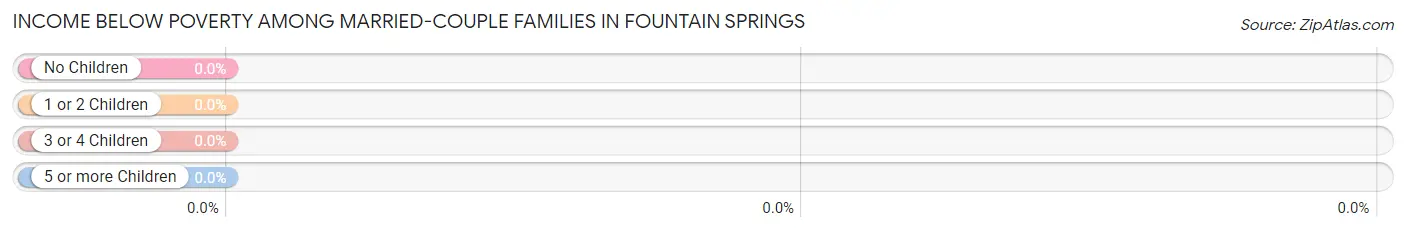
| Children | Above Poverty | Below Poverty |
| No Children | 25 (100.0%) | 0 (0.0%) |
| 1 or 2 Children | 0 (0.0%) | 0 (0.0%) |
| 3 or 4 Children | 0 (0.0%) | 0 (0.0%) |
| 5 or more Children | 0 (0.0%) | 0 (0.0%) |
| Total | 25 (100.0%) | 0 (0.0%) |
Income Below Poverty Among Single-Parent Households in Fountain Springs
| Children | Single Father | Single Mother |
| No Children | 0 (0.0%) | 0 (0.0%) |
| 1 or 2 Children | 0 (0.0%) | 0 (0.0%) |
| 3 or 4 Children | 0 (0.0%) | 0 (0.0%) |
| 5 or more Children | 0 (0.0%) | 0 (0.0%) |
| Total | 0 (0.0%) | 0 (0.0%) |
Income Below Poverty Among Married-Couple vs Single-Parent Households in Fountain Springs
| Children | Married-Couple Families | Single-Parent Households |
| No Children | 0 (0.0%) | 0 (0.0%) |
| 1 or 2 Children | 0 (0.0%) | 0 (0.0%) |
| 3 or 4 Children | 0 (0.0%) | 0 (0.0%) |
| 5 or more Children | 0 (0.0%) | 0 (0.0%) |
| Total | 0 (0.0%) | 0 (0.0%) |
Race in Fountain Springs
The most populous races in Fountain Springs are White / Caucasian (229 | 87.7%), Asian (18 | 6.9%), and Black / African American (14 | 5.4%).
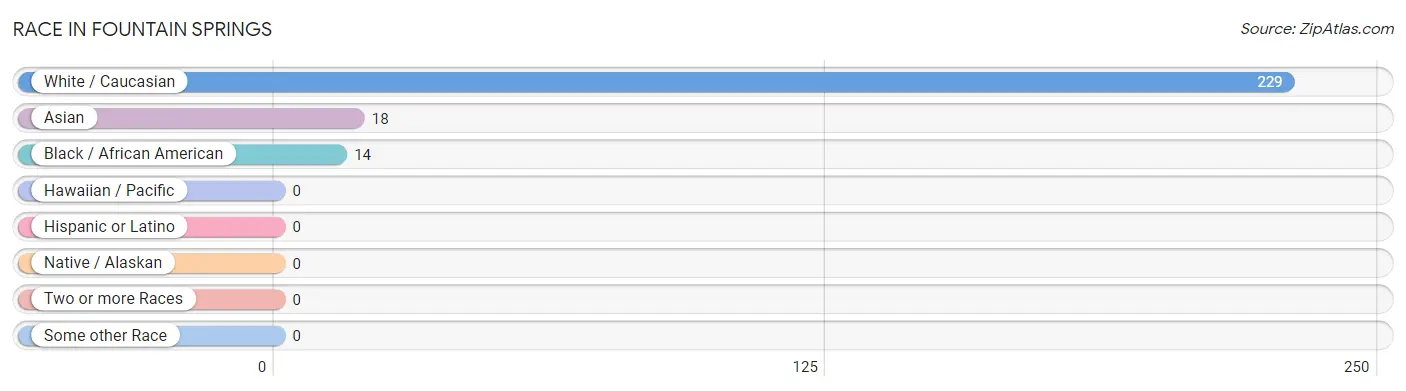
| Race | # Population | % Population |
| Asian | 18 | 6.9% |
| Black / African American | 14 | 5.4% |
| Hawaiian / Pacific | 0 | 0.0% |
| Hispanic or Latino | 0 | 0.0% |
| Native / Alaskan | 0 | 0.0% |
| White / Caucasian | 229 | 87.7% |
| Two or more Races | 0 | 0.0% |
| Some other Race | 0 | 0.0% |
| Total | 261 | 100.0% |
Ancestry in Fountain Springs
The most populous ancestries reported in Fountain Springs are German (62 | 23.7%), Irish (41 | 15.7%), Dutch (38 | 14.6%), Polish (23 | 8.8%), and Sri Lankan (18 | 6.9%), together accounting for 69.7% of all Fountain Springs residents.
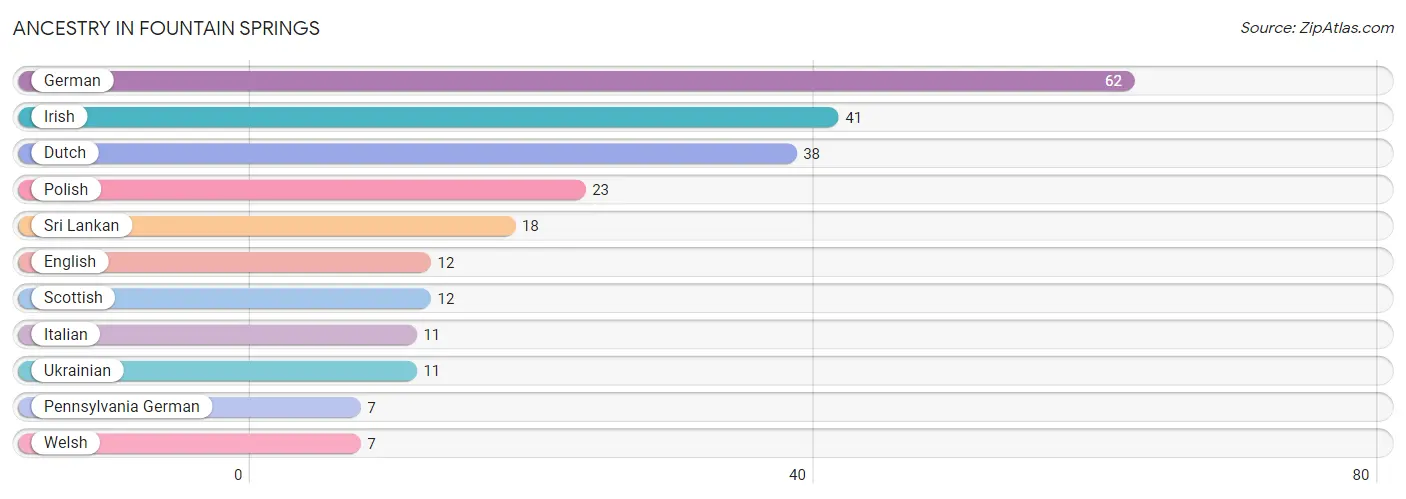
| Ancestry | # Population | % Population |
| Dutch | 38 | 14.6% |
| English | 12 | 4.6% |
| German | 62 | 23.7% |
| Irish | 41 | 15.7% |
| Italian | 11 | 4.2% |
| Pennsylvania German | 7 | 2.7% |
| Polish | 23 | 8.8% |
| Scottish | 12 | 4.6% |
| Sri Lankan | 18 | 6.9% |
| Ukrainian | 11 | 4.2% |
| Welsh | 7 | 2.7% | View All 11 Rows |
Immigrants in Fountain Springs
The most numerous immigrant groups reported in Fountain Springs came from Asia (18 | 6.9%), South Eastern Asia (18 | 6.9%), and Vietnam (18 | 6.9%), together accounting for 20.7% of all Fountain Springs residents.
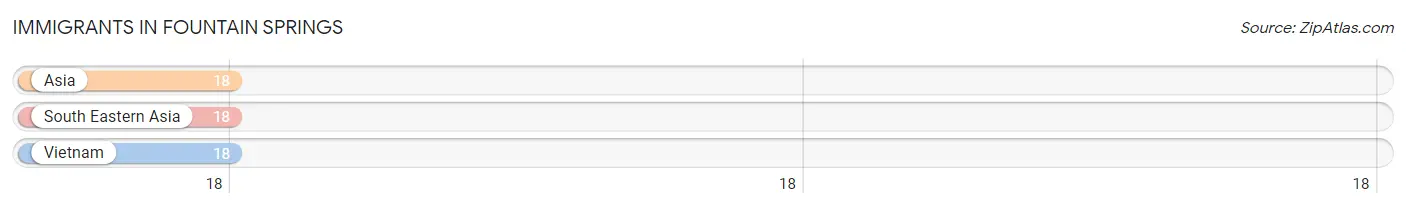
| Immigration Origin | # Population | % Population |
| Asia | 18 | 6.9% |
| South Eastern Asia | 18 | 6.9% |
| Vietnam | 18 | 6.9% | View All 3 Rows |
Sex and Age in Fountain Springs
Sex and Age in Fountain Springs
The most populous age groups in Fountain Springs are 55 to 59 Years (50 | 45.9%) for men and 10 to 14 Years (43 | 28.3%) for women.
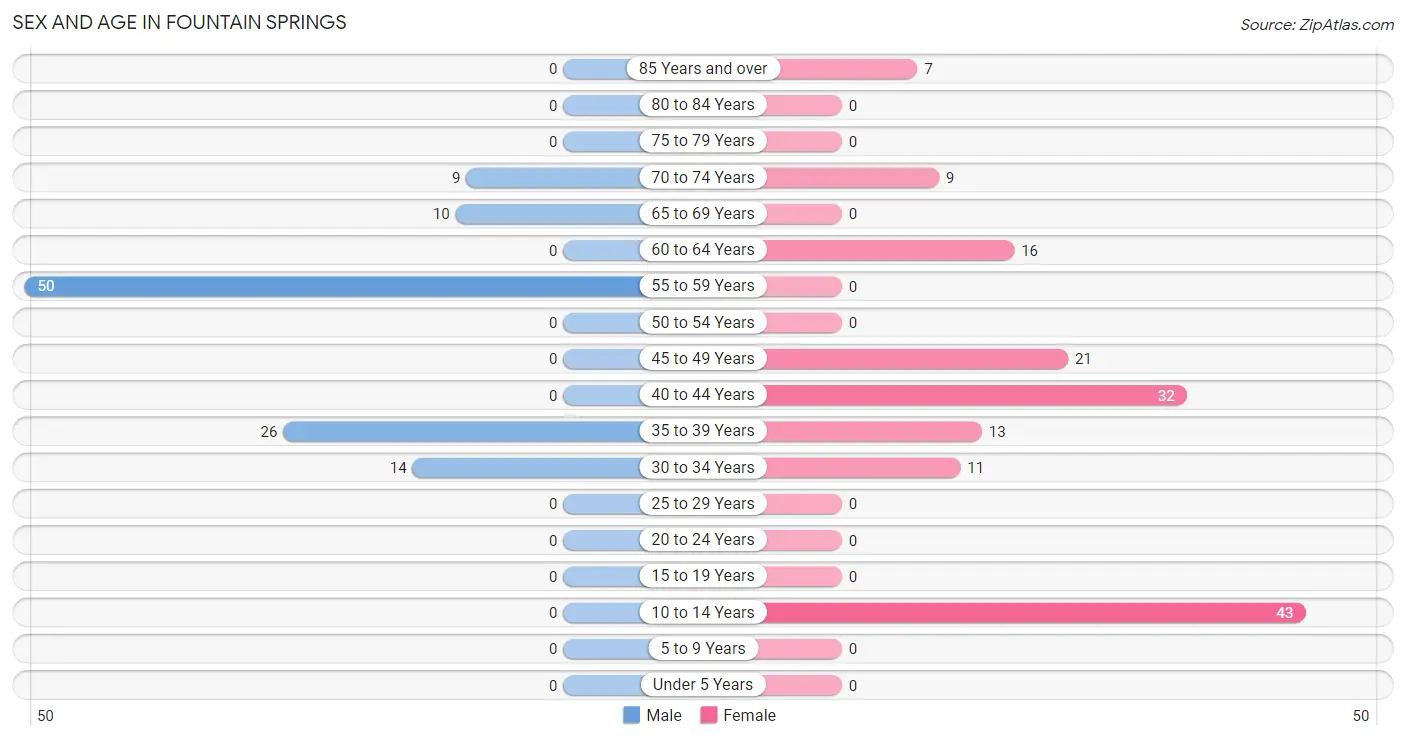
| Age Bracket | Male | Female |
| Under 5 Years | 0 (0.0%) | 0 (0.0%) |
| 5 to 9 Years | 0 (0.0%) | 0 (0.0%) |
| 10 to 14 Years | 0 (0.0%) | 43 (28.3%) |
| 15 to 19 Years | 0 (0.0%) | 0 (0.0%) |
| 20 to 24 Years | 0 (0.0%) | 0 (0.0%) |
| 25 to 29 Years | 0 (0.0%) | 0 (0.0%) |
| 30 to 34 Years | 14 (12.8%) | 11 (7.2%) |
| 35 to 39 Years | 26 (23.8%) | 13 (8.6%) |
| 40 to 44 Years | 0 (0.0%) | 32 (21.0%) |
| 45 to 49 Years | 0 (0.0%) | 21 (13.8%) |
| 50 to 54 Years | 0 (0.0%) | 0 (0.0%) |
| 55 to 59 Years | 50 (45.9%) | 0 (0.0%) |
| 60 to 64 Years | 0 (0.0%) | 16 (10.5%) |
| 65 to 69 Years | 10 (9.2%) | 0 (0.0%) |
| 70 to 74 Years | 9 (8.3%) | 9 (5.9%) |
| 75 to 79 Years | 0 (0.0%) | 0 (0.0%) |
| 80 to 84 Years | 0 (0.0%) | 0 (0.0%) |
| 85 Years and over | 0 (0.0%) | 7 (4.6%) |
| Total | 109 (100.0%) | 152 (100.0%) |
Families and Households in Fountain Springs
Median Family Size in Fountain Springs
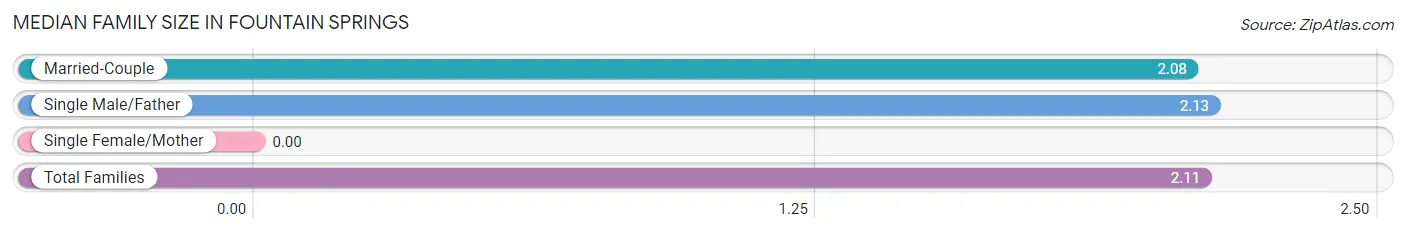
| Family Type | # Families | Family Size |
| Married-Couple | 25 (39.7%) | 2.08 |
| Single Male/Father | 38 (60.3%) | 2.13 |
| Single Female/Mother | 0 (0.0%) | - |
| Total Families | 63 (100.0%) | 2.11 |
Median Household Size in Fountain Springs
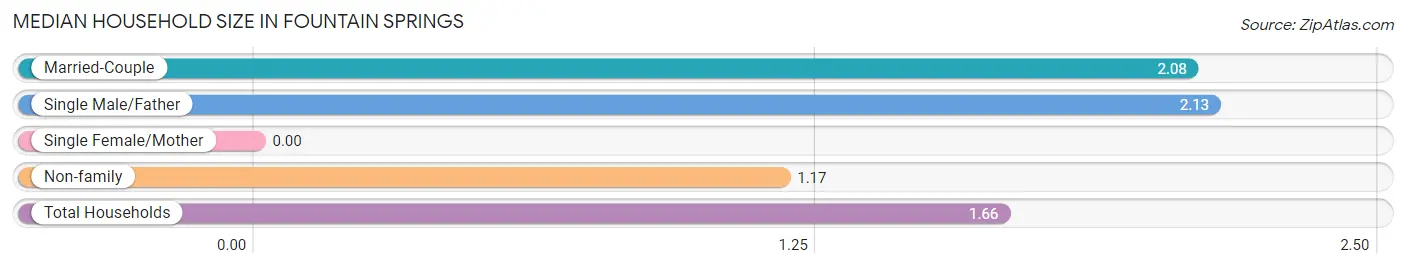
| Household Type | # Households | Household Size |
| Married-Couple | 25 (20.7%) | 2.08 |
| Single Male/Father | 38 (31.4%) | 2.13 |
| Single Female/Mother | 0 (0.0%) | - |
| Non-family | 58 (47.9%) | 1.17 |
| Total Households | 121 (100.0%) | 1.66 |
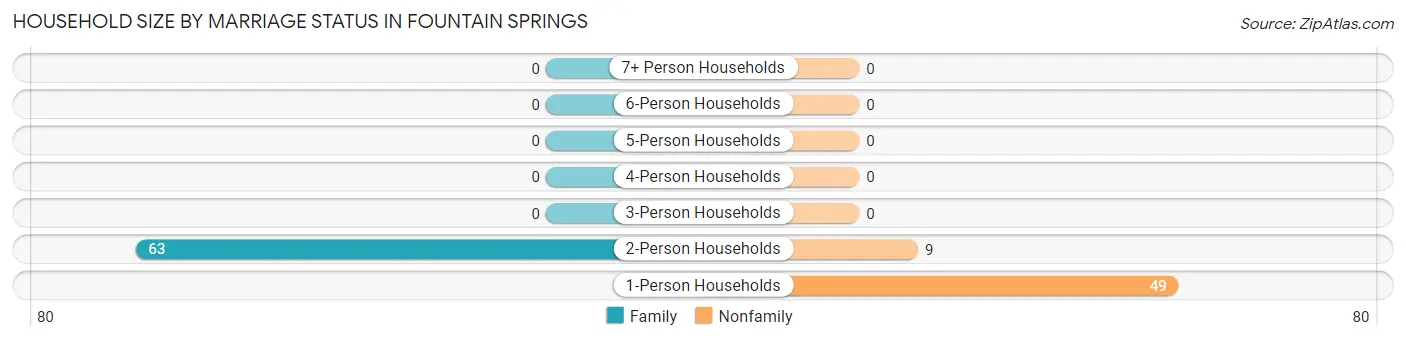
Household Size by Marriage Status in Fountain Springs
Out of a total of 121 households in Fountain Springs, 63 (52.1%) are family households, while 58 (47.9%) are nonfamily households. The most numerous type of family households are 2-person households, comprising 63, and the most common type of nonfamily households are 1-person households, comprising 49.
| Household Size | Family Households | Nonfamily Households |
| 1-Person Households | - | 49 (40.5%) |
| 2-Person Households | 63 (52.1%) | 9 (7.4%) |
| 3-Person Households | 0 (0.0%) | 0 (0.0%) |
| 4-Person Households | 0 (0.0%) | 0 (0.0%) |
| 5-Person Households | 0 (0.0%) | 0 (0.0%) |
| 6-Person Households | 0 (0.0%) | 0 (0.0%) |
| 7+ Person Households | 0 (0.0%) | 0 (0.0%) |
| Total | 63 (52.1%) | 58 (47.9%) |
Female Fertility in Fountain Springs
Fertility by Age in Fountain Springs
| Age Bracket | Women with Births | Births / 1,000 Women |
| 15 to 19 years | 0 (0.0%) | 0.0 |
| 20 to 34 years | 0 (0.0%) | 0.0 |
| 35 to 50 years | 0 (0.0%) | 0.0 |
| Total | 0 (0.0%) | 0.0 |
Fertility by Age by Marriage Status in Fountain Springs
| Age Bracket | Married | Unmarried |
| 15 to 19 years | 0 (0.0%) | 0 (0.0%) |
| 20 to 34 years | 0 (0.0%) | 0 (0.0%) |
| 35 to 50 years | 0 (0.0%) | 0 (0.0%) |
| Total | 0 (0.0%) | 0 (0.0%) |
Fertility by Education in Fountain Springs
| Educational Attainment | Women with Births | Births / 1,000 Women |
| Less than High School | 0 (0.0%) | 0.0 |
| High School Diploma | 0 (0.0%) | 0.0 |
| College or Associate's Degree | 0 (0.0%) | 0.0 |
| Bachelor's Degree | 0 (0.0%) | 0.0 |
| Graduate Degree | 0 (0.0%) | 0.0 |
| Total | 0 (0.0%) | 0.0 |
Fertility by Education by Marriage Status in Fountain Springs
| Educational Attainment | Married | Unmarried |
| Less than High School | 0 (0.0%) | 0 (0.0%) |
| High School Diploma | 0 (0.0%) | 0 (0.0%) |
| College or Associate's Degree | 0 (0.0%) | 0 (0.0%) |
| Bachelor's Degree | 0 (0.0%) | 0 (0.0%) |
| Graduate Degree | 0 (0.0%) | 0 (0.0%) |
| Total | 0 (0.0%) | 0 (0.0%) |
Employment Characteristics in Fountain Springs
Employment by Class of Employer in Fountain Springs
Among the 102 employed individuals in Fountain Springs, private company employees (72 | 70.6%), self-employed (incorporated) (16 | 15.7%), and local government employees (14 | 13.7%) make up the most common classes of employment.
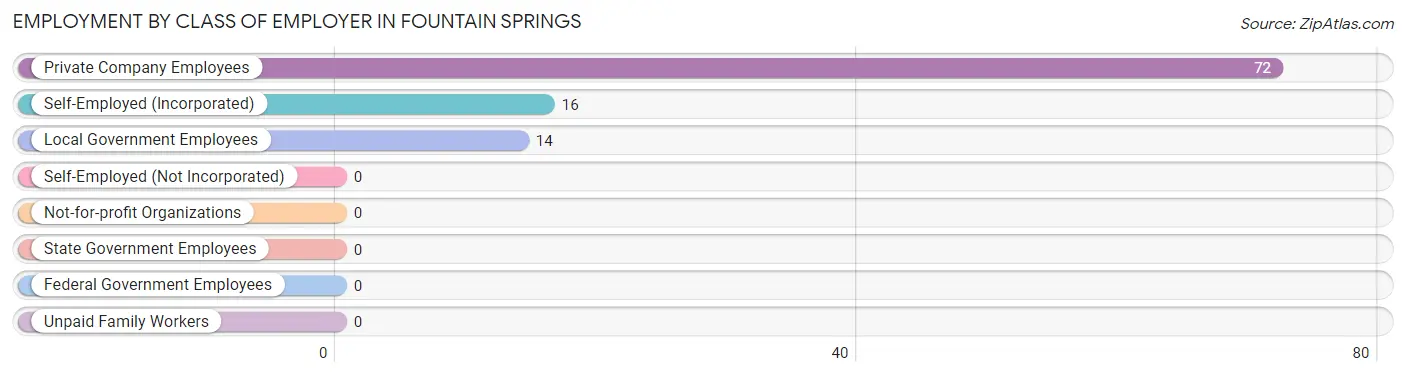
| Employer Class | # Employees | % Employees |
| Private Company Employees | 72 | 70.6% |
| Self-Employed (Incorporated) | 16 | 15.7% |
| Self-Employed (Not Incorporated) | 0 | 0.0% |
| Not-for-profit Organizations | 0 | 0.0% |
| Local Government Employees | 14 | 13.7% |
| State Government Employees | 0 | 0.0% |
| Federal Government Employees | 0 | 0.0% |
| Unpaid Family Workers | 0 | 0.0% |
| Total | 102 | 100.0% |
Employment Status by Age in Fountain Springs
According to the labor force statistics for Fountain Springs, out of the total population over 16 years of age (218), 58.3% or 127 individuals are in the labor force, with 9.4% or 12 of them unemployed. The age group with the highest labor force participation rate is 30 to 34 years, with 100.0% or 25 individuals in the labor force. Within the labor force, the 35 to 44 years age range has the highest percentage of unemployed individuals, with 30.8% or 12 of them being unemployed.
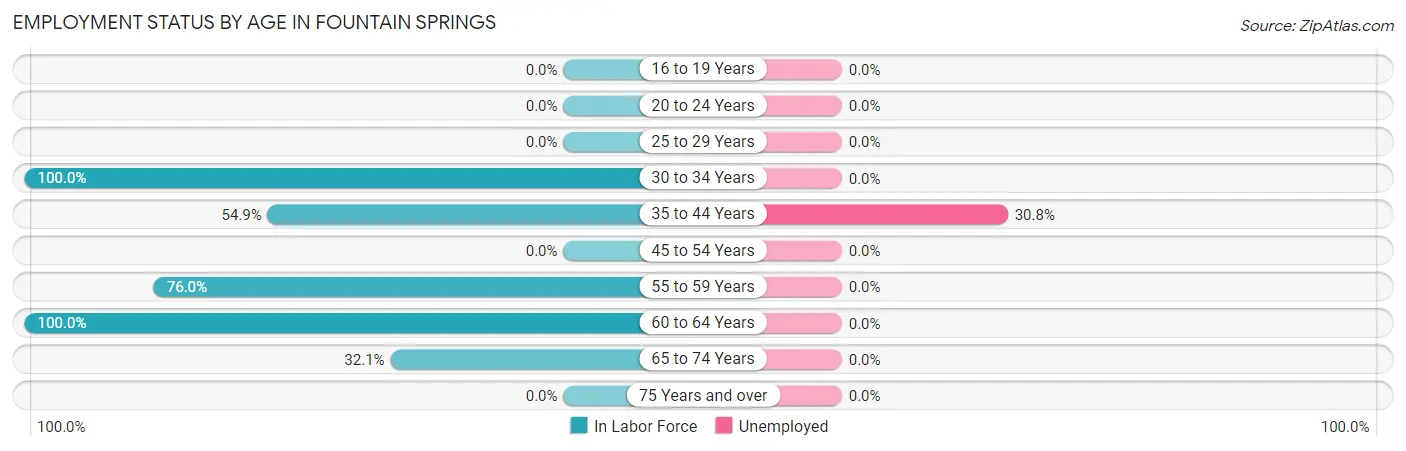
| Age Bracket | In Labor Force | Unemployed |
| 16 to 19 Years | 0 (0.0%) | 0 (0.0%) |
| 20 to 24 Years | 0 (0.0%) | 0 (0.0%) |
| 25 to 29 Years | 0 (0.0%) | 0 (0.0%) |
| 30 to 34 Years | 25 (100.0%) | 0 (0.0%) |
| 35 to 44 Years | 39 (54.9%) | 12 (30.8%) |
| 45 to 54 Years | 0 (0.0%) | 0 (0.0%) |
| 55 to 59 Years | 38 (76.0%) | 0 (0.0%) |
| 60 to 64 Years | 16 (100.0%) | 0 (0.0%) |
| 65 to 74 Years | 9 (32.1%) | 0 (0.0%) |
| 75 Years and over | 0 (0.0%) | 0 (0.0%) |
| Total | 127 (58.3%) | 12 (9.4%) |
Employment Status by Educational Attainment in Fountain Springs
According to labor force statistics for Fountain Springs, 64.5% of individuals (118) out of the total population between 25 and 64 years of age (183) are in the labor force, with 10.2% or 12 of them being unemployed. The group with the highest labor force participation rate are those with the educational attainment of college / associate degree, with 100.0% or 80 individuals in the labor force. Within the labor force, individuals with college / associate degree education have the highest percentage of unemployment, with 15.0% or 12 of them being unemployed.
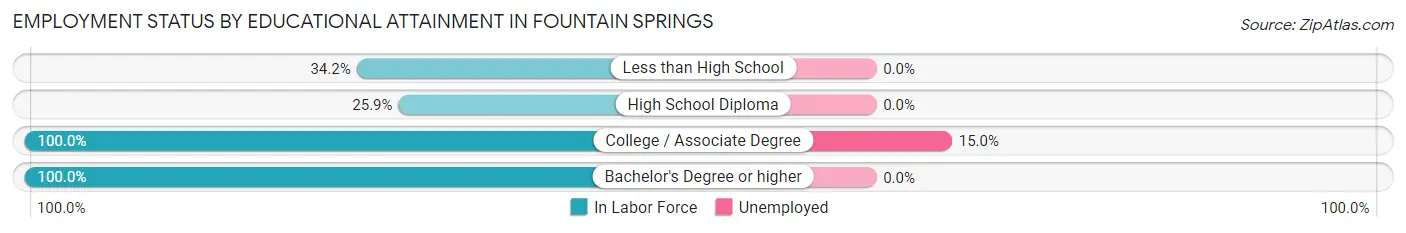
| Educational Attainment | In Labor Force | Unemployed |
| Less than High School | 13 (34.2%) | 0 (0.0%) |
| High School Diploma | 14 (25.9%) | 0 (0.0%) |
| College / Associate Degree | 80 (100.0%) | 12 (15.0%) |
| Bachelor's Degree or higher | 11 (100.0%) | 0 (0.0%) |
| Total | 118 (64.5%) | 19 (10.2%) |
Employment Occupations by Sex in Fountain Springs
Management, Business, Science and Arts Occupations
The most common Management, Business, Science and Arts occupations in Fountain Springs are Management (16 | 13.9%), Health Diagnosing & Treating (11 | 9.6%), and Health Technologists (11 | 9.6%).
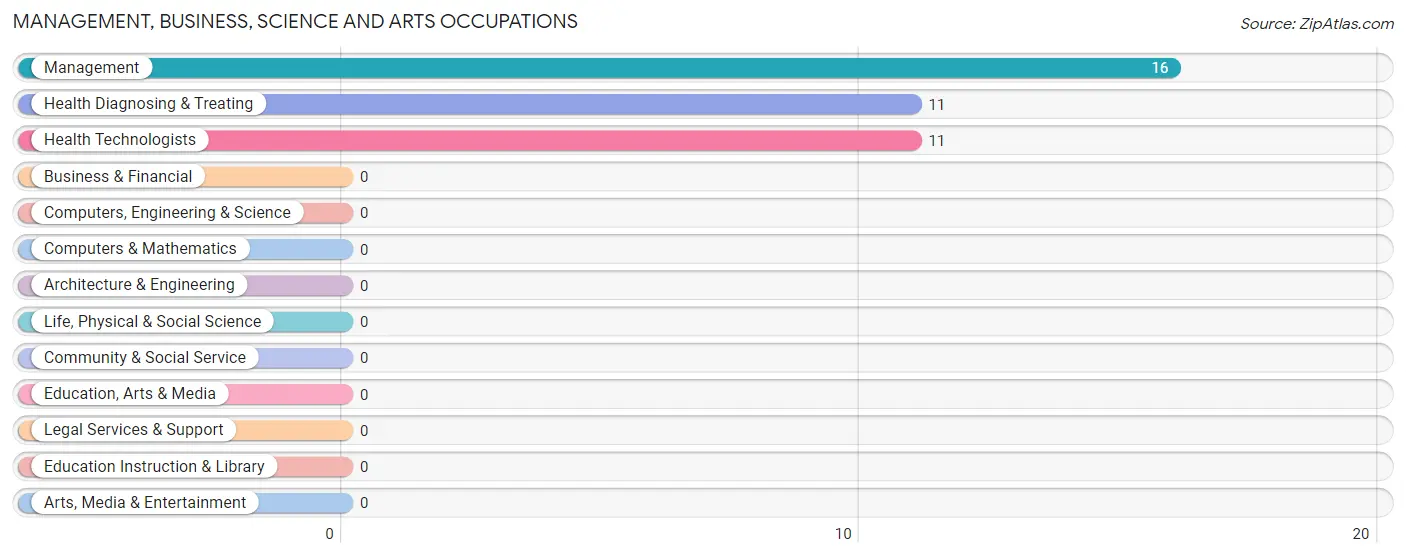
Management, Business, Science and Arts Occupations by Sex
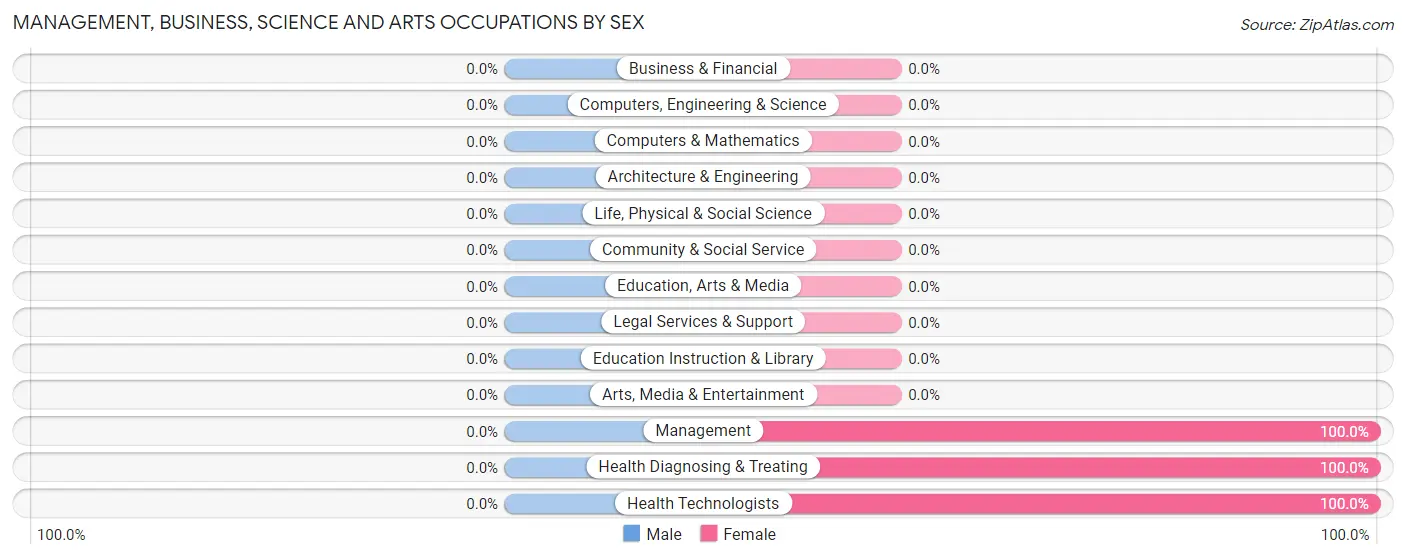
| Occupation | Male | Female |
| Management | 0 (0.0%) | 16 (100.0%) |
| Business & Financial | 0 (0.0%) | 0 (0.0%) |
| Computers, Engineering & Science | 0 (0.0%) | 0 (0.0%) |
| Computers & Mathematics | 0 (0.0%) | 0 (0.0%) |
| Architecture & Engineering | 0 (0.0%) | 0 (0.0%) |
| Life, Physical & Social Science | 0 (0.0%) | 0 (0.0%) |
| Community & Social Service | 0 (0.0%) | 0 (0.0%) |
| Education, Arts & Media | 0 (0.0%) | 0 (0.0%) |
| Legal Services & Support | 0 (0.0%) | 0 (0.0%) |
| Education Instruction & Library | 0 (0.0%) | 0 (0.0%) |
| Arts, Media & Entertainment | 0 (0.0%) | 0 (0.0%) |
| Health Diagnosing & Treating | 0 (0.0%) | 11 (100.0%) |
| Health Technologists | 0 (0.0%) | 11 (100.0%) |
| Total (Category) | 0 (0.0%) | 27 (100.0%) |
| Total (Overall) | 66 (57.4%) | 49 (42.6%) |
Services Occupations
The most common Services occupations in Fountain Springs are Security & Protection (14 | 12.2%), Law Enforcement (14 | 12.2%), and Food Preparation & Serving (13 | 11.3%).
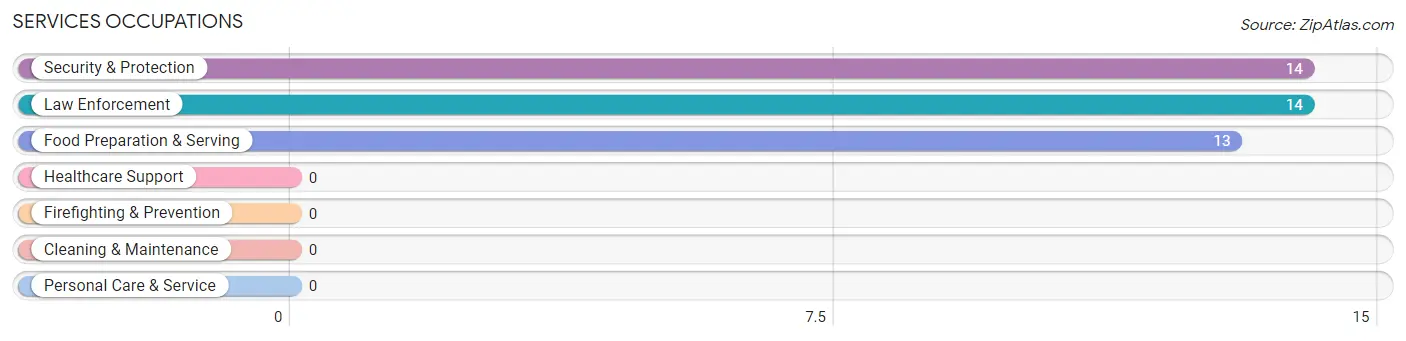
Services Occupations by Sex
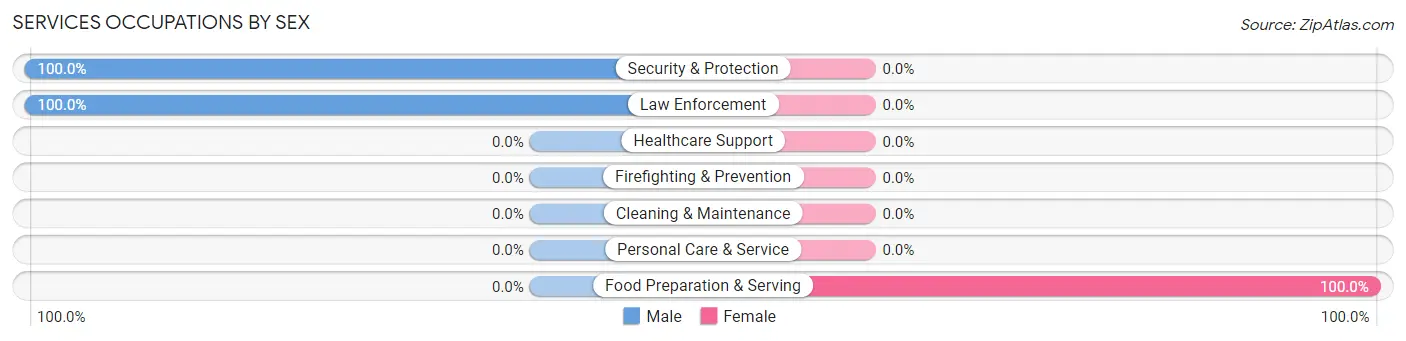
| Occupation | Male | Female |
| Healthcare Support | 0 (0.0%) | 0 (0.0%) |
| Security & Protection | 14 (100.0%) | 0 (0.0%) |
| Firefighting & Prevention | 0 (0.0%) | 0 (0.0%) |
| Law Enforcement | 14 (100.0%) | 0 (0.0%) |
| Food Preparation & Serving | 0 (0.0%) | 13 (100.0%) |
| Cleaning & Maintenance | 0 (0.0%) | 0 (0.0%) |
| Personal Care & Service | 0 (0.0%) | 0 (0.0%) |
| Total (Category) | 14 (51.8%) | 13 (48.1%) |
| Total (Overall) | 66 (57.4%) | 49 (42.6%) |
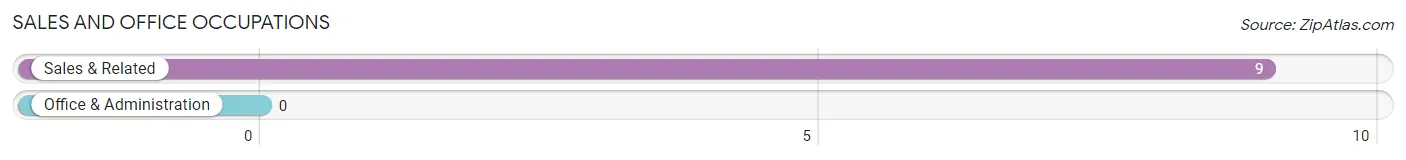
Sales and Office Occupations
The most common Sales and Office occupations in Fountain Springs are , and Sales & Related (9 | 7.8%).
Sales and Office Occupations by Sex
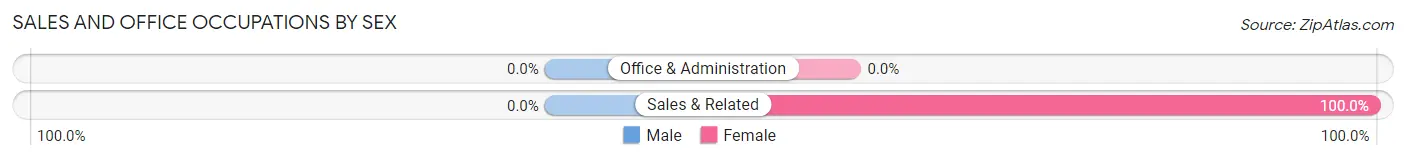
| Occupation | Male | Female |
| Sales & Related | 0 (0.0%) | 9 (100.0%) |
| Office & Administration | 0 (0.0%) | 0 (0.0%) |
| Total (Category) | 0 (0.0%) | 9 (100.0%) |
| Total (Overall) | 66 (57.4%) | 49 (42.6%) |
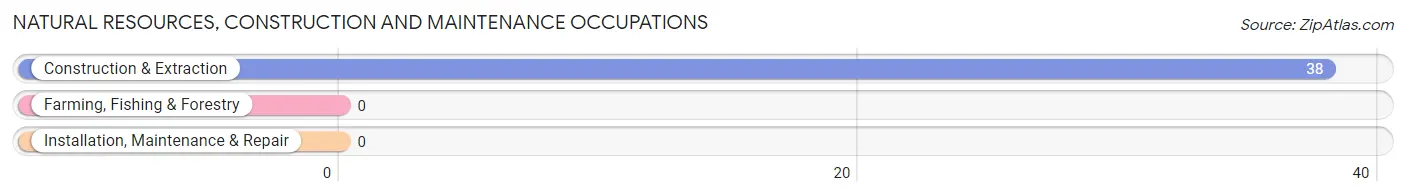
Natural Resources, Construction and Maintenance Occupations
The most common Natural Resources, Construction and Maintenance occupations in Fountain Springs are , and Construction & Extraction (38 | 33.0%).
Natural Resources, Construction and Maintenance Occupations by Sex
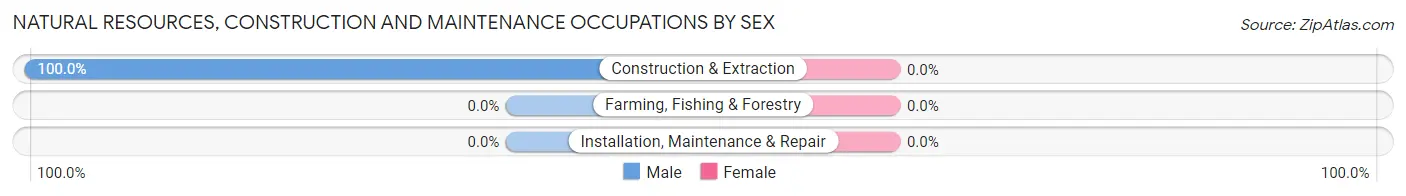
| Occupation | Male | Female |
| Farming, Fishing & Forestry | 0 (0.0%) | 0 (0.0%) |
| Construction & Extraction | 38 (100.0%) | 0 (0.0%) |
| Installation, Maintenance & Repair | 0 (0.0%) | 0 (0.0%) |
| Total (Category) | 38 (100.0%) | 0 (0.0%) |
| Total (Overall) | 66 (57.4%) | 49 (42.6%) |
Production, Transportation and Moving Occupations
The most common Production, Transportation and Moving occupations in Fountain Springs are , and Transportation (14 | 12.2%).
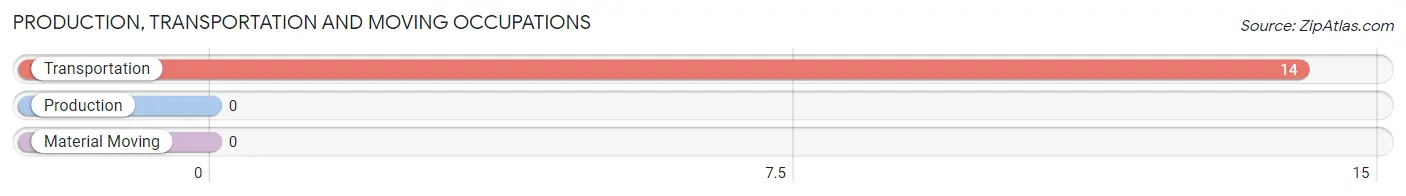
Production, Transportation and Moving Occupations by Sex
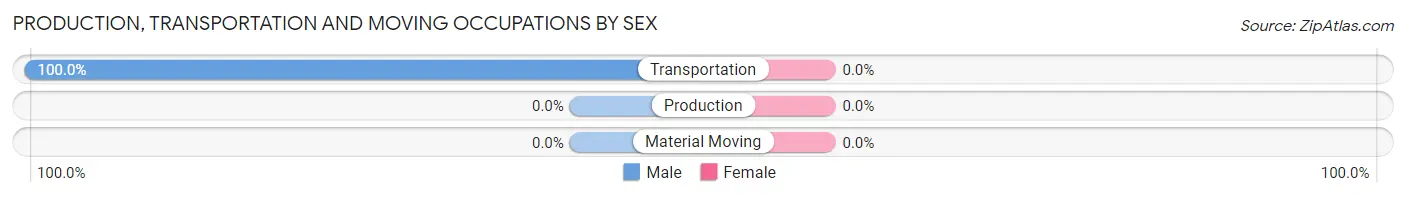
| Occupation | Male | Female |
| Production | 0 (0.0%) | 0 (0.0%) |
| Transportation | 14 (100.0%) | 0 (0.0%) |
| Material Moving | 0 (0.0%) | 0 (0.0%) |
| Total (Category) | 14 (100.0%) | 0 (0.0%) |
| Total (Overall) | 66 (57.4%) | 49 (42.6%) |
Employment Industries by Sex in Fountain Springs
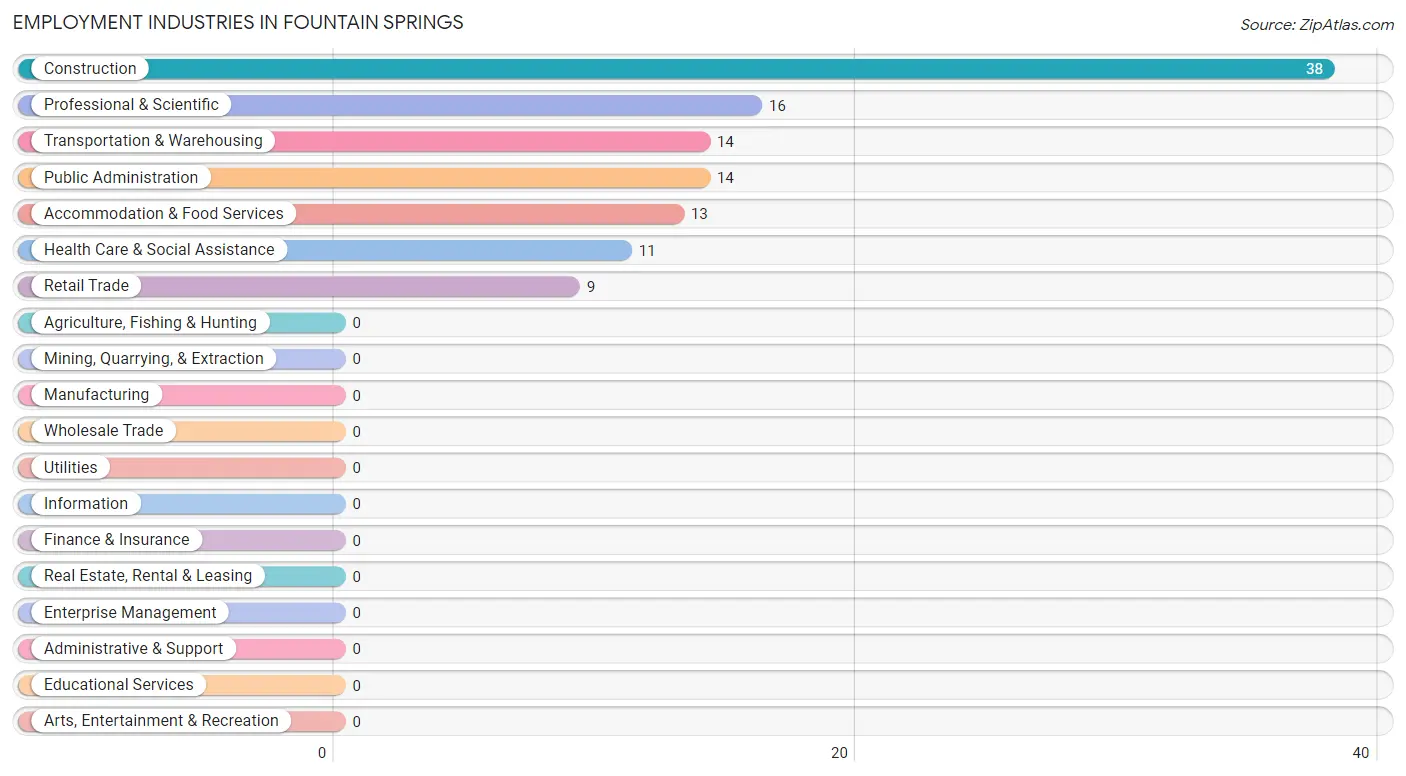
Employment Industries in Fountain Springs
The major employment industries in Fountain Springs include Construction (38 | 33.0%), Professional & Scientific (16 | 13.9%), Transportation & Warehousing (14 | 12.2%), Public Administration (14 | 12.2%), and Accommodation & Food Services (13 | 11.3%).
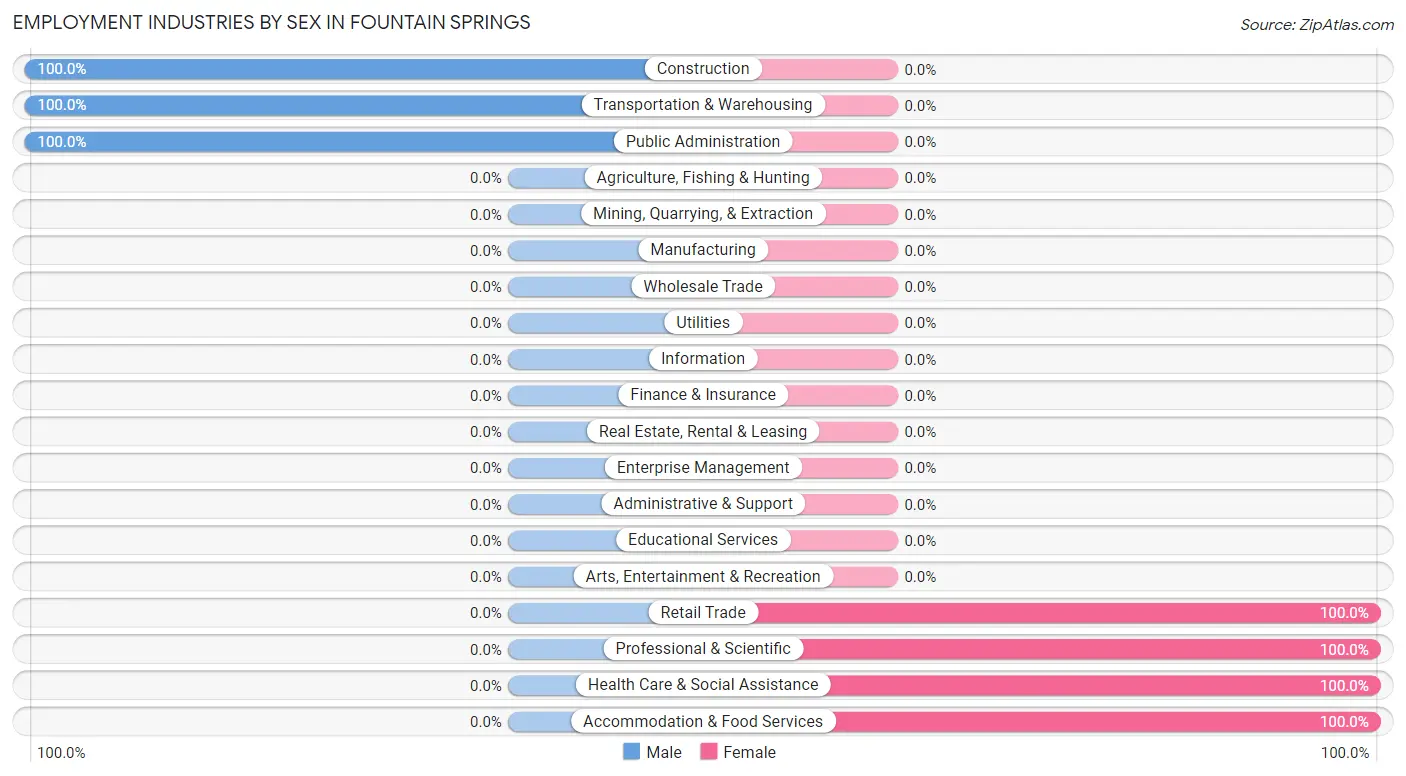
Employment Industries by Sex in Fountain Springs
The Fountain Springs industries that see more men than women are Construction (100.0%), Transportation & Warehousing (100.0%), and Public Administration (100.0%), whereas the industries that tend to have a higher number of women are Retail Trade (100.0%), Professional & Scientific (100.0%), and Health Care & Social Assistance (100.0%).
| Industry | Male | Female |
| Agriculture, Fishing & Hunting | 0 (0.0%) | 0 (0.0%) |
| Mining, Quarrying, & Extraction | 0 (0.0%) | 0 (0.0%) |
| Construction | 38 (100.0%) | 0 (0.0%) |
| Manufacturing | 0 (0.0%) | 0 (0.0%) |
| Wholesale Trade | 0 (0.0%) | 0 (0.0%) |
| Retail Trade | 0 (0.0%) | 9 (100.0%) |
| Transportation & Warehousing | 14 (100.0%) | 0 (0.0%) |
| Utilities | 0 (0.0%) | 0 (0.0%) |
| Information | 0 (0.0%) | 0 (0.0%) |
| Finance & Insurance | 0 (0.0%) | 0 (0.0%) |
| Real Estate, Rental & Leasing | 0 (0.0%) | 0 (0.0%) |
| Professional & Scientific | 0 (0.0%) | 16 (100.0%) |
| Enterprise Management | 0 (0.0%) | 0 (0.0%) |
| Administrative & Support | 0 (0.0%) | 0 (0.0%) |
| Educational Services | 0 (0.0%) | 0 (0.0%) |
| Health Care & Social Assistance | 0 (0.0%) | 11 (100.0%) |
| Arts, Entertainment & Recreation | 0 (0.0%) | 0 (0.0%) |
| Accommodation & Food Services | 0 (0.0%) | 13 (100.0%) |
| Public Administration | 14 (100.0%) | 0 (0.0%) |
| Total | 66 (57.4%) | 49 (42.6%) |
Education in Fountain Springs
School Enrollment in Fountain Springs
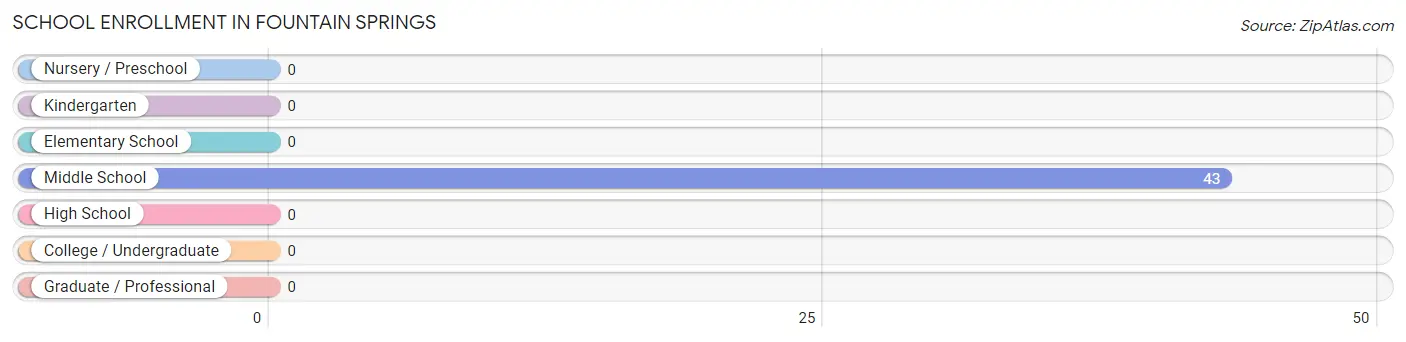
| School Level | # Students | % Students |
| Nursery / Preschool | 0 | 0.0% |
| Kindergarten | 0 | 0.0% |
| Elementary School | 0 | 0.0% |
| Middle School | 43 | 100.0% |
| High School | 0 | 0.0% |
| College / Undergraduate | 0 | 0.0% |
| Graduate / Professional | 0 | 0.0% |
| Total | 43 | 100.0% |
School Enrollment by Age by Funding Source in Fountain Springs
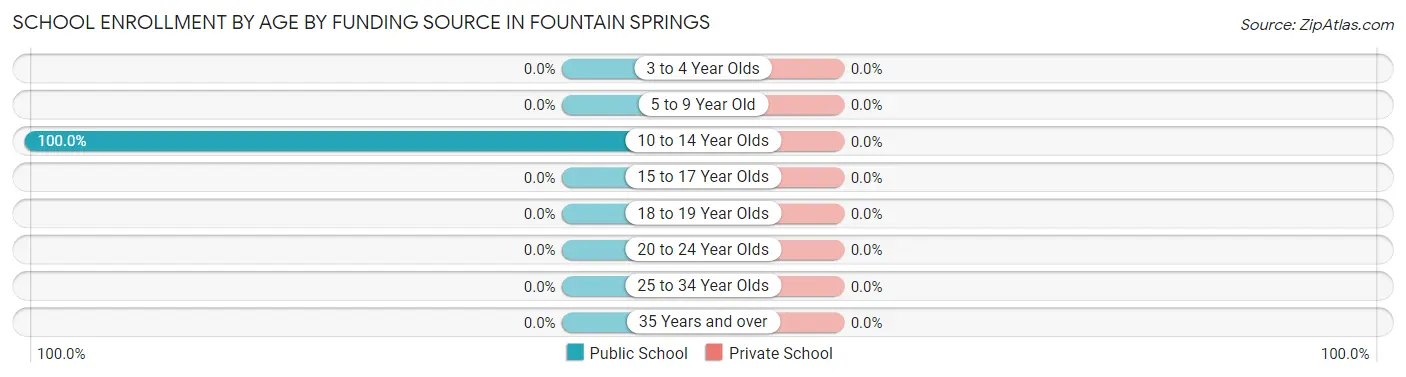
| Age Bracket | Public School | Private School |
| 3 to 4 Year Olds | 0 (0.0%) | 0 (0.0%) |
| 5 to 9 Year Old | 0 (0.0%) | 0 (0.0%) |
| 10 to 14 Year Olds | 43 (100.0%) | 0 (0.0%) |
| 15 to 17 Year Olds | 0 (0.0%) | 0 (0.0%) |
| 18 to 19 Year Olds | 0 (0.0%) | 0 (0.0%) |
| 20 to 24 Year Olds | 0 (0.0%) | 0 (0.0%) |
| 25 to 34 Year Olds | 0 (0.0%) | 0 (0.0%) |
| 35 Years and over | 0 (0.0%) | 0 (0.0%) |
| Total | 43 (100.0%) | 0 (0.0%) |
Educational Attainment by Field of Study in Fountain Springs
, and science & technology (11 | 100.0%) are the most common fields of study among 11 individuals in Fountain Springs who have obtained a bachelor's degree or higher.
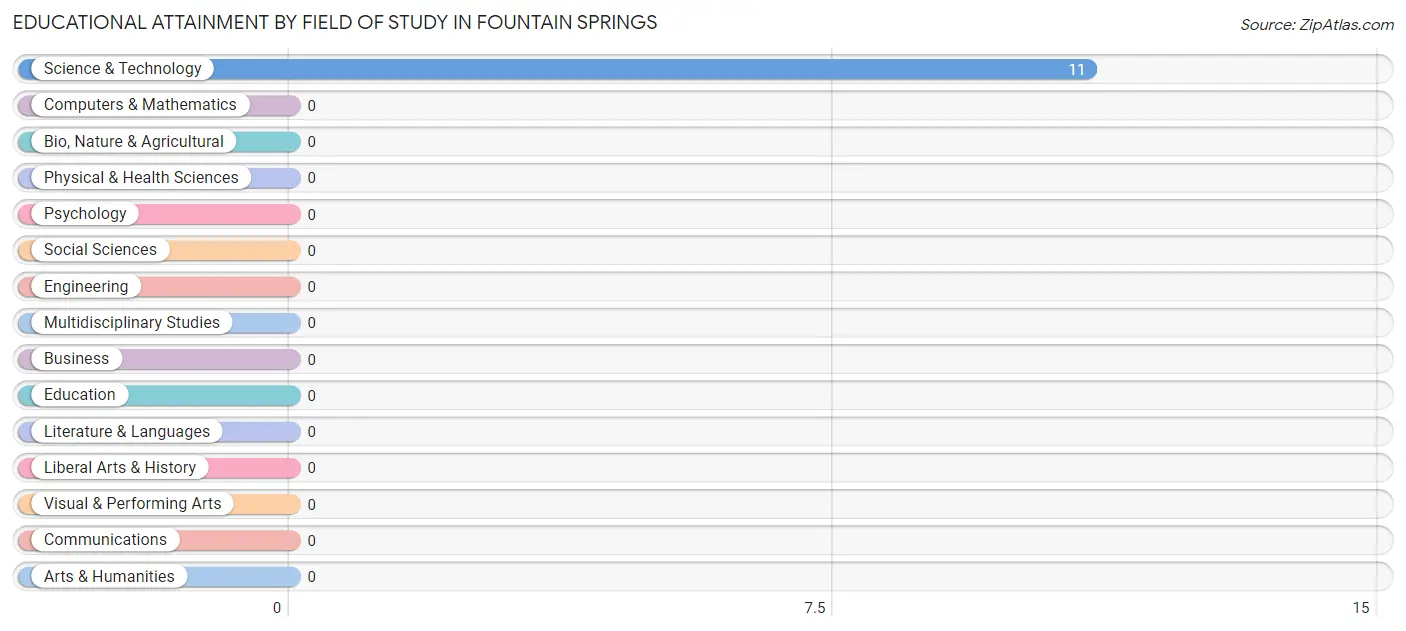
| Field of Study | # Graduates | % Graduates |
| Computers & Mathematics | 0 | 0.0% |
| Bio, Nature & Agricultural | 0 | 0.0% |
| Physical & Health Sciences | 0 | 0.0% |
| Psychology | 0 | 0.0% |
| Social Sciences | 0 | 0.0% |
| Engineering | 0 | 0.0% |
| Multidisciplinary Studies | 0 | 0.0% |
| Science & Technology | 11 | 100.0% |
| Business | 0 | 0.0% |
| Education | 0 | 0.0% |
| Literature & Languages | 0 | 0.0% |
| Liberal Arts & History | 0 | 0.0% |
| Visual & Performing Arts | 0 | 0.0% |
| Communications | 0 | 0.0% |
| Arts & Humanities | 0 | 0.0% |
| Total | 11 | 100.0% |
Transportation & Commute in Fountain Springs
Vehicle Availability by Sex in Fountain Springs
The most prevalent vehicle ownership categories in Fountain Springs are males with 2 vehicles (52, accounting for 78.8%) and females with 2 vehicles (20, making up 144.4%).
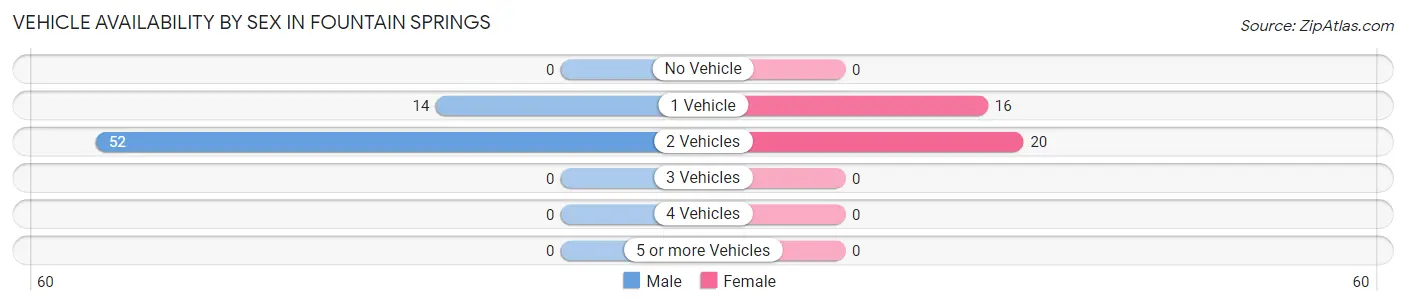
| Vehicles Available | Male | Female |
| No Vehicle | 0 (0.0%) | 0 (0.0%) |
| 1 Vehicle | 14 (21.2%) | 16 (44.4%) |
| 2 Vehicles | 52 (78.8%) | 20 (55.6%) |
| 3 Vehicles | 0 (0.0%) | 0 (0.0%) |
| 4 Vehicles | 0 (0.0%) | 0 (0.0%) |
| 5 or more Vehicles | 0 (0.0%) | 0 (0.0%) |
| Total | 66 (100.0%) | 36 (100.0%) |
Commute Time in Fountain Springs
The most frequently occuring commute durations in Fountain Springs are 15 to 19 minutes (52 commuters, 51.0%), 10 to 14 minutes (16 commuters, 15.7%), and 45 to 59 minutes (14 commuters, 13.7%).
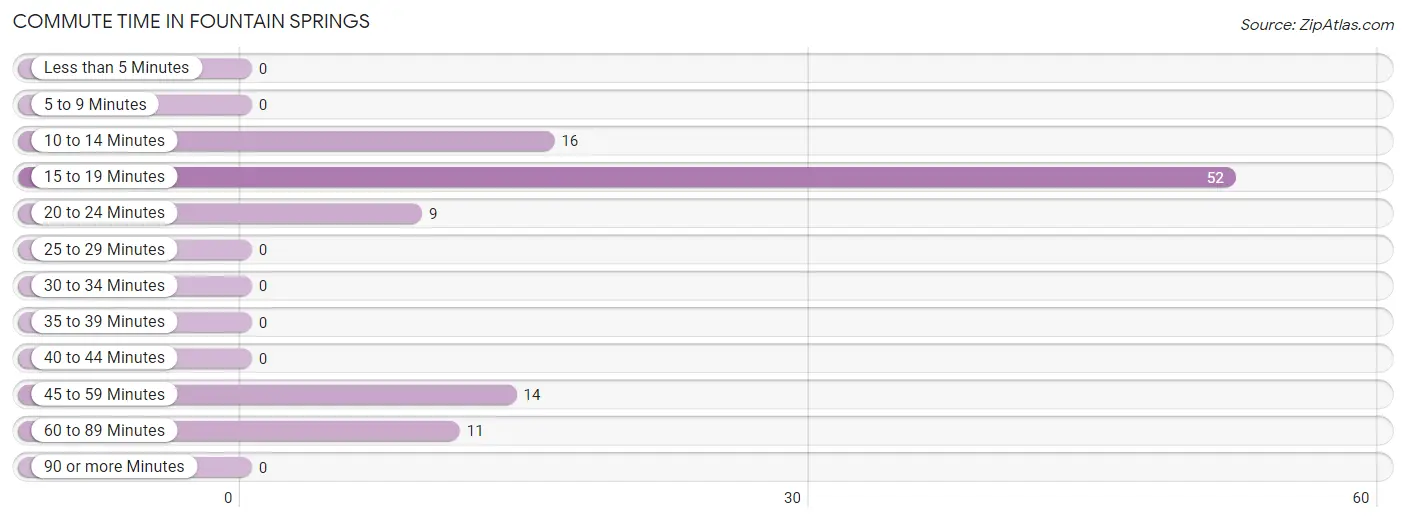
| Commute Time | # Commuters | % Commuters |
| Less than 5 Minutes | 0 | 0.0% |
| 5 to 9 Minutes | 0 | 0.0% |
| 10 to 14 Minutes | 16 | 15.7% |
| 15 to 19 Minutes | 52 | 51.0% |
| 20 to 24 Minutes | 9 | 8.8% |
| 25 to 29 Minutes | 0 | 0.0% |
| 30 to 34 Minutes | 0 | 0.0% |
| 35 to 39 Minutes | 0 | 0.0% |
| 40 to 44 Minutes | 0 | 0.0% |
| 45 to 59 Minutes | 14 | 13.7% |
| 60 to 89 Minutes | 11 | 10.8% |
| 90 or more Minutes | 0 | 0.0% |
Commute Time by Sex in Fountain Springs
The most common commute times in Fountain Springs are 15 to 19 minutes (52 commuters, 78.8%) for males and 10 to 14 minutes (16 commuters, 44.4%) for females.
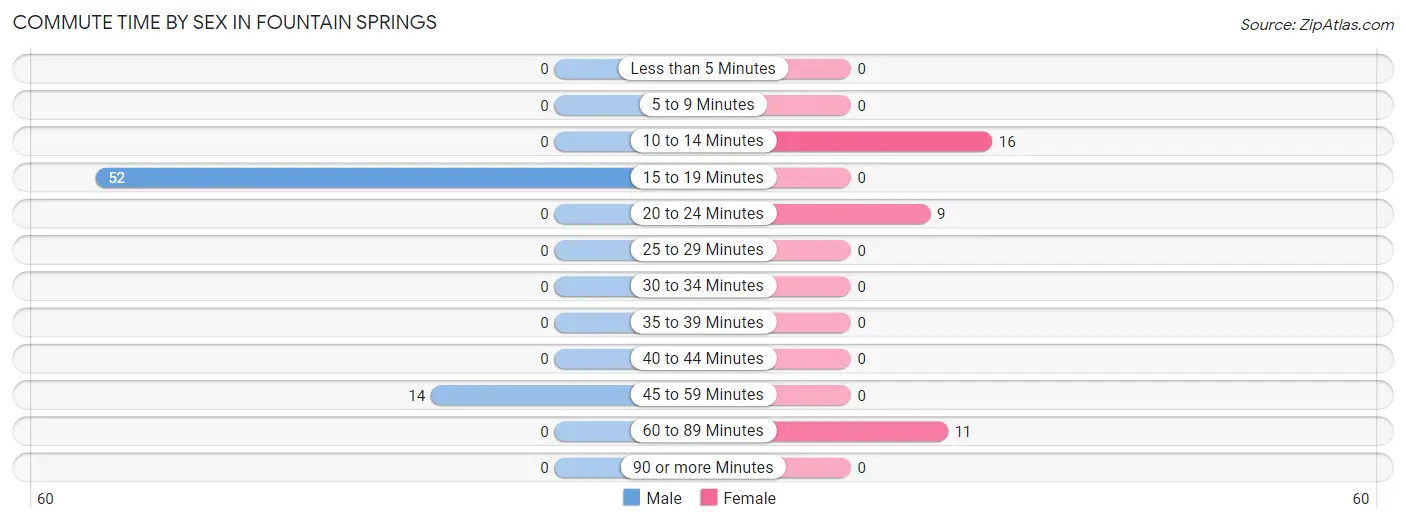
| Commute Time | Male | Female |
| Less than 5 Minutes | 0 (0.0%) | 0 (0.0%) |
| 5 to 9 Minutes | 0 (0.0%) | 0 (0.0%) |
| 10 to 14 Minutes | 0 (0.0%) | 16 (44.4%) |
| 15 to 19 Minutes | 52 (78.8%) | 0 (0.0%) |
| 20 to 24 Minutes | 0 (0.0%) | 9 (25.0%) |
| 25 to 29 Minutes | 0 (0.0%) | 0 (0.0%) |
| 30 to 34 Minutes | 0 (0.0%) | 0 (0.0%) |
| 35 to 39 Minutes | 0 (0.0%) | 0 (0.0%) |
| 40 to 44 Minutes | 0 (0.0%) | 0 (0.0%) |
| 45 to 59 Minutes | 14 (21.2%) | 0 (0.0%) |
| 60 to 89 Minutes | 0 (0.0%) | 11 (30.6%) |
| 90 or more Minutes | 0 (0.0%) | 0 (0.0%) |
Time of Departure to Work by Sex in Fountain Springs
The most frequent times of departure to work in Fountain Springs are 5:30 AM to 5:59 AM (38, 57.6%) for males and 8:00 AM to 8:29 AM (16, 44.4%) for females.
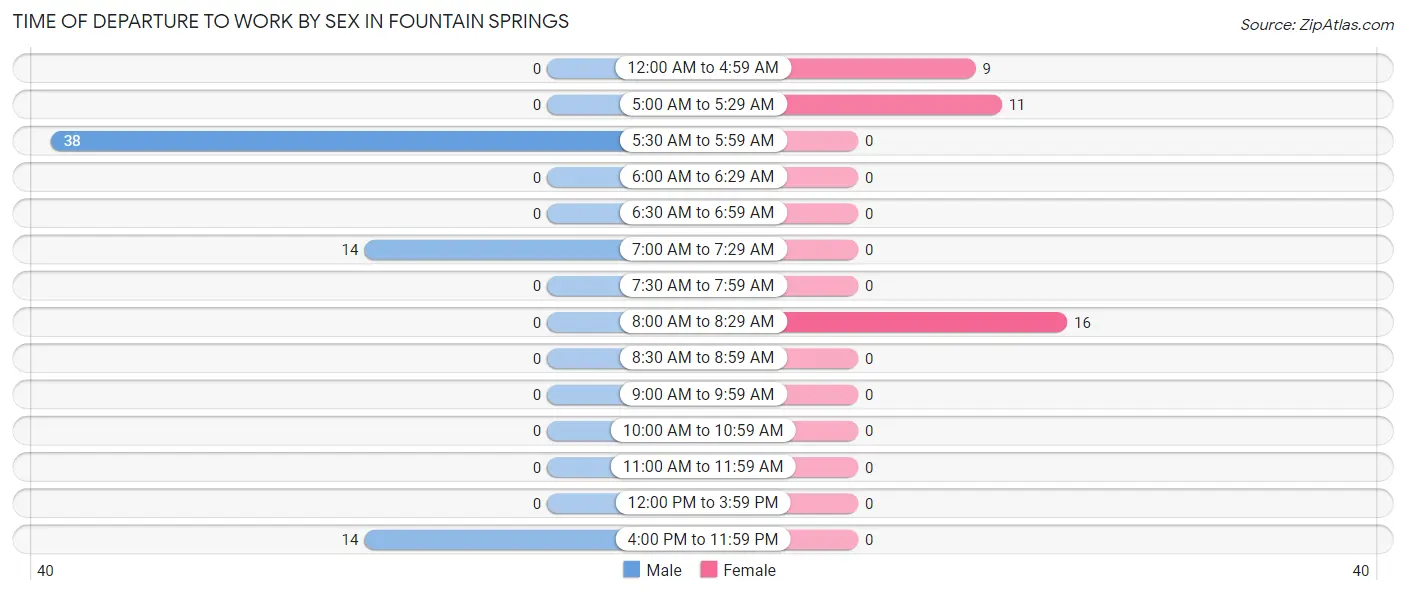
| Time of Departure | Male | Female |
| 12:00 AM to 4:59 AM | 0 (0.0%) | 9 (25.0%) |
| 5:00 AM to 5:29 AM | 0 (0.0%) | 11 (30.6%) |
| 5:30 AM to 5:59 AM | 38 (57.6%) | 0 (0.0%) |
| 6:00 AM to 6:29 AM | 0 (0.0%) | 0 (0.0%) |
| 6:30 AM to 6:59 AM | 0 (0.0%) | 0 (0.0%) |
| 7:00 AM to 7:29 AM | 14 (21.2%) | 0 (0.0%) |
| 7:30 AM to 7:59 AM | 0 (0.0%) | 0 (0.0%) |
| 8:00 AM to 8:29 AM | 0 (0.0%) | 16 (44.4%) |
| 8:30 AM to 8:59 AM | 0 (0.0%) | 0 (0.0%) |
| 9:00 AM to 9:59 AM | 0 (0.0%) | 0 (0.0%) |
| 10:00 AM to 10:59 AM | 0 (0.0%) | 0 (0.0%) |
| 11:00 AM to 11:59 AM | 0 (0.0%) | 0 (0.0%) |
| 12:00 PM to 3:59 PM | 0 (0.0%) | 0 (0.0%) |
| 4:00 PM to 11:59 PM | 14 (21.2%) | 0 (0.0%) |
| Total | 66 (100.0%) | 36 (100.0%) |
Housing Occupancy in Fountain Springs
Occupancy by Ownership in Fountain Springs
Of the total 121 dwellings in Fountain Springs, owner-occupied units account for 121 (100.0%), while renter-occupied units make up 0 (0.0%).
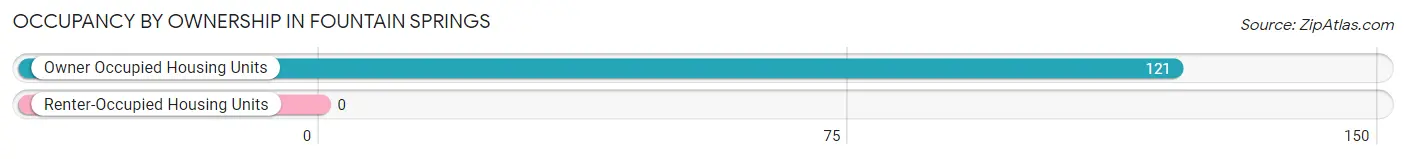
| Occupancy | # Housing Units | % Housing Units |
| Owner Occupied Housing Units | 121 | 100.0% |
| Renter-Occupied Housing Units | 0 | 0.0% |
| Total Occupied Housing Units | 121 | 100.0% |
Occupancy by Household Size in Fountain Springs
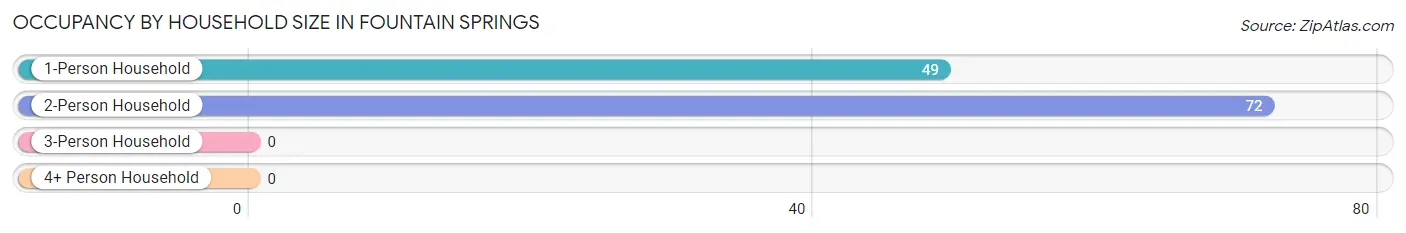
| Household Size | # Housing Units | % Housing Units |
| 1-Person Household | 49 | 40.5% |
| 2-Person Household | 72 | 59.5% |
| 3-Person Household | 0 | 0.0% |
| 4+ Person Household | 0 | 0.0% |
| Total Housing Units | 121 | 100.0% |
Occupancy by Ownership by Household Size in Fountain Springs
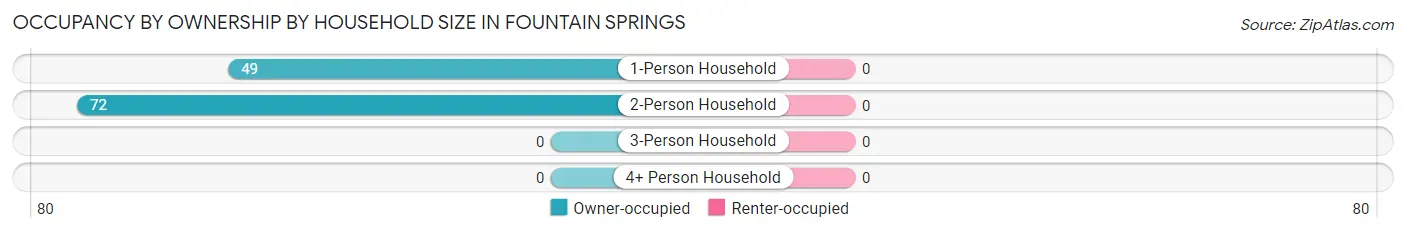
| Household Size | Owner-occupied | Renter-occupied |
| 1-Person Household | 49 (100.0%) | 0 (0.0%) |
| 2-Person Household | 72 (100.0%) | 0 (0.0%) |
| 3-Person Household | 0 (0.0%) | 0 (0.0%) |
| 4+ Person Household | 0 (0.0%) | 0 (0.0%) |
| Total Housing Units | 121 (100.0%) | 0 (0.0%) |
Occupancy by Educational Attainment in Fountain Springs
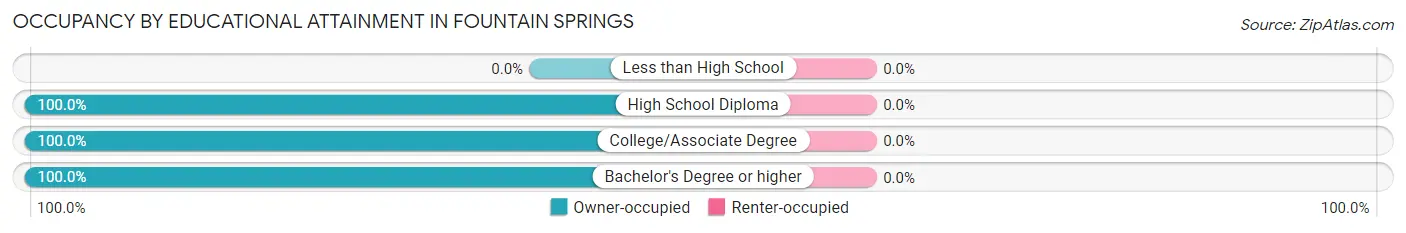
| Household Size | Owner-occupied | Renter-occupied |
| Less than High School | 0 (0.0%) | 0 (0.0%) |
| High School Diploma | 44 (100.0%) | 0 (0.0%) |
| College/Associate Degree | 66 (100.0%) | 0 (0.0%) |
| Bachelor's Degree or higher | 11 (100.0%) | 0 (0.0%) |
Occupancy by Age of Householder in Fountain Springs
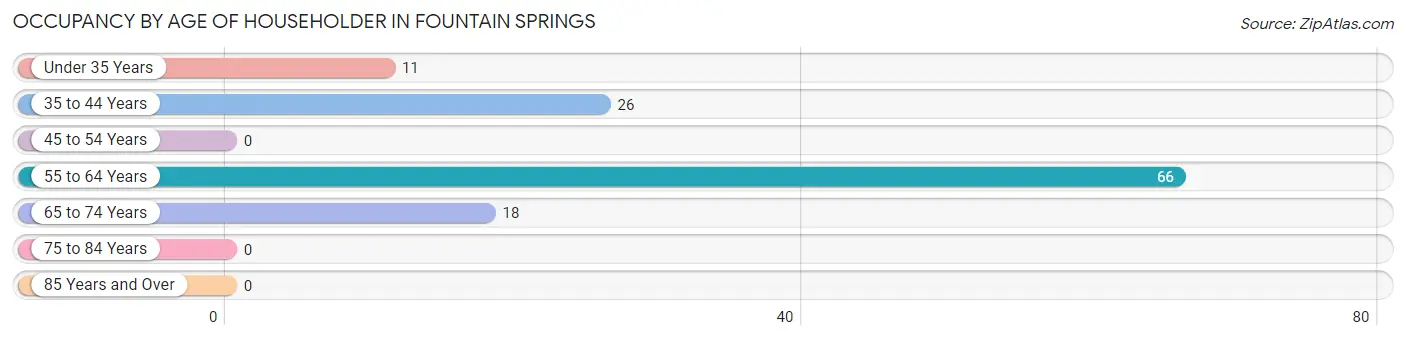
| Age Bracket | # Households | % Households |
| Under 35 Years | 11 | 9.1% |
| 35 to 44 Years | 26 | 21.5% |
| 45 to 54 Years | 0 | 0.0% |
| 55 to 64 Years | 66 | 54.5% |
| 65 to 74 Years | 18 | 14.9% |
| 75 to 84 Years | 0 | 0.0% |
| 85 Years and Over | 0 | 0.0% |
| Total | 121 | 100.0% |
Housing Finances in Fountain Springs
Median Income by Occupancy in Fountain Springs
| Occupancy Type | # Households | Median Income |
| Owner-Occupied | 121 (100.0%) | $0 |
| Renter-Occupied | 0 (0.0%) | $0 |
| Average | 121 (100.0%) | $0 |
Occupancy by Householder Income Bracket in Fountain Springs
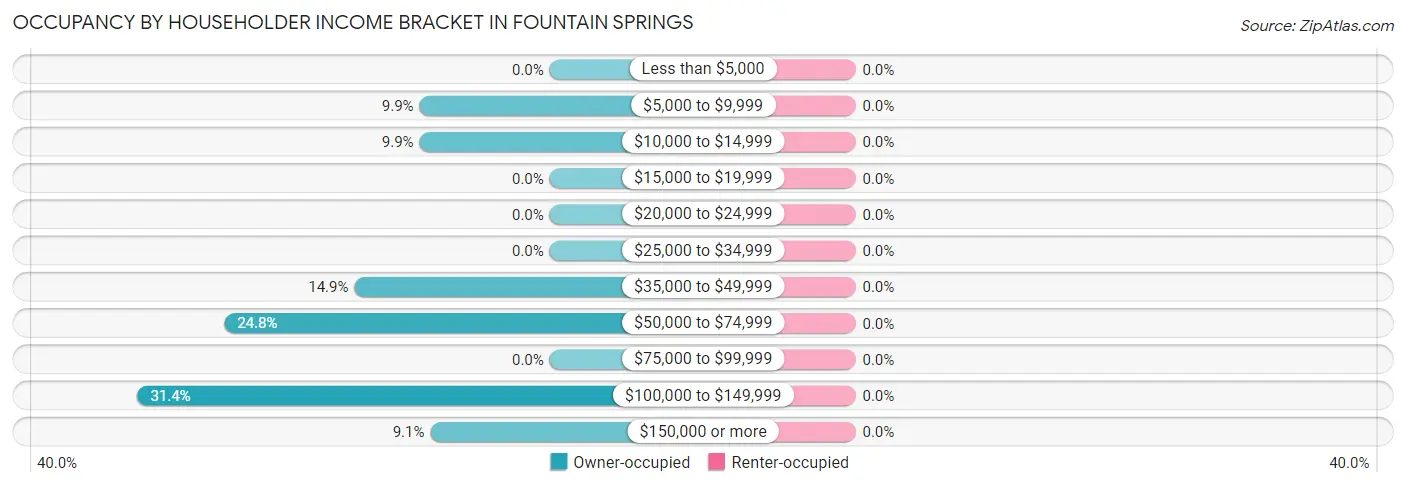
| Income Bracket | Owner-occupied | Renter-occupied |
| Less than $5,000 | 0 (0.0%) | 0 (0.0%) |
| $5,000 to $9,999 | 12 (9.9%) | 0 (0.0%) |
| $10,000 to $14,999 | 12 (9.9%) | 0 (0.0%) |
| $15,000 to $19,999 | 0 (0.0%) | 0 (0.0%) |
| $20,000 to $24,999 | 0 (0.0%) | 0 (0.0%) |
| $25,000 to $34,999 | 0 (0.0%) | 0 (0.0%) |
| $35,000 to $49,999 | 18 (14.9%) | 0 (0.0%) |
| $50,000 to $74,999 | 30 (24.8%) | 0 (0.0%) |
| $75,000 to $99,999 | 0 (0.0%) | 0 (0.0%) |
| $100,000 to $149,999 | 38 (31.4%) | 0 (0.0%) |
| $150,000 or more | 11 (9.1%) | 0 (0.0%) |
| Total | 121 (100.0%) | 0 (0.0%) |
Monthly Housing Cost Tiers in Fountain Springs
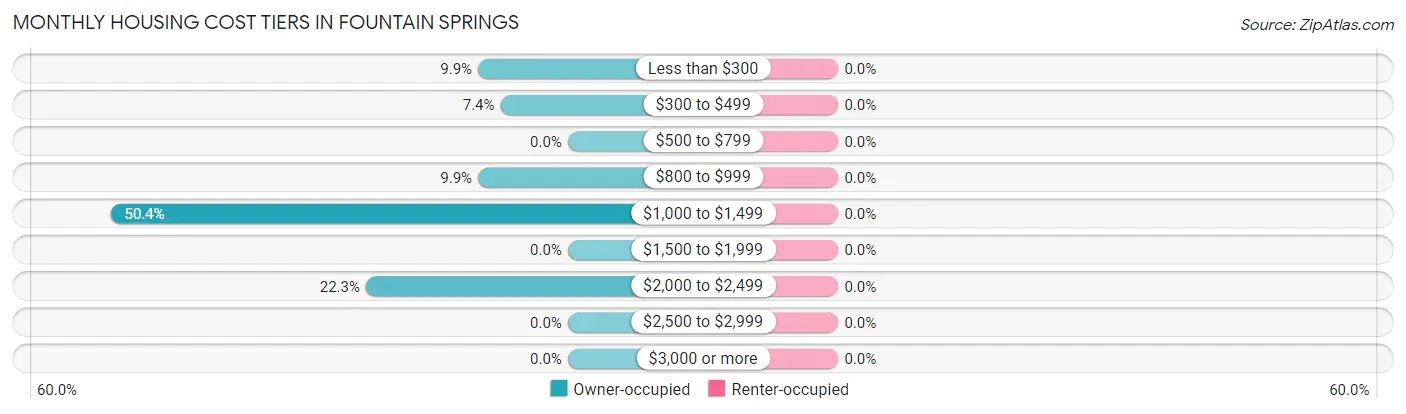
| Monthly Cost | Owner-occupied | Renter-occupied |
| Less than $300 | 12 (9.9%) | 0 (0.0%) |
| $300 to $499 | 9 (7.4%) | 0 (0.0%) |
| $500 to $799 | 0 (0.0%) | 0 (0.0%) |
| $800 to $999 | 12 (9.9%) | 0 (0.0%) |
| $1,000 to $1,499 | 61 (50.4%) | 0 (0.0%) |
| $1,500 to $1,999 | 0 (0.0%) | 0 (0.0%) |
| $2,000 to $2,499 | 27 (22.3%) | 0 (0.0%) |
| $2,500 to $2,999 | 0 (0.0%) | 0 (0.0%) |
| $3,000 or more | 0 (0.0%) | 0 (0.0%) |
| Total | 121 (100.0%) | 0 (0.0%) |
Physical Housing Characteristics in Fountain Springs
Housing Structures in Fountain Springs
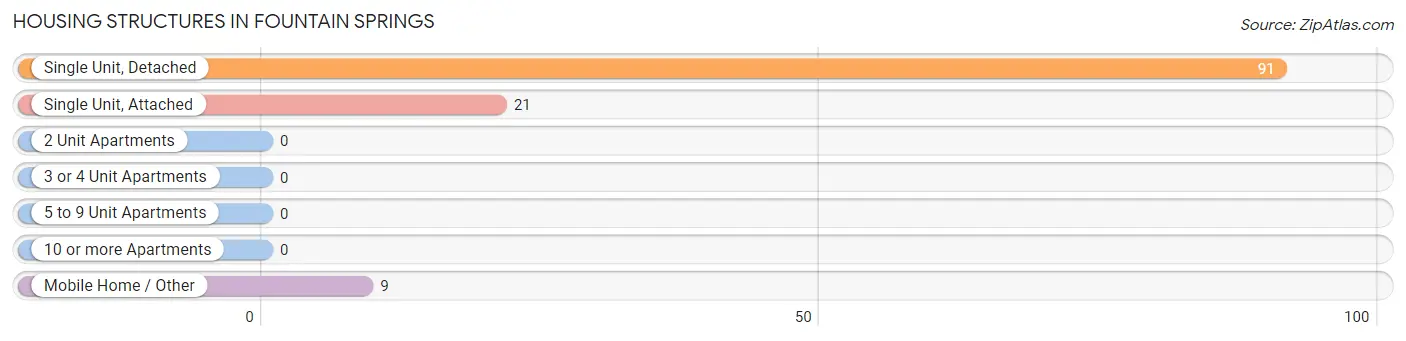
| Structure Type | # Housing Units | % Housing Units |
| Single Unit, Detached | 91 | 75.2% |
| Single Unit, Attached | 21 | 17.4% |
| 2 Unit Apartments | 0 | 0.0% |
| 3 or 4 Unit Apartments | 0 | 0.0% |
| 5 to 9 Unit Apartments | 0 | 0.0% |
| 10 or more Apartments | 0 | 0.0% |
| Mobile Home / Other | 9 | 7.4% |
| Total | 121 | 100.0% |
Housing Structures by Occupancy in Fountain Springs
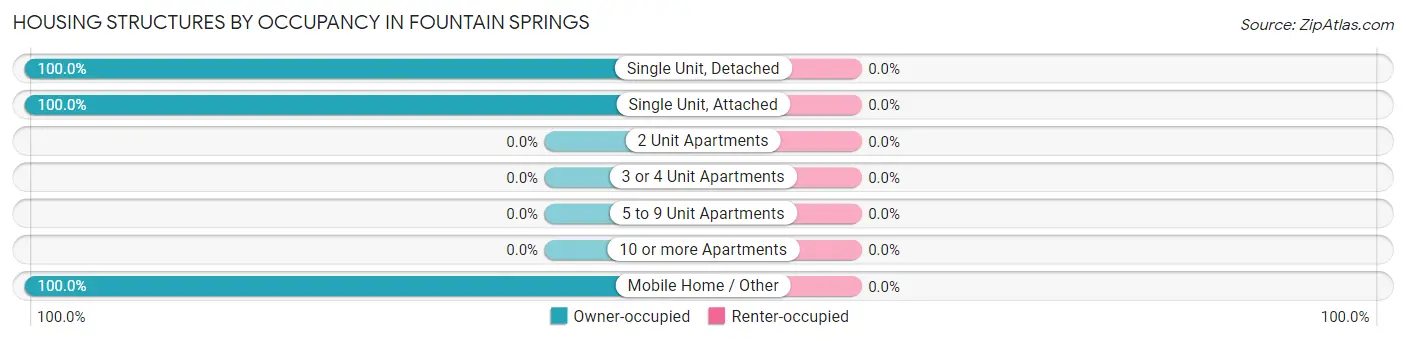
| Structure Type | Owner-occupied | Renter-occupied |
| Single Unit, Detached | 91 (100.0%) | 0 (0.0%) |
| Single Unit, Attached | 21 (100.0%) | 0 (0.0%) |
| 2 Unit Apartments | 0 (0.0%) | 0 (0.0%) |
| 3 or 4 Unit Apartments | 0 (0.0%) | 0 (0.0%) |
| 5 to 9 Unit Apartments | 0 (0.0%) | 0 (0.0%) |
| 10 or more Apartments | 0 (0.0%) | 0 (0.0%) |
| Mobile Home / Other | 9 (100.0%) | 0 (0.0%) |
| Total | 121 (100.0%) | 0 (0.0%) |
Housing Structures by Number of Rooms in Fountain Springs
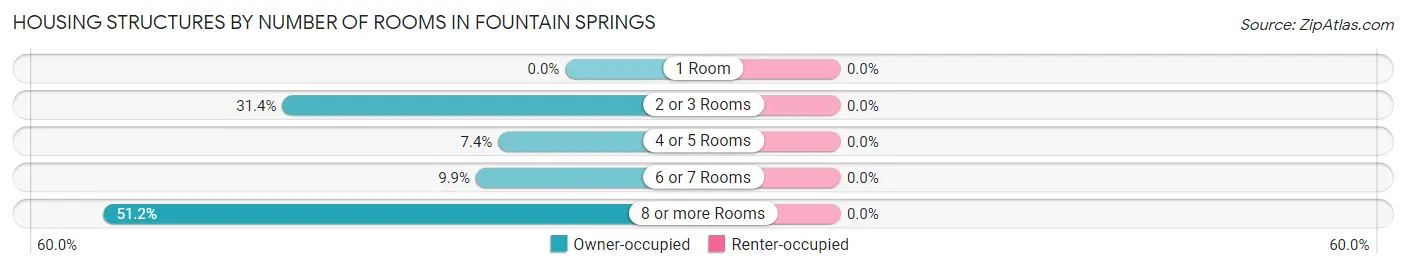
| Number of Rooms | Owner-occupied | Renter-occupied |
| 1 Room | 0 (0.0%) | 0 (0.0%) |
| 2 or 3 Rooms | 38 (31.4%) | 0 (0.0%) |
| 4 or 5 Rooms | 9 (7.4%) | 0 (0.0%) |
| 6 or 7 Rooms | 12 (9.9%) | 0 (0.0%) |
| 8 or more Rooms | 62 (51.2%) | 0 (0.0%) |
| Total | 121 (100.0%) | 0 (0.0%) |
Housing Structure by Heating Type in Fountain Springs
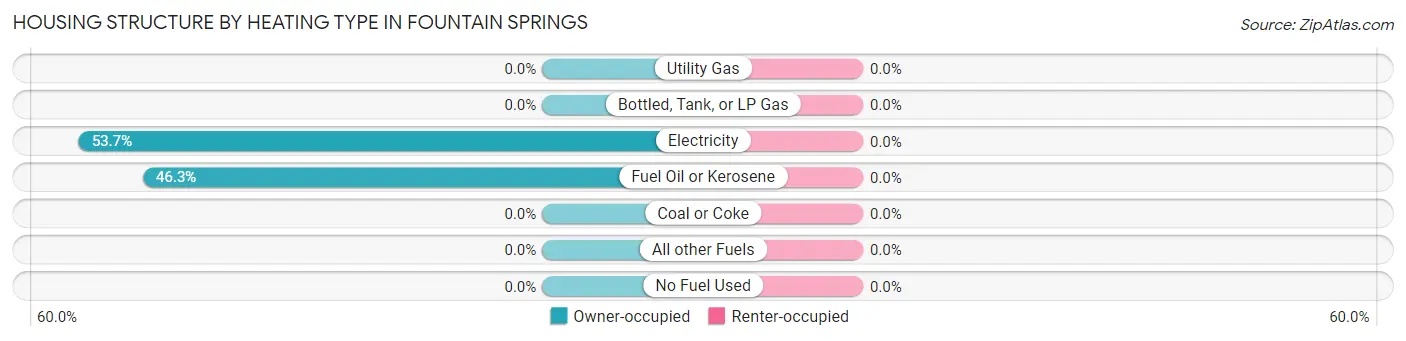
| Heating Type | Owner-occupied | Renter-occupied |
| Utility Gas | 0 (0.0%) | 0 (0.0%) |
| Bottled, Tank, or LP Gas | 0 (0.0%) | 0 (0.0%) |
| Electricity | 65 (53.7%) | 0 (0.0%) |
| Fuel Oil or Kerosene | 56 (46.3%) | 0 (0.0%) |
| Coal or Coke | 0 (0.0%) | 0 (0.0%) |
| All other Fuels | 0 (0.0%) | 0 (0.0%) |
| No Fuel Used | 0 (0.0%) | 0 (0.0%) |
| Total | 121 (100.0%) | 0 (0.0%) |
Household Vehicle Usage in Fountain Springs
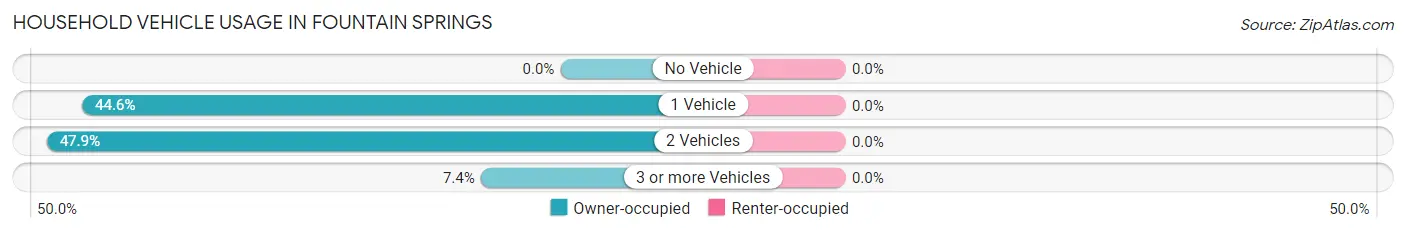
| Vehicles per Household | Owner-occupied | Renter-occupied |
| No Vehicle | 0 (0.0%) | 0 (0.0%) |
| 1 Vehicle | 54 (44.6%) | 0 (0.0%) |
| 2 Vehicles | 58 (47.9%) | 0 (0.0%) |
| 3 or more Vehicles | 9 (7.4%) | 0 (0.0%) |
| Total | 121 (100.0%) | 0 (0.0%) |
Real Estate & Mortgages in Fountain Springs
Real Estate and Mortgage Overview in Fountain Springs
| Characteristic | Without Mortgage | With Mortgage |
| Housing Units | 33 | 88 |
| Median Property Value | - | - |
| Median Household Income | - | - |
| Monthly Housing Costs | - | - |
| Real Estate Taxes | - | - |
Property Value by Mortgage Status in Fountain Springs
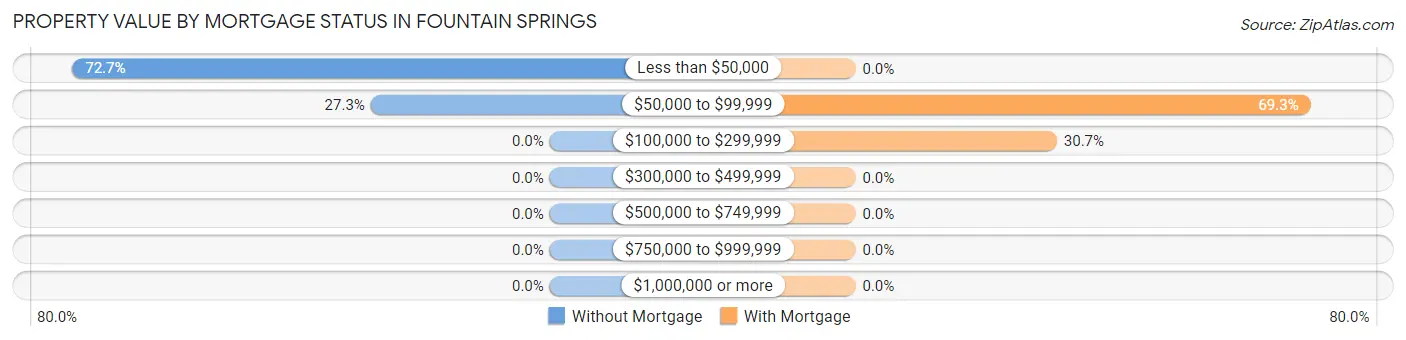
| Property Value | Without Mortgage | With Mortgage |
| Less than $50,000 | 24 (72.7%) | 0 (0.0%) |
| $50,000 to $99,999 | 9 (27.3%) | 61 (69.3%) |
| $100,000 to $299,999 | 0 (0.0%) | 27 (30.7%) |
| $300,000 to $499,999 | 0 (0.0%) | 0 (0.0%) |
| $500,000 to $749,999 | 0 (0.0%) | 0 (0.0%) |
| $750,000 to $999,999 | 0 (0.0%) | 0 (0.0%) |
| $1,000,000 or more | 0 (0.0%) | 0 (0.0%) |
| Total | 33 (100.0%) | 88 (100.0%) |
Household Income by Mortgage Status in Fountain Springs
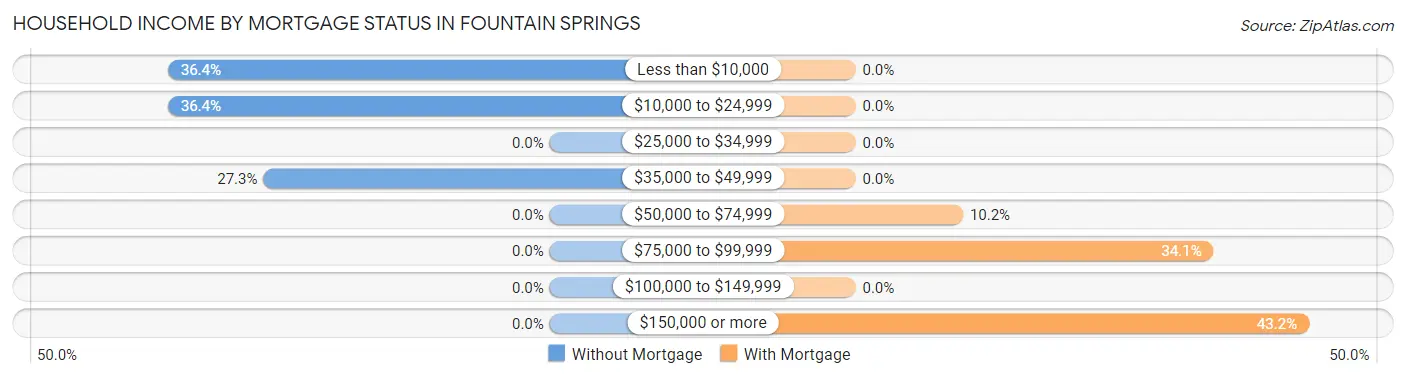
| Household Income | Without Mortgage | With Mortgage |
| Less than $10,000 | 12 (36.4%) | 0 (0.0%) |
| $10,000 to $24,999 | 12 (36.4%) | 0 (0.0%) |
| $25,000 to $34,999 | 0 (0.0%) | 0 (0.0%) |
| $35,000 to $49,999 | 9 (27.3%) | 0 (0.0%) |
| $50,000 to $74,999 | 0 (0.0%) | 9 (10.2%) |
| $75,000 to $99,999 | 0 (0.0%) | 30 (34.1%) |
| $100,000 to $149,999 | 0 (0.0%) | 0 (0.0%) |
| $150,000 or more | 0 (0.0%) | 38 (43.2%) |
| Total | 33 (100.0%) | 88 (100.0%) |
Property Value to Household Income Ratio in Fountain Springs
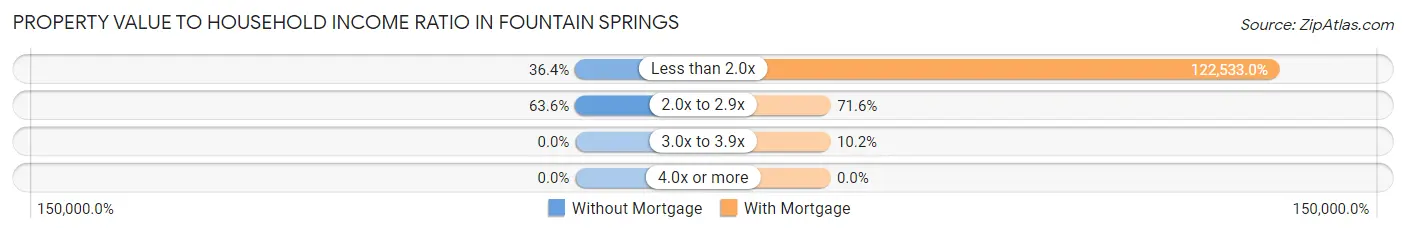
| Value-to-Income Ratio | Without Mortgage | With Mortgage |
| Less than 2.0x | 12 (36.4%) | 107,829 (122,533.0%) |
| 2.0x to 2.9x | 21 (63.6%) | 63 (71.6%) |
| 3.0x to 3.9x | 0 (0.0%) | 9 (10.2%) |
| 4.0x or more | 0 (0.0%) | 0 (0.0%) |
| Total | 33 (100.0%) | 88 (100.0%) |
Real Estate Taxes by Mortgage Status in Fountain Springs
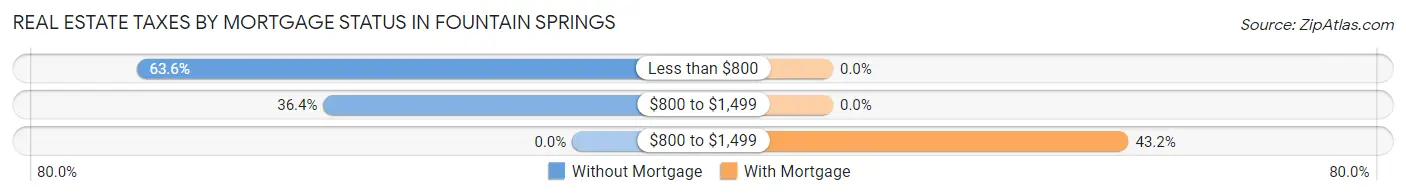
| Property Taxes | Without Mortgage | With Mortgage |
| Less than $800 | 21 (63.6%) | 0 (0.0%) |
| $800 to $1,499 | 12 (36.4%) | 0 (0.0%) |
| $800 to $1,499 | 0 (0.0%) | 38 (43.2%) |
| Total | 33 (100.0%) | 88 (100.0%) |
Health & Disability in Fountain Springs
Health Insurance Coverage by Age in Fountain Springs
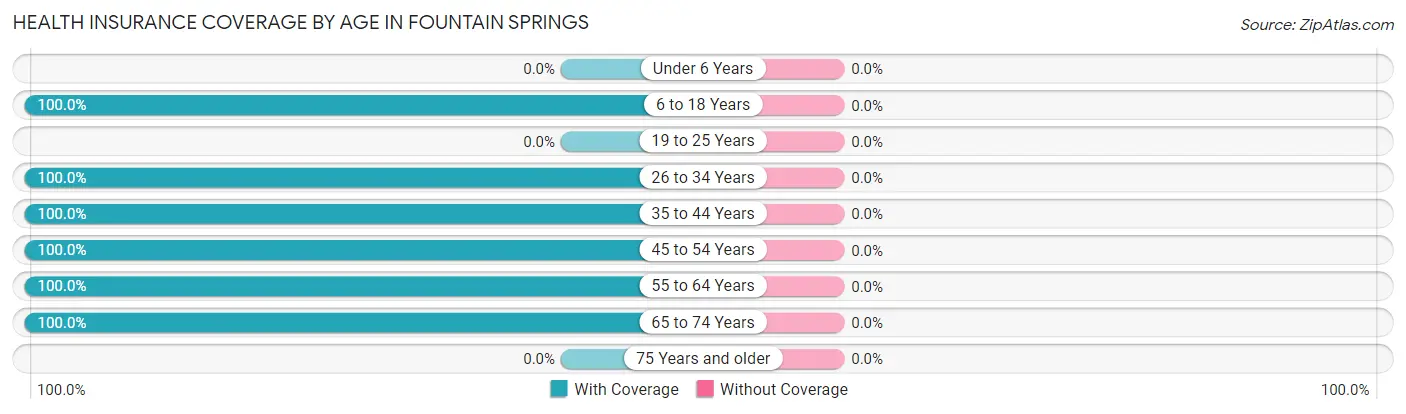
| Age Bracket | With Coverage | Without Coverage |
| Under 6 Years | 0 (0.0%) | 0 (0.0%) |
| 6 to 18 Years | 43 (100.0%) | 0 (0.0%) |
| 19 to 25 Years | 0 (0.0%) | 0 (0.0%) |
| 26 to 34 Years | 25 (100.0%) | 0 (0.0%) |
| 35 to 44 Years | 71 (100.0%) | 0 (0.0%) |
| 45 to 54 Years | 14 (100.0%) | 0 (0.0%) |
| 55 to 64 Years | 66 (100.0%) | 0 (0.0%) |
| 65 to 74 Years | 28 (100.0%) | 0 (0.0%) |
| 75 Years and older | 0 (0.0%) | 0 (0.0%) |
| Total | 247 (100.0%) | 0 (0.0%) |
Health Insurance Coverage by Citizenship Status in Fountain Springs
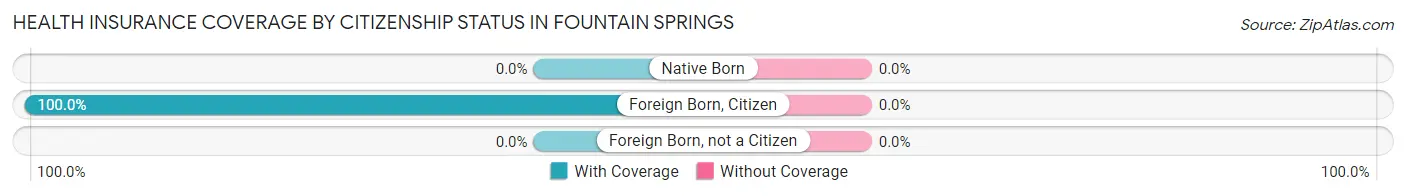
| Citizenship Status | With Coverage | Without Coverage |
| Native Born | 0 (0.0%) | 0 (0.0%) |
| Foreign Born, Citizen | 43 (100.0%) | 0 (0.0%) |
| Foreign Born, not a Citizen | 0 (0.0%) | 0 (0.0%) |
Health Insurance Coverage by Household Income in Fountain Springs
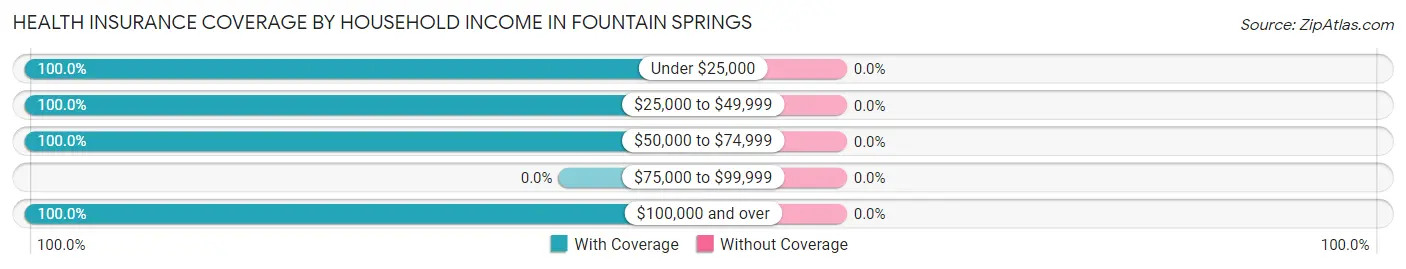
| Household Income | With Coverage | Without Coverage |
| Under $25,000 | 24 (100.0%) | 0 (0.0%) |
| $25,000 to $49,999 | 28 (100.0%) | 0 (0.0%) |
| $50,000 to $74,999 | 43 (100.0%) | 0 (0.0%) |
| $75,000 to $99,999 | 0 (0.0%) | 0 (0.0%) |
| $100,000 and over | 106 (100.0%) | 0 (0.0%) |
Public vs Private Health Insurance Coverage by Age in Fountain Springs
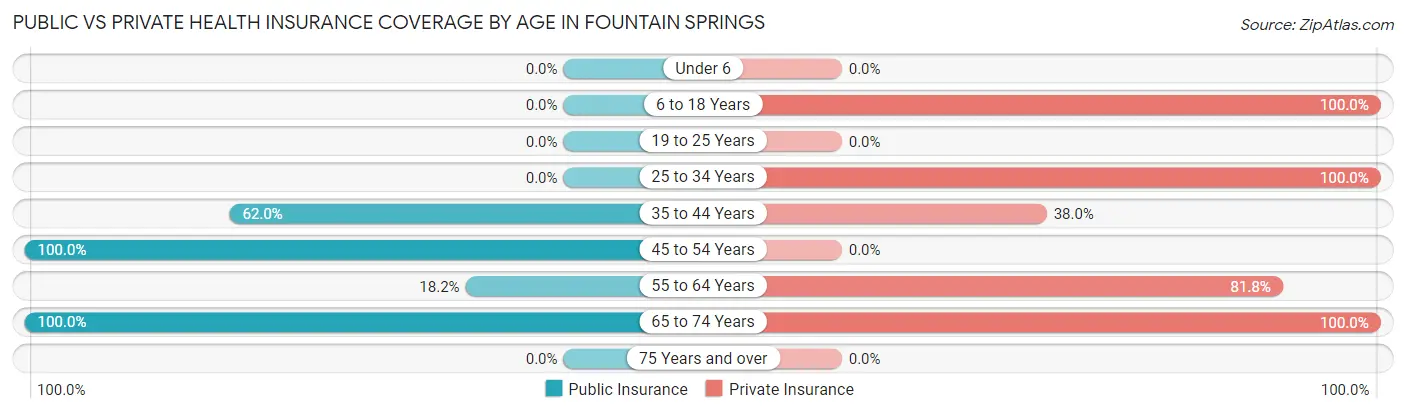
| Age Bracket | Public Insurance | Private Insurance |
| Under 6 | 0 (0.0%) | 0 (0.0%) |
| 6 to 18 Years | 0 (0.0%) | 43 (100.0%) |
| 19 to 25 Years | 0 (0.0%) | 0 (0.0%) |
| 25 to 34 Years | 0 (0.0%) | 25 (100.0%) |
| 35 to 44 Years | 44 (62.0%) | 27 (38.0%) |
| 45 to 54 Years | 14 (100.0%) | 0 (0.0%) |
| 55 to 64 Years | 12 (18.2%) | 54 (81.8%) |
| 65 to 74 Years | 28 (100.0%) | 28 (100.0%) |
| 75 Years and over | 0 (0.0%) | 0 (0.0%) |
| Total | 98 (39.7%) | 177 (71.7%) |
Disability Status by Sex by Age in Fountain Springs
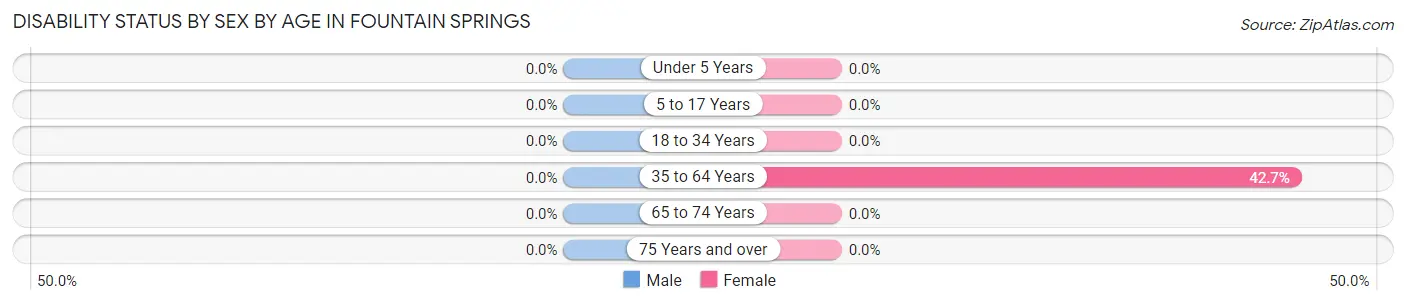
| Age Bracket | Male | Female |
| Under 5 Years | 0 (0.0%) | 0 (0.0%) |
| 5 to 17 Years | 0 (0.0%) | 0 (0.0%) |
| 18 to 34 Years | 0 (0.0%) | 0 (0.0%) |
| 35 to 64 Years | 0 (0.0%) | 32 (42.7%) |
| 65 to 74 Years | 0 (0.0%) | 0 (0.0%) |
| 75 Years and over | 0 (0.0%) | 0 (0.0%) |
Disability Class by Sex by Age in Fountain Springs
Disability Class: Hearing Difficulty
| Age Bracket | Male | Female |
| Under 5 Years | 0 (0.0%) | 0 (0.0%) |
| 5 to 17 Years | 0 (0.0%) | 0 (0.0%) |
| 18 to 34 Years | 0 (0.0%) | 0 (0.0%) |
| 35 to 64 Years | 0 (0.0%) | 0 (0.0%) |
| 65 to 74 Years | 0 (0.0%) | 0 (0.0%) |
| 75 Years and over | 0 (0.0%) | 0 (0.0%) |
Disability Class: Vision Difficulty
| Age Bracket | Male | Female |
| Under 5 Years | 0 (0.0%) | 0 (0.0%) |
| 5 to 17 Years | 0 (0.0%) | 0 (0.0%) |
| 18 to 34 Years | 0 (0.0%) | 0 (0.0%) |
| 35 to 64 Years | 0 (0.0%) | 0 (0.0%) |
| 65 to 74 Years | 0 (0.0%) | 0 (0.0%) |
| 75 Years and over | 0 (0.0%) | 0 (0.0%) |
Disability Class: Cognitive Difficulty
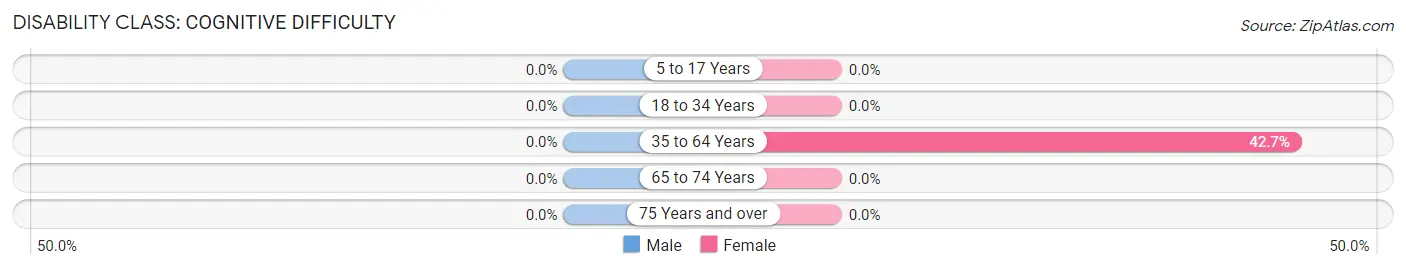
| Age Bracket | Male | Female |
| 5 to 17 Years | 0 (0.0%) | 0 (0.0%) |
| 18 to 34 Years | 0 (0.0%) | 0 (0.0%) |
| 35 to 64 Years | 0 (0.0%) | 32 (42.7%) |
| 65 to 74 Years | 0 (0.0%) | 0 (0.0%) |
| 75 Years and over | 0 (0.0%) | 0 (0.0%) |
Disability Class: Ambulatory Difficulty
| Age Bracket | Male | Female |
| 5 to 17 Years | 0 (0.0%) | 0 (0.0%) |
| 18 to 34 Years | 0 (0.0%) | 0 (0.0%) |
| 35 to 64 Years | 0 (0.0%) | 0 (0.0%) |
| 65 to 74 Years | 0 (0.0%) | 0 (0.0%) |
| 75 Years and over | 0 (0.0%) | 0 (0.0%) |
Disability Class: Self-Care Difficulty
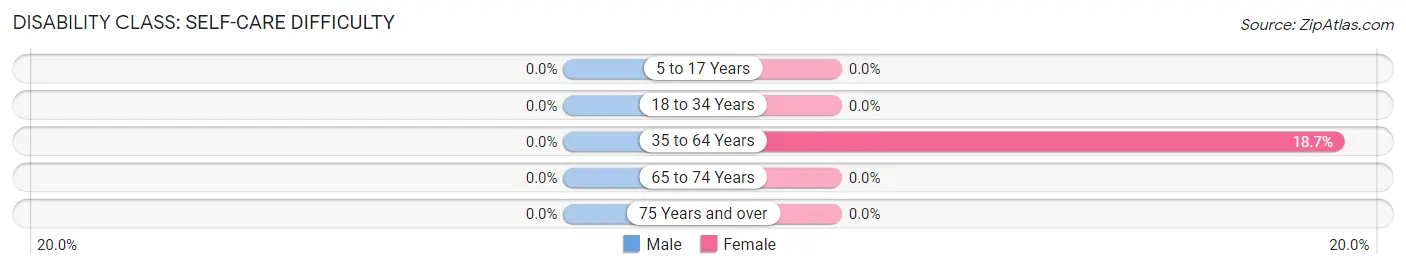
| Age Bracket | Male | Female |
| 5 to 17 Years | 0 (0.0%) | 0 (0.0%) |
| 18 to 34 Years | 0 (0.0%) | 0 (0.0%) |
| 35 to 64 Years | 0 (0.0%) | 14 (18.7%) |
| 65 to 74 Years | 0 (0.0%) | 0 (0.0%) |
| 75 Years and over | 0 (0.0%) | 0 (0.0%) |
Technology Access in Fountain Springs
Computing Device Access in Fountain Springs
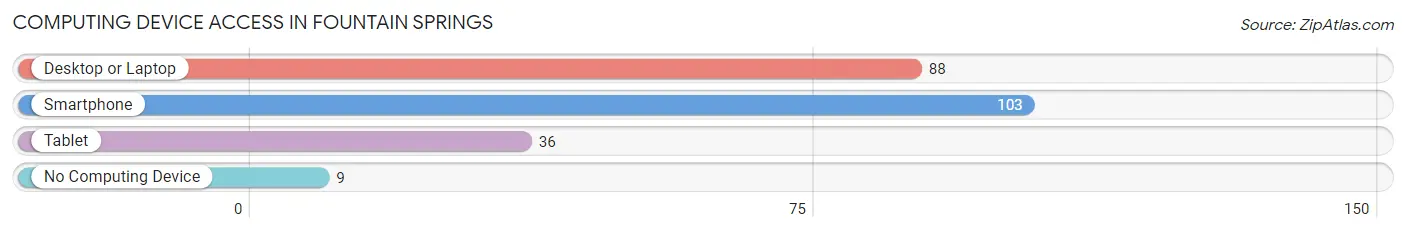
| Device Type | # Households | % Households |
| Desktop or Laptop | 88 | 72.7% |
| Smartphone | 103 | 85.1% |
| Tablet | 36 | 29.7% |
| No Computing Device | 9 | 7.4% |
| Total | 121 | 100.0% |
Internet Access in Fountain Springs
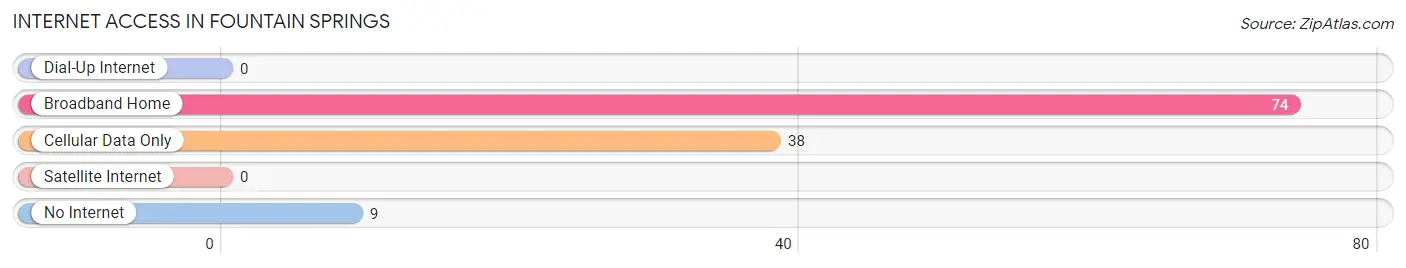
| Internet Type | # Households | % Households |
| Dial-Up Internet | 0 | 0.0% |
| Broadband Home | 74 | 61.2% |
| Cellular Data Only | 38 | 31.4% |
| Satellite Internet | 0 | 0.0% |
| No Internet | 9 | 7.4% |
| Total | 121 | 100.0% |
Fountain Springs Summary
Fountain Springs is a borough located in Schuylkill County, Pennsylvania. It is situated in the southern part of the county, approximately five miles south of the county seat of Pottsville. The borough is part of the Pottsville Metropolitan Statistical Area. As of the 2010 census, the population of Fountain Springs was 1,845.
History
Fountain Springs was founded in 1845 by a group of German immigrants. The town was originally known as “Fountainville”, but the name was changed to “Fountain Springs” in 1851. The town was named after a nearby spring that was believed to have healing properties.
The town grew rapidly in the late 19th century, and by the early 20th century, it had become a thriving industrial center. The town was home to several coal mines, a brickyard, a tannery, and a number of other businesses.
Geography
Fountain Springs is located at 40°45'17" North, 76°14'45" West (40.754722, -76.245833). It is situated in the southern part of Schuylkill County, approximately five miles south of the county seat of Pottsville. The borough is part of the Pottsville Metropolitan Statistical Area.
The borough has a total area of 0.7 square miles, all of which is land. The town is situated in a valley, surrounded by hills. The town is drained by the Little Schuylkill River, which flows through the center of town.
Economy
Fountain Springs is a small, rural community with a limited economy. The town is home to a few small businesses, including a grocery store, a hardware store, and a few restaurants. The town is also home to a number of small manufacturing companies, including a metal fabrication plant and a plastics factory.
The town is also home to a number of coal mines, which have been in operation since the late 19th century. The coal mines are the primary source of employment in the town.
Demographics
As of the 2010 census, the population of Fountain Springs was 1,845. The racial makeup of the town was 97.3% White, 0.7% African American, 0.2% Native American, 0.3% Asian, 0.1% from other races, and 1.4% from two or more races. Hispanic or Latino of any race were 0.9% of the population.
The median income for a household in the town was $37,917, and the median income for a family was $45,625. The per capita income for the town was $17,945. About 11.2% of families and 14.2% of the population were below the poverty line, including 19.2% of those under age 18 and 8.2% of those age 65 or over.
Common Questions
What is Per Capita Income in Fountain Springs?
Per Capita income in Fountain Springs is $40,475.
What is the Median Family Income in Fountain Springs?
Median Family Income in Fountain Springs is $108,651.
What is Inequality or Gini Index in Fountain Springs?
Inequality or Gini Index in Fountain Springs is 0.43.
What is the Total Population of Fountain Springs?
Total Population of Fountain Springs is 261.
What is the Total Male Population of Fountain Springs?
Total Male Population of Fountain Springs is 109.
What is the Total Female Population of Fountain Springs?
Total Female Population of Fountain Springs is 152.
What is the Ratio of Males per 100 Females in Fountain Springs?
There are 71.71 Males per 100 Females in Fountain Springs.
What is the Ratio of Females per 100 Males in Fountain Springs?
There are 139.45 Females per 100 Males in Fountain Springs.
What is the Median Population Age in Fountain Springs?
Median Population Age in Fountain Springs is 44.5 Years.
What is the Average Family Size in Fountain Springs
Average Family Size in Fountain Springs is 2.1 People.
What is the Average Household Size in Fountain Springs
Average Household Size in Fountain Springs is 1.7 People.
How Large is the Labor Force in Fountain Springs?
There are 127 People in the Labor Forcein in Fountain Springs.
What is the Percentage of People in the Labor Force in Fountain Springs?
58.3% of People are in the Labor Force in Fountain Springs.
What is the Unemployment Rate in Fountain Springs?
Unemployment Rate in Fountain Springs is 9.4%.