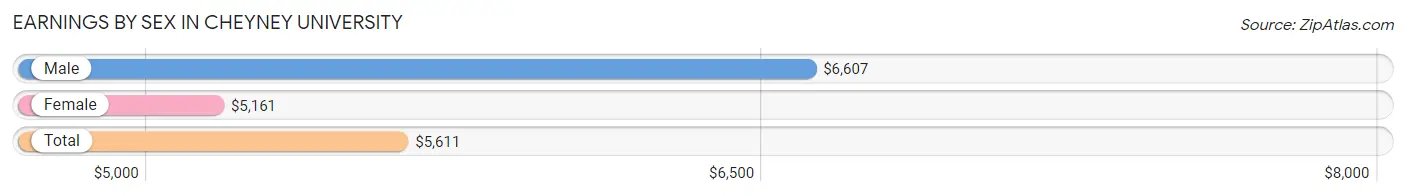
Average Earnings in Cheyney University are $5,611, $6,607 for men and $5,161 for women, a difference of 21.9%.
Sex
Number
Average Earnings
Male
46 (44.2%)
$6,607
Female
58 (55.8%)
$5,161
Total
104 (100.0%)
$5,611
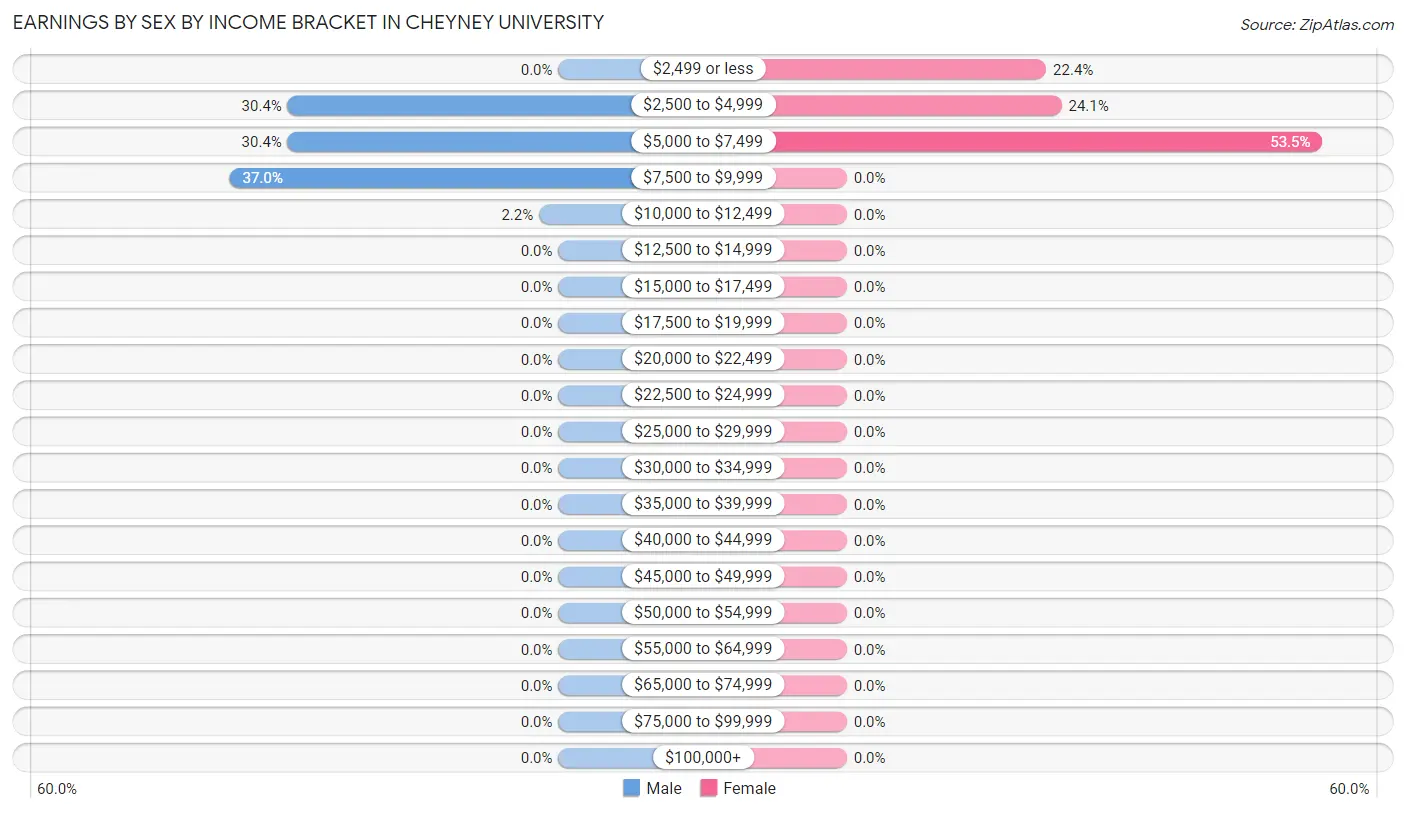
Earnings by Sex by Income Bracket in Cheyney University
The most common earnings brackets in Cheyney University are $7,500 to $9,999 for men (17 | 37.0%) and $5,000 to $7,499 for women (31 | 53.4%).
Income
Male
Female
$2,499 or less
0 (0.0%)
13 (22.4%)
$2,500 to $4,999
14 (30.4%)
14 (24.1%)
$5,000 to $7,499
14 (30.4%)
31 (53.4%)
$7,500 to $9,999
17 (37.0%)
0 (0.0%)
$10,000 to $12,499
1 (2.2%)
0 (0.0%)
$12,500 to $14,999
0 (0.0%)
0 (0.0%)
$15,000 to $17,499
0 (0.0%)
0 (0.0%)
$17,500 to $19,999
0 (0.0%)
0 (0.0%)
$20,000 to $22,499
0 (0.0%)
0 (0.0%)
$22,500 to $24,999
0 (0.0%)
0 (0.0%)
$25,000 to $29,999
0 (0.0%)
0 (0.0%)
$30,000 to $34,999
0 (0.0%)
0 (0.0%)
$35,000 to $39,999
0 (0.0%)
0 (0.0%)
$40,000 to $44,999
0 (0.0%)
0 (0.0%)
$45,000 to $49,999
0 (0.0%)
0 (0.0%)
$50,000 to $54,999
0 (0.0%)
0 (0.0%)
$55,000 to $64,999
0 (0.0%)
0 (0.0%)
$65,000 to $74,999
0 (0.0%)
0 (0.0%)
$75,000 to $99,999
0 (0.0%)
0 (0.0%)
$100,000+
0 (0.0%)
0 (0.0%)
Total
46 (100.0%)
58 (100.0%)
Earnings by Sex by Educational Attainment in Cheyney University
Educational Attainment
Male Income
Female Income
Less than High School
-
-
High School Diploma
-
-
College or Associate's Degree
-
-
Bachelor's Degree
-
-
Graduate Degree
-
-
Total
-
-
Family Income in Cheyney University
Family Income Brackets in Cheyney University
Income Bracket
# Families
% Families
Less than $10,000
0
0.0%
$10,000 to $14,999
0
0.0%
$15,000 to $24,999
0
0.0%
$25,000 to $34,999
0
0.0%
$35,000 to $49,999
0
0.0%
$50,000 to $74,999
0
0.0%
$75,000 to $99,999
0
0.0%
$100,000 to $149,999
0
0.0%
$150,000 to $199,999
0
0.0%
$200,000+
0
0.0%
Family Income by Famaliy Size in Cheyney University
Income Bracket
# Families
Median Income
2-Person Families
0 (0.0%)
$0
3-Person Families
0 (0.0%)
$0
4-Person Families
0 (0.0%)
$0
5-Person Families
0 (0.0%)
$0
6-Person Families
0 (0.0%)
$0
7+ Person Families
0 (0.0%)
$0
Total
0 (0.0%)
$0
Family Income by Number of Earners in Cheyney University
Number of Earners
# Families
Median Income
No Earners
0 (0.0%)
$0
1 Earner
0 (0.0%)
$0
2 Earners
0 (0.0%)
$0
3+ Earners
0 (0.0%)
$0
Total
0 (0.0%)
$0
Household Income in Cheyney University
Household Income Brackets in Cheyney University
Income Bracket
# Households
% Households
Less than $10,000
0
0.0%
$10,000 to $14,999
0
0.0%
$15,000 to $24,999
0
0.0%
$25,000 to $34,999
0
0.0%
$35,000 to $49,999
0
0.0%
$50,000 to $74,999
0
0.0%
$75,000 to $99,999
0
0.0%
$100,000 to $149,999
0
0.0%
$150,000 to $199,999
0
0.0%
$200,000+
0
0.0%
Household Income by Householder Age in Cheyney University
Income Bracket
# Households
Median Income
15 to 24 Years
0 (0.0%)
$0
25 to 44 Years
0 (0.0%)
$0
45 to 64 Years
0 (0.0%)
$0
65+ Years
0 (0.0%)
$0
Total
0 (0.0%)
$0
Poverty in Cheyney University
Income Below Poverty by Sex and Age in Cheyney University
Age Bracket
Male
Female
Under 5 Years
0 (0.0%)
0 (0.0%)
5 Years
0 (0.0%)
0 (0.0%)
6 to 11 Years
0 (0.0%)
0 (0.0%)
12 to 14 Years
0 (0.0%)
0 (0.0%)
15 Years
0 (0.0%)
0 (0.0%)
16 and 17 Years
0 (0.0%)
0 (0.0%)
18 to 24 Years
0 (0.0%)
0 (0.0%)
25 to 34 Years
0 (0.0%)
0 (0.0%)
35 to 44 Years
0 (0.0%)
0 (0.0%)
45 to 54 Years
0 (0.0%)
0 (0.0%)
55 to 64 Years
0 (0.0%)
0 (0.0%)
65 to 74 Years
0 (0.0%)
0 (0.0%)
75 Years and over
0 (0.0%)
0 (0.0%)
Total
0 (0.0%)
0 (0.0%)
Income Above Poverty by Sex and Age in Cheyney University
Age Bracket
Male
Female
Under 5 Years
0 (0.0%)
0 (0.0%)
5 Years
0 (0.0%)
0 (0.0%)
6 to 11 Years
0 (0.0%)
0 (0.0%)
12 to 14 Years
0 (0.0%)
0 (0.0%)
15 Years
0 (0.0%)
0 (0.0%)
16 and 17 Years
0 (0.0%)
0 (0.0%)
18 to 24 Years
0 (0.0%)
0 (0.0%)
25 to 34 Years
0 (0.0%)
0 (0.0%)
35 to 44 Years
0 (0.0%)
0 (0.0%)
45 to 54 Years
0 (0.0%)
0 (0.0%)
55 to 64 Years
0 (0.0%)
0 (0.0%)
65 to 74 Years
0 (0.0%)
0 (0.0%)
75 Years and over
0 (0.0%)
0 (0.0%)
Total
0 (0.0%)
0 (0.0%)
Income Below Poverty Among Married-Couple Families in Cheyney University
Children
Above Poverty
Below Poverty
No Children
0 (0.0%)
0 (0.0%)
1 or 2 Children
0 (0.0%)
0 (0.0%)
3 or 4 Children
0 (0.0%)
0 (0.0%)
5 or more Children
0 (0.0%)
0 (0.0%)
Total
0 (0.0%)
0 (0.0%)
Income Below Poverty Among Single-Parent Households in Cheyney University
Children
Single Father
Single Mother
No Children
0 (0.0%)
0 (0.0%)
1 or 2 Children
0 (0.0%)
0 (0.0%)
3 or 4 Children
0 (0.0%)
0 (0.0%)
5 or more Children
0 (0.0%)
0 (0.0%)
Total
0 (0.0%)
0 (0.0%)
Income Below Poverty Among Married-Couple vs Single-Parent Households in Cheyney University
Children
Married-Couple Families
Single-Parent Households
No Children
0 (0.0%)
0 (0.0%)
1 or 2 Children
0 (0.0%)
0 (0.0%)
3 or 4 Children
0 (0.0%)
0 (0.0%)
5 or more Children
0 (0.0%)
0 (0.0%)
Total
0 (0.0%)
0 (0.0%)
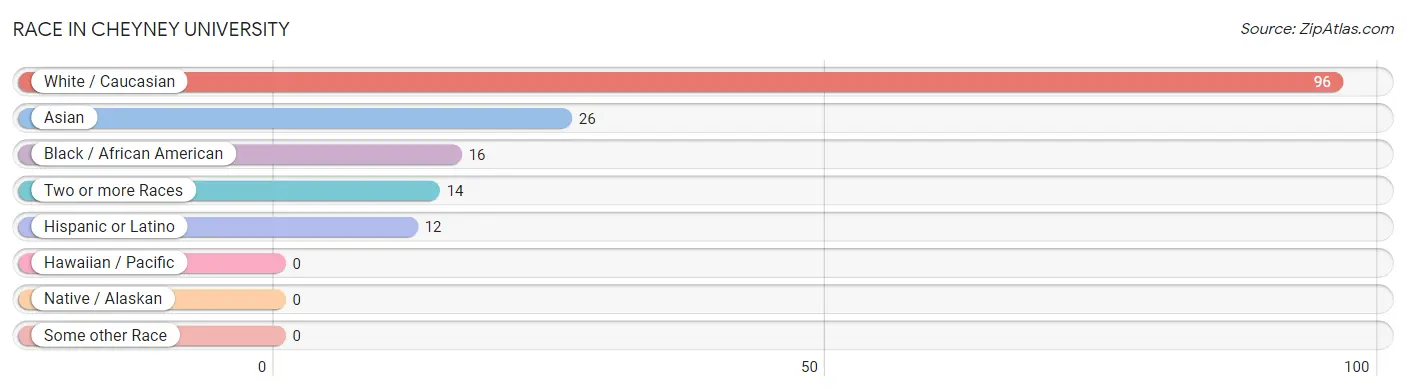
Race in Cheyney University
The most populous races in Cheyney University are White / Caucasian (96 | 63.2%), Asian (26 | 17.1%), and Black / African American (16 | 10.5%).
Race
# Population
% Population
Asian
26
17.1%
Black / African American
16
10.5%
Hawaiian / Pacific
0
0.0%
Hispanic or Latino
12
7.9%
Native / Alaskan
0
0.0%
White / Caucasian
96
63.2%
Two or more Races
14
9.2%
Some other Race
0
0.0%
Total
152
100.0%
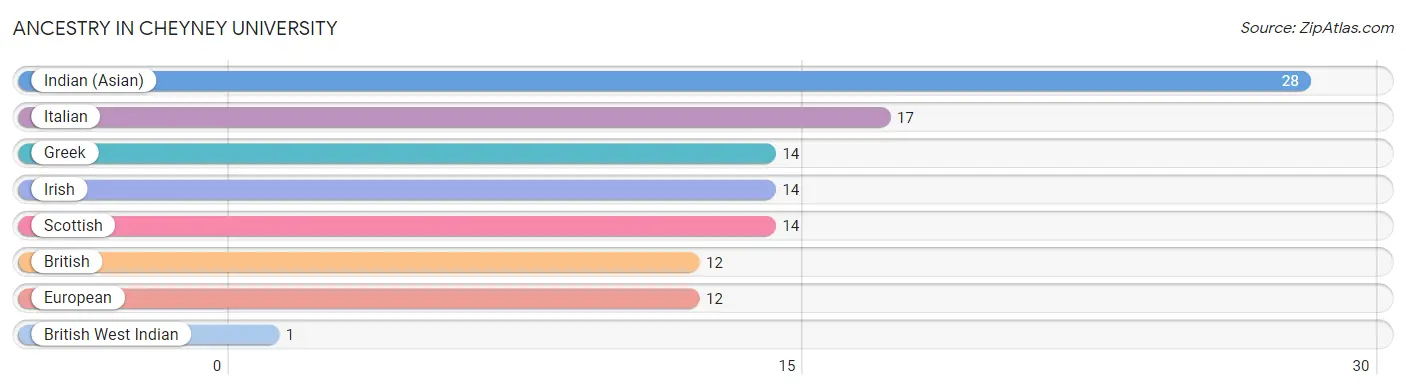
Ancestry in Cheyney University
The most populous ancestries reported in Cheyney University are Indian (Asian) (28 | 18.4%), Italian (17 | 11.2%), Greek (14 | 9.2%), Irish (14 | 9.2%), and Scottish (14 | 9.2%), together accounting for 57.2% of all Cheyney University residents.
Ancestry
# Population
% Population
British
12
7.9%
British West Indian
1
0.7%
European
12
7.9%
Greek
14
9.2%
Indian (Asian)
28
18.4%
Irish
14
9.2%
Italian
17
11.2%
Scottish
14
9.2%
View All 8 Rows
Immigrants in Cheyney University
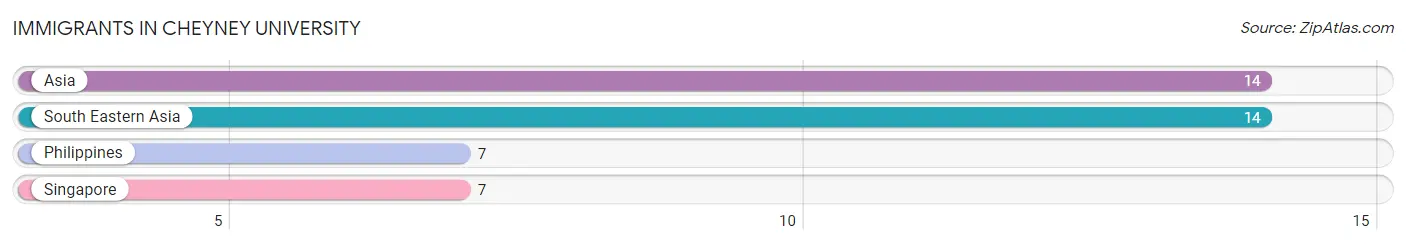
The most numerous immigrant groups reported in Cheyney University came from Asia (14 | 9.2%), South Eastern Asia (14 | 9.2%), Philippines (7 | 4.6%), and Singapore (7 | 4.6%), together accounting for 27.6% of all Cheyney University residents.
Immigration Origin
# Population
% Population
Asia
14
9.2%
Philippines
7
4.6%
Singapore
7
4.6%
South Eastern Asia
14
9.2%
View All 4 Rows
Sex and Age in Cheyney University
Sex and Age in Cheyney University
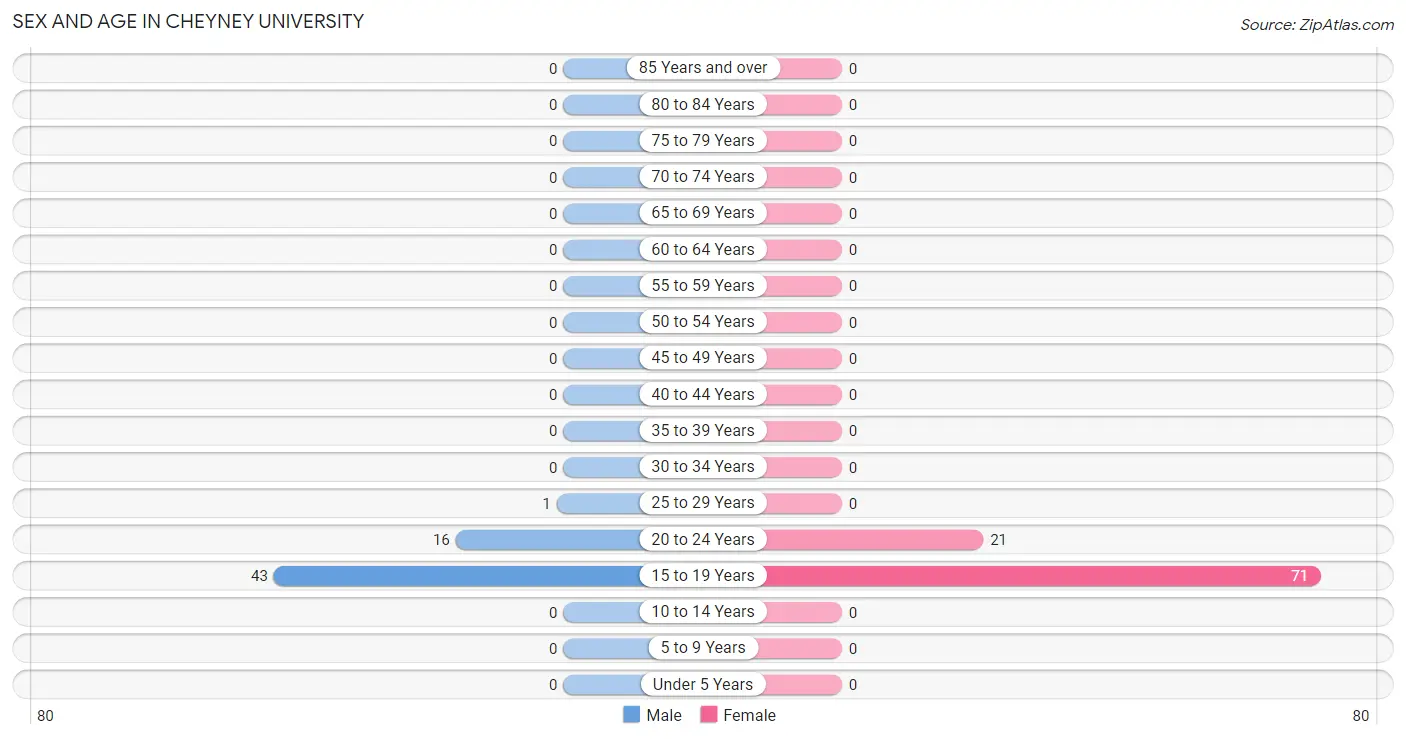
The most populous age groups in Cheyney University are 15 to 19 Years (43 | 71.7%) for men and 15 to 19 Years (71 | 77.2%) for women.
Age Bracket
Male
Female
Under 5 Years
0 (0.0%)
0 (0.0%)
5 to 9 Years
0 (0.0%)
0 (0.0%)
10 to 14 Years
0 (0.0%)
0 (0.0%)
15 to 19 Years
43 (71.7%)
71 (77.2%)
20 to 24 Years
16 (26.7%)
21 (22.8%)
25 to 29 Years
1 (1.7%)
0 (0.0%)
30 to 34 Years
0 (0.0%)
0 (0.0%)
35 to 39 Years
0 (0.0%)
0 (0.0%)
40 to 44 Years
0 (0.0%)
0 (0.0%)
45 to 49 Years
0 (0.0%)
0 (0.0%)
50 to 54 Years
0 (0.0%)
0 (0.0%)
55 to 59 Years
0 (0.0%)
0 (0.0%)
60 to 64 Years
0 (0.0%)
0 (0.0%)
65 to 69 Years
0 (0.0%)
0 (0.0%)
70 to 74 Years
0 (0.0%)
0 (0.0%)
75 to 79 Years
0 (0.0%)
0 (0.0%)
80 to 84 Years
0 (0.0%)
0 (0.0%)
85 Years and over
0 (0.0%)
0 (0.0%)
Total
60 (100.0%)
92 (100.0%)
Families and Households in Cheyney University
Median Family Size in Cheyney University
Family Type
# Families
Family Size
Married-Couple
0 (0.0%)
-
Single Male/Father
0 (0.0%)
-
Single Female/Mother
0 (0.0%)
-
Total Families
0 (0.0%)
-
Median Household Size in Cheyney University
Household Type
# Households
Household Size
Married-Couple
0 (0.0%)
-
Single Male/Father
0 (0.0%)
-
Single Female/Mother
0 (0.0%)
-
Non-family
0 (0.0%)
-
Total Households
0 (0.0%)
-
Household Size by Marriage Status in Cheyney University
Household Size
Family Households
Nonfamily Households
1-Person Households
-
0 (0.0%)
2-Person Households
0 (0.0%)
0 (0.0%)
3-Person Households
0 (0.0%)
0 (0.0%)
4-Person Households
0 (0.0%)
0 (0.0%)
5-Person Households
0 (0.0%)
0 (0.0%)
6-Person Households
0 (0.0%)
0 (0.0%)
7+ Person Households
0 (0.0%)
0 (0.0%)
Total
0 (0.0%)
0 (0.0%)
Female Fertility in Cheyney University
Fertility by Age in Cheyney University
Age Bracket
Women with Births
Births / 1,000 Women
15 to 19 years
0 (0.0%)
0.0
20 to 34 years
0 (0.0%)
0.0
35 to 50 years
0 (0.0%)
0.0
Total
0 (0.0%)
0.0
Fertility by Age by Marriage Status in Cheyney University
Age Bracket
Married
Unmarried
15 to 19 years
0 (0.0%)
0 (0.0%)
20 to 34 years
0 (0.0%)
0 (0.0%)
35 to 50 years
0 (0.0%)
0 (0.0%)
Total
0 (0.0%)
0 (0.0%)
Fertility by Education in Cheyney University
Educational Attainment
Women with Births
Births / 1,000 Women
Less than High School
0 (0.0%)
0.0
High School Diploma
0 (0.0%)
0.0
College or Associate's Degree
0 (0.0%)
0.0
Bachelor's Degree
0 (0.0%)
0.0
Graduate Degree
0 (0.0%)
0.0
Total
0 (0.0%)
0.0
Fertility by Education by Marriage Status in Cheyney University
Educational Attainment
Married
Unmarried
Less than High School
0 (0.0%)
0 (0.0%)
High School Diploma
0 (0.0%)
0 (0.0%)
College or Associate's Degree
0 (0.0%)
0 (0.0%)
Bachelor's Degree
0 (0.0%)
0 (0.0%)
Graduate Degree
0 (0.0%)
0 (0.0%)
Total
0 (0.0%)
0 (0.0%)
Employment Characteristics in Cheyney University
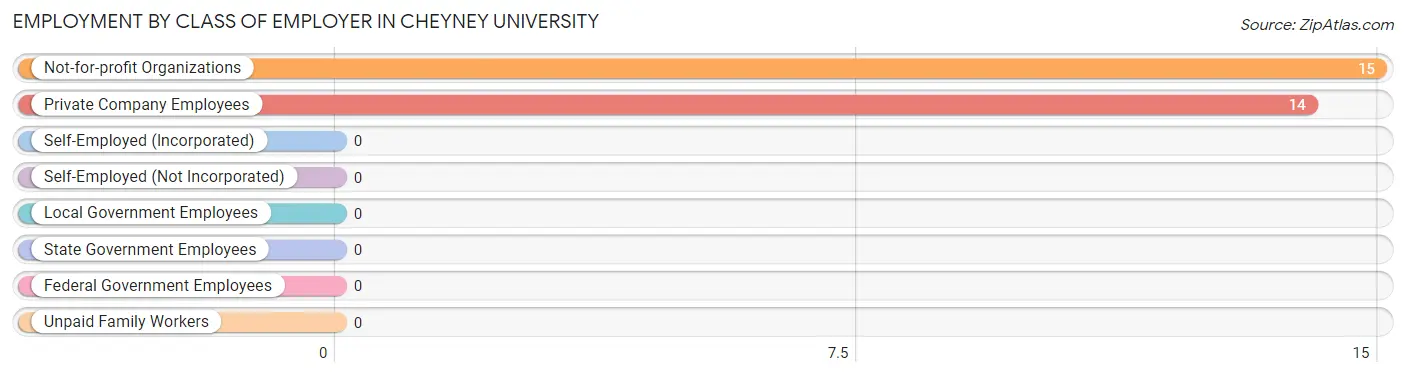
Employment by Class of Employer in Cheyney University
Among the 29 employed individuals in Cheyney University, not-for-profit organizations (15 | 51.7%), and private company employees (14 | 48.3%) make up the most common classes of employment.
Employer Class
# Employees
% Employees
Private Company Employees
14
48.3%
Self-Employed (Incorporated)
0
0.0%
Self-Employed (Not Incorporated)
0
0.0%
Not-for-profit Organizations
15
51.7%
Local Government Employees
0
0.0%
State Government Employees
0
0.0%
Federal Government Employees
0
0.0%
Unpaid Family Workers
0
0.0%
Total
29
100.0%
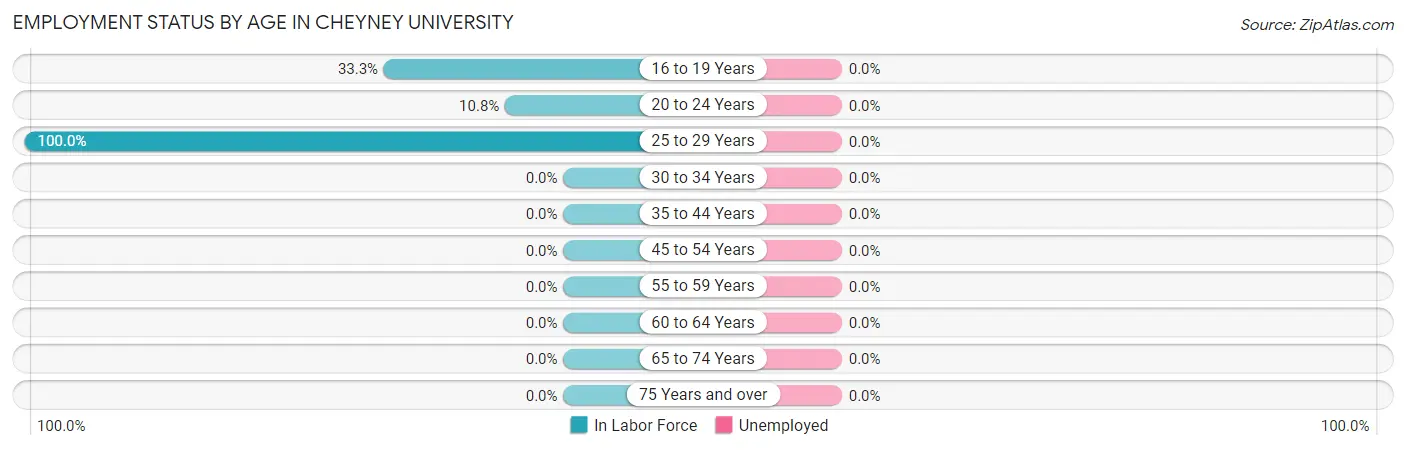
Employment Status by Age in Cheyney University
Age Bracket
In Labor Force
Unemployed
16 to 19 Years
38 (33.3%)
0 (0.0%)
20 to 24 Years
4 (10.8%)
0 (0.0%)
25 to 29 Years
1 (100.0%)
0 (0.0%)
30 to 34 Years
0 (0.0%)
0 (0.0%)
35 to 44 Years
0 (0.0%)
0 (0.0%)
45 to 54 Years
0 (0.0%)
0 (0.0%)
55 to 59 Years
0 (0.0%)
0 (0.0%)
60 to 64 Years
0 (0.0%)
0 (0.0%)
65 to 74 Years
0 (0.0%)
0 (0.0%)
75 Years and over
0 (0.0%)
0 (0.0%)
Total
43 (28.3%)
0 (0.0%)
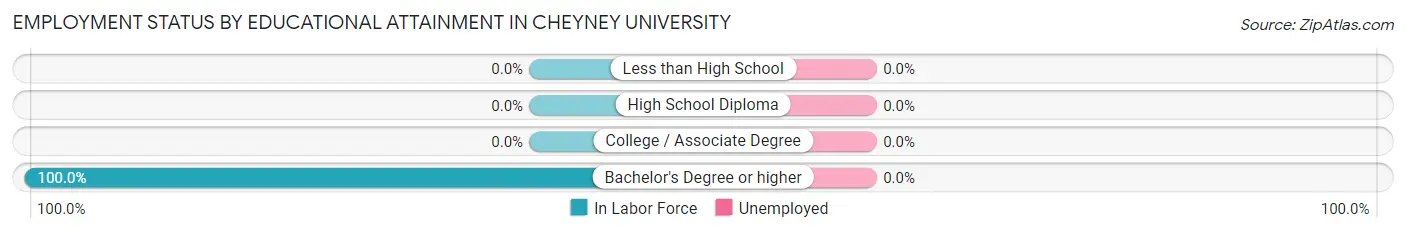
Employment Status by Educational Attainment in Cheyney University
Educational Attainment
In Labor Force
Unemployed
Less than High School
0 (0.0%)
0 (0.0%)
High School Diploma
0 (0.0%)
0 (0.0%)
College / Associate Degree
0 (0.0%)
0 (0.0%)
Bachelor's Degree or higher
1 (100.0%)
0 (0.0%)
Total
1 (100.0%)
0 (0.0%)
Employment Occupations by Sex in Cheyney University
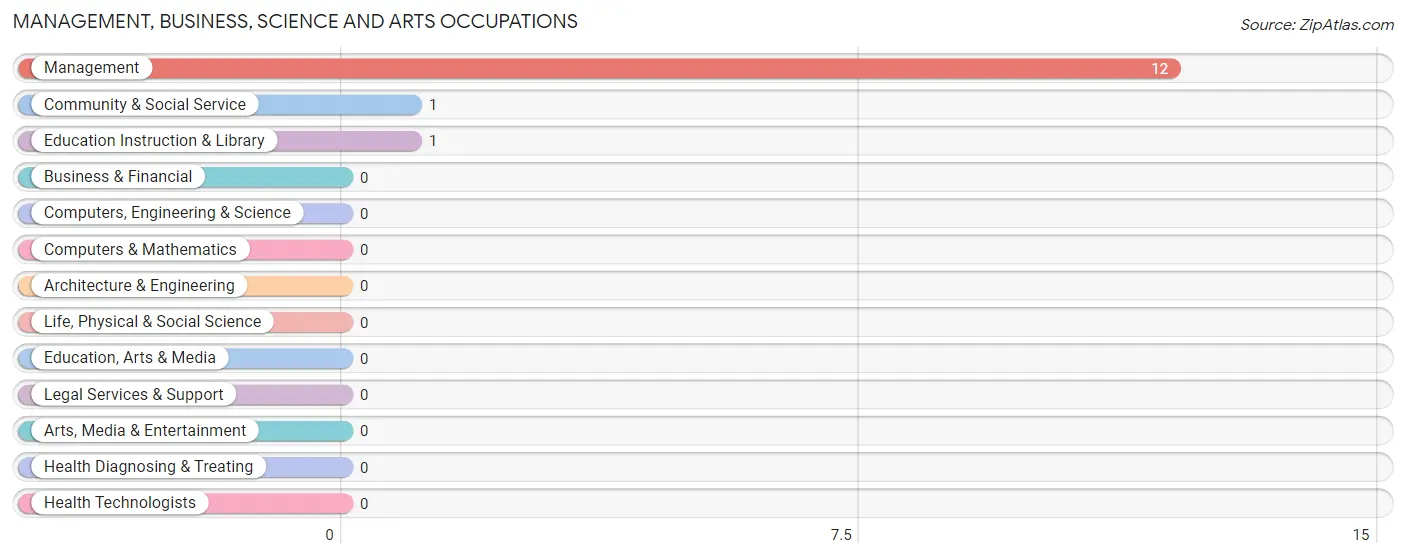
Management, Business, Science and Arts Occupations
The most common Management, Business, Science and Arts occupations in Cheyney University are Management (12 | 27.9%), Community & Social Service (1 | 2.3%), and Education Instruction & Library (1 | 2.3%).
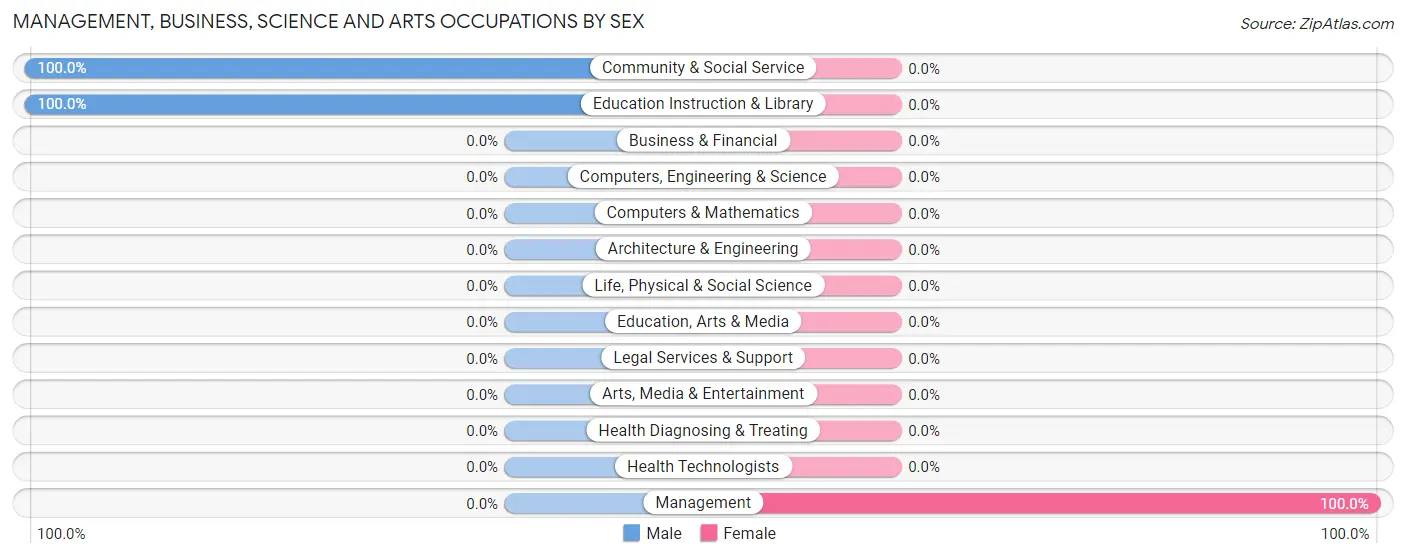
Management, Business, Science and Arts Occupations by Sex
Occupation
Male
Female
Management
0 (0.0%)
12 (100.0%)
Business & Financial
0 (0.0%)
0 (0.0%)
Computers, Engineering & Science
0 (0.0%)
0 (0.0%)
Computers & Mathematics
0 (0.0%)
0 (0.0%)
Architecture & Engineering
0 (0.0%)
0 (0.0%)
Life, Physical & Social Science
0 (0.0%)
0 (0.0%)
Community & Social Service
1 (100.0%)
0 (0.0%)
Education, Arts & Media
0 (0.0%)
0 (0.0%)
Legal Services & Support
0 (0.0%)
0 (0.0%)
Education Instruction & Library
1 (100.0%)
0 (0.0%)
Arts, Media & Entertainment
0 (0.0%)
0 (0.0%)
Health Diagnosing & Treating
0 (0.0%)
0 (0.0%)
Health Technologists
0 (0.0%)
0 (0.0%)
Total (Category)
1 (7.7%)
12 (92.3%)
Total (Overall)
17 (39.5%)
26 (60.5%)
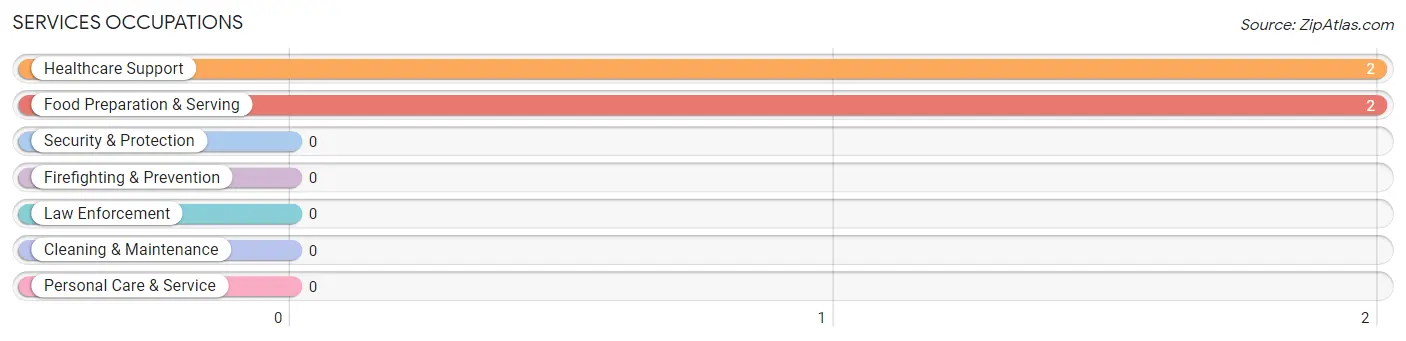
Services Occupations
The most common Services occupations in Cheyney University are Healthcare Support (2 | 4.6%), and Food Preparation & Serving (2 | 4.6%).
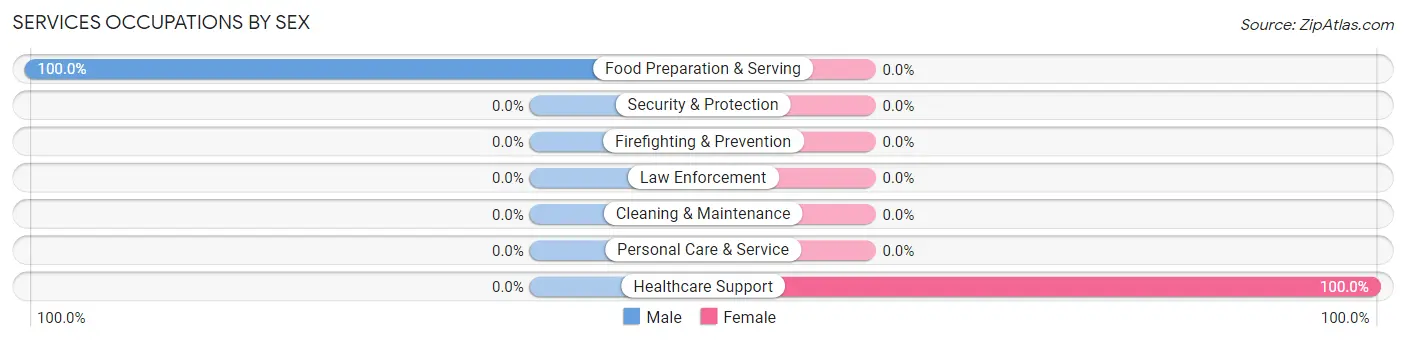
Services Occupations by Sex
Occupation
Male
Female
Healthcare Support
0 (0.0%)
2 (100.0%)
Security & Protection
0 (0.0%)
0 (0.0%)
Firefighting & Prevention
0 (0.0%)
0 (0.0%)
Law Enforcement
0 (0.0%)
0 (0.0%)
Food Preparation & Serving
2 (100.0%)
0 (0.0%)
Cleaning & Maintenance
0 (0.0%)
0 (0.0%)
Personal Care & Service
0 (0.0%)
0 (0.0%)
Total (Category)
2 (50.0%)
2 (50.0%)
Total (Overall)
17 (39.5%)
26 (60.5%)
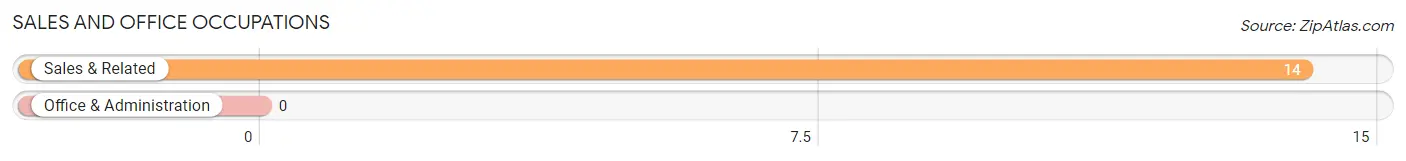
Sales and Office Occupations
The most common Sales and Office occupations in Cheyney University are , and Sales & Related (14 | 32.6%).
Sales and Office Occupations by Sex
Occupation
Male
Female
Sales & Related
14 (100.0%)
0 (0.0%)
Office & Administration
0 (0.0%)
0 (0.0%)
Total (Category)
14 (100.0%)
0 (0.0%)
Total (Overall)
17 (39.5%)
26 (60.5%)
Natural Resources, Construction and Maintenance Occupations
Natural Resources, Construction and Maintenance Occupations by Sex
Occupation
Male
Female
Farming, Fishing & Forestry
0 (0.0%)
0 (0.0%)
Construction & Extraction
0 (0.0%)
0 (0.0%)
Installation, Maintenance & Repair
0 (0.0%)
0 (0.0%)
Total (Category)
0 (0.0%)
0 (0.0%)
Total (Overall)
17 (39.5%)
26 (60.5%)
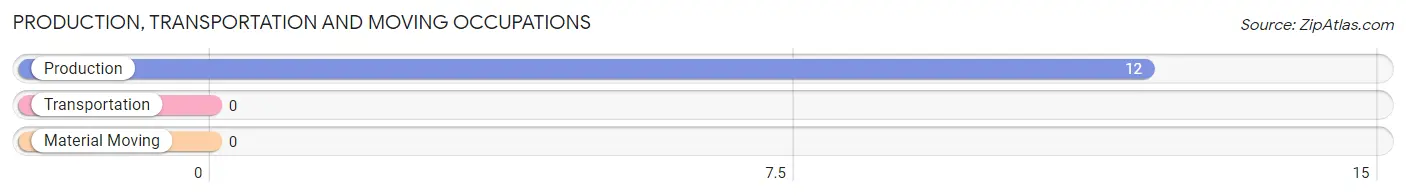
Production, Transportation and Moving Occupations
The most common Production, Transportation and Moving occupations in Cheyney University are , and Production (12 | 27.9%).
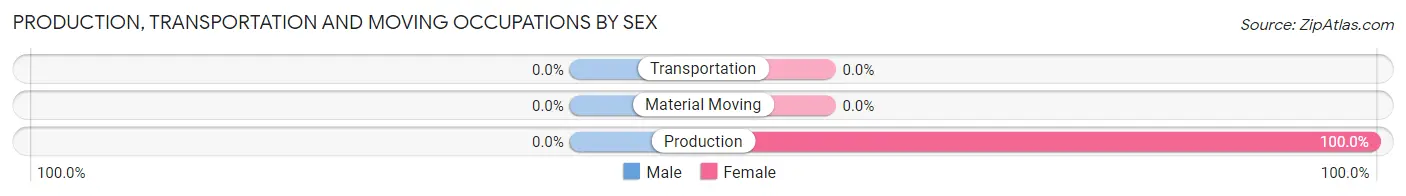
Production, Transportation and Moving Occupations by Sex
Occupation
Male
Female
Production
0 (0.0%)
12 (100.0%)
Transportation
0 (0.0%)
0 (0.0%)
Material Moving
0 (0.0%)
0 (0.0%)
Total (Category)
0 (0.0%)
12 (100.0%)
Total (Overall)
17 (39.5%)
26 (60.5%)
Employment Industries by Sex in Cheyney University
Employment Industries in Cheyney University
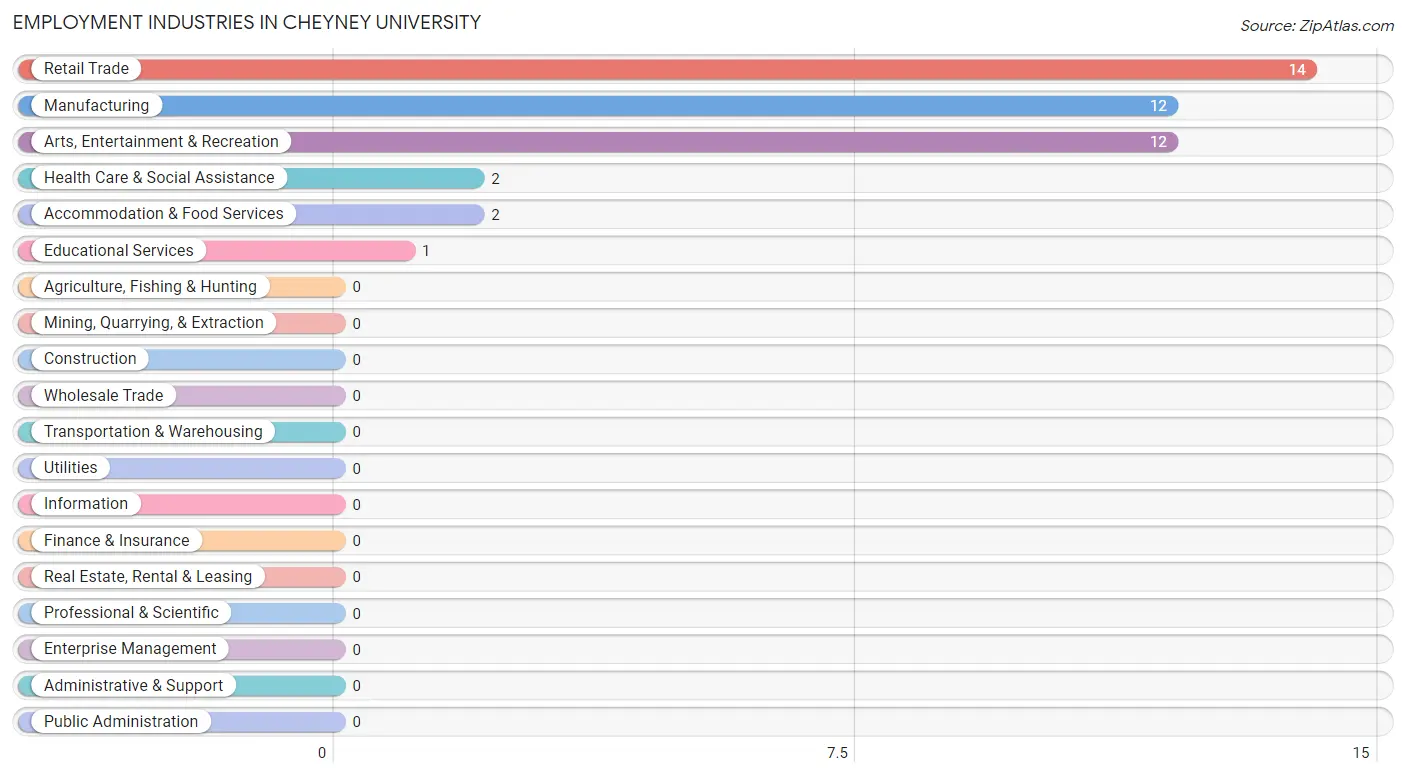
The major employment industries in Cheyney University include Retail Trade (14 | 32.6%), Manufacturing (12 | 27.9%), Arts, Entertainment & Recreation (12 | 27.9%), Health Care & Social Assistance (2 | 4.6%), and Accommodation & Food Services (2 | 4.6%).
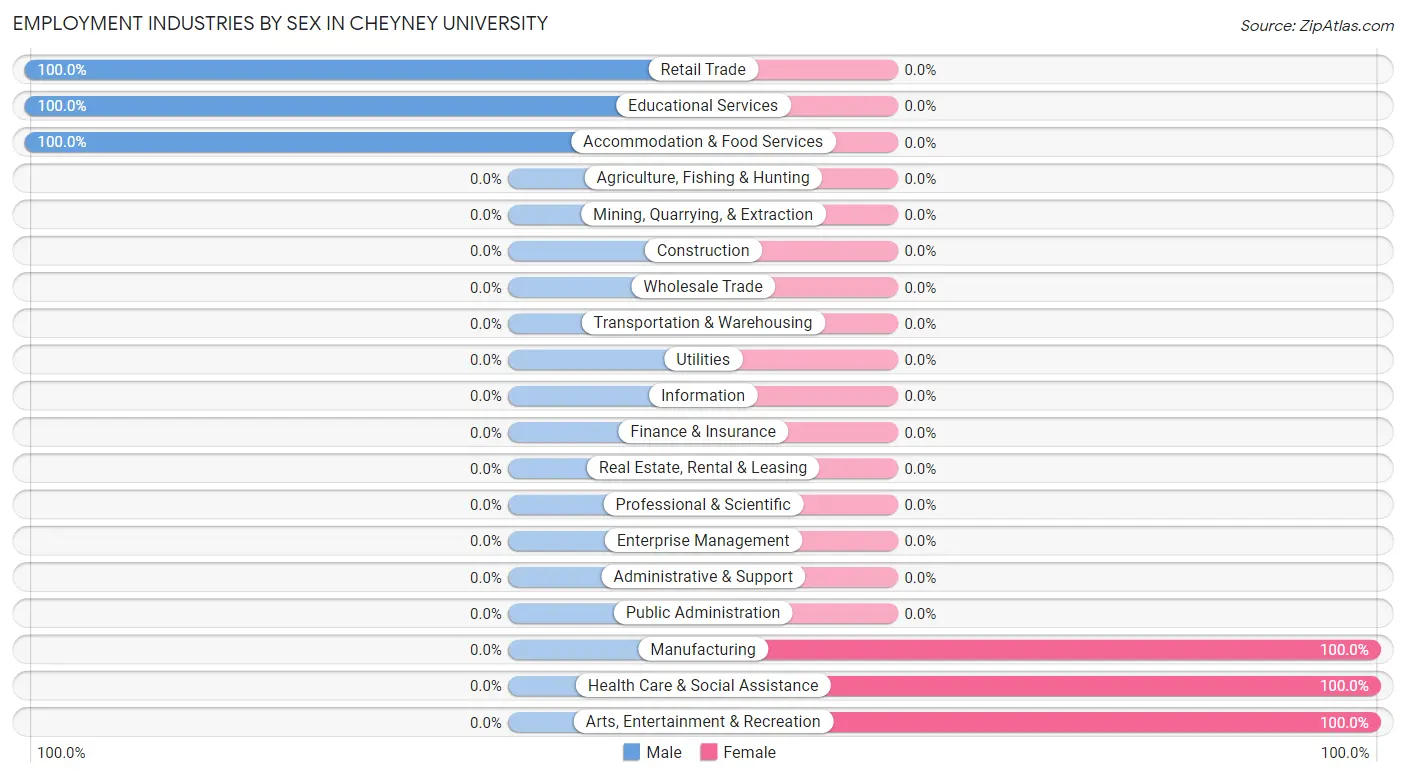
Employment Industries by Sex in Cheyney University
The Cheyney University industries that see more men than women are Retail Trade (100.0%), Educational Services (100.0%), and Accommodation & Food Services (100.0%), whereas the industries that tend to have a higher number of women are Manufacturing (100.0%), Health Care & Social Assistance (100.0%), and Arts, Entertainment & Recreation (100.0%).
Industry
Male
Female
Agriculture, Fishing & Hunting
0 (0.0%)
0 (0.0%)
Mining, Quarrying, & Extraction
0 (0.0%)
0 (0.0%)
Construction
0 (0.0%)
0 (0.0%)
Manufacturing
0 (0.0%)
12 (100.0%)
Wholesale Trade
0 (0.0%)
0 (0.0%)
Retail Trade
14 (100.0%)
0 (0.0%)
Transportation & Warehousing
0 (0.0%)
0 (0.0%)
Utilities
0 (0.0%)
0 (0.0%)
Information
0 (0.0%)
0 (0.0%)
Finance & Insurance
0 (0.0%)
0 (0.0%)
Real Estate, Rental & Leasing
0 (0.0%)
0 (0.0%)
Professional & Scientific
0 (0.0%)
0 (0.0%)
Enterprise Management
0 (0.0%)
0 (0.0%)
Administrative & Support
0 (0.0%)
0 (0.0%)
Educational Services
1 (100.0%)
0 (0.0%)
Health Care & Social Assistance
0 (0.0%)
2 (100.0%)
Arts, Entertainment & Recreation
0 (0.0%)
12 (100.0%)
Accommodation & Food Services
2 (100.0%)
0 (0.0%)
Public Administration
0 (0.0%)
0 (0.0%)
Total
17 (39.5%)
26 (60.5%)
Education in Cheyney University
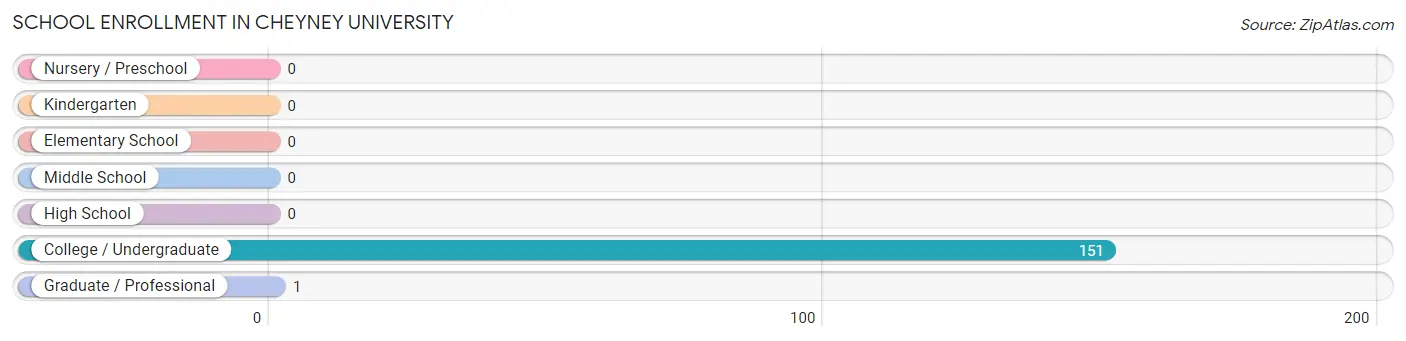
School Enrollment in Cheyney University
The most common levels of schooling among the 152 students in Cheyney University are college / undergraduate (151 | 99.3%), and graduate / professional (1 | 0.7%).
School Level
# Students
% Students
Nursery / Preschool
0
0.0%
Kindergarten
0
0.0%
Elementary School
0
0.0%
Middle School
0
0.0%
High School
0
0.0%
College / Undergraduate
151
99.3%
Graduate / Professional
1
0.7%
Total
152
100.0%
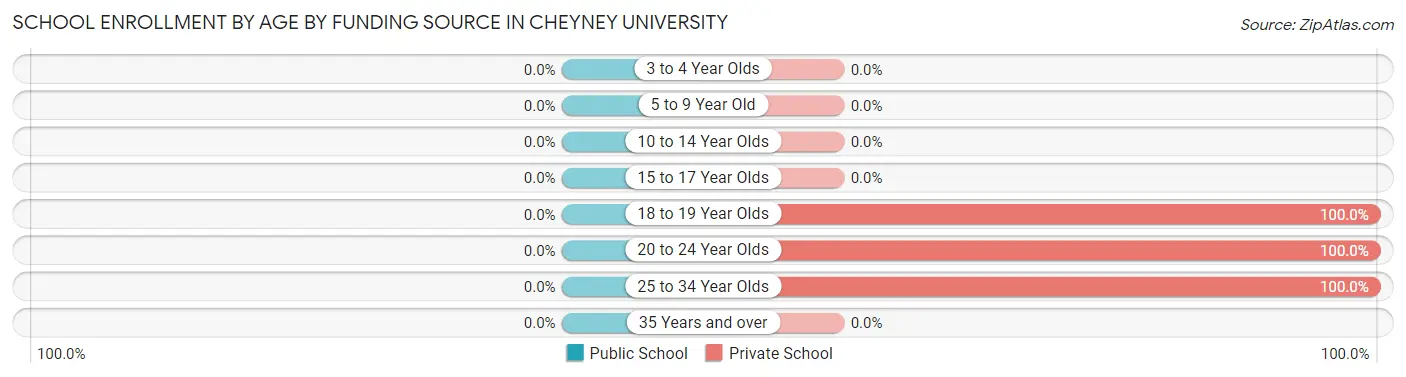
School Enrollment by Age by Funding Source in Cheyney University
Age Bracket
Public School
Private School
3 to 4 Year Olds
0 (0.0%)
0 (0.0%)
5 to 9 Year Old
0 (0.0%)
0 (0.0%)
10 to 14 Year Olds
0 (0.0%)
0 (0.0%)
15 to 17 Year Olds
0 (0.0%)
0 (0.0%)
18 to 19 Year Olds
0 (0.0%)
114 (100.0%)
20 to 24 Year Olds
0 (0.0%)
37 (100.0%)
25 to 34 Year Olds
0 (0.0%)
1 (100.0%)
35 Years and over
0 (0.0%)
0 (0.0%)
Total
0 (0.0%)
152 (100.0%)
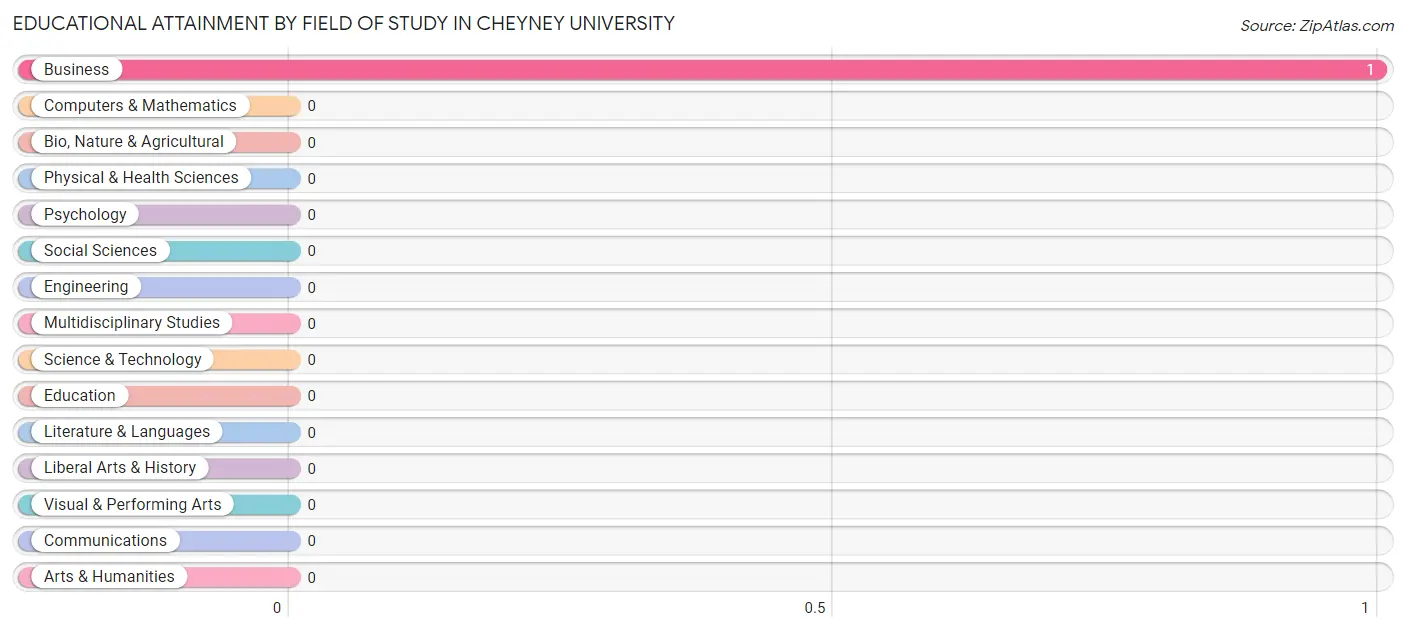
Educational Attainment by Field of Study in Cheyney University
, and business (1 | 100.0%) are the most common fields of study among 1 individuals in Cheyney University who have obtained a bachelor's degree or higher.
Field of Study
# Graduates
% Graduates
Computers & Mathematics
0
0.0%
Bio, Nature & Agricultural
0
0.0%
Physical & Health Sciences
0
0.0%
Psychology
0
0.0%
Social Sciences
0
0.0%
Engineering
0
0.0%
Multidisciplinary Studies
0
0.0%
Science & Technology
0
0.0%
Business
1
100.0%
Education
0
0.0%
Literature & Languages
0
0.0%
Liberal Arts & History
0
0.0%
Visual & Performing Arts
0
0.0%
Communications
0
0.0%
Arts & Humanities
0
0.0%
Total
1
100.0%
Transportation & Commute in Cheyney University
Vehicle Availability by Sex in Cheyney University
Vehicles Available
Male
Female
No Vehicle
0 (0.0%)
0 (0.0%)
1 Vehicle
0 (0.0%)
0 (0.0%)
2 Vehicles
0 (0.0%)
0 (0.0%)
3 Vehicles
0 (0.0%)
0 (0.0%)
4 Vehicles
0 (0.0%)
0 (0.0%)
5 or more Vehicles
0 (0.0%)
0 (0.0%)
Total
0 (0.0%)
0 (0.0%)
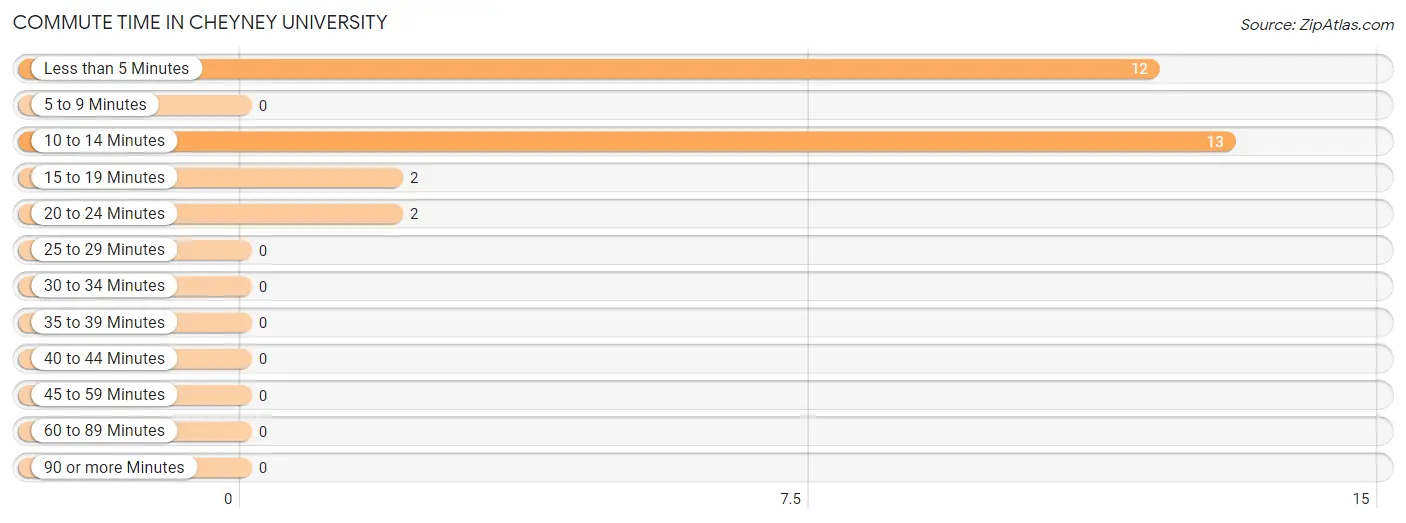
Commute Time in Cheyney University
The most frequently occuring commute durations in Cheyney University are 10 to 14 minutes (13 commuters, 44.8%), less than 5 minutes (12 commuters, 41.4%), and 15 to 19 minutes (2 commuters, 6.9%).
Commute Time
# Commuters
% Commuters
Less than 5 Minutes
12
41.4%
5 to 9 Minutes
0
0.0%
10 to 14 Minutes
13
44.8%
15 to 19 Minutes
2
6.9%
20 to 24 Minutes
2
6.9%
25 to 29 Minutes
0
0.0%
30 to 34 Minutes
0
0.0%
35 to 39 Minutes
0
0.0%
40 to 44 Minutes
0
0.0%
45 to 59 Minutes
0
0.0%
60 to 89 Minutes
0
0.0%
90 or more Minutes
0
0.0%
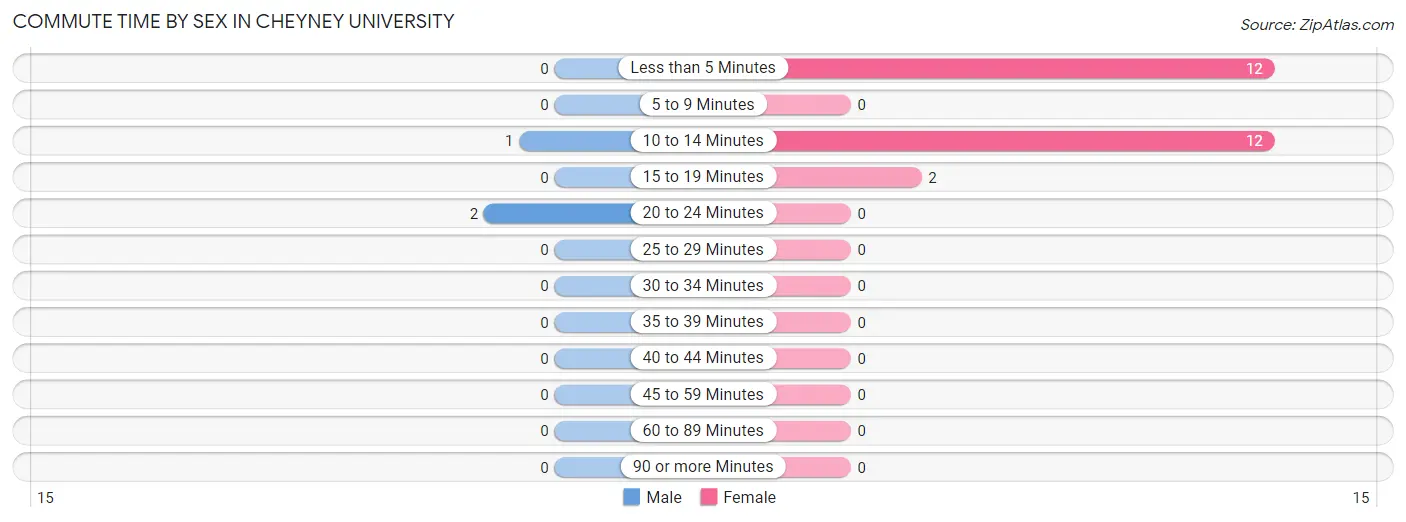
Commute Time by Sex in Cheyney University
The most common commute times in Cheyney University are 20 to 24 minutes (2 commuters, 66.7%) for males and less than 5 minutes (12 commuters, 46.2%) for females.
Commute Time
Male
Female
Less than 5 Minutes
0 (0.0%)
12 (46.2%)
5 to 9 Minutes
0 (0.0%)
0 (0.0%)
10 to 14 Minutes
1 (33.3%)
12 (46.2%)
15 to 19 Minutes
0 (0.0%)
2 (7.7%)
20 to 24 Minutes
2 (66.7%)
0 (0.0%)
25 to 29 Minutes
0 (0.0%)
0 (0.0%)
30 to 34 Minutes
0 (0.0%)
0 (0.0%)
35 to 39 Minutes
0 (0.0%)
0 (0.0%)
40 to 44 Minutes
0 (0.0%)
0 (0.0%)
45 to 59 Minutes
0 (0.0%)
0 (0.0%)
60 to 89 Minutes
0 (0.0%)
0 (0.0%)
90 or more Minutes
0 (0.0%)
0 (0.0%)
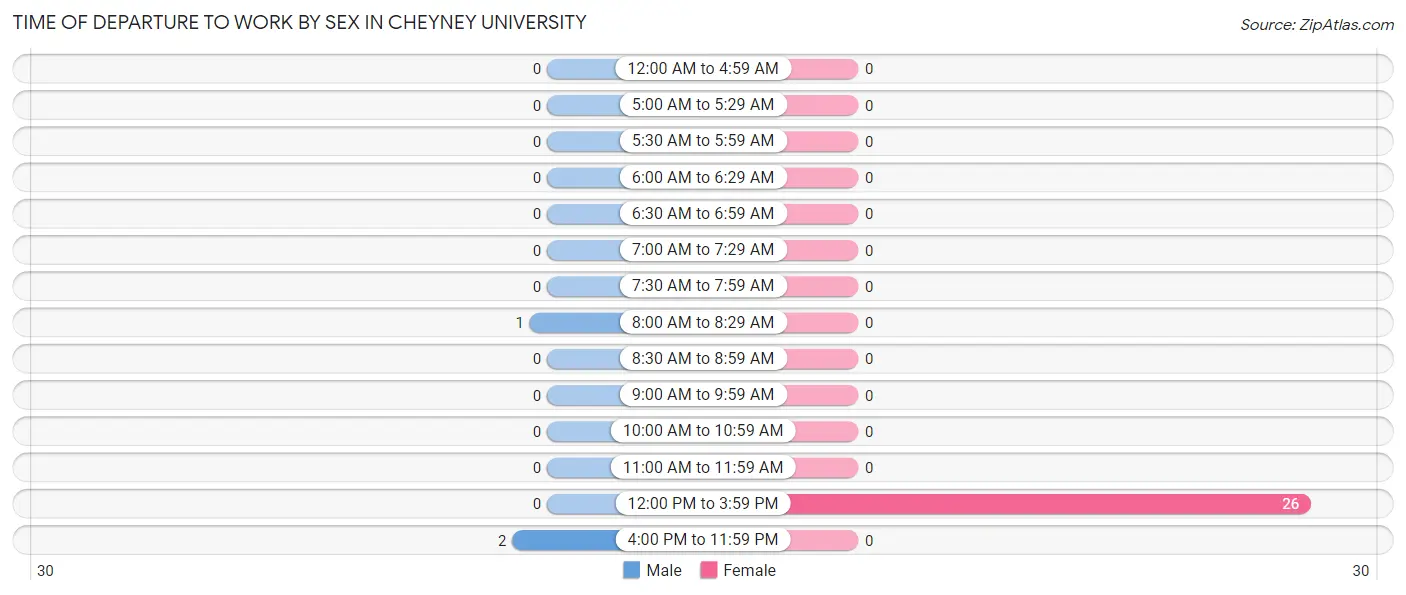
Time of Departure to Work by Sex in Cheyney University
The most frequent times of departure to work in Cheyney University are 4:00 PM to 11:59 PM (2, 66.7%) for males and 12:00 PM to 3:59 PM (26, 100.0%) for females.
Time of Departure
Male
Female
12:00 AM to 4:59 AM
0 (0.0%)
0 (0.0%)
5:00 AM to 5:29 AM
0 (0.0%)
0 (0.0%)
5:30 AM to 5:59 AM
0 (0.0%)
0 (0.0%)
6:00 AM to 6:29 AM
0 (0.0%)
0 (0.0%)
6:30 AM to 6:59 AM
0 (0.0%)
0 (0.0%)
7:00 AM to 7:29 AM
0 (0.0%)
0 (0.0%)
7:30 AM to 7:59 AM
0 (0.0%)
0 (0.0%)
8:00 AM to 8:29 AM
1 (33.3%)
0 (0.0%)
8:30 AM to 8:59 AM
0 (0.0%)
0 (0.0%)
9:00 AM to 9:59 AM
0 (0.0%)
0 (0.0%)
10:00 AM to 10:59 AM
0 (0.0%)
0 (0.0%)
11:00 AM to 11:59 AM
0 (0.0%)
0 (0.0%)
12:00 PM to 3:59 PM
0 (0.0%)
26 (100.0%)
4:00 PM to 11:59 PM
2 (66.7%)
0 (0.0%)
Total
3 (100.0%)
26 (100.0%)
Housing Occupancy in Cheyney University
Occupancy by Ownership in Cheyney University
Occupancy
# Housing Units
% Housing Units
Owner Occupied Housing Units
0
0.0%
Renter-Occupied Housing Units
0
0.0%
Total Occupied Housing Units
0
0.0%
Occupancy by Household Size in Cheyney University
Household Size
# Housing Units
% Housing Units
1-Person Household
0
0.0%
2-Person Household
0
0.0%
3-Person Household
0
0.0%
4+ Person Household
0
0.0%
Total Housing Units
0
0.0%
Occupancy by Ownership by Household Size in Cheyney University
Household Size
Owner-occupied
Renter-occupied
1-Person Household
0 (0.0%)
0 (0.0%)
2-Person Household
0 (0.0%)
0 (0.0%)
3-Person Household
0 (0.0%)
0 (0.0%)
4+ Person Household
0 (0.0%)
0 (0.0%)
Total Housing Units
0 (0.0%)
0 (0.0%)
Occupancy by Educational Attainment in Cheyney University
Household Size
Owner-occupied
Renter-occupied
Less than High School
0 (0.0%)
0 (0.0%)
High School Diploma
0 (0.0%)
0 (0.0%)
College/Associate Degree
0 (0.0%)
0 (0.0%)
Bachelor's Degree or higher
0 (0.0%)
0 (0.0%)
Occupancy by Age of Householder in Cheyney University
Age Bracket
# Households
% Households
Under 35 Years
0
0.0%
35 to 44 Years
0
0.0%
45 to 54 Years
0
0.0%
55 to 64 Years
0
0.0%
65 to 74 Years
0
0.0%
75 to 84 Years
0
0.0%
85 Years and Over
0
0.0%
Total
0
0.0%
Housing Finances in Cheyney University
Median Income by Occupancy in Cheyney University
Occupancy Type
# Households
Median Income
Owner-Occupied
0 (0.0%)
$0
Renter-Occupied
0 (0.0%)
$0
Average
0 (0.0%)
$0
Occupancy by Householder Income Bracket in Cheyney University
Income Bracket
Owner-occupied
Renter-occupied
Less than $5,000
0 (0.0%)
0 (0.0%)
$5,000 to $9,999
0 (0.0%)
0 (0.0%)
$10,000 to $14,999
0 (0.0%)
0 (0.0%)
$15,000 to $19,999
0 (0.0%)
0 (0.0%)
$20,000 to $24,999
0 (0.0%)
0 (0.0%)
$25,000 to $34,999
0 (0.0%)
0 (0.0%)
$35,000 to $49,999
0 (0.0%)
0 (0.0%)
$50,000 to $74,999
0 (0.0%)
0 (0.0%)
$75,000 to $99,999
0 (0.0%)
0 (0.0%)
$100,000 to $149,999
0 (0.0%)
0 (0.0%)
$150,000 or more
0 (0.0%)
0 (0.0%)
Total
0 (0.0%)
0 (0.0%)
Monthly Housing Cost Tiers in Cheyney University
Monthly Cost
Owner-occupied
Renter-occupied
Less than $300
0 (0.0%)
0 (0.0%)
$300 to $499
0 (0.0%)
0 (0.0%)
$500 to $799
0 (0.0%)
0 (0.0%)
$800 to $999
0 (0.0%)
0 (0.0%)
$1,000 to $1,499
0 (0.0%)
0 (0.0%)
$1,500 to $1,999
0 (0.0%)
0 (0.0%)
$2,000 to $2,499
0 (0.0%)
0 (0.0%)
$2,500 to $2,999
0 (0.0%)
0 (0.0%)
$3,000 or more
0 (0.0%)
0 (0.0%)
Total
0 (0.0%)
0 (0.0%)
Physical Housing Characteristics in Cheyney University
Housing Structures in Cheyney University
Structure Type
# Housing Units
% Housing Units
Single Unit, Detached
0
0.0%
Single Unit, Attached
0
0.0%
2 Unit Apartments
0
0.0%
3 or 4 Unit Apartments
0
0.0%
5 to 9 Unit Apartments
0
0.0%
10 or more Apartments
0
0.0%
Mobile Home / Other
0
0.0%
Total
0
0.0%
Housing Structures by Occupancy in Cheyney University
Structure Type
Owner-occupied
Renter-occupied
Single Unit, Detached
0 (0.0%)
0 (0.0%)
Single Unit, Attached
0 (0.0%)
0 (0.0%)
2 Unit Apartments
0 (0.0%)
0 (0.0%)
3 or 4 Unit Apartments
0 (0.0%)
0 (0.0%)
5 to 9 Unit Apartments
0 (0.0%)
0 (0.0%)
10 or more Apartments
0 (0.0%)
0 (0.0%)
Mobile Home / Other
0 (0.0%)
0 (0.0%)
Total
0 (0.0%)
0 (0.0%)
Housing Structures by Number of Rooms in Cheyney University
Number of Rooms
Owner-occupied
Renter-occupied
1 Room
0 (0.0%)
0 (0.0%)
2 or 3 Rooms
0 (0.0%)
0 (0.0%)
4 or 5 Rooms
0 (0.0%)
0 (0.0%)
6 or 7 Rooms
0 (0.0%)
0 (0.0%)
8 or more Rooms
0 (0.0%)
0 (0.0%)
Total
0 (0.0%)
0 (0.0%)
Housing Structure by Heating Type in Cheyney University
Heating Type
Owner-occupied
Renter-occupied
Utility Gas
0 (0.0%)
0 (0.0%)
Bottled, Tank, or LP Gas
0 (0.0%)
0 (0.0%)
Electricity
0 (0.0%)
0 (0.0%)
Fuel Oil or Kerosene
0 (0.0%)
0 (0.0%)
Coal or Coke
0 (0.0%)
0 (0.0%)
All other Fuels
0 (0.0%)
0 (0.0%)
No Fuel Used
0 (0.0%)
0 (0.0%)
Total
0 (0.0%)
0 (0.0%)
Household Vehicle Usage in Cheyney University
Vehicles per Household
Owner-occupied
Renter-occupied
No Vehicle
0 (0.0%)
0 (0.0%)
1 Vehicle
0 (0.0%)
0 (0.0%)
2 Vehicles
0 (0.0%)
0 (0.0%)
3 or more Vehicles
0 (0.0%)
0 (0.0%)
Total
0 (0.0%)
0 (0.0%)
Real Estate & Mortgages in Cheyney University
Real Estate and Mortgage Overview in Cheyney University
Characteristic
Without Mortgage
With Mortgage
Housing Units
0
0
Median Property Value
-
-
Median Household Income
-
-
Monthly Housing Costs
-
-
Real Estate Taxes
-
-
Property Value by Mortgage Status in Cheyney University
Property Value
Without Mortgage
With Mortgage
Less than $50,000
0 (0.0%)
0 (0.0%)
$50,000 to $99,999
0 (0.0%)
0 (0.0%)
$100,000 to $299,999
0 (0.0%)
0 (0.0%)
$300,000 to $499,999
0 (0.0%)
0 (0.0%)
$500,000 to $749,999
0 (0.0%)
0 (0.0%)
$750,000 to $999,999
0 (0.0%)
0 (0.0%)
$1,000,000 or more
0 (0.0%)
0 (0.0%)
Total
0 (0.0%)
0 (0.0%)
Household Income by Mortgage Status in Cheyney University
Household Income
Without Mortgage
With Mortgage
Less than $10,000
0 (0.0%)
0 (0.0%)
$10,000 to $24,999
0 (0.0%)
0 (0.0%)
$25,000 to $34,999
0 (0.0%)
0 (0.0%)
$35,000 to $49,999
0 (0.0%)
0 (0.0%)
$50,000 to $74,999
0 (0.0%)
0 (0.0%)
$75,000 to $99,999
0 (0.0%)
0 (0.0%)
$100,000 to $149,999
0 (0.0%)
0 (0.0%)
$150,000 or more
0 (0.0%)
0 (0.0%)
Total
0 (0.0%)
0 (0.0%)
Property Value to Household Income Ratio in Cheyney University
Value-to-Income Ratio
Without Mortgage
With Mortgage
Less than 2.0x
0 (0.0%)
0 (0.0%)
2.0x to 2.9x
0 (0.0%)
0 (0.0%)
3.0x to 3.9x
0 (0.0%)
0 (0.0%)
4.0x or more
0 (0.0%)
0 (0.0%)
Total
0 (0.0%)
0 (0.0%)
Real Estate Taxes by Mortgage Status in Cheyney University
Property Taxes
Without Mortgage
With Mortgage
Less than $800
0 (0.0%)
0 (0.0%)
$800 to $1,499
0 (0.0%)
0 (0.0%)
$800 to $1,499
0 (0.0%)
0 (0.0%)
Total
0 (0.0%)
0 (0.0%)
Health & Disability in Cheyney University
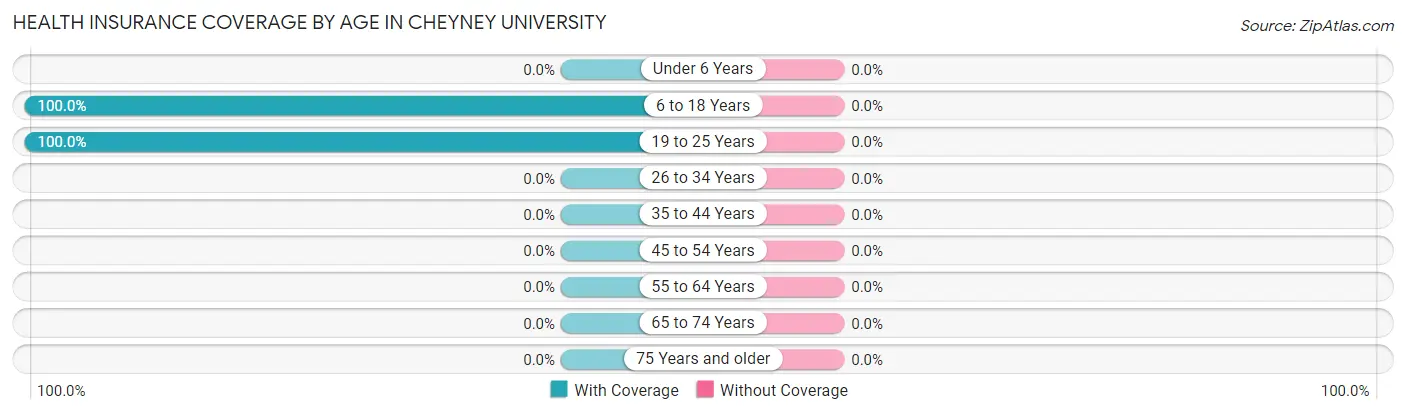
Health Insurance Coverage by Age in Cheyney University
Age Bracket
With Coverage
Without Coverage
Under 6 Years
0 (0.0%)
0 (0.0%)
6 to 18 Years
46 (100.0%)
0 (0.0%)
19 to 25 Years
106 (100.0%)
0 (0.0%)
26 to 34 Years
0 (0.0%)
0 (0.0%)
35 to 44 Years
0 (0.0%)
0 (0.0%)
45 to 54 Years
0 (0.0%)
0 (0.0%)
55 to 64 Years
0 (0.0%)
0 (0.0%)
65 to 74 Years
0 (0.0%)
0 (0.0%)
75 Years and older
0 (0.0%)
0 (0.0%)
Total
152 (100.0%)
0 (0.0%)
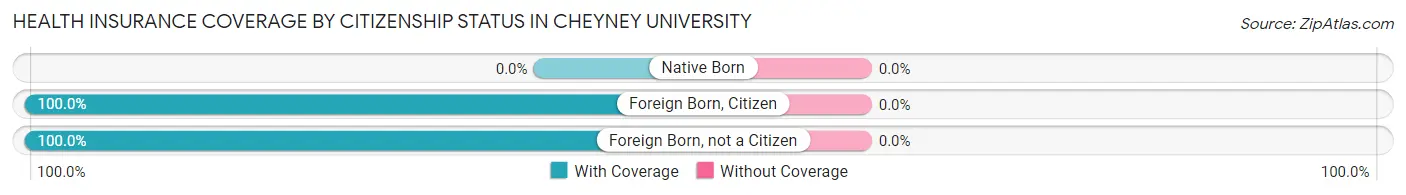
Health Insurance Coverage by Citizenship Status in Cheyney University
Citizenship Status
With Coverage
Without Coverage
Native Born
0 (0.0%)
0 (0.0%)
Foreign Born, Citizen
46 (100.0%)
0 (0.0%)
Foreign Born, not a Citizen
106 (100.0%)
0 (0.0%)
Health Insurance Coverage by Household Income in Cheyney University
Household Income
With Coverage
Without Coverage
Under $25,000
0 (0.0%)
0 (0.0%)
$25,000 to $49,999
0 (0.0%)
0 (0.0%)
$50,000 to $74,999
0 (0.0%)
0 (0.0%)
$75,000 to $99,999
0 (0.0%)
0 (0.0%)
$100,000 and over
0 (0.0%)
0 (0.0%)
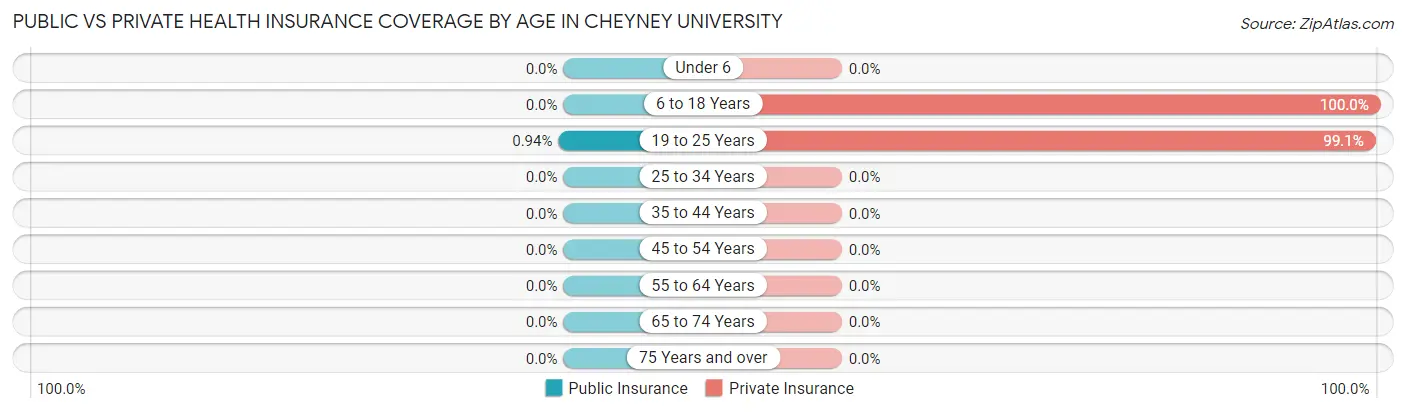
Public vs Private Health Insurance Coverage by Age in Cheyney University
Age Bracket
Public Insurance
Private Insurance
Under 6
0 (0.0%)
0 (0.0%)
6 to 18 Years
0 (0.0%)
46 (100.0%)
19 to 25 Years
1 (0.9%)
105 (99.1%)
25 to 34 Years
0 (0.0%)
0 (0.0%)
35 to 44 Years
0 (0.0%)
0 (0.0%)
45 to 54 Years
0 (0.0%)
0 (0.0%)
55 to 64 Years
0 (0.0%)
0 (0.0%)
65 to 74 Years
0 (0.0%)
0 (0.0%)
75 Years and over
0 (0.0%)
0 (0.0%)
Total
1 (0.7%)
151 (99.3%)
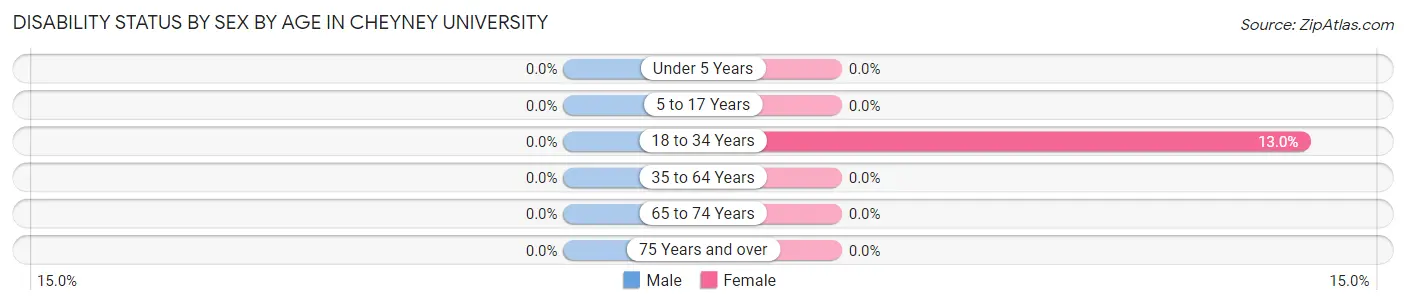
Disability Status by Sex by Age in Cheyney University
Age Bracket
Male
Female
Under 5 Years
0 (0.0%)
0 (0.0%)
5 to 17 Years
0 (0.0%)
0 (0.0%)
18 to 34 Years
0 (0.0%)
12 (13.0%)
35 to 64 Years
0 (0.0%)
0 (0.0%)
65 to 74 Years
0 (0.0%)
0 (0.0%)
75 Years and over
0 (0.0%)
0 (0.0%)
Disability Class by Sex by Age in Cheyney University
Disability Class: Hearing Difficulty
Age Bracket
Male
Female
Under 5 Years
0 (0.0%)
0 (0.0%)
5 to 17 Years
0 (0.0%)
0 (0.0%)
18 to 34 Years
0 (0.0%)
0 (0.0%)
35 to 64 Years
0 (0.0%)
0 (0.0%)
65 to 74 Years
0 (0.0%)
0 (0.0%)
75 Years and over
0 (0.0%)
0 (0.0%)
Disability Class: Vision Difficulty
Age Bracket
Male
Female
Under 5 Years
0 (0.0%)
0 (0.0%)
5 to 17 Years
0 (0.0%)
0 (0.0%)
18 to 34 Years
0 (0.0%)
0 (0.0%)
35 to 64 Years
0 (0.0%)
0 (0.0%)
65 to 74 Years
0 (0.0%)
0 (0.0%)
75 Years and over
0 (0.0%)
0 (0.0%)
Disability Class: Cognitive Difficulty
Age Bracket
Male
Female
5 to 17 Years
0 (0.0%)
0 (0.0%)
18 to 34 Years
0 (0.0%)
0 (0.0%)
35 to 64 Years
0 (0.0%)
0 (0.0%)
65 to 74 Years
0 (0.0%)
0 (0.0%)
75 Years and over
0 (0.0%)
0 (0.0%)
Disability Class: Ambulatory Difficulty
Age Bracket
Male
Female
5 to 17 Years
0 (0.0%)
0 (0.0%)
18 to 34 Years
0 (0.0%)
0 (0.0%)
35 to 64 Years
0 (0.0%)
0 (0.0%)
65 to 74 Years
0 (0.0%)
0 (0.0%)
75 Years and over
0 (0.0%)
0 (0.0%)
Disability Class: Self-Care Difficulty
Age Bracket
Male
Female
5 to 17 Years
0 (0.0%)
0 (0.0%)
18 to 34 Years
0 (0.0%)
0 (0.0%)
35 to 64 Years
0 (0.0%)
0 (0.0%)
65 to 74 Years
0 (0.0%)
0 (0.0%)
75 Years and over
0 (0.0%)
0 (0.0%)
Technology Access in Cheyney University
Computing Device Access in Cheyney University
Device Type
# Households
% Households
Desktop or Laptop
0
0.0%
Smartphone
0
0.0%
Tablet
0
0.0%
No Computing Device
0
0.0%
Total
0
0.0%
Internet Access in Cheyney University
Internet Type
# Households
% Households
Dial-Up Internet
0
0.0%
Broadband Home
0
0.0%
Cellular Data Only
0
0.0%
Satellite Internet
0
0.0%
No Internet
0
0.0%
Total
0
0.0%
Cheyney University Summary
Cheyney University of Pennsylvania is the oldest historically black college in the United States. Founded in 1837, it is located in the small town of Cheyney, Pennsylvania, about 25 miles west of Philadelphia. The university has a long and proud history of providing educational opportunities to African Americans and other minority students.
History
Cheyney University was founded in 1837 by Richard Humphreys, a Quaker philanthropist, as the Institute for Colored Youth. Humphreys was a strong advocate for the education of African Americans and believed that education was the key to racial equality. The school was originally located in Philadelphia, but was moved to its current location in 1854.
The school was renamed Cheyney University of Pennsylvania in 1983, in honor of its founder, Richard Humphreys. The university has a long history of providing educational opportunities to African Americans and other minority students. It was the first college in the United States to offer a four-year degree program for African Americans.
Geography
Cheyney University is located in the small town of Cheyney, Pennsylvania, about 25 miles west of Philadelphia. The university is situated on a beautiful, wooded campus of over 200 acres. The campus is home to a variety of buildings, including academic buildings, residence halls, and athletic facilities.
The town of Cheyney is a small, rural community with a population of about 1,500 people. The town is located in Delaware County, Pennsylvania, and is part of the Philadelphia metropolitan area. The town is home to a variety of businesses, including restaurants, shops, and a post office.
Economy
Cheyney University is an important part of the local economy. The university provides jobs for faculty and staff, and its students contribute to the local economy by spending money in the town. The university also provides educational opportunities to the local community, and its graduates often stay in the area and contribute to the local economy.
The town of Cheyney is also home to a variety of businesses, including restaurants, shops, and a post office. The town is also home to a number of small manufacturing businesses, which provide jobs for local residents.
Demographics
As of the 2010 census, the population of Cheyney was 1,500 people. The population is predominantly African American, with about 95% of the population identifying as African American. The median household income is $37,000, and the median age is 33.
Cheyney University has a diverse student body, with students from all over the United States and from many different backgrounds. The university has a strong commitment to diversity and inclusion, and is dedicated to providing educational opportunities to all students, regardless of race, gender, or socioeconomic status.
Common Questions
What is Per Capita Income in Cheyney University?
Per Capita income in Cheyney University is $5,297.
What is Income or Wage Gap in Cheyney University?
Income or Wage Gap in Cheyney University is 21.9%.
Women in Cheyney University earn 78.1 cents for every dollar earned by a man.
What is the Total Population of Cheyney University?
Total Population of Cheyney University is 152.
What is the Total Male Population of Cheyney University?
Total Male Population of Cheyney University is 60.
What is the Total Female Population of Cheyney University?
Total Female Population of Cheyney University is 92.
What is the Ratio of Males per 100 Females in Cheyney University?
There are 65.22 Males per 100 Females in Cheyney University.
What is the Ratio of Females per 100 Males in Cheyney University?
There are 153.33 Females per 100 Males in Cheyney University.
What is the Median Population Age in Cheyney University?
Median Population Age in Cheyney University is 19.4 Years.
How Large is the Labor Force in Cheyney University?
There are 43 People in the Labor Forcein in Cheyney University.
What is the Percentage of People in the Labor Force in Cheyney University?
28.3% of People are in the Labor Force in Cheyney University.
Report Title
Report Link
HTML Copy & Paste Link
Social Media
Copy and paste the folowing code into any webpage where you would like this interactive chart to display