Glenburn, PA Map & Demographics
Glenburn Map
Glenburn Overview
$54,238
PER CAPITA INCOME
$122,917
AVG FAMILY INCOME
$84,659
AVG HOUSEHOLD INCOME
44.8%
WAGE / INCOME GAP [ % ]
55.2¢/ $1
WAGE / INCOME GAP [ $ ]
$16,663
FAMILY INCOME DEFICIT
0.51
INEQUALITY / GINI INDEX
1,112
TOTAL POPULATION
542
MALE POPULATION
570
FEMALE POPULATION
95.09
MALES / 100 FEMALES
105.17
FEMALES / 100 MALES
38.9
MEDIAN AGE
3.1
AVG FAMILY SIZE
2.6
AVG HOUSEHOLD SIZE
541
LABOR FORCE [ PEOPLE ]
65.8%
PERCENT IN LABOR FORCE
9.6%
UNEMPLOYMENT RATE
Income in Glenburn
Income Overview in Glenburn
Per Capita Income in Glenburn is $54,238, while median incomes of families and households are $122,917 and $84,659 respectively.
| Characteristic | Number | Measure |
| Per Capita Income | 1,112 | $54,238 |
| Median Family Income | 295 | $122,917 |
| Mean Family Income | 295 | $170,725 |
| Median Household Income | 435 | $84,659 |
| Mean Household Income | 435 | $137,933 |
| Income Deficit | 295 | $16,663 |
| Wage / Income Gap (%) | 1,112 | 44.77% |
| Wage / Income Gap ($) | 1,112 | 55.23¢ per $1 |
| Gini / Inequality Index | 1,112 | 0.51 |
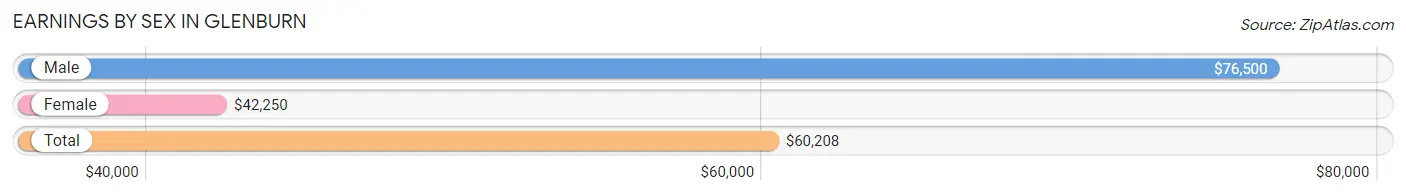
Earnings by Sex in Glenburn
Average Earnings in Glenburn are $60,208, $76,500 for men and $42,250 for women, a difference of 44.8%.
| Sex | Number | Average Earnings |
| Male | 300 (54.4%) | $76,500 |
| Female | 251 (45.6%) | $42,250 |
| Total | 551 (100.0%) | $60,208 |
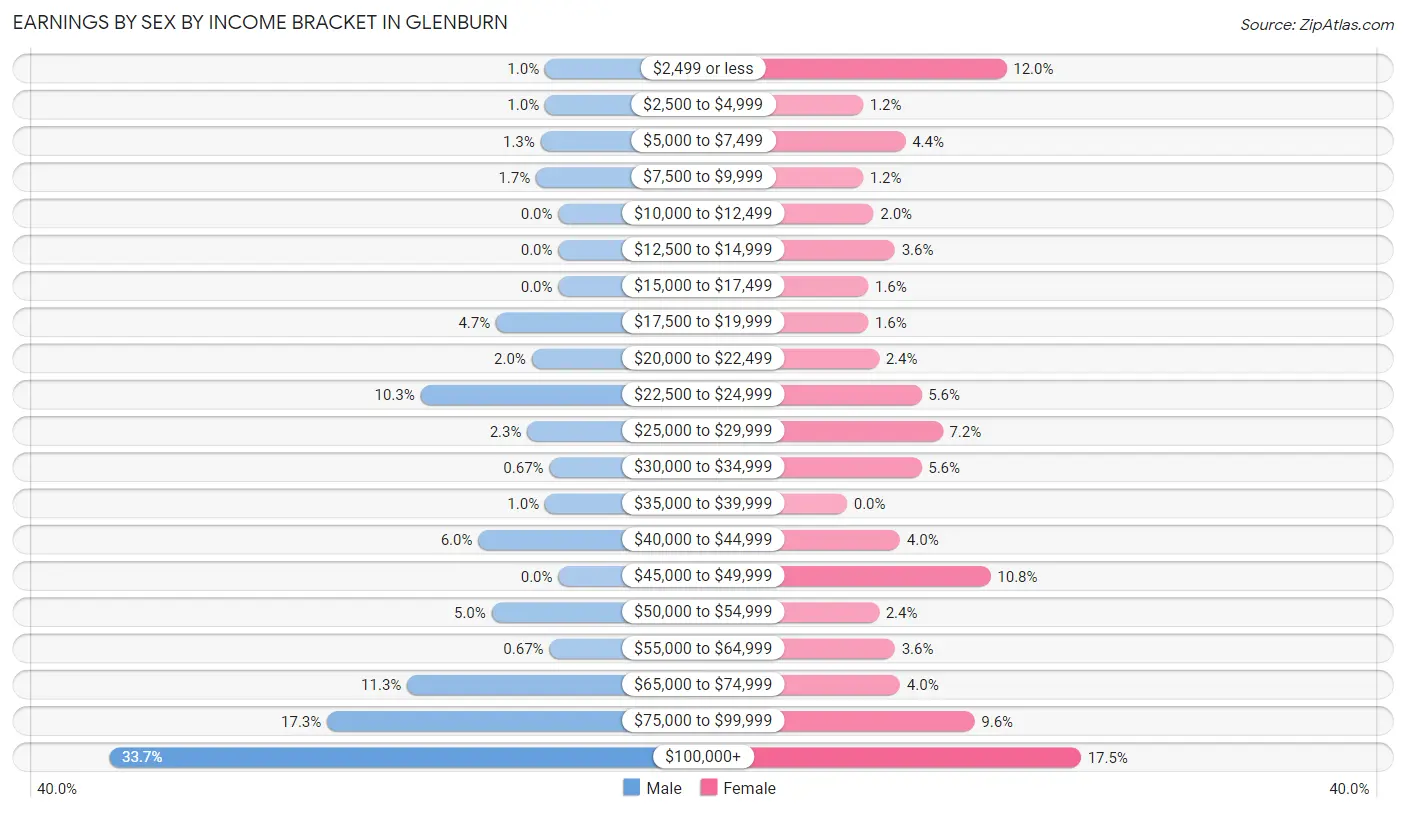
Earnings by Sex by Income Bracket in Glenburn
The most common earnings brackets in Glenburn are $100,000+ for men (101 | 33.7%) and $100,000+ for women (44 | 17.5%).
| Income | Male | Female |
| $2,499 or less | 3 (1.0%) | 30 (11.9%) |
| $2,500 to $4,999 | 3 (1.0%) | 3 (1.2%) |
| $5,000 to $7,499 | 4 (1.3%) | 11 (4.4%) |
| $7,500 to $9,999 | 5 (1.7%) | 3 (1.2%) |
| $10,000 to $12,499 | 0 (0.0%) | 5 (2.0%) |
| $12,500 to $14,999 | 0 (0.0%) | 9 (3.6%) |
| $15,000 to $17,499 | 0 (0.0%) | 4 (1.6%) |
| $17,500 to $19,999 | 14 (4.7%) | 4 (1.6%) |
| $20,000 to $22,499 | 6 (2.0%) | 6 (2.4%) |
| $22,500 to $24,999 | 31 (10.3%) | 14 (5.6%) |
| $25,000 to $29,999 | 7 (2.3%) | 18 (7.2%) |
| $30,000 to $34,999 | 2 (0.7%) | 14 (5.6%) |
| $35,000 to $39,999 | 3 (1.0%) | 0 (0.0%) |
| $40,000 to $44,999 | 18 (6.0%) | 10 (4.0%) |
| $45,000 to $49,999 | 0 (0.0%) | 27 (10.8%) |
| $50,000 to $54,999 | 15 (5.0%) | 6 (2.4%) |
| $55,000 to $64,999 | 2 (0.7%) | 9 (3.6%) |
| $65,000 to $74,999 | 34 (11.3%) | 10 (4.0%) |
| $75,000 to $99,999 | 52 (17.3%) | 24 (9.6%) |
| $100,000+ | 101 (33.7%) | 44 (17.5%) |
| Total | 300 (100.0%) | 251 (100.0%) |
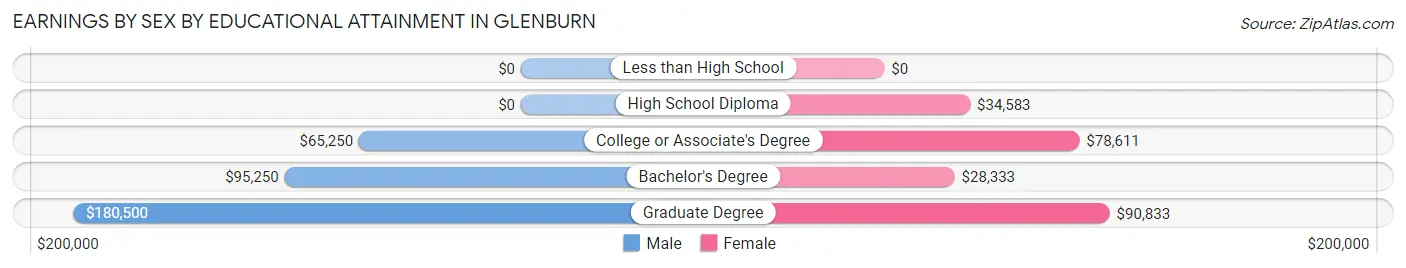
Earnings by Sex by Educational Attainment in Glenburn
Average earnings in Glenburn are $79,750 for men and $45,324 for women, a difference of 43.2%. Men with an educational attainment of graduate degree enjoy the highest average annual earnings of $180,500, while those with college or associate's degree education earn the least with $65,250. Women with an educational attainment of graduate degree earn the most with the average annual earnings of $90,833, while those with bachelor's degree education have the smallest earnings of $28,333.
| Educational Attainment | Male Income | Female Income |
| Less than High School | - | - |
| High School Diploma | - | - |
| College or Associate's Degree | $65,250 | $78,611 |
| Bachelor's Degree | $95,250 | $28,333 |
| Graduate Degree | $180,500 | $90,833 |
| Total | $79,750 | $45,324 |
Family Income in Glenburn
Family Income Brackets in Glenburn
According to the Glenburn family income data, there are 69 families falling into the $200,000+ income range, which is the most common income bracket and makes up 23.4% of all families.
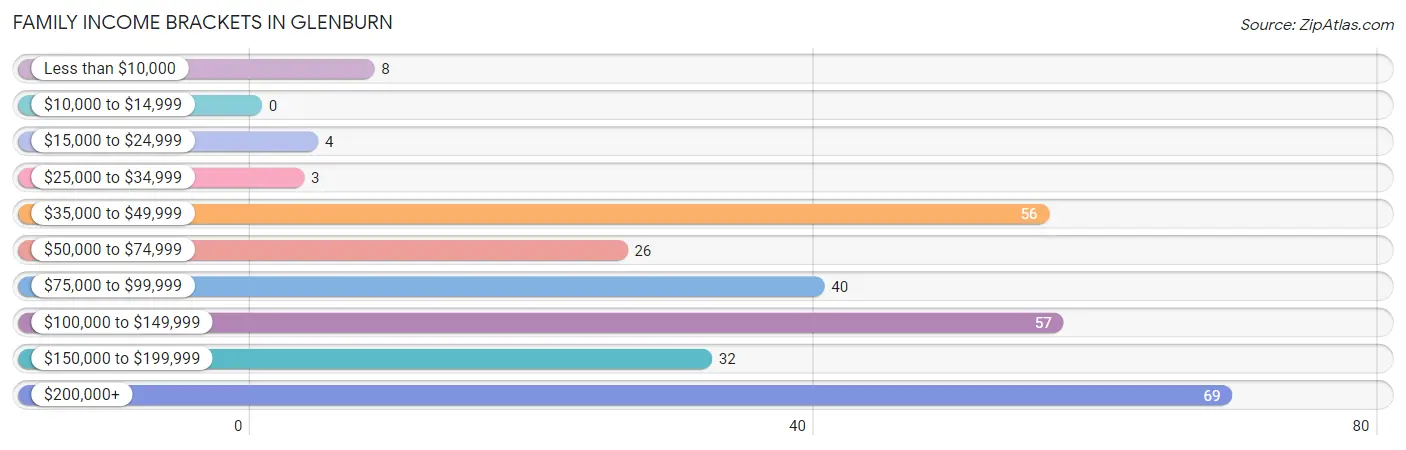
| Income Bracket | # Families | % Families |
| Less than $10,000 | 8 | 2.7% |
| $10,000 to $14,999 | 0 | 0.0% |
| $15,000 to $24,999 | 4 | 1.4% |
| $25,000 to $34,999 | 3 | 1.0% |
| $35,000 to $49,999 | 56 | 19.0% |
| $50,000 to $74,999 | 26 | 8.8% |
| $75,000 to $99,999 | 40 | 13.6% |
| $100,000 to $149,999 | 57 | 19.3% |
| $150,000 to $199,999 | 32 | 10.8% |
| $200,000+ | 69 | 23.4% |
Family Income by Famaliy Size in Glenburn
5-person families (30 | 10.2%) account for the highest median family income in Glenburn with $250,001 per family, while 5-person families (30 | 10.2%) have the highest median income of $50,000 per family member.
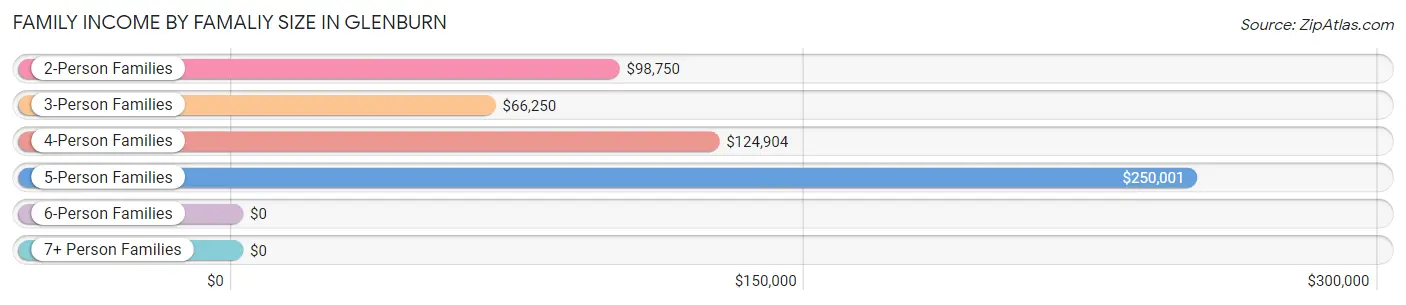
| Income Bracket | # Families | Median Income |
| 2-Person Families | 108 (36.6%) | $98,750 |
| 3-Person Families | 81 (27.5%) | $66,250 |
| 4-Person Families | 69 (23.4%) | $124,904 |
| 5-Person Families | 30 (10.2%) | $250,001 |
| 6-Person Families | 7 (2.4%) | $0 |
| 7+ Person Families | 0 (0.0%) | $0 |
| Total | 295 (100.0%) | $122,917 |
Family Income by Number of Earners in Glenburn
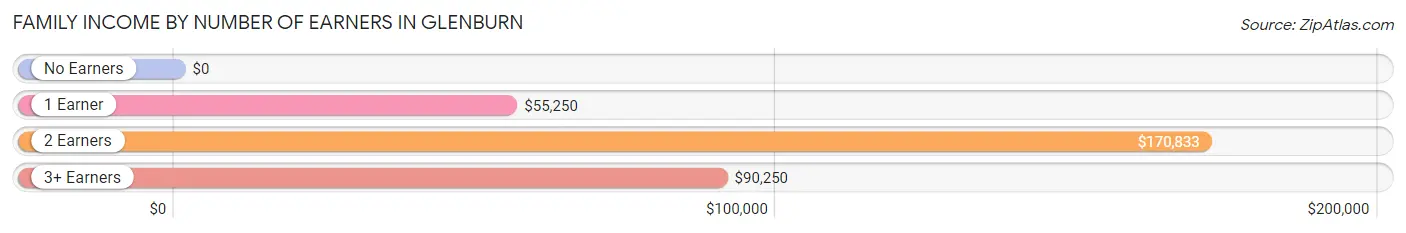
| Number of Earners | # Families | Median Income |
| No Earners | 12 (4.1%) | $0 |
| 1 Earner | 142 (48.1%) | $55,250 |
| 2 Earners | 126 (42.7%) | $170,833 |
| 3+ Earners | 15 (5.1%) | $90,250 |
| Total | 295 (100.0%) | $122,917 |
Household Income in Glenburn
Household Income Brackets in Glenburn
With 92 households falling in the category, the $50,000 to $74,999 income range is the most frequent in Glenburn, accounting for 21.1% of all households. In contrast, only 4 households (0.9%) fall into the $10,000 to $14,999 income bracket, making it the least populous group.
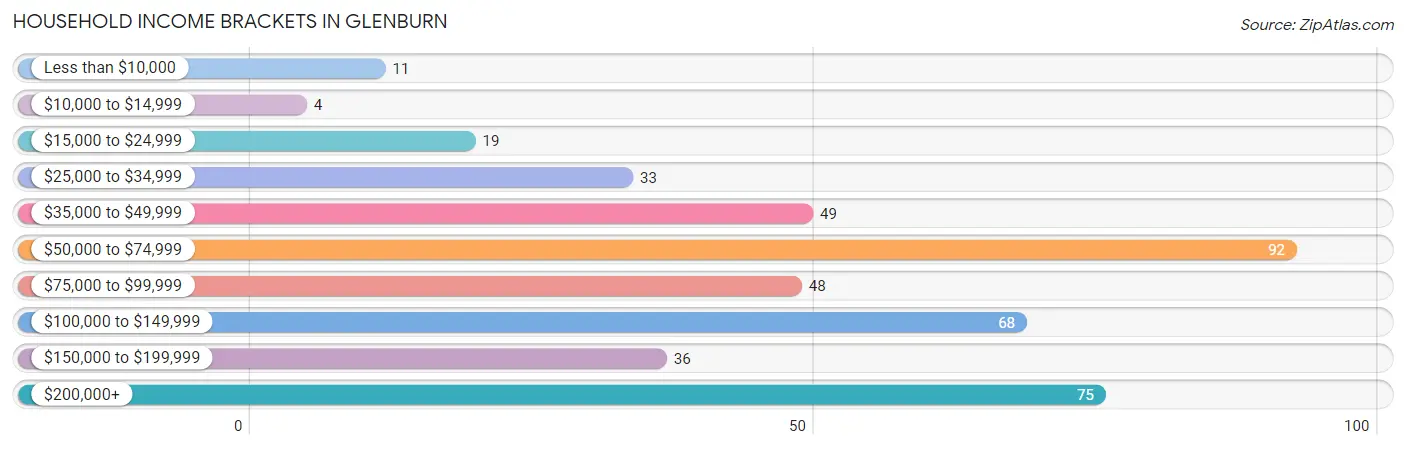
| Income Bracket | # Households | % Households |
| Less than $10,000 | 11 | 2.5% |
| $10,000 to $14,999 | 4 | 0.9% |
| $15,000 to $24,999 | 19 | 4.4% |
| $25,000 to $34,999 | 33 | 7.6% |
| $35,000 to $49,999 | 49 | 11.3% |
| $50,000 to $74,999 | 92 | 21.1% |
| $75,000 to $99,999 | 48 | 11.0% |
| $100,000 to $149,999 | 68 | 15.6% |
| $150,000 to $199,999 | 36 | 8.3% |
| $200,000+ | 75 | 17.2% |
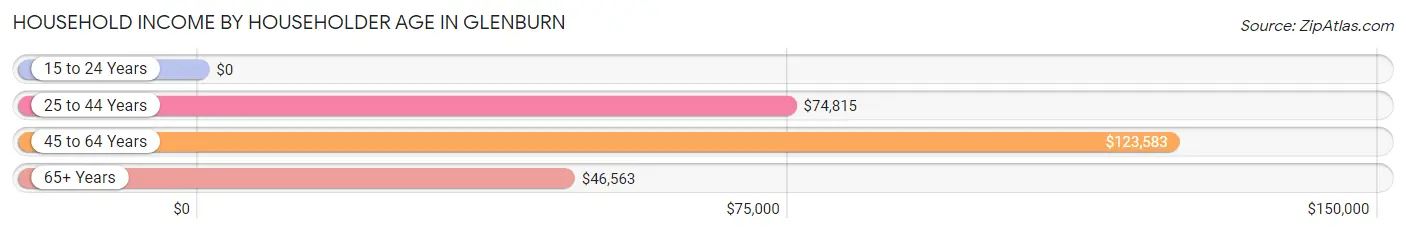
Household Income by Householder Age in Glenburn
The median household income in Glenburn is $84,659, with the highest median household income of $123,583 found in the 45 to 64 years age bracket for the primary householder. A total of 147 households (33.8%) fall into this category. Meanwhile, the 15 to 24 years age bracket for the primary householder has the lowest median household income of $0, with 7 households (1.6%) in this group.
| Income Bracket | # Households | Median Income |
| 15 to 24 Years | 7 (1.6%) | $0 |
| 25 to 44 Years | 146 (33.6%) | $74,815 |
| 45 to 64 Years | 147 (33.8%) | $123,583 |
| 65+ Years | 135 (31.0%) | $46,563 |
| Total | 435 (100.0%) | $84,659 |
Poverty in Glenburn
Income Below Poverty by Sex and Age in Glenburn
With 2.6% poverty level for males and 4.6% for females among the residents of Glenburn, 75 year old and over males and 25 to 34 year old females are the most vulnerable to poverty, with 9 males (26.5%) and 10 females (34.5%) in their respective age groups living below the poverty level.
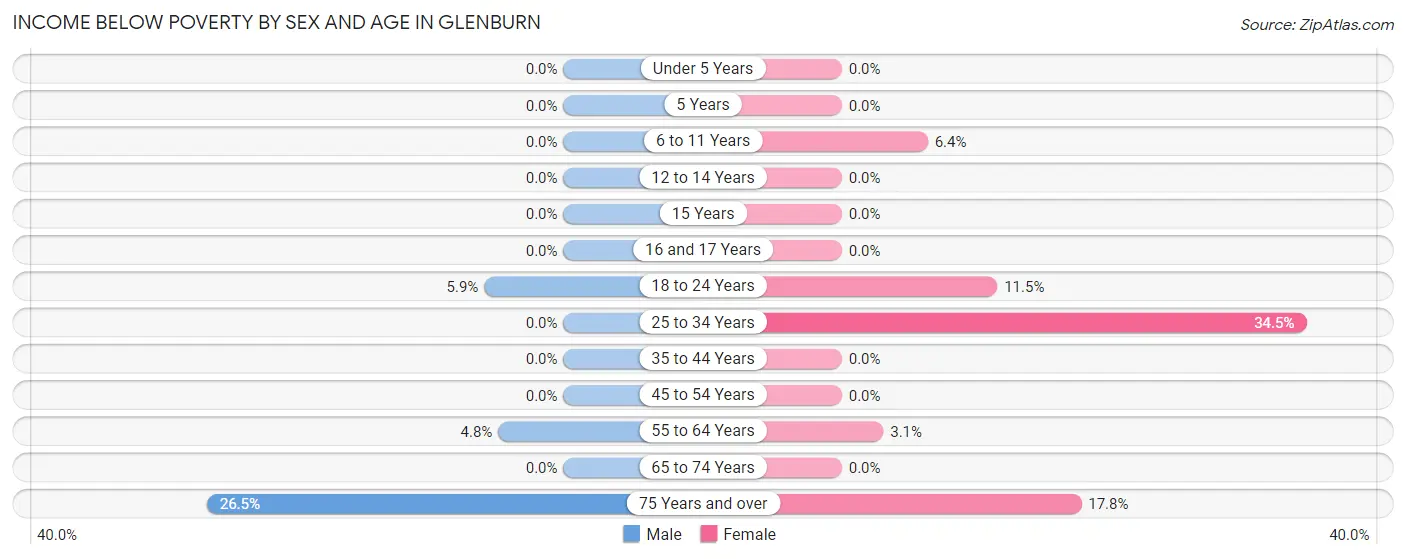
| Age Bracket | Male | Female |
| Under 5 Years | 0 (0.0%) | 0 (0.0%) |
| 5 Years | 0 (0.0%) | 0 (0.0%) |
| 6 to 11 Years | 0 (0.0%) | 3 (6.4%) |
| 12 to 14 Years | 0 (0.0%) | 0 (0.0%) |
| 15 Years | 0 (0.0%) | 0 (0.0%) |
| 16 and 17 Years | 0 (0.0%) | 0 (0.0%) |
| 18 to 24 Years | 2 (5.9%) | 3 (11.5%) |
| 25 to 34 Years | 0 (0.0%) | 10 (34.5%) |
| 35 to 44 Years | 0 (0.0%) | 0 (0.0%) |
| 45 to 54 Years | 0 (0.0%) | 0 (0.0%) |
| 55 to 64 Years | 3 (4.8%) | 2 (3.1%) |
| 65 to 74 Years | 0 (0.0%) | 0 (0.0%) |
| 75 Years and over | 9 (26.5%) | 8 (17.8%) |
| Total | 14 (2.6%) | 26 (4.6%) |
Income Above Poverty by Sex and Age in Glenburn
According to the poverty statistics in Glenburn, males aged under 5 years and females aged under 5 years are the age groups that are most secure financially, with 100.0% of males and 100.0% of females in these age groups living above the poverty line.
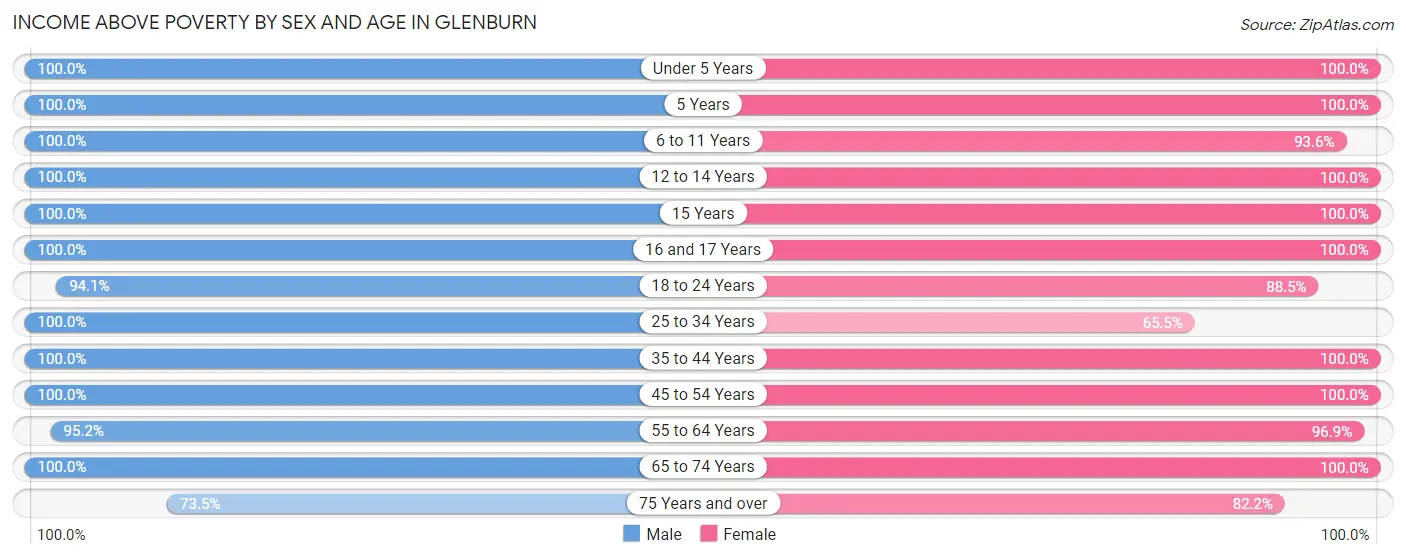
| Age Bracket | Male | Female |
| Under 5 Years | 66 (100.0%) | 73 (100.0%) |
| 5 Years | 4 (100.0%) | 19 (100.0%) |
| 6 to 11 Years | 17 (100.0%) | 44 (93.6%) |
| 12 to 14 Years | 36 (100.0%) | 10 (100.0%) |
| 15 Years | 5 (100.0%) | 13 (100.0%) |
| 16 and 17 Years | 9 (100.0%) | 5 (100.0%) |
| 18 to 24 Years | 32 (94.1%) | 23 (88.5%) |
| 25 to 34 Years | 38 (100.0%) | 19 (65.5%) |
| 35 to 44 Years | 112 (100.0%) | 132 (100.0%) |
| 45 to 54 Years | 76 (100.0%) | 52 (100.0%) |
| 55 to 64 Years | 59 (95.2%) | 63 (96.9%) |
| 65 to 74 Years | 49 (100.0%) | 54 (100.0%) |
| 75 Years and over | 25 (73.5%) | 37 (82.2%) |
| Total | 528 (97.4%) | 544 (95.4%) |
Income Below Poverty Among Married-Couple Families in Glenburn
The poverty statistics for married-couple families in Glenburn show that 3.7% or 8 of the total 215 families live below the poverty line. Families with no children have the highest poverty rate of 5.4%, comprising of 5 families. On the other hand, families with 3 or 4 children have the lowest poverty rate of 0.0%, which includes 0 families.
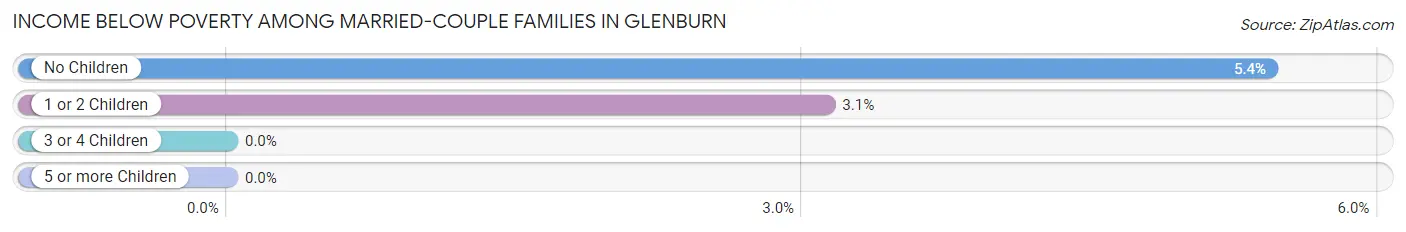
| Children | Above Poverty | Below Poverty |
| No Children | 87 (94.6%) | 5 (5.4%) |
| 1 or 2 Children | 93 (96.9%) | 3 (3.1%) |
| 3 or 4 Children | 27 (100.0%) | 0 (0.0%) |
| 5 or more Children | 0 (0.0%) | 0 (0.0%) |
| Total | 207 (96.3%) | 8 (3.7%) |
Income Below Poverty Among Single-Parent Households in Glenburn
| Children | Single Father | Single Mother |
| No Children | 0 (0.0%) | 0 (0.0%) |
| 1 or 2 Children | 0 (0.0%) | 0 (0.0%) |
| 3 or 4 Children | 0 (0.0%) | 0 (0.0%) |
| 5 or more Children | 0 (0.0%) | 0 (0.0%) |
| Total | 0 (0.0%) | 0 (0.0%) |
Income Below Poverty Among Married-Couple vs Single-Parent Households in Glenburn
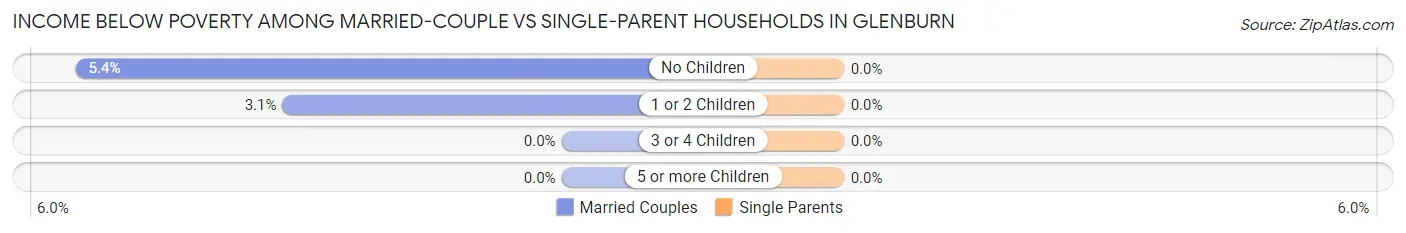
| Children | Married-Couple Families | Single-Parent Households |
| No Children | 5 (5.4%) | 0 (0.0%) |
| 1 or 2 Children | 3 (3.1%) | 0 (0.0%) |
| 3 or 4 Children | 0 (0.0%) | 0 (0.0%) |
| 5 or more Children | 0 (0.0%) | 0 (0.0%) |
| Total | 8 (3.7%) | 0 (0.0%) |
Race in Glenburn
The most populous races in Glenburn are White / Caucasian (981 | 88.2%), Asian (77 | 6.9%), and Two or more Races (33 | 3.0%).
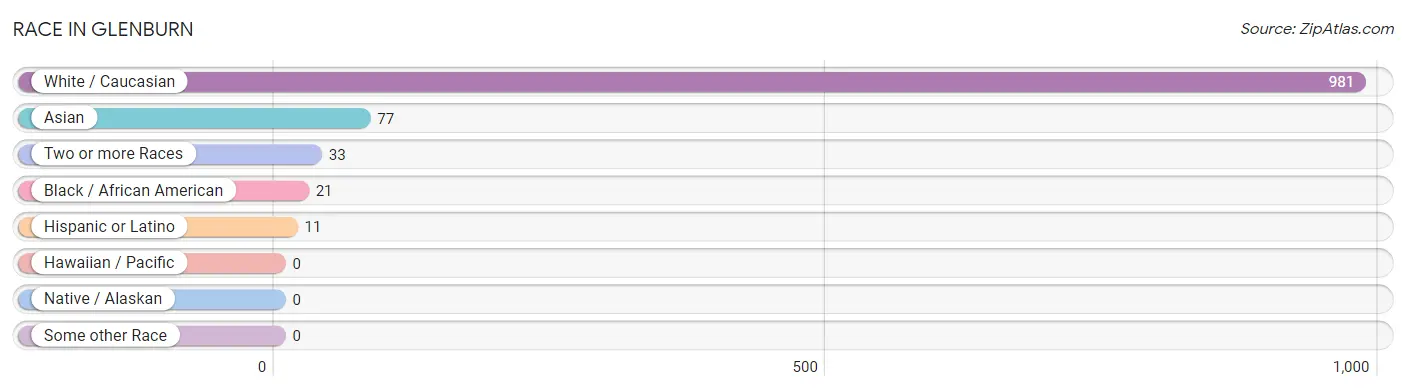
| Race | # Population | % Population |
| Asian | 77 | 6.9% |
| Black / African American | 21 | 1.9% |
| Hawaiian / Pacific | 0 | 0.0% |
| Hispanic or Latino | 11 | 1.0% |
| Native / Alaskan | 0 | 0.0% |
| White / Caucasian | 981 | 88.2% |
| Two or more Races | 33 | 3.0% |
| Some other Race | 0 | 0.0% |
| Total | 1,112 | 100.0% |
Ancestry in Glenburn
The most populous ancestries reported in Glenburn are Italian (214 | 19.2%), German (206 | 18.5%), English (162 | 14.6%), Irish (141 | 12.7%), and American (80 | 7.2%), together accounting for 72.2% of all Glenburn residents.
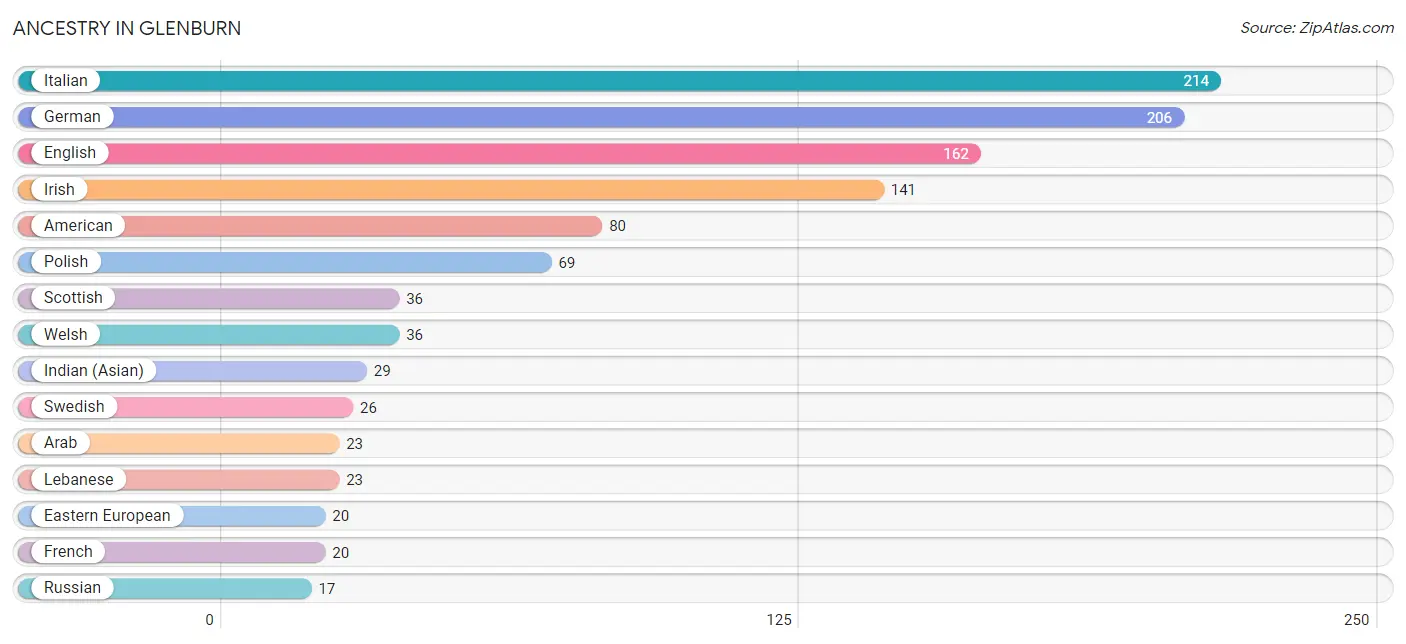
| Ancestry | # Population | % Population |
| American | 80 | 7.2% |
| Arab | 23 | 2.1% |
| Bhutanese | 4 | 0.4% |
| Blackfeet | 7 | 0.6% |
| British | 3 | 0.3% |
| Cuban | 4 | 0.4% |
| Czech | 2 | 0.2% |
| Czechoslovakian | 3 | 0.3% |
| Dutch | 13 | 1.2% |
| Eastern European | 20 | 1.8% |
| English | 162 | 14.6% |
| European | 9 | 0.8% |
| French | 20 | 1.8% |
| German | 206 | 18.5% |
| Indian (Asian) | 29 | 2.6% |
| Irish | 141 | 12.7% |
| Italian | 214 | 19.2% |
| Lebanese | 23 | 2.1% |
| Lithuanian | 3 | 0.3% |
| Polish | 69 | 6.2% |
| Puerto Rican | 7 | 0.6% |
| Russian | 17 | 1.5% |
| Scotch-Irish | 4 | 0.4% |
| Scottish | 36 | 3.2% |
| Slovak | 11 | 1.0% |
| Swedish | 26 | 2.3% |
| Swiss | 4 | 0.4% |
| Thai | 4 | 0.4% |
| Ukrainian | 6 | 0.5% |
| Welsh | 36 | 3.2% | View All 30 Rows |
Immigrants in Glenburn
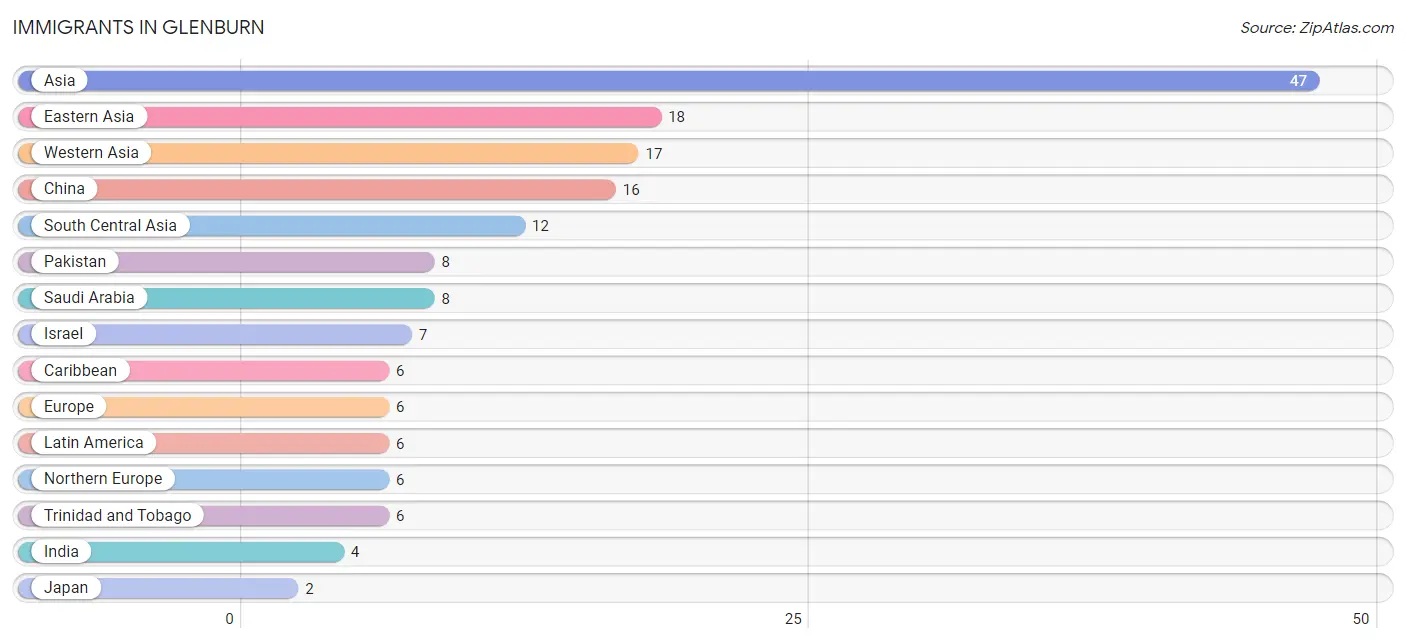
The most numerous immigrant groups reported in Glenburn came from Asia (47 | 4.2%), Eastern Asia (18 | 1.6%), Western Asia (17 | 1.5%), China (16 | 1.4%), and South Central Asia (12 | 1.1%), together accounting for 9.9% of all Glenburn residents.
| Immigration Origin | # Population | % Population |
| Asia | 47 | 4.2% |
| Caribbean | 6 | 0.5% |
| China | 16 | 1.4% |
| Eastern Asia | 18 | 1.6% |
| Europe | 6 | 0.5% |
| India | 4 | 0.4% |
| Israel | 7 | 0.6% |
| Japan | 2 | 0.2% |
| Latin America | 6 | 0.5% |
| Lebanon | 2 | 0.2% |
| Northern Europe | 6 | 0.5% |
| Pakistan | 8 | 0.7% |
| Saudi Arabia | 8 | 0.7% |
| South Central Asia | 12 | 1.1% |
| Trinidad and Tobago | 6 | 0.5% |
| Western Asia | 17 | 1.5% | View All 16 Rows |
Sex and Age in Glenburn
Sex and Age in Glenburn
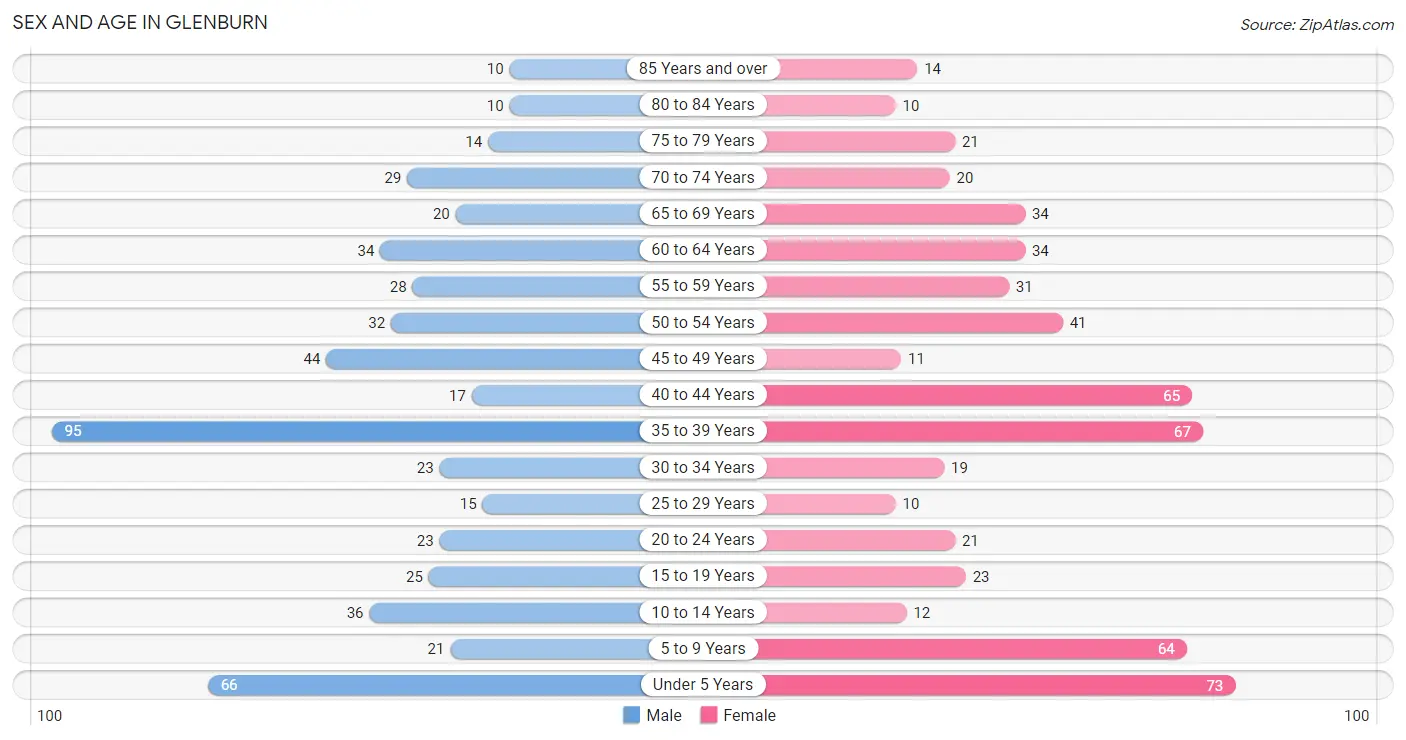
The most populous age groups in Glenburn are 35 to 39 Years (95 | 17.5%) for men and Under 5 Years (73 | 12.8%) for women.
| Age Bracket | Male | Female |
| Under 5 Years | 66 (12.2%) | 73 (12.8%) |
| 5 to 9 Years | 21 (3.9%) | 64 (11.2%) |
| 10 to 14 Years | 36 (6.6%) | 12 (2.1%) |
| 15 to 19 Years | 25 (4.6%) | 23 (4.0%) |
| 20 to 24 Years | 23 (4.2%) | 21 (3.7%) |
| 25 to 29 Years | 15 (2.8%) | 10 (1.8%) |
| 30 to 34 Years | 23 (4.2%) | 19 (3.3%) |
| 35 to 39 Years | 95 (17.5%) | 67 (11.7%) |
| 40 to 44 Years | 17 (3.1%) | 65 (11.4%) |
| 45 to 49 Years | 44 (8.1%) | 11 (1.9%) |
| 50 to 54 Years | 32 (5.9%) | 41 (7.2%) |
| 55 to 59 Years | 28 (5.2%) | 31 (5.4%) |
| 60 to 64 Years | 34 (6.3%) | 34 (6.0%) |
| 65 to 69 Years | 20 (3.7%) | 34 (6.0%) |
| 70 to 74 Years | 29 (5.3%) | 20 (3.5%) |
| 75 to 79 Years | 14 (2.6%) | 21 (3.7%) |
| 80 to 84 Years | 10 (1.8%) | 10 (1.8%) |
| 85 Years and over | 10 (1.8%) | 14 (2.5%) |
| Total | 542 (100.0%) | 570 (100.0%) |
Families and Households in Glenburn
Median Family Size in Glenburn
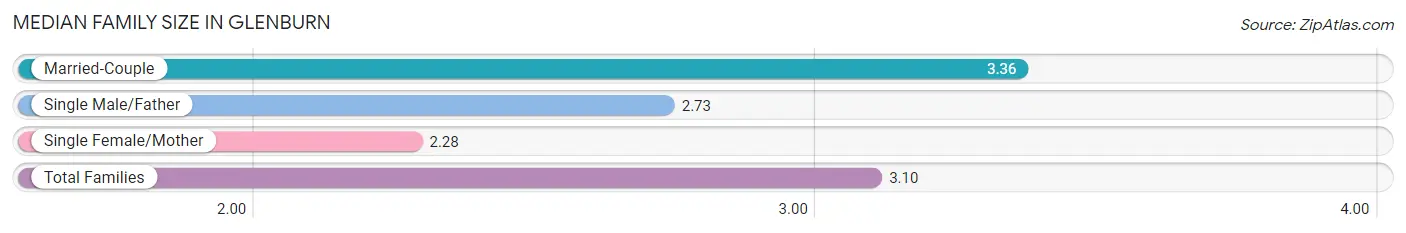
The median family size in Glenburn is 3.10 persons per family, with married-couple families (215 | 72.9%) accounting for the largest median family size of 3.36 persons per family. On the other hand, single female/mother families (58 | 19.7%) represent the smallest median family size with 2.28 persons per family.
| Family Type | # Families | Family Size |
| Married-Couple | 215 (72.9%) | 3.36 |
| Single Male/Father | 22 (7.5%) | 2.73 |
| Single Female/Mother | 58 (19.7%) | 2.28 |
| Total Families | 295 (100.0%) | 3.10 |
Median Household Size in Glenburn
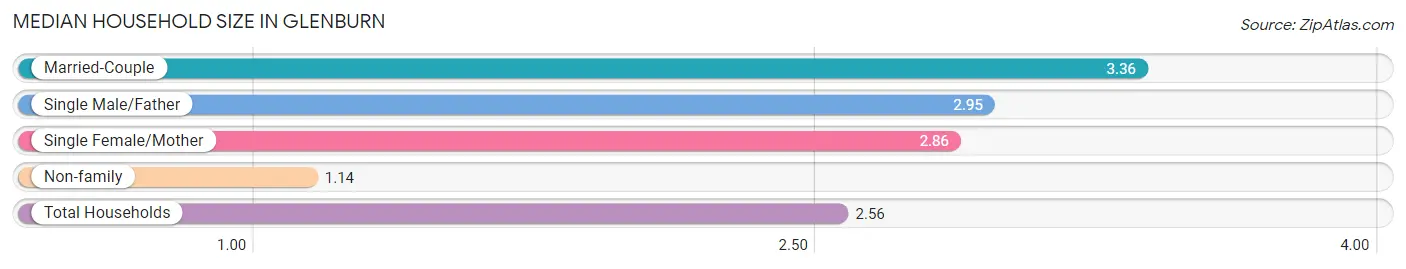
The median household size in Glenburn is 2.56 persons per household, with married-couple households (215 | 49.4%) accounting for the largest median household size of 3.36 persons per household. non-family households (140 | 32.2%) represent the smallest median household size with 1.14 persons per household.
| Household Type | # Households | Household Size |
| Married-Couple | 215 (49.4%) | 3.36 |
| Single Male/Father | 22 (5.1%) | 2.95 |
| Single Female/Mother | 58 (13.3%) | 2.86 |
| Non-family | 140 (32.2%) | 1.14 |
| Total Households | 435 (100.0%) | 2.56 |
Household Size by Marriage Status in Glenburn
Out of a total of 435 households in Glenburn, 295 (67.8%) are family households, while 140 (32.2%) are nonfamily households. The most numerous type of family households are 2-person households, comprising 105, and the most common type of nonfamily households are 1-person households, comprising 124.
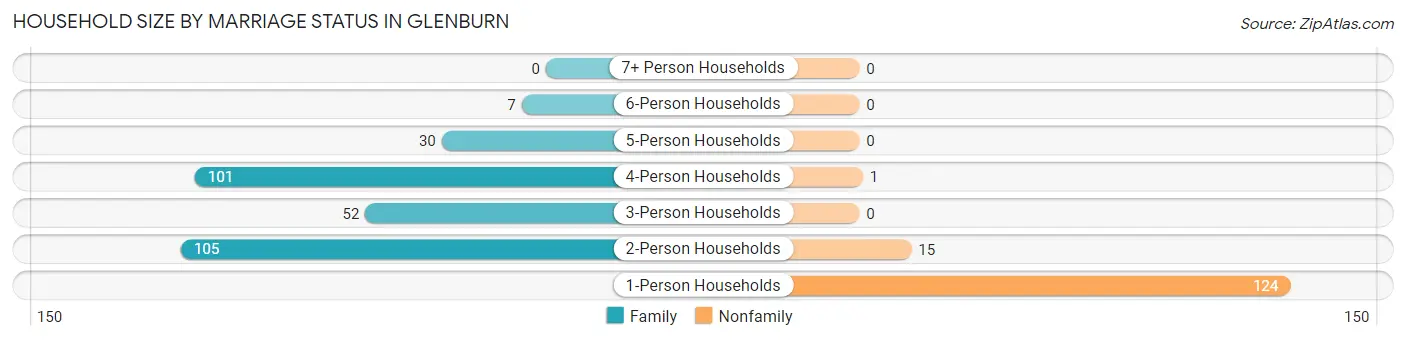
| Household Size | Family Households | Nonfamily Households |
| 1-Person Households | - | 124 (28.5%) |
| 2-Person Households | 105 (24.1%) | 15 (3.5%) |
| 3-Person Households | 52 (11.9%) | 0 (0.0%) |
| 4-Person Households | 101 (23.2%) | 1 (0.2%) |
| 5-Person Households | 30 (6.9%) | 0 (0.0%) |
| 6-Person Households | 7 (1.6%) | 0 (0.0%) |
| 7+ Person Households | 0 (0.0%) | 0 (0.0%) |
| Total | 295 (67.8%) | 140 (32.2%) |
Female Fertility in Glenburn
Fertility by Age in Glenburn
Average fertility rate in Glenburn is 140.0 births per 1,000 women. Women in the age bracket of 35 to 50 years have the highest fertility rate with 174.0 births per 1,000 women. Women in the age bracket of 35 to 50 years acount for 84.4% of all women with births.
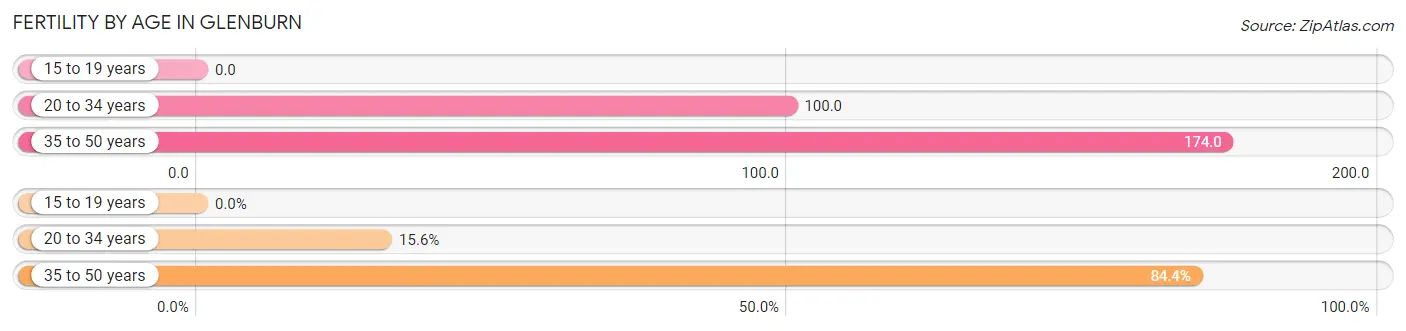
| Age Bracket | Women with Births | Births / 1,000 Women |
| 15 to 19 years | 0 (0.0%) | 0.0 |
| 20 to 34 years | 5 (15.6%) | 100.0 |
| 35 to 50 years | 27 (84.4%) | 174.0 |
| Total | 32 (100.0%) | 140.0 |
Fertility by Age by Marriage Status in Glenburn
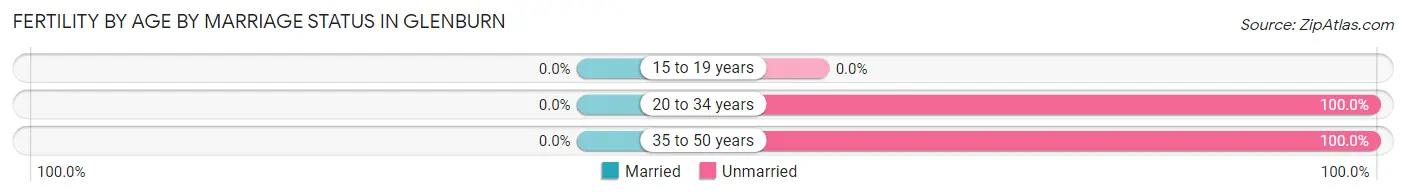
| Age Bracket | Married | Unmarried |
| 15 to 19 years | 0 (0.0%) | 0 (0.0%) |
| 20 to 34 years | 0 (0.0%) | 5 (100.0%) |
| 35 to 50 years | 0 (0.0%) | 27 (100.0%) |
| Total | 0 (0.0%) | 32 (100.0%) |
Fertility by Education in Glenburn
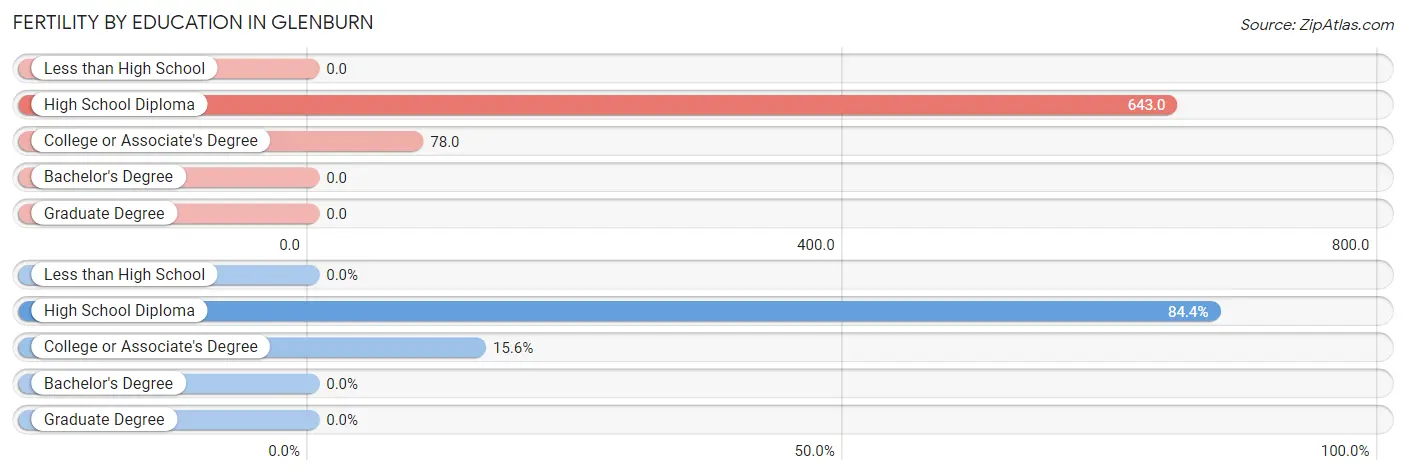
| Educational Attainment | Women with Births | Births / 1,000 Women |
| Less than High School | 0 (0.0%) | 0.0 |
| High School Diploma | 27 (84.4%) | 643.0 |
| College or Associate's Degree | 5 (15.6%) | 78.0 |
| Bachelor's Degree | 0 (0.0%) | 0.0 |
| Graduate Degree | 0 (0.0%) | 0.0 |
| Total | 32 (100.0%) | 140.0 |
Fertility by Education by Marriage Status in Glenburn
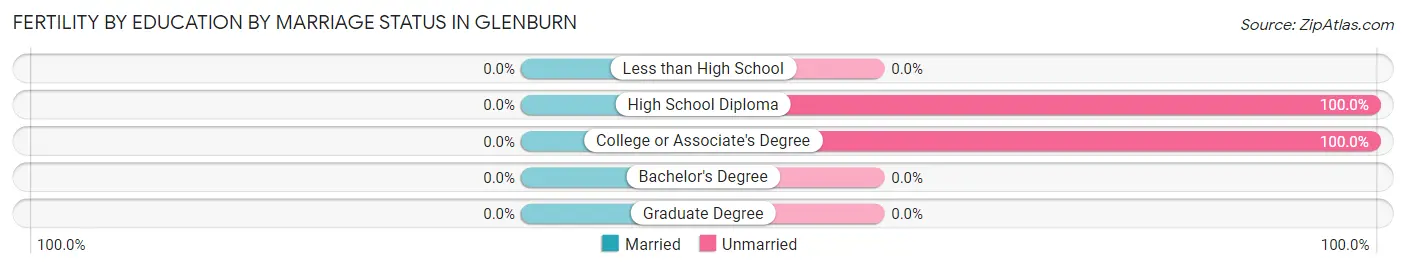
| Educational Attainment | Married | Unmarried |
| Less than High School | 0 (0.0%) | 0 (0.0%) |
| High School Diploma | 0 (0.0%) | 27 (100.0%) |
| College or Associate's Degree | 0 (0.0%) | 5 (100.0%) |
| Bachelor's Degree | 0 (0.0%) | 0 (0.0%) |
| Graduate Degree | 0 (0.0%) | 0 (0.0%) |
| Total | 0 (0.0%) | 32 (100.0%) |
Employment Characteristics in Glenburn
Employment by Class of Employer in Glenburn
Among the 468 employed individuals in Glenburn, private company employees (262 | 56.0%), not-for-profit organizations (66 | 14.1%), and self-employed (incorporated) (60 | 12.8%) make up the most common classes of employment.
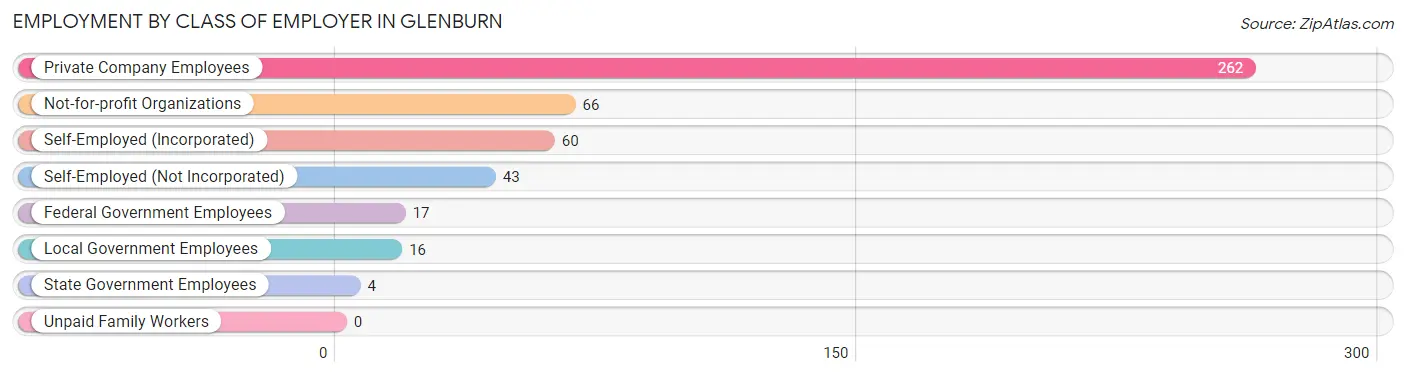
| Employer Class | # Employees | % Employees |
| Private Company Employees | 262 | 56.0% |
| Self-Employed (Incorporated) | 60 | 12.8% |
| Self-Employed (Not Incorporated) | 43 | 9.2% |
| Not-for-profit Organizations | 66 | 14.1% |
| Local Government Employees | 16 | 3.4% |
| State Government Employees | 4 | 0.9% |
| Federal Government Employees | 17 | 3.6% |
| Unpaid Family Workers | 0 | 0.0% |
| Total | 468 | 100.0% |
Employment Status by Age in Glenburn
According to the labor force statistics for Glenburn, out of the total population over 16 years of age (822), 65.8% or 541 individuals are in the labor force, with 9.6% or 52 of them unemployed. The age group with the highest labor force participation rate is 55 to 59 years, with 88.1% or 52 individuals in the labor force. Within the labor force, the 45 to 54 years age range has the highest percentage of unemployed individuals, with 20.2% or 21 of them being unemployed.
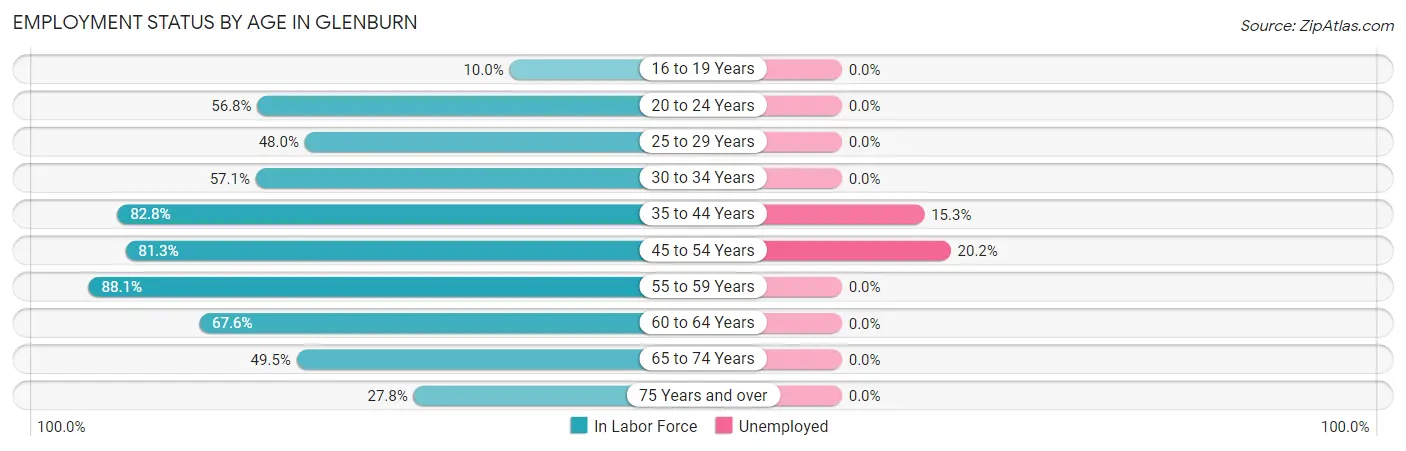
| Age Bracket | In Labor Force | Unemployed |
| 16 to 19 Years | 3 (10.0%) | 0 (0.0%) |
| 20 to 24 Years | 25 (56.8%) | 0 (0.0%) |
| 25 to 29 Years | 12 (48.0%) | 0 (0.0%) |
| 30 to 34 Years | 24 (57.1%) | 0 (0.0%) |
| 35 to 44 Years | 202 (82.8%) | 31 (15.3%) |
| 45 to 54 Years | 104 (81.3%) | 21 (20.2%) |
| 55 to 59 Years | 52 (88.1%) | 0 (0.0%) |
| 60 to 64 Years | 46 (67.6%) | 0 (0.0%) |
| 65 to 74 Years | 51 (49.5%) | 0 (0.0%) |
| 75 Years and over | 22 (27.8%) | 0 (0.0%) |
| Total | 541 (65.8%) | 52 (9.6%) |
Employment Status by Educational Attainment in Glenburn
According to labor force statistics for Glenburn, 77.7% of individuals (440) out of the total population between 25 and 64 years of age (566) are in the labor force, with 11.8% or 52 of them being unemployed. The group with the highest labor force participation rate are those with the educational attainment of bachelor's degree or higher, with 90.9% or 229 individuals in the labor force. Within the labor force, individuals with high school diploma education have the highest percentage of unemployment, with 28.2% or 31 of them being unemployed.
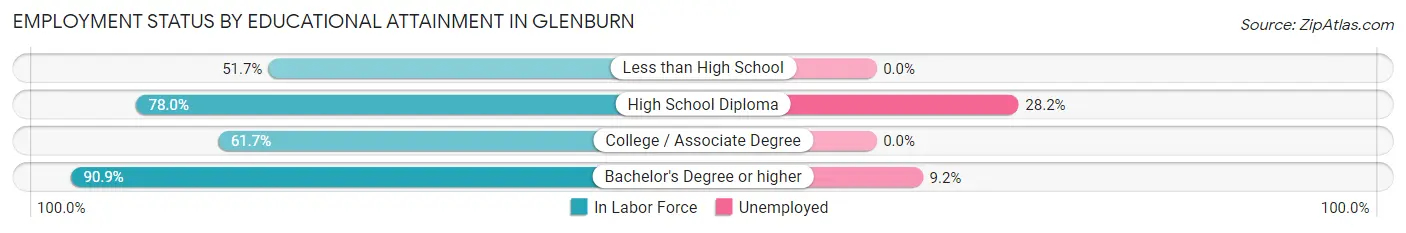
| Educational Attainment | In Labor Force | Unemployed |
| Less than High School | 30 (51.7%) | 0 (0.0%) |
| High School Diploma | 110 (78.0%) | 40 (28.2%) |
| College / Associate Degree | 71 (61.7%) | 0 (0.0%) |
| Bachelor's Degree or higher | 229 (90.9%) | 23 (9.2%) |
| Total | 440 (77.7%) | 67 (11.8%) |
Employment Occupations by Sex in Glenburn
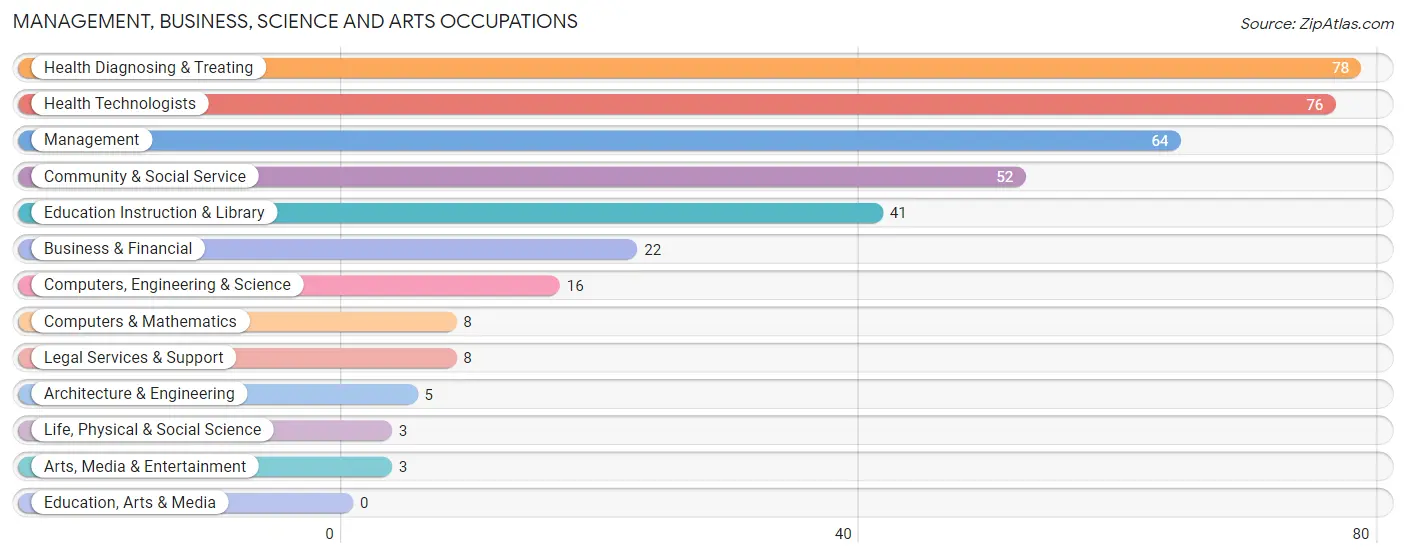
Management, Business, Science and Arts Occupations
The most common Management, Business, Science and Arts occupations in Glenburn are Health Diagnosing & Treating (78 | 16.0%), Health Technologists (76 | 15.5%), Management (64 | 13.1%), Community & Social Service (52 | 10.6%), and Education Instruction & Library (41 | 8.4%).
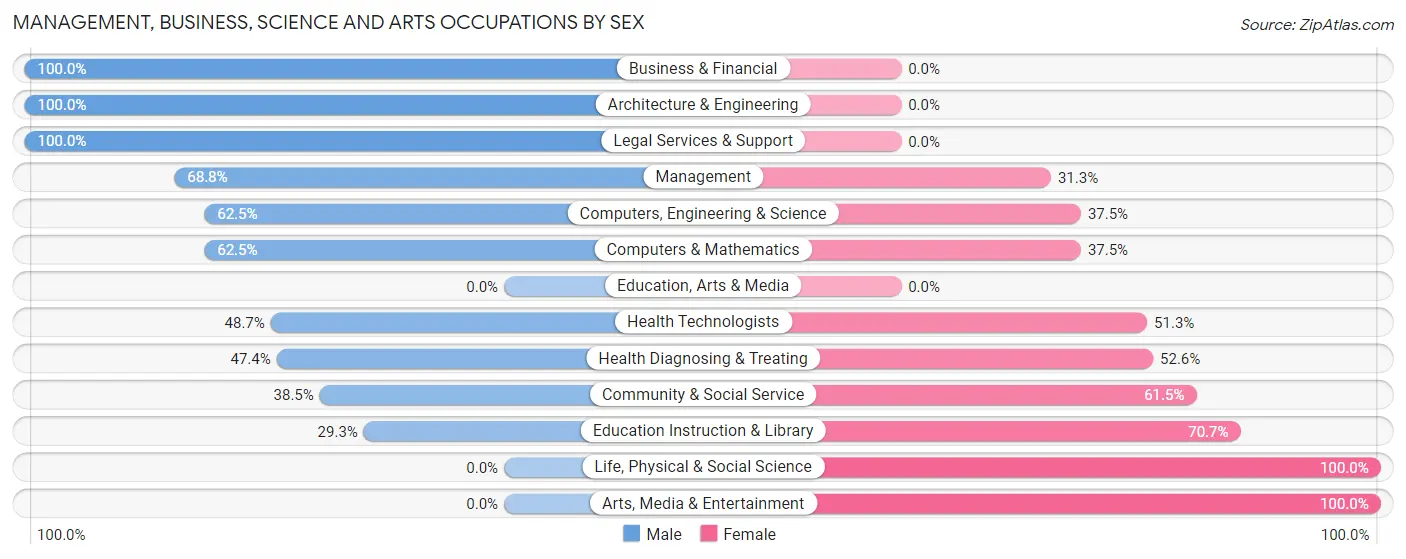
Management, Business, Science and Arts Occupations by Sex
Within the Management, Business, Science and Arts occupations in Glenburn, the most male-oriented occupations are Business & Financial (100.0%), Architecture & Engineering (100.0%), and Legal Services & Support (100.0%), while the most female-oriented occupations are Life, Physical & Social Science (100.0%), Arts, Media & Entertainment (100.0%), and Education Instruction & Library (70.7%).
| Occupation | Male | Female |
| Management | 44 (68.8%) | 20 (31.2%) |
| Business & Financial | 22 (100.0%) | 0 (0.0%) |
| Computers, Engineering & Science | 10 (62.5%) | 6 (37.5%) |
| Computers & Mathematics | 5 (62.5%) | 3 (37.5%) |
| Architecture & Engineering | 5 (100.0%) | 0 (0.0%) |
| Life, Physical & Social Science | 0 (0.0%) | 3 (100.0%) |
| Community & Social Service | 20 (38.5%) | 32 (61.5%) |
| Education, Arts & Media | 0 (0.0%) | 0 (0.0%) |
| Legal Services & Support | 8 (100.0%) | 0 (0.0%) |
| Education Instruction & Library | 12 (29.3%) | 29 (70.7%) |
| Arts, Media & Entertainment | 0 (0.0%) | 3 (100.0%) |
| Health Diagnosing & Treating | 37 (47.4%) | 41 (52.6%) |
| Health Technologists | 37 (48.7%) | 39 (51.3%) |
| Total (Category) | 133 (57.3%) | 99 (42.7%) |
| Total (Overall) | 269 (55.0%) | 220 (45.0%) |
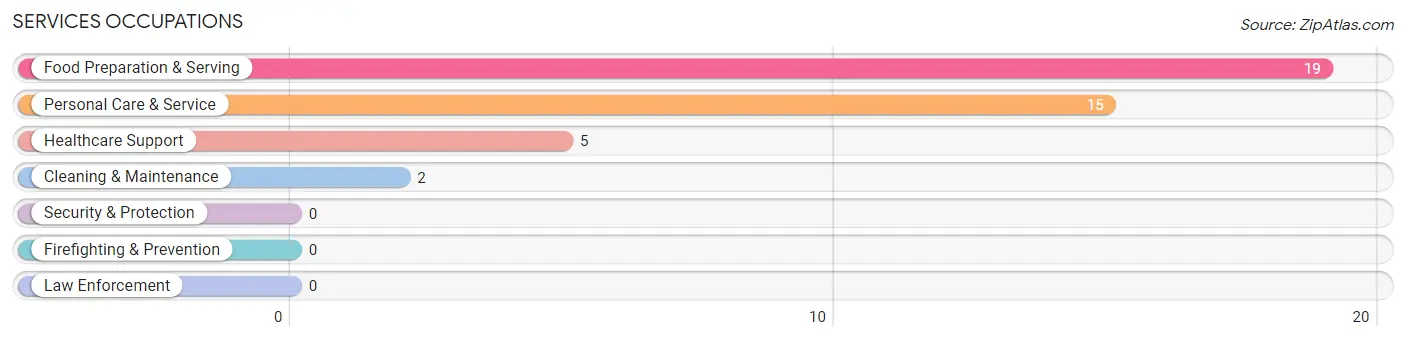
Services Occupations
The most common Services occupations in Glenburn are Food Preparation & Serving (19 | 3.9%), Personal Care & Service (15 | 3.1%), Healthcare Support (5 | 1.0%), and Cleaning & Maintenance (2 | 0.4%).
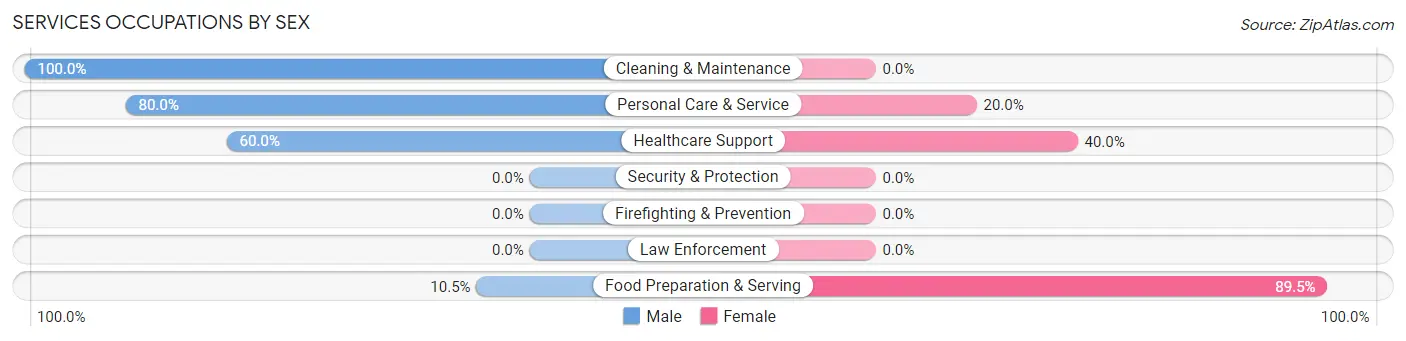
Services Occupations by Sex
Within the Services occupations in Glenburn, the most male-oriented occupations are Cleaning & Maintenance (100.0%), Personal Care & Service (80.0%), and Healthcare Support (60.0%), while the most female-oriented occupations are Food Preparation & Serving (89.5%), Healthcare Support (40.0%), and Personal Care & Service (20.0%).
| Occupation | Male | Female |
| Healthcare Support | 3 (60.0%) | 2 (40.0%) |
| Security & Protection | 0 (0.0%) | 0 (0.0%) |
| Firefighting & Prevention | 0 (0.0%) | 0 (0.0%) |
| Law Enforcement | 0 (0.0%) | 0 (0.0%) |
| Food Preparation & Serving | 2 (10.5%) | 17 (89.5%) |
| Cleaning & Maintenance | 2 (100.0%) | 0 (0.0%) |
| Personal Care & Service | 12 (80.0%) | 3 (20.0%) |
| Total (Category) | 19 (46.3%) | 22 (53.7%) |
| Total (Overall) | 269 (55.0%) | 220 (45.0%) |
Sales and Office Occupations
The most common Sales and Office occupations in Glenburn are Office & Administration (94 | 19.2%), and Sales & Related (46 | 9.4%).
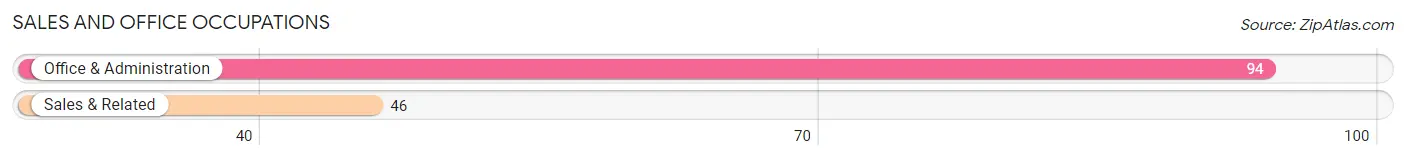
Sales and Office Occupations by Sex
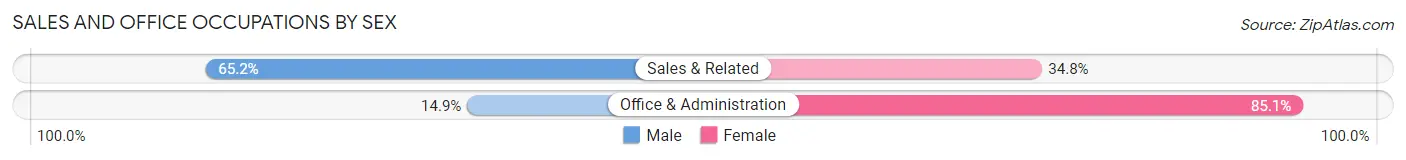
| Occupation | Male | Female |
| Sales & Related | 30 (65.2%) | 16 (34.8%) |
| Office & Administration | 14 (14.9%) | 80 (85.1%) |
| Total (Category) | 44 (31.4%) | 96 (68.6%) |
| Total (Overall) | 269 (55.0%) | 220 (45.0%) |
Natural Resources, Construction and Maintenance Occupations
The most common Natural Resources, Construction and Maintenance occupations in Glenburn are Construction & Extraction (38 | 7.8%), and Installation, Maintenance & Repair (11 | 2.2%).
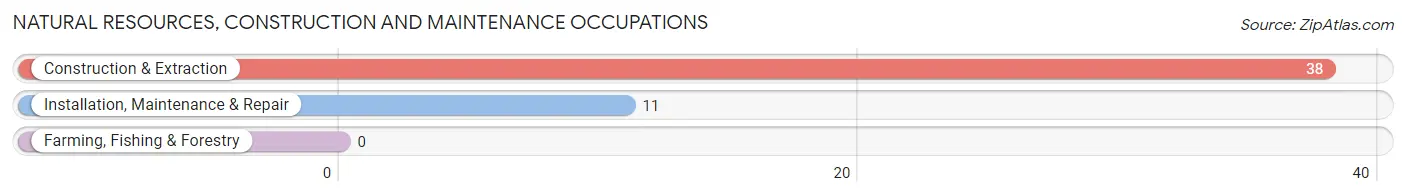
Natural Resources, Construction and Maintenance Occupations by Sex
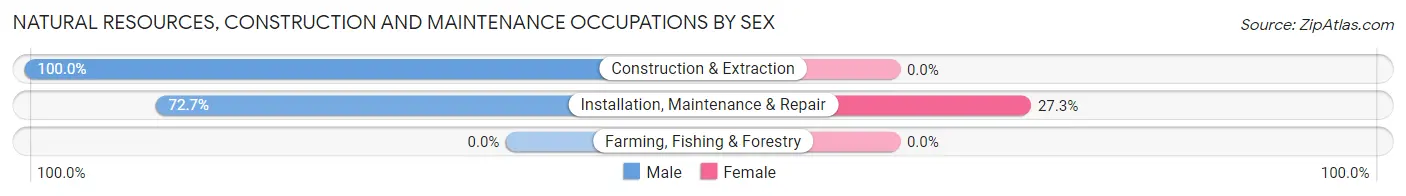
| Occupation | Male | Female |
| Farming, Fishing & Forestry | 0 (0.0%) | 0 (0.0%) |
| Construction & Extraction | 38 (100.0%) | 0 (0.0%) |
| Installation, Maintenance & Repair | 8 (72.7%) | 3 (27.3%) |
| Total (Category) | 46 (93.9%) | 3 (6.1%) |
| Total (Overall) | 269 (55.0%) | 220 (45.0%) |
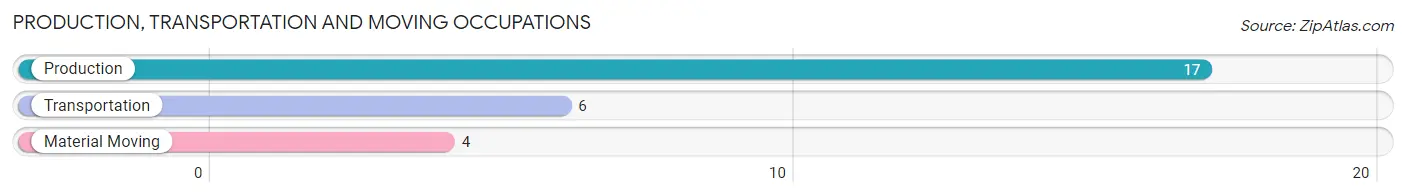
Production, Transportation and Moving Occupations
The most common Production, Transportation and Moving occupations in Glenburn are Production (17 | 3.5%), Transportation (6 | 1.2%), and Material Moving (4 | 0.8%).
Production, Transportation and Moving Occupations by Sex

| Occupation | Male | Female |
| Production | 17 (100.0%) | 0 (0.0%) |
| Transportation | 6 (100.0%) | 0 (0.0%) |
| Material Moving | 4 (100.0%) | 0 (0.0%) |
| Total (Category) | 27 (100.0%) | 0 (0.0%) |
| Total (Overall) | 269 (55.0%) | 220 (45.0%) |
Employment Industries by Sex in Glenburn
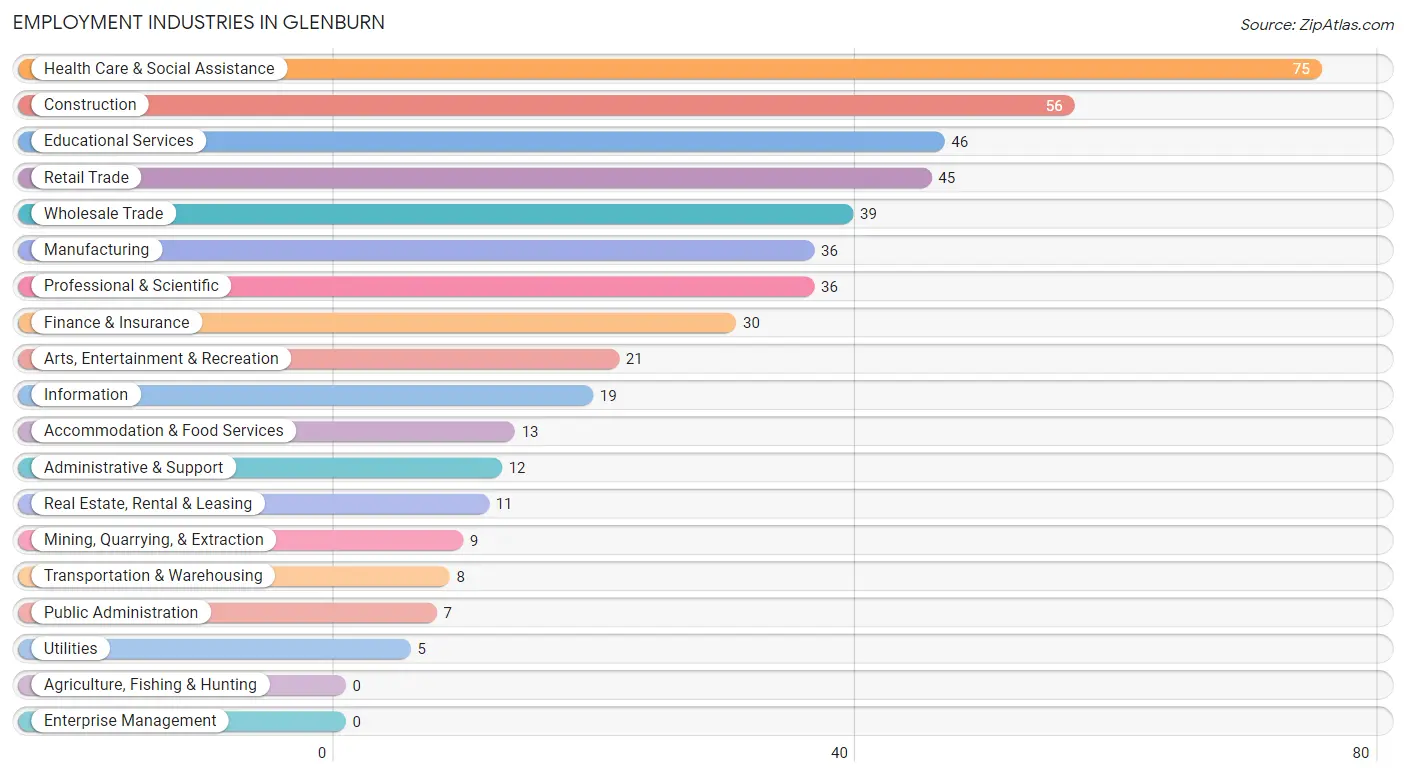
Employment Industries in Glenburn
The major employment industries in Glenburn include Health Care & Social Assistance (75 | 15.3%), Construction (56 | 11.5%), Educational Services (46 | 9.4%), Retail Trade (45 | 9.2%), and Wholesale Trade (39 | 8.0%).
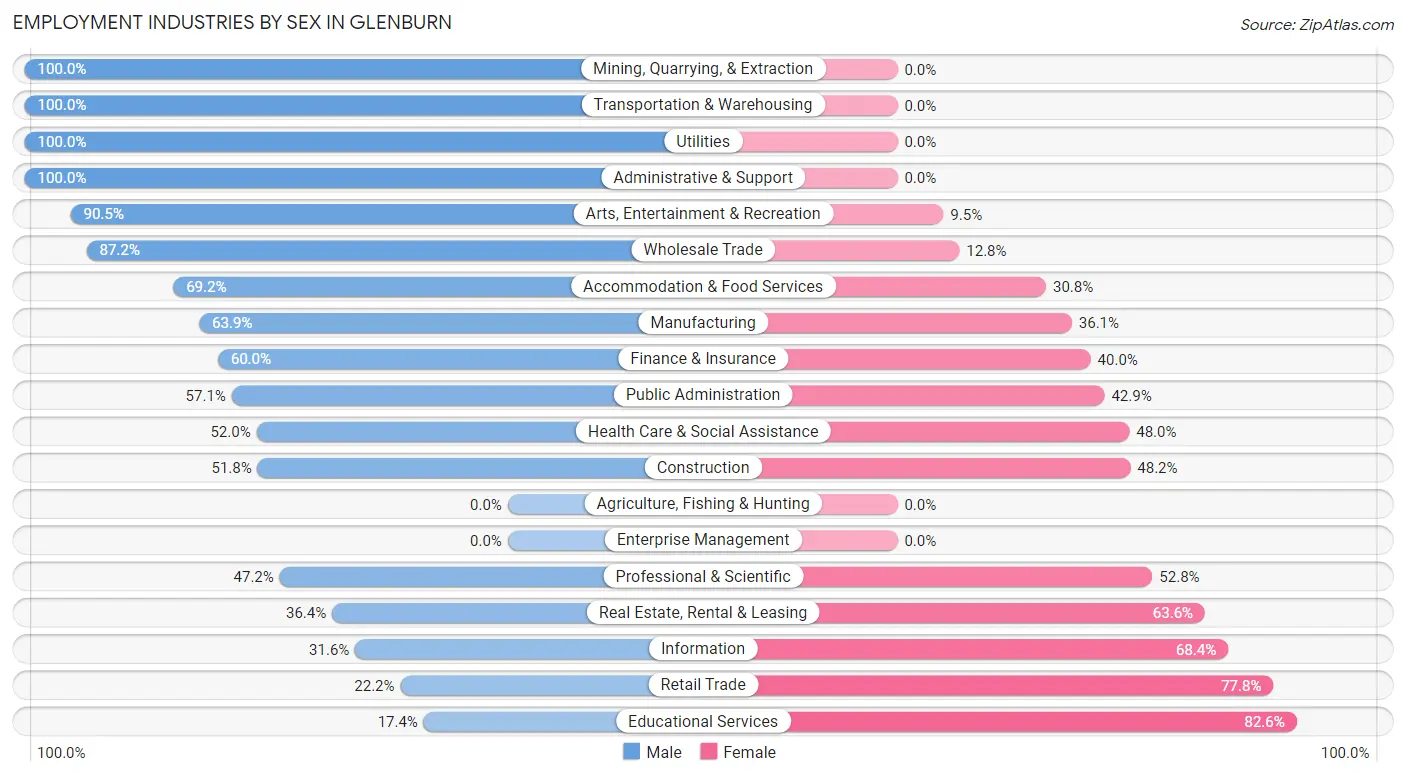
Employment Industries by Sex in Glenburn
The Glenburn industries that see more men than women are Mining, Quarrying, & Extraction (100.0%), Transportation & Warehousing (100.0%), and Utilities (100.0%), whereas the industries that tend to have a higher number of women are Educational Services (82.6%), Retail Trade (77.8%), and Information (68.4%).
| Industry | Male | Female |
| Agriculture, Fishing & Hunting | 0 (0.0%) | 0 (0.0%) |
| Mining, Quarrying, & Extraction | 9 (100.0%) | 0 (0.0%) |
| Construction | 29 (51.8%) | 27 (48.2%) |
| Manufacturing | 23 (63.9%) | 13 (36.1%) |
| Wholesale Trade | 34 (87.2%) | 5 (12.8%) |
| Retail Trade | 10 (22.2%) | 35 (77.8%) |
| Transportation & Warehousing | 8 (100.0%) | 0 (0.0%) |
| Utilities | 5 (100.0%) | 0 (0.0%) |
| Information | 6 (31.6%) | 13 (68.4%) |
| Finance & Insurance | 18 (60.0%) | 12 (40.0%) |
| Real Estate, Rental & Leasing | 4 (36.4%) | 7 (63.6%) |
| Professional & Scientific | 17 (47.2%) | 19 (52.8%) |
| Enterprise Management | 0 (0.0%) | 0 (0.0%) |
| Administrative & Support | 12 (100.0%) | 0 (0.0%) |
| Educational Services | 8 (17.4%) | 38 (82.6%) |
| Health Care & Social Assistance | 39 (52.0%) | 36 (48.0%) |
| Arts, Entertainment & Recreation | 19 (90.5%) | 2 (9.5%) |
| Accommodation & Food Services | 9 (69.2%) | 4 (30.8%) |
| Public Administration | 4 (57.1%) | 3 (42.9%) |
| Total | 269 (55.0%) | 220 (45.0%) |
Education in Glenburn
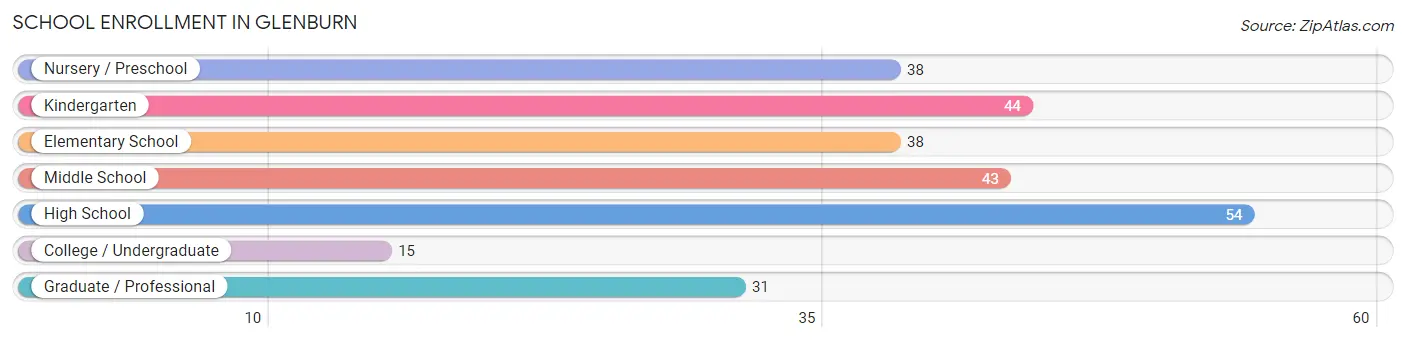
School Enrollment in Glenburn
The most common levels of schooling among the 263 students in Glenburn are high school (54 | 20.5%), kindergarten (44 | 16.7%), and middle school (43 | 16.4%).
| School Level | # Students | % Students |
| Nursery / Preschool | 38 | 14.4% |
| Kindergarten | 44 | 16.7% |
| Elementary School | 38 | 14.4% |
| Middle School | 43 | 16.4% |
| High School | 54 | 20.5% |
| College / Undergraduate | 15 | 5.7% |
| Graduate / Professional | 31 | 11.8% |
| Total | 263 | 100.0% |
School Enrollment by Age by Funding Source in Glenburn
Out of a total of 263 students who are enrolled in schools in Glenburn, 102 (38.8%) attend a private institution, while the remaining 161 (61.2%) are enrolled in public schools. The age group of 20 to 24 year olds has the highest likelihood of being enrolled in private schools, with 14 (87.5% in the age bracket) enrolled. Conversely, the age group of 18 to 19 year olds has the lowest likelihood of being enrolled in a private school, with 15 (100.0% in the age bracket) attending a public institution.
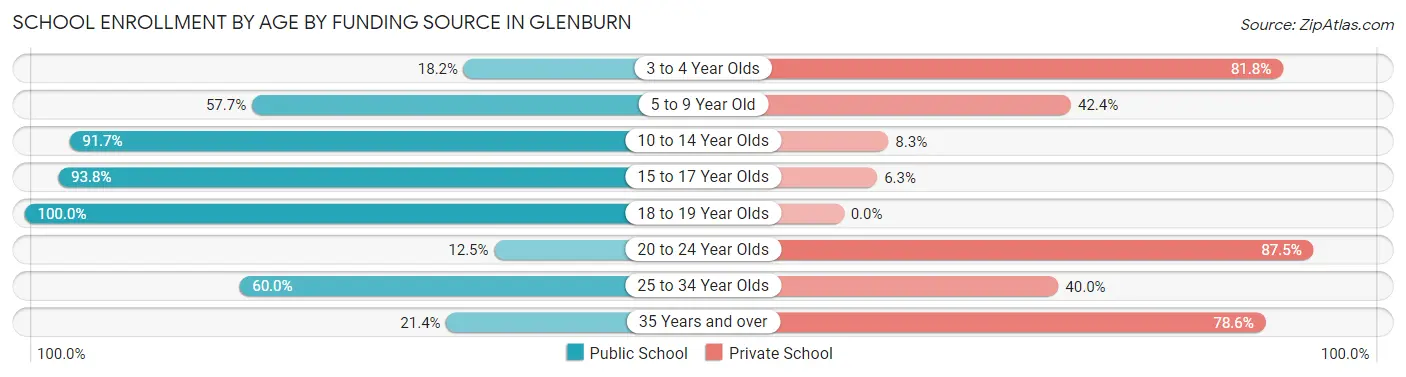
| Age Bracket | Public School | Private School |
| 3 to 4 Year Olds | 6 (18.2%) | 27 (81.8%) |
| 5 to 9 Year Old | 49 (57.7%) | 36 (42.3%) |
| 10 to 14 Year Olds | 44 (91.7%) | 4 (8.3%) |
| 15 to 17 Year Olds | 30 (93.8%) | 2 (6.2%) |
| 18 to 19 Year Olds | 15 (100.0%) | 0 (0.0%) |
| 20 to 24 Year Olds | 2 (12.5%) | 14 (87.5%) |
| 25 to 34 Year Olds | 12 (60.0%) | 8 (40.0%) |
| 35 Years and over | 3 (21.4%) | 11 (78.6%) |
| Total | 161 (61.2%) | 102 (38.8%) |
Educational Attainment by Field of Study in Glenburn
Business (53 | 15.1%), science & technology (52 | 14.8%), bio, nature & agricultural (51 | 14.5%), social sciences (26 | 7.4%), and education (24 | 6.8%) are the most common fields of study among 352 individuals in Glenburn who have obtained a bachelor's degree or higher.
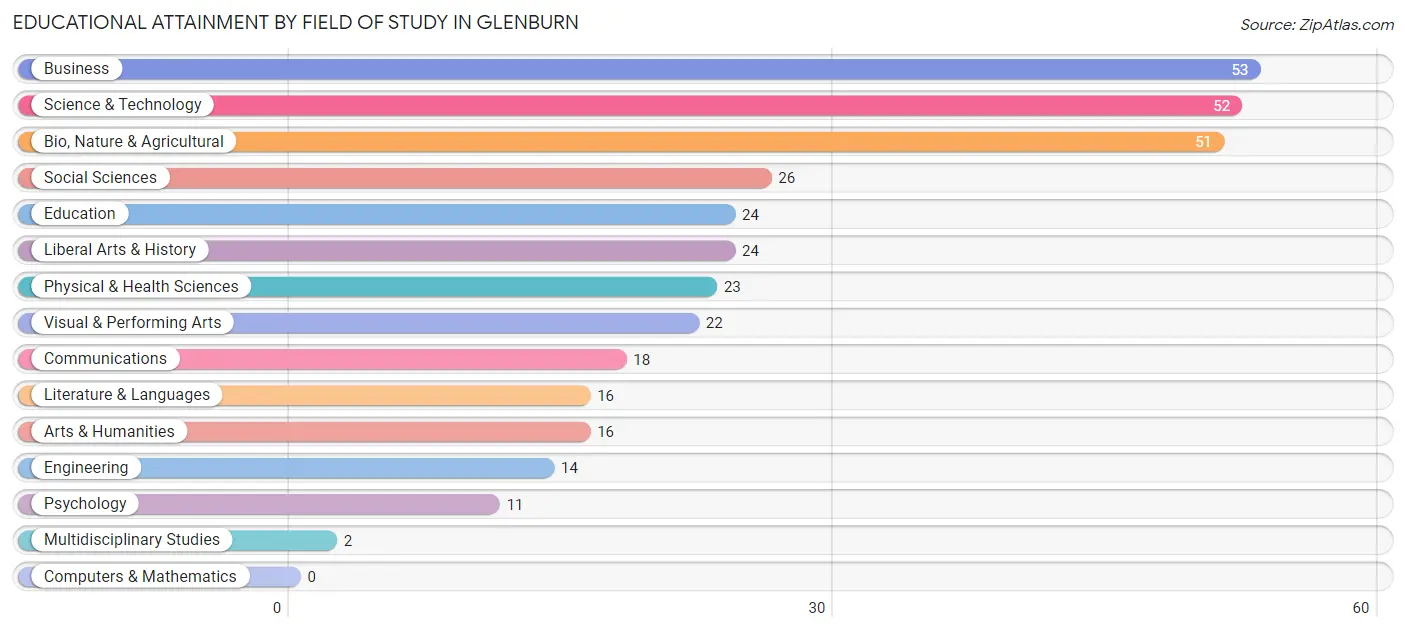
| Field of Study | # Graduates | % Graduates |
| Computers & Mathematics | 0 | 0.0% |
| Bio, Nature & Agricultural | 51 | 14.5% |
| Physical & Health Sciences | 23 | 6.5% |
| Psychology | 11 | 3.1% |
| Social Sciences | 26 | 7.4% |
| Engineering | 14 | 4.0% |
| Multidisciplinary Studies | 2 | 0.6% |
| Science & Technology | 52 | 14.8% |
| Business | 53 | 15.1% |
| Education | 24 | 6.8% |
| Literature & Languages | 16 | 4.5% |
| Liberal Arts & History | 24 | 6.8% |
| Visual & Performing Arts | 22 | 6.2% |
| Communications | 18 | 5.1% |
| Arts & Humanities | 16 | 4.5% |
| Total | 352 | 100.0% |
Transportation & Commute in Glenburn
Vehicle Availability by Sex in Glenburn
The most prevalent vehicle ownership categories in Glenburn are males with 2 vehicles (91, accounting for 36.2%) and females with 2 vehicles (104, making up 41.9%).
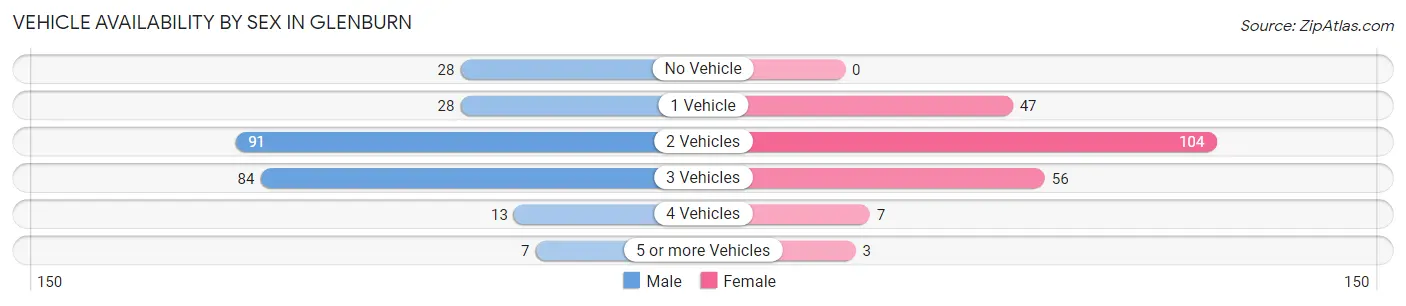
| Vehicles Available | Male | Female |
| No Vehicle | 28 (11.2%) | 0 (0.0%) |
| 1 Vehicle | 28 (11.2%) | 47 (21.7%) |
| 2 Vehicles | 91 (36.2%) | 104 (47.9%) |
| 3 Vehicles | 84 (33.5%) | 56 (25.8%) |
| 4 Vehicles | 13 (5.2%) | 7 (3.2%) |
| 5 or more Vehicles | 7 (2.8%) | 3 (1.4%) |
| Total | 251 (100.0%) | 217 (100.0%) |
Commute Time in Glenburn
The most frequently occuring commute durations in Glenburn are 15 to 19 minutes (85 commuters, 19.9%), 20 to 24 minutes (81 commuters, 18.9%), and 30 to 34 minutes (65 commuters, 15.2%).
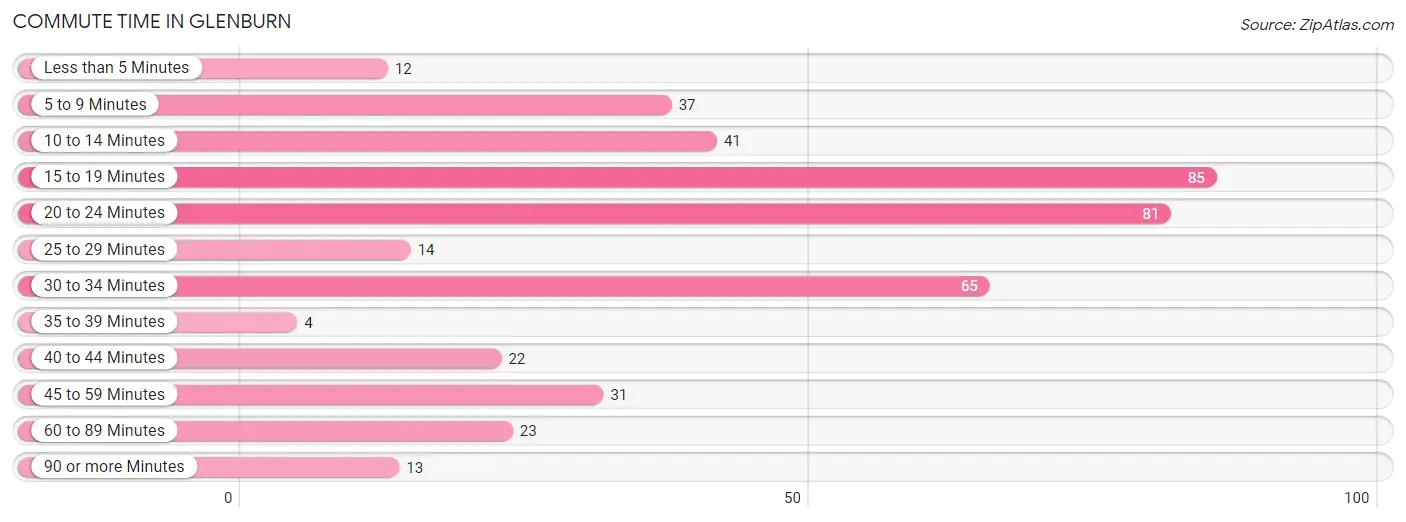
| Commute Time | # Commuters | % Commuters |
| Less than 5 Minutes | 12 | 2.8% |
| 5 to 9 Minutes | 37 | 8.6% |
| 10 to 14 Minutes | 41 | 9.6% |
| 15 to 19 Minutes | 85 | 19.9% |
| 20 to 24 Minutes | 81 | 18.9% |
| 25 to 29 Minutes | 14 | 3.3% |
| 30 to 34 Minutes | 65 | 15.2% |
| 35 to 39 Minutes | 4 | 0.9% |
| 40 to 44 Minutes | 22 | 5.1% |
| 45 to 59 Minutes | 31 | 7.2% |
| 60 to 89 Minutes | 23 | 5.4% |
| 90 or more Minutes | 13 | 3.0% |
Commute Time by Sex in Glenburn
The most common commute times in Glenburn are 15 to 19 minutes (63 commuters, 27.8%) for males and 20 to 24 minutes (41 commuters, 20.4%) for females.
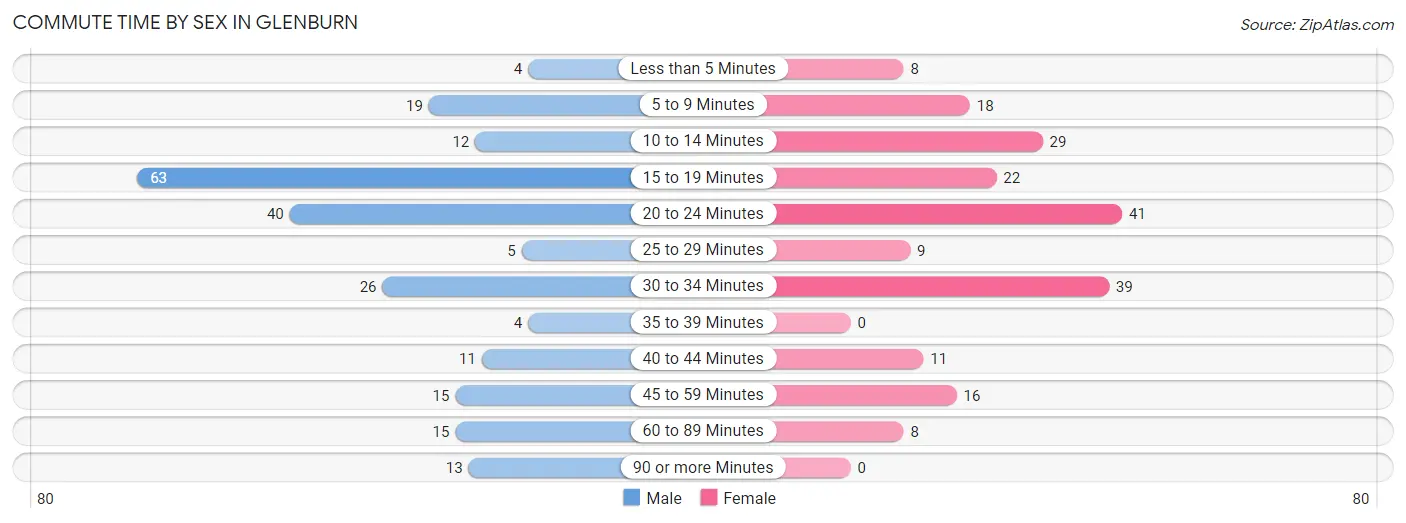
| Commute Time | Male | Female |
| Less than 5 Minutes | 4 (1.8%) | 8 (4.0%) |
| 5 to 9 Minutes | 19 (8.4%) | 18 (9.0%) |
| 10 to 14 Minutes | 12 (5.3%) | 29 (14.4%) |
| 15 to 19 Minutes | 63 (27.8%) | 22 (11.0%) |
| 20 to 24 Minutes | 40 (17.6%) | 41 (20.4%) |
| 25 to 29 Minutes | 5 (2.2%) | 9 (4.5%) |
| 30 to 34 Minutes | 26 (11.5%) | 39 (19.4%) |
| 35 to 39 Minutes | 4 (1.8%) | 0 (0.0%) |
| 40 to 44 Minutes | 11 (4.9%) | 11 (5.5%) |
| 45 to 59 Minutes | 15 (6.6%) | 16 (8.0%) |
| 60 to 89 Minutes | 15 (6.6%) | 8 (4.0%) |
| 90 or more Minutes | 13 (5.7%) | 0 (0.0%) |
Time of Departure to Work by Sex in Glenburn
The most frequent times of departure to work in Glenburn are 7:00 AM to 7:29 AM (69, 30.4%) for males and 8:00 AM to 8:29 AM (54, 26.9%) for females.
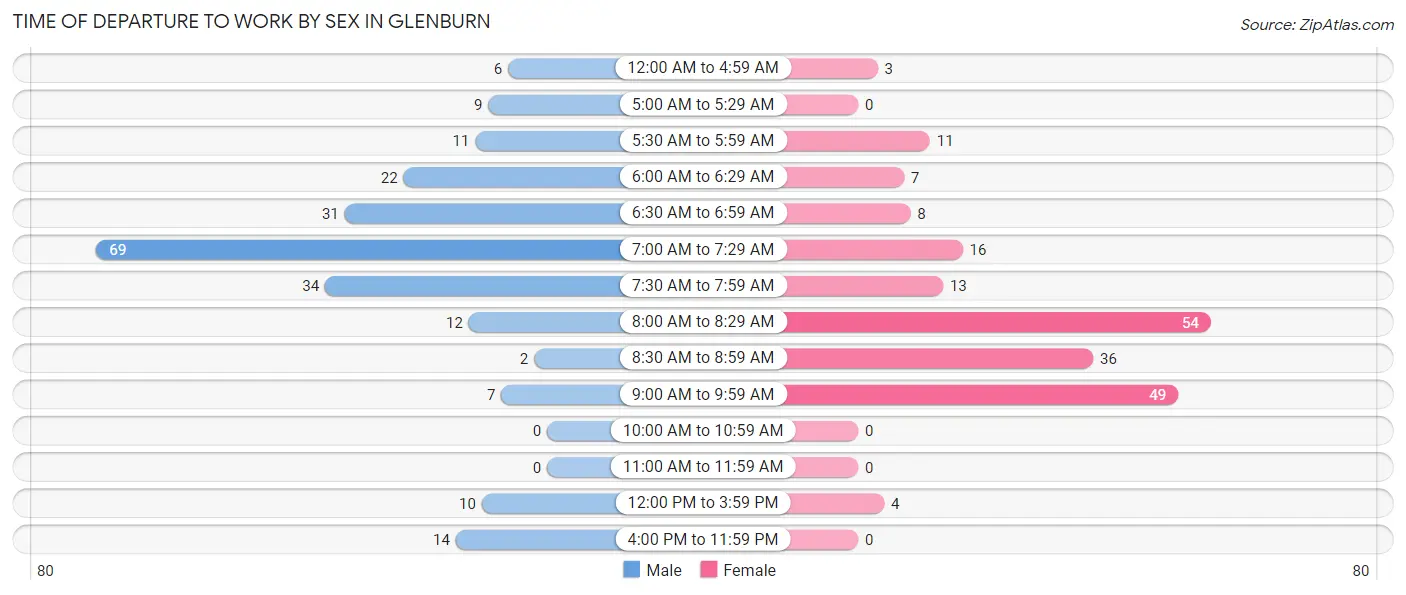
| Time of Departure | Male | Female |
| 12:00 AM to 4:59 AM | 6 (2.6%) | 3 (1.5%) |
| 5:00 AM to 5:29 AM | 9 (4.0%) | 0 (0.0%) |
| 5:30 AM to 5:59 AM | 11 (4.9%) | 11 (5.5%) |
| 6:00 AM to 6:29 AM | 22 (9.7%) | 7 (3.5%) |
| 6:30 AM to 6:59 AM | 31 (13.7%) | 8 (4.0%) |
| 7:00 AM to 7:29 AM | 69 (30.4%) | 16 (8.0%) |
| 7:30 AM to 7:59 AM | 34 (15.0%) | 13 (6.5%) |
| 8:00 AM to 8:29 AM | 12 (5.3%) | 54 (26.9%) |
| 8:30 AM to 8:59 AM | 2 (0.9%) | 36 (17.9%) |
| 9:00 AM to 9:59 AM | 7 (3.1%) | 49 (24.4%) |
| 10:00 AM to 10:59 AM | 0 (0.0%) | 0 (0.0%) |
| 11:00 AM to 11:59 AM | 0 (0.0%) | 0 (0.0%) |
| 12:00 PM to 3:59 PM | 10 (4.4%) | 4 (2.0%) |
| 4:00 PM to 11:59 PM | 14 (6.2%) | 0 (0.0%) |
| Total | 227 (100.0%) | 201 (100.0%) |
Housing Occupancy in Glenburn
Occupancy by Ownership in Glenburn
Of the total 435 dwellings in Glenburn, owner-occupied units account for 318 (73.1%), while renter-occupied units make up 117 (26.9%).
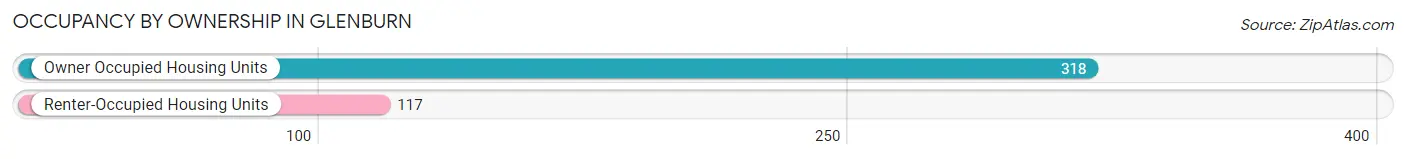
| Occupancy | # Housing Units | % Housing Units |
| Owner Occupied Housing Units | 318 | 73.1% |
| Renter-Occupied Housing Units | 117 | 26.9% |
| Total Occupied Housing Units | 435 | 100.0% |
Occupancy by Household Size in Glenburn
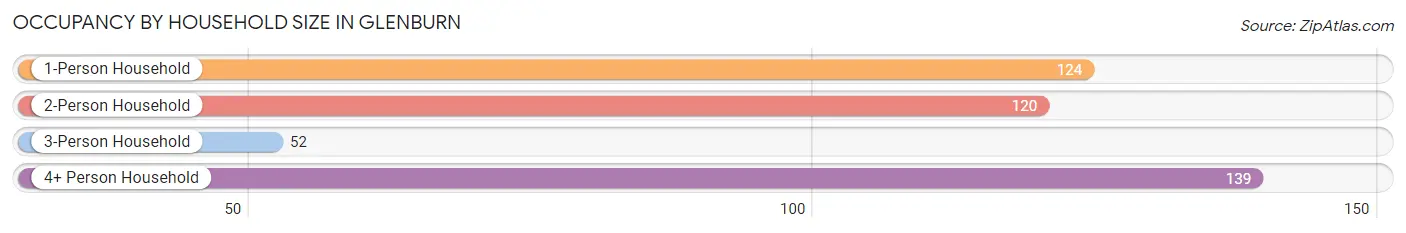
| Household Size | # Housing Units | % Housing Units |
| 1-Person Household | 124 | 28.5% |
| 2-Person Household | 120 | 27.6% |
| 3-Person Household | 52 | 11.9% |
| 4+ Person Household | 139 | 32.0% |
| Total Housing Units | 435 | 100.0% |
Occupancy by Ownership by Household Size in Glenburn
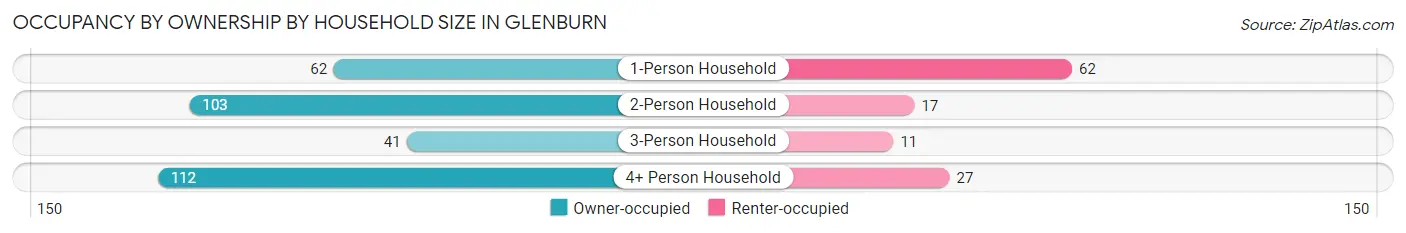
| Household Size | Owner-occupied | Renter-occupied |
| 1-Person Household | 62 (50.0%) | 62 (50.0%) |
| 2-Person Household | 103 (85.8%) | 17 (14.2%) |
| 3-Person Household | 41 (78.8%) | 11 (21.1%) |
| 4+ Person Household | 112 (80.6%) | 27 (19.4%) |
| Total Housing Units | 318 (73.1%) | 117 (26.9%) |
Occupancy by Educational Attainment in Glenburn
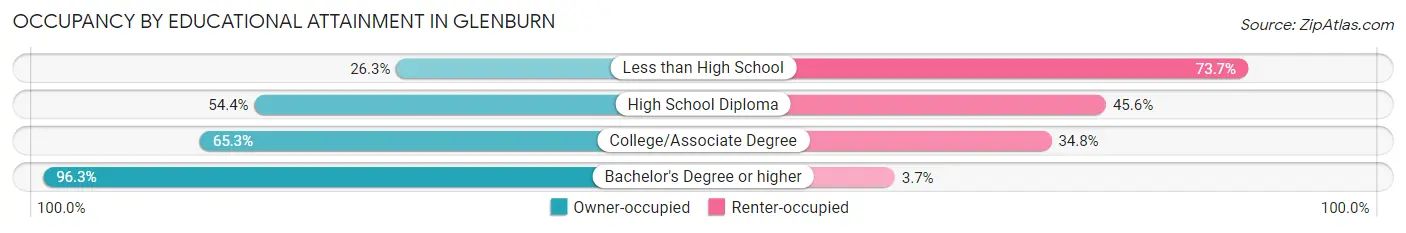
| Household Size | Owner-occupied | Renter-occupied |
| Less than High School | 10 (26.3%) | 28 (73.7%) |
| High School Diploma | 49 (54.4%) | 41 (45.6%) |
| College/Associate Degree | 77 (65.2%) | 41 (34.7%) |
| Bachelor's Degree or higher | 182 (96.3%) | 7 (3.7%) |
Occupancy by Age of Householder in Glenburn
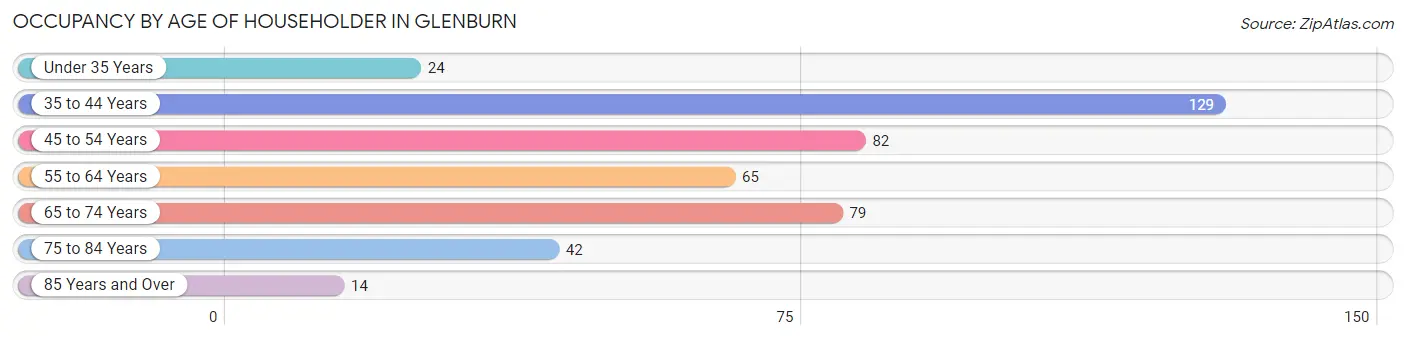
| Age Bracket | # Households | % Households |
| Under 35 Years | 24 | 5.5% |
| 35 to 44 Years | 129 | 29.7% |
| 45 to 54 Years | 82 | 18.9% |
| 55 to 64 Years | 65 | 14.9% |
| 65 to 74 Years | 79 | 18.2% |
| 75 to 84 Years | 42 | 9.7% |
| 85 Years and Over | 14 | 3.2% |
| Total | 435 | 100.0% |
Housing Finances in Glenburn
Median Income by Occupancy in Glenburn
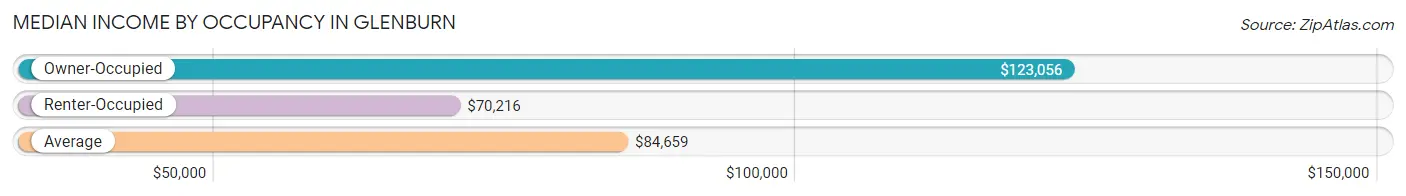
| Occupancy Type | # Households | Median Income |
| Owner-Occupied | 318 (73.1%) | $123,056 |
| Renter-Occupied | 117 (26.9%) | $70,216 |
| Average | 435 (100.0%) | $84,659 |
Occupancy by Householder Income Bracket in Glenburn
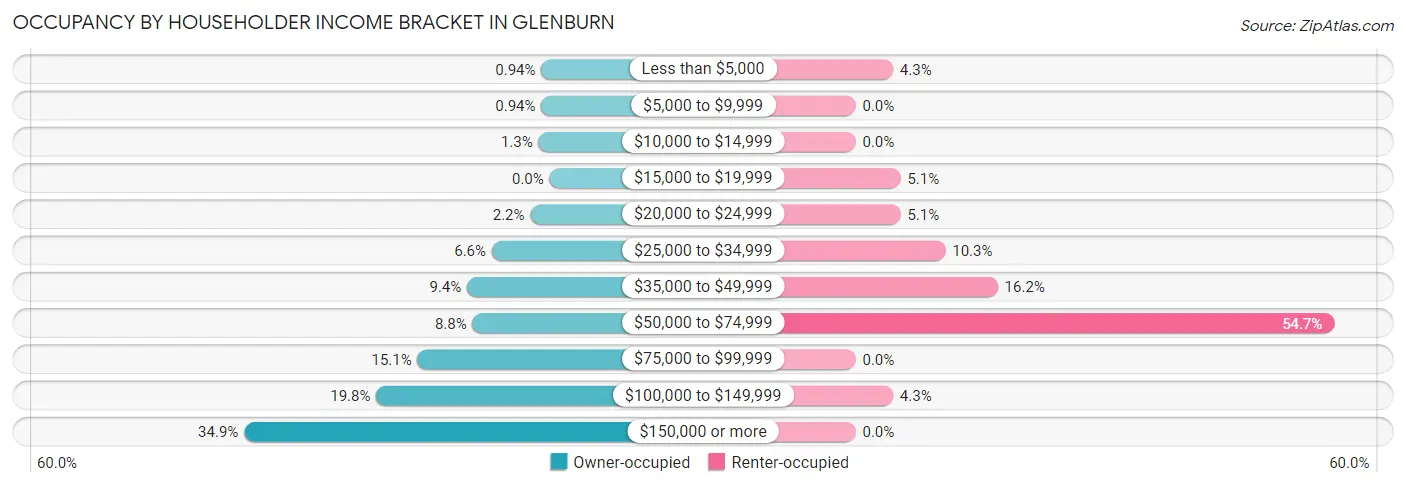
| Income Bracket | Owner-occupied | Renter-occupied |
| Less than $5,000 | 3 (0.9%) | 5 (4.3%) |
| $5,000 to $9,999 | 3 (0.9%) | 0 (0.0%) |
| $10,000 to $14,999 | 4 (1.3%) | 0 (0.0%) |
| $15,000 to $19,999 | 0 (0.0%) | 6 (5.1%) |
| $20,000 to $24,999 | 7 (2.2%) | 6 (5.1%) |
| $25,000 to $34,999 | 21 (6.6%) | 12 (10.3%) |
| $35,000 to $49,999 | 30 (9.4%) | 19 (16.2%) |
| $50,000 to $74,999 | 28 (8.8%) | 64 (54.7%) |
| $75,000 to $99,999 | 48 (15.1%) | 0 (0.0%) |
| $100,000 to $149,999 | 63 (19.8%) | 5 (4.3%) |
| $150,000 or more | 111 (34.9%) | 0 (0.0%) |
| Total | 318 (100.0%) | 117 (100.0%) |
Monthly Housing Cost Tiers in Glenburn
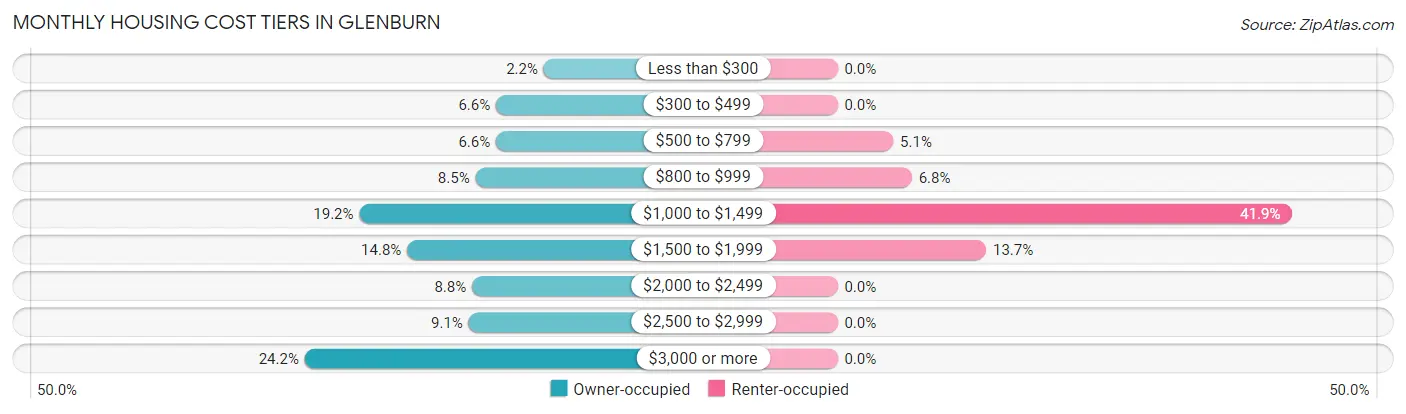
| Monthly Cost | Owner-occupied | Renter-occupied |
| Less than $300 | 7 (2.2%) | 0 (0.0%) |
| $300 to $499 | 21 (6.6%) | 0 (0.0%) |
| $500 to $799 | 21 (6.6%) | 6 (5.1%) |
| $800 to $999 | 27 (8.5%) | 8 (6.8%) |
| $1,000 to $1,499 | 61 (19.2%) | 49 (41.9%) |
| $1,500 to $1,999 | 47 (14.8%) | 16 (13.7%) |
| $2,000 to $2,499 | 28 (8.8%) | 0 (0.0%) |
| $2,500 to $2,999 | 29 (9.1%) | 0 (0.0%) |
| $3,000 or more | 77 (24.2%) | 0 (0.0%) |
| Total | 318 (100.0%) | 117 (100.0%) |
Physical Housing Characteristics in Glenburn
Housing Structures in Glenburn
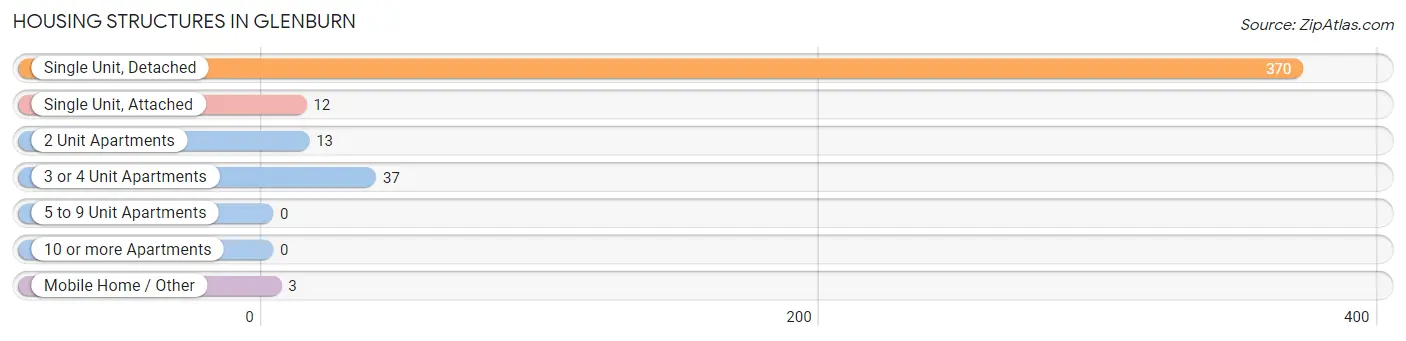
| Structure Type | # Housing Units | % Housing Units |
| Single Unit, Detached | 370 | 85.1% |
| Single Unit, Attached | 12 | 2.8% |
| 2 Unit Apartments | 13 | 3.0% |
| 3 or 4 Unit Apartments | 37 | 8.5% |
| 5 to 9 Unit Apartments | 0 | 0.0% |
| 10 or more Apartments | 0 | 0.0% |
| Mobile Home / Other | 3 | 0.7% |
| Total | 435 | 100.0% |
Housing Structures by Occupancy in Glenburn
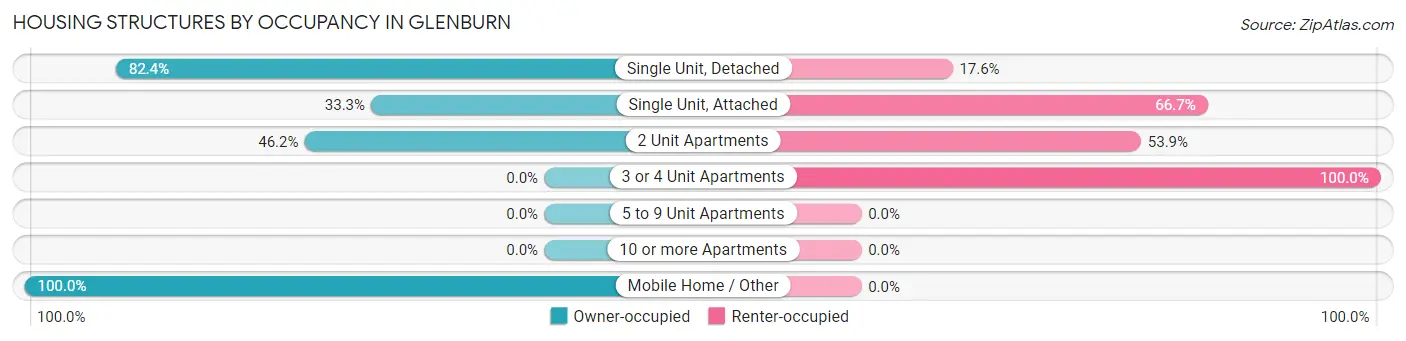
| Structure Type | Owner-occupied | Renter-occupied |
| Single Unit, Detached | 305 (82.4%) | 65 (17.6%) |
| Single Unit, Attached | 4 (33.3%) | 8 (66.7%) |
| 2 Unit Apartments | 6 (46.2%) | 7 (53.8%) |
| 3 or 4 Unit Apartments | 0 (0.0%) | 37 (100.0%) |
| 5 to 9 Unit Apartments | 0 (0.0%) | 0 (0.0%) |
| 10 or more Apartments | 0 (0.0%) | 0 (0.0%) |
| Mobile Home / Other | 3 (100.0%) | 0 (0.0%) |
| Total | 318 (73.1%) | 117 (26.9%) |
Housing Structures by Number of Rooms in Glenburn
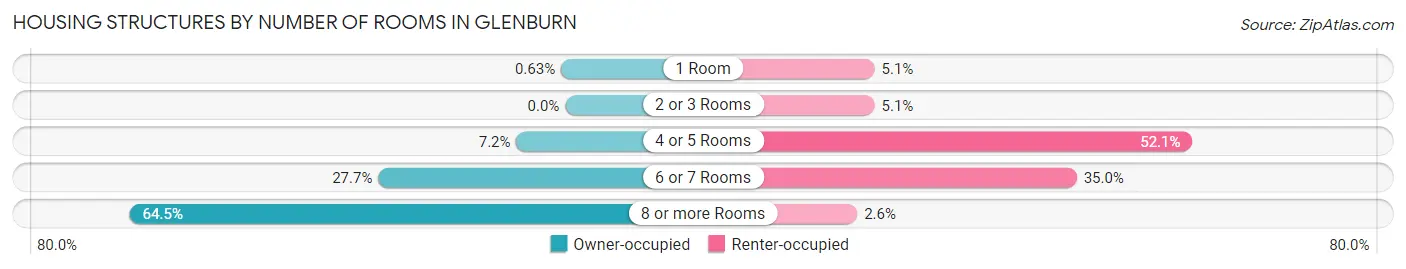
| Number of Rooms | Owner-occupied | Renter-occupied |
| 1 Room | 2 (0.6%) | 6 (5.1%) |
| 2 or 3 Rooms | 0 (0.0%) | 6 (5.1%) |
| 4 or 5 Rooms | 23 (7.2%) | 61 (52.1%) |
| 6 or 7 Rooms | 88 (27.7%) | 41 (35.0%) |
| 8 or more Rooms | 205 (64.5%) | 3 (2.6%) |
| Total | 318 (100.0%) | 117 (100.0%) |
Housing Structure by Heating Type in Glenburn
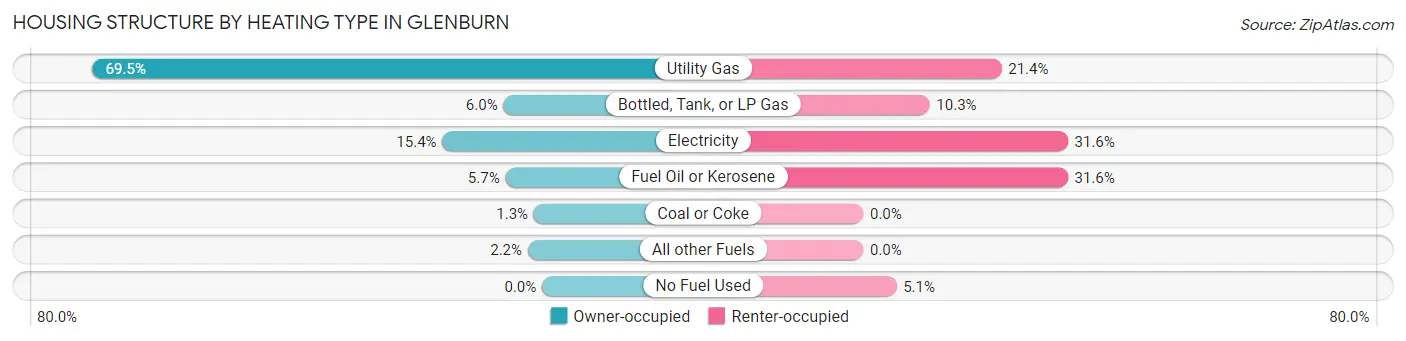
| Heating Type | Owner-occupied | Renter-occupied |
| Utility Gas | 221 (69.5%) | 25 (21.4%) |
| Bottled, Tank, or LP Gas | 19 (6.0%) | 12 (10.3%) |
| Electricity | 49 (15.4%) | 37 (31.6%) |
| Fuel Oil or Kerosene | 18 (5.7%) | 37 (31.6%) |
| Coal or Coke | 4 (1.3%) | 0 (0.0%) |
| All other Fuels | 7 (2.2%) | 0 (0.0%) |
| No Fuel Used | 0 (0.0%) | 6 (5.1%) |
| Total | 318 (100.0%) | 117 (100.0%) |
Household Vehicle Usage in Glenburn
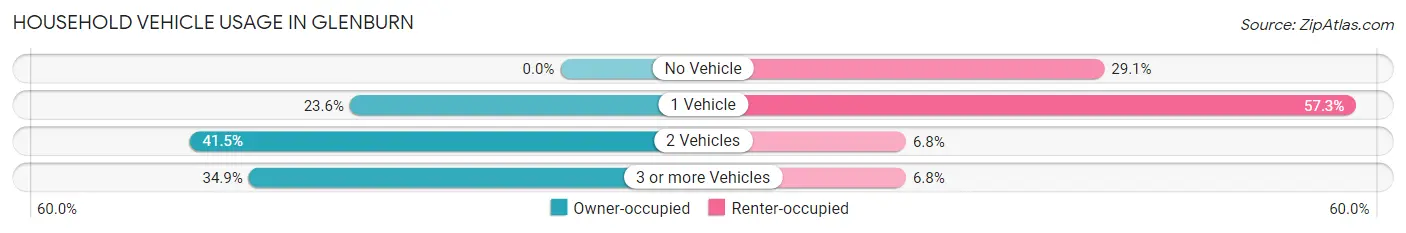
| Vehicles per Household | Owner-occupied | Renter-occupied |
| No Vehicle | 0 (0.0%) | 34 (29.1%) |
| 1 Vehicle | 75 (23.6%) | 67 (57.3%) |
| 2 Vehicles | 132 (41.5%) | 8 (6.8%) |
| 3 or more Vehicles | 111 (34.9%) | 8 (6.8%) |
| Total | 318 (100.0%) | 117 (100.0%) |
Real Estate & Mortgages in Glenburn
Real Estate and Mortgage Overview in Glenburn
| Characteristic | Without Mortgage | With Mortgage |
| Housing Units | 92 | 226 |
| Median Property Value | $370,000 | $322,900 |
| Median Household Income | $54,375 | $83 |
| Monthly Housing Costs | $800 | $77 |
| Real Estate Taxes | $3,679 | $0 |
Property Value by Mortgage Status in Glenburn
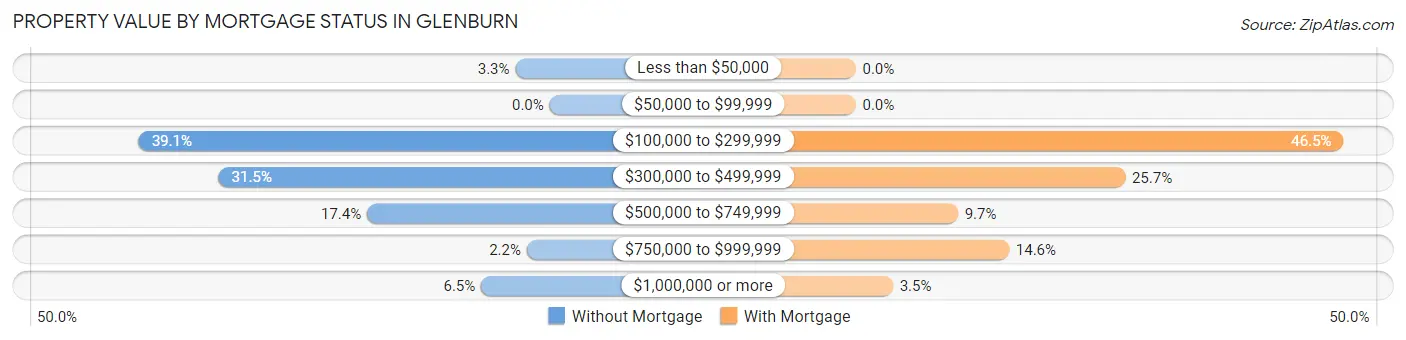
| Property Value | Without Mortgage | With Mortgage |
| Less than $50,000 | 3 (3.3%) | 0 (0.0%) |
| $50,000 to $99,999 | 0 (0.0%) | 0 (0.0%) |
| $100,000 to $299,999 | 36 (39.1%) | 105 (46.5%) |
| $300,000 to $499,999 | 29 (31.5%) | 58 (25.7%) |
| $500,000 to $749,999 | 16 (17.4%) | 22 (9.7%) |
| $750,000 to $999,999 | 2 (2.2%) | 33 (14.6%) |
| $1,000,000 or more | 6 (6.5%) | 8 (3.5%) |
| Total | 92 (100.0%) | 226 (100.0%) |
Household Income by Mortgage Status in Glenburn
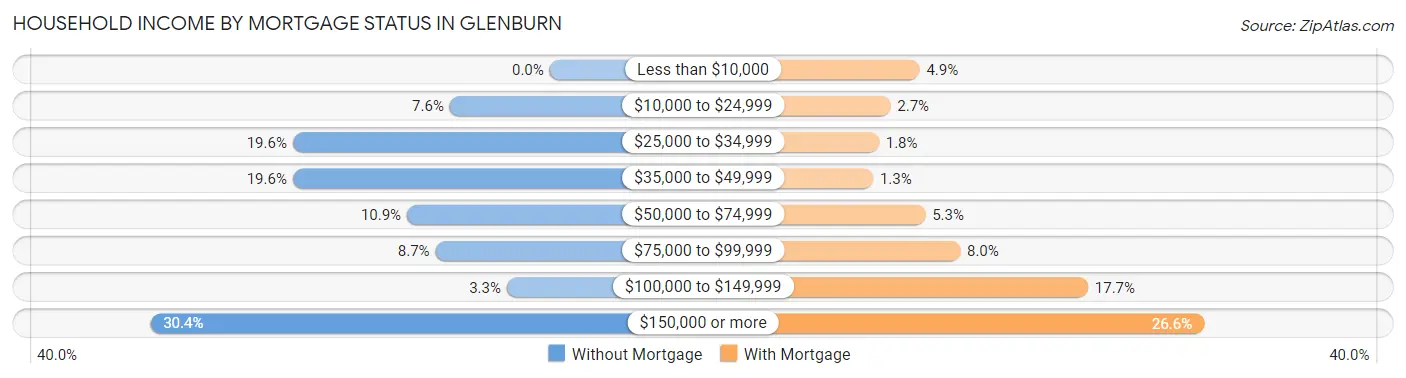
| Household Income | Without Mortgage | With Mortgage |
| Less than $10,000 | 0 (0.0%) | 11 (4.9%) |
| $10,000 to $24,999 | 7 (7.6%) | 6 (2.6%) |
| $25,000 to $34,999 | 18 (19.6%) | 4 (1.8%) |
| $35,000 to $49,999 | 18 (19.6%) | 3 (1.3%) |
| $50,000 to $74,999 | 10 (10.9%) | 12 (5.3%) |
| $75,000 to $99,999 | 8 (8.7%) | 18 (8.0%) |
| $100,000 to $149,999 | 3 (3.3%) | 40 (17.7%) |
| $150,000 or more | 28 (30.4%) | 60 (26.6%) |
| Total | 92 (100.0%) | 226 (100.0%) |
Property Value to Household Income Ratio in Glenburn
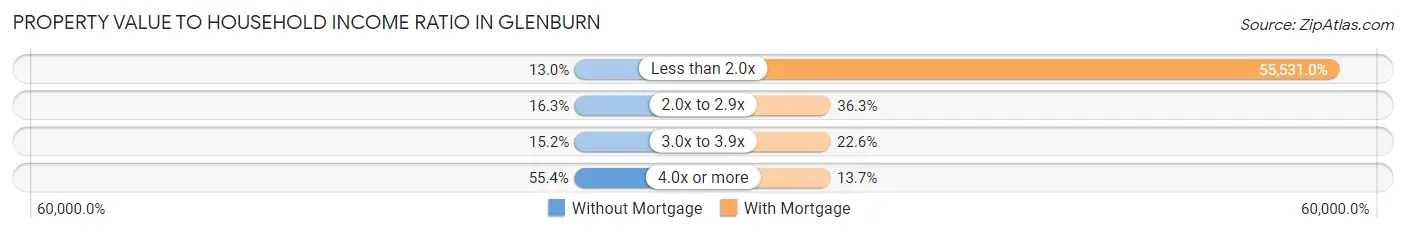
| Value-to-Income Ratio | Without Mortgage | With Mortgage |
| Less than 2.0x | 12 (13.0%) | 125,500 (55,531.0%) |
| 2.0x to 2.9x | 15 (16.3%) | 82 (36.3%) |
| 3.0x to 3.9x | 14 (15.2%) | 51 (22.6%) |
| 4.0x or more | 51 (55.4%) | 31 (13.7%) |
| Total | 92 (100.0%) | 226 (100.0%) |
Real Estate Taxes by Mortgage Status in Glenburn
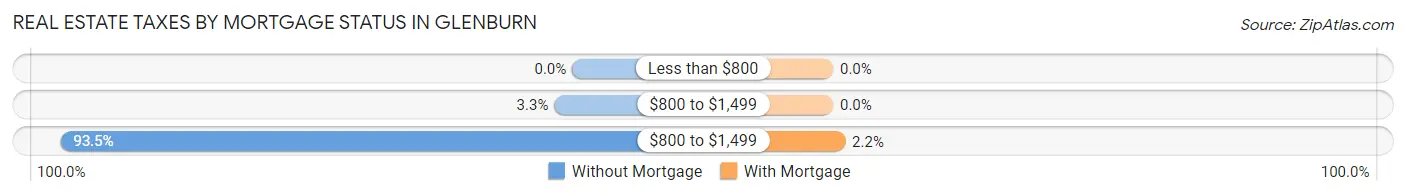
| Property Taxes | Without Mortgage | With Mortgage |
| Less than $800 | 0 (0.0%) | 0 (0.0%) |
| $800 to $1,499 | 3 (3.3%) | 0 (0.0%) |
| $800 to $1,499 | 86 (93.5%) | 5 (2.2%) |
| Total | 92 (100.0%) | 226 (100.0%) |
Health & Disability in Glenburn
Health Insurance Coverage by Age in Glenburn
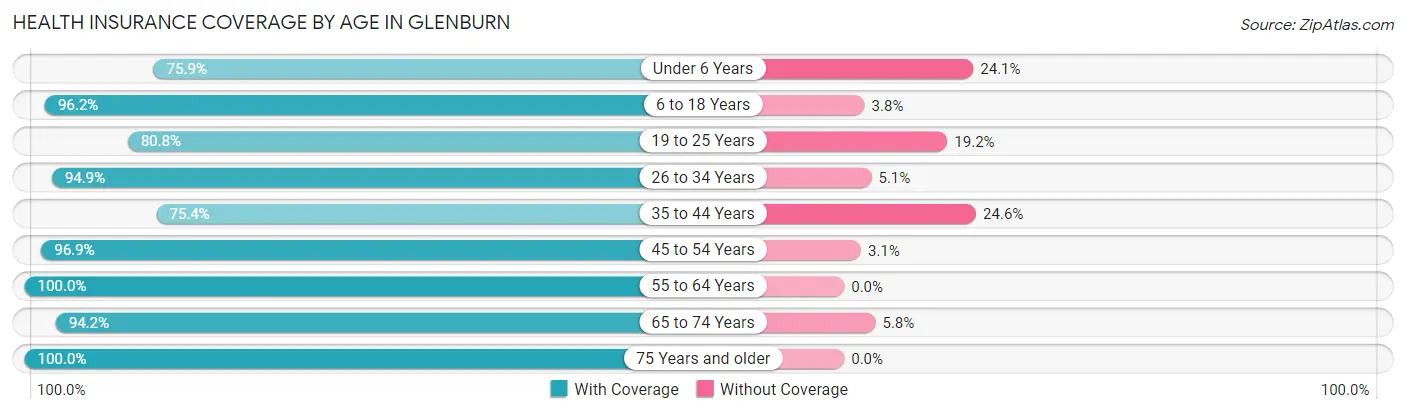
| Age Bracket | With Coverage | Without Coverage |
| Under 6 Years | 123 (75.9%) | 39 (24.1%) |
| 6 to 18 Years | 152 (96.2%) | 6 (3.8%) |
| 19 to 25 Years | 42 (80.8%) | 10 (19.2%) |
| 26 to 34 Years | 56 (94.9%) | 3 (5.1%) |
| 35 to 44 Years | 184 (75.4%) | 60 (24.6%) |
| 45 to 54 Years | 124 (96.9%) | 4 (3.1%) |
| 55 to 64 Years | 127 (100.0%) | 0 (0.0%) |
| 65 to 74 Years | 97 (94.2%) | 6 (5.8%) |
| 75 Years and older | 79 (100.0%) | 0 (0.0%) |
| Total | 984 (88.5%) | 128 (11.5%) |
Health Insurance Coverage by Citizenship Status in Glenburn
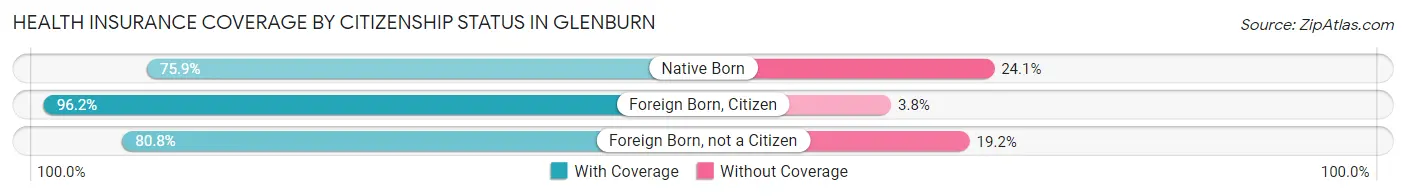
| Citizenship Status | With Coverage | Without Coverage |
| Native Born | 123 (75.9%) | 39 (24.1%) |
| Foreign Born, Citizen | 152 (96.2%) | 6 (3.8%) |
| Foreign Born, not a Citizen | 42 (80.8%) | 10 (19.2%) |
Health Insurance Coverage by Household Income in Glenburn
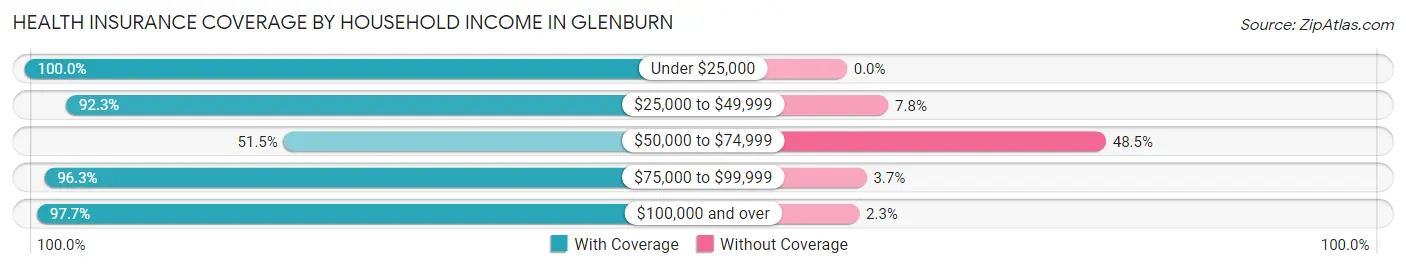
| Household Income | With Coverage | Without Coverage |
| Under $25,000 | 51 (100.0%) | 0 (0.0%) |
| $25,000 to $49,999 | 119 (92.2%) | 10 (7.7%) |
| $50,000 to $74,999 | 105 (51.5%) | 99 (48.5%) |
| $75,000 to $99,999 | 157 (96.3%) | 6 (3.7%) |
| $100,000 and over | 552 (97.7%) | 13 (2.3%) |
Public vs Private Health Insurance Coverage by Age in Glenburn
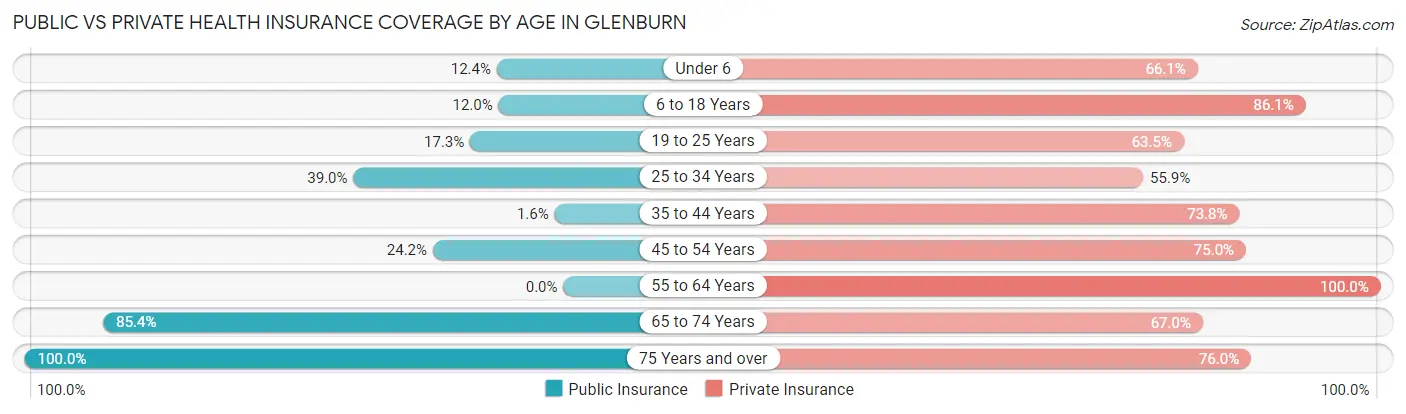
| Age Bracket | Public Insurance | Private Insurance |
| Under 6 | 20 (12.3%) | 107 (66.0%) |
| 6 to 18 Years | 19 (12.0%) | 136 (86.1%) |
| 19 to 25 Years | 9 (17.3%) | 33 (63.5%) |
| 25 to 34 Years | 23 (39.0%) | 33 (55.9%) |
| 35 to 44 Years | 4 (1.6%) | 180 (73.8%) |
| 45 to 54 Years | 31 (24.2%) | 96 (75.0%) |
| 55 to 64 Years | 0 (0.0%) | 127 (100.0%) |
| 65 to 74 Years | 88 (85.4%) | 69 (67.0%) |
| 75 Years and over | 79 (100.0%) | 60 (75.9%) |
| Total | 273 (24.5%) | 841 (75.6%) |
Disability Status by Sex by Age in Glenburn
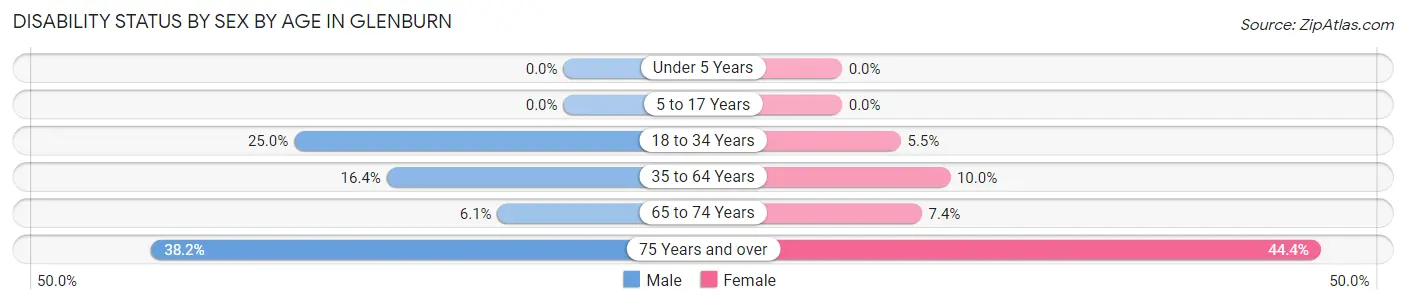
| Age Bracket | Male | Female |
| Under 5 Years | 0 (0.0%) | 0 (0.0%) |
| 5 to 17 Years | 0 (0.0%) | 0 (0.0%) |
| 18 to 34 Years | 18 (25.0%) | 3 (5.4%) |
| 35 to 64 Years | 41 (16.4%) | 25 (10.0%) |
| 65 to 74 Years | 3 (6.1%) | 4 (7.4%) |
| 75 Years and over | 13 (38.2%) | 20 (44.4%) |
Disability Class by Sex by Age in Glenburn
Disability Class: Hearing Difficulty
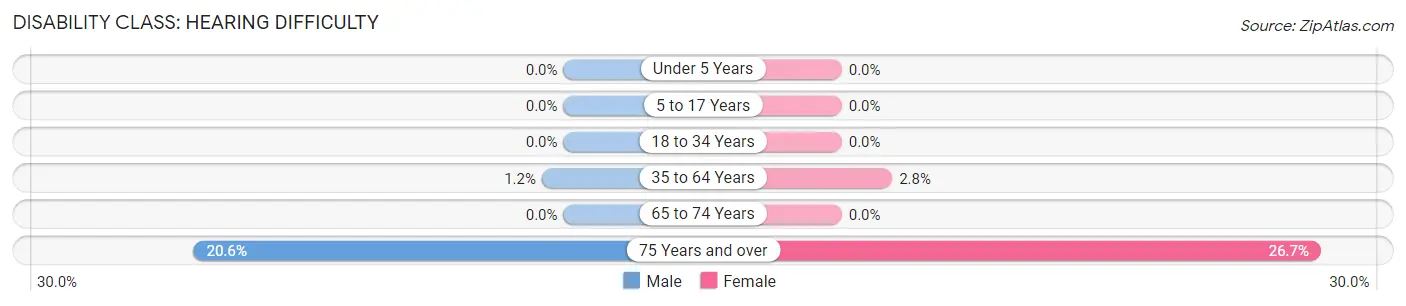
| Age Bracket | Male | Female |
| Under 5 Years | 0 (0.0%) | 0 (0.0%) |
| 5 to 17 Years | 0 (0.0%) | 0 (0.0%) |
| 18 to 34 Years | 0 (0.0%) | 0 (0.0%) |
| 35 to 64 Years | 3 (1.2%) | 7 (2.8%) |
| 65 to 74 Years | 0 (0.0%) | 0 (0.0%) |
| 75 Years and over | 7 (20.6%) | 12 (26.7%) |
Disability Class: Vision Difficulty
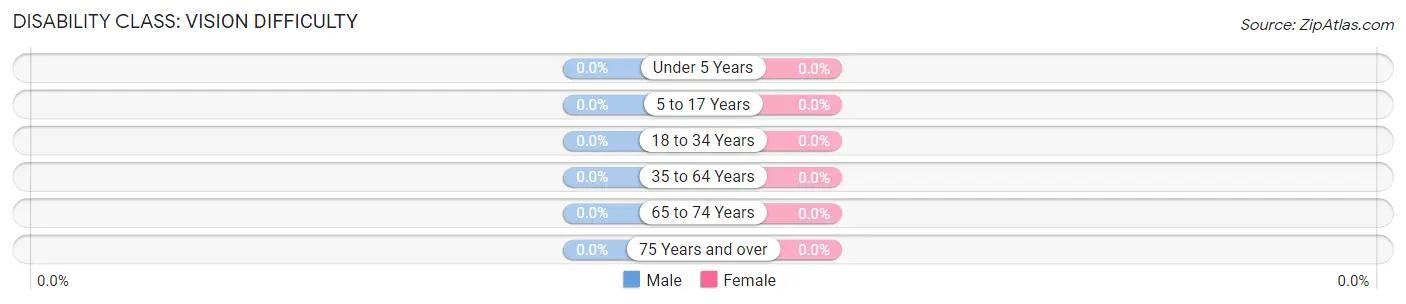
| Age Bracket | Male | Female |
| Under 5 Years | 0 (0.0%) | 0 (0.0%) |
| 5 to 17 Years | 0 (0.0%) | 0 (0.0%) |
| 18 to 34 Years | 0 (0.0%) | 0 (0.0%) |
| 35 to 64 Years | 0 (0.0%) | 0 (0.0%) |
| 65 to 74 Years | 0 (0.0%) | 0 (0.0%) |
| 75 Years and over | 0 (0.0%) | 0 (0.0%) |
Disability Class: Cognitive Difficulty
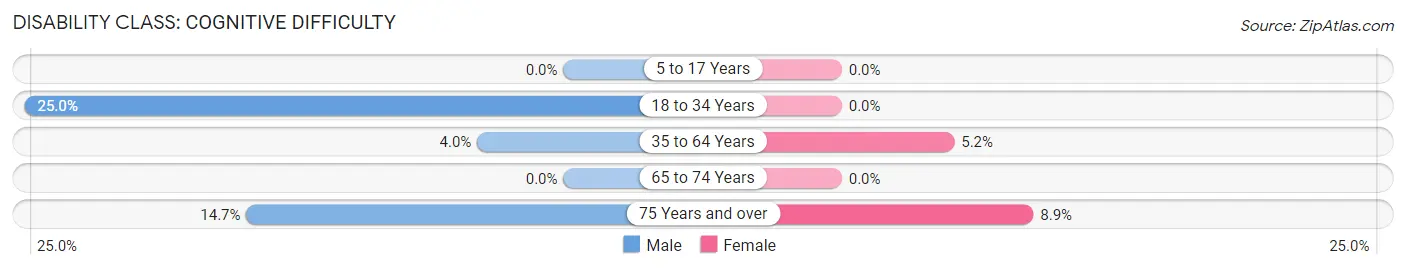
| Age Bracket | Male | Female |
| 5 to 17 Years | 0 (0.0%) | 0 (0.0%) |
| 18 to 34 Years | 18 (25.0%) | 0 (0.0%) |
| 35 to 64 Years | 10 (4.0%) | 13 (5.2%) |
| 65 to 74 Years | 0 (0.0%) | 0 (0.0%) |
| 75 Years and over | 5 (14.7%) | 4 (8.9%) |
Disability Class: Ambulatory Difficulty
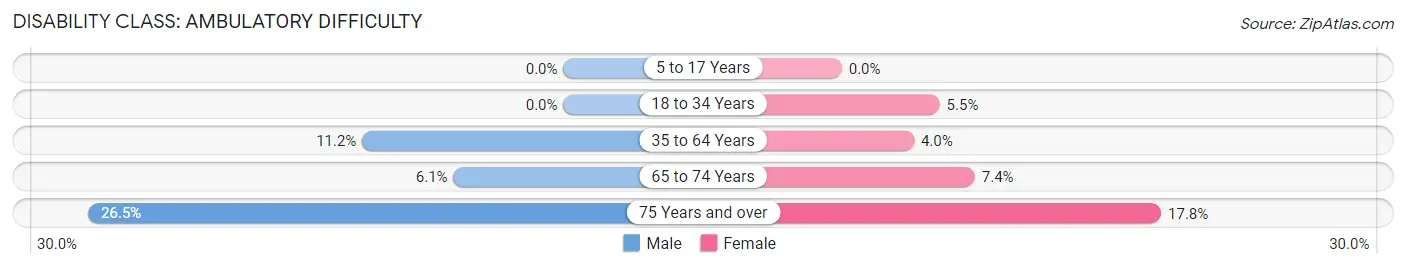
| Age Bracket | Male | Female |
| 5 to 17 Years | 0 (0.0%) | 0 (0.0%) |
| 18 to 34 Years | 0 (0.0%) | 3 (5.4%) |
| 35 to 64 Years | 28 (11.2%) | 10 (4.0%) |
| 65 to 74 Years | 3 (6.1%) | 4 (7.4%) |
| 75 Years and over | 9 (26.5%) | 8 (17.8%) |
Disability Class: Self-Care Difficulty
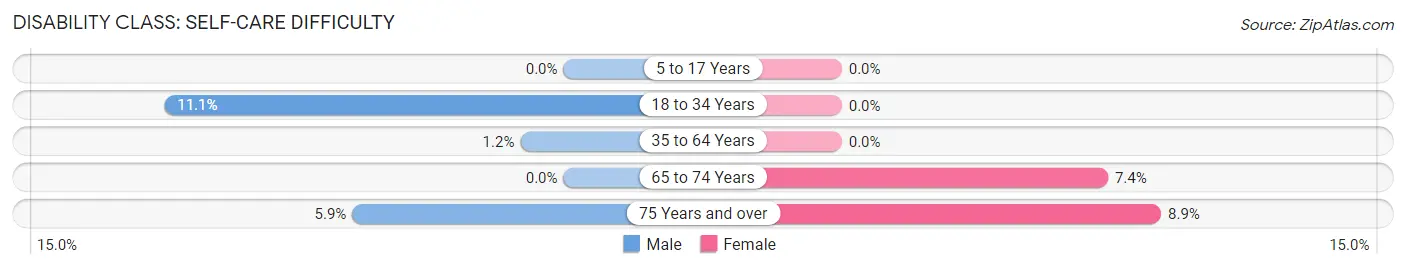
| Age Bracket | Male | Female |
| 5 to 17 Years | 0 (0.0%) | 0 (0.0%) |
| 18 to 34 Years | 8 (11.1%) | 0 (0.0%) |
| 35 to 64 Years | 3 (1.2%) | 0 (0.0%) |
| 65 to 74 Years | 0 (0.0%) | 4 (7.4%) |
| 75 Years and over | 2 (5.9%) | 4 (8.9%) |
Technology Access in Glenburn
Computing Device Access in Glenburn
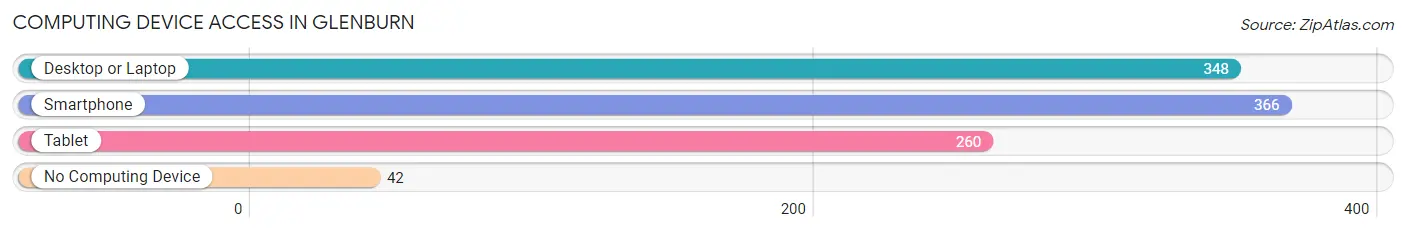
| Device Type | # Households | % Households |
| Desktop or Laptop | 348 | 80.0% |
| Smartphone | 366 | 84.1% |
| Tablet | 260 | 59.8% |
| No Computing Device | 42 | 9.7% |
| Total | 435 | 100.0% |
Internet Access in Glenburn
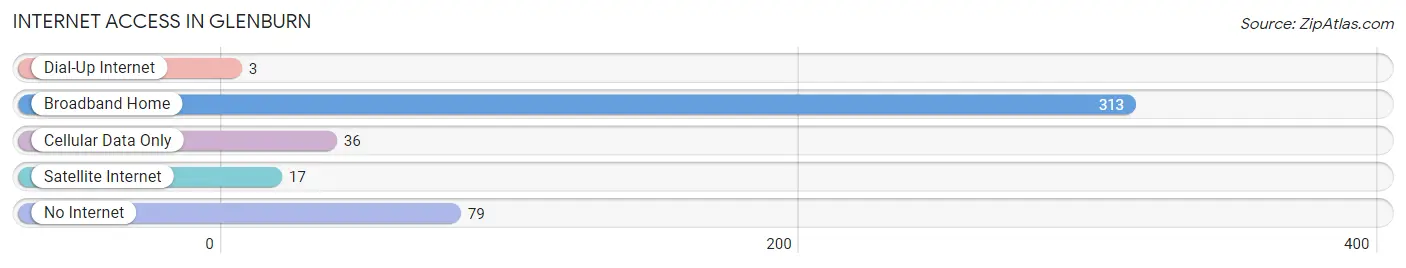
| Internet Type | # Households | % Households |
| Dial-Up Internet | 3 | 0.7% |
| Broadband Home | 313 | 72.0% |
| Cellular Data Only | 36 | 8.3% |
| Satellite Internet | 17 | 3.9% |
| No Internet | 79 | 18.2% |
| Total | 435 | 100.0% |
Glenburn Summary
Glenburn, Pennsylvania is a small borough located in Lackawanna County, Pennsylvania. It is situated in the foothills of the Pocono Mountains, approximately 10 miles north of Scranton. The population of Glenburn was 1,845 at the 2010 census.
History
Glenburn was first settled in the early 1800s by a group of Irish immigrants. The town was originally known as “Glenburne” and was part of the town of North Abington. In 1845, the town was officially incorporated as the Borough of Glenburn.
The town was named after the Glenburne family, who were prominent landowners in the area. The family owned a large tract of land that stretched from the Lackawanna River to the top of the mountain. The family also owned a large grist mill, which was the main source of employment for the town’s residents.
The town grew steadily throughout the 19th century, and by the early 20th century, it had become a popular summer resort destination. The town was home to several large hotels, including the Glenburn Hotel, which was built in 1891. The hotel was a popular destination for wealthy families from Philadelphia and New York City.
Geography
Glenburn is located in the foothills of the Pocono Mountains, approximately 10 miles north of Scranton. The town is situated on the Lackawanna River, which flows through the center of town. The town is bordered by the towns of North Abington, Clarks Summit, and Dalton.
The terrain of Glenburn is mostly hilly, with some flat areas near the river. The highest point in the town is located at the top of the mountain, which is approximately 1,500 feet above sea level.
Economy
The economy of Glenburn is largely based on tourism. The town is home to several popular attractions, including the Lackawanna River, the Glenburn Hotel, and the Glenburn Country Club. The town also has several small businesses, including restaurants, shops, and a few small manufacturing companies.
The town is also home to several large employers, including the University of Scranton, Geisinger Health System, and the Commonwealth of Pennsylvania.
Demographics
As of the 2010 census, the population of Glenburn was 1,845. The racial makeup of the town was 97.3% White, 0.9% African American, 0.2% Native American, 0.4% Asian, and 0.9% from other races. Hispanic or Latino of any race were 1.2% of the population.
The median household income in Glenburn was $45,938, and the median family income was $54,844. The per capita income for the town was $22,845. About 8.3% of families and 10.2% of the population were below the poverty line, including 14.2% of those under age 18 and 5.2% of those age 65 or over.
Common Questions
What is Per Capita Income in Glenburn?
Per Capita income in Glenburn is $54,238.
What is the Median Family Income in Glenburn?
Median Family Income in Glenburn is $122,917.
What is the Median Household income in Glenburn?
Median Household Income in Glenburn is $84,659.
What is Income or Wage Gap in Glenburn?
Income or Wage Gap in Glenburn is 44.8%.
Women in Glenburn earn 55.2 cents for every dollar earned by a man.
What is Family Income Deficit in Glenburn?
Family Income Deficit in Glenburn is $16,663.
Families that are below poverty line in Glenburn earn $16,663 less on average than the poverty threshold level.
What is Inequality or Gini Index in Glenburn?
Inequality or Gini Index in Glenburn is 0.51.
What is the Total Population of Glenburn?
Total Population of Glenburn is 1,112.
What is the Total Male Population of Glenburn?
Total Male Population of Glenburn is 542.
What is the Total Female Population of Glenburn?
Total Female Population of Glenburn is 570.
What is the Ratio of Males per 100 Females in Glenburn?
There are 95.09 Males per 100 Females in Glenburn.
What is the Ratio of Females per 100 Males in Glenburn?
There are 105.17 Females per 100 Males in Glenburn.
What is the Median Population Age in Glenburn?
Median Population Age in Glenburn is 38.9 Years.
What is the Average Family Size in Glenburn
Average Family Size in Glenburn is 3.1 People.
What is the Average Household Size in Glenburn
Average Household Size in Glenburn is 2.6 People.
How Large is the Labor Force in Glenburn?
There are 541 People in the Labor Forcein in Glenburn.
What is the Percentage of People in the Labor Force in Glenburn?
65.8% of People are in the Labor Force in Glenburn.
What is the Unemployment Rate in Glenburn?
Unemployment Rate in Glenburn is 9.6%.