Matamoras borough, PA Map & Demographics
Matamoras borough Overview
$60,497
PER CAPITA INCOME
$86,514
AVG FAMILY INCOME
$78,500
AVG HOUSEHOLD INCOME
30.4%
WAGE / INCOME GAP [ % ]
69.6¢/ $1
WAGE / INCOME GAP [ $ ]
0.56
INEQUALITY / GINI INDEX
2,396
TOTAL POPULATION
1,258
MALE POPULATION
1,138
FEMALE POPULATION
110.54
MALES / 100 FEMALES
90.46
FEMALES / 100 MALES
43.1
MEDIAN AGE
2.9
AVG FAMILY SIZE
2.2
AVG HOUSEHOLD SIZE
1,397
LABOR FORCE [ PEOPLE ]
71.6%
PERCENT IN LABOR FORCE
1.7%
UNEMPLOYMENT RATE
Income in Matamoras borough
Income Overview in Matamoras borough
Per Capita Income in Matamoras borough is $60,497, while median incomes of families and households are $86,514 and $78,500 respectively.
| Characteristic | Number | Measure |
| Per Capita Income | 2,396 | $60,497 |
| Median Family Income | 635 | $86,514 |
| Mean Family Income | 635 | $117,007 |
| Median Household Income | 1,064 | $78,500 |
| Mean Household Income | 1,064 | $133,723 |
| Income Deficit | 635 | $0 |
| Wage / Income Gap (%) | 2,396 | 30.42% |
| Wage / Income Gap ($) | 2,396 | 69.58¢ per $1 |
| Gini / Inequality Index | 2,396 | 0.56 |
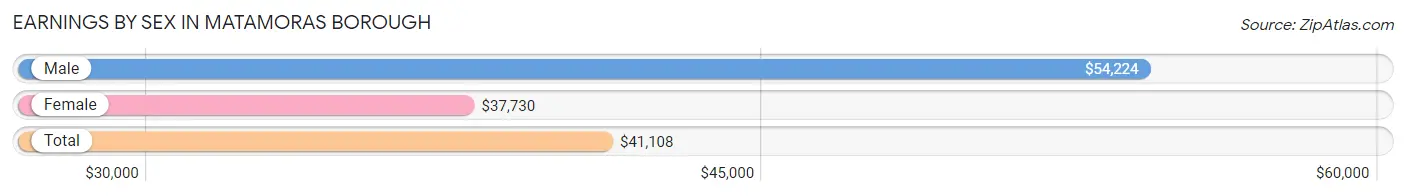
Earnings by Sex in Matamoras borough
Average Earnings in Matamoras borough are $41,108, $54,224 for men and $37,730 for women, a difference of 30.4%.
| Sex | Number | Average Earnings |
| Male | 780 (54.8%) | $54,224 |
| Female | 643 (45.2%) | $37,730 |
| Total | 1,423 (100.0%) | $41,108 |
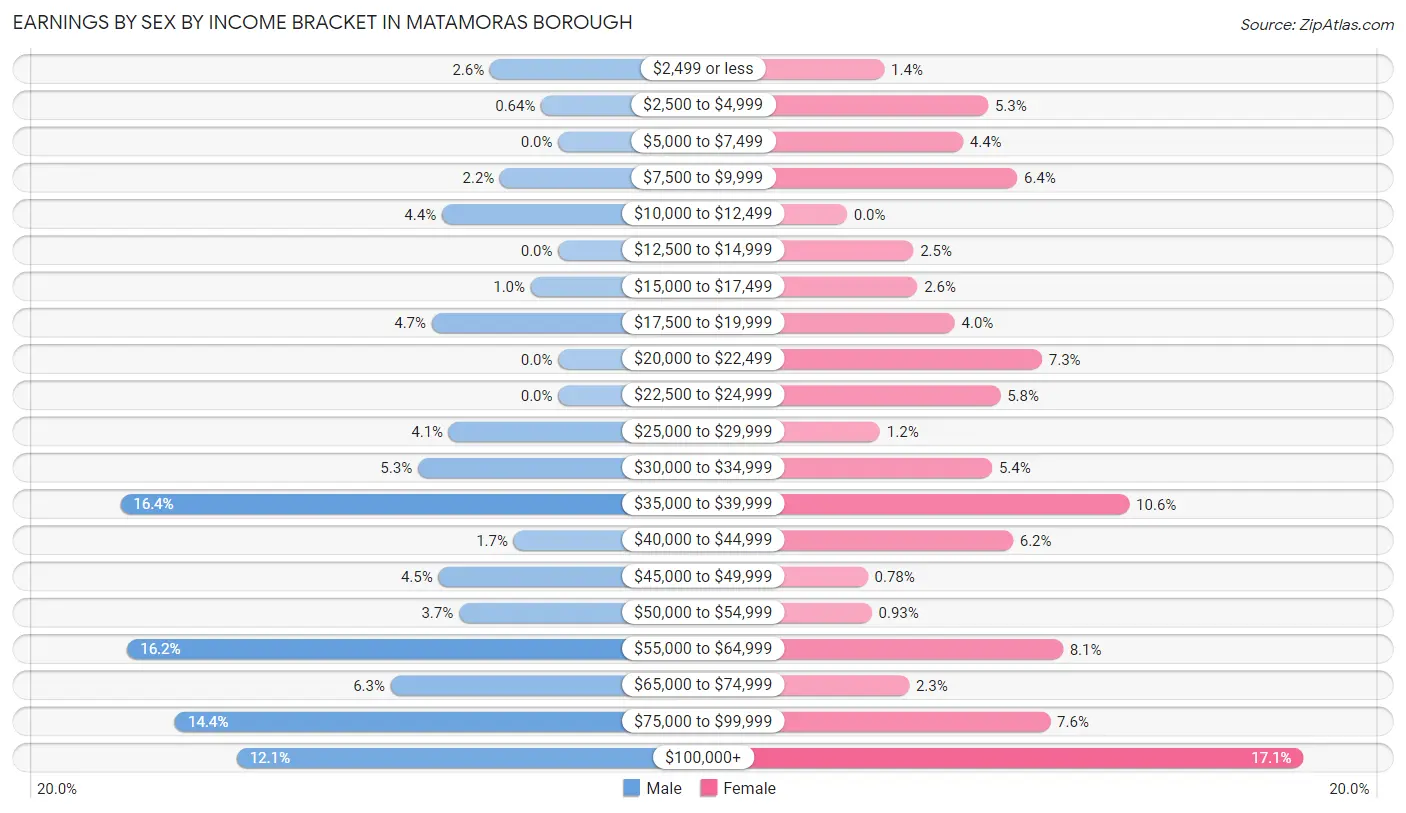
Earnings by Sex by Income Bracket in Matamoras borough
The most common earnings brackets in Matamoras borough are $35,000 to $39,999 for men (128 | 16.4%) and $100,000+ for women (110 | 17.1%).
| Income | Male | Female |
| $2,499 or less | 20 (2.6%) | 9 (1.4%) |
| $2,500 to $4,999 | 5 (0.6%) | 34 (5.3%) |
| $5,000 to $7,499 | 0 (0.0%) | 28 (4.3%) |
| $7,500 to $9,999 | 17 (2.2%) | 41 (6.4%) |
| $10,000 to $12,499 | 34 (4.4%) | 0 (0.0%) |
| $12,500 to $14,999 | 0 (0.0%) | 16 (2.5%) |
| $15,000 to $17,499 | 8 (1.0%) | 17 (2.6%) |
| $17,500 to $19,999 | 37 (4.7%) | 26 (4.0%) |
| $20,000 to $22,499 | 0 (0.0%) | 47 (7.3%) |
| $22,500 to $24,999 | 0 (0.0%) | 37 (5.8%) |
| $25,000 to $29,999 | 32 (4.1%) | 8 (1.2%) |
| $30,000 to $34,999 | 41 (5.3%) | 35 (5.4%) |
| $35,000 to $39,999 | 128 (16.4%) | 68 (10.6%) |
| $40,000 to $44,999 | 13 (1.7%) | 40 (6.2%) |
| $45,000 to $49,999 | 35 (4.5%) | 5 (0.8%) |
| $50,000 to $54,999 | 29 (3.7%) | 6 (0.9%) |
| $55,000 to $64,999 | 126 (16.2%) | 52 (8.1%) |
| $65,000 to $74,999 | 49 (6.3%) | 15 (2.3%) |
| $75,000 to $99,999 | 112 (14.4%) | 49 (7.6%) |
| $100,000+ | 94 (12.0%) | 110 (17.1%) |
| Total | 780 (100.0%) | 643 (100.0%) |
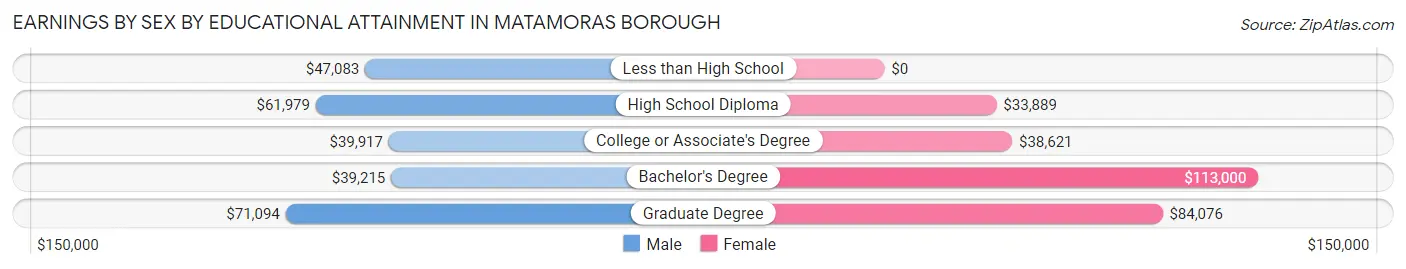
Earnings by Sex by Educational Attainment in Matamoras borough
Average earnings in Matamoras borough are $55,833 for men and $40,344 for women, a difference of 27.7%. Men with an educational attainment of graduate degree enjoy the highest average annual earnings of $71,094, while those with bachelor's degree education earn the least with $39,215. Women with an educational attainment of bachelor's degree earn the most with the average annual earnings of $113,000, while those with high school diploma education have the smallest earnings of $33,889.
| Educational Attainment | Male Income | Female Income |
| Less than High School | $47,083 | $0 |
| High School Diploma | $61,979 | $33,889 |
| College or Associate's Degree | $39,917 | $38,621 |
| Bachelor's Degree | $39,215 | $113,000 |
| Graduate Degree | $71,094 | $84,076 |
| Total | $55,833 | $40,344 |
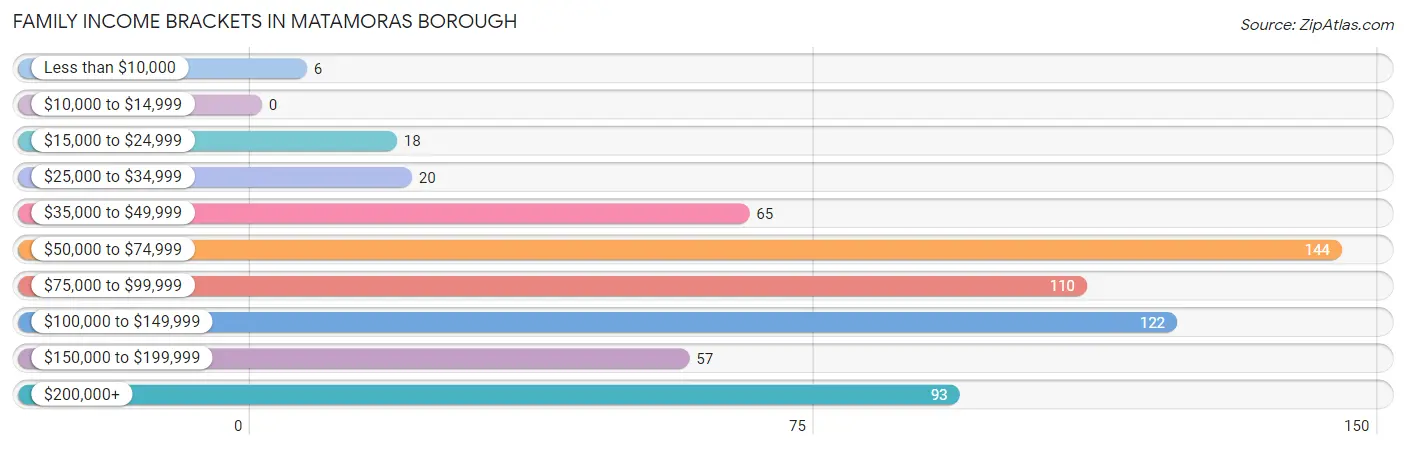
Family Income in Matamoras borough
Family Income Brackets in Matamoras borough
According to the Matamoras borough family income data, there are 144 families falling into the $50,000 to $74,999 income range, which is the most common income bracket and makes up 22.7% of all families.
| Income Bracket | # Families | % Families |
| Less than $10,000 | 6 | 0.9% |
| $10,000 to $14,999 | 0 | 0.0% |
| $15,000 to $24,999 | 18 | 2.8% |
| $25,000 to $34,999 | 20 | 3.1% |
| $35,000 to $49,999 | 65 | 10.2% |
| $50,000 to $74,999 | 144 | 22.7% |
| $75,000 to $99,999 | 110 | 17.3% |
| $100,000 to $149,999 | 122 | 19.2% |
| $150,000 to $199,999 | 57 | 9.0% |
| $200,000+ | 93 | 14.6% |
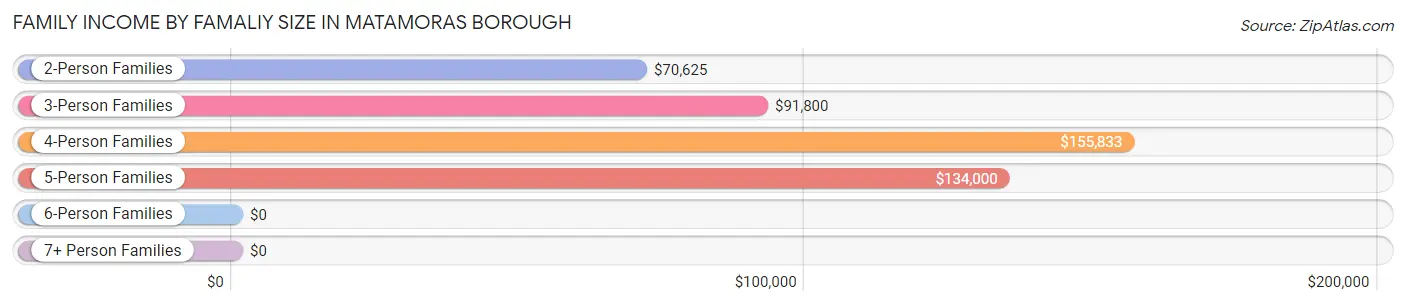
Family Income by Famaliy Size in Matamoras borough
4-person families (44 | 6.9%) account for the highest median family income in Matamoras borough with $155,833 per family, while 4-person families (44 | 6.9%) have the highest median income of $38,958 per family member.
| Income Bracket | # Families | Median Income |
| 2-Person Families | 339 (53.4%) | $70,625 |
| 3-Person Families | 146 (23.0%) | $91,800 |
| 4-Person Families | 44 (6.9%) | $155,833 |
| 5-Person Families | 84 (13.2%) | $134,000 |
| 6-Person Families | 22 (3.5%) | $0 |
| 7+ Person Families | 0 (0.0%) | $0 |
| Total | 635 (100.0%) | $86,514 |
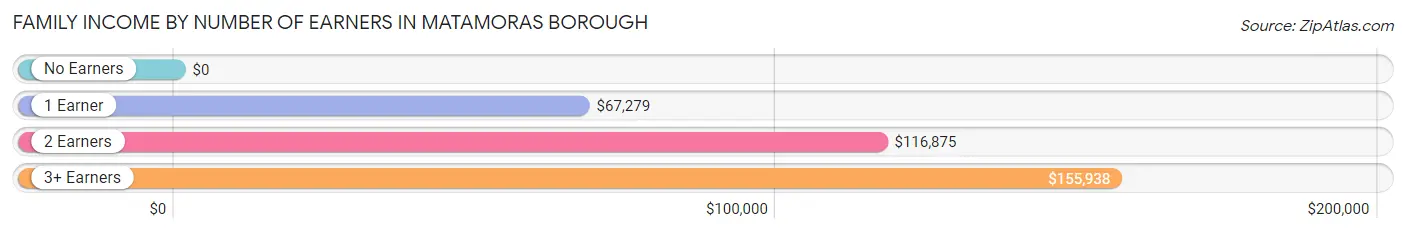
Family Income by Number of Earners in Matamoras borough
| Number of Earners | # Families | Median Income |
| No Earners | 111 (17.5%) | $0 |
| 1 Earner | 179 (28.2%) | $67,279 |
| 2 Earners | 231 (36.4%) | $116,875 |
| 3+ Earners | 114 (17.9%) | $155,938 |
| Total | 635 (100.0%) | $86,514 |
Household Income in Matamoras borough
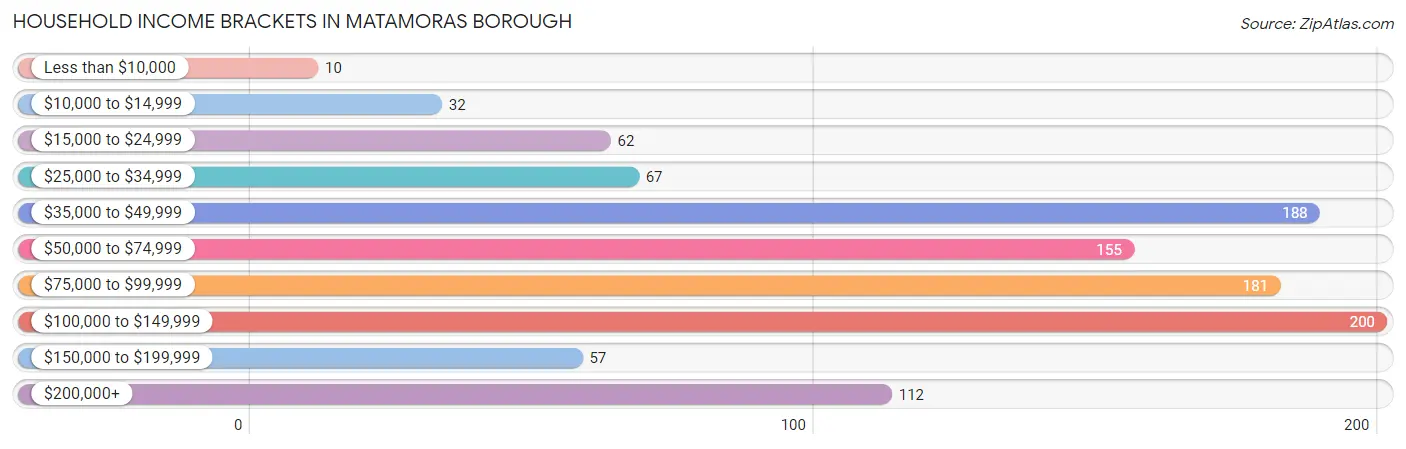
Household Income Brackets in Matamoras borough
With 200 households falling in the category, the $100,000 to $149,999 income range is the most frequent in Matamoras borough, accounting for 18.8% of all households. In contrast, only 10 households (0.9%) fall into the less than $10,000 income bracket, making it the least populous group.
| Income Bracket | # Households | % Households |
| Less than $10,000 | 10 | 0.9% |
| $10,000 to $14,999 | 32 | 3.0% |
| $15,000 to $24,999 | 62 | 5.8% |
| $25,000 to $34,999 | 67 | 6.3% |
| $35,000 to $49,999 | 188 | 17.7% |
| $50,000 to $74,999 | 155 | 14.6% |
| $75,000 to $99,999 | 181 | 17.0% |
| $100,000 to $149,999 | 200 | 18.8% |
| $150,000 to $199,999 | 57 | 5.4% |
| $200,000+ | 112 | 10.5% |
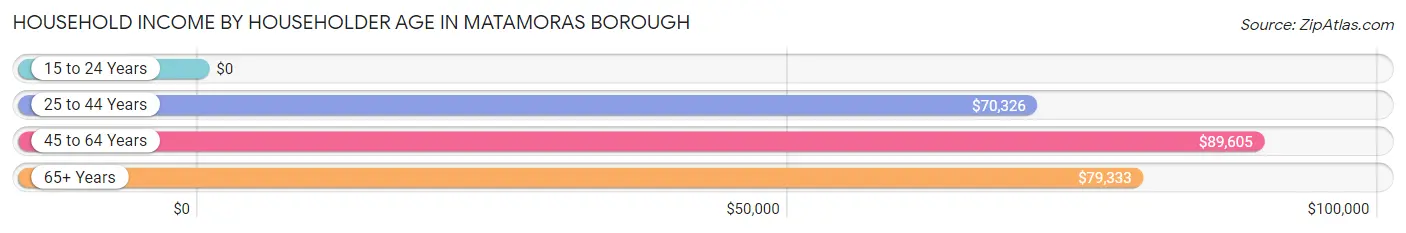
Household Income by Householder Age in Matamoras borough
The median household income in Matamoras borough is $78,500, with the highest median household income of $89,605 found in the 45 to 64 years age bracket for the primary householder. A total of 280 households (26.3%) fall into this category. Meanwhile, the 15 to 24 years age bracket for the primary householder has the lowest median household income of $0, with 24 households (2.3%) in this group.
| Income Bracket | # Households | Median Income |
| 15 to 24 Years | 24 (2.3%) | $0 |
| 25 to 44 Years | 440 (41.3%) | $70,326 |
| 45 to 64 Years | 280 (26.3%) | $89,605 |
| 65+ Years | 320 (30.1%) | $79,333 |
| Total | 1,064 (100.0%) | $78,500 |
Poverty in Matamoras borough
Income Below Poverty by Sex and Age in Matamoras borough
With 3.3% poverty level for males and 2.1% for females among the residents of Matamoras borough, 25 to 34 year old males and 75 year old and over females are the most vulnerable to poverty, with 23 males (18.9%) and 12 females (6.4%) in their respective age groups living below the poverty level.
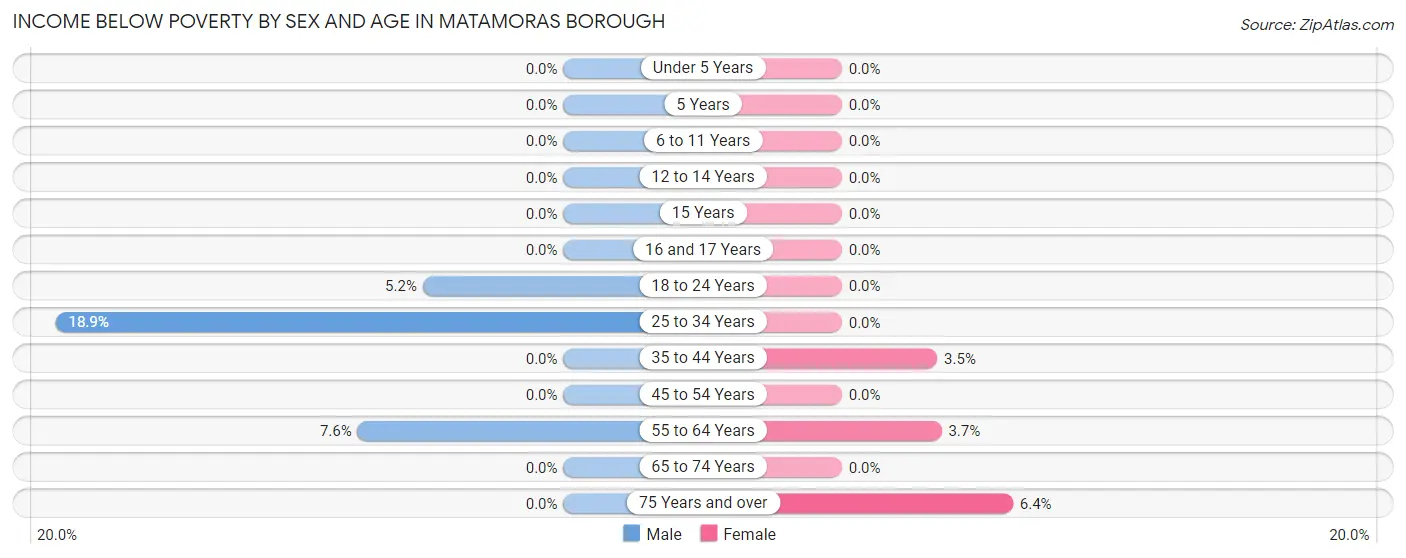
| Age Bracket | Male | Female |
| Under 5 Years | 0 (0.0%) | 0 (0.0%) |
| 5 Years | 0 (0.0%) | 0 (0.0%) |
| 6 to 11 Years | 0 (0.0%) | 0 (0.0%) |
| 12 to 14 Years | 0 (0.0%) | 0 (0.0%) |
| 15 Years | 0 (0.0%) | 0 (0.0%) |
| 16 and 17 Years | 0 (0.0%) | 0 (0.0%) |
| 18 to 24 Years | 6 (5.2%) | 0 (0.0%) |
| 25 to 34 Years | 23 (18.9%) | 0 (0.0%) |
| 35 to 44 Years | 0 (0.0%) | 4 (3.5%) |
| 45 to 54 Years | 0 (0.0%) | 0 (0.0%) |
| 55 to 64 Years | 12 (7.6%) | 8 (3.7%) |
| 65 to 74 Years | 0 (0.0%) | 0 (0.0%) |
| 75 Years and over | 0 (0.0%) | 12 (6.4%) |
| Total | 41 (3.3%) | 24 (2.1%) |
Income Above Poverty by Sex and Age in Matamoras borough
According to the poverty statistics in Matamoras borough, males aged under 5 years and females aged under 5 years are the age groups that are most secure financially, with 100.0% of males and 100.0% of females in these age groups living above the poverty line.
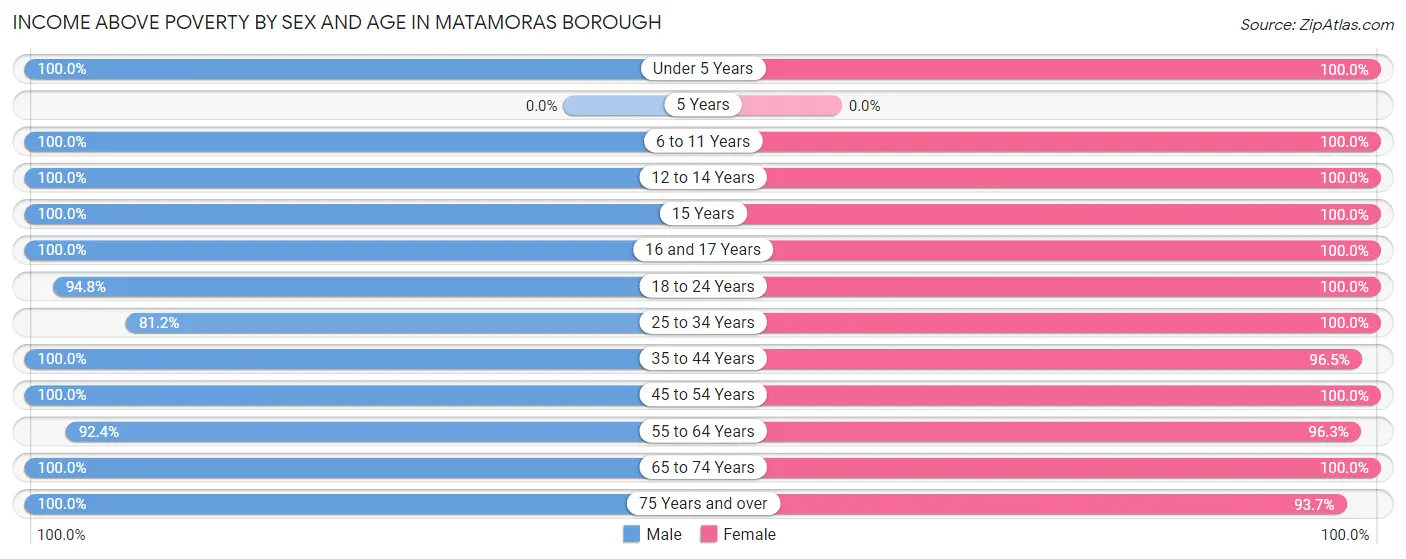
| Age Bracket | Male | Female |
| Under 5 Years | 80 (100.0%) | 46 (100.0%) |
| 5 Years | 0 (0.0%) | 0 (0.0%) |
| 6 to 11 Years | 104 (100.0%) | 104 (100.0%) |
| 12 to 14 Years | 45 (100.0%) | 32 (100.0%) |
| 15 Years | 4 (100.0%) | 12 (100.0%) |
| 16 and 17 Years | 10 (100.0%) | 21 (100.0%) |
| 18 to 24 Years | 109 (94.8%) | 83 (100.0%) |
| 25 to 34 Years | 99 (81.1%) | 146 (100.0%) |
| 35 to 44 Years | 314 (100.0%) | 109 (96.5%) |
| 45 to 54 Years | 101 (100.0%) | 82 (100.0%) |
| 55 to 64 Years | 145 (92.4%) | 208 (96.3%) |
| 65 to 74 Years | 133 (100.0%) | 91 (100.0%) |
| 75 Years and over | 58 (100.0%) | 177 (93.6%) |
| Total | 1,202 (96.7%) | 1,111 (97.9%) |
Income Below Poverty Among Married-Couple Families in Matamoras borough
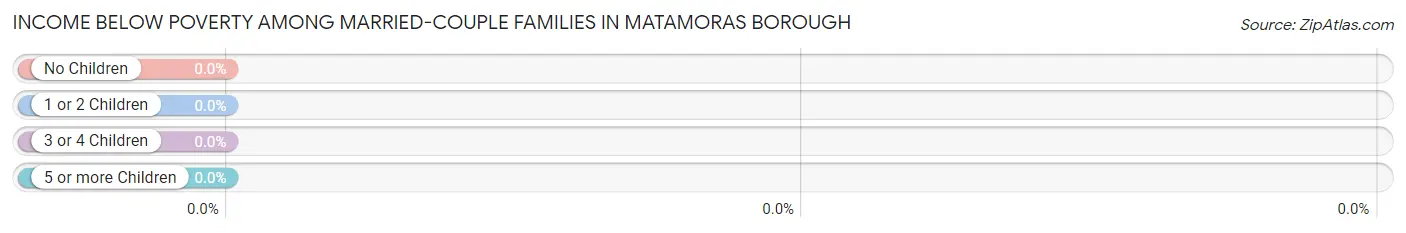
| Children | Above Poverty | Below Poverty |
| No Children | 239 (100.0%) | 0 (0.0%) |
| 1 or 2 Children | 120 (100.0%) | 0 (0.0%) |
| 3 or 4 Children | 42 (100.0%) | 0 (0.0%) |
| 5 or more Children | 0 (0.0%) | 0 (0.0%) |
| Total | 401 (100.0%) | 0 (0.0%) |
Income Below Poverty Among Single-Parent Households in Matamoras borough
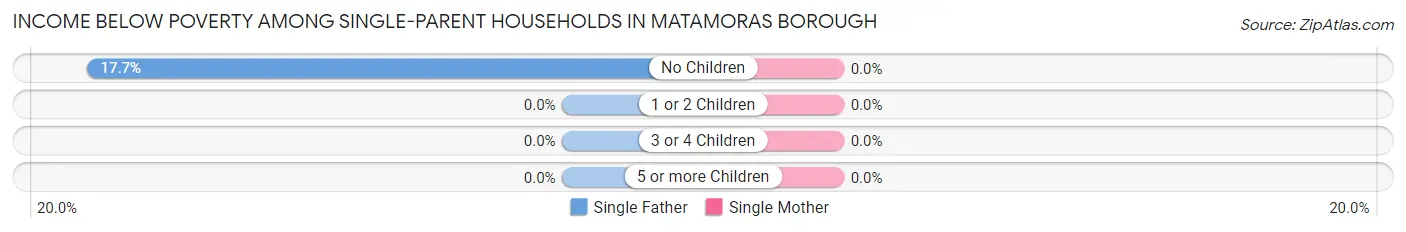
| Children | Single Father | Single Mother |
| No Children | 6 (17.6%) | 0 (0.0%) |
| 1 or 2 Children | 0 (0.0%) | 0 (0.0%) |
| 3 or 4 Children | 0 (0.0%) | 0 (0.0%) |
| 5 or more Children | 0 (0.0%) | 0 (0.0%) |
| Total | 6 (6.6%) | 0 (0.0%) |
Income Below Poverty Among Married-Couple vs Single-Parent Households in Matamoras borough
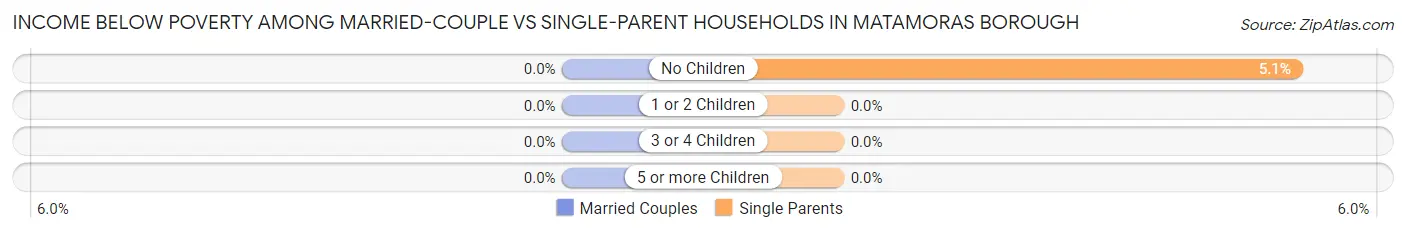
| Children | Married-Couple Families | Single-Parent Households |
| No Children | 0 (0.0%) | 6 (5.1%) |
| 1 or 2 Children | 0 (0.0%) | 0 (0.0%) |
| 3 or 4 Children | 0 (0.0%) | 0 (0.0%) |
| 5 or more Children | 0 (0.0%) | 0 (0.0%) |
| Total | 0 (0.0%) | 6 (2.6%) |
Race in Matamoras borough
The most populous races in Matamoras borough are White / Caucasian (1,977 | 82.5%), Hispanic or Latino (329 | 13.7%), and Asian (190 | 7.9%).
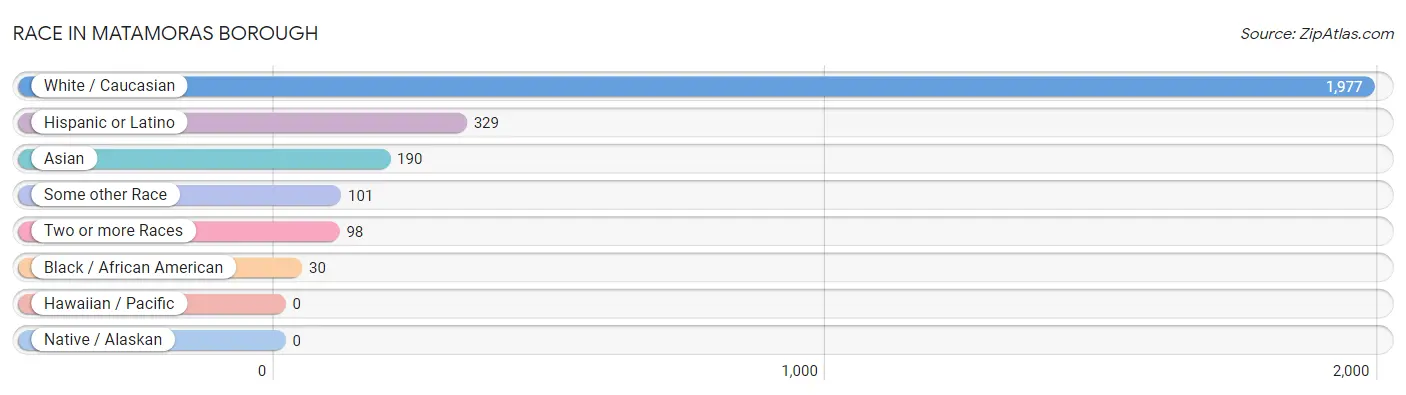
| Race | # Population | % Population |
| Asian | 190 | 7.9% |
| Black / African American | 30 | 1.3% |
| Hawaiian / Pacific | 0 | 0.0% |
| Hispanic or Latino | 329 | 13.7% |
| Native / Alaskan | 0 | 0.0% |
| White / Caucasian | 1,977 | 82.5% |
| Two or more Races | 98 | 4.1% |
| Some other Race | 101 | 4.2% |
| Total | 2,396 | 100.0% |
Ancestry in Matamoras borough
The most populous ancestries reported in Matamoras borough are Irish (499 | 20.8%), German (449 | 18.7%), Italian (375 | 15.7%), Puerto Rican (323 | 13.5%), and Thai (129 | 5.4%), together accounting for 74.1% of all Matamoras borough residents.
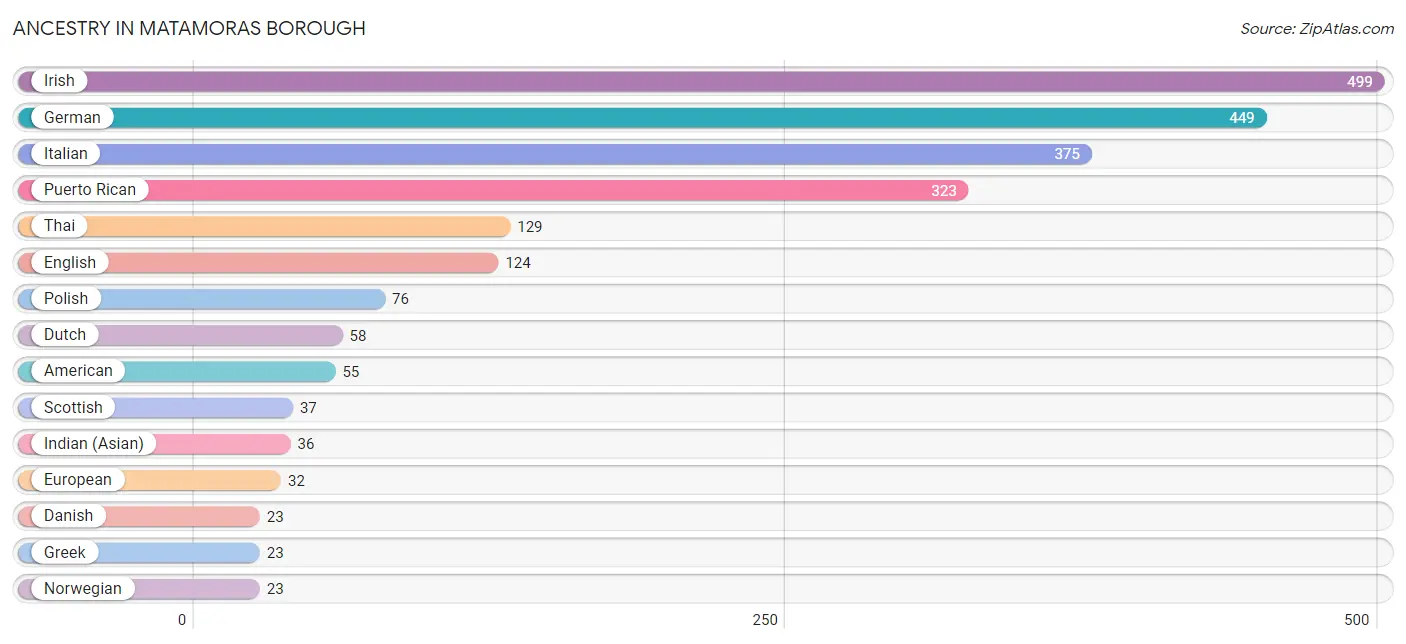
| Ancestry | # Population | % Population |
| American | 55 | 2.3% |
| Arab | 10 | 0.4% |
| Austrian | 13 | 0.5% |
| British | 18 | 0.7% |
| Danish | 23 | 1.0% |
| Dutch | 58 | 2.4% |
| Eastern European | 3 | 0.1% |
| English | 124 | 5.2% |
| European | 32 | 1.3% |
| French | 6 | 0.3% |
| French Canadian | 21 | 0.9% |
| German | 449 | 18.7% |
| Greek | 23 | 1.0% |
| Haitian | 16 | 0.7% |
| Hungarian | 5 | 0.2% |
| Indian (Asian) | 36 | 1.5% |
| Irish | 499 | 20.8% |
| Italian | 375 | 15.7% |
| Korean | 10 | 0.4% |
| Lebanese | 5 | 0.2% |
| Liberian | 7 | 0.3% |
| Lithuanian | 8 | 0.3% |
| Norwegian | 23 | 1.0% |
| Peruvian | 6 | 0.3% |
| Polish | 76 | 3.2% |
| Puerto Rican | 323 | 13.5% |
| Russian | 13 | 0.5% |
| Scottish | 37 | 1.5% |
| South American | 6 | 0.3% |
| Sri Lankan | 22 | 0.9% |
| Subsaharan African | 7 | 0.3% |
| Swiss | 5 | 0.2% |
| Syrian | 5 | 0.2% |
| Thai | 129 | 5.4% |
| Ukrainian | 17 | 0.7% |
| Welsh | 13 | 0.5% | View All 36 Rows |
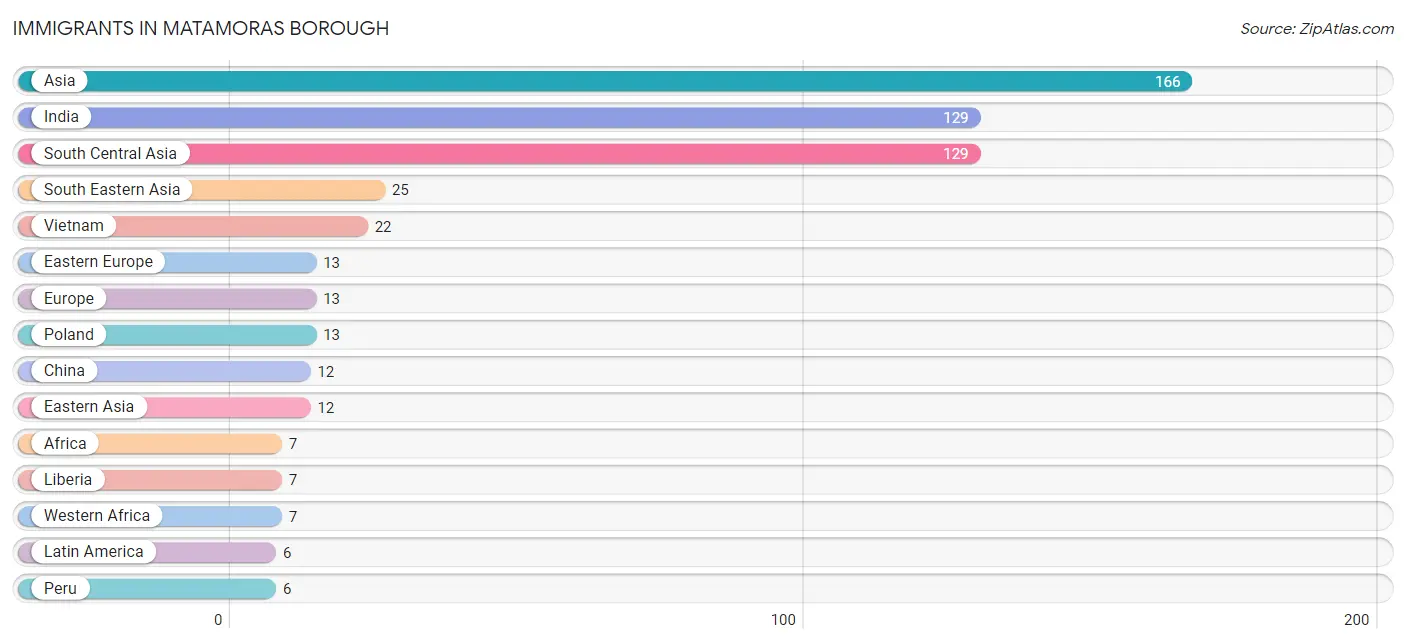
Immigrants in Matamoras borough
The most numerous immigrant groups reported in Matamoras borough came from Asia (166 | 6.9%), India (129 | 5.4%), South Central Asia (129 | 5.4%), South Eastern Asia (25 | 1.0%), and Vietnam (22 | 0.9%), together accounting for 19.7% of all Matamoras borough residents.
| Immigration Origin | # Population | % Population |
| Africa | 7 | 0.3% |
| Asia | 166 | 6.9% |
| China | 12 | 0.5% |
| Eastern Asia | 12 | 0.5% |
| Eastern Europe | 13 | 0.5% |
| Europe | 13 | 0.5% |
| India | 129 | 5.4% |
| Latin America | 6 | 0.3% |
| Liberia | 7 | 0.3% |
| Peru | 6 | 0.3% |
| Philippines | 3 | 0.1% |
| Poland | 13 | 0.5% |
| South America | 6 | 0.3% |
| South Central Asia | 129 | 5.4% |
| South Eastern Asia | 25 | 1.0% |
| Vietnam | 22 | 0.9% |
| Western Africa | 7 | 0.3% | View All 17 Rows |
Sex and Age in Matamoras borough
Sex and Age in Matamoras borough
The most populous age groups in Matamoras borough are 40 to 44 Years (160 | 12.7%) for men and 55 to 59 Years (147 | 12.9%) for women.
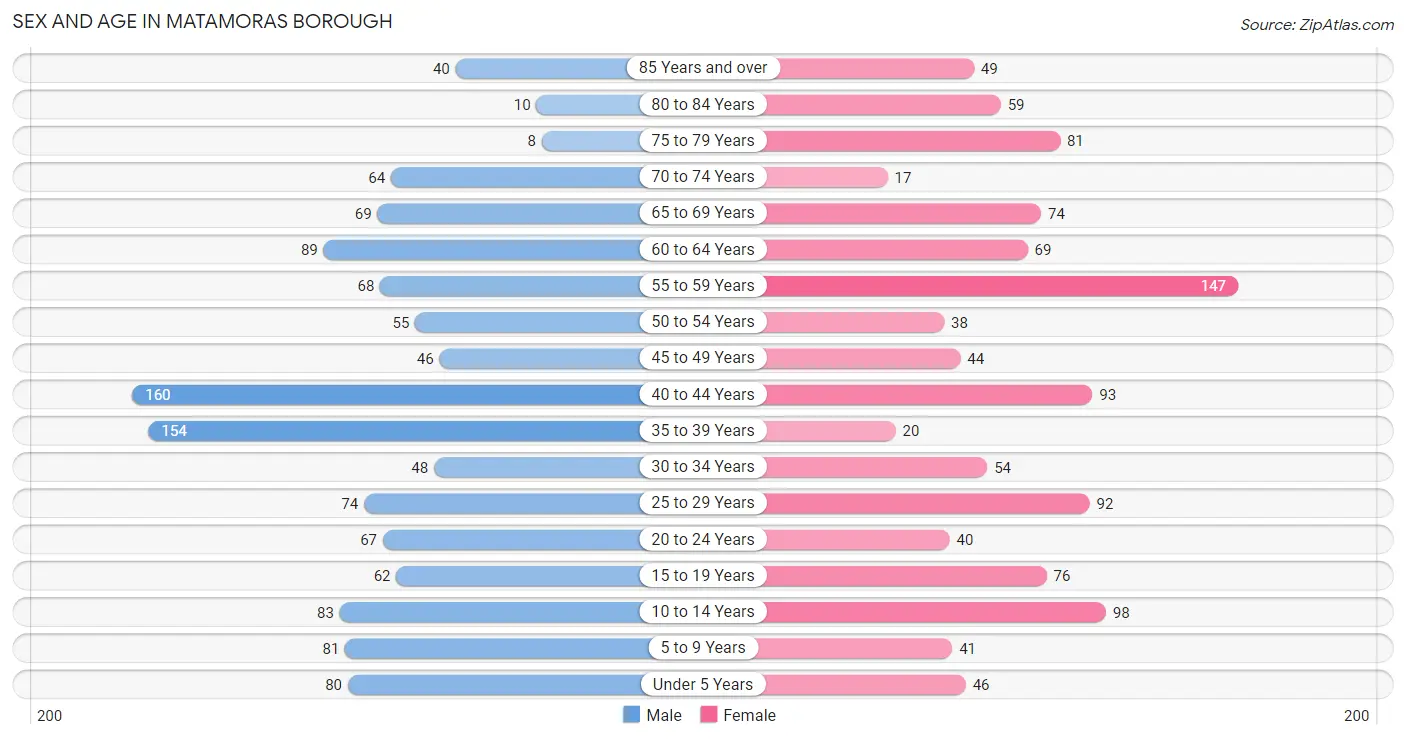
| Age Bracket | Male | Female |
| Under 5 Years | 80 (6.4%) | 46 (4.0%) |
| 5 to 9 Years | 81 (6.4%) | 41 (3.6%) |
| 10 to 14 Years | 83 (6.6%) | 98 (8.6%) |
| 15 to 19 Years | 62 (4.9%) | 76 (6.7%) |
| 20 to 24 Years | 67 (5.3%) | 40 (3.5%) |
| 25 to 29 Years | 74 (5.9%) | 92 (8.1%) |
| 30 to 34 Years | 48 (3.8%) | 54 (4.8%) |
| 35 to 39 Years | 154 (12.2%) | 20 (1.8%) |
| 40 to 44 Years | 160 (12.7%) | 93 (8.2%) |
| 45 to 49 Years | 46 (3.7%) | 44 (3.9%) |
| 50 to 54 Years | 55 (4.4%) | 38 (3.3%) |
| 55 to 59 Years | 68 (5.4%) | 147 (12.9%) |
| 60 to 64 Years | 89 (7.1%) | 69 (6.1%) |
| 65 to 69 Years | 69 (5.5%) | 74 (6.5%) |
| 70 to 74 Years | 64 (5.1%) | 17 (1.5%) |
| 75 to 79 Years | 8 (0.6%) | 81 (7.1%) |
| 80 to 84 Years | 10 (0.8%) | 59 (5.2%) |
| 85 Years and over | 40 (3.2%) | 49 (4.3%) |
| Total | 1,258 (100.0%) | 1,138 (100.0%) |
Families and Households in Matamoras borough
Median Family Size in Matamoras borough
The median family size in Matamoras borough is 2.94 persons per family, with married-couple families (401 | 63.1%) accounting for the largest median family size of 3.1 persons per family. On the other hand, single male/father families (91 | 14.3%) represent the smallest median family size with 2.33 persons per family.
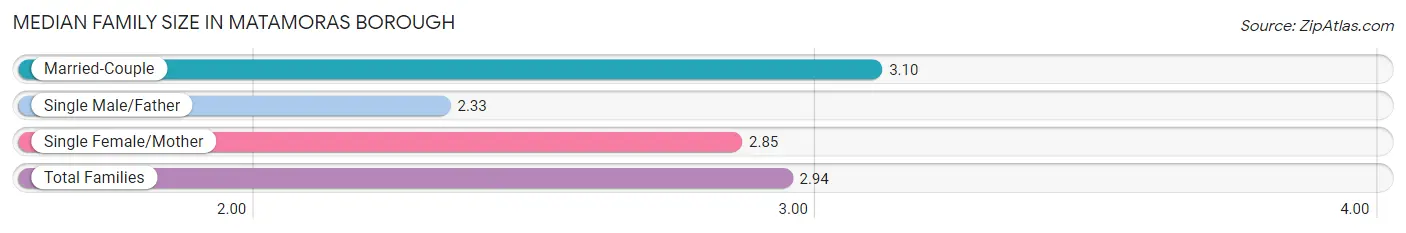
| Family Type | # Families | Family Size |
| Married-Couple | 401 (63.1%) | 3.10 |
| Single Male/Father | 91 (14.3%) | 2.33 |
| Single Female/Mother | 143 (22.5%) | 2.85 |
| Total Families | 635 (100.0%) | 2.94 |
Median Household Size in Matamoras borough
The median household size in Matamoras borough is 2.25 persons per household, with married-couple households (401 | 37.7%) accounting for the largest median household size of 3.12 persons per household. non-family households (429 | 40.3%) represent the smallest median household size with 1.08 persons per household.
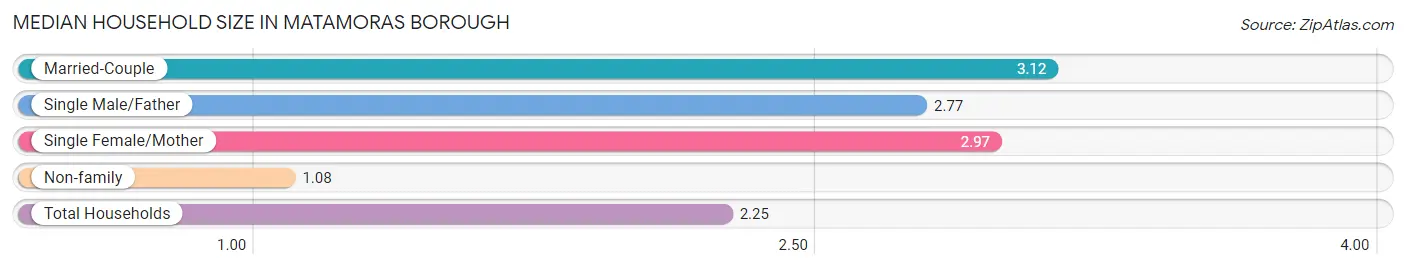
| Household Type | # Households | Household Size |
| Married-Couple | 401 (37.7%) | 3.12 |
| Single Male/Father | 91 (8.6%) | 2.77 |
| Single Female/Mother | 143 (13.4%) | 2.97 |
| Non-family | 429 (40.3%) | 1.08 |
| Total Households | 1,064 (100.0%) | 2.25 |
Household Size by Marriage Status in Matamoras borough
Out of a total of 1,064 households in Matamoras borough, 635 (59.7%) are family households, while 429 (40.3%) are nonfamily households. The most numerous type of family households are 2-person households, comprising 297, and the most common type of nonfamily households are 1-person households, comprising 389.
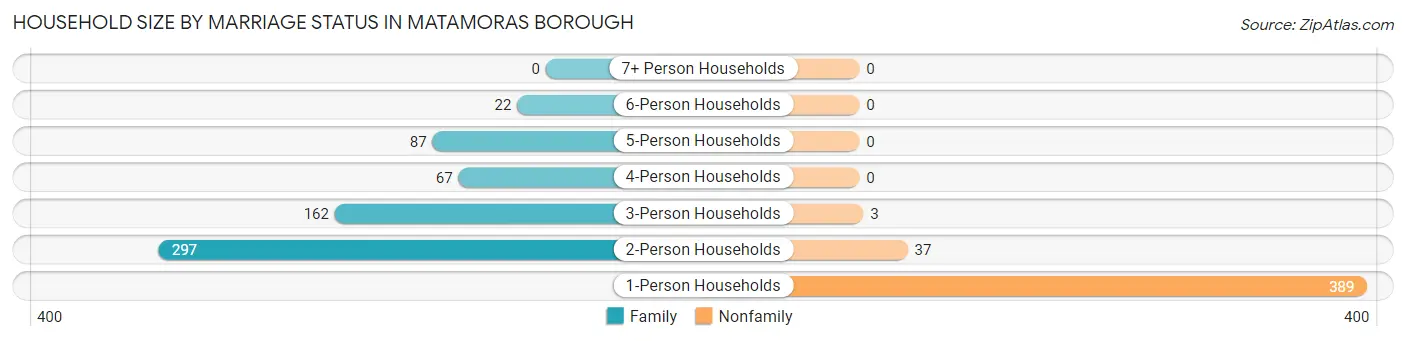
| Household Size | Family Households | Nonfamily Households |
| 1-Person Households | - | 389 (36.6%) |
| 2-Person Households | 297 (27.9%) | 37 (3.5%) |
| 3-Person Households | 162 (15.2%) | 3 (0.3%) |
| 4-Person Households | 67 (6.3%) | 0 (0.0%) |
| 5-Person Households | 87 (8.2%) | 0 (0.0%) |
| 6-Person Households | 22 (2.1%) | 0 (0.0%) |
| 7+ Person Households | 0 (0.0%) | 0 (0.0%) |
| Total | 635 (59.7%) | 429 (40.3%) |
Female Fertility in Matamoras borough
Fertility by Age in Matamoras borough
Average fertility rate in Matamoras borough is 60.0 births per 1,000 women. Women in the age bracket of 20 to 34 years have the highest fertility rate with 134.0 births per 1,000 women. Women in the age bracket of 20 to 34 years acount for 100.0% of all women with births.
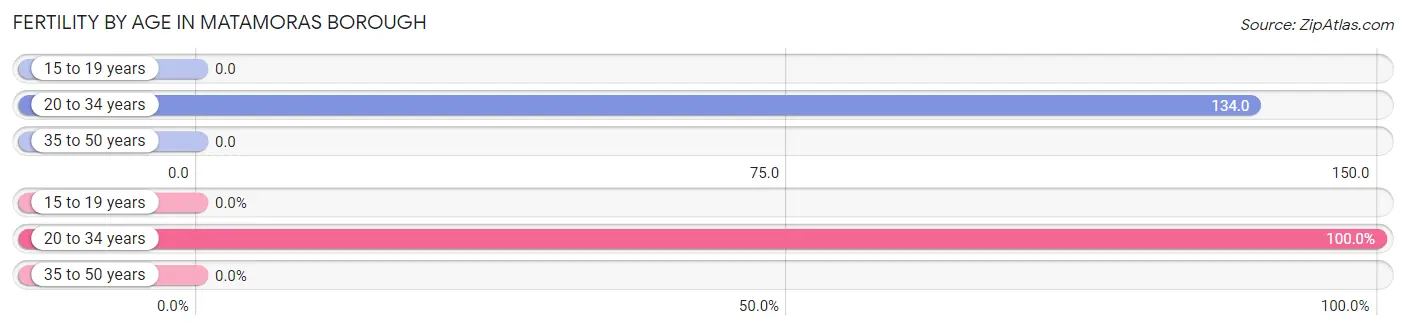
| Age Bracket | Women with Births | Births / 1,000 Women |
| 15 to 19 years | 0 (0.0%) | 0.0 |
| 20 to 34 years | 25 (100.0%) | 134.0 |
| 35 to 50 years | 0 (0.0%) | 0.0 |
| Total | 25 (100.0%) | 60.0 |
Fertility by Age by Marriage Status in Matamoras borough
52.0% of women with births (25) in Matamoras borough are married. The highest percentage of unmarried women with births falls into 20 to 34 years age bracket with 48.0% of them unmarried at the time of birth, while the lowest percentage of unmarried women with births belong to 20 to 34 years age bracket with 48.0% of them unmarried.
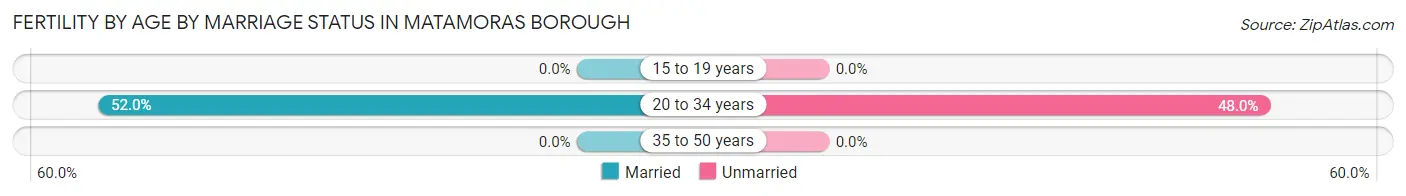
| Age Bracket | Married | Unmarried |
| 15 to 19 years | 0 (0.0%) | 0 (0.0%) |
| 20 to 34 years | 13 (52.0%) | 12 (48.0%) |
| 35 to 50 years | 0 (0.0%) | 0 (0.0%) |
| Total | 13 (52.0%) | 12 (48.0%) |
Fertility by Education in Matamoras borough
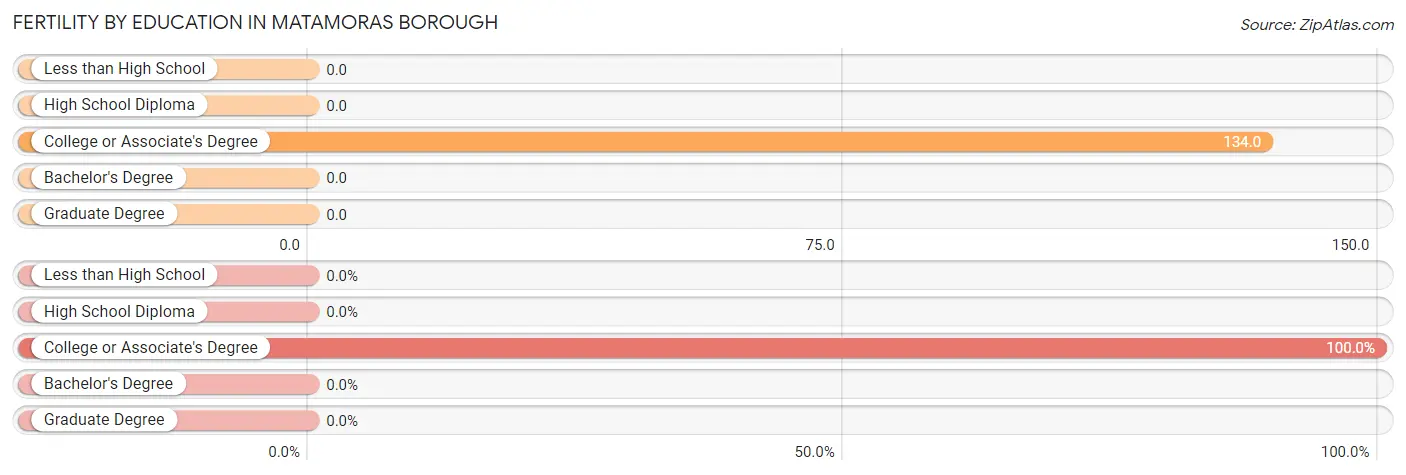
| Educational Attainment | Women with Births | Births / 1,000 Women |
| Less than High School | 0 (0.0%) | 0.0 |
| High School Diploma | 0 (0.0%) | 0.0 |
| College or Associate's Degree | 25 (100.0%) | 134.0 |
| Bachelor's Degree | 0 (0.0%) | 0.0 |
| Graduate Degree | 0 (0.0%) | 0.0 |
| Total | 25 (100.0%) | 60.0 |
Fertility by Education by Marriage Status in Matamoras borough
48.0% of women with births in Matamoras borough are unmarried. Women with the educational attainment of college or associate's degree are most likely to be married with 52.0% of them married at childbirth, while women with the educational attainment of college or associate's degree are least likely to be married with 48.0% of them unmarried at childbirth.
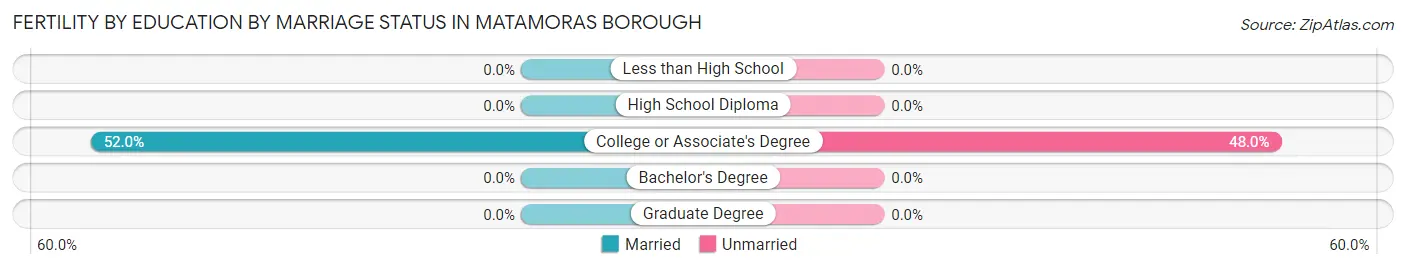
| Educational Attainment | Married | Unmarried |
| Less than High School | 0 (0.0%) | 0 (0.0%) |
| High School Diploma | 0 (0.0%) | 0 (0.0%) |
| College or Associate's Degree | 13 (52.0%) | 12 (48.0%) |
| Bachelor's Degree | 0 (0.0%) | 0 (0.0%) |
| Graduate Degree | 0 (0.0%) | 0 (0.0%) |
| Total | 13 (52.0%) | 12 (48.0%) |
Employment Characteristics in Matamoras borough
Employment by Class of Employer in Matamoras borough
Among the 1,337 employed individuals in Matamoras borough, private company employees (899 | 67.2%), local government employees (163 | 12.2%), and not-for-profit organizations (117 | 8.7%) make up the most common classes of employment.
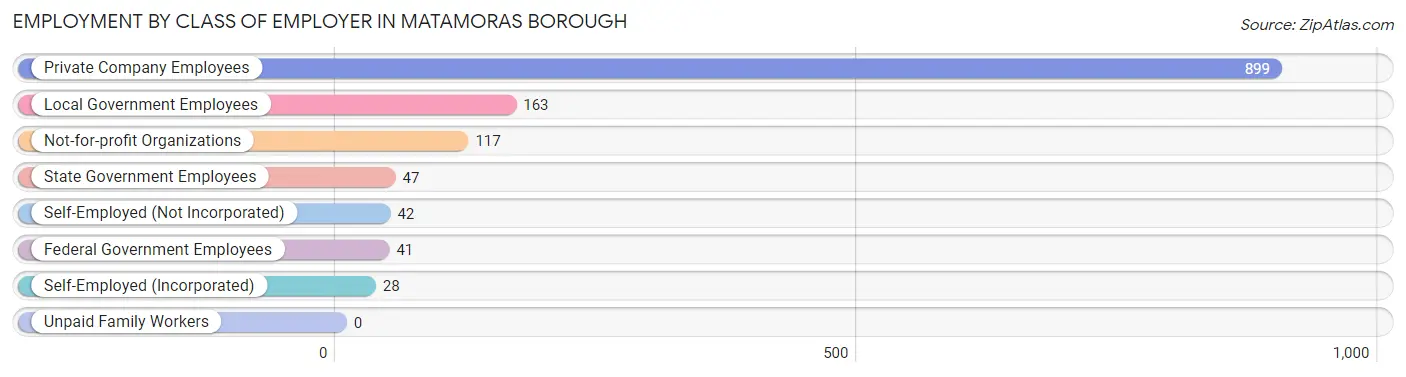
| Employer Class | # Employees | % Employees |
| Private Company Employees | 899 | 67.2% |
| Self-Employed (Incorporated) | 28 | 2.1% |
| Self-Employed (Not Incorporated) | 42 | 3.1% |
| Not-for-profit Organizations | 117 | 8.7% |
| Local Government Employees | 163 | 12.2% |
| State Government Employees | 47 | 3.5% |
| Federal Government Employees | 41 | 3.1% |
| Unpaid Family Workers | 0 | 0.0% |
| Total | 1,337 | 100.0% |
Employment Status by Age in Matamoras borough
According to the labor force statistics for Matamoras borough, out of the total population over 16 years of age (1,951), 71.6% or 1,397 individuals are in the labor force, with 1.7% or 24 of them unemployed. The age group with the highest labor force participation rate is 25 to 29 years, with 98.2% or 163 individuals in the labor force. Within the labor force, the 20 to 24 years age range has the highest percentage of unemployed individuals, with 11.5% or 11 of them being unemployed.
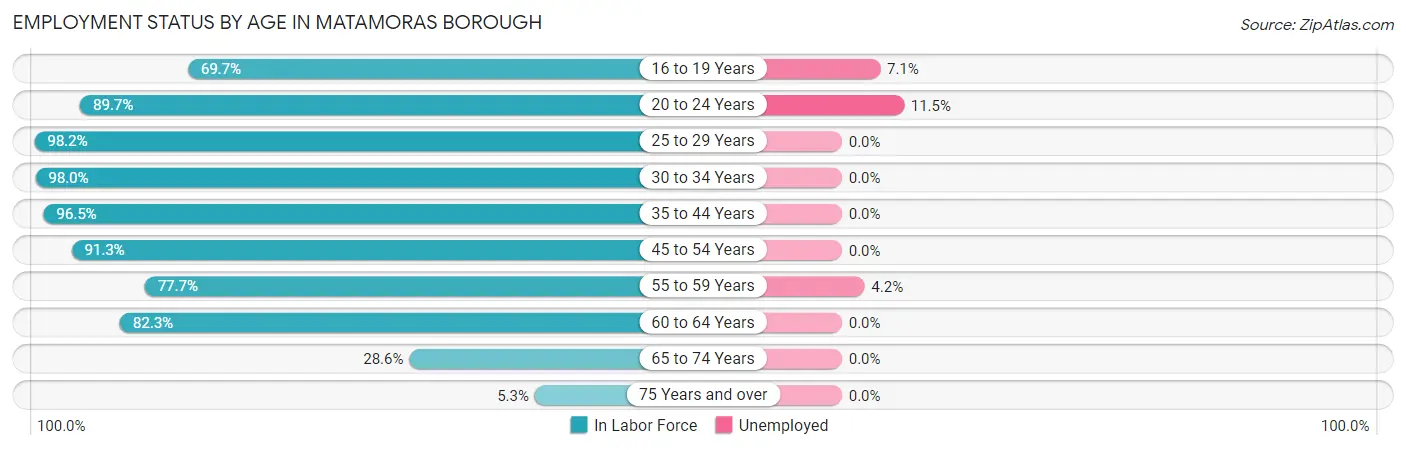
| Age Bracket | In Labor Force | Unemployed |
| 16 to 19 Years | 85 (69.7%) | 6 (7.1%) |
| 20 to 24 Years | 96 (89.7%) | 11 (11.5%) |
| 25 to 29 Years | 163 (98.2%) | 0 (0.0%) |
| 30 to 34 Years | 100 (98.0%) | 0 (0.0%) |
| 35 to 44 Years | 412 (96.5%) | 0 (0.0%) |
| 45 to 54 Years | 167 (91.3%) | 0 (0.0%) |
| 55 to 59 Years | 167 (77.7%) | 7 (4.2%) |
| 60 to 64 Years | 130 (82.3%) | 0 (0.0%) |
| 65 to 74 Years | 64 (28.6%) | 0 (0.0%) |
| 75 Years and over | 13 (5.3%) | 0 (0.0%) |
| Total | 1,397 (71.6%) | 24 (1.7%) |
Employment Status by Educational Attainment in Matamoras borough
According to labor force statistics for Matamoras borough, 91.0% of individuals (1,138) out of the total population between 25 and 64 years of age (1,251) are in the labor force, with 0.6% or 7 of them being unemployed. The group with the highest labor force participation rate are those with the educational attainment of less than high school, with 100.0% or 81 individuals in the labor force. Within the labor force, individuals with college / associate degree education have the highest percentage of unemployment, with 1.2% or 4 of them being unemployed.
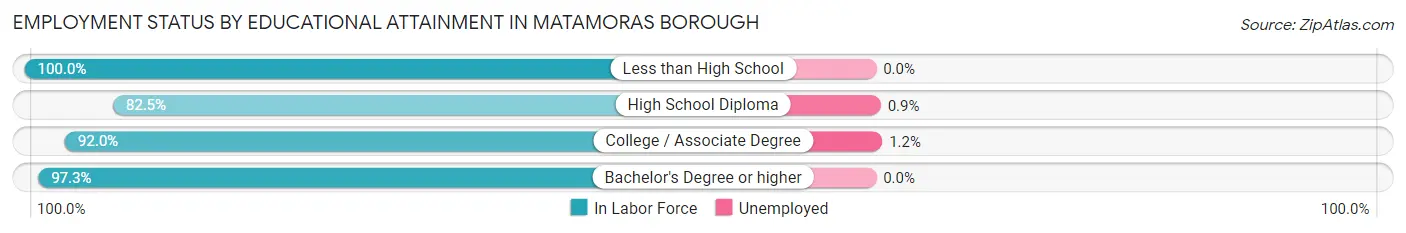
| Educational Attainment | In Labor Force | Unemployed |
| Less than High School | 81 (100.0%) | 0 (0.0%) |
| High School Diploma | 334 (82.5%) | 4 (0.9%) |
| College / Associate Degree | 358 (92.0%) | 5 (1.2%) |
| Bachelor's Degree or higher | 366 (97.3%) | 0 (0.0%) |
| Total | 1,138 (91.0%) | 8 (0.6%) |
Employment Occupations by Sex in Matamoras borough
Management, Business, Science and Arts Occupations
The most common Management, Business, Science and Arts occupations in Matamoras borough are Management (180 | 13.3%), Community & Social Service (154 | 11.3%), Health Diagnosing & Treating (102 | 7.5%), Education Instruction & Library (87 | 6.4%), and Business & Financial (53 | 3.9%).
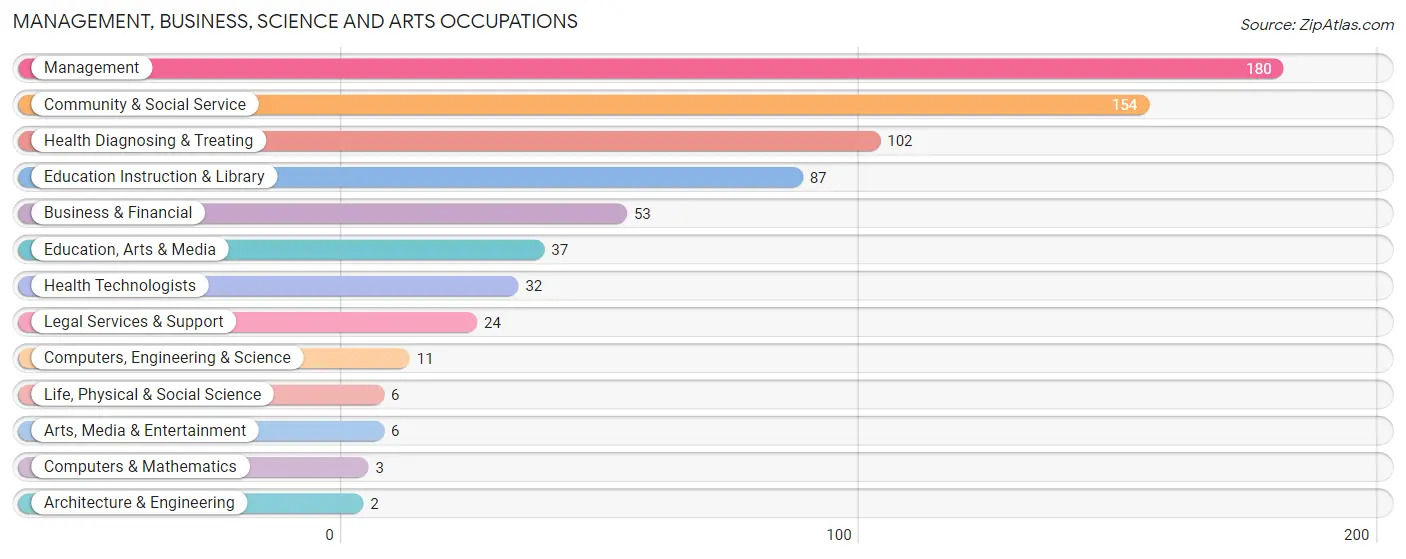
Management, Business, Science and Arts Occupations by Sex
Within the Management, Business, Science and Arts occupations in Matamoras borough, the most male-oriented occupations are Computers, Engineering & Science (100.0%), Computers & Mathematics (100.0%), and Architecture & Engineering (100.0%), while the most female-oriented occupations are Arts, Media & Entertainment (100.0%), Health Technologists (100.0%), and Health Diagnosing & Treating (96.1%).
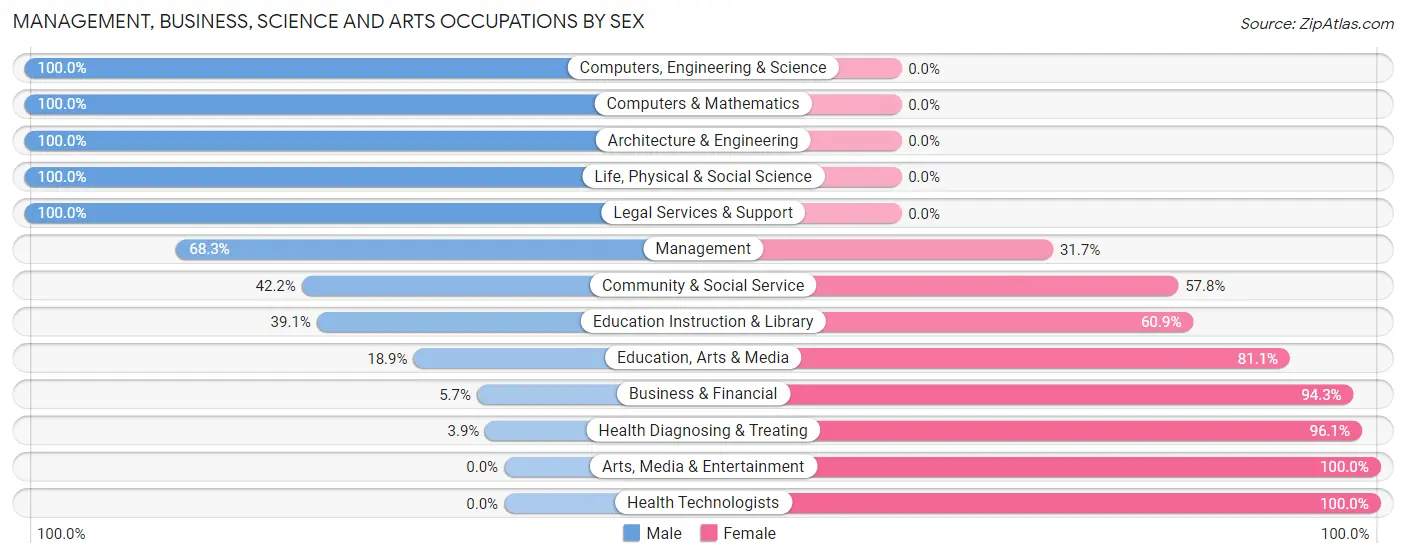
| Occupation | Male | Female |
| Management | 123 (68.3%) | 57 (31.7%) |
| Business & Financial | 3 (5.7%) | 50 (94.3%) |
| Computers, Engineering & Science | 11 (100.0%) | 0 (0.0%) |
| Computers & Mathematics | 3 (100.0%) | 0 (0.0%) |
| Architecture & Engineering | 2 (100.0%) | 0 (0.0%) |
| Life, Physical & Social Science | 6 (100.0%) | 0 (0.0%) |
| Community & Social Service | 65 (42.2%) | 89 (57.8%) |
| Education, Arts & Media | 7 (18.9%) | 30 (81.1%) |
| Legal Services & Support | 24 (100.0%) | 0 (0.0%) |
| Education Instruction & Library | 34 (39.1%) | 53 (60.9%) |
| Arts, Media & Entertainment | 0 (0.0%) | 6 (100.0%) |
| Health Diagnosing & Treating | 4 (3.9%) | 98 (96.1%) |
| Health Technologists | 0 (0.0%) | 32 (100.0%) |
| Total (Category) | 206 (41.2%) | 294 (58.8%) |
| Total (Overall) | 760 (56.0%) | 598 (44.0%) |
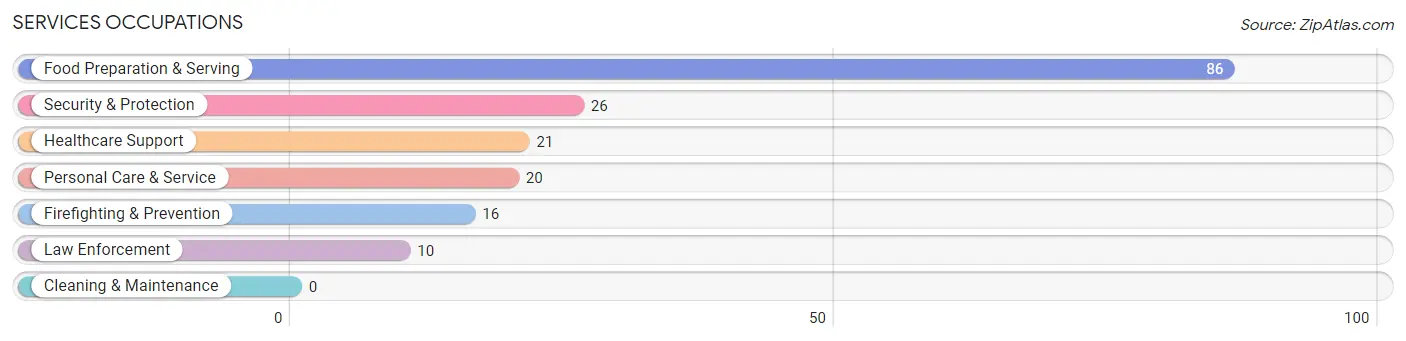
Services Occupations
The most common Services occupations in Matamoras borough are Food Preparation & Serving (86 | 6.3%), Security & Protection (26 | 1.9%), Healthcare Support (21 | 1.5%), Personal Care & Service (20 | 1.5%), and Firefighting & Prevention (16 | 1.2%).
Services Occupations by Sex
Within the Services occupations in Matamoras borough, the most male-oriented occupations are Security & Protection (100.0%), Firefighting & Prevention (100.0%), and Law Enforcement (100.0%), while the most female-oriented occupations are Healthcare Support (100.0%), Food Preparation & Serving (80.2%), and Personal Care & Service (70.0%).
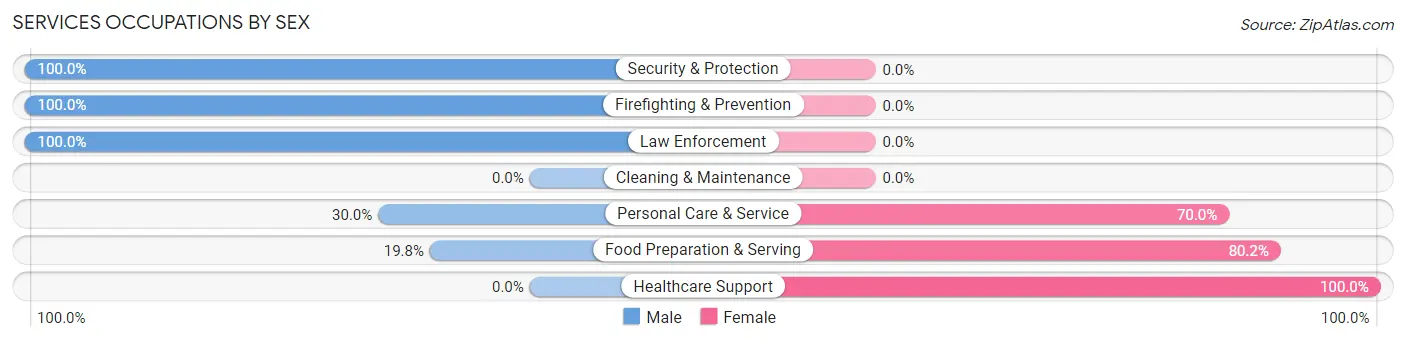
| Occupation | Male | Female |
| Healthcare Support | 0 (0.0%) | 21 (100.0%) |
| Security & Protection | 26 (100.0%) | 0 (0.0%) |
| Firefighting & Prevention | 16 (100.0%) | 0 (0.0%) |
| Law Enforcement | 10 (100.0%) | 0 (0.0%) |
| Food Preparation & Serving | 17 (19.8%) | 69 (80.2%) |
| Cleaning & Maintenance | 0 (0.0%) | 0 (0.0%) |
| Personal Care & Service | 6 (30.0%) | 14 (70.0%) |
| Total (Category) | 49 (32.0%) | 104 (68.0%) |
| Total (Overall) | 760 (56.0%) | 598 (44.0%) |
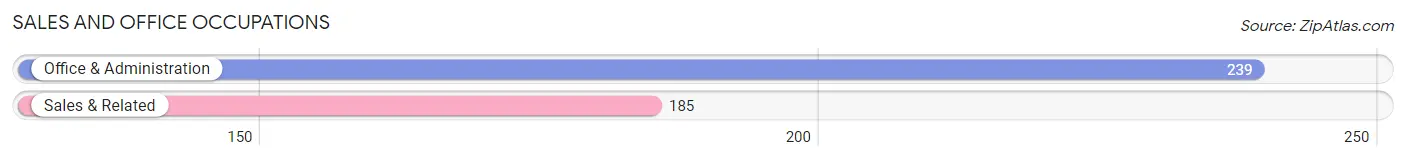
Sales and Office Occupations
The most common Sales and Office occupations in Matamoras borough are Office & Administration (239 | 17.6%), and Sales & Related (185 | 13.6%).
Sales and Office Occupations by Sex
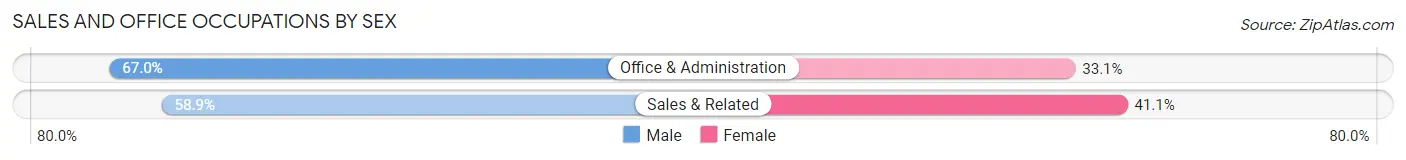
| Occupation | Male | Female |
| Sales & Related | 109 (58.9%) | 76 (41.1%) |
| Office & Administration | 160 (66.9%) | 79 (33.1%) |
| Total (Category) | 269 (63.4%) | 155 (36.6%) |
| Total (Overall) | 760 (56.0%) | 598 (44.0%) |
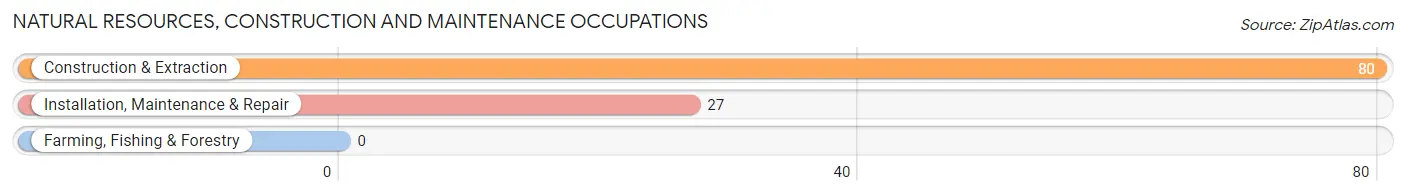
Natural Resources, Construction and Maintenance Occupations
The most common Natural Resources, Construction and Maintenance occupations in Matamoras borough are Construction & Extraction (80 | 5.9%), and Installation, Maintenance & Repair (27 | 2.0%).
Natural Resources, Construction and Maintenance Occupations by Sex
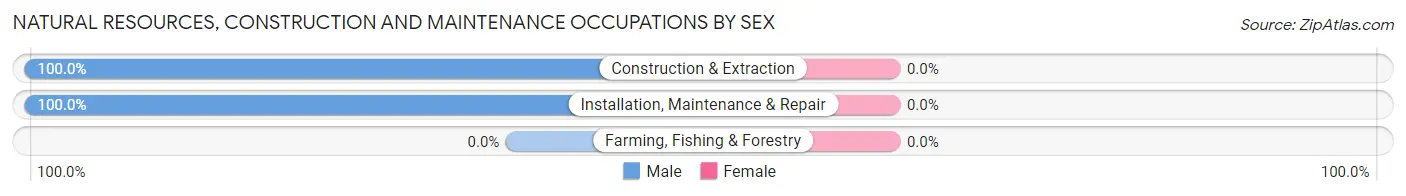
| Occupation | Male | Female |
| Farming, Fishing & Forestry | 0 (0.0%) | 0 (0.0%) |
| Construction & Extraction | 80 (100.0%) | 0 (0.0%) |
| Installation, Maintenance & Repair | 27 (100.0%) | 0 (0.0%) |
| Total (Category) | 107 (100.0%) | 0 (0.0%) |
| Total (Overall) | 760 (56.0%) | 598 (44.0%) |
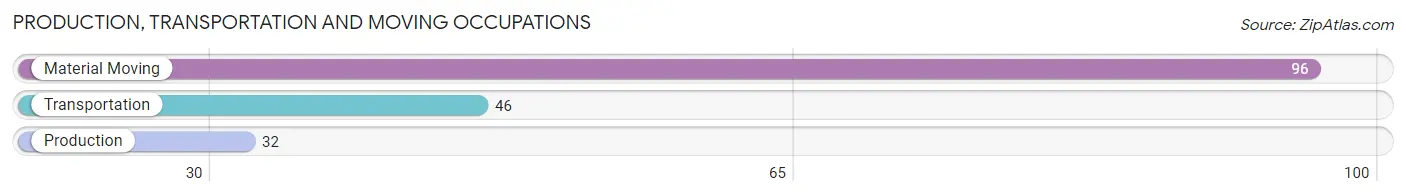
Production, Transportation and Moving Occupations
The most common Production, Transportation and Moving occupations in Matamoras borough are Material Moving (96 | 7.1%), Transportation (46 | 3.4%), and Production (32 | 2.4%).
Production, Transportation and Moving Occupations by Sex
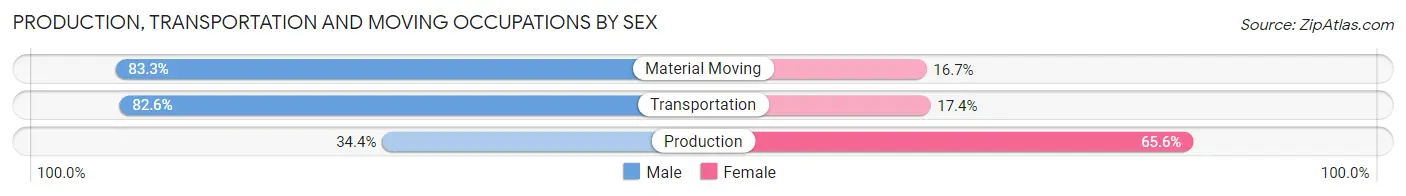
| Occupation | Male | Female |
| Production | 11 (34.4%) | 21 (65.6%) |
| Transportation | 38 (82.6%) | 8 (17.4%) |
| Material Moving | 80 (83.3%) | 16 (16.7%) |
| Total (Category) | 129 (74.1%) | 45 (25.9%) |
| Total (Overall) | 760 (56.0%) | 598 (44.0%) |
Employment Industries by Sex in Matamoras borough
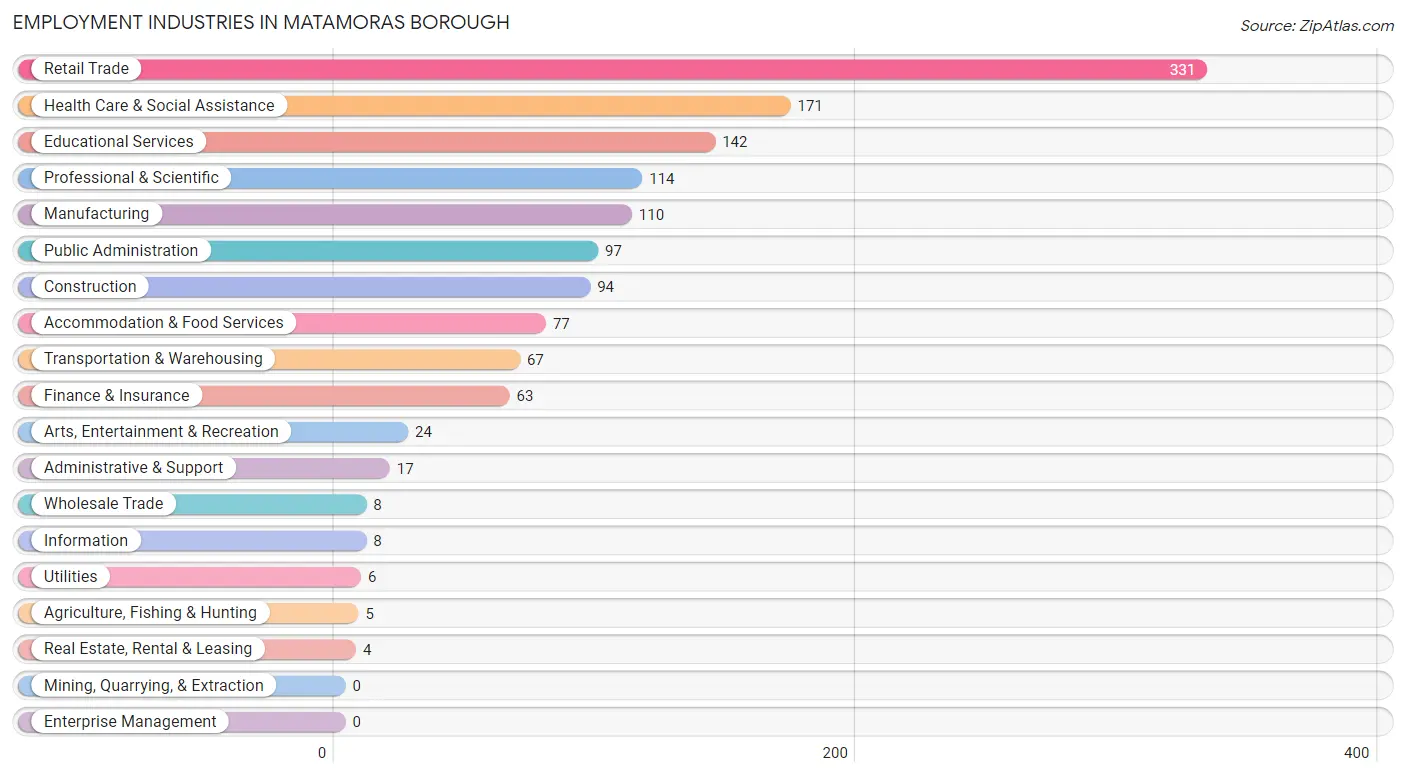
Employment Industries in Matamoras borough
The major employment industries in Matamoras borough include Retail Trade (331 | 24.4%), Health Care & Social Assistance (171 | 12.6%), Educational Services (142 | 10.5%), Professional & Scientific (114 | 8.4%), and Manufacturing (110 | 8.1%).
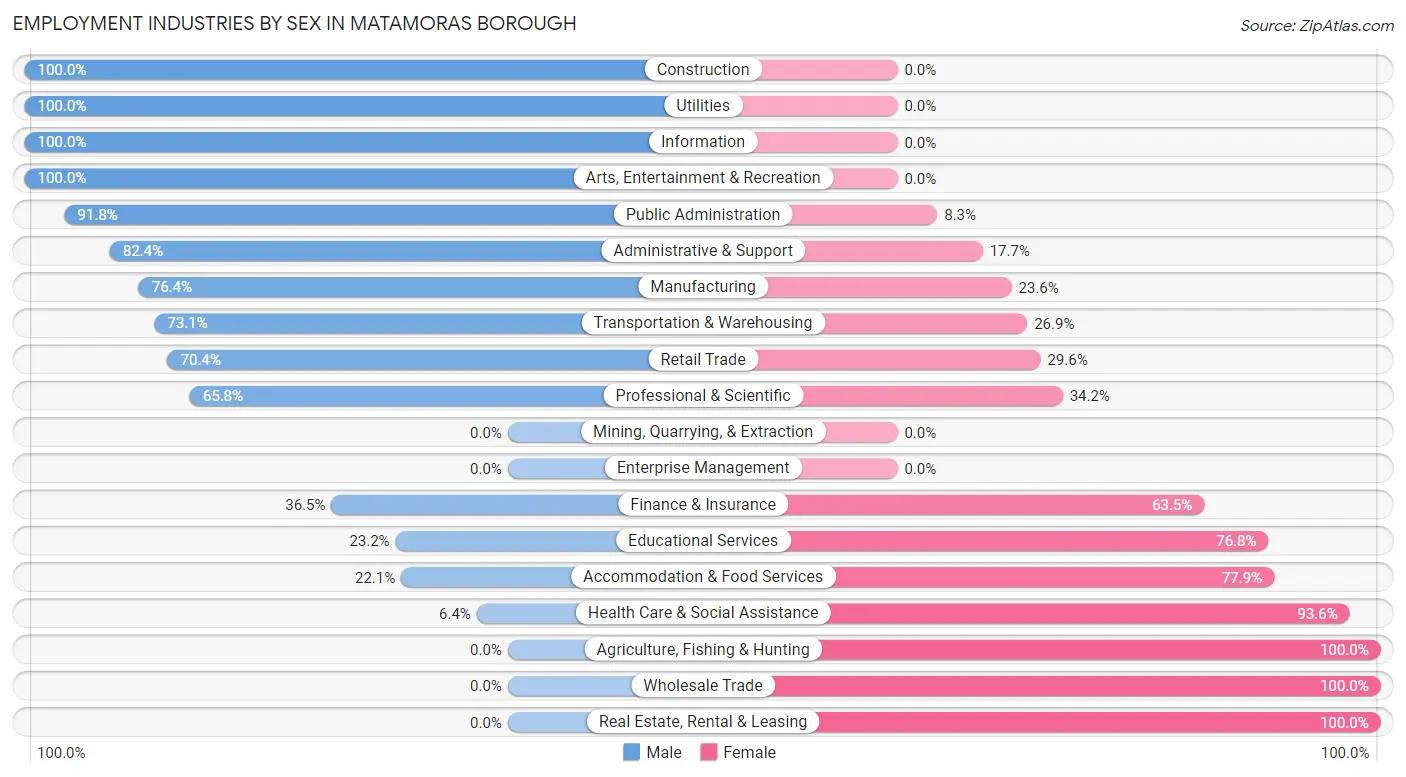
Employment Industries by Sex in Matamoras borough
The Matamoras borough industries that see more men than women are Construction (100.0%), Utilities (100.0%), and Information (100.0%), whereas the industries that tend to have a higher number of women are Agriculture, Fishing & Hunting (100.0%), Wholesale Trade (100.0%), and Real Estate, Rental & Leasing (100.0%).
| Industry | Male | Female |
| Agriculture, Fishing & Hunting | 0 (0.0%) | 5 (100.0%) |
| Mining, Quarrying, & Extraction | 0 (0.0%) | 0 (0.0%) |
| Construction | 94 (100.0%) | 0 (0.0%) |
| Manufacturing | 84 (76.4%) | 26 (23.6%) |
| Wholesale Trade | 0 (0.0%) | 8 (100.0%) |
| Retail Trade | 233 (70.4%) | 98 (29.6%) |
| Transportation & Warehousing | 49 (73.1%) | 18 (26.9%) |
| Utilities | 6 (100.0%) | 0 (0.0%) |
| Information | 8 (100.0%) | 0 (0.0%) |
| Finance & Insurance | 23 (36.5%) | 40 (63.5%) |
| Real Estate, Rental & Leasing | 0 (0.0%) | 4 (100.0%) |
| Professional & Scientific | 75 (65.8%) | 39 (34.2%) |
| Enterprise Management | 0 (0.0%) | 0 (0.0%) |
| Administrative & Support | 14 (82.4%) | 3 (17.6%) |
| Educational Services | 33 (23.2%) | 109 (76.8%) |
| Health Care & Social Assistance | 11 (6.4%) | 160 (93.6%) |
| Arts, Entertainment & Recreation | 24 (100.0%) | 0 (0.0%) |
| Accommodation & Food Services | 17 (22.1%) | 60 (77.9%) |
| Public Administration | 89 (91.7%) | 8 (8.3%) |
| Total | 760 (56.0%) | 598 (44.0%) |
Education in Matamoras borough
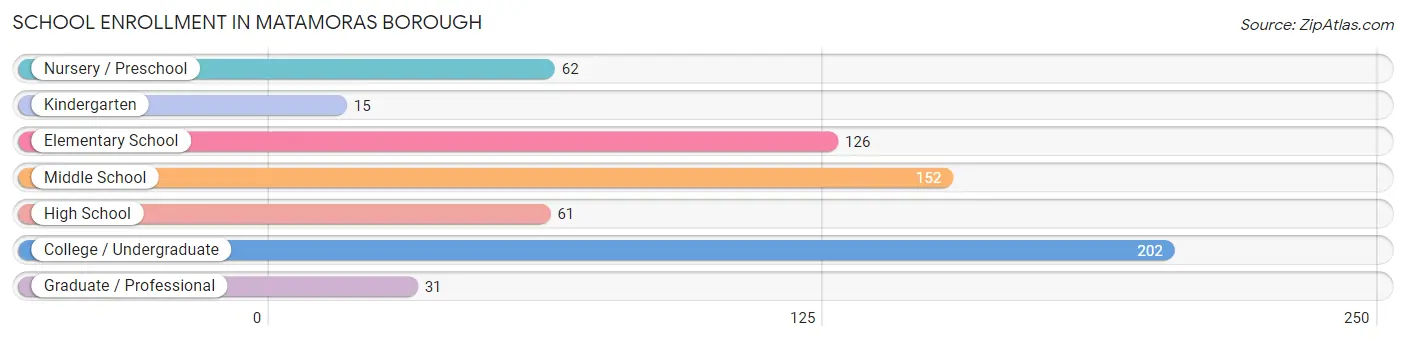
School Enrollment in Matamoras borough
The most common levels of schooling among the 649 students in Matamoras borough are college / undergraduate (202 | 31.1%), middle school (152 | 23.4%), and elementary school (126 | 19.4%).
| School Level | # Students | % Students |
| Nursery / Preschool | 62 | 9.6% |
| Kindergarten | 15 | 2.3% |
| Elementary School | 126 | 19.4% |
| Middle School | 152 | 23.4% |
| High School | 61 | 9.4% |
| College / Undergraduate | 202 | 31.1% |
| Graduate / Professional | 31 | 4.8% |
| Total | 649 | 100.0% |
School Enrollment by Age by Funding Source in Matamoras borough
Out of a total of 649 students who are enrolled in schools in Matamoras borough, 160 (24.7%) attend a private institution, while the remaining 489 (75.3%) are enrolled in public schools. The age group of 20 to 24 year olds has the highest likelihood of being enrolled in private schools, with 61 (100.0% in the age bracket) enrolled. Conversely, the age group of 18 to 19 year olds has the lowest likelihood of being enrolled in a private school, with 85 (93.4% in the age bracket) attending a public institution.
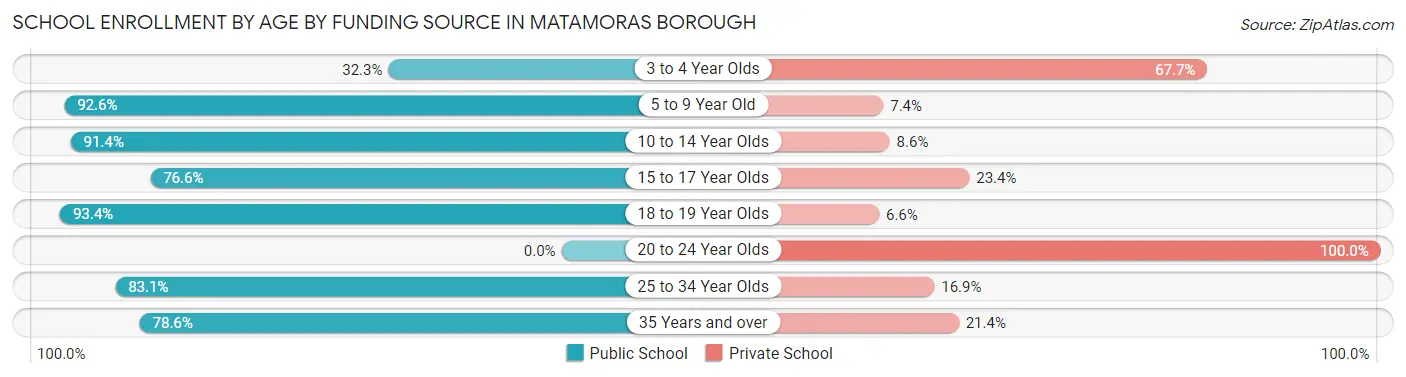
| Age Bracket | Public School | Private School |
| 3 to 4 Year Olds | 20 (32.3%) | 42 (67.7%) |
| 5 to 9 Year Old | 113 (92.6%) | 9 (7.4%) |
| 10 to 14 Year Olds | 160 (91.4%) | 15 (8.6%) |
| 15 to 17 Year Olds | 36 (76.6%) | 11 (23.4%) |
| 18 to 19 Year Olds | 85 (93.4%) | 6 (6.6%) |
| 20 to 24 Year Olds | 0 (0.0%) | 61 (100.0%) |
| 25 to 34 Year Olds | 64 (83.1%) | 13 (16.9%) |
| 35 Years and over | 11 (78.6%) | 3 (21.4%) |
| Total | 489 (75.3%) | 160 (24.7%) |
Educational Attainment by Field of Study in Matamoras borough
Social sciences (135 | 22.8%), education (126 | 21.3%), liberal arts & history (70 | 11.8%), science & technology (49 | 8.3%), and business (46 | 7.8%) are the most common fields of study among 592 individuals in Matamoras borough who have obtained a bachelor's degree or higher.
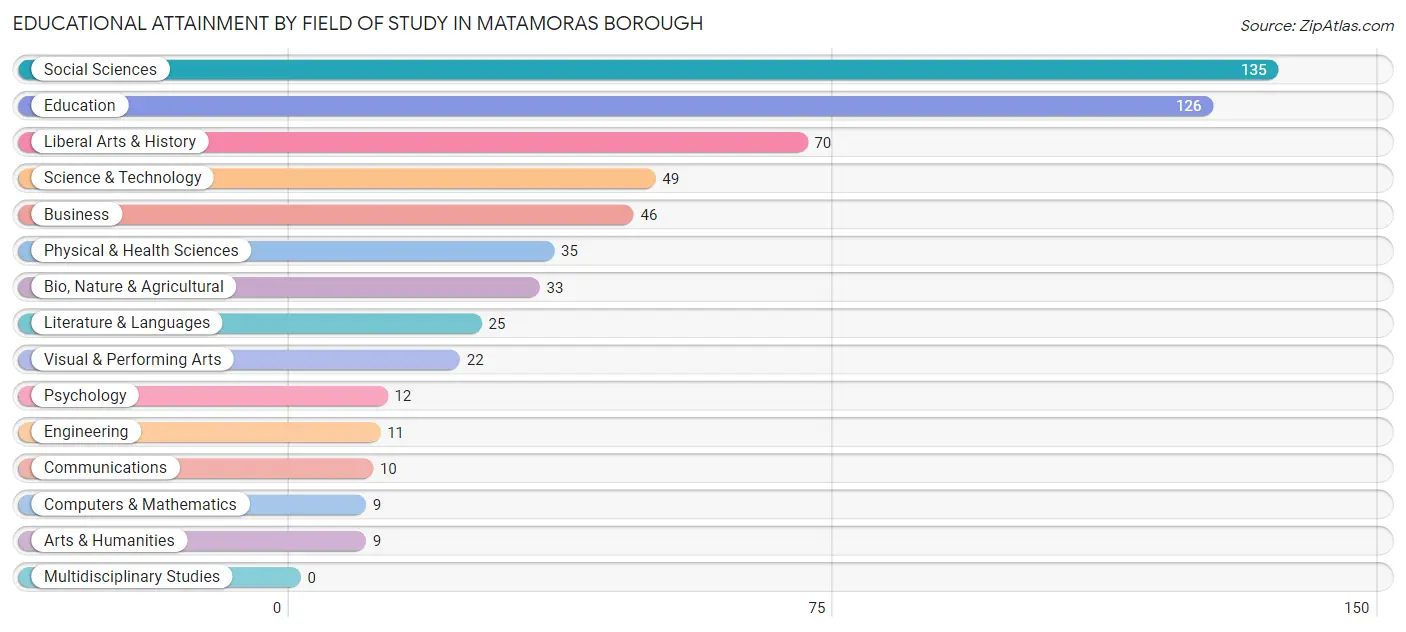
| Field of Study | # Graduates | % Graduates |
| Computers & Mathematics | 9 | 1.5% |
| Bio, Nature & Agricultural | 33 | 5.6% |
| Physical & Health Sciences | 35 | 5.9% |
| Psychology | 12 | 2.0% |
| Social Sciences | 135 | 22.8% |
| Engineering | 11 | 1.9% |
| Multidisciplinary Studies | 0 | 0.0% |
| Science & Technology | 49 | 8.3% |
| Business | 46 | 7.8% |
| Education | 126 | 21.3% |
| Literature & Languages | 25 | 4.2% |
| Liberal Arts & History | 70 | 11.8% |
| Visual & Performing Arts | 22 | 3.7% |
| Communications | 10 | 1.7% |
| Arts & Humanities | 9 | 1.5% |
| Total | 592 | 100.0% |
Transportation & Commute in Matamoras borough
Vehicle Availability by Sex in Matamoras borough
The most prevalent vehicle ownership categories in Matamoras borough are males with 3 vehicles (286, accounting for 37.8%) and females with 3 vehicles (235, making up 49.3%).
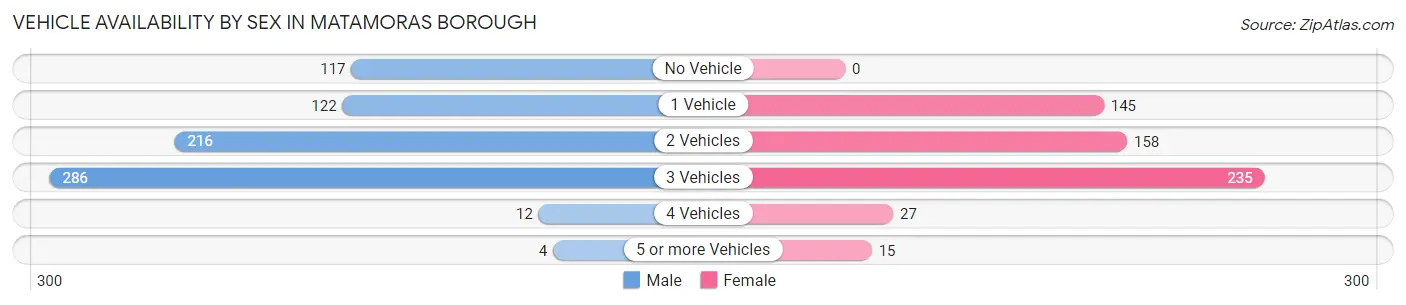
| Vehicles Available | Male | Female |
| No Vehicle | 117 (15.5%) | 0 (0.0%) |
| 1 Vehicle | 122 (16.1%) | 145 (25.0%) |
| 2 Vehicles | 216 (28.5%) | 158 (27.2%) |
| 3 Vehicles | 286 (37.8%) | 235 (40.5%) |
| 4 Vehicles | 12 (1.6%) | 27 (4.7%) |
| 5 or more Vehicles | 4 (0.5%) | 15 (2.6%) |
| Total | 757 (100.0%) | 580 (100.0%) |
Commute Time in Matamoras borough
The most frequently occuring commute durations in Matamoras borough are 5 to 9 minutes (345 commuters, 28.4%), 90 or more minutes (122 commuters, 10.1%), and 25 to 29 minutes (121 commuters, 10.0%).
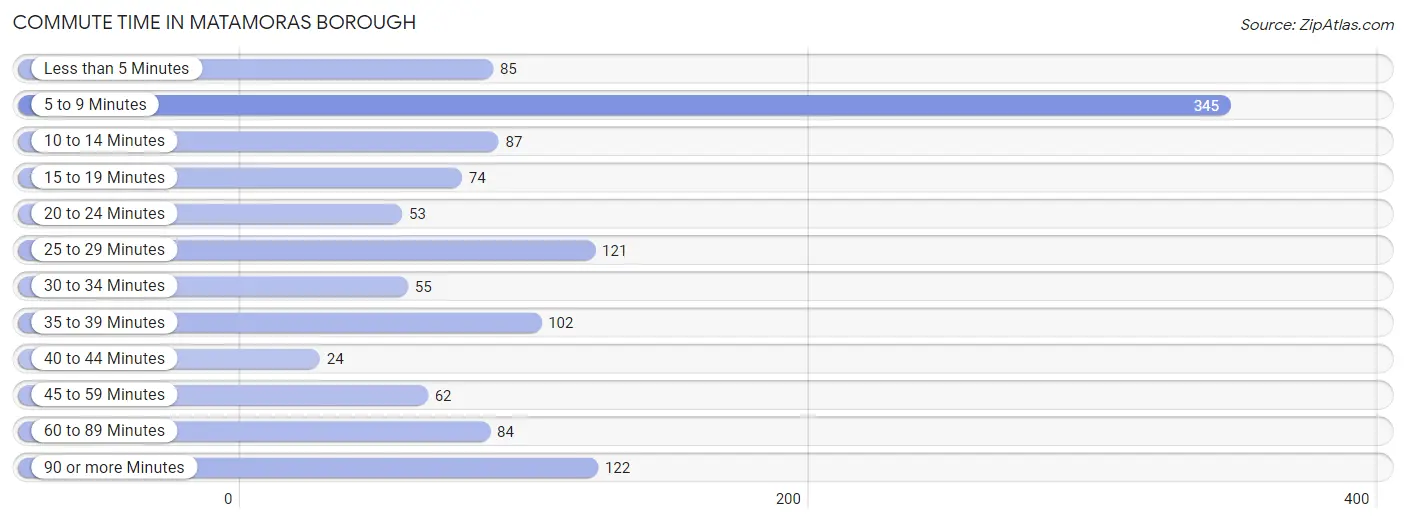
| Commute Time | # Commuters | % Commuters |
| Less than 5 Minutes | 85 | 7.0% |
| 5 to 9 Minutes | 345 | 28.4% |
| 10 to 14 Minutes | 87 | 7.2% |
| 15 to 19 Minutes | 74 | 6.1% |
| 20 to 24 Minutes | 53 | 4.4% |
| 25 to 29 Minutes | 121 | 10.0% |
| 30 to 34 Minutes | 55 | 4.5% |
| 35 to 39 Minutes | 102 | 8.4% |
| 40 to 44 Minutes | 24 | 2.0% |
| 45 to 59 Minutes | 62 | 5.1% |
| 60 to 89 Minutes | 84 | 6.9% |
| 90 or more Minutes | 122 | 10.1% |
Commute Time by Sex in Matamoras borough
The most common commute times in Matamoras borough are 5 to 9 minutes (248 commuters, 35.4%) for males and 5 to 9 minutes (97 commuters, 18.9%) for females.
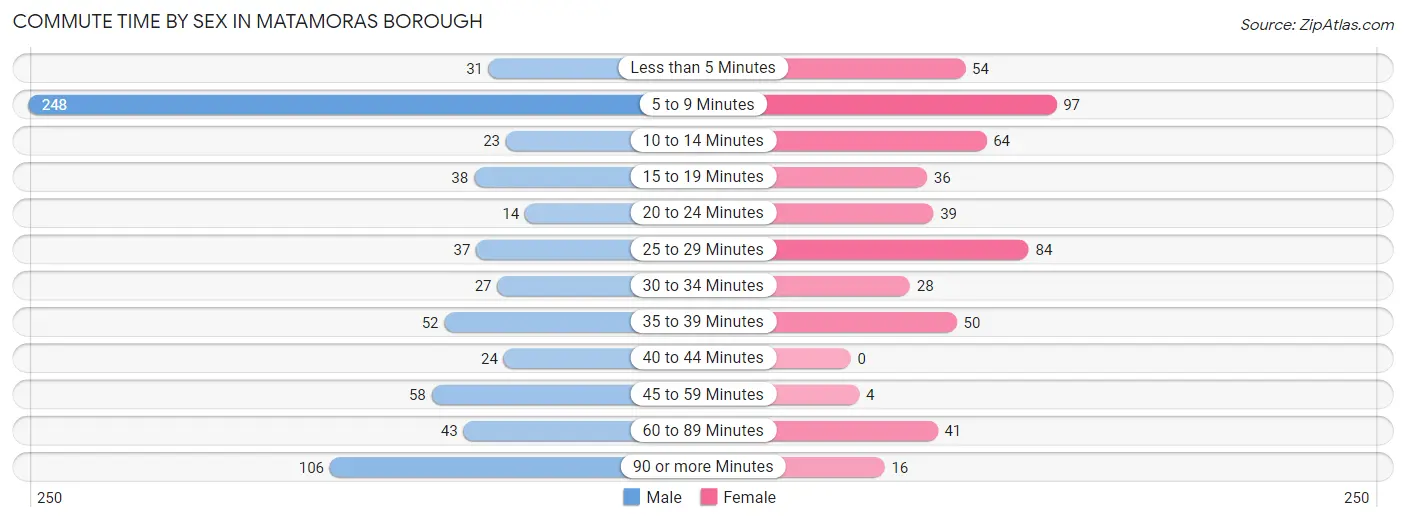
| Commute Time | Male | Female |
| Less than 5 Minutes | 31 (4.4%) | 54 (10.5%) |
| 5 to 9 Minutes | 248 (35.4%) | 97 (18.9%) |
| 10 to 14 Minutes | 23 (3.3%) | 64 (12.5%) |
| 15 to 19 Minutes | 38 (5.4%) | 36 (7.0%) |
| 20 to 24 Minutes | 14 (2.0%) | 39 (7.6%) |
| 25 to 29 Minutes | 37 (5.3%) | 84 (16.4%) |
| 30 to 34 Minutes | 27 (3.8%) | 28 (5.5%) |
| 35 to 39 Minutes | 52 (7.4%) | 50 (9.8%) |
| 40 to 44 Minutes | 24 (3.4%) | 0 (0.0%) |
| 45 to 59 Minutes | 58 (8.3%) | 4 (0.8%) |
| 60 to 89 Minutes | 43 (6.1%) | 41 (8.0%) |
| 90 or more Minutes | 106 (15.1%) | 16 (3.1%) |
Time of Departure to Work by Sex in Matamoras borough
The most frequent times of departure to work in Matamoras borough are 5:30 AM to 5:59 AM (154, 22.0%) for males and 7:00 AM to 7:29 AM (103, 20.1%) for females.
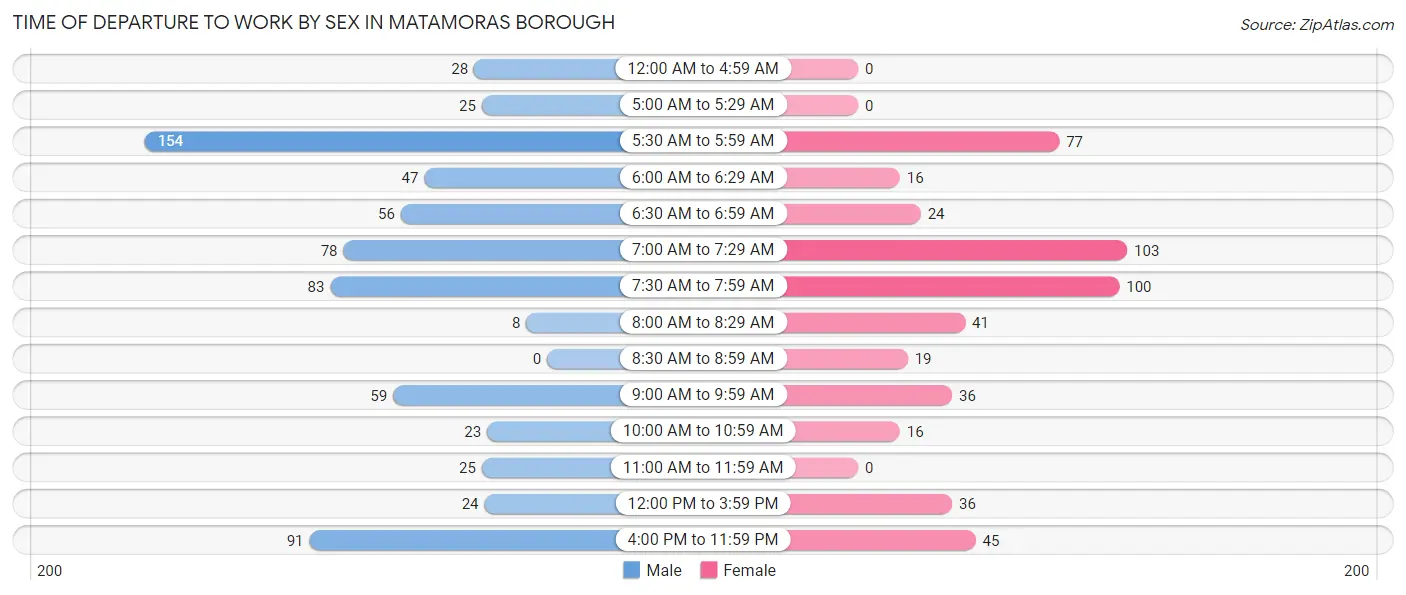
| Time of Departure | Male | Female |
| 12:00 AM to 4:59 AM | 28 (4.0%) | 0 (0.0%) |
| 5:00 AM to 5:29 AM | 25 (3.6%) | 0 (0.0%) |
| 5:30 AM to 5:59 AM | 154 (22.0%) | 77 (15.0%) |
| 6:00 AM to 6:29 AM | 47 (6.7%) | 16 (3.1%) |
| 6:30 AM to 6:59 AM | 56 (8.0%) | 24 (4.7%) |
| 7:00 AM to 7:29 AM | 78 (11.1%) | 103 (20.1%) |
| 7:30 AM to 7:59 AM | 83 (11.8%) | 100 (19.5%) |
| 8:00 AM to 8:29 AM | 8 (1.1%) | 41 (8.0%) |
| 8:30 AM to 8:59 AM | 0 (0.0%) | 19 (3.7%) |
| 9:00 AM to 9:59 AM | 59 (8.4%) | 36 (7.0%) |
| 10:00 AM to 10:59 AM | 23 (3.3%) | 16 (3.1%) |
| 11:00 AM to 11:59 AM | 25 (3.6%) | 0 (0.0%) |
| 12:00 PM to 3:59 PM | 24 (3.4%) | 36 (7.0%) |
| 4:00 PM to 11:59 PM | 91 (13.0%) | 45 (8.8%) |
| Total | 701 (100.0%) | 513 (100.0%) |
Housing Occupancy in Matamoras borough
Occupancy by Ownership in Matamoras borough
Of the total 1,064 dwellings in Matamoras borough, owner-occupied units account for 744 (69.9%), while renter-occupied units make up 320 (30.1%).
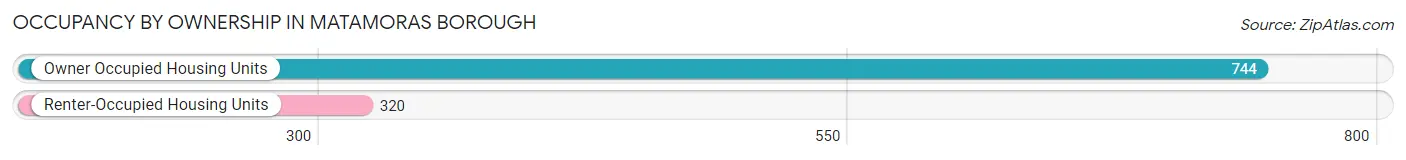
| Occupancy | # Housing Units | % Housing Units |
| Owner Occupied Housing Units | 744 | 69.9% |
| Renter-Occupied Housing Units | 320 | 30.1% |
| Total Occupied Housing Units | 1,064 | 100.0% |
Occupancy by Household Size in Matamoras borough
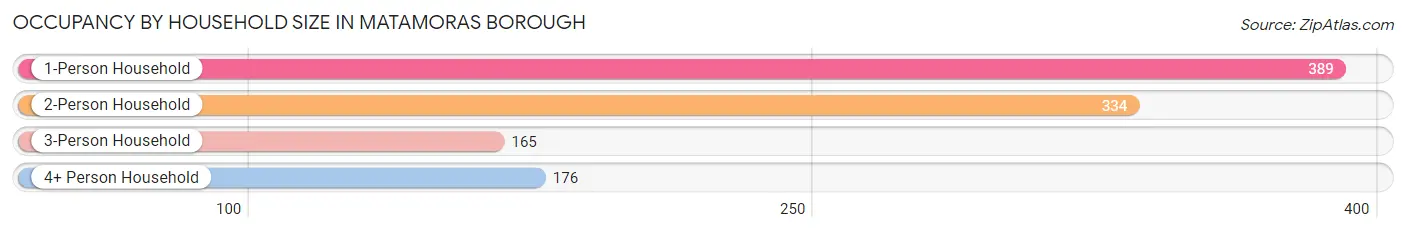
| Household Size | # Housing Units | % Housing Units |
| 1-Person Household | 389 | 36.6% |
| 2-Person Household | 334 | 31.4% |
| 3-Person Household | 165 | 15.5% |
| 4+ Person Household | 176 | 16.5% |
| Total Housing Units | 1,064 | 100.0% |
Occupancy by Ownership by Household Size in Matamoras borough
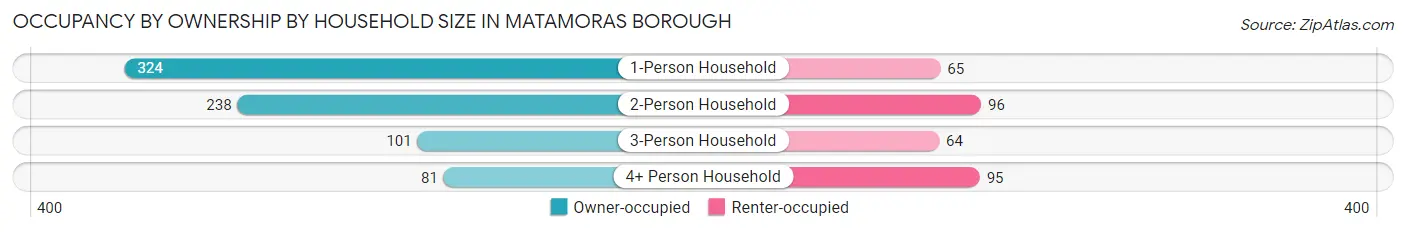
| Household Size | Owner-occupied | Renter-occupied |
| 1-Person Household | 324 (83.3%) | 65 (16.7%) |
| 2-Person Household | 238 (71.3%) | 96 (28.7%) |
| 3-Person Household | 101 (61.2%) | 64 (38.8%) |
| 4+ Person Household | 81 (46.0%) | 95 (54.0%) |
| Total Housing Units | 744 (69.9%) | 320 (30.1%) |
Occupancy by Educational Attainment in Matamoras borough
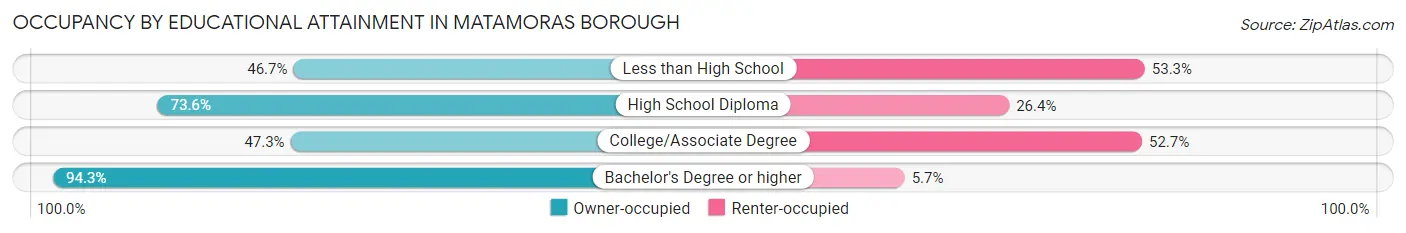
| Household Size | Owner-occupied | Renter-occupied |
| Less than High School | 50 (46.7%) | 57 (53.3%) |
| High School Diploma | 187 (73.6%) | 67 (26.4%) |
| College/Associate Degree | 157 (47.3%) | 175 (52.7%) |
| Bachelor's Degree or higher | 350 (94.3%) | 21 (5.7%) |
Occupancy by Age of Householder in Matamoras borough
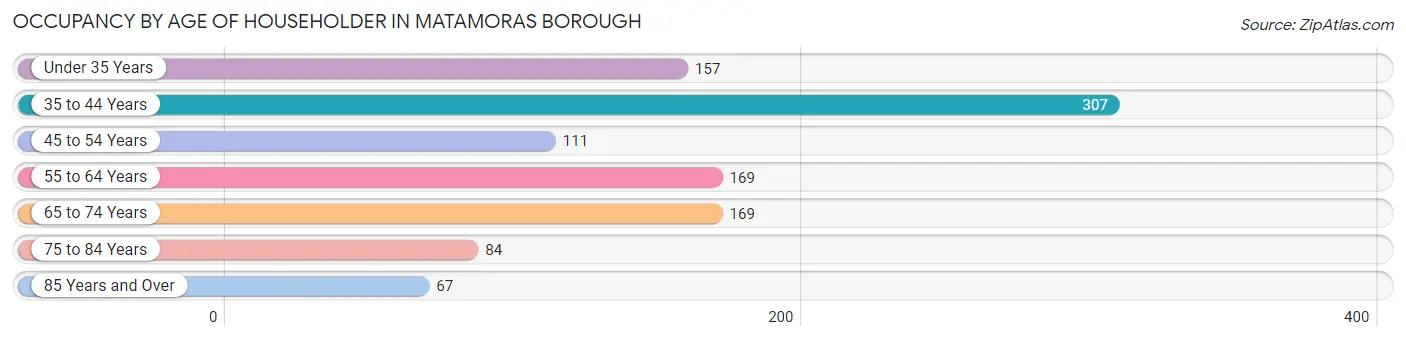
| Age Bracket | # Households | % Households |
| Under 35 Years | 157 | 14.8% |
| 35 to 44 Years | 307 | 28.8% |
| 45 to 54 Years | 111 | 10.4% |
| 55 to 64 Years | 169 | 15.9% |
| 65 to 74 Years | 169 | 15.9% |
| 75 to 84 Years | 84 | 7.9% |
| 85 Years and Over | 67 | 6.3% |
| Total | 1,064 | 100.0% |
Housing Finances in Matamoras borough
Median Income by Occupancy in Matamoras borough
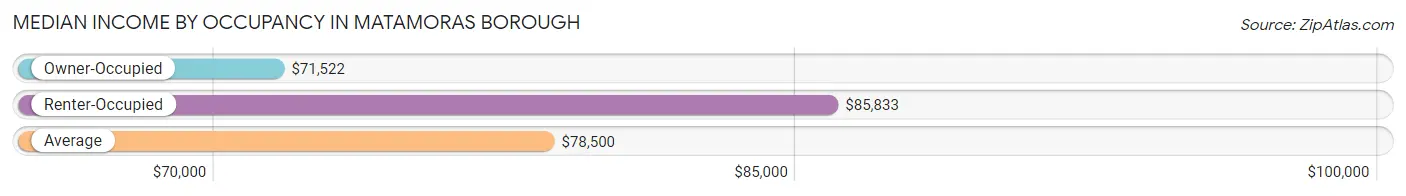
| Occupancy Type | # Households | Median Income |
| Owner-Occupied | 744 (69.9%) | $71,522 |
| Renter-Occupied | 320 (30.1%) | $85,833 |
| Average | 1,064 (100.0%) | $78,500 |
Occupancy by Householder Income Bracket in Matamoras borough
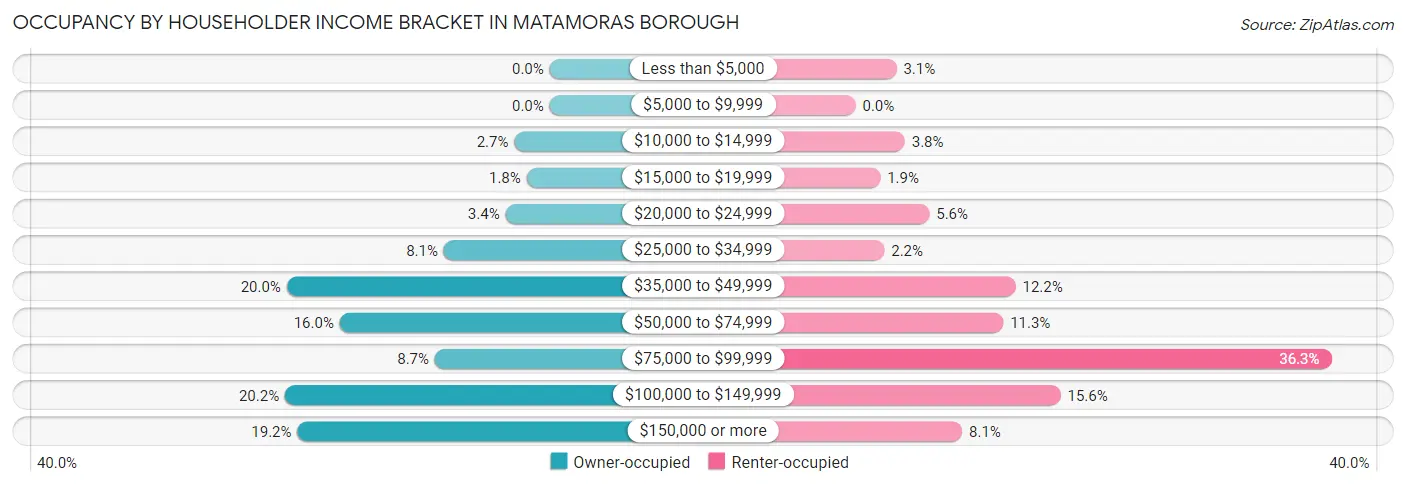
| Income Bracket | Owner-occupied | Renter-occupied |
| Less than $5,000 | 0 (0.0%) | 10 (3.1%) |
| $5,000 to $9,999 | 0 (0.0%) | 0 (0.0%) |
| $10,000 to $14,999 | 20 (2.7%) | 12 (3.7%) |
| $15,000 to $19,999 | 13 (1.8%) | 6 (1.9%) |
| $20,000 to $24,999 | 25 (3.4%) | 18 (5.6%) |
| $25,000 to $34,999 | 60 (8.1%) | 7 (2.2%) |
| $35,000 to $49,999 | 149 (20.0%) | 39 (12.2%) |
| $50,000 to $74,999 | 119 (16.0%) | 36 (11.3%) |
| $75,000 to $99,999 | 65 (8.7%) | 116 (36.2%) |
| $100,000 to $149,999 | 150 (20.2%) | 50 (15.6%) |
| $150,000 or more | 143 (19.2%) | 26 (8.1%) |
| Total | 744 (100.0%) | 320 (100.0%) |
Monthly Housing Cost Tiers in Matamoras borough
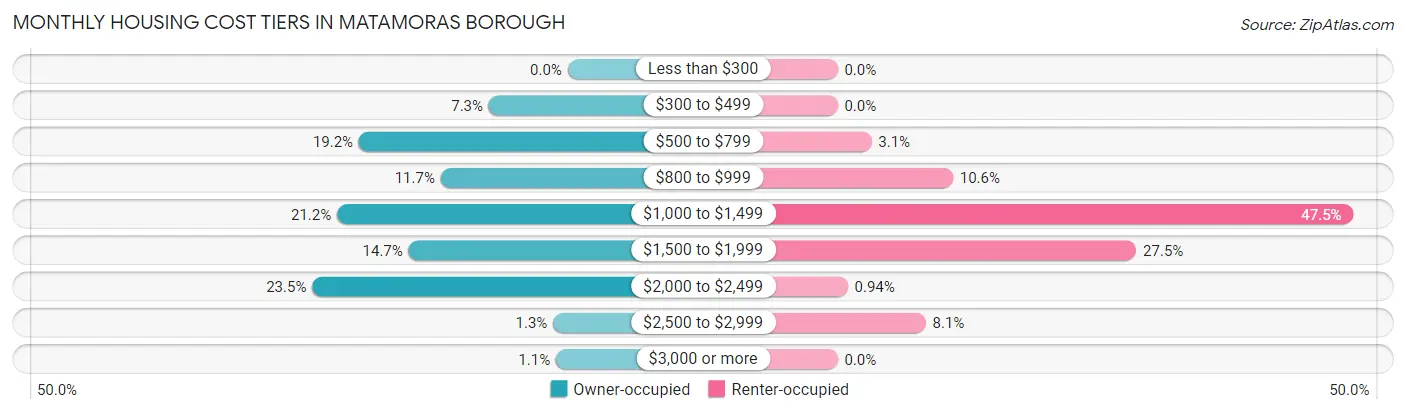
| Monthly Cost | Owner-occupied | Renter-occupied |
| Less than $300 | 0 (0.0%) | 0 (0.0%) |
| $300 to $499 | 54 (7.3%) | 0 (0.0%) |
| $500 to $799 | 143 (19.2%) | 10 (3.1%) |
| $800 to $999 | 87 (11.7%) | 34 (10.6%) |
| $1,000 to $1,499 | 158 (21.2%) | 152 (47.5%) |
| $1,500 to $1,999 | 109 (14.6%) | 88 (27.5%) |
| $2,000 to $2,499 | 175 (23.5%) | 3 (0.9%) |
| $2,500 to $2,999 | 10 (1.3%) | 26 (8.1%) |
| $3,000 or more | 8 (1.1%) | 0 (0.0%) |
| Total | 744 (100.0%) | 320 (100.0%) |
Physical Housing Characteristics in Matamoras borough
Housing Structures in Matamoras borough
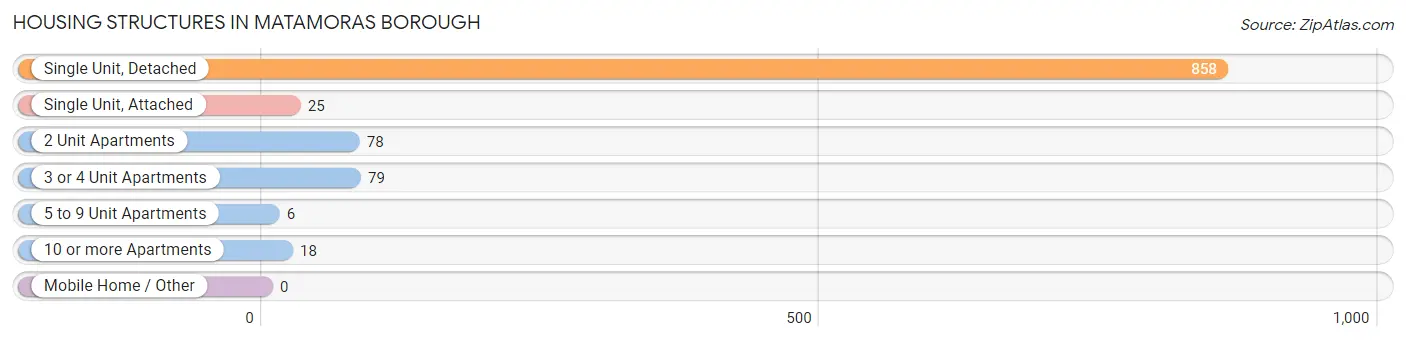
| Structure Type | # Housing Units | % Housing Units |
| Single Unit, Detached | 858 | 80.6% |
| Single Unit, Attached | 25 | 2.4% |
| 2 Unit Apartments | 78 | 7.3% |
| 3 or 4 Unit Apartments | 79 | 7.4% |
| 5 to 9 Unit Apartments | 6 | 0.6% |
| 10 or more Apartments | 18 | 1.7% |
| Mobile Home / Other | 0 | 0.0% |
| Total | 1,064 | 100.0% |
Housing Structures by Occupancy in Matamoras borough
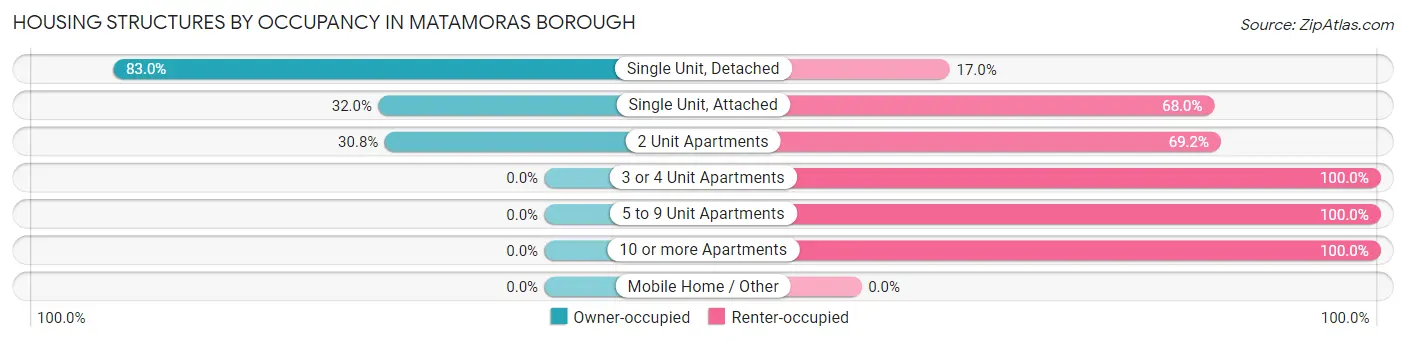
| Structure Type | Owner-occupied | Renter-occupied |
| Single Unit, Detached | 712 (83.0%) | 146 (17.0%) |
| Single Unit, Attached | 8 (32.0%) | 17 (68.0%) |
| 2 Unit Apartments | 24 (30.8%) | 54 (69.2%) |
| 3 or 4 Unit Apartments | 0 (0.0%) | 79 (100.0%) |
| 5 to 9 Unit Apartments | 0 (0.0%) | 6 (100.0%) |
| 10 or more Apartments | 0 (0.0%) | 18 (100.0%) |
| Mobile Home / Other | 0 (0.0%) | 0 (0.0%) |
| Total | 744 (69.9%) | 320 (30.1%) |
Housing Structures by Number of Rooms in Matamoras borough
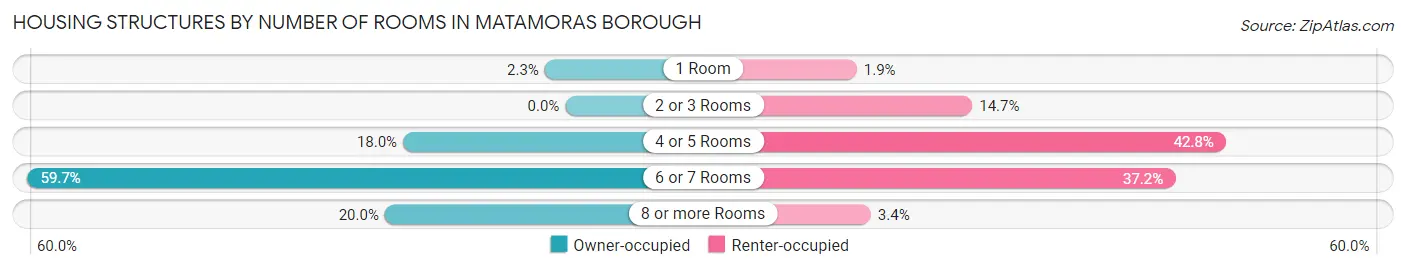
| Number of Rooms | Owner-occupied | Renter-occupied |
| 1 Room | 17 (2.3%) | 6 (1.9%) |
| 2 or 3 Rooms | 0 (0.0%) | 47 (14.7%) |
| 4 or 5 Rooms | 134 (18.0%) | 137 (42.8%) |
| 6 or 7 Rooms | 444 (59.7%) | 119 (37.2%) |
| 8 or more Rooms | 149 (20.0%) | 11 (3.4%) |
| Total | 744 (100.0%) | 320 (100.0%) |
Housing Structure by Heating Type in Matamoras borough
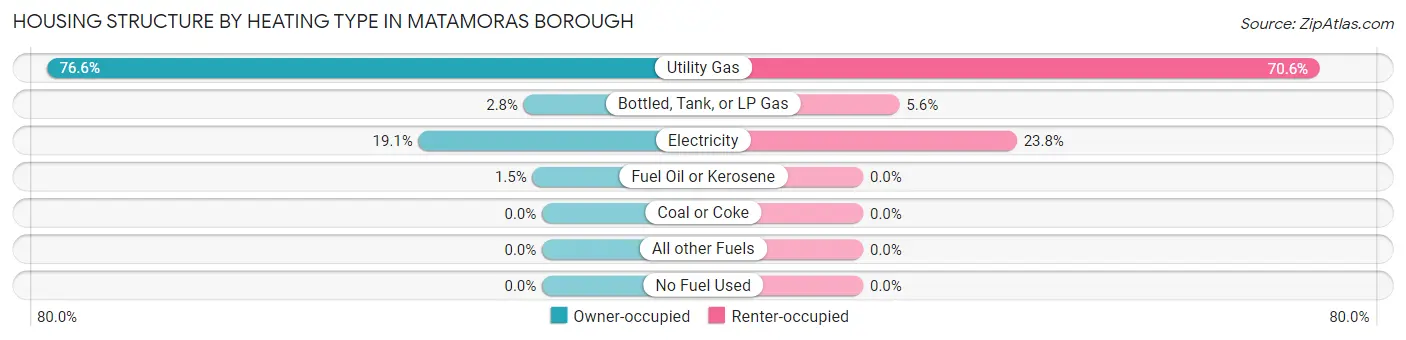
| Heating Type | Owner-occupied | Renter-occupied |
| Utility Gas | 570 (76.6%) | 226 (70.6%) |
| Bottled, Tank, or LP Gas | 21 (2.8%) | 18 (5.6%) |
| Electricity | 142 (19.1%) | 76 (23.7%) |
| Fuel Oil or Kerosene | 11 (1.5%) | 0 (0.0%) |
| Coal or Coke | 0 (0.0%) | 0 (0.0%) |
| All other Fuels | 0 (0.0%) | 0 (0.0%) |
| No Fuel Used | 0 (0.0%) | 0 (0.0%) |
| Total | 744 (100.0%) | 320 (100.0%) |
Household Vehicle Usage in Matamoras borough
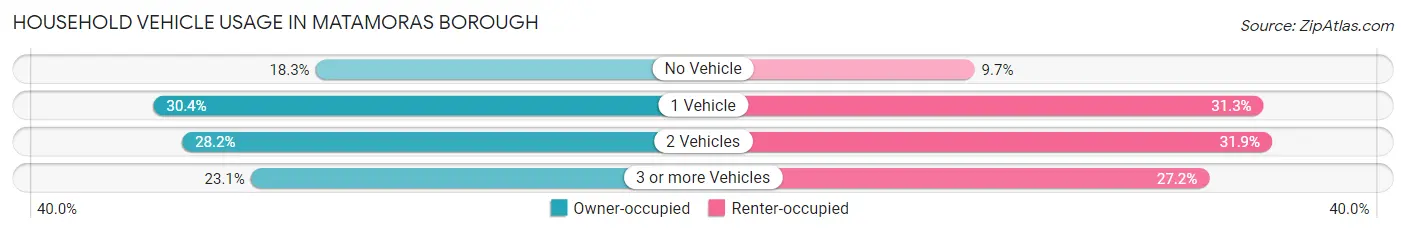
| Vehicles per Household | Owner-occupied | Renter-occupied |
| No Vehicle | 136 (18.3%) | 31 (9.7%) |
| 1 Vehicle | 226 (30.4%) | 100 (31.2%) |
| 2 Vehicles | 210 (28.2%) | 102 (31.9%) |
| 3 or more Vehicles | 172 (23.1%) | 87 (27.2%) |
| Total | 744 (100.0%) | 320 (100.0%) |
Real Estate & Mortgages in Matamoras borough
Real Estate and Mortgage Overview in Matamoras borough
| Characteristic | Without Mortgage | With Mortgage |
| Housing Units | 289 | 455 |
| Median Property Value | $208,300 | $228,000 |
| Median Household Income | $87,031 | $104 |
| Monthly Housing Costs | $691 | $8 |
| Real Estate Taxes | $3,536 | $0 |
Property Value by Mortgage Status in Matamoras borough
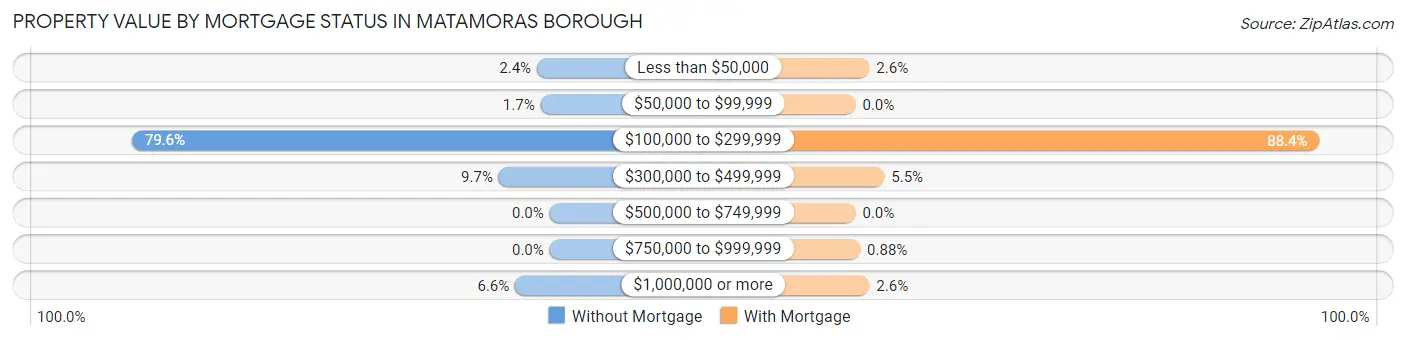
| Property Value | Without Mortgage | With Mortgage |
| Less than $50,000 | 7 (2.4%) | 12 (2.6%) |
| $50,000 to $99,999 | 5 (1.7%) | 0 (0.0%) |
| $100,000 to $299,999 | 230 (79.6%) | 402 (88.3%) |
| $300,000 to $499,999 | 28 (9.7%) | 25 (5.5%) |
| $500,000 to $749,999 | 0 (0.0%) | 0 (0.0%) |
| $750,000 to $999,999 | 0 (0.0%) | 4 (0.9%) |
| $1,000,000 or more | 19 (6.6%) | 12 (2.6%) |
| Total | 289 (100.0%) | 455 (100.0%) |
Household Income by Mortgage Status in Matamoras borough
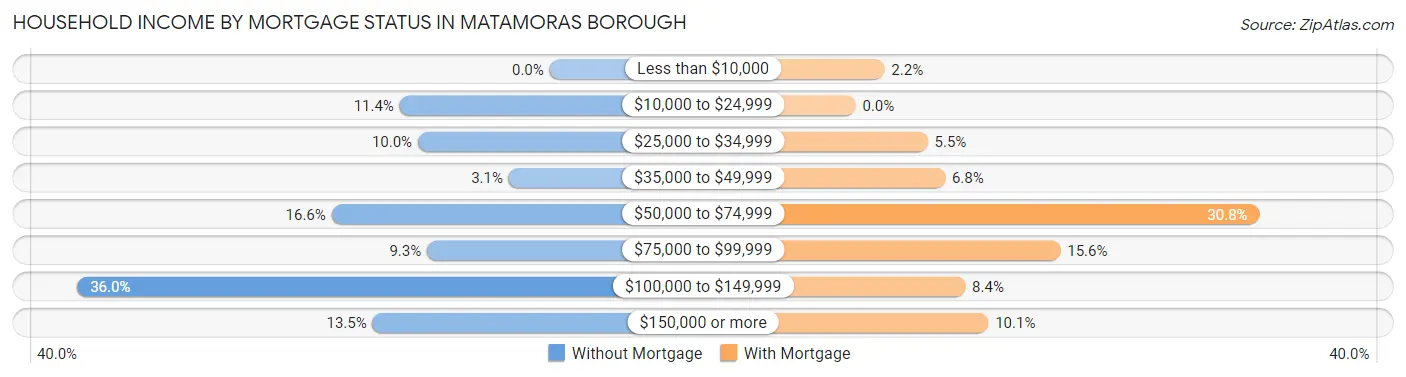
| Household Income | Without Mortgage | With Mortgage |
| Less than $10,000 | 0 (0.0%) | 10 (2.2%) |
| $10,000 to $24,999 | 33 (11.4%) | 0 (0.0%) |
| $25,000 to $34,999 | 29 (10.0%) | 25 (5.5%) |
| $35,000 to $49,999 | 9 (3.1%) | 31 (6.8%) |
| $50,000 to $74,999 | 48 (16.6%) | 140 (30.8%) |
| $75,000 to $99,999 | 27 (9.3%) | 71 (15.6%) |
| $100,000 to $149,999 | 104 (36.0%) | 38 (8.4%) |
| $150,000 or more | 39 (13.5%) | 46 (10.1%) |
| Total | 289 (100.0%) | 455 (100.0%) |
Property Value to Household Income Ratio in Matamoras borough
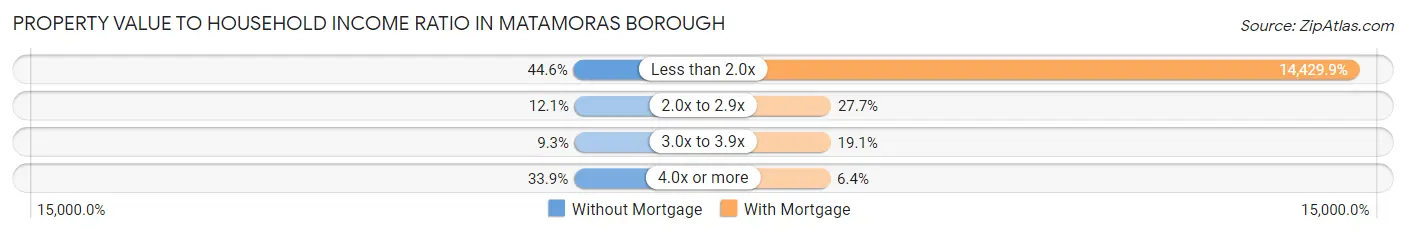
| Value-to-Income Ratio | Without Mortgage | With Mortgage |
| Less than 2.0x | 129 (44.6%) | 65,656 (14,429.9%) |
| 2.0x to 2.9x | 35 (12.1%) | 126 (27.7%) |
| 3.0x to 3.9x | 27 (9.3%) | 87 (19.1%) |
| 4.0x or more | 98 (33.9%) | 29 (6.4%) |
| Total | 289 (100.0%) | 455 (100.0%) |
Real Estate Taxes by Mortgage Status in Matamoras borough
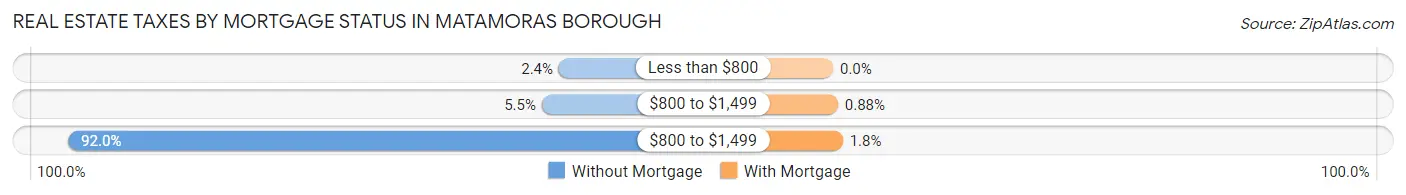
| Property Taxes | Without Mortgage | With Mortgage |
| Less than $800 | 7 (2.4%) | 0 (0.0%) |
| $800 to $1,499 | 16 (5.5%) | 4 (0.9%) |
| $800 to $1,499 | 266 (92.0%) | 8 (1.8%) |
| Total | 289 (100.0%) | 455 (100.0%) |
Health & Disability in Matamoras borough
Health Insurance Coverage by Age in Matamoras borough
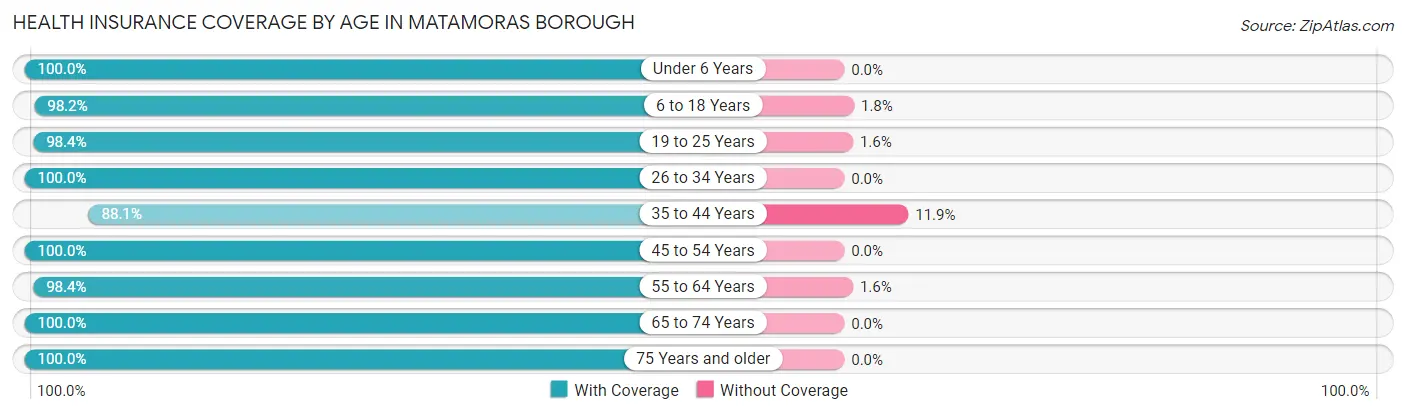
| Age Bracket | With Coverage | Without Coverage |
| Under 6 Years | 126 (100.0%) | 0 (0.0%) |
| 6 to 18 Years | 378 (98.2%) | 7 (1.8%) |
| 19 to 25 Years | 182 (98.4%) | 3 (1.6%) |
| 26 to 34 Years | 231 (100.0%) | 0 (0.0%) |
| 35 to 44 Years | 376 (88.1%) | 51 (11.9%) |
| 45 to 54 Years | 183 (100.0%) | 0 (0.0%) |
| 55 to 64 Years | 367 (98.4%) | 6 (1.6%) |
| 65 to 74 Years | 224 (100.0%) | 0 (0.0%) |
| 75 Years and older | 247 (100.0%) | 0 (0.0%) |
| Total | 2,314 (97.2%) | 67 (2.8%) |
Health Insurance Coverage by Citizenship Status in Matamoras borough
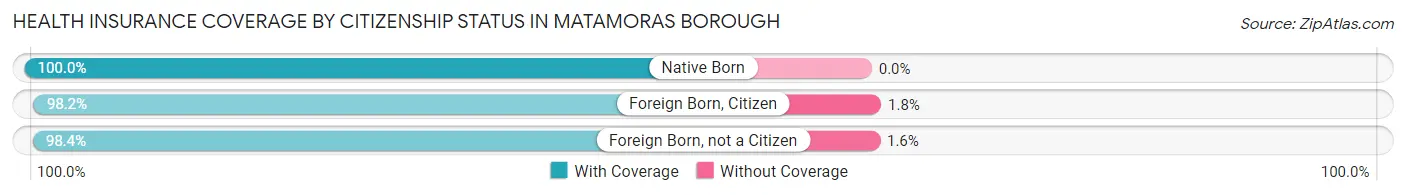
| Citizenship Status | With Coverage | Without Coverage |
| Native Born | 126 (100.0%) | 0 (0.0%) |
| Foreign Born, Citizen | 378 (98.2%) | 7 (1.8%) |
| Foreign Born, not a Citizen | 182 (98.4%) | 3 (1.6%) |
Health Insurance Coverage by Household Income in Matamoras borough
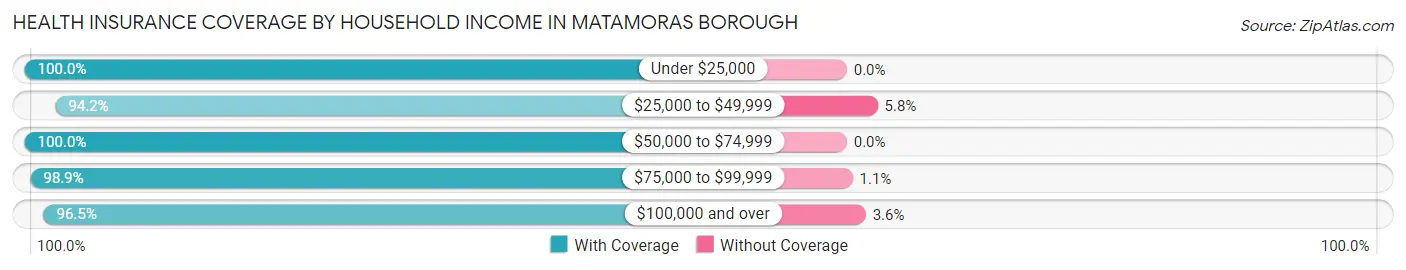
| Household Income | With Coverage | Without Coverage |
| Under $25,000 | 131 (100.0%) | 0 (0.0%) |
| $25,000 to $49,999 | 343 (94.2%) | 21 (5.8%) |
| $50,000 to $74,999 | 355 (100.0%) | 0 (0.0%) |
| $75,000 to $99,999 | 452 (98.9%) | 5 (1.1%) |
| $100,000 and over | 1,033 (96.5%) | 38 (3.5%) |
Public vs Private Health Insurance Coverage by Age in Matamoras borough
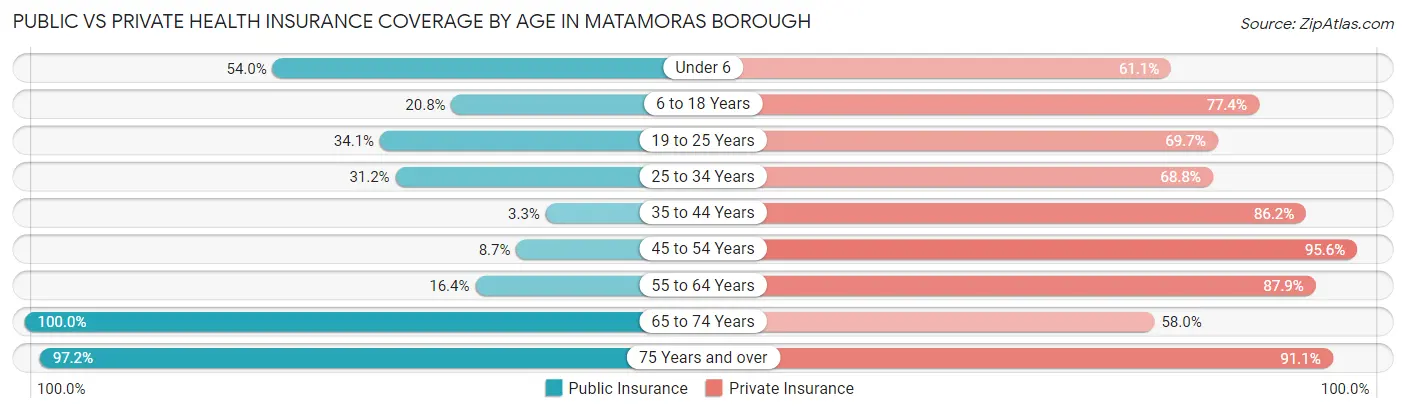
| Age Bracket | Public Insurance | Private Insurance |
| Under 6 | 68 (54.0%) | 77 (61.1%) |
| 6 to 18 Years | 80 (20.8%) | 298 (77.4%) |
| 19 to 25 Years | 63 (34.1%) | 129 (69.7%) |
| 25 to 34 Years | 72 (31.2%) | 159 (68.8%) |
| 35 to 44 Years | 14 (3.3%) | 368 (86.2%) |
| 45 to 54 Years | 16 (8.7%) | 175 (95.6%) |
| 55 to 64 Years | 61 (16.4%) | 328 (87.9%) |
| 65 to 74 Years | 224 (100.0%) | 130 (58.0%) |
| 75 Years and over | 240 (97.2%) | 225 (91.1%) |
| Total | 838 (35.2%) | 1,889 (79.3%) |
Disability Status by Sex by Age in Matamoras borough
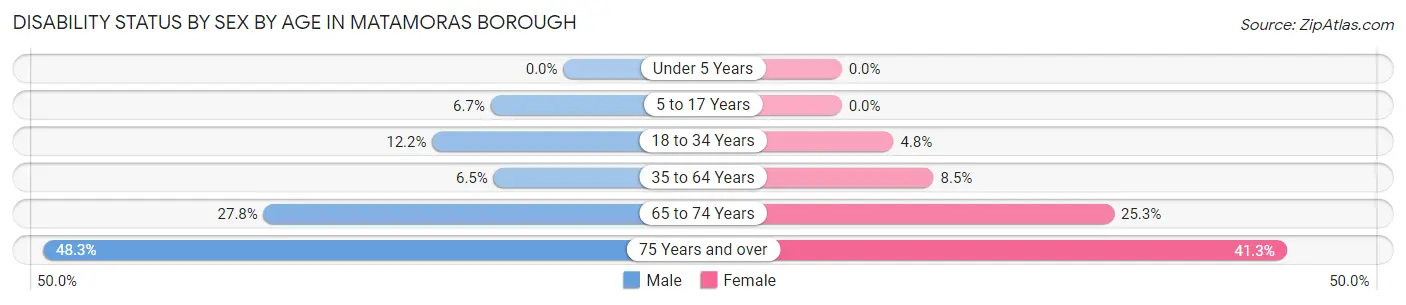
| Age Bracket | Male | Female |
| Under 5 Years | 0 (0.0%) | 0 (0.0%) |
| 5 to 17 Years | 12 (6.7%) | 0 (0.0%) |
| 18 to 34 Years | 27 (12.2%) | 11 (4.8%) |
| 35 to 64 Years | 37 (6.5%) | 35 (8.5%) |
| 65 to 74 Years | 37 (27.8%) | 23 (25.3%) |
| 75 Years and over | 28 (48.3%) | 78 (41.3%) |
Disability Class by Sex by Age in Matamoras borough
Disability Class: Hearing Difficulty
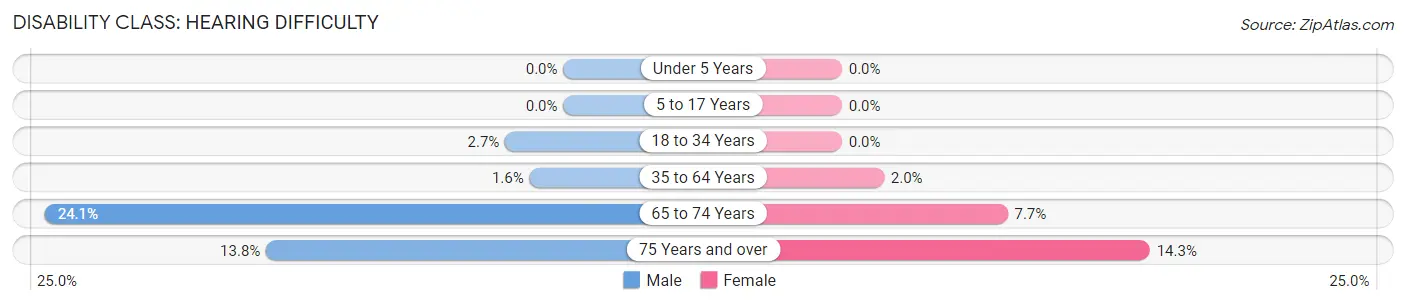
| Age Bracket | Male | Female |
| Under 5 Years | 0 (0.0%) | 0 (0.0%) |
| 5 to 17 Years | 0 (0.0%) | 0 (0.0%) |
| 18 to 34 Years | 6 (2.7%) | 0 (0.0%) |
| 35 to 64 Years | 9 (1.6%) | 8 (1.9%) |
| 65 to 74 Years | 32 (24.1%) | 7 (7.7%) |
| 75 Years and over | 8 (13.8%) | 27 (14.3%) |
Disability Class: Vision Difficulty
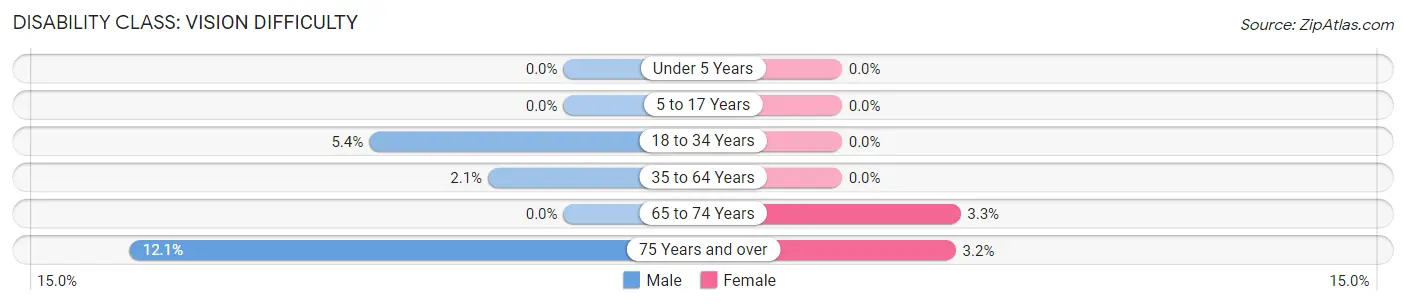
| Age Bracket | Male | Female |
| Under 5 Years | 0 (0.0%) | 0 (0.0%) |
| 5 to 17 Years | 0 (0.0%) | 0 (0.0%) |
| 18 to 34 Years | 12 (5.4%) | 0 (0.0%) |
| 35 to 64 Years | 12 (2.1%) | 0 (0.0%) |
| 65 to 74 Years | 0 (0.0%) | 3 (3.3%) |
| 75 Years and over | 7 (12.1%) | 6 (3.2%) |
Disability Class: Cognitive Difficulty
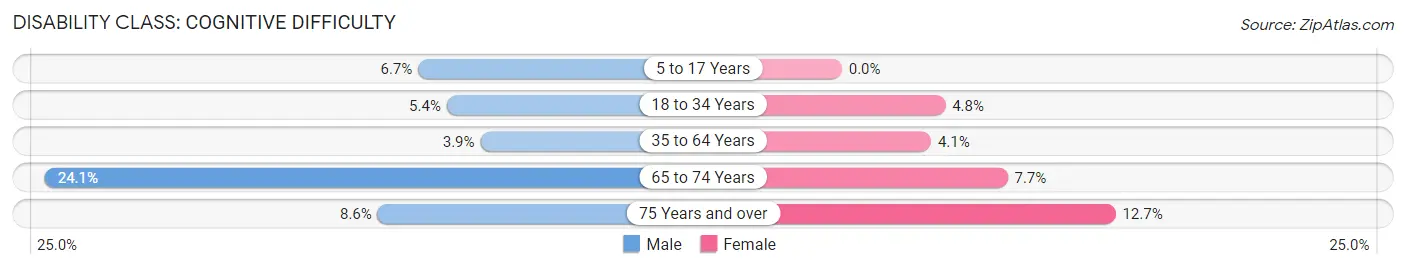
| Age Bracket | Male | Female |
| 5 to 17 Years | 12 (6.7%) | 0 (0.0%) |
| 18 to 34 Years | 12 (5.4%) | 11 (4.8%) |
| 35 to 64 Years | 22 (3.8%) | 17 (4.1%) |
| 65 to 74 Years | 32 (24.1%) | 7 (7.7%) |
| 75 Years and over | 5 (8.6%) | 24 (12.7%) |
Disability Class: Ambulatory Difficulty
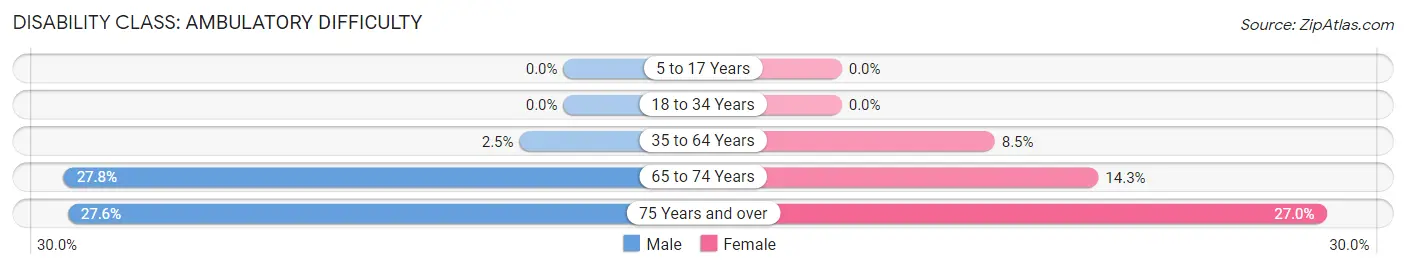
| Age Bracket | Male | Female |
| 5 to 17 Years | 0 (0.0%) | 0 (0.0%) |
| 18 to 34 Years | 0 (0.0%) | 0 (0.0%) |
| 35 to 64 Years | 14 (2.5%) | 35 (8.5%) |
| 65 to 74 Years | 37 (27.8%) | 13 (14.3%) |
| 75 Years and over | 16 (27.6%) | 51 (27.0%) |
Disability Class: Self-Care Difficulty
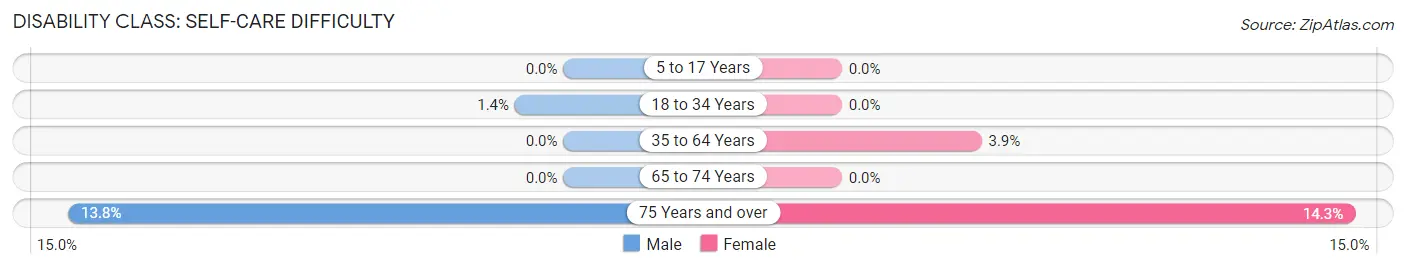
| Age Bracket | Male | Female |
| 5 to 17 Years | 0 (0.0%) | 0 (0.0%) |
| 18 to 34 Years | 3 (1.3%) | 0 (0.0%) |
| 35 to 64 Years | 0 (0.0%) | 16 (3.9%) |
| 65 to 74 Years | 0 (0.0%) | 0 (0.0%) |
| 75 Years and over | 8 (13.8%) | 27 (14.3%) |
Technology Access in Matamoras borough
Computing Device Access in Matamoras borough
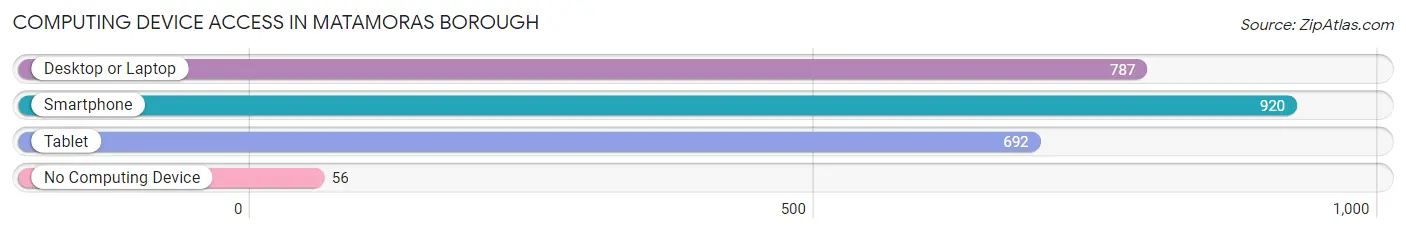
| Device Type | # Households | % Households |
| Desktop or Laptop | 787 | 74.0% |
| Smartphone | 920 | 86.5% |
| Tablet | 692 | 65.0% |
| No Computing Device | 56 | 5.3% |
| Total | 1,064 | 100.0% |
Internet Access in Matamoras borough
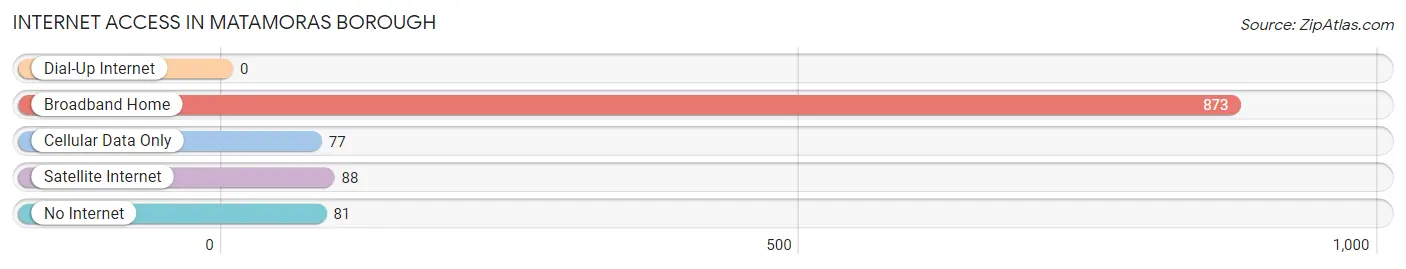
| Internet Type | # Households | % Households |
| Dial-Up Internet | 0 | 0.0% |
| Broadband Home | 873 | 82.1% |
| Cellular Data Only | 77 | 7.2% |
| Satellite Internet | 88 | 8.3% |
| No Internet | 81 | 7.6% |
| Total | 1,064 | 100.0% |
Matamoras borough Summary
Matamoras Borough is a small borough located in Pike County, Pennsylvania. It is situated along the Delaware River, just south of the New York border. The population of Matamoras Borough was 1,817 at the 2010 census.
History
Matamoras Borough was founded in 1851 by a group of settlers from New York. The name of the borough was derived from the Spanish word for “kill”, as the area was known for its many battles between Native Americans and settlers. The borough was incorporated in 1872.
In the late 19th century, Matamoras Borough was a popular destination for vacationers from New York City. The Delaware River provided a scenic backdrop for the many resorts and hotels that were built in the area. The resorts attracted many visitors, and the town grew rapidly.
In the early 20th century, Matamoras Borough was a major hub for the lumber industry. The town was home to several sawmills and lumber yards, and the lumber industry provided many jobs for the residents of the borough.
Geography
Matamoras Borough is located in the northeast corner of Pike County, Pennsylvania. It is situated along the Delaware River, just south of the New York border. The borough is bordered by Westfall Township to the north, Milford Township to the east, and Dingman Township to the south.
The terrain of Matamoras Borough is mostly flat, with some rolling hills in the northern part of the borough. The borough is located in the Appalachian Mountains, and the highest point in the borough is 1,817 feet above sea level.
Economy
The economy of Matamoras Borough is largely based on tourism. The borough is home to several resorts and hotels, as well as a number of restaurants and shops. The Delaware River provides a scenic backdrop for the many outdoor activities that are available in the area, such as fishing, boating, and hiking.
The borough is also home to several manufacturing companies, including a plastics factory and a paper mill. These companies provide jobs for many of the residents of Matamoras Borough.
Demographics
As of the 2010 census, the population of Matamoras Borough was 1,817. The racial makeup of the borough was 95.3% White, 1.2% African American, 0.3% Native American, 0.7% Asian, 0.1% Pacific Islander, 0.7% from other races, and 1.9% from two or more races. Hispanic or Latino of any race were 3.2% of the population.
The median household income in Matamoras Borough was $41,250, and the median family income was $48,750. The per capita income for the borough was $20,945. About 11.2% of families and 14.2% of the population were below the poverty line, including 19.2% of those under age 18 and 8.3% of those age 65 or over.
Common Questions
What is Per Capita Income in Matamoras borough?
Per Capita income in Matamoras borough is $60,497.
What is the Median Family Income in Matamoras borough?
Median Family Income in Matamoras borough is $86,514.
What is the Median Household income in Matamoras borough?
Median Household Income in Matamoras borough is $78,500.
What is Income or Wage Gap in Matamoras borough?
Income or Wage Gap in Matamoras borough is 30.4%.
Women in Matamoras borough earn 69.6 cents for every dollar earned by a man.
What is Inequality or Gini Index in Matamoras borough?
Inequality or Gini Index in Matamoras borough is 0.56.
What is the Total Population of Matamoras borough?
Total Population of Matamoras borough is 2,396.
What is the Total Male Population of Matamoras borough?
Total Male Population of Matamoras borough is 1,258.
What is the Total Female Population of Matamoras borough?
Total Female Population of Matamoras borough is 1,138.
What is the Ratio of Males per 100 Females in Matamoras borough?
There are 110.54 Males per 100 Females in Matamoras borough.
What is the Ratio of Females per 100 Males in Matamoras borough?
There are 90.46 Females per 100 Males in Matamoras borough.
What is the Median Population Age in Matamoras borough?
Median Population Age in Matamoras borough is 43.1 Years.
What is the Average Family Size in Matamoras borough
Average Family Size in Matamoras borough is 2.9 People.
What is the Average Household Size in Matamoras borough
Average Household Size in Matamoras borough is 2.2 People.
How Large is the Labor Force in Matamoras borough?
There are 1,397 People in the Labor Forcein in Matamoras borough.
What is the Percentage of People in the Labor Force in Matamoras borough?
71.6% of People are in the Labor Force in Matamoras borough.
What is the Unemployment Rate in Matamoras borough?
Unemployment Rate in Matamoras borough is 1.7%.