Penn borough, PA Map & Demographics
Penn borough Overview
$22,570
PER CAPITA INCOME
$69,536
AVG FAMILY INCOME
$67,857
AVG HOUSEHOLD INCOME
33.1%
WAGE / INCOME GAP [ % ]
66.9¢/ $1
WAGE / INCOME GAP [ $ ]
0.29
INEQUALITY / GINI INDEX
1,033
TOTAL POPULATION
513
MALE POPULATION
520
FEMALE POPULATION
98.65
MALES / 100 FEMALES
101.36
FEMALES / 100 MALES
25.5
MEDIAN AGE
3.8
AVG FAMILY SIZE
3.2
AVG HOUSEHOLD SIZE
413
LABOR FORCE [ PEOPLE ]
66.1%
PERCENT IN LABOR FORCE
2.7%
UNEMPLOYMENT RATE
Income in Penn borough
Income Overview in Penn borough
Per Capita Income in Penn borough is $22,570, while median incomes of families and households are $69,536 and $67,857 respectively.
| Characteristic | Number | Measure |
| Per Capita Income | 1,033 | $22,570 |
| Median Family Income | 247 | $69,536 |
| Mean Family Income | 247 | $78,705 |
| Median Household Income | 324 | $67,857 |
| Mean Household Income | 324 | $72,027 |
| Income Deficit | 247 | $0 |
| Wage / Income Gap (%) | 1,033 | 33.14% |
| Wage / Income Gap ($) | 1,033 | 66.86¢ per $1 |
| Gini / Inequality Index | 1,033 | 0.29 |
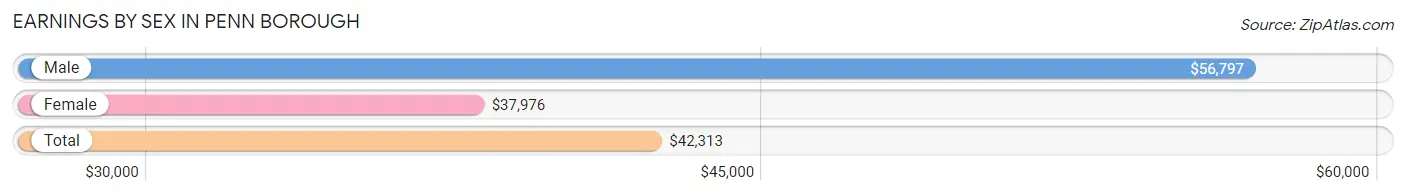
Earnings by Sex in Penn borough
Average Earnings in Penn borough are $42,313, $56,797 for men and $37,976 for women, a difference of 33.1%.
| Sex | Number | Average Earnings |
| Male | 227 (50.6%) | $56,797 |
| Female | 222 (49.4%) | $37,976 |
| Total | 449 (100.0%) | $42,313 |
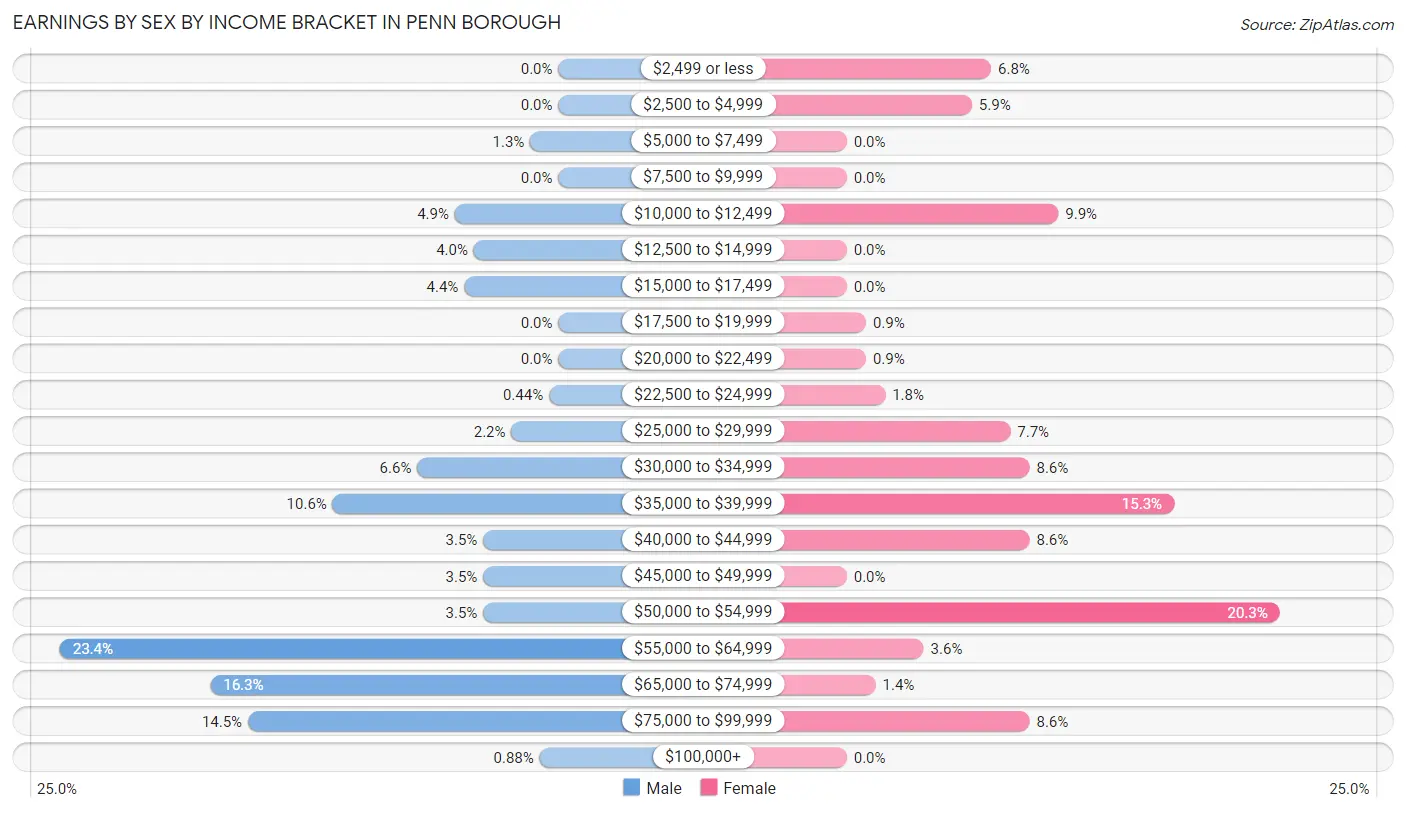
Earnings by Sex by Income Bracket in Penn borough
The most common earnings brackets in Penn borough are $55,000 to $64,999 for men (53 | 23.4%) and $50,000 to $54,999 for women (45 | 20.3%).
| Income | Male | Female |
| $2,499 or less | 0 (0.0%) | 15 (6.8%) |
| $2,500 to $4,999 | 0 (0.0%) | 13 (5.9%) |
| $5,000 to $7,499 | 3 (1.3%) | 0 (0.0%) |
| $7,500 to $9,999 | 0 (0.0%) | 0 (0.0%) |
| $10,000 to $12,499 | 11 (4.9%) | 22 (9.9%) |
| $12,500 to $14,999 | 9 (4.0%) | 0 (0.0%) |
| $15,000 to $17,499 | 10 (4.4%) | 0 (0.0%) |
| $17,500 to $19,999 | 0 (0.0%) | 2 (0.9%) |
| $20,000 to $22,499 | 0 (0.0%) | 2 (0.9%) |
| $22,500 to $24,999 | 1 (0.4%) | 4 (1.8%) |
| $25,000 to $29,999 | 5 (2.2%) | 17 (7.7%) |
| $30,000 to $34,999 | 15 (6.6%) | 19 (8.6%) |
| $35,000 to $39,999 | 24 (10.6%) | 34 (15.3%) |
| $40,000 to $44,999 | 8 (3.5%) | 19 (8.6%) |
| $45,000 to $49,999 | 8 (3.5%) | 0 (0.0%) |
| $50,000 to $54,999 | 8 (3.5%) | 45 (20.3%) |
| $55,000 to $64,999 | 53 (23.4%) | 8 (3.6%) |
| $65,000 to $74,999 | 37 (16.3%) | 3 (1.3%) |
| $75,000 to $99,999 | 33 (14.5%) | 19 (8.6%) |
| $100,000+ | 2 (0.9%) | 0 (0.0%) |
| Total | 227 (100.0%) | 222 (100.0%) |
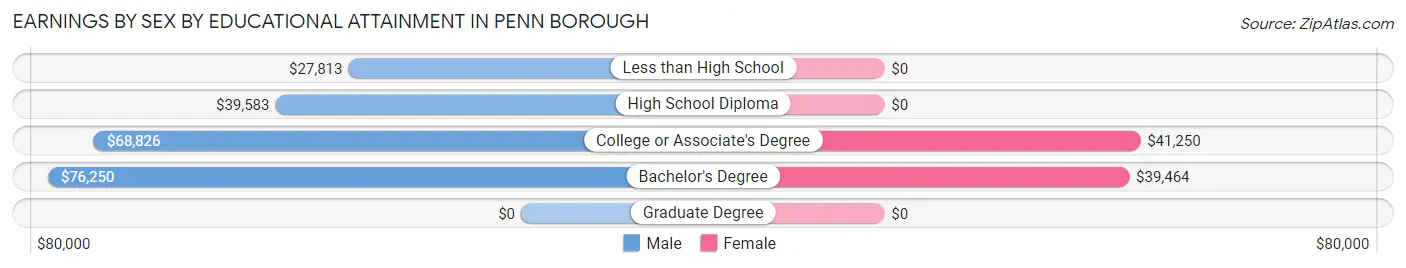
Earnings by Sex by Educational Attainment in Penn borough
Average earnings in Penn borough are $56,875 for men and $38,869 for women, a difference of 31.7%. Men with an educational attainment of bachelor's degree enjoy the highest average annual earnings of $76,250, while those with less than high school education earn the least with $27,813. Women with an educational attainment of college or associate's degree earn the most with the average annual earnings of $41,250, while those with bachelor's degree education have the smallest earnings of $39,464.
| Educational Attainment | Male Income | Female Income |
| Less than High School | $27,813 | $0 |
| High School Diploma | $39,583 | $0 |
| College or Associate's Degree | $68,826 | $41,250 |
| Bachelor's Degree | $76,250 | $39,464 |
| Graduate Degree | - | - |
| Total | $56,875 | $38,869 |
Family Income in Penn borough
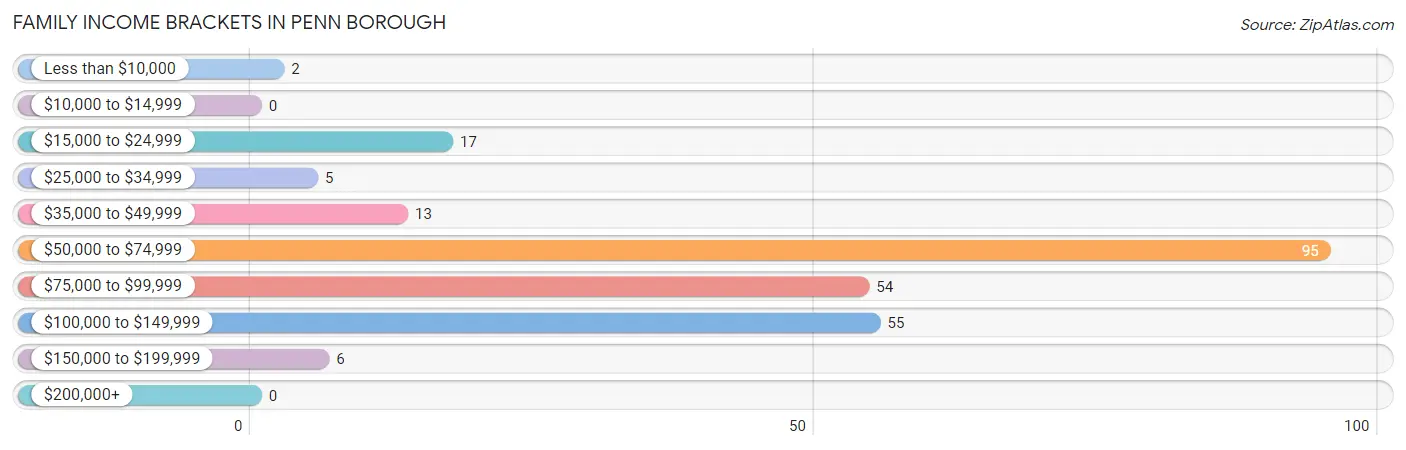
Family Income Brackets in Penn borough
According to the Penn borough family income data, there are 95 families falling into the $50,000 to $74,999 income range, which is the most common income bracket and makes up 38.5% of all families.
| Income Bracket | # Families | % Families |
| Less than $10,000 | 2 | 0.8% |
| $10,000 to $14,999 | 0 | 0.0% |
| $15,000 to $24,999 | 17 | 6.9% |
| $25,000 to $34,999 | 5 | 2.0% |
| $35,000 to $49,999 | 13 | 5.3% |
| $50,000 to $74,999 | 95 | 38.5% |
| $75,000 to $99,999 | 54 | 21.9% |
| $100,000 to $149,999 | 55 | 22.3% |
| $150,000 to $199,999 | 6 | 2.4% |
| $200,000+ | 0 | 0.0% |
Family Income by Famaliy Size in Penn borough
4-person families (83 | 33.6%) account for the highest median family income in Penn borough with $90,893 per family, while 2-person families (39 | 15.8%) have the highest median income of $35,938 per family member.
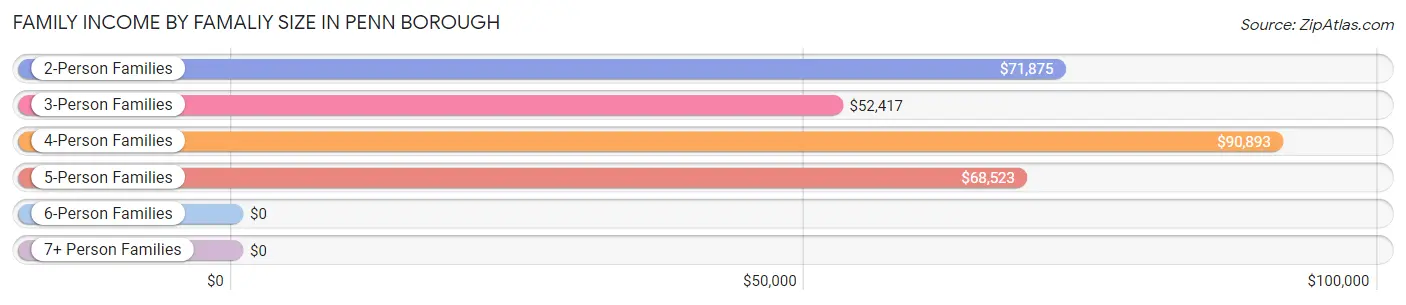
| Income Bracket | # Families | Median Income |
| 2-Person Families | 39 (15.8%) | $71,875 |
| 3-Person Families | 47 (19.0%) | $52,417 |
| 4-Person Families | 83 (33.6%) | $90,893 |
| 5-Person Families | 75 (30.4%) | $68,523 |
| 6-Person Families | 3 (1.2%) | $0 |
| 7+ Person Families | 0 (0.0%) | $0 |
| Total | 247 (100.0%) | $69,536 |
Family Income by Number of Earners in Penn borough
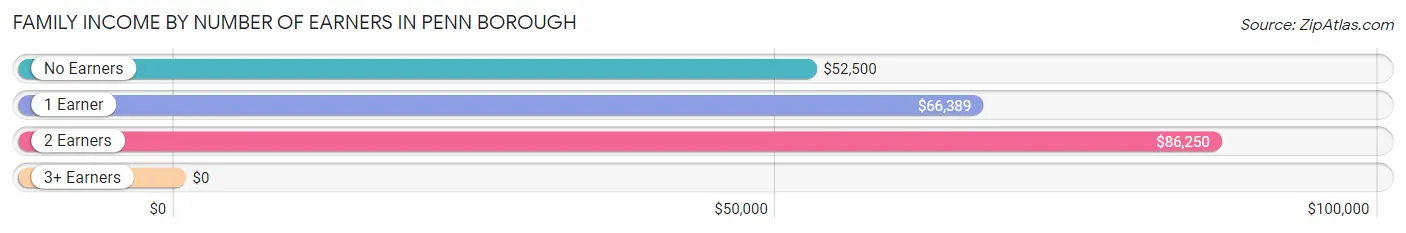
| Number of Earners | # Families | Median Income |
| No Earners | 12 (4.9%) | $52,500 |
| 1 Earner | 90 (36.4%) | $66,389 |
| 2 Earners | 142 (57.5%) | $86,250 |
| 3+ Earners | 3 (1.2%) | $0 |
| Total | 247 (100.0%) | $69,536 |
Household Income in Penn borough
Household Income Brackets in Penn borough
With 116 households falling in the category, the $50,000 to $74,999 income range is the most frequent in Penn borough, accounting for 35.8% of all households. In contrast, only 2 households (0.6%) fall into the $200,000+ income bracket, making it the least populous group.
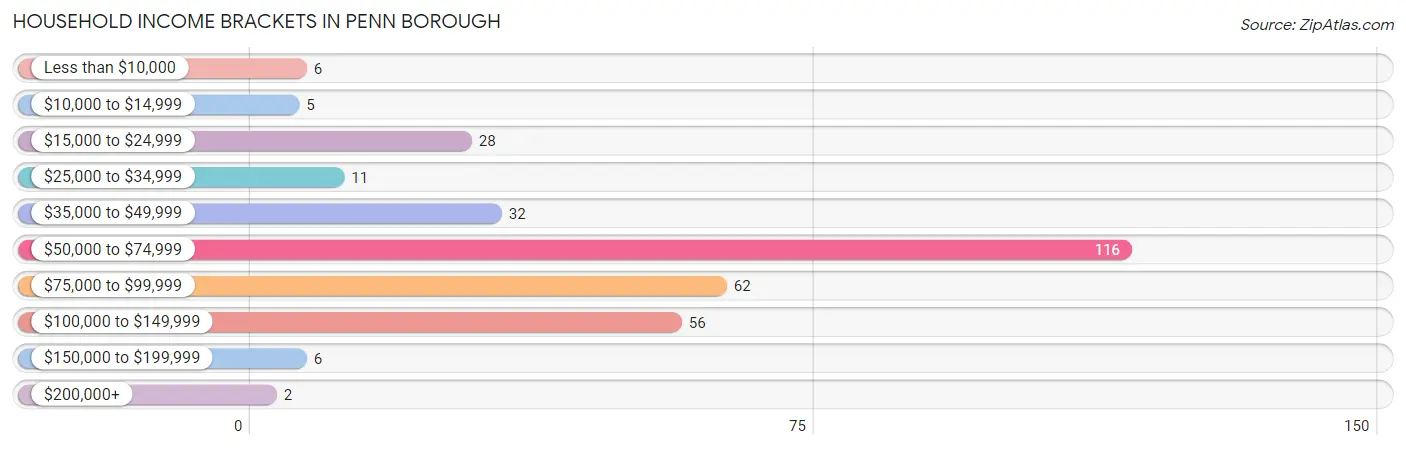
| Income Bracket | # Households | % Households |
| Less than $10,000 | 6 | 1.9% |
| $10,000 to $14,999 | 5 | 1.5% |
| $15,000 to $24,999 | 28 | 8.6% |
| $25,000 to $34,999 | 11 | 3.4% |
| $35,000 to $49,999 | 32 | 9.9% |
| $50,000 to $74,999 | 116 | 35.8% |
| $75,000 to $99,999 | 62 | 19.1% |
| $100,000 to $149,999 | 56 | 17.3% |
| $150,000 to $199,999 | 6 | 1.9% |
| $200,000+ | 2 | 0.6% |
Household Income by Householder Age in Penn borough
The median household income in Penn borough is $67,857, with the highest median household income of $69,750 found in the 25 to 44 years age bracket for the primary householder. A total of 161 households (49.7%) fall into this category.
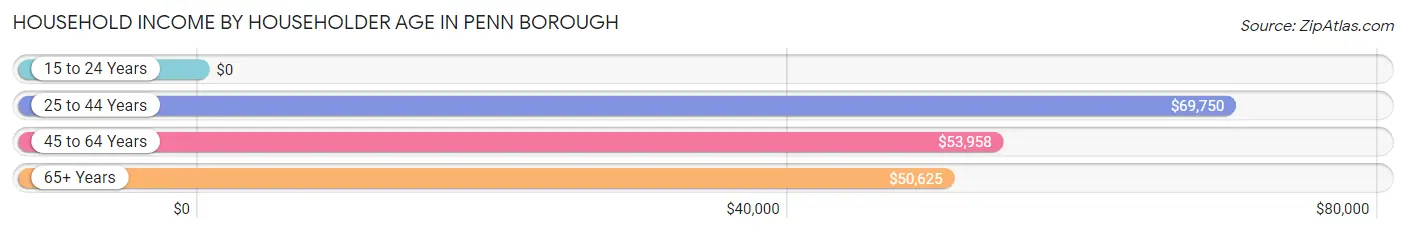
| Income Bracket | # Households | Median Income |
| 15 to 24 Years | 0 (0.0%) | $0 |
| 25 to 44 Years | 161 (49.7%) | $69,750 |
| 45 to 64 Years | 125 (38.6%) | $53,958 |
| 65+ Years | 38 (11.7%) | $50,625 |
| Total | 324 (100.0%) | $67,857 |
Poverty in Penn borough
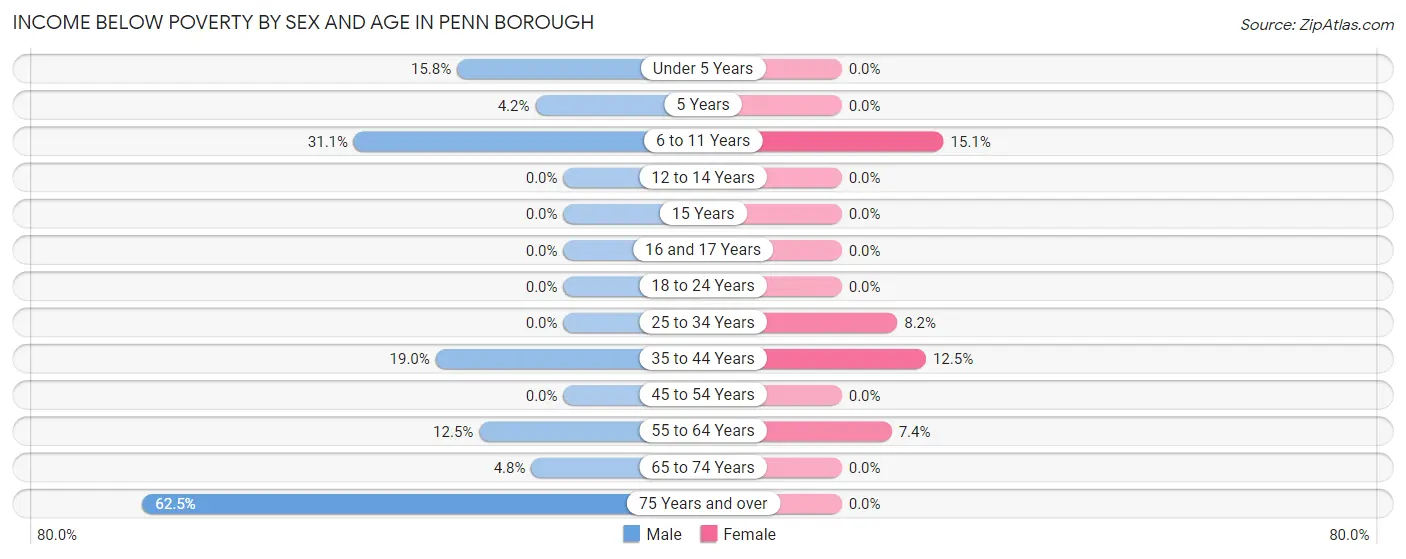
Income Below Poverty by Sex and Age in Penn borough
With 10.5% poverty level for males and 6.1% for females among the residents of Penn borough, 75 year old and over males and 6 to 11 year old females are the most vulnerable to poverty, with 5 males (62.5%) and 13 females (15.1%) in their respective age groups living below the poverty level.
| Age Bracket | Male | Female |
| Under 5 Years | 18 (15.8%) | 0 (0.0%) |
| 5 Years | 1 (4.2%) | 0 (0.0%) |
| 6 to 11 Years | 14 (31.1%) | 13 (15.1%) |
| 12 to 14 Years | 0 (0.0%) | 0 (0.0%) |
| 15 Years | 0 (0.0%) | 0 (0.0%) |
| 16 and 17 Years | 0 (0.0%) | 0 (0.0%) |
| 18 to 24 Years | 0 (0.0%) | 0 (0.0%) |
| 25 to 34 Years | 0 (0.0%) | 7 (8.2%) |
| 35 to 44 Years | 11 (19.0%) | 10 (12.5%) |
| 45 to 54 Years | 0 (0.0%) | 0 (0.0%) |
| 55 to 64 Years | 4 (12.5%) | 2 (7.4%) |
| 65 to 74 Years | 1 (4.8%) | 0 (0.0%) |
| 75 Years and over | 5 (62.5%) | 0 (0.0%) |
| Total | 54 (10.5%) | 32 (6.1%) |
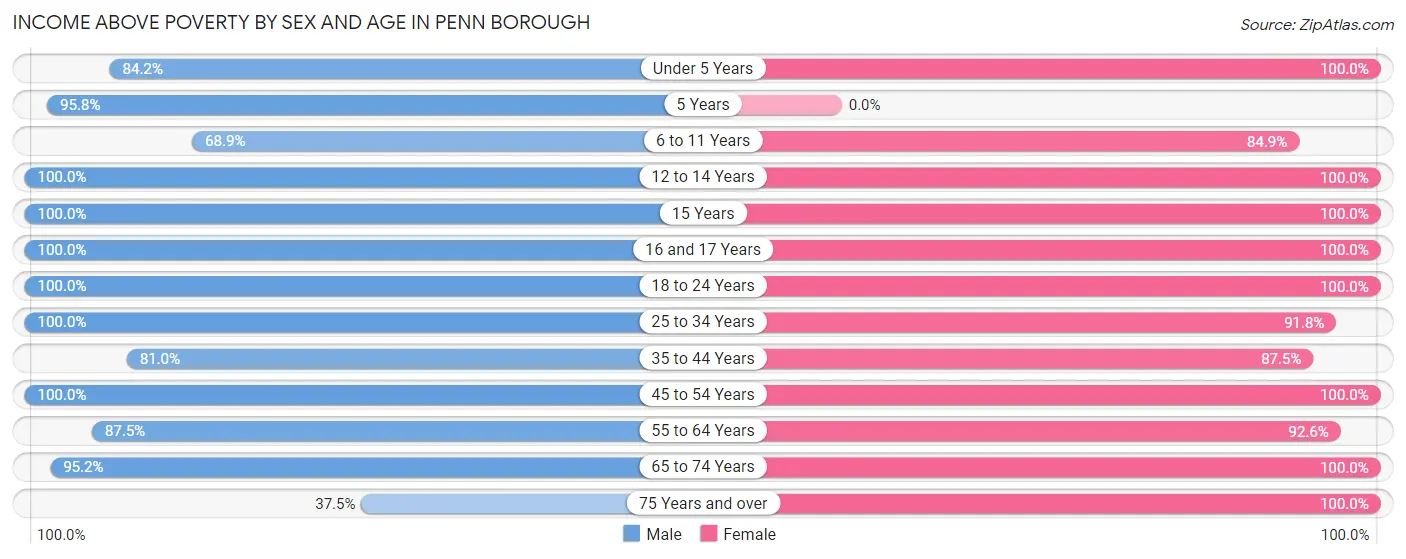
Income Above Poverty by Sex and Age in Penn borough
According to the poverty statistics in Penn borough, males aged 12 to 14 years and females aged under 5 years are the age groups that are most secure financially, with 100.0% of males and 100.0% of females in these age groups living above the poverty line.
| Age Bracket | Male | Female |
| Under 5 Years | 96 (84.2%) | 91 (100.0%) |
| 5 Years | 23 (95.8%) | 0 (0.0%) |
| 6 to 11 Years | 31 (68.9%) | 73 (84.9%) |
| 12 to 14 Years | 32 (100.0%) | 3 (100.0%) |
| 15 Years | 9 (100.0%) | 4 (100.0%) |
| 16 and 17 Years | 4 (100.0%) | 27 (100.0%) |
| 18 to 24 Years | 11 (100.0%) | 34 (100.0%) |
| 25 to 34 Years | 99 (100.0%) | 78 (91.8%) |
| 35 to 44 Years | 47 (81.0%) | 70 (87.5%) |
| 45 to 54 Years | 56 (100.0%) | 48 (100.0%) |
| 55 to 64 Years | 28 (87.5%) | 25 (92.6%) |
| 65 to 74 Years | 20 (95.2%) | 27 (100.0%) |
| 75 Years and over | 3 (37.5%) | 8 (100.0%) |
| Total | 459 (89.5%) | 488 (93.9%) |
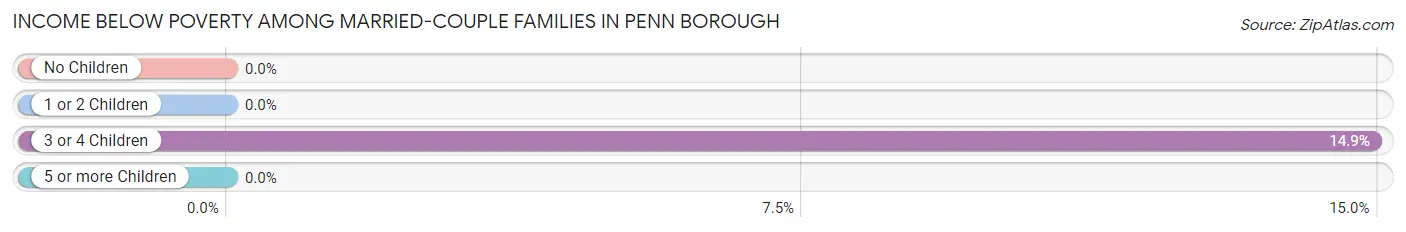
Income Below Poverty Among Married-Couple Families in Penn borough
The poverty statistics for married-couple families in Penn borough show that 5.5% or 10 of the total 182 families live below the poverty line. Families with 3 or 4 children have the highest poverty rate of 14.9%, comprising of 10 families. On the other hand, families with no children have the lowest poverty rate of 0.0%, which includes 0 families.
| Children | Above Poverty | Below Poverty |
| No Children | 28 (100.0%) | 0 (0.0%) |
| 1 or 2 Children | 87 (100.0%) | 0 (0.0%) |
| 3 or 4 Children | 57 (85.1%) | 10 (14.9%) |
| 5 or more Children | 0 (0.0%) | 0 (0.0%) |
| Total | 172 (94.5%) | 10 (5.5%) |
Income Below Poverty Among Single-Parent Households in Penn borough
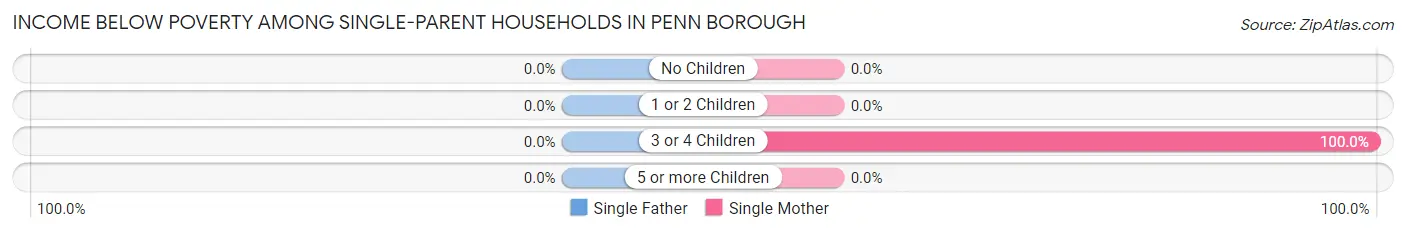
| Children | Single Father | Single Mother |
| No Children | 0 (0.0%) | 0 (0.0%) |
| 1 or 2 Children | 0 (0.0%) | 0 (0.0%) |
| 3 or 4 Children | 0 (0.0%) | 5 (100.0%) |
| 5 or more Children | 0 (0.0%) | 0 (0.0%) |
| Total | 0 (0.0%) | 5 (9.1%) |
Income Below Poverty Among Married-Couple vs Single-Parent Households in Penn borough
The poverty data for Penn borough shows that 10 of the married-couple family households (5.5%) and 5 of the single-parent households (7.7%) are living below the poverty level. Within the married-couple family households, those with 3 or 4 children have the highest poverty rate, with 10 households (14.9%) falling below the poverty line. Among the single-parent households, those with 3 or 4 children have the highest poverty rate, with 5 household (100.0%) living below poverty.
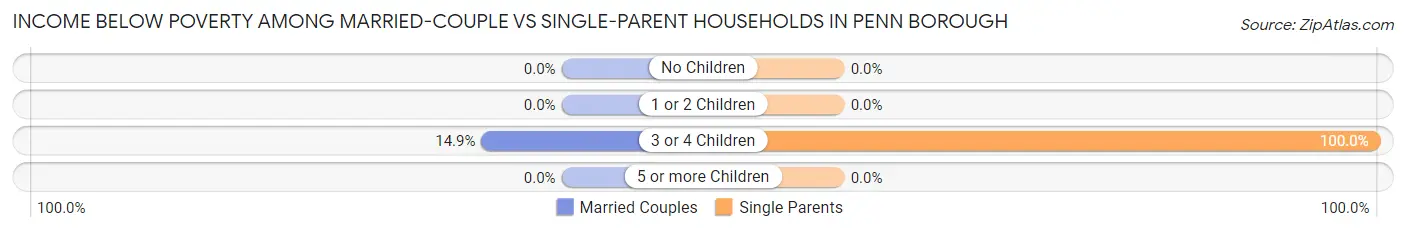
| Children | Married-Couple Families | Single-Parent Households |
| No Children | 0 (0.0%) | 0 (0.0%) |
| 1 or 2 Children | 0 (0.0%) | 0 (0.0%) |
| 3 or 4 Children | 10 (14.9%) | 5 (100.0%) |
| 5 or more Children | 0 (0.0%) | 0 (0.0%) |
| Total | 10 (5.5%) | 5 (7.7%) |
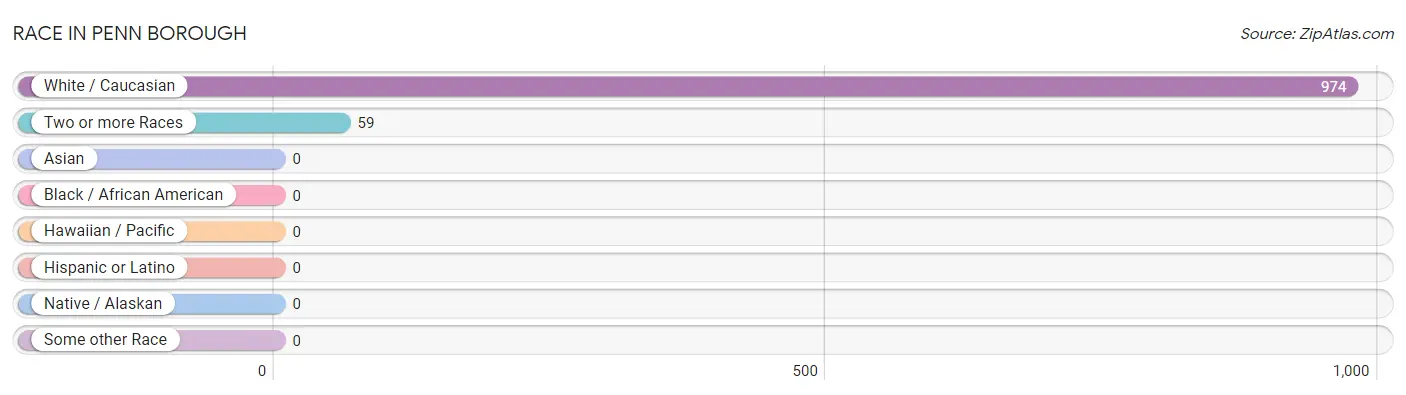
Race in Penn borough
The most populous races in Penn borough are White / Caucasian (974 | 94.3%), and Two or more Races (59 | 5.7%).
| Race | # Population | % Population |
| Asian | 0 | 0.0% |
| Black / African American | 0 | 0.0% |
| Hawaiian / Pacific | 0 | 0.0% |
| Hispanic or Latino | 0 | 0.0% |
| Native / Alaskan | 0 | 0.0% |
| White / Caucasian | 974 | 94.3% |
| Two or more Races | 59 | 5.7% |
| Some other Race | 0 | 0.0% |
| Total | 1,033 | 100.0% |
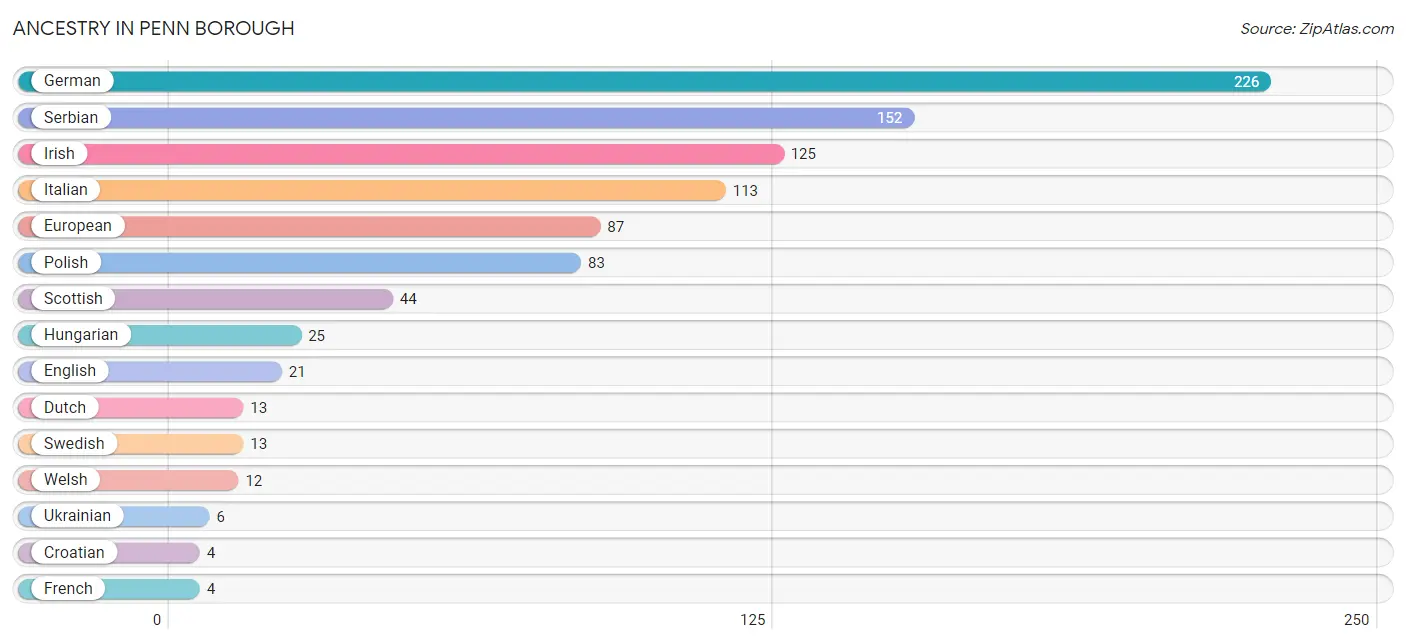
Ancestry in Penn borough
The most populous ancestries reported in Penn borough are German (226 | 21.9%), Serbian (152 | 14.7%), Irish (125 | 12.1%), Italian (113 | 10.9%), and European (87 | 8.4%), together accounting for 68.1% of all Penn borough residents.
| Ancestry | # Population | % Population |
| American | 2 | 0.2% |
| Arab | 2 | 0.2% |
| Croatian | 4 | 0.4% |
| Dutch | 13 | 1.3% |
| English | 21 | 2.0% |
| European | 87 | 8.4% |
| French | 4 | 0.4% |
| German | 226 | 21.9% |
| Hungarian | 25 | 2.4% |
| Irish | 125 | 12.1% |
| Italian | 113 | 10.9% |
| Lebanese | 2 | 0.2% |
| Lithuanian | 2 | 0.2% |
| Pennsylvania German | 1 | 0.1% |
| Polish | 83 | 8.0% |
| Scotch-Irish | 2 | 0.2% |
| Scottish | 44 | 4.3% |
| Serbian | 152 | 14.7% |
| Slovak | 4 | 0.4% |
| Swedish | 13 | 1.3% |
| Ukrainian | 6 | 0.6% |
| Welsh | 12 | 1.2% | View All 22 Rows |
Immigrants in Penn borough

| Immigration Origin | # Population | % Population | View All 0 Rows |
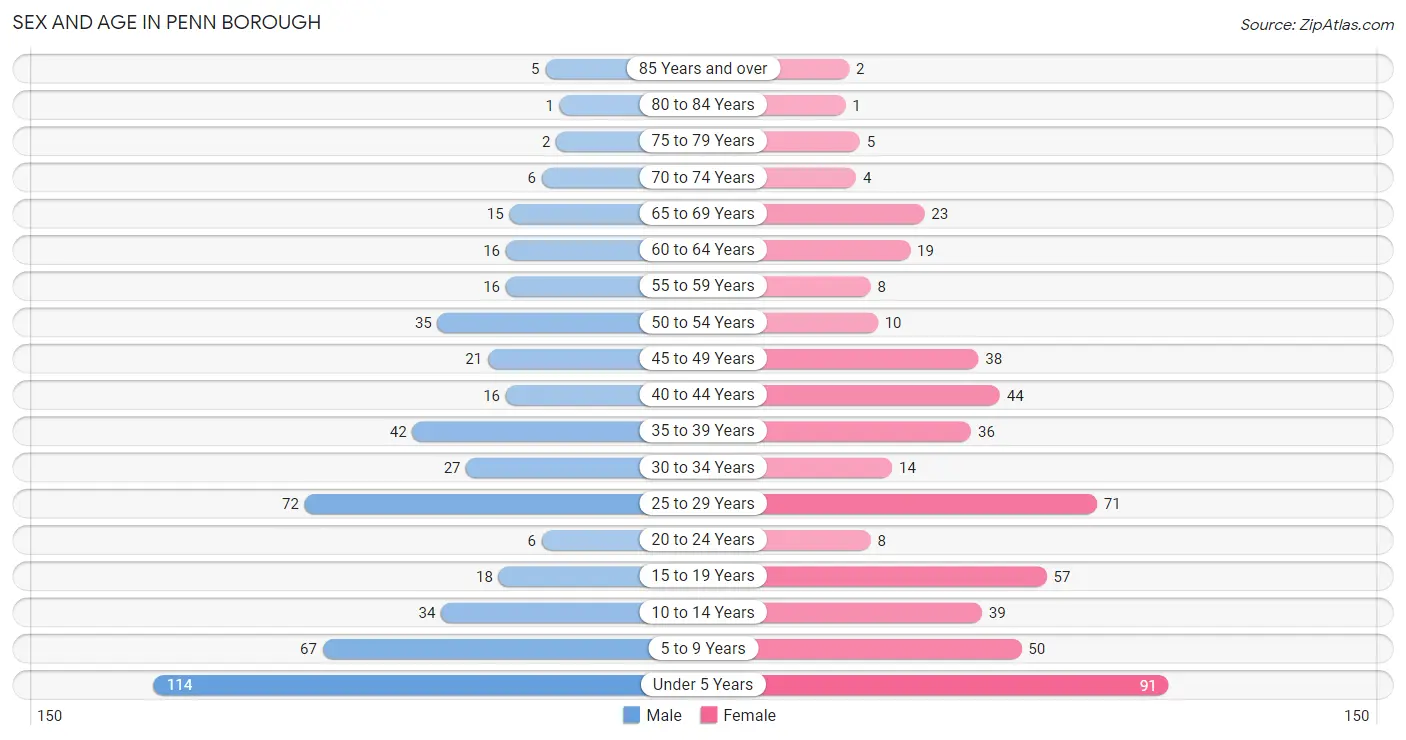
Sex and Age in Penn borough
Sex and Age in Penn borough
The most populous age groups in Penn borough are Under 5 Years (114 | 22.2%) for men and Under 5 Years (91 | 17.5%) for women.
| Age Bracket | Male | Female |
| Under 5 Years | 114 (22.2%) | 91 (17.5%) |
| 5 to 9 Years | 67 (13.1%) | 50 (9.6%) |
| 10 to 14 Years | 34 (6.6%) | 39 (7.5%) |
| 15 to 19 Years | 18 (3.5%) | 57 (11.0%) |
| 20 to 24 Years | 6 (1.2%) | 8 (1.5%) |
| 25 to 29 Years | 72 (14.0%) | 71 (13.7%) |
| 30 to 34 Years | 27 (5.3%) | 14 (2.7%) |
| 35 to 39 Years | 42 (8.2%) | 36 (6.9%) |
| 40 to 44 Years | 16 (3.1%) | 44 (8.5%) |
| 45 to 49 Years | 21 (4.1%) | 38 (7.3%) |
| 50 to 54 Years | 35 (6.8%) | 10 (1.9%) |
| 55 to 59 Years | 16 (3.1%) | 8 (1.5%) |
| 60 to 64 Years | 16 (3.1%) | 19 (3.6%) |
| 65 to 69 Years | 15 (2.9%) | 23 (4.4%) |
| 70 to 74 Years | 6 (1.2%) | 4 (0.8%) |
| 75 to 79 Years | 2 (0.4%) | 5 (1.0%) |
| 80 to 84 Years | 1 (0.2%) | 1 (0.2%) |
| 85 Years and over | 5 (1.0%) | 2 (0.4%) |
| Total | 513 (100.0%) | 520 (100.0%) |
Families and Households in Penn borough
Median Family Size in Penn borough
The median family size in Penn borough is 3.81 persons per family, with married-couple families (182 | 73.7%) accounting for the largest median family size of 4.06 persons per family. On the other hand, single male/father families (10 | 4.1%) represent the smallest median family size with 2.40 persons per family.
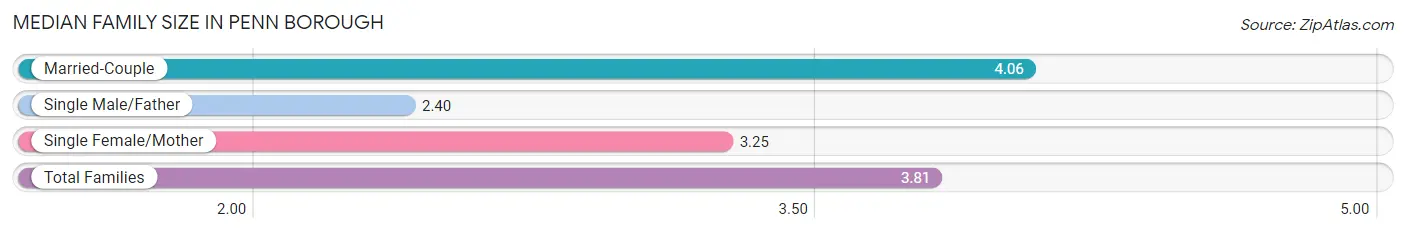
| Family Type | # Families | Family Size |
| Married-Couple | 182 (73.7%) | 4.06 |
| Single Male/Father | 10 (4.1%) | 2.40 |
| Single Female/Mother | 55 (22.3%) | 3.25 |
| Total Families | 247 (100.0%) | 3.81 |
Median Household Size in Penn borough
The median household size in Penn borough is 3.19 persons per household, with married-couple households (182 | 56.2%) accounting for the largest median household size of 4.06 persons per household. non-family households (77 | 23.8%) represent the smallest median household size with 1.06 persons per household.
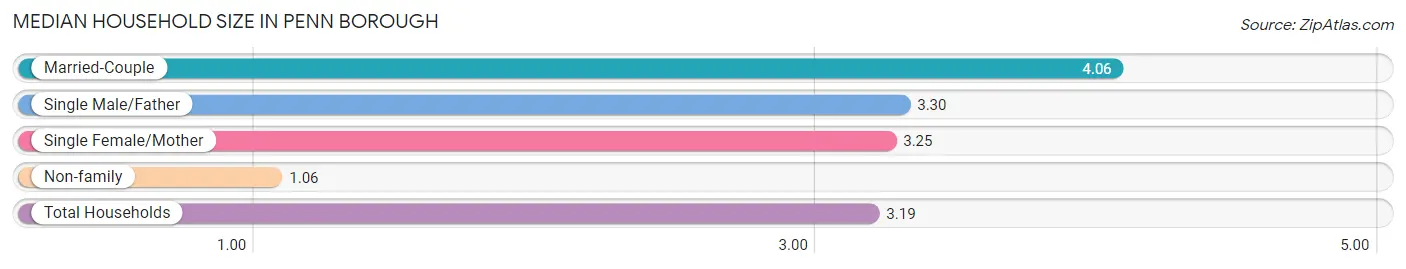
| Household Type | # Households | Household Size |
| Married-Couple | 182 (56.2%) | 4.06 |
| Single Male/Father | 10 (3.1%) | 3.30 |
| Single Female/Mother | 55 (17.0%) | 3.25 |
| Non-family | 77 (23.8%) | 1.06 |
| Total Households | 324 (100.0%) | 3.19 |
Household Size by Marriage Status in Penn borough
Out of a total of 324 households in Penn borough, 247 (76.2%) are family households, while 77 (23.8%) are nonfamily households. The most numerous type of family households are 4-person households, comprising 91, and the most common type of nonfamily households are 1-person households, comprising 70.
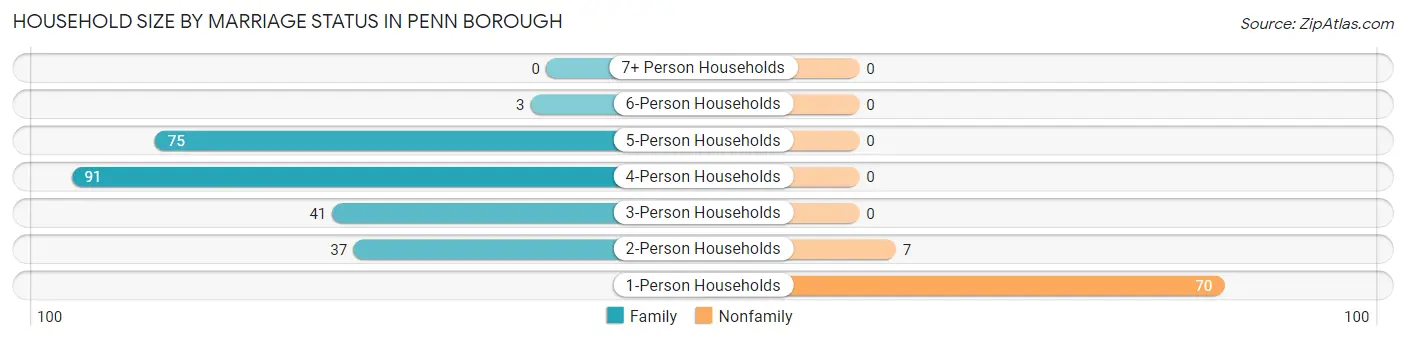
| Household Size | Family Households | Nonfamily Households |
| 1-Person Households | - | 70 (21.6%) |
| 2-Person Households | 37 (11.4%) | 7 (2.2%) |
| 3-Person Households | 41 (12.7%) | 0 (0.0%) |
| 4-Person Households | 91 (28.1%) | 0 (0.0%) |
| 5-Person Households | 75 (23.2%) | 0 (0.0%) |
| 6-Person Households | 3 (0.9%) | 0 (0.0%) |
| 7+ Person Households | 0 (0.0%) | 0 (0.0%) |
| Total | 247 (76.2%) | 77 (23.8%) |
Female Fertility in Penn borough
Fertility by Age in Penn borough
Average fertility rate in Penn borough is 48.0 births per 1,000 women. Women in the age bracket of 20 to 34 years have the highest fertility rate with 65.0 births per 1,000 women. Women in the age bracket of 35 to 50 years acount for 53.8% of all women with births.
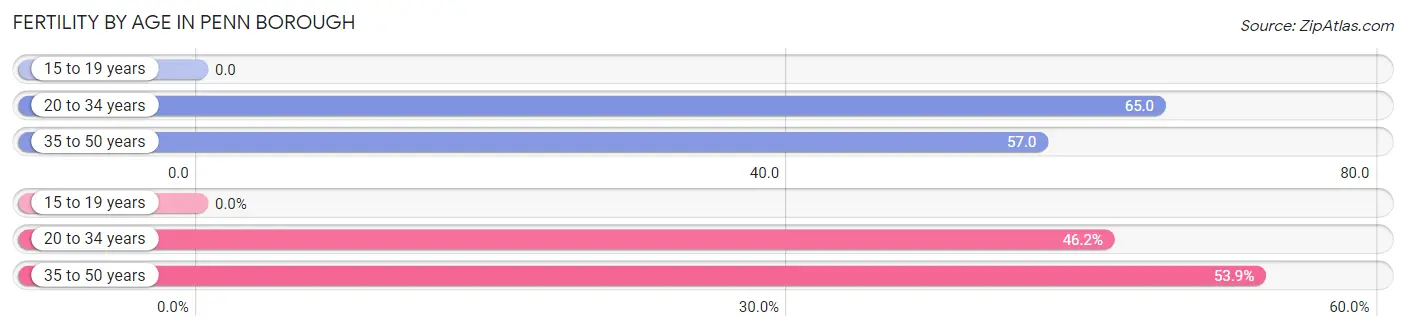
| Age Bracket | Women with Births | Births / 1,000 Women |
| 15 to 19 years | 0 (0.0%) | 0.0 |
| 20 to 34 years | 6 (46.2%) | 65.0 |
| 35 to 50 years | 7 (53.8%) | 57.0 |
| Total | 13 (100.0%) | 48.0 |
Fertility by Age by Marriage Status in Penn borough
61.5% of women with births (13) in Penn borough are married. The highest percentage of unmarried women with births falls into 20 to 34 years age bracket with 50.0% of them unmarried at the time of birth, while the lowest percentage of unmarried women with births belong to 35 to 50 years age bracket with 28.6% of them unmarried.
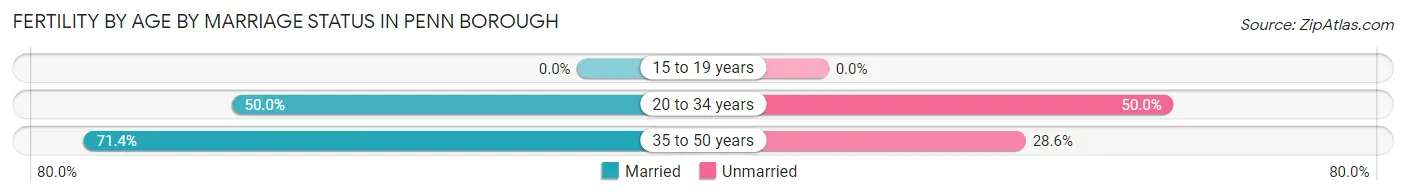
| Age Bracket | Married | Unmarried |
| 15 to 19 years | 0 (0.0%) | 0 (0.0%) |
| 20 to 34 years | 3 (50.0%) | 3 (50.0%) |
| 35 to 50 years | 5 (71.4%) | 2 (28.6%) |
| Total | 8 (61.5%) | 5 (38.5%) |
Fertility by Education in Penn borough
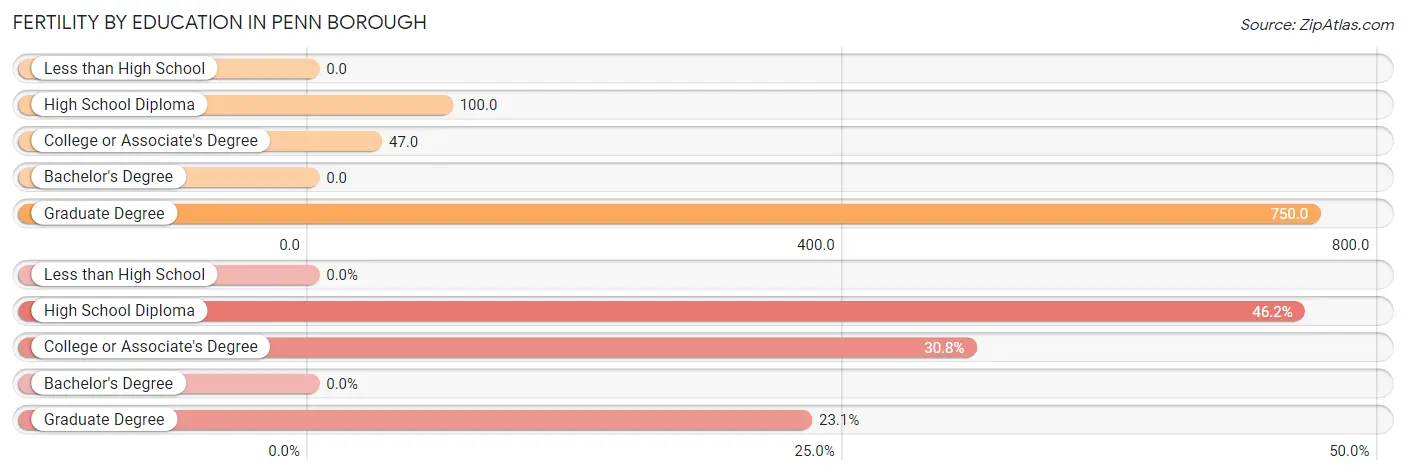
| Educational Attainment | Women with Births | Births / 1,000 Women |
| Less than High School | 0 (0.0%) | 0.0 |
| High School Diploma | 6 (46.2%) | 100.0 |
| College or Associate's Degree | 4 (30.8%) | 47.0 |
| Bachelor's Degree | 0 (0.0%) | 0.0 |
| Graduate Degree | 3 (23.1%) | 750.0 |
| Total | 13 (100.0%) | 48.0 |
Fertility by Education by Marriage Status in Penn borough
38.5% of women with births in Penn borough are unmarried. Women with the educational attainment of college or associate's degree are most likely to be married with 100.0% of them married at childbirth, while women with the educational attainment of high school diploma are least likely to be married with 83.3% of them unmarried at childbirth.
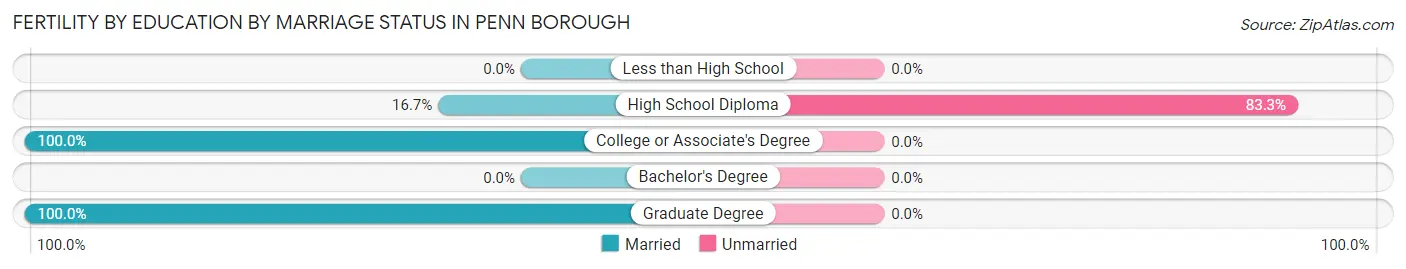
| Educational Attainment | Married | Unmarried |
| Less than High School | 0 (0.0%) | 0 (0.0%) |
| High School Diploma | 1 (16.7%) | 5 (83.3%) |
| College or Associate's Degree | 4 (100.0%) | 0 (0.0%) |
| Bachelor's Degree | 0 (0.0%) | 0 (0.0%) |
| Graduate Degree | 3 (100.0%) | 0 (0.0%) |
| Total | 8 (61.5%) | 5 (38.5%) |
Employment Characteristics in Penn borough
Employment by Class of Employer in Penn borough
Among the 398 employed individuals in Penn borough, private company employees (289 | 72.6%), not-for-profit organizations (76 | 19.1%), and state government employees (12 | 3.0%) make up the most common classes of employment.
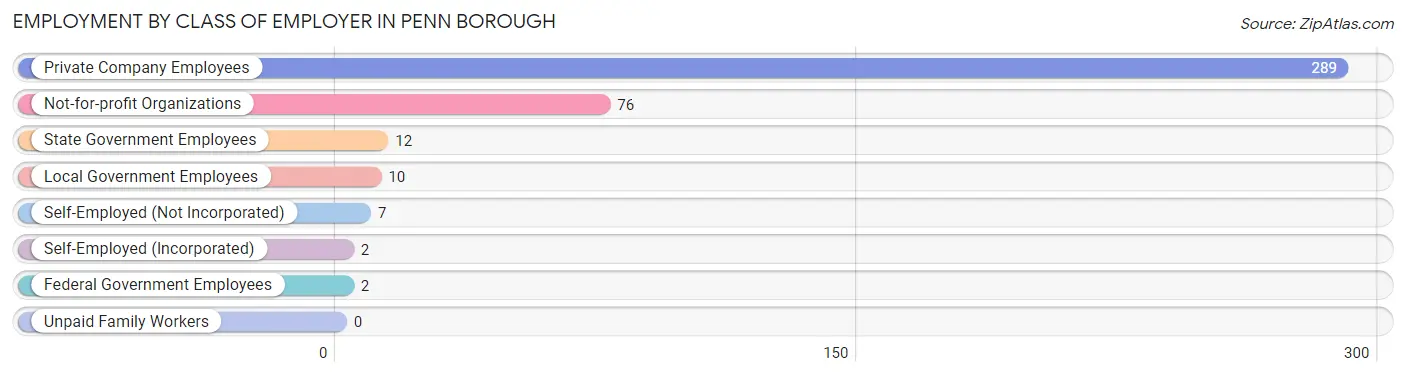
| Employer Class | # Employees | % Employees |
| Private Company Employees | 289 | 72.6% |
| Self-Employed (Incorporated) | 2 | 0.5% |
| Self-Employed (Not Incorporated) | 7 | 1.8% |
| Not-for-profit Organizations | 76 | 19.1% |
| Local Government Employees | 10 | 2.5% |
| State Government Employees | 12 | 3.0% |
| Federal Government Employees | 2 | 0.5% |
| Unpaid Family Workers | 0 | 0.0% |
| Total | 398 | 100.0% |
Employment Status by Age in Penn borough
According to the labor force statistics for Penn borough, out of the total population over 16 years of age (625), 66.1% or 413 individuals are in the labor force, with 2.7% or 11 of them unemployed. The age group with the highest labor force participation rate is 30 to 34 years, with 100.0% or 41 individuals in the labor force. Within the labor force, the 60 to 64 years age range has the highest percentage of unemployed individuals, with 8.0% or 2 of them being unemployed.
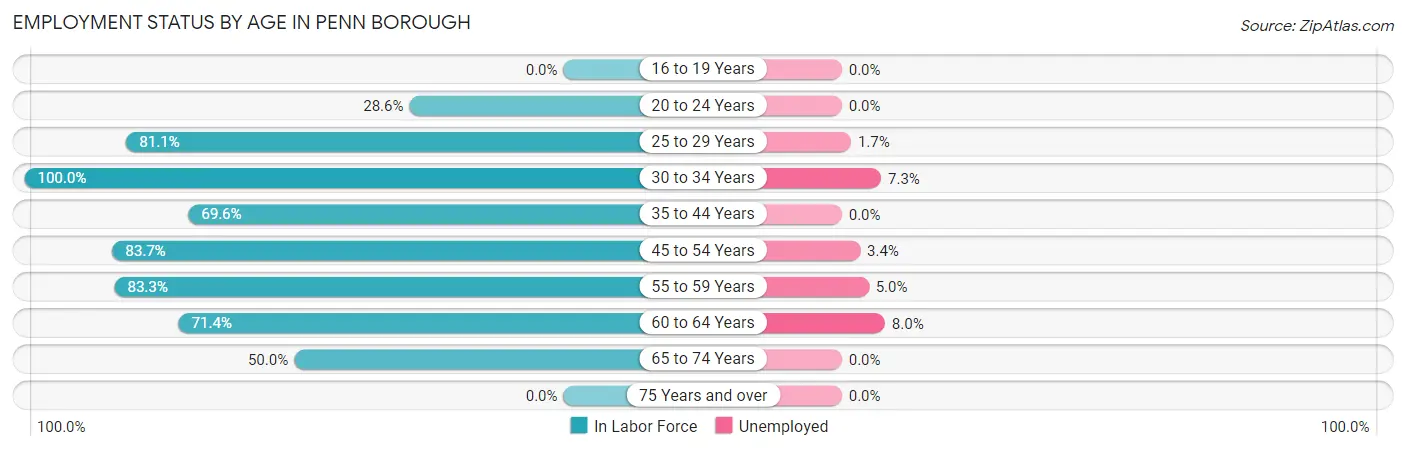
| Age Bracket | In Labor Force | Unemployed |
| 16 to 19 Years | 0 (0.0%) | 0 (0.0%) |
| 20 to 24 Years | 4 (28.6%) | 0 (0.0%) |
| 25 to 29 Years | 116 (81.1%) | 2 (1.7%) |
| 30 to 34 Years | 41 (100.0%) | 3 (7.3%) |
| 35 to 44 Years | 96 (69.6%) | 0 (0.0%) |
| 45 to 54 Years | 87 (83.7%) | 3 (3.4%) |
| 55 to 59 Years | 20 (83.3%) | 1 (5.0%) |
| 60 to 64 Years | 25 (71.4%) | 2 (8.0%) |
| 65 to 74 Years | 24 (50.0%) | 0 (0.0%) |
| 75 Years and over | 0 (0.0%) | 0 (0.0%) |
| Total | 413 (66.1%) | 11 (2.7%) |
Employment Status by Educational Attainment in Penn borough
According to labor force statistics for Penn borough, 79.4% of individuals (385) out of the total population between 25 and 64 years of age (485) are in the labor force, with 2.9% or 11 of them being unemployed. The group with the highest labor force participation rate are those with the educational attainment of bachelor's degree or higher, with 87.3% or 96 individuals in the labor force. Within the labor force, individuals with less than high school education have the highest percentage of unemployment, with 22.2% or 2 of them being unemployed.
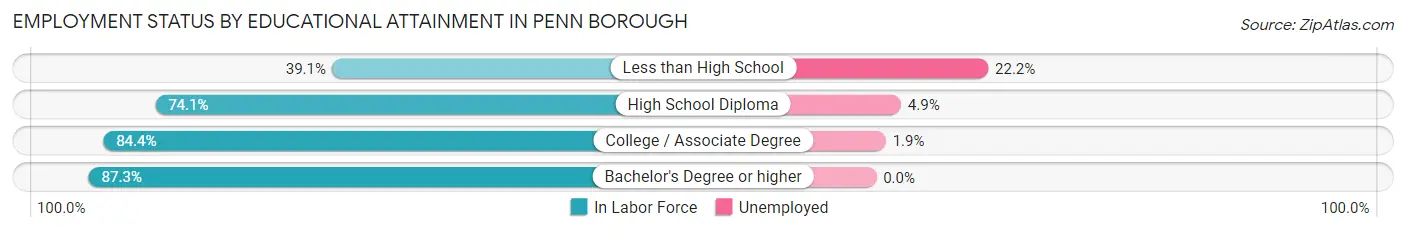
| Educational Attainment | In Labor Force | Unemployed |
| Less than High School | 9 (39.1%) | 5 (22.2%) |
| High School Diploma | 123 (74.1%) | 8 (4.9%) |
| College / Associate Degree | 157 (84.4%) | 4 (1.9%) |
| Bachelor's Degree or higher | 96 (87.3%) | 0 (0.0%) |
| Total | 385 (79.4%) | 14 (2.9%) |
Employment Occupations by Sex in Penn borough
Management, Business, Science and Arts Occupations
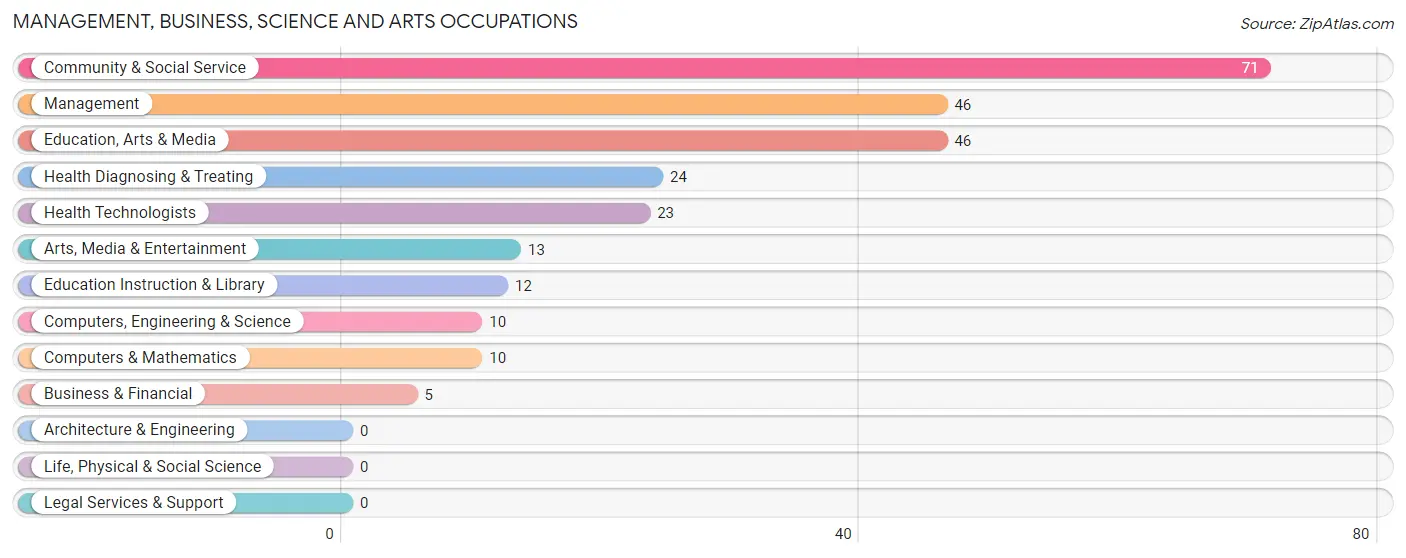
The most common Management, Business, Science and Arts occupations in Penn borough are Community & Social Service (71 | 17.7%), Management (46 | 11.4%), Education, Arts & Media (46 | 11.4%), Health Diagnosing & Treating (24 | 6.0%), and Health Technologists (23 | 5.7%).
Management, Business, Science and Arts Occupations by Sex
Within the Management, Business, Science and Arts occupations in Penn borough, the most male-oriented occupations are Management (78.3%), Business & Financial (60.0%), and Education, Arts & Media (23.9%), while the most female-oriented occupations are Education Instruction & Library (100.0%), Arts, Media & Entertainment (100.0%), and Health Technologists (100.0%).
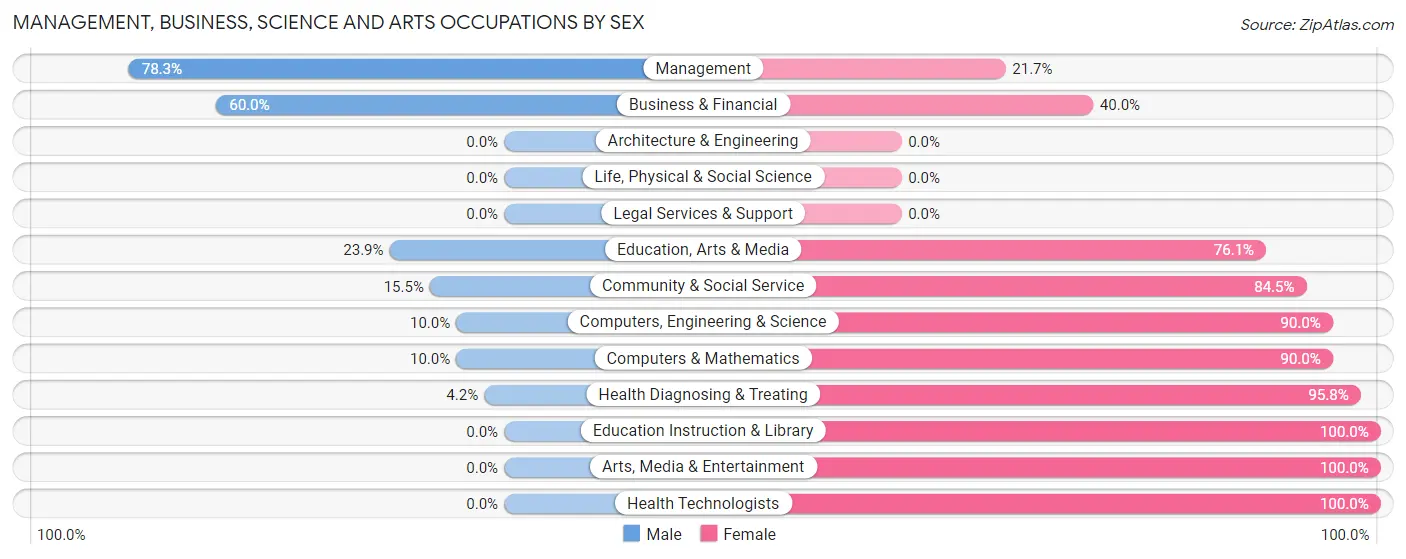
| Occupation | Male | Female |
| Management | 36 (78.3%) | 10 (21.7%) |
| Business & Financial | 3 (60.0%) | 2 (40.0%) |
| Computers, Engineering & Science | 1 (10.0%) | 9 (90.0%) |
| Computers & Mathematics | 1 (10.0%) | 9 (90.0%) |
| Architecture & Engineering | 0 (0.0%) | 0 (0.0%) |
| Life, Physical & Social Science | 0 (0.0%) | 0 (0.0%) |
| Community & Social Service | 11 (15.5%) | 60 (84.5%) |
| Education, Arts & Media | 11 (23.9%) | 35 (76.1%) |
| Legal Services & Support | 0 (0.0%) | 0 (0.0%) |
| Education Instruction & Library | 0 (0.0%) | 12 (100.0%) |
| Arts, Media & Entertainment | 0 (0.0%) | 13 (100.0%) |
| Health Diagnosing & Treating | 1 (4.2%) | 23 (95.8%) |
| Health Technologists | 0 (0.0%) | 23 (100.0%) |
| Total (Category) | 52 (33.3%) | 104 (66.7%) |
| Total (Overall) | 210 (52.2%) | 192 (47.8%) |
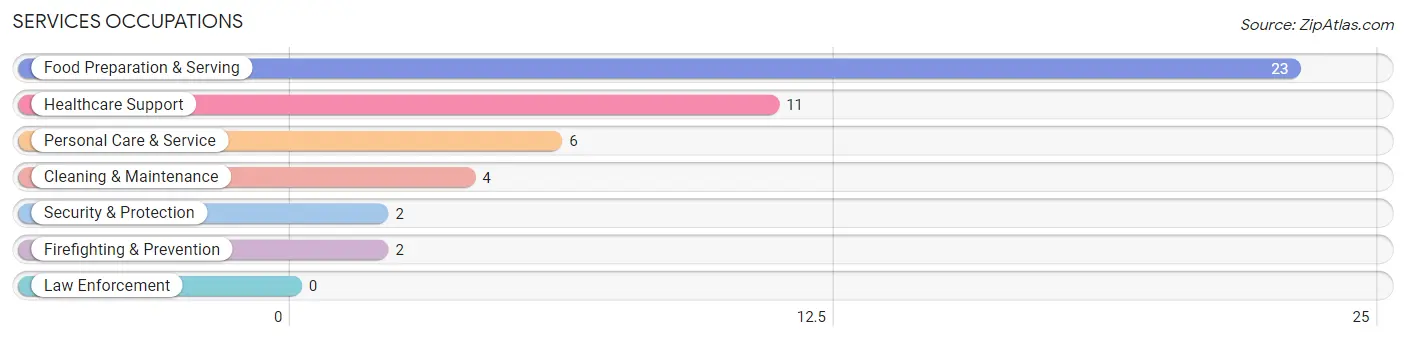
Services Occupations
The most common Services occupations in Penn borough are Food Preparation & Serving (23 | 5.7%), Healthcare Support (11 | 2.7%), Personal Care & Service (6 | 1.5%), Cleaning & Maintenance (4 | 1.0%), and Security & Protection (2 | 0.5%).
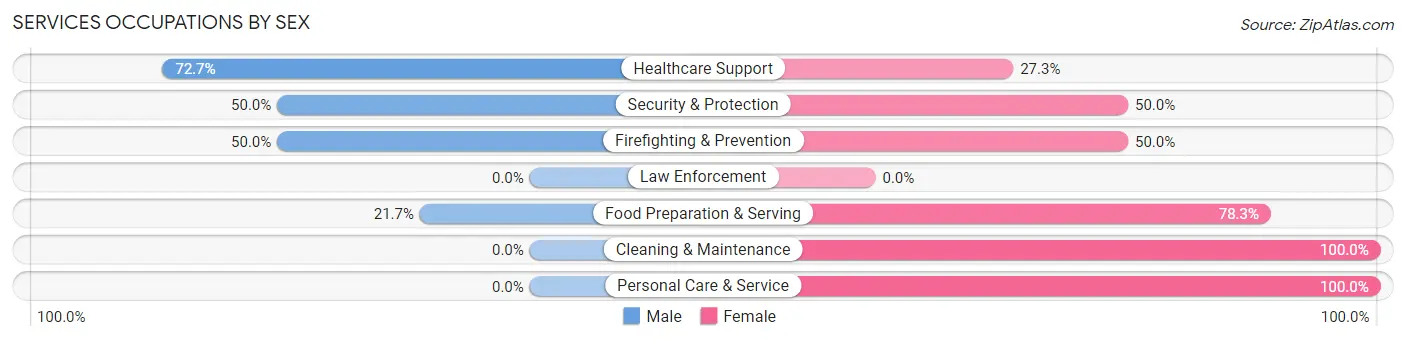
Services Occupations by Sex
Within the Services occupations in Penn borough, the most male-oriented occupations are Healthcare Support (72.7%), Security & Protection (50.0%), and Firefighting & Prevention (50.0%), while the most female-oriented occupations are Cleaning & Maintenance (100.0%), Personal Care & Service (100.0%), and Food Preparation & Serving (78.3%).
| Occupation | Male | Female |
| Healthcare Support | 8 (72.7%) | 3 (27.3%) |
| Security & Protection | 1 (50.0%) | 1 (50.0%) |
| Firefighting & Prevention | 1 (50.0%) | 1 (50.0%) |
| Law Enforcement | 0 (0.0%) | 0 (0.0%) |
| Food Preparation & Serving | 5 (21.7%) | 18 (78.3%) |
| Cleaning & Maintenance | 0 (0.0%) | 4 (100.0%) |
| Personal Care & Service | 0 (0.0%) | 6 (100.0%) |
| Total (Category) | 14 (30.4%) | 32 (69.6%) |
| Total (Overall) | 210 (52.2%) | 192 (47.8%) |
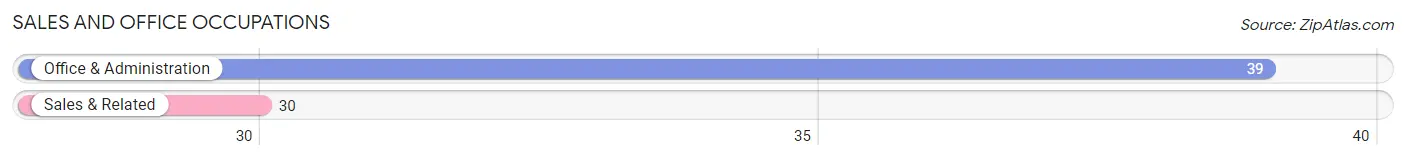
Sales and Office Occupations
The most common Sales and Office occupations in Penn borough are Office & Administration (39 | 9.7%), and Sales & Related (30 | 7.5%).
Sales and Office Occupations by Sex

| Occupation | Male | Female |
| Sales & Related | 11 (36.7%) | 19 (63.3%) |
| Office & Administration | 7 (17.9%) | 32 (82.1%) |
| Total (Category) | 18 (26.1%) | 51 (73.9%) |
| Total (Overall) | 210 (52.2%) | 192 (47.8%) |
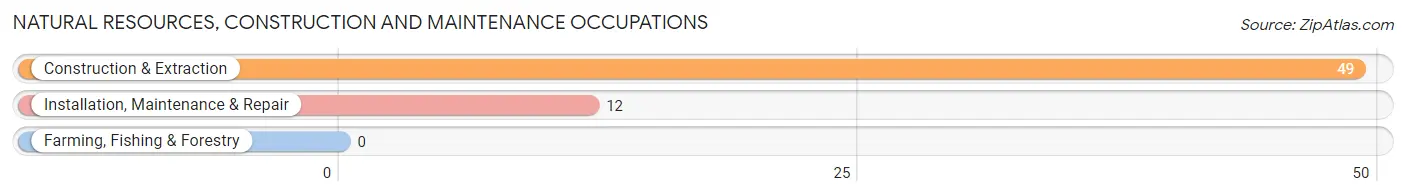
Natural Resources, Construction and Maintenance Occupations
The most common Natural Resources, Construction and Maintenance occupations in Penn borough are Construction & Extraction (49 | 12.2%), and Installation, Maintenance & Repair (12 | 3.0%).
Natural Resources, Construction and Maintenance Occupations by Sex
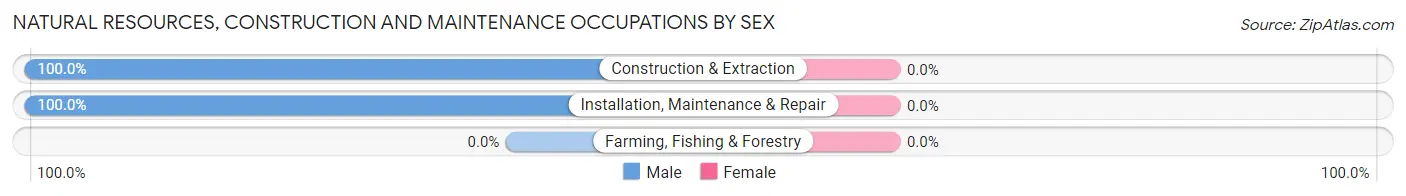
| Occupation | Male | Female |
| Farming, Fishing & Forestry | 0 (0.0%) | 0 (0.0%) |
| Construction & Extraction | 49 (100.0%) | 0 (0.0%) |
| Installation, Maintenance & Repair | 12 (100.0%) | 0 (0.0%) |
| Total (Category) | 61 (100.0%) | 0 (0.0%) |
| Total (Overall) | 210 (52.2%) | 192 (47.8%) |
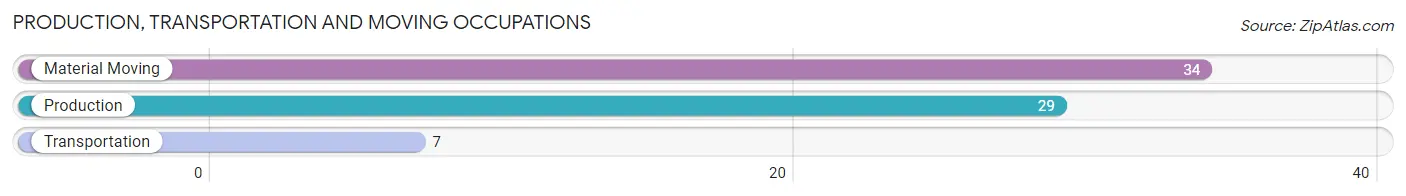
Production, Transportation and Moving Occupations
The most common Production, Transportation and Moving occupations in Penn borough are Material Moving (34 | 8.5%), Production (29 | 7.2%), and Transportation (7 | 1.7%).
Production, Transportation and Moving Occupations by Sex
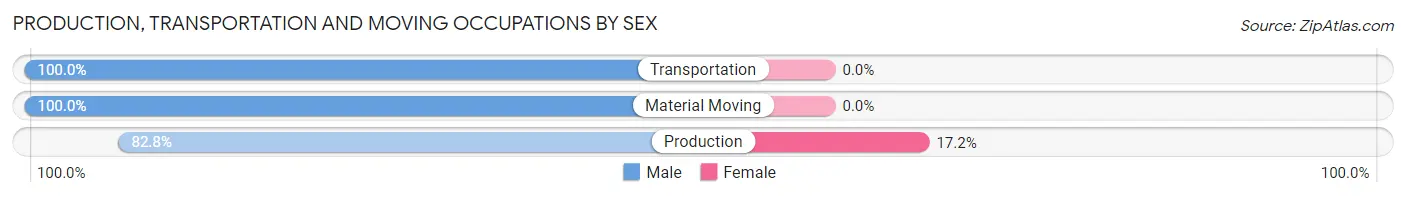
| Occupation | Male | Female |
| Production | 24 (82.8%) | 5 (17.2%) |
| Transportation | 7 (100.0%) | 0 (0.0%) |
| Material Moving | 34 (100.0%) | 0 (0.0%) |
| Total (Category) | 65 (92.9%) | 5 (7.1%) |
| Total (Overall) | 210 (52.2%) | 192 (47.8%) |
Employment Industries by Sex in Penn borough
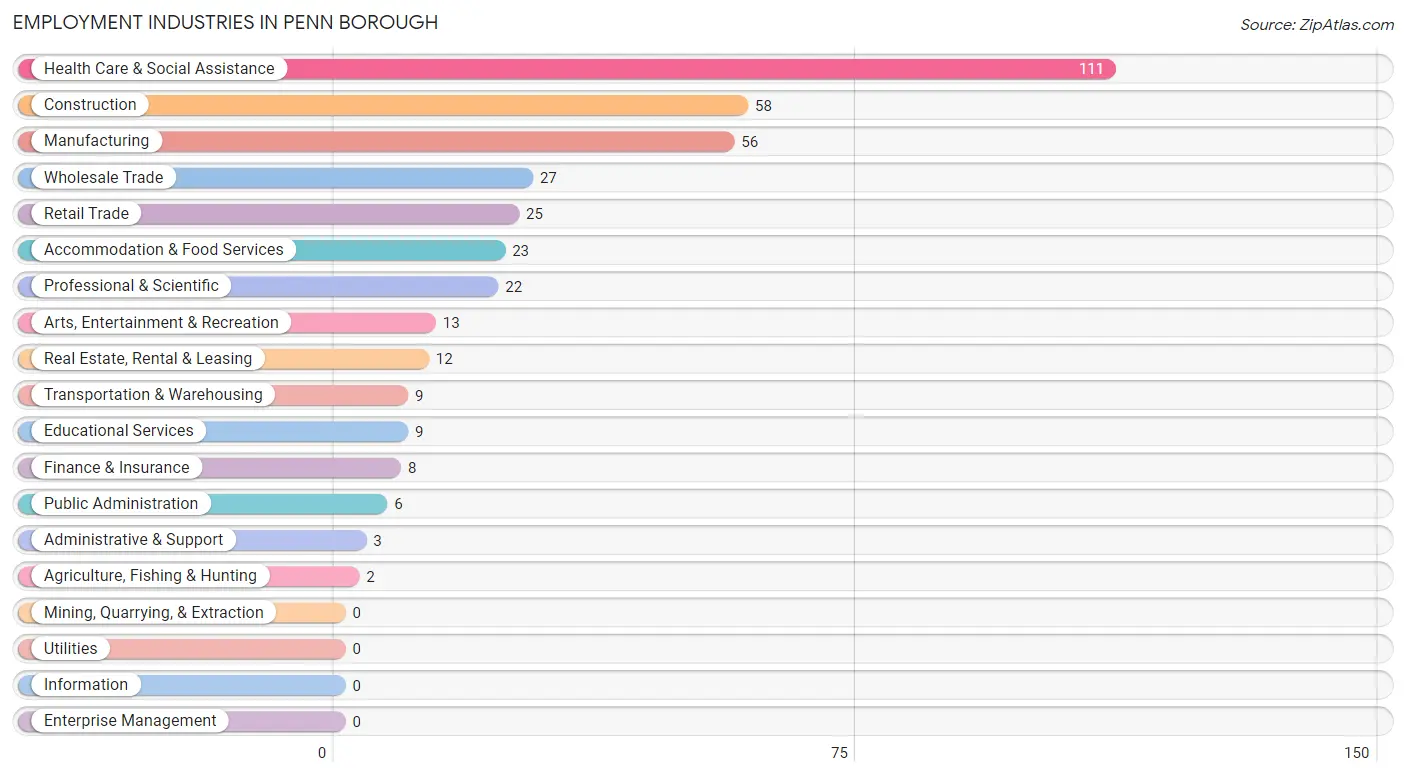
Employment Industries in Penn borough
The major employment industries in Penn borough include Health Care & Social Assistance (111 | 27.6%), Construction (58 | 14.4%), Manufacturing (56 | 13.9%), Wholesale Trade (27 | 6.7%), and Retail Trade (25 | 6.2%).
Employment Industries by Sex in Penn borough
The Penn borough industries that see more men than women are Agriculture, Fishing & Hunting (100.0%), Construction (100.0%), and Wholesale Trade (100.0%), whereas the industries that tend to have a higher number of women are Finance & Insurance (100.0%), Administrative & Support (100.0%), and Educational Services (100.0%).
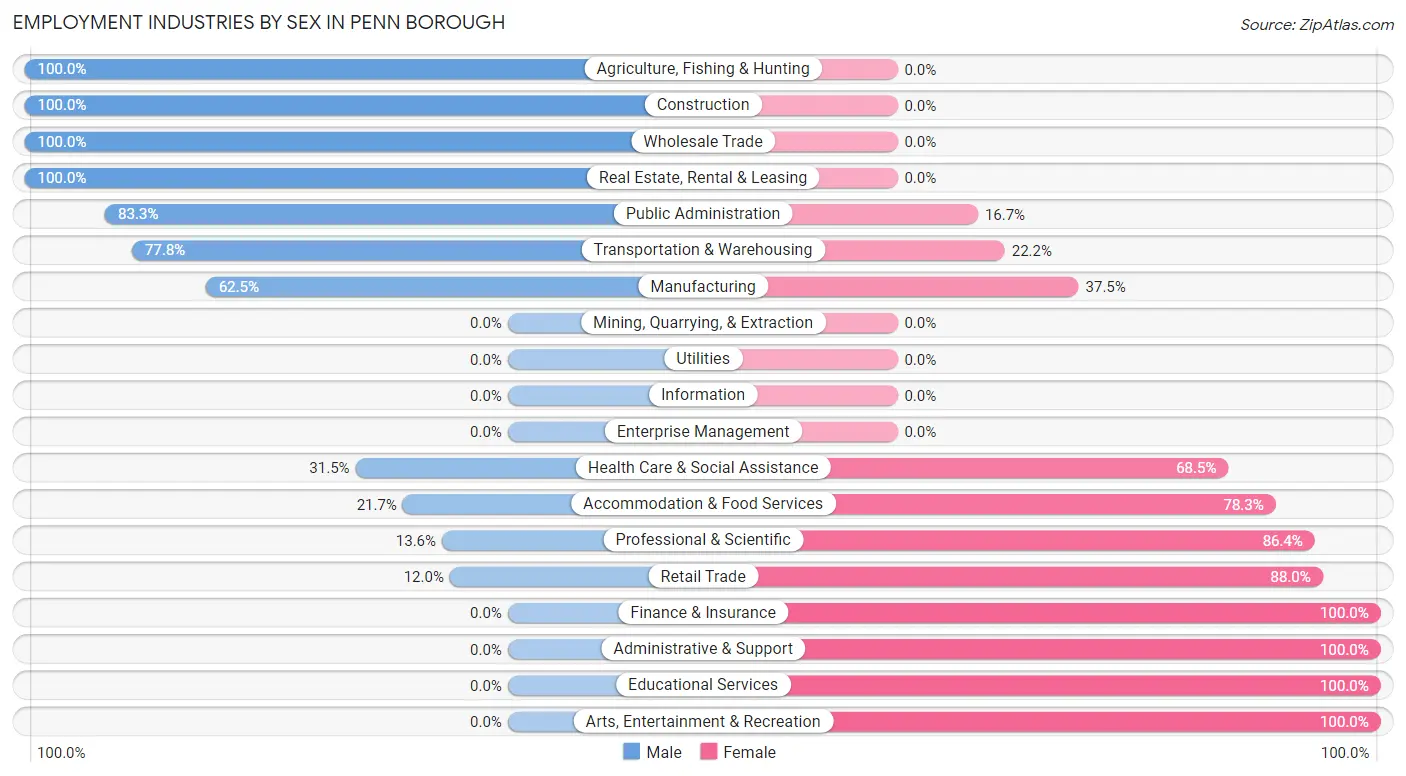
| Industry | Male | Female |
| Agriculture, Fishing & Hunting | 2 (100.0%) | 0 (0.0%) |
| Mining, Quarrying, & Extraction | 0 (0.0%) | 0 (0.0%) |
| Construction | 58 (100.0%) | 0 (0.0%) |
| Manufacturing | 35 (62.5%) | 21 (37.5%) |
| Wholesale Trade | 27 (100.0%) | 0 (0.0%) |
| Retail Trade | 3 (12.0%) | 22 (88.0%) |
| Transportation & Warehousing | 7 (77.8%) | 2 (22.2%) |
| Utilities | 0 (0.0%) | 0 (0.0%) |
| Information | 0 (0.0%) | 0 (0.0%) |
| Finance & Insurance | 0 (0.0%) | 8 (100.0%) |
| Real Estate, Rental & Leasing | 12 (100.0%) | 0 (0.0%) |
| Professional & Scientific | 3 (13.6%) | 19 (86.4%) |
| Enterprise Management | 0 (0.0%) | 0 (0.0%) |
| Administrative & Support | 0 (0.0%) | 3 (100.0%) |
| Educational Services | 0 (0.0%) | 9 (100.0%) |
| Health Care & Social Assistance | 35 (31.5%) | 76 (68.5%) |
| Arts, Entertainment & Recreation | 0 (0.0%) | 13 (100.0%) |
| Accommodation & Food Services | 5 (21.7%) | 18 (78.3%) |
| Public Administration | 5 (83.3%) | 1 (16.7%) |
| Total | 210 (52.2%) | 192 (47.8%) |
Education in Penn borough
School Enrollment in Penn borough
The most common levels of schooling among the 312 students in Penn borough are elementary school (95 | 30.4%), nursery / preschool (70 | 22.4%), and high school (53 | 17.0%).
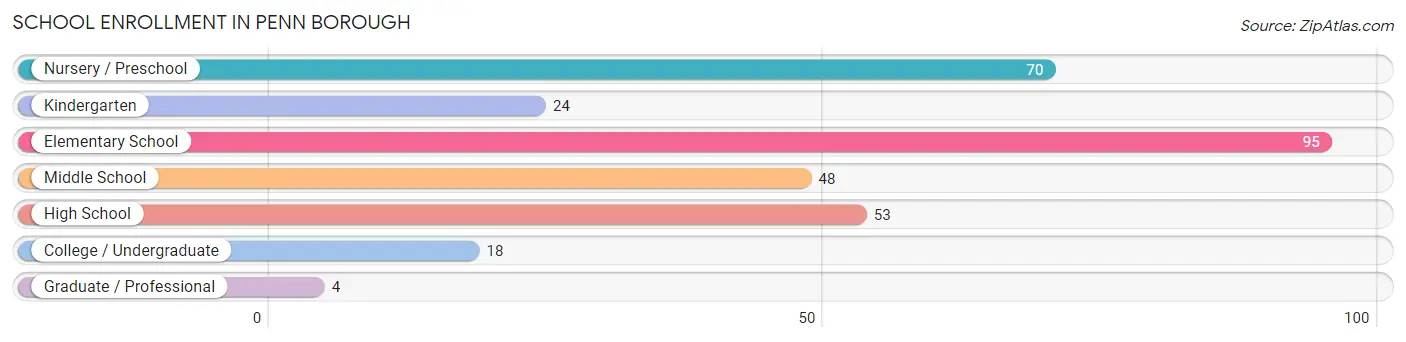
| School Level | # Students | % Students |
| Nursery / Preschool | 70 | 22.4% |
| Kindergarten | 24 | 7.7% |
| Elementary School | 95 | 30.4% |
| Middle School | 48 | 15.4% |
| High School | 53 | 17.0% |
| College / Undergraduate | 18 | 5.8% |
| Graduate / Professional | 4 | 1.3% |
| Total | 312 | 100.0% |
School Enrollment by Age by Funding Source in Penn borough
Out of a total of 312 students who are enrolled in schools in Penn borough, 36 (11.5%) attend a private institution, while the remaining 276 (88.5%) are enrolled in public schools. The age group of 20 to 24 year olds has the highest likelihood of being enrolled in private schools, with 3 (100.0% in the age bracket) enrolled. Conversely, the age group of 3 to 4 year olds has the lowest likelihood of being enrolled in a private school, with 47 (100.0% in the age bracket) attending a public institution.
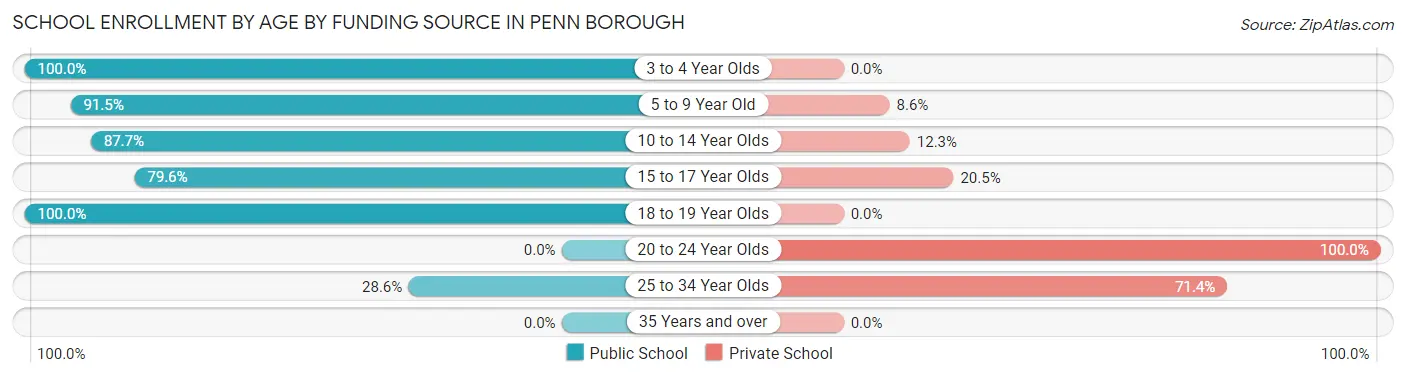
| Age Bracket | Public School | Private School |
| 3 to 4 Year Olds | 47 (100.0%) | 0 (0.0%) |
| 5 to 9 Year Old | 107 (91.4%) | 10 (8.6%) |
| 10 to 14 Year Olds | 64 (87.7%) | 9 (12.3%) |
| 15 to 17 Year Olds | 35 (79.5%) | 9 (20.4%) |
| 18 to 19 Year Olds | 21 (100.0%) | 0 (0.0%) |
| 20 to 24 Year Olds | 0 (0.0%) | 3 (100.0%) |
| 25 to 34 Year Olds | 2 (28.6%) | 5 (71.4%) |
| 35 Years and over | 0 (0.0%) | 0 (0.0%) |
| Total | 276 (88.5%) | 36 (11.5%) |
Educational Attainment by Field of Study in Penn borough
Liberal arts & history (32 | 19.5%), psychology (27 | 16.5%), science & technology (23 | 14.0%), arts & humanities (21 | 12.8%), and social sciences (17 | 10.4%) are the most common fields of study among 164 individuals in Penn borough who have obtained a bachelor's degree or higher.
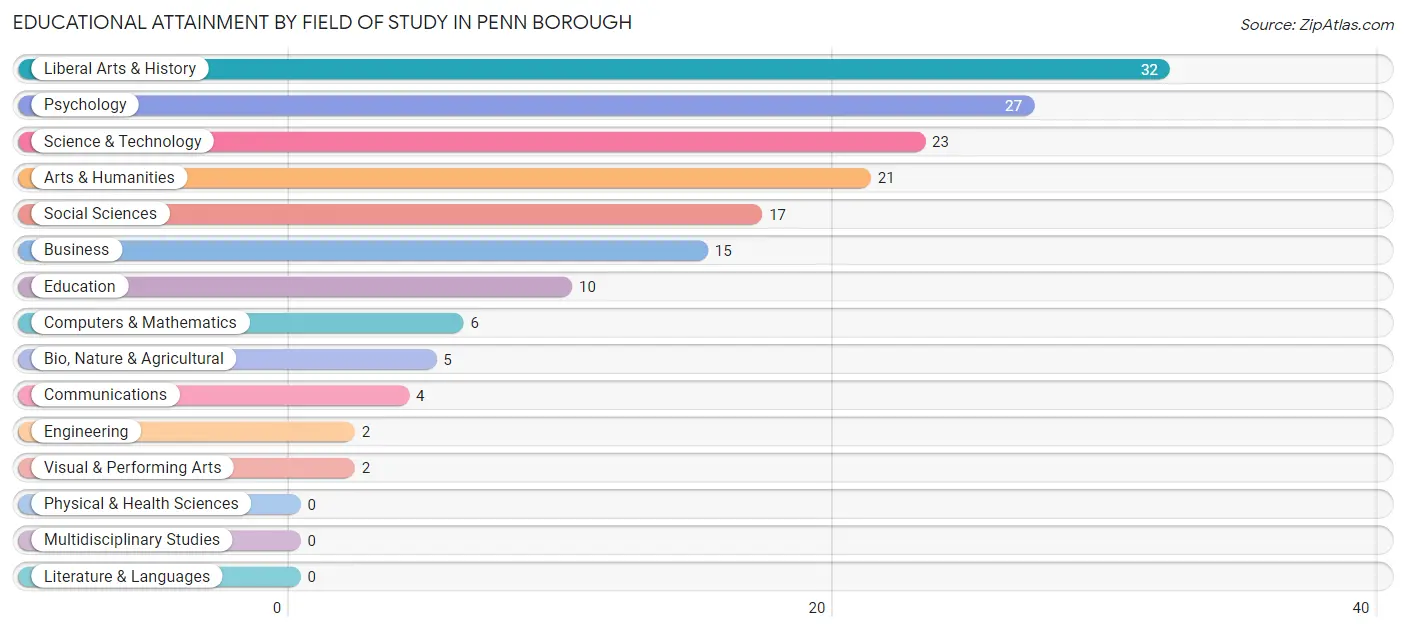
| Field of Study | # Graduates | % Graduates |
| Computers & Mathematics | 6 | 3.7% |
| Bio, Nature & Agricultural | 5 | 3.0% |
| Physical & Health Sciences | 0 | 0.0% |
| Psychology | 27 | 16.5% |
| Social Sciences | 17 | 10.4% |
| Engineering | 2 | 1.2% |
| Multidisciplinary Studies | 0 | 0.0% |
| Science & Technology | 23 | 14.0% |
| Business | 15 | 9.1% |
| Education | 10 | 6.1% |
| Literature & Languages | 0 | 0.0% |
| Liberal Arts & History | 32 | 19.5% |
| Visual & Performing Arts | 2 | 1.2% |
| Communications | 4 | 2.4% |
| Arts & Humanities | 21 | 12.8% |
| Total | 164 | 100.0% |
Transportation & Commute in Penn borough
Vehicle Availability by Sex in Penn borough
The most prevalent vehicle ownership categories in Penn borough are males with 2 vehicles (108, accounting for 51.4%) and females with 2 vehicles (113, making up 57.5%).
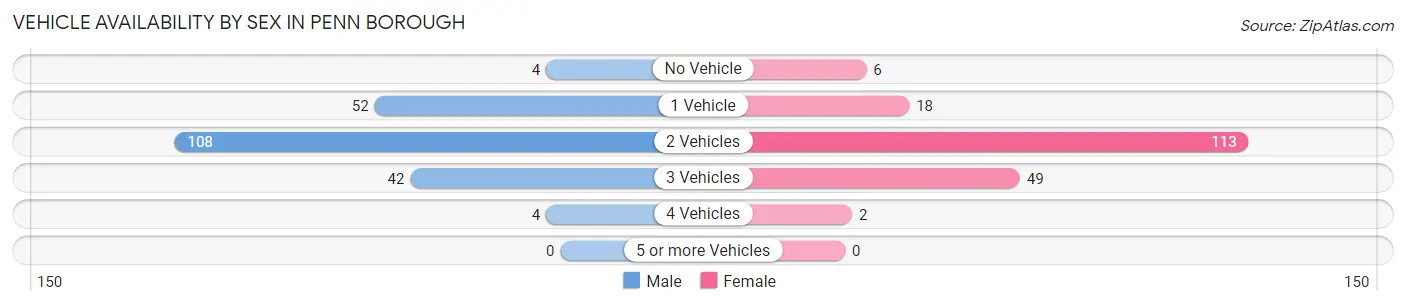
| Vehicles Available | Male | Female |
| No Vehicle | 4 (1.9%) | 6 (3.2%) |
| 1 Vehicle | 52 (24.8%) | 18 (9.6%) |
| 2 Vehicles | 108 (51.4%) | 113 (60.1%) |
| 3 Vehicles | 42 (20.0%) | 49 (26.1%) |
| 4 Vehicles | 4 (1.9%) | 2 (1.1%) |
| 5 or more Vehicles | 0 (0.0%) | 0 (0.0%) |
| Total | 210 (100.0%) | 188 (100.0%) |
Commute Time in Penn borough
The most frequently occuring commute durations in Penn borough are 45 to 59 minutes (102 commuters, 27.7%), 10 to 14 minutes (82 commuters, 22.3%), and 15 to 19 minutes (79 commuters, 21.5%).
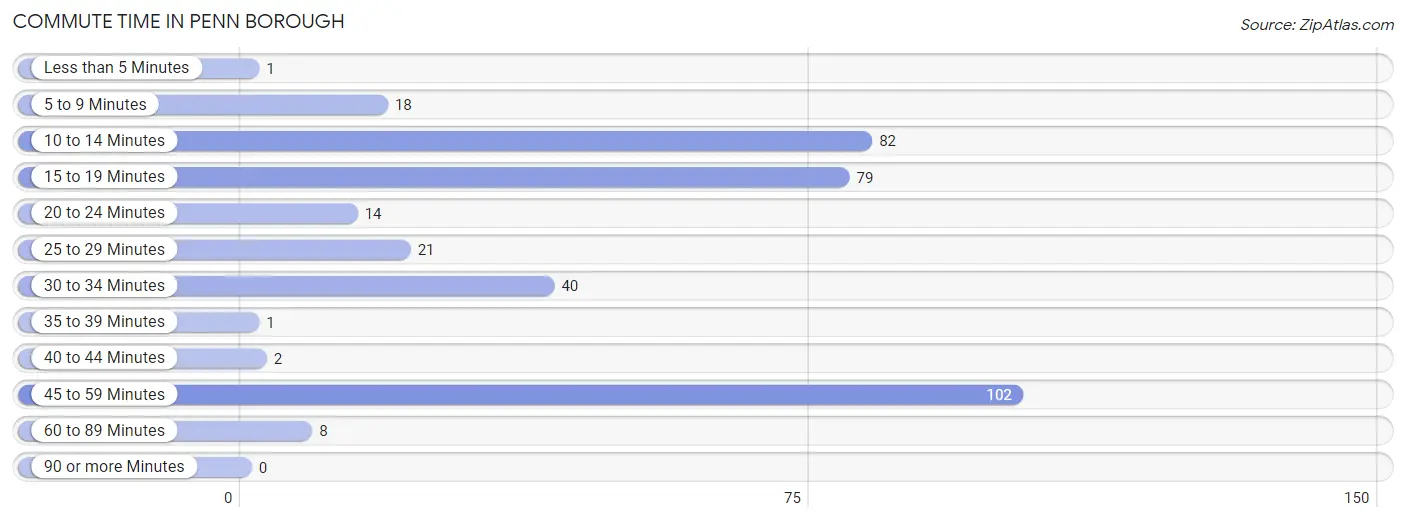
| Commute Time | # Commuters | % Commuters |
| Less than 5 Minutes | 1 | 0.3% |
| 5 to 9 Minutes | 18 | 4.9% |
| 10 to 14 Minutes | 82 | 22.3% |
| 15 to 19 Minutes | 79 | 21.5% |
| 20 to 24 Minutes | 14 | 3.8% |
| 25 to 29 Minutes | 21 | 5.7% |
| 30 to 34 Minutes | 40 | 10.9% |
| 35 to 39 Minutes | 1 | 0.3% |
| 40 to 44 Minutes | 2 | 0.5% |
| 45 to 59 Minutes | 102 | 27.7% |
| 60 to 89 Minutes | 8 | 2.2% |
| 90 or more Minutes | 0 | 0.0% |
Commute Time by Sex in Penn borough
The most common commute times in Penn borough are 45 to 59 minutes (80 commuters, 38.3%) for males and 15 to 19 minutes (55 commuters, 34.6%) for females.
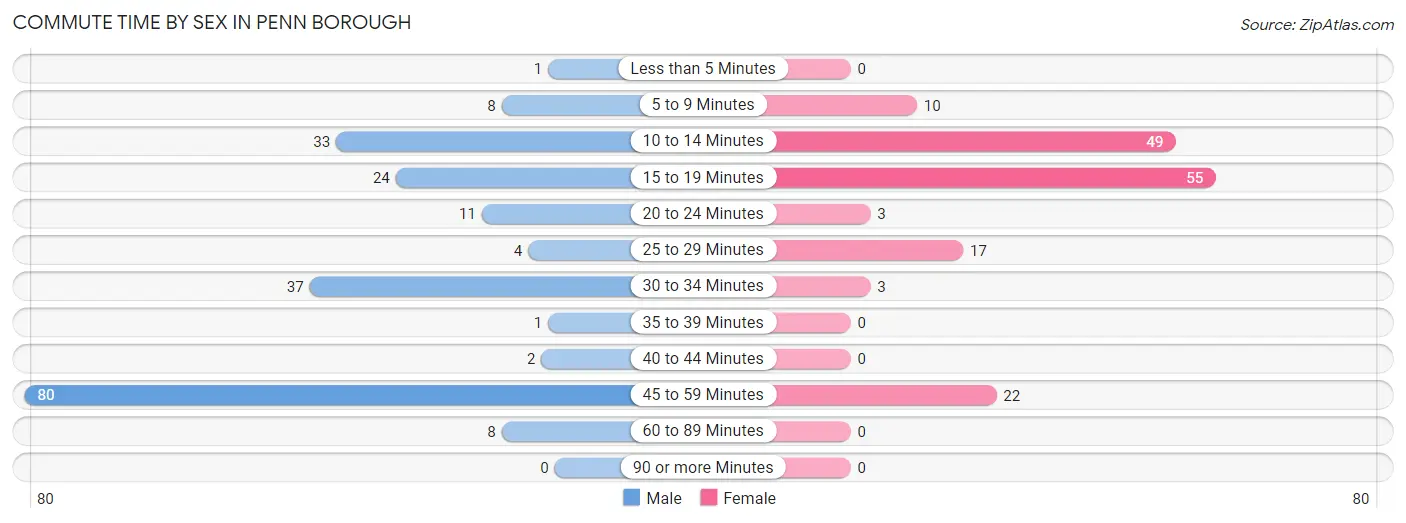
| Commute Time | Male | Female |
| Less than 5 Minutes | 1 (0.5%) | 0 (0.0%) |
| 5 to 9 Minutes | 8 (3.8%) | 10 (6.3%) |
| 10 to 14 Minutes | 33 (15.8%) | 49 (30.8%) |
| 15 to 19 Minutes | 24 (11.5%) | 55 (34.6%) |
| 20 to 24 Minutes | 11 (5.3%) | 3 (1.9%) |
| 25 to 29 Minutes | 4 (1.9%) | 17 (10.7%) |
| 30 to 34 Minutes | 37 (17.7%) | 3 (1.9%) |
| 35 to 39 Minutes | 1 (0.5%) | 0 (0.0%) |
| 40 to 44 Minutes | 2 (1.0%) | 0 (0.0%) |
| 45 to 59 Minutes | 80 (38.3%) | 22 (13.8%) |
| 60 to 89 Minutes | 8 (3.8%) | 0 (0.0%) |
| 90 or more Minutes | 0 (0.0%) | 0 (0.0%) |
Time of Departure to Work by Sex in Penn borough
The most frequent times of departure to work in Penn borough are 5:30 AM to 5:59 AM (62, 29.7%) for males and 6:00 AM to 6:29 AM (49, 30.8%) for females.
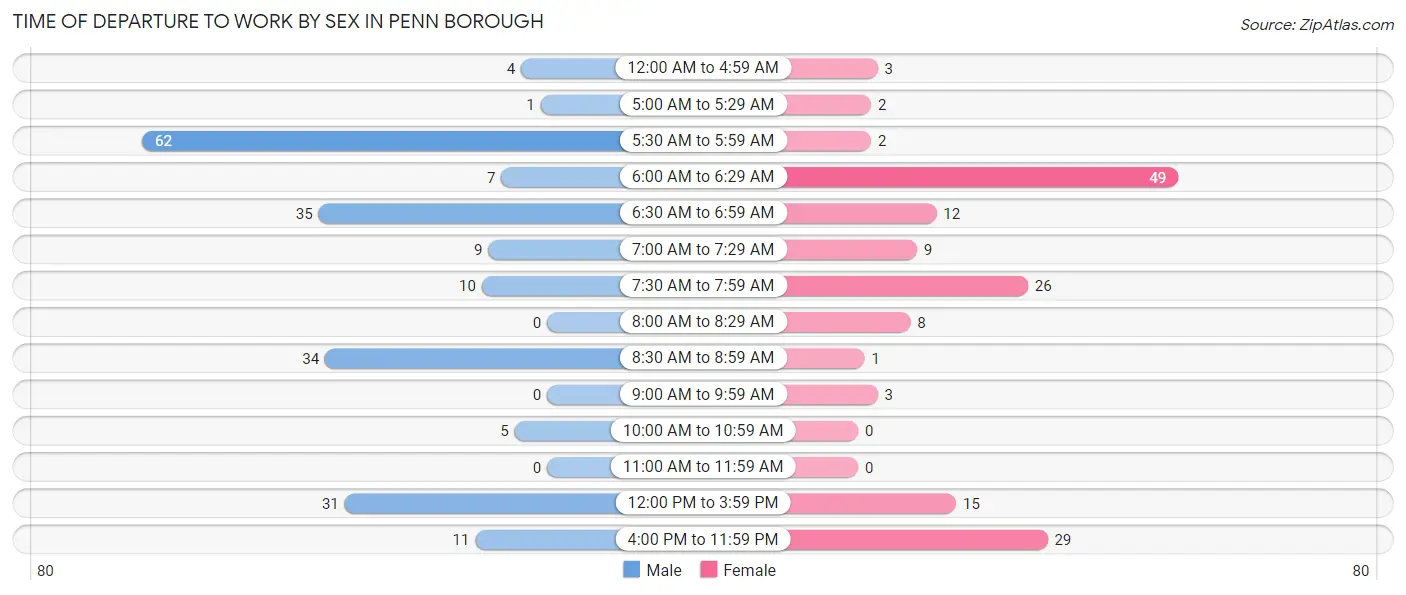
| Time of Departure | Male | Female |
| 12:00 AM to 4:59 AM | 4 (1.9%) | 3 (1.9%) |
| 5:00 AM to 5:29 AM | 1 (0.5%) | 2 (1.3%) |
| 5:30 AM to 5:59 AM | 62 (29.7%) | 2 (1.3%) |
| 6:00 AM to 6:29 AM | 7 (3.4%) | 49 (30.8%) |
| 6:30 AM to 6:59 AM | 35 (16.8%) | 12 (7.5%) |
| 7:00 AM to 7:29 AM | 9 (4.3%) | 9 (5.7%) |
| 7:30 AM to 7:59 AM | 10 (4.8%) | 26 (16.4%) |
| 8:00 AM to 8:29 AM | 0 (0.0%) | 8 (5.0%) |
| 8:30 AM to 8:59 AM | 34 (16.3%) | 1 (0.6%) |
| 9:00 AM to 9:59 AM | 0 (0.0%) | 3 (1.9%) |
| 10:00 AM to 10:59 AM | 5 (2.4%) | 0 (0.0%) |
| 11:00 AM to 11:59 AM | 0 (0.0%) | 0 (0.0%) |
| 12:00 PM to 3:59 PM | 31 (14.8%) | 15 (9.4%) |
| 4:00 PM to 11:59 PM | 11 (5.3%) | 29 (18.2%) |
| Total | 209 (100.0%) | 159 (100.0%) |
Housing Occupancy in Penn borough
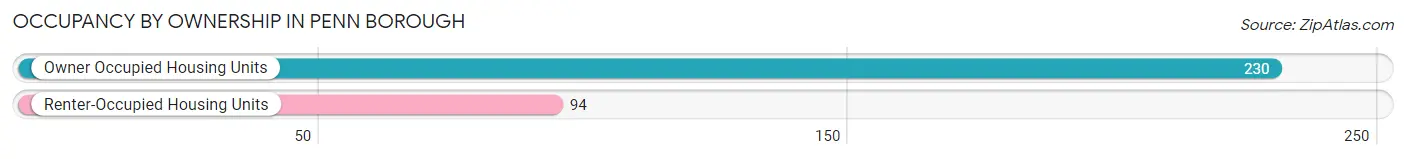
Occupancy by Ownership in Penn borough
Of the total 324 dwellings in Penn borough, owner-occupied units account for 230 (71.0%), while renter-occupied units make up 94 (29.0%).
| Occupancy | # Housing Units | % Housing Units |
| Owner Occupied Housing Units | 230 | 71.0% |
| Renter-Occupied Housing Units | 94 | 29.0% |
| Total Occupied Housing Units | 324 | 100.0% |
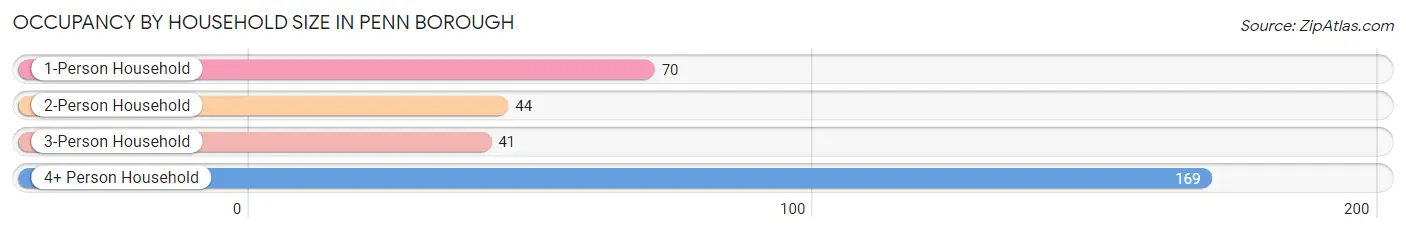
Occupancy by Household Size in Penn borough
| Household Size | # Housing Units | % Housing Units |
| 1-Person Household | 70 | 21.6% |
| 2-Person Household | 44 | 13.6% |
| 3-Person Household | 41 | 12.7% |
| 4+ Person Household | 169 | 52.2% |
| Total Housing Units | 324 | 100.0% |
Occupancy by Ownership by Household Size in Penn borough
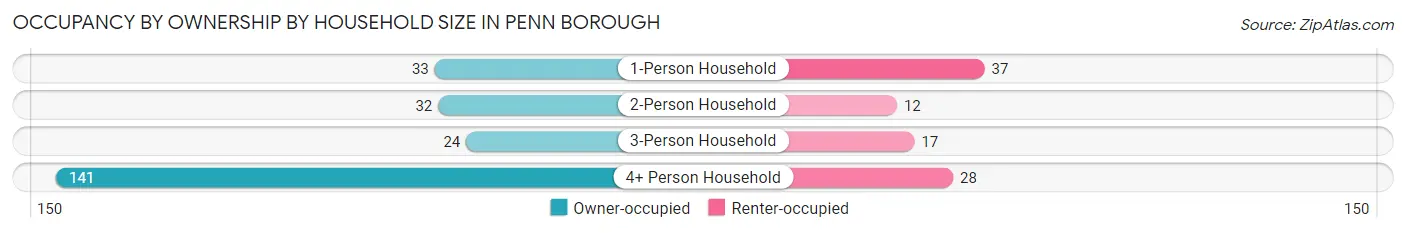
| Household Size | Owner-occupied | Renter-occupied |
| 1-Person Household | 33 (47.1%) | 37 (52.9%) |
| 2-Person Household | 32 (72.7%) | 12 (27.3%) |
| 3-Person Household | 24 (58.5%) | 17 (41.5%) |
| 4+ Person Household | 141 (83.4%) | 28 (16.6%) |
| Total Housing Units | 230 (71.0%) | 94 (29.0%) |
Occupancy by Educational Attainment in Penn borough
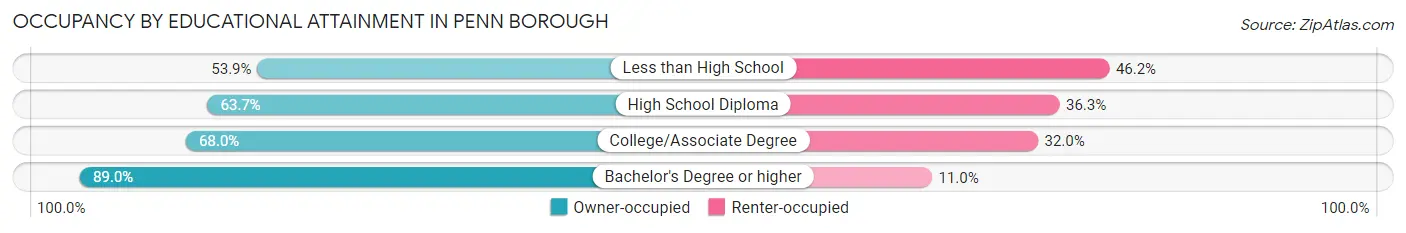
| Household Size | Owner-occupied | Renter-occupied |
| Less than High School | 14 (53.8%) | 12 (46.2%) |
| High School Diploma | 58 (63.7%) | 33 (36.3%) |
| College/Associate Degree | 85 (68.0%) | 40 (32.0%) |
| Bachelor's Degree or higher | 73 (89.0%) | 9 (11.0%) |
Occupancy by Age of Householder in Penn borough
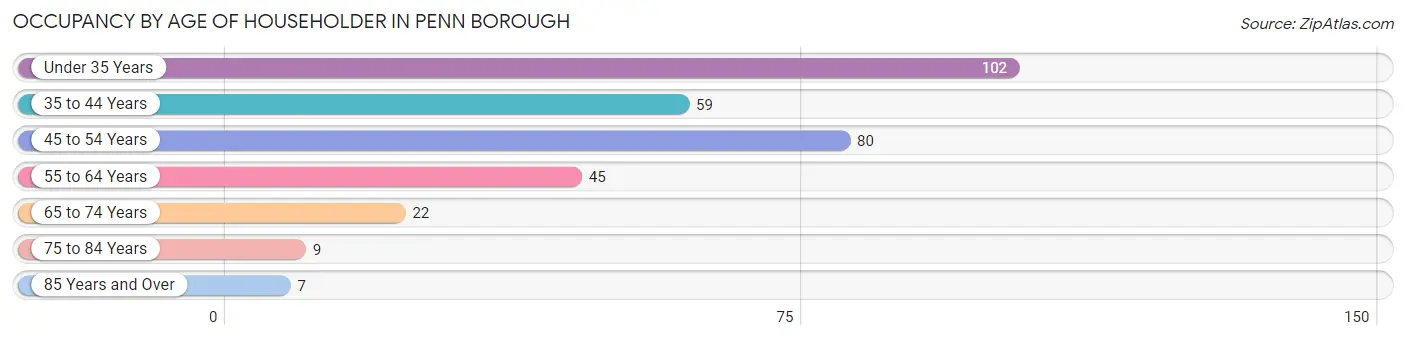
| Age Bracket | # Households | % Households |
| Under 35 Years | 102 | 31.5% |
| 35 to 44 Years | 59 | 18.2% |
| 45 to 54 Years | 80 | 24.7% |
| 55 to 64 Years | 45 | 13.9% |
| 65 to 74 Years | 22 | 6.8% |
| 75 to 84 Years | 9 | 2.8% |
| 85 Years and Over | 7 | 2.2% |
| Total | 324 | 100.0% |
Housing Finances in Penn borough
Median Income by Occupancy in Penn borough
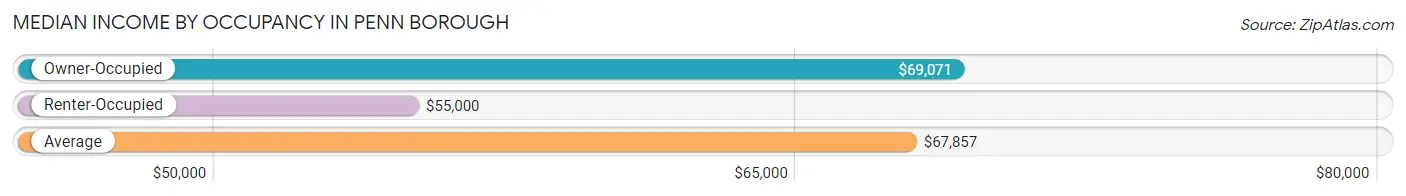
| Occupancy Type | # Households | Median Income |
| Owner-Occupied | 230 (71.0%) | $69,071 |
| Renter-Occupied | 94 (29.0%) | $55,000 |
| Average | 324 (100.0%) | $67,857 |
Occupancy by Householder Income Bracket in Penn borough
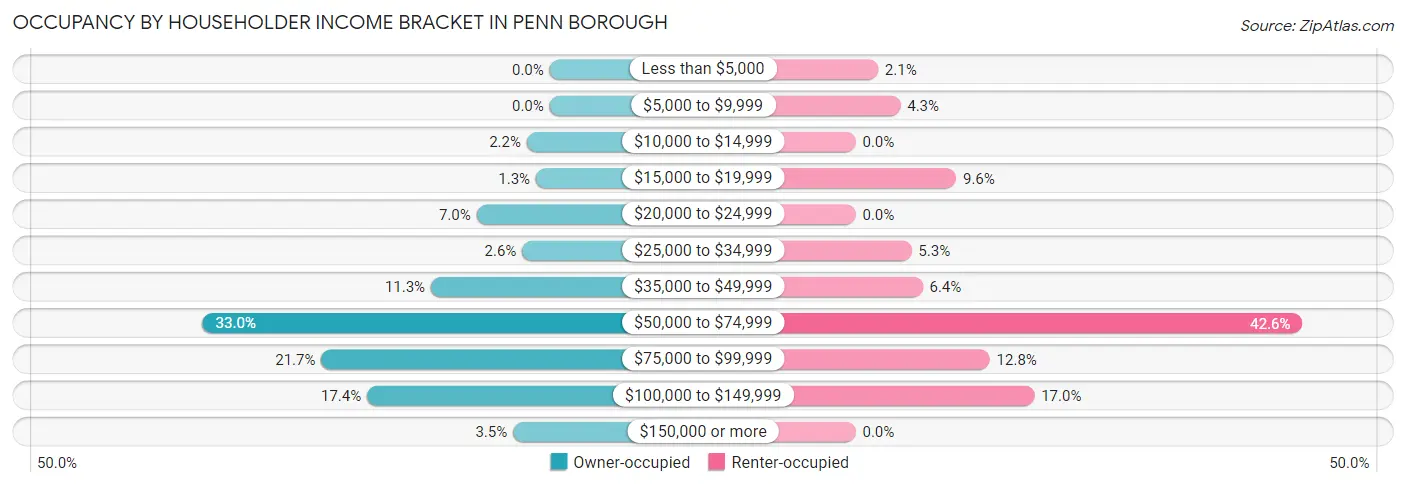
| Income Bracket | Owner-occupied | Renter-occupied |
| Less than $5,000 | 0 (0.0%) | 2 (2.1%) |
| $5,000 to $9,999 | 0 (0.0%) | 4 (4.3%) |
| $10,000 to $14,999 | 5 (2.2%) | 0 (0.0%) |
| $15,000 to $19,999 | 3 (1.3%) | 9 (9.6%) |
| $20,000 to $24,999 | 16 (7.0%) | 0 (0.0%) |
| $25,000 to $34,999 | 6 (2.6%) | 5 (5.3%) |
| $35,000 to $49,999 | 26 (11.3%) | 6 (6.4%) |
| $50,000 to $74,999 | 76 (33.0%) | 40 (42.5%) |
| $75,000 to $99,999 | 50 (21.7%) | 12 (12.8%) |
| $100,000 to $149,999 | 40 (17.4%) | 16 (17.0%) |
| $150,000 or more | 8 (3.5%) | 0 (0.0%) |
| Total | 230 (100.0%) | 94 (100.0%) |
Monthly Housing Cost Tiers in Penn borough
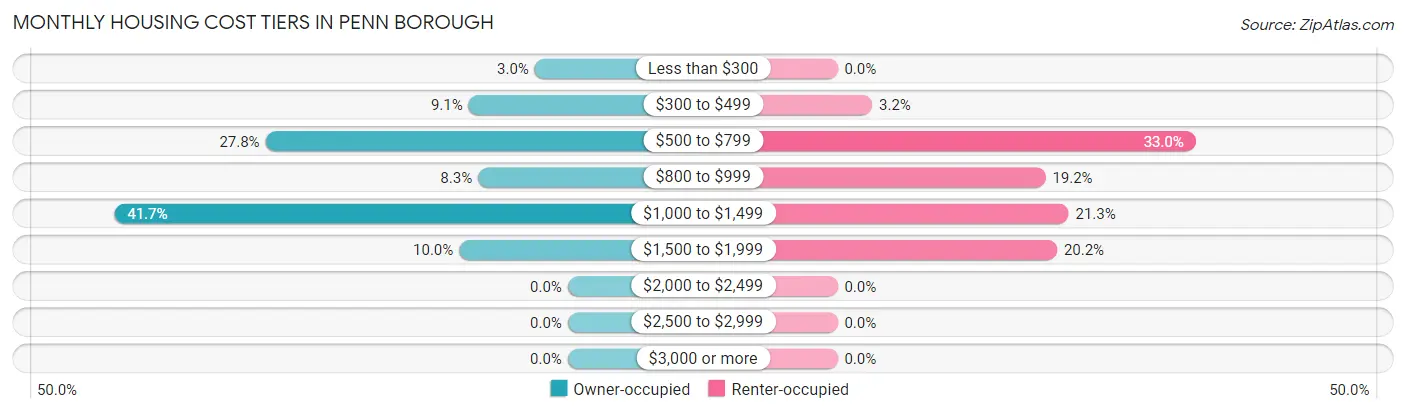
| Monthly Cost | Owner-occupied | Renter-occupied |
| Less than $300 | 7 (3.0%) | 0 (0.0%) |
| $300 to $499 | 21 (9.1%) | 3 (3.2%) |
| $500 to $799 | 64 (27.8%) | 31 (33.0%) |
| $800 to $999 | 19 (8.3%) | 18 (19.2%) |
| $1,000 to $1,499 | 96 (41.7%) | 20 (21.3%) |
| $1,500 to $1,999 | 23 (10.0%) | 19 (20.2%) |
| $2,000 to $2,499 | 0 (0.0%) | 0 (0.0%) |
| $2,500 to $2,999 | 0 (0.0%) | 0 (0.0%) |
| $3,000 or more | 0 (0.0%) | 0 (0.0%) |
| Total | 230 (100.0%) | 94 (100.0%) |
Physical Housing Characteristics in Penn borough
Housing Structures in Penn borough
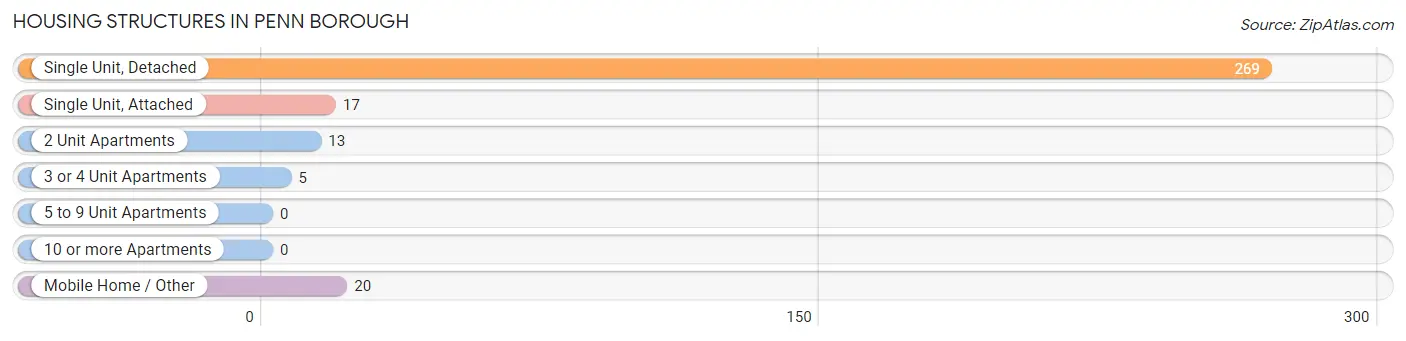
| Structure Type | # Housing Units | % Housing Units |
| Single Unit, Detached | 269 | 83.0% |
| Single Unit, Attached | 17 | 5.2% |
| 2 Unit Apartments | 13 | 4.0% |
| 3 or 4 Unit Apartments | 5 | 1.5% |
| 5 to 9 Unit Apartments | 0 | 0.0% |
| 10 or more Apartments | 0 | 0.0% |
| Mobile Home / Other | 20 | 6.2% |
| Total | 324 | 100.0% |
Housing Structures by Occupancy in Penn borough
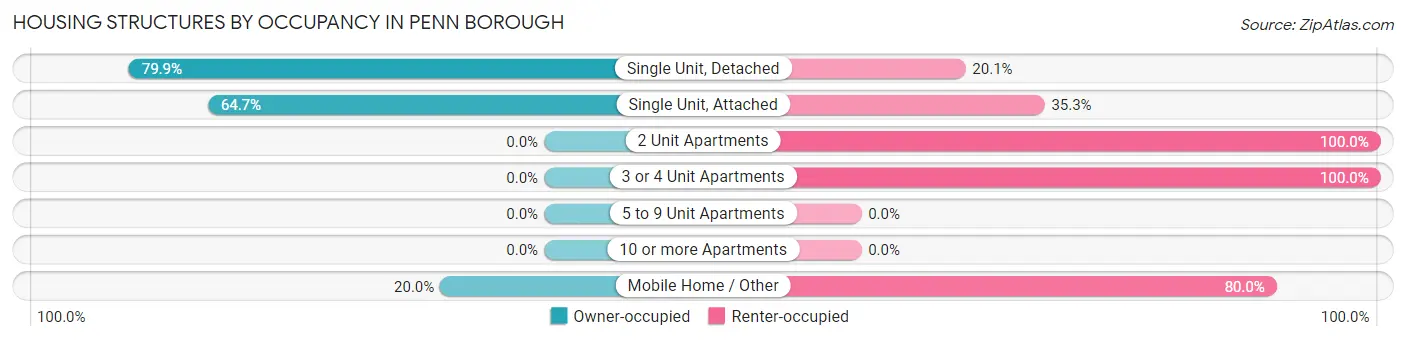
| Structure Type | Owner-occupied | Renter-occupied |
| Single Unit, Detached | 215 (79.9%) | 54 (20.1%) |
| Single Unit, Attached | 11 (64.7%) | 6 (35.3%) |
| 2 Unit Apartments | 0 (0.0%) | 13 (100.0%) |
| 3 or 4 Unit Apartments | 0 (0.0%) | 5 (100.0%) |
| 5 to 9 Unit Apartments | 0 (0.0%) | 0 (0.0%) |
| 10 or more Apartments | 0 (0.0%) | 0 (0.0%) |
| Mobile Home / Other | 4 (20.0%) | 16 (80.0%) |
| Total | 230 (71.0%) | 94 (29.0%) |
Housing Structures by Number of Rooms in Penn borough
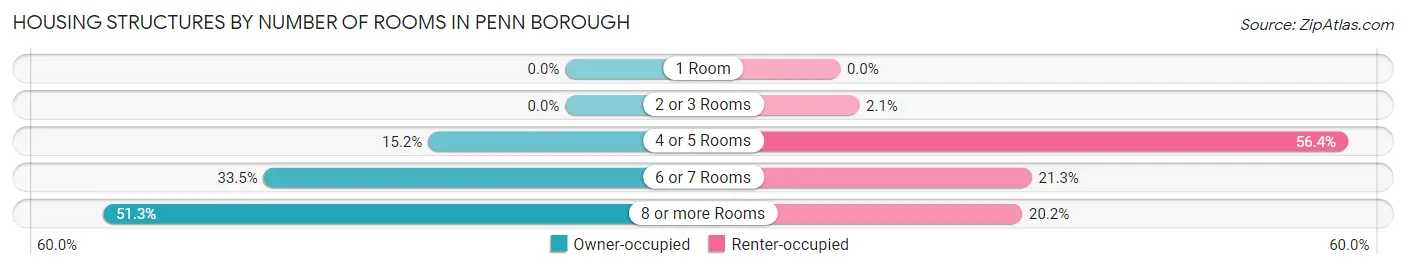
| Number of Rooms | Owner-occupied | Renter-occupied |
| 1 Room | 0 (0.0%) | 0 (0.0%) |
| 2 or 3 Rooms | 0 (0.0%) | 2 (2.1%) |
| 4 or 5 Rooms | 35 (15.2%) | 53 (56.4%) |
| 6 or 7 Rooms | 77 (33.5%) | 20 (21.3%) |
| 8 or more Rooms | 118 (51.3%) | 19 (20.2%) |
| Total | 230 (100.0%) | 94 (100.0%) |
Housing Structure by Heating Type in Penn borough
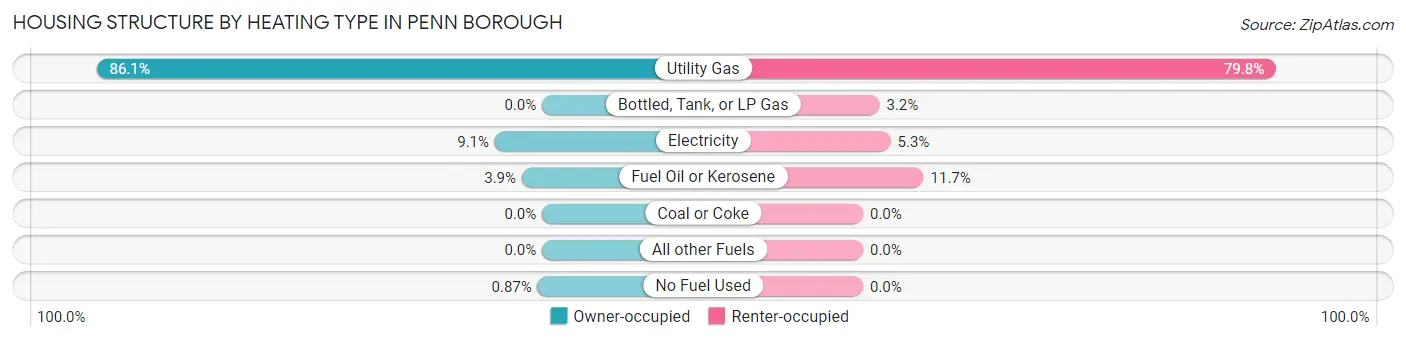
| Heating Type | Owner-occupied | Renter-occupied |
| Utility Gas | 198 (86.1%) | 75 (79.8%) |
| Bottled, Tank, or LP Gas | 0 (0.0%) | 3 (3.2%) |
| Electricity | 21 (9.1%) | 5 (5.3%) |
| Fuel Oil or Kerosene | 9 (3.9%) | 11 (11.7%) |
| Coal or Coke | 0 (0.0%) | 0 (0.0%) |
| All other Fuels | 0 (0.0%) | 0 (0.0%) |
| No Fuel Used | 2 (0.9%) | 0 (0.0%) |
| Total | 230 (100.0%) | 94 (100.0%) |
Household Vehicle Usage in Penn borough
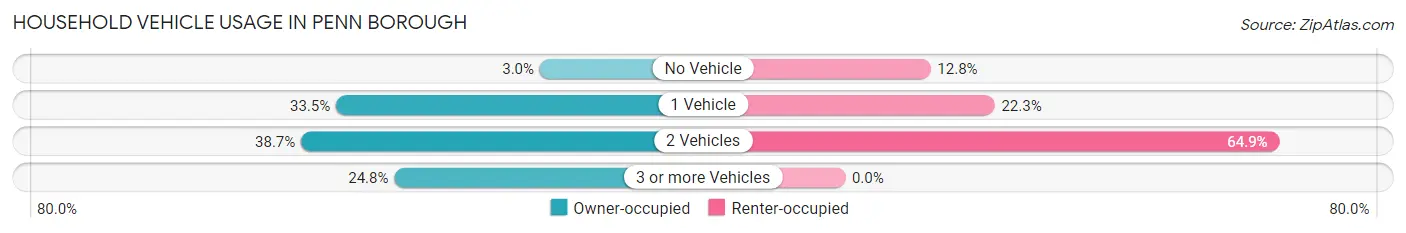
| Vehicles per Household | Owner-occupied | Renter-occupied |
| No Vehicle | 7 (3.0%) | 12 (12.8%) |
| 1 Vehicle | 77 (33.5%) | 21 (22.3%) |
| 2 Vehicles | 89 (38.7%) | 61 (64.9%) |
| 3 or more Vehicles | 57 (24.8%) | 0 (0.0%) |
| Total | 230 (100.0%) | 94 (100.0%) |
Real Estate & Mortgages in Penn borough
Real Estate and Mortgage Overview in Penn borough
| Characteristic | Without Mortgage | With Mortgage |
| Housing Units | 44 | 186 |
| Median Property Value | $95,000 | $107,100 |
| Median Household Income | $49,167 | $4 |
| Monthly Housing Costs | $468 | $0 |
| Real Estate Taxes | $940 | $0 |
Property Value by Mortgage Status in Penn borough
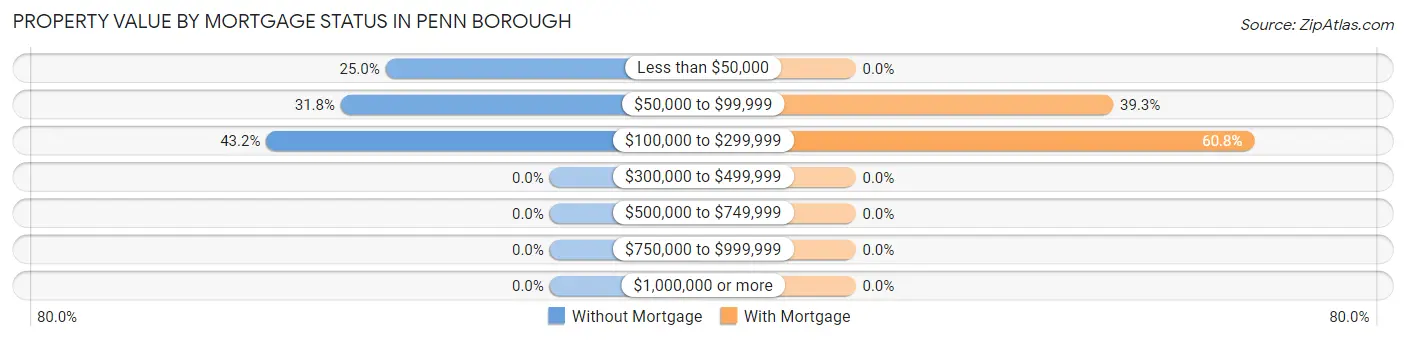
| Property Value | Without Mortgage | With Mortgage |
| Less than $50,000 | 11 (25.0%) | 0 (0.0%) |
| $50,000 to $99,999 | 14 (31.8%) | 73 (39.3%) |
| $100,000 to $299,999 | 19 (43.2%) | 113 (60.8%) |
| $300,000 to $499,999 | 0 (0.0%) | 0 (0.0%) |
| $500,000 to $749,999 | 0 (0.0%) | 0 (0.0%) |
| $750,000 to $999,999 | 0 (0.0%) | 0 (0.0%) |
| $1,000,000 or more | 0 (0.0%) | 0 (0.0%) |
| Total | 44 (100.0%) | 186 (100.0%) |
Household Income by Mortgage Status in Penn borough
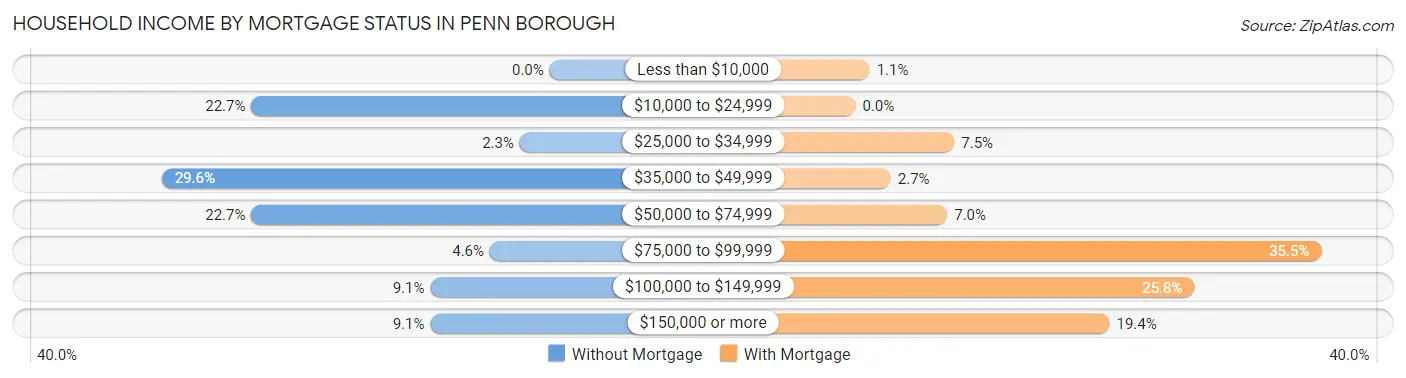
| Household Income | Without Mortgage | With Mortgage |
| Less than $10,000 | 0 (0.0%) | 2 (1.1%) |
| $10,000 to $24,999 | 10 (22.7%) | 0 (0.0%) |
| $25,000 to $34,999 | 1 (2.3%) | 14 (7.5%) |
| $35,000 to $49,999 | 13 (29.5%) | 5 (2.7%) |
| $50,000 to $74,999 | 10 (22.7%) | 13 (7.0%) |
| $75,000 to $99,999 | 2 (4.5%) | 66 (35.5%) |
| $100,000 to $149,999 | 4 (9.1%) | 48 (25.8%) |
| $150,000 or more | 4 (9.1%) | 36 (19.4%) |
| Total | 44 (100.0%) | 186 (100.0%) |
Property Value to Household Income Ratio in Penn borough
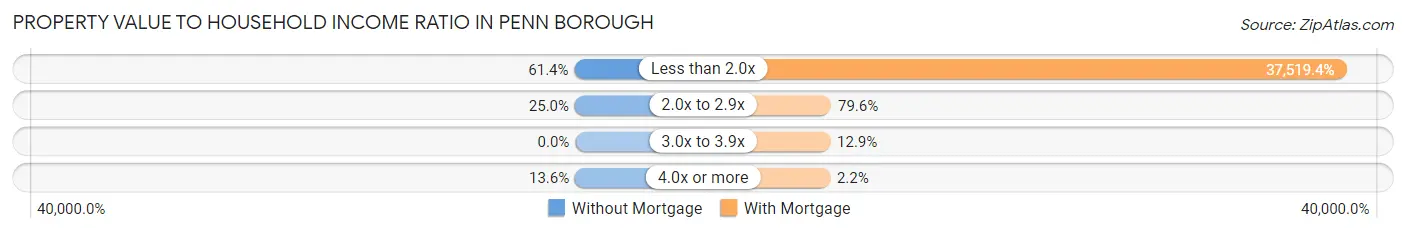
| Value-to-Income Ratio | Without Mortgage | With Mortgage |
| Less than 2.0x | 27 (61.4%) | 69,786 (37,519.3%) |
| 2.0x to 2.9x | 11 (25.0%) | 148 (79.6%) |
| 3.0x to 3.9x | 0 (0.0%) | 24 (12.9%) |
| 4.0x or more | 6 (13.6%) | 4 (2.1%) |
| Total | 44 (100.0%) | 186 (100.0%) |
Real Estate Taxes by Mortgage Status in Penn borough
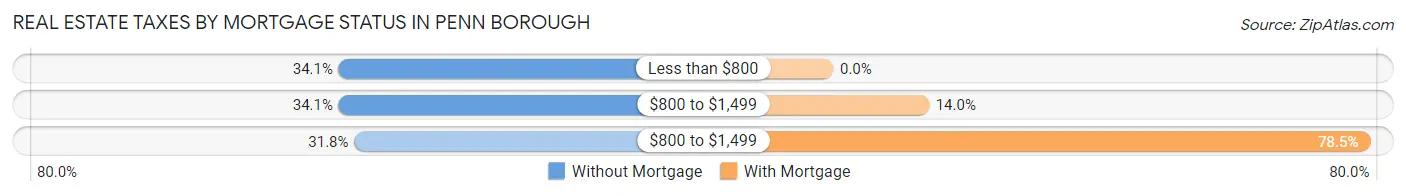
| Property Taxes | Without Mortgage | With Mortgage |
| Less than $800 | 15 (34.1%) | 0 (0.0%) |
| $800 to $1,499 | 15 (34.1%) | 26 (14.0%) |
| $800 to $1,499 | 14 (31.8%) | 146 (78.5%) |
| Total | 44 (100.0%) | 186 (100.0%) |
Health & Disability in Penn borough
Health Insurance Coverage by Age in Penn borough
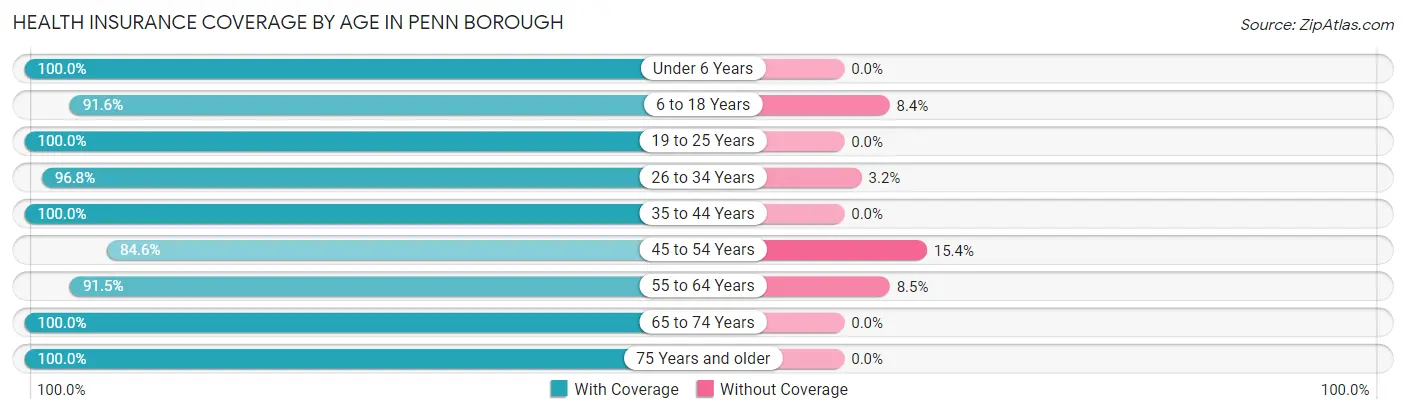
| Age Bracket | With Coverage | Without Coverage |
| Under 6 Years | 229 (100.0%) | 0 (0.0%) |
| 6 to 18 Years | 217 (91.6%) | 20 (8.4%) |
| 19 to 25 Years | 78 (100.0%) | 0 (0.0%) |
| 26 to 34 Years | 120 (96.8%) | 4 (3.2%) |
| 35 to 44 Years | 138 (100.0%) | 0 (0.0%) |
| 45 to 54 Years | 88 (84.6%) | 16 (15.4%) |
| 55 to 64 Years | 54 (91.5%) | 5 (8.5%) |
| 65 to 74 Years | 48 (100.0%) | 0 (0.0%) |
| 75 Years and older | 16 (100.0%) | 0 (0.0%) |
| Total | 988 (95.6%) | 45 (4.4%) |
Health Insurance Coverage by Citizenship Status in Penn borough
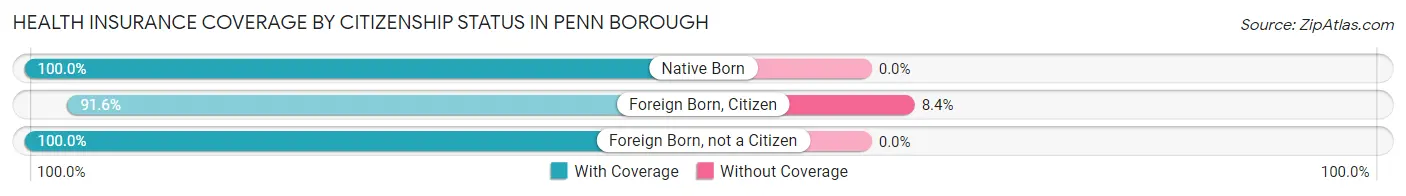
| Citizenship Status | With Coverage | Without Coverage |
| Native Born | 229 (100.0%) | 0 (0.0%) |
| Foreign Born, Citizen | 217 (91.6%) | 20 (8.4%) |
| Foreign Born, not a Citizen | 78 (100.0%) | 0 (0.0%) |
Health Insurance Coverage by Household Income in Penn borough
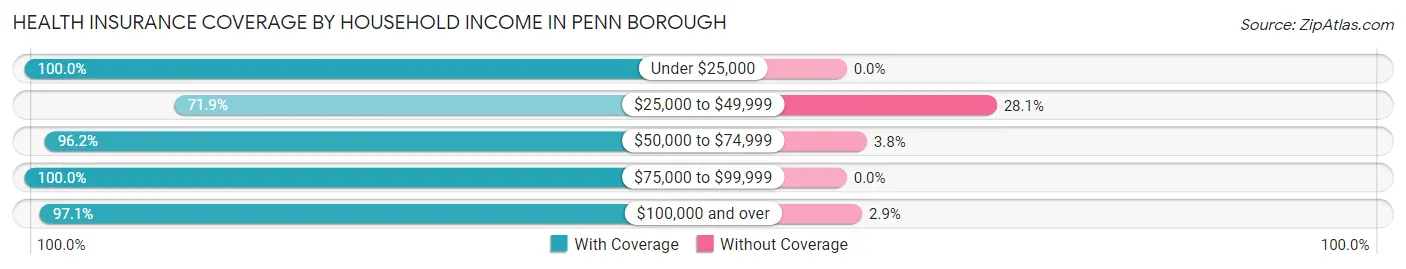
| Household Income | With Coverage | Without Coverage |
| Under $25,000 | 102 (100.0%) | 0 (0.0%) |
| $25,000 to $49,999 | 64 (71.9%) | 25 (28.1%) |
| $50,000 to $74,999 | 357 (96.2%) | 14 (3.8%) |
| $75,000 to $99,999 | 262 (100.0%) | 0 (0.0%) |
| $100,000 and over | 203 (97.1%) | 6 (2.9%) |
Public vs Private Health Insurance Coverage by Age in Penn borough
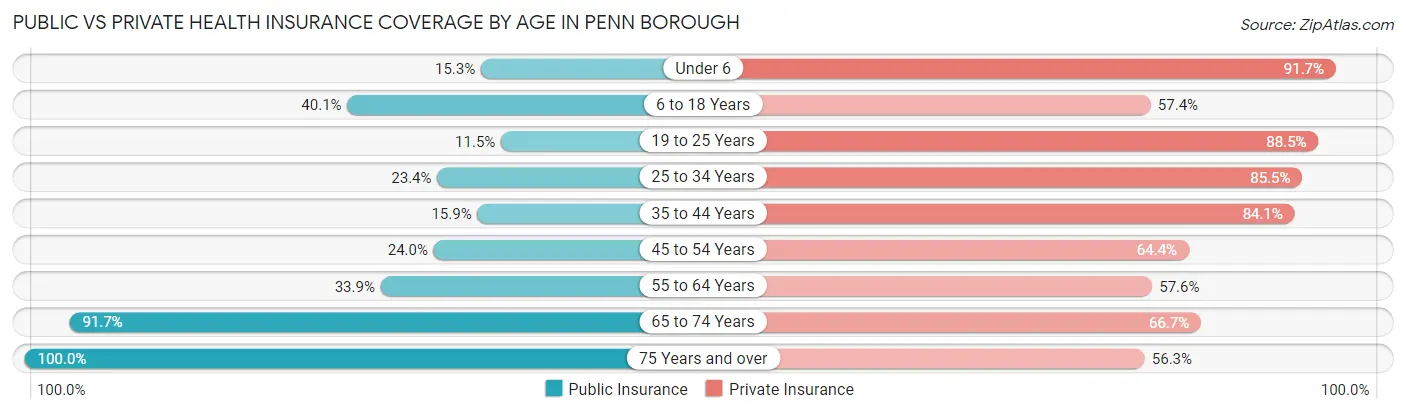
| Age Bracket | Public Insurance | Private Insurance |
| Under 6 | 35 (15.3%) | 210 (91.7%) |
| 6 to 18 Years | 95 (40.1%) | 136 (57.4%) |
| 19 to 25 Years | 9 (11.5%) | 69 (88.5%) |
| 25 to 34 Years | 29 (23.4%) | 106 (85.5%) |
| 35 to 44 Years | 22 (15.9%) | 116 (84.1%) |
| 45 to 54 Years | 25 (24.0%) | 67 (64.4%) |
| 55 to 64 Years | 20 (33.9%) | 34 (57.6%) |
| 65 to 74 Years | 44 (91.7%) | 32 (66.7%) |
| 75 Years and over | 16 (100.0%) | 9 (56.2%) |
| Total | 295 (28.6%) | 779 (75.4%) |
Disability Status by Sex by Age in Penn borough
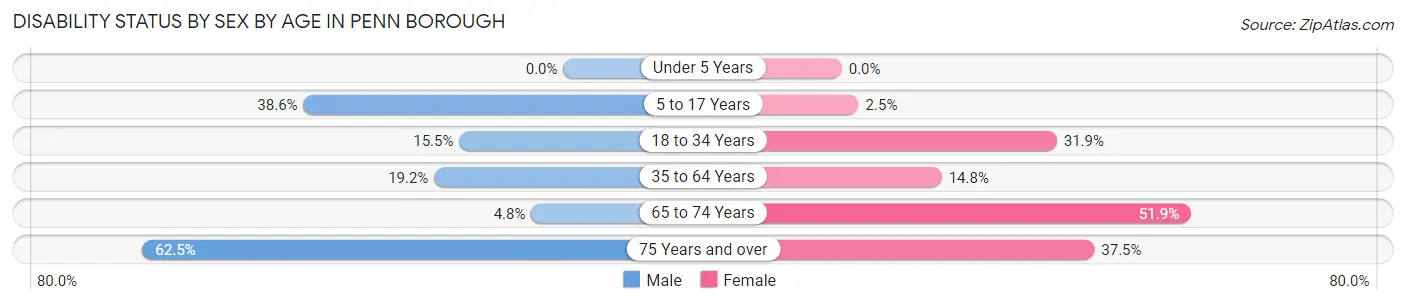
| Age Bracket | Male | Female |
| Under 5 Years | 0 (0.0%) | 0 (0.0%) |
| 5 to 17 Years | 44 (38.6%) | 3 (2.5%) |
| 18 to 34 Years | 17 (15.4%) | 38 (31.9%) |
| 35 to 64 Years | 28 (19.2%) | 23 (14.8%) |
| 65 to 74 Years | 1 (4.8%) | 14 (51.8%) |
| 75 Years and over | 5 (62.5%) | 3 (37.5%) |
Disability Class by Sex by Age in Penn borough
Disability Class: Hearing Difficulty
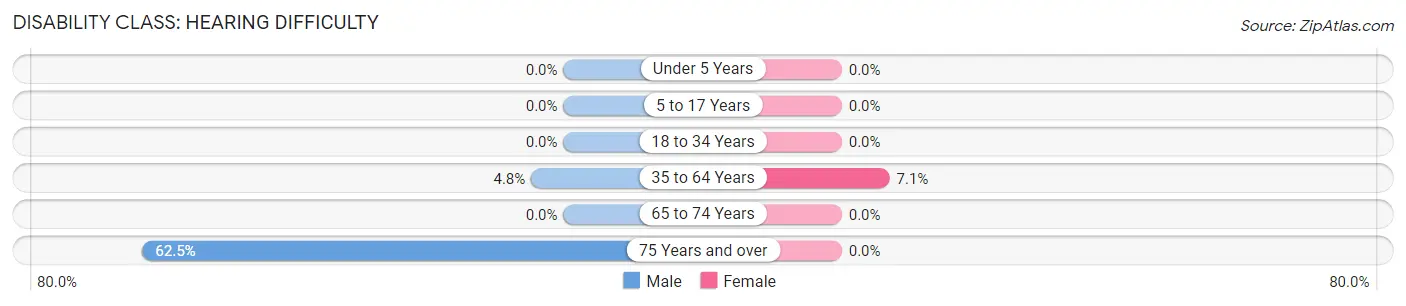
| Age Bracket | Male | Female |
| Under 5 Years | 0 (0.0%) | 0 (0.0%) |
| 5 to 17 Years | 0 (0.0%) | 0 (0.0%) |
| 18 to 34 Years | 0 (0.0%) | 0 (0.0%) |
| 35 to 64 Years | 7 (4.8%) | 11 (7.1%) |
| 65 to 74 Years | 0 (0.0%) | 0 (0.0%) |
| 75 Years and over | 5 (62.5%) | 0 (0.0%) |
Disability Class: Vision Difficulty
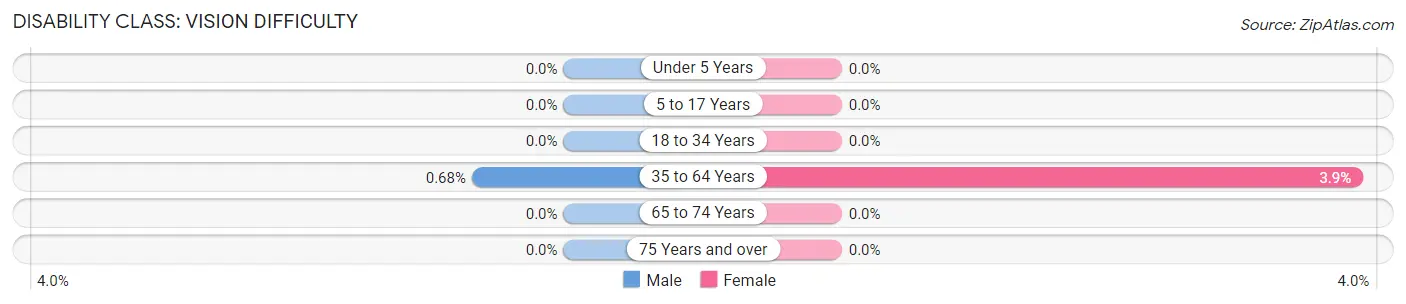
| Age Bracket | Male | Female |
| Under 5 Years | 0 (0.0%) | 0 (0.0%) |
| 5 to 17 Years | 0 (0.0%) | 0 (0.0%) |
| 18 to 34 Years | 0 (0.0%) | 0 (0.0%) |
| 35 to 64 Years | 1 (0.7%) | 6 (3.9%) |
| 65 to 74 Years | 0 (0.0%) | 0 (0.0%) |
| 75 Years and over | 0 (0.0%) | 0 (0.0%) |
Disability Class: Cognitive Difficulty
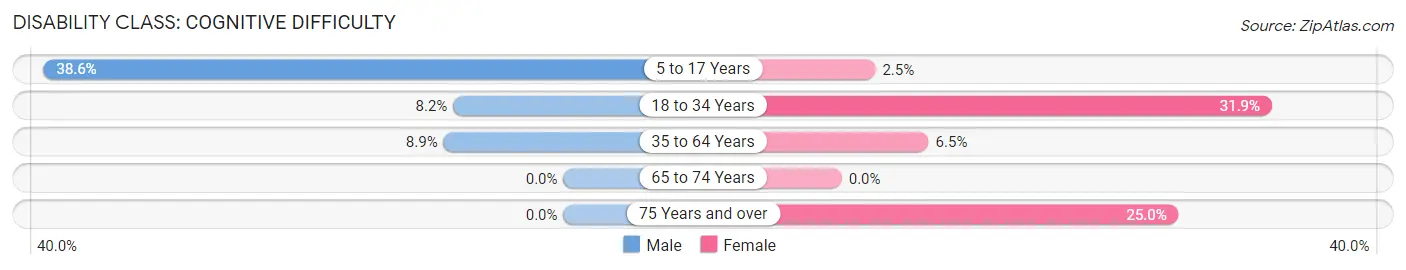
| Age Bracket | Male | Female |
| 5 to 17 Years | 44 (38.6%) | 3 (2.5%) |
| 18 to 34 Years | 9 (8.2%) | 38 (31.9%) |
| 35 to 64 Years | 13 (8.9%) | 10 (6.5%) |
| 65 to 74 Years | 0 (0.0%) | 0 (0.0%) |
| 75 Years and over | 0 (0.0%) | 2 (25.0%) |
Disability Class: Ambulatory Difficulty
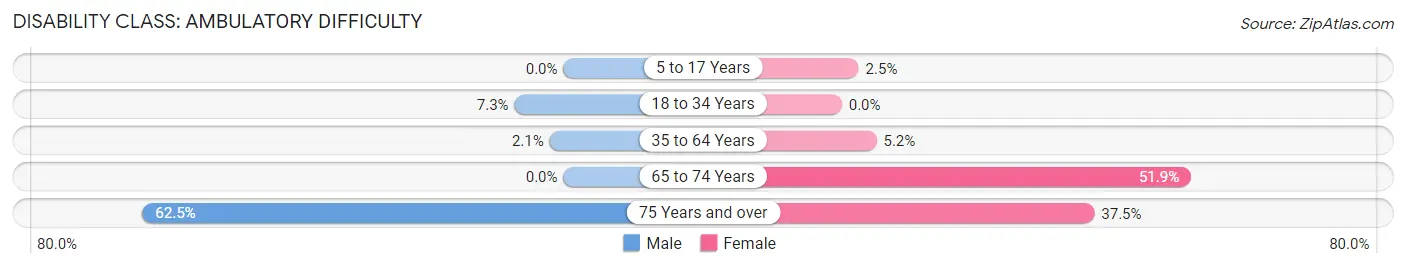
| Age Bracket | Male | Female |
| 5 to 17 Years | 0 (0.0%) | 3 (2.5%) |
| 18 to 34 Years | 8 (7.3%) | 0 (0.0%) |
| 35 to 64 Years | 3 (2.1%) | 8 (5.2%) |
| 65 to 74 Years | 0 (0.0%) | 14 (51.8%) |
| 75 Years and over | 5 (62.5%) | 3 (37.5%) |
Disability Class: Self-Care Difficulty
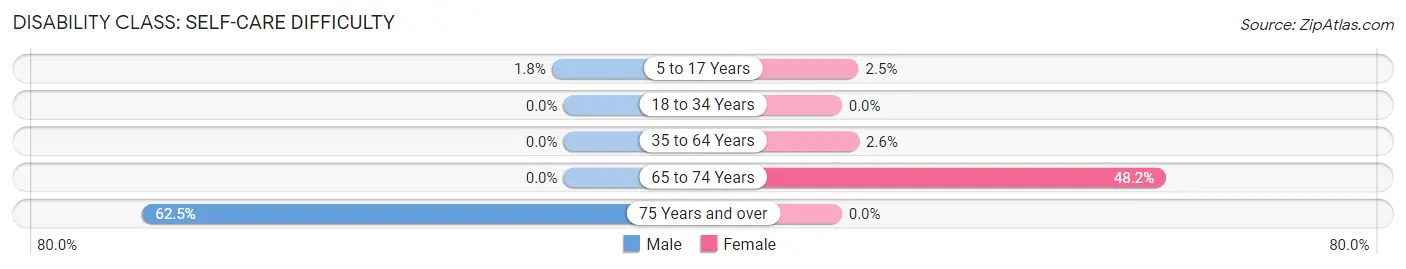
| Age Bracket | Male | Female |
| 5 to 17 Years | 2 (1.8%) | 3 (2.5%) |
| 18 to 34 Years | 0 (0.0%) | 0 (0.0%) |
| 35 to 64 Years | 0 (0.0%) | 4 (2.6%) |
| 65 to 74 Years | 0 (0.0%) | 13 (48.1%) |
| 75 Years and over | 5 (62.5%) | 0 (0.0%) |
Technology Access in Penn borough
Computing Device Access in Penn borough
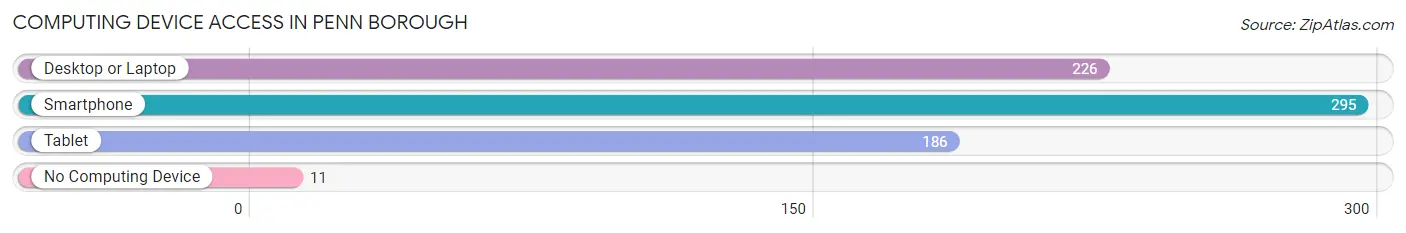
| Device Type | # Households | % Households |
| Desktop or Laptop | 226 | 69.8% |
| Smartphone | 295 | 91.0% |
| Tablet | 186 | 57.4% |
| No Computing Device | 11 | 3.4% |
| Total | 324 | 100.0% |
Internet Access in Penn borough
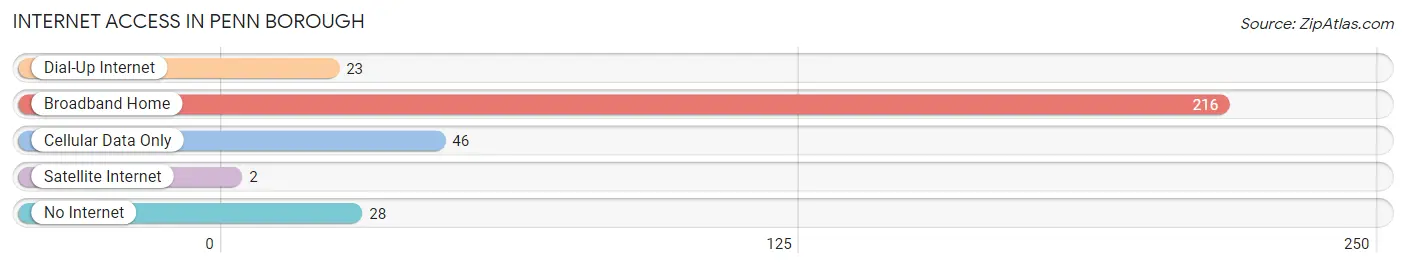
| Internet Type | # Households | % Households |
| Dial-Up Internet | 23 | 7.1% |
| Broadband Home | 216 | 66.7% |
| Cellular Data Only | 46 | 14.2% |
| Satellite Internet | 2 | 0.6% |
| No Internet | 28 | 8.6% |
| Total | 324 | 100.0% |
Penn borough Summary
Penn Borough is a borough located in Westmoreland County, Pennsylvania. It is part of the Pittsburgh metropolitan area. The population was 1,845 at the 2010 census.
History
Penn Borough was founded in 1845 by a group of settlers from Pennsylvania and Virginia. The borough was named after William Penn, the founder of Pennsylvania. The first settlers were mostly farmers and the area was known for its fertile soil and abundant natural resources.
The first post office in Penn Borough was established in 1848. The first school was built in 1851 and the first church was built in 1853.
The borough was incorporated in 1854 and the first mayor was elected in 1855. The first newspaper, the Penn Borough Gazette, was established in 1856.
The borough grew steadily throughout the 19th century and by the early 20th century, it had become a thriving community with a variety of businesses and industries. The borough was home to several coal mines, a brickyard, a sawmill, a flour mill, a tannery, and a variety of other businesses.
Geography
Penn Borough is located in western Westmoreland County at 40°17'25" North, 79°37'45" West (40.290, -79.629). It is bordered to the north by the borough of New Kensington, to the east by the borough of Arnold, to the south by the borough of Lower Burrell, and to the west by the borough of Tarentum.
According to the United States Census Bureau, the borough has a total area of 1.2 square miles (3.1 km2), all of it land.
Economy
Penn Borough is a small, rural community with a population of 1,845 as of the 2010 census. The borough is home to a variety of businesses and industries, including a few small manufacturing companies, a few retail stores, and a few restaurants.
The borough is also home to a few small farms, which produce a variety of crops, including corn, soybeans, wheat, and hay.
Demographics
As of the 2010 census, the population of Penn Borough was 1,845. The racial makeup of the borough was 97.3% White, 0.7% African American, 0.2% Native American, 0.2% Asian, 0.2% from other races, and 1.4% from two or more races. Hispanic or Latino of any race were 0.7% of the population.
The median income for a household in the borough was $37,917, and the median income for a family was $45,000. The per capita income for the borough was $18,945. About 8.3% of families and 10.2% of the population were below the poverty line, including 14.3% of those under age 18 and 6.2% of those age 65 or over.
Common Questions
What is Per Capita Income in Penn borough?
Per Capita income in Penn borough is $22,570.
What is the Median Family Income in Penn borough?
Median Family Income in Penn borough is $69,536.
What is the Median Household income in Penn borough?
Median Household Income in Penn borough is $67,857.
What is Income or Wage Gap in Penn borough?
Income or Wage Gap in Penn borough is 33.1%.
Women in Penn borough earn 66.9 cents for every dollar earned by a man.
What is Inequality or Gini Index in Penn borough?
Inequality or Gini Index in Penn borough is 0.29.
What is the Total Population of Penn borough?
Total Population of Penn borough is 1,033.
What is the Total Male Population of Penn borough?
Total Male Population of Penn borough is 513.
What is the Total Female Population of Penn borough?
Total Female Population of Penn borough is 520.
What is the Ratio of Males per 100 Females in Penn borough?
There are 98.65 Males per 100 Females in Penn borough.
What is the Ratio of Females per 100 Males in Penn borough?
There are 101.36 Females per 100 Males in Penn borough.
What is the Median Population Age in Penn borough?
Median Population Age in Penn borough is 25.5 Years.
What is the Average Family Size in Penn borough
Average Family Size in Penn borough is 3.8 People.
What is the Average Household Size in Penn borough
Average Household Size in Penn borough is 3.2 People.
How Large is the Labor Force in Penn borough?
There are 413 People in the Labor Forcein in Penn borough.
What is the Percentage of People in the Labor Force in Penn borough?
66.1% of People are in the Labor Force in Penn borough.
What is the Unemployment Rate in Penn borough?
Unemployment Rate in Penn borough is 2.7%.