Hughesville borough, PA Map & Demographics
Hughesville borough Overview
$33,570
PER CAPITA INCOME
$67,158
AVG FAMILY INCOME
$65,897
AVG HOUSEHOLD INCOME
28.3%
WAGE / INCOME GAP [ % ]
71.7¢/ $1
WAGE / INCOME GAP [ $ ]
0.42
INEQUALITY / GINI INDEX
2,511
TOTAL POPULATION
1,142
MALE POPULATION
1,369
FEMALE POPULATION
83.42
MALES / 100 FEMALES
119.88
FEMALES / 100 MALES
41.0
MEDIAN AGE
2.6
AVG FAMILY SIZE
2.3
AVG HOUSEHOLD SIZE
1,602
LABOR FORCE [ PEOPLE ]
78.8%
PERCENT IN LABOR FORCE
4.2%
UNEMPLOYMENT RATE
Income in Hughesville borough
Income Overview in Hughesville borough
Per Capita Income in Hughesville borough is $33,570, while median incomes of families and households are $67,158 and $65,897 respectively.
| Characteristic | Number | Measure |
| Per Capita Income | 2,511 | $33,570 |
| Median Family Income | 746 | $67,158 |
| Mean Family Income | 746 | $85,197 |
| Median Household Income | 1,108 | $65,897 |
| Mean Household Income | 1,108 | $76,475 |
| Income Deficit | 746 | $0 |
| Wage / Income Gap (%) | 2,511 | 28.25% |
| Wage / Income Gap ($) | 2,511 | 71.75¢ per $1 |
| Gini / Inequality Index | 2,511 | 0.42 |
Earnings by Sex in Hughesville borough
Average Earnings in Hughesville borough are $35,948, $44,665 for men and $32,045 for women, a difference of 28.2%.
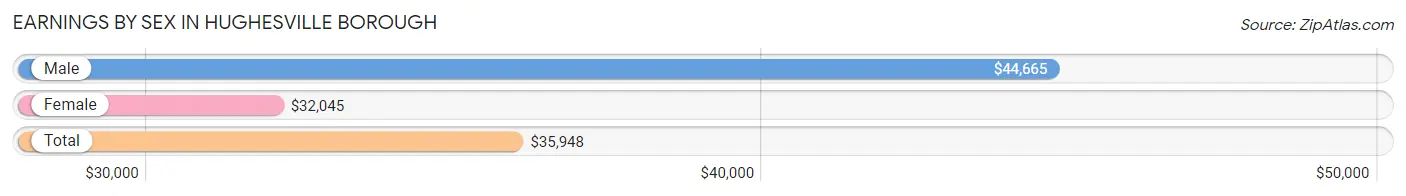
| Sex | Number | Average Earnings |
| Male | 833 (51.2%) | $44,665 |
| Female | 794 (48.8%) | $32,045 |
| Total | 1,627 (100.0%) | $35,948 |
Earnings by Sex by Income Bracket in Hughesville borough
The most common earnings brackets in Hughesville borough are $5,000 to $7,499 for men (171 | 20.5%) and $50,000 to $54,999 for women (99 | 12.5%).
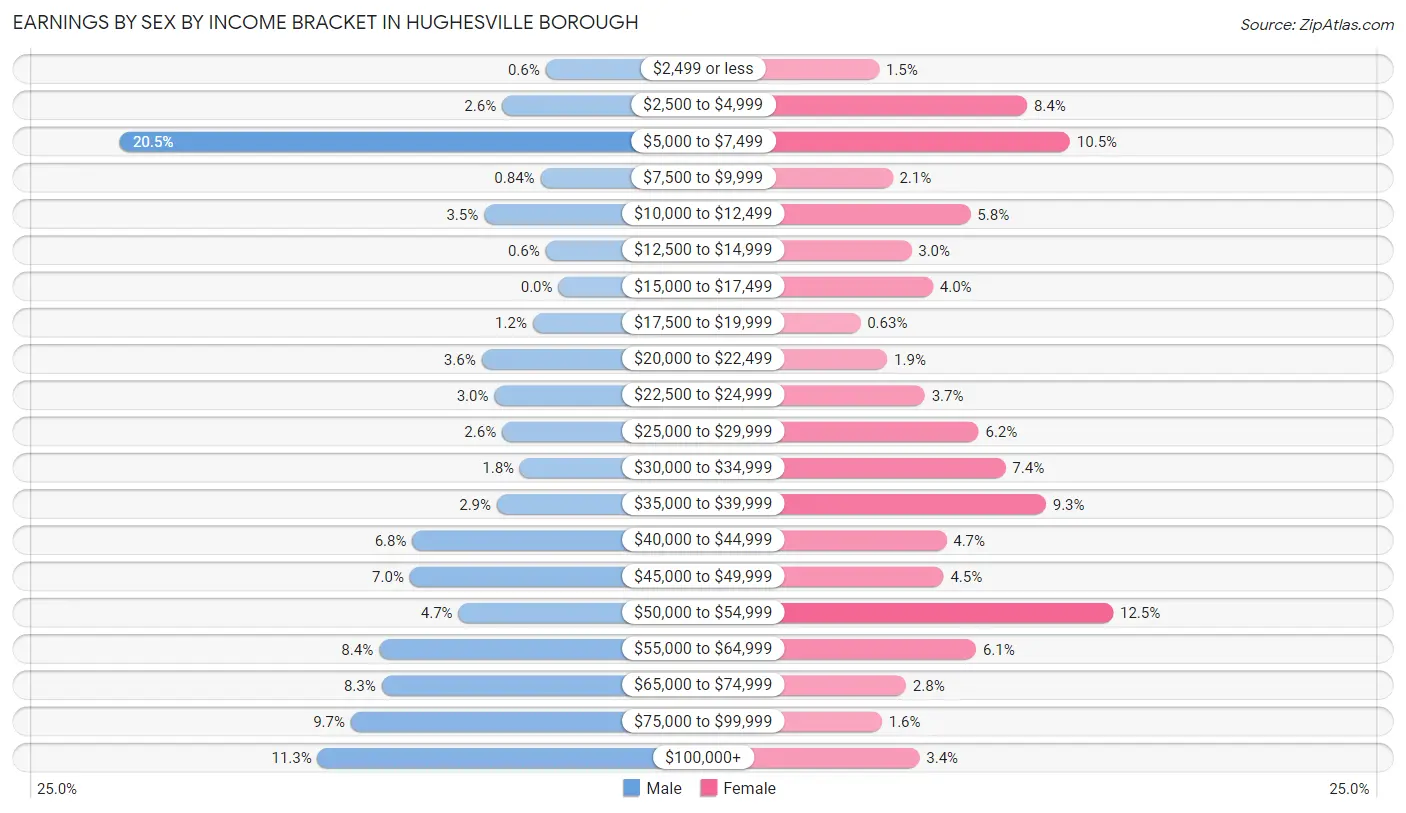
| Income | Male | Female |
| $2,499 or less | 5 (0.6%) | 12 (1.5%) |
| $2,500 to $4,999 | 22 (2.6%) | 67 (8.4%) |
| $5,000 to $7,499 | 171 (20.5%) | 83 (10.4%) |
| $7,500 to $9,999 | 7 (0.8%) | 17 (2.1%) |
| $10,000 to $12,499 | 29 (3.5%) | 46 (5.8%) |
| $12,500 to $14,999 | 5 (0.6%) | 24 (3.0%) |
| $15,000 to $17,499 | 0 (0.0%) | 32 (4.0%) |
| $17,500 to $19,999 | 10 (1.2%) | 5 (0.6%) |
| $20,000 to $22,499 | 30 (3.6%) | 15 (1.9%) |
| $22,500 to $24,999 | 25 (3.0%) | 29 (3.6%) |
| $25,000 to $29,999 | 22 (2.6%) | 49 (6.2%) |
| $30,000 to $34,999 | 15 (1.8%) | 59 (7.4%) |
| $35,000 to $39,999 | 24 (2.9%) | 74 (9.3%) |
| $40,000 to $44,999 | 57 (6.8%) | 37 (4.7%) |
| $45,000 to $49,999 | 58 (7.0%) | 36 (4.5%) |
| $50,000 to $54,999 | 39 (4.7%) | 99 (12.5%) |
| $55,000 to $64,999 | 70 (8.4%) | 48 (6.0%) |
| $65,000 to $74,999 | 69 (8.3%) | 22 (2.8%) |
| $75,000 to $99,999 | 81 (9.7%) | 13 (1.6%) |
| $100,000+ | 94 (11.3%) | 27 (3.4%) |
| Total | 833 (100.0%) | 794 (100.0%) |
Earnings by Sex by Educational Attainment in Hughesville borough
Average earnings in Hughesville borough are $47,171 for men and $35,084 for women, a difference of 25.6%. Men with an educational attainment of bachelor's degree enjoy the highest average annual earnings of $63,421, while those with less than high school education earn the least with $6,536. Women with an educational attainment of graduate degree earn the most with the average annual earnings of $68,750, while those with high school diploma education have the smallest earnings of $17,202.
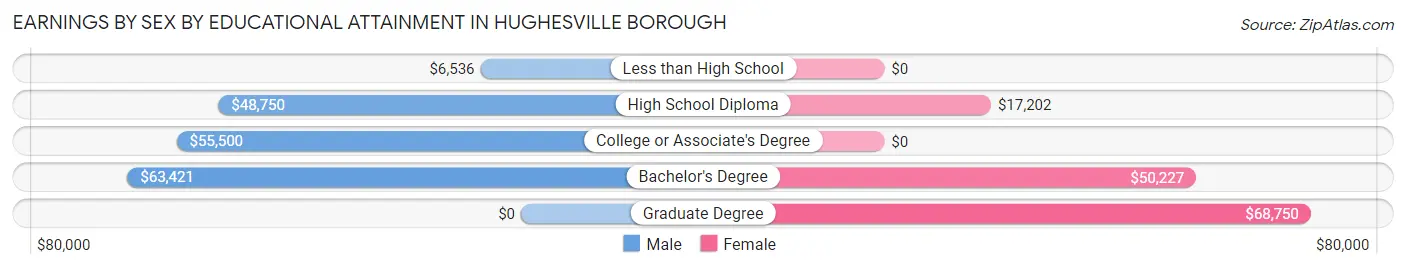
| Educational Attainment | Male Income | Female Income |
| Less than High School | $6,536 | $0 |
| High School Diploma | $48,750 | $17,202 |
| College or Associate's Degree | $55,500 | $0 |
| Bachelor's Degree | $63,421 | $50,227 |
| Graduate Degree | - | - |
| Total | $47,171 | $35,084 |
Family Income in Hughesville borough
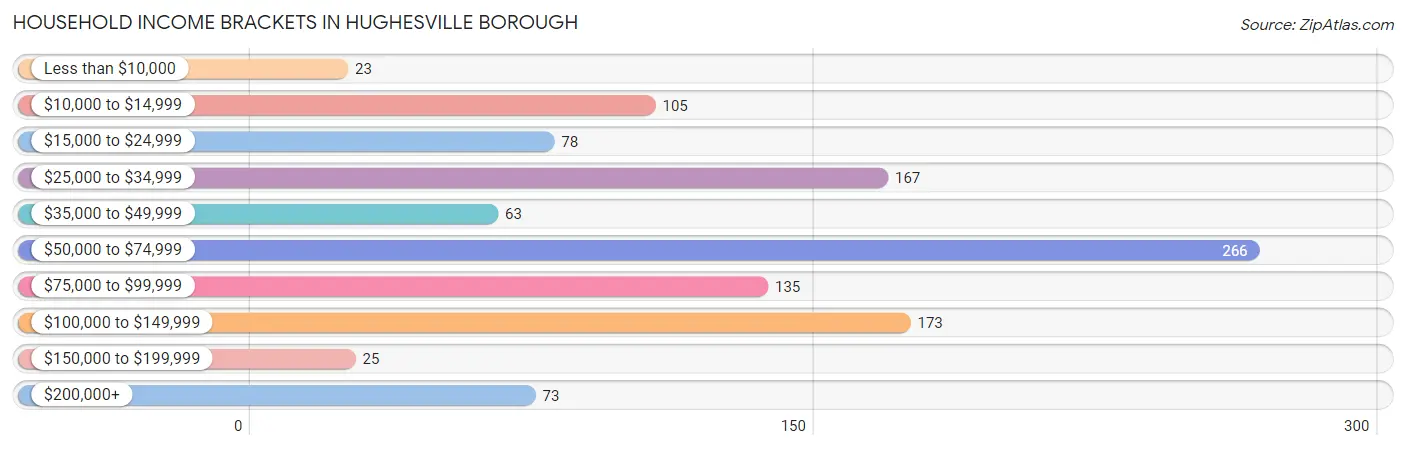
Family Income Brackets in Hughesville borough
According to the Hughesville borough family income data, there are 218 families falling into the $50,000 to $74,999 income range, which is the most common income bracket and makes up 29.2% of all families. Conversely, the $35,000 to $49,999 income bracket is the least frequent group with only 8 families (1.1%) belonging to this category.
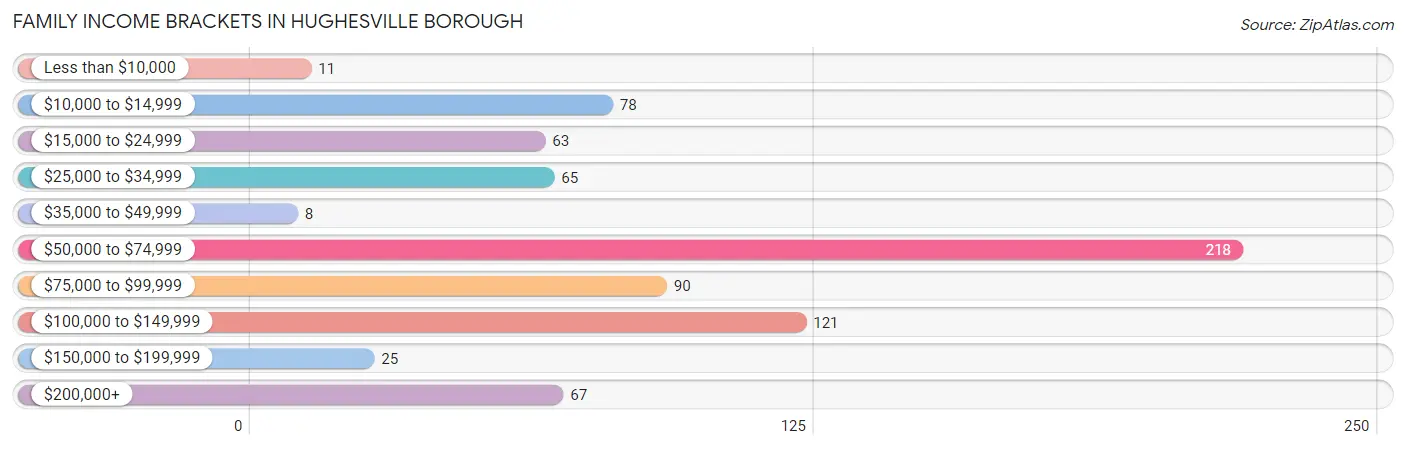
| Income Bracket | # Families | % Families |
| Less than $10,000 | 11 | 1.5% |
| $10,000 to $14,999 | 78 | 10.5% |
| $15,000 to $24,999 | 63 | 8.4% |
| $25,000 to $34,999 | 65 | 8.7% |
| $35,000 to $49,999 | 8 | 1.1% |
| $50,000 to $74,999 | 218 | 29.2% |
| $75,000 to $99,999 | 90 | 12.1% |
| $100,000 to $149,999 | 121 | 16.2% |
| $150,000 to $199,999 | 25 | 3.4% |
| $200,000+ | 67 | 9.0% |
Family Income by Famaliy Size in Hughesville borough
3-person families (163 | 21.8%) account for the highest median family income in Hughesville borough with $108,194 per family, while 3-person families (163 | 21.8%) have the highest median income of $36,065 per family member.
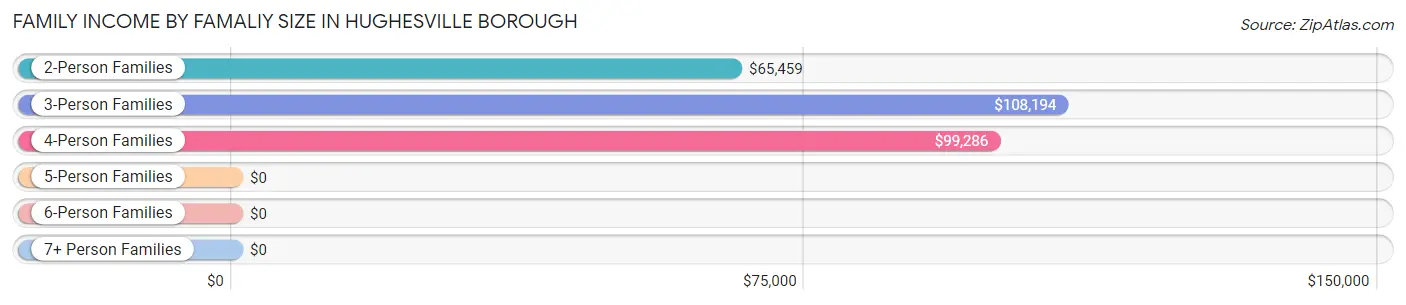
| Income Bracket | # Families | Median Income |
| 2-Person Families | 408 (54.7%) | $65,459 |
| 3-Person Families | 163 (21.8%) | $108,194 |
| 4-Person Families | 118 (15.8%) | $99,286 |
| 5-Person Families | 43 (5.8%) | $0 |
| 6-Person Families | 13 (1.7%) | $0 |
| 7+ Person Families | 1 (0.1%) | $0 |
| Total | 746 (100.0%) | $67,158 |
Family Income by Number of Earners in Hughesville borough
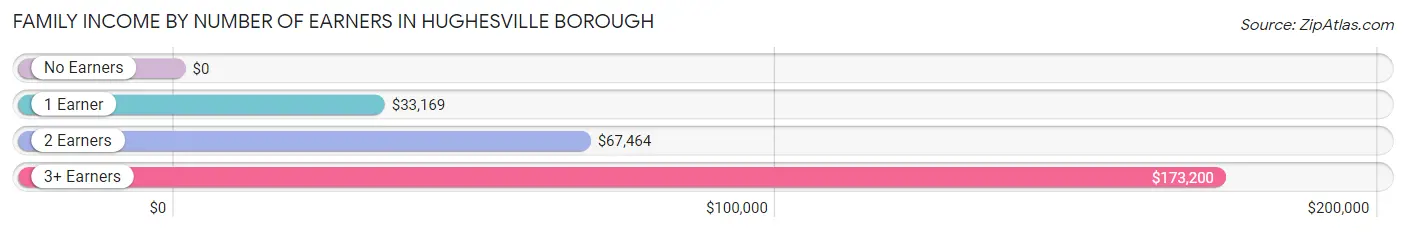
| Number of Earners | # Families | Median Income |
| No Earners | 76 (10.2%) | $0 |
| 1 Earner | 161 (21.6%) | $33,169 |
| 2 Earners | 379 (50.8%) | $67,464 |
| 3+ Earners | 130 (17.4%) | $173,200 |
| Total | 746 (100.0%) | $67,158 |
Household Income in Hughesville borough
Household Income Brackets in Hughesville borough
With 266 households falling in the category, the $50,000 to $74,999 income range is the most frequent in Hughesville borough, accounting for 24.0% of all households. In contrast, only 23 households (2.1%) fall into the less than $10,000 income bracket, making it the least populous group.
| Income Bracket | # Households | % Households |
| Less than $10,000 | 23 | 2.1% |
| $10,000 to $14,999 | 105 | 9.5% |
| $15,000 to $24,999 | 78 | 7.0% |
| $25,000 to $34,999 | 167 | 15.1% |
| $35,000 to $49,999 | 63 | 5.7% |
| $50,000 to $74,999 | 266 | 24.0% |
| $75,000 to $99,999 | 135 | 12.2% |
| $100,000 to $149,999 | 173 | 15.6% |
| $150,000 to $199,999 | 25 | 2.3% |
| $200,000+ | 73 | 6.6% |
Household Income by Householder Age in Hughesville borough
The median household income in Hughesville borough is $65,897, with the highest median household income of $70,682 found in the 25 to 44 years age bracket for the primary householder. A total of 316 households (28.5%) fall into this category. Meanwhile, the 15 to 24 years age bracket for the primary householder has the lowest median household income of $33,393, with 37 households (3.3%) in this group.
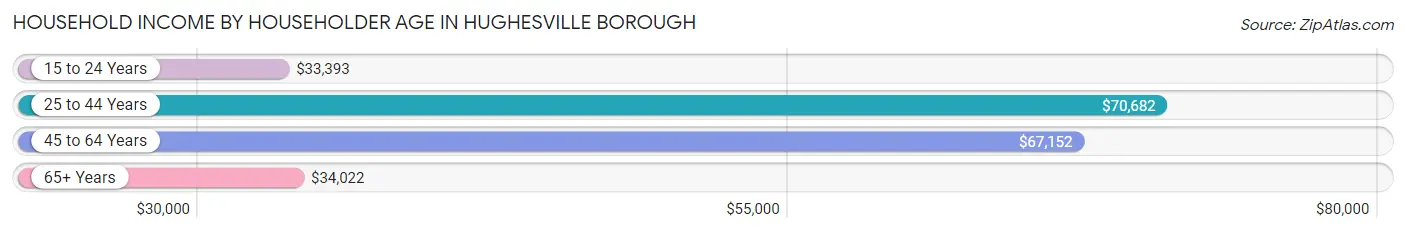
| Income Bracket | # Households | Median Income |
| 15 to 24 Years | 37 (3.3%) | $33,393 |
| 25 to 44 Years | 316 (28.5%) | $70,682 |
| 45 to 64 Years | 513 (46.3%) | $67,152 |
| 65+ Years | 242 (21.8%) | $34,022 |
| Total | 1,108 (100.0%) | $65,897 |
Poverty in Hughesville borough
Income Below Poverty by Sex and Age in Hughesville borough
With 13.4% poverty level for males and 21.7% for females among the residents of Hughesville borough, 6 to 11 year old males and 5 year old females are the most vulnerable to poverty, with 29 males (42.0%) and 18 females (100.0%) in their respective age groups living below the poverty level.
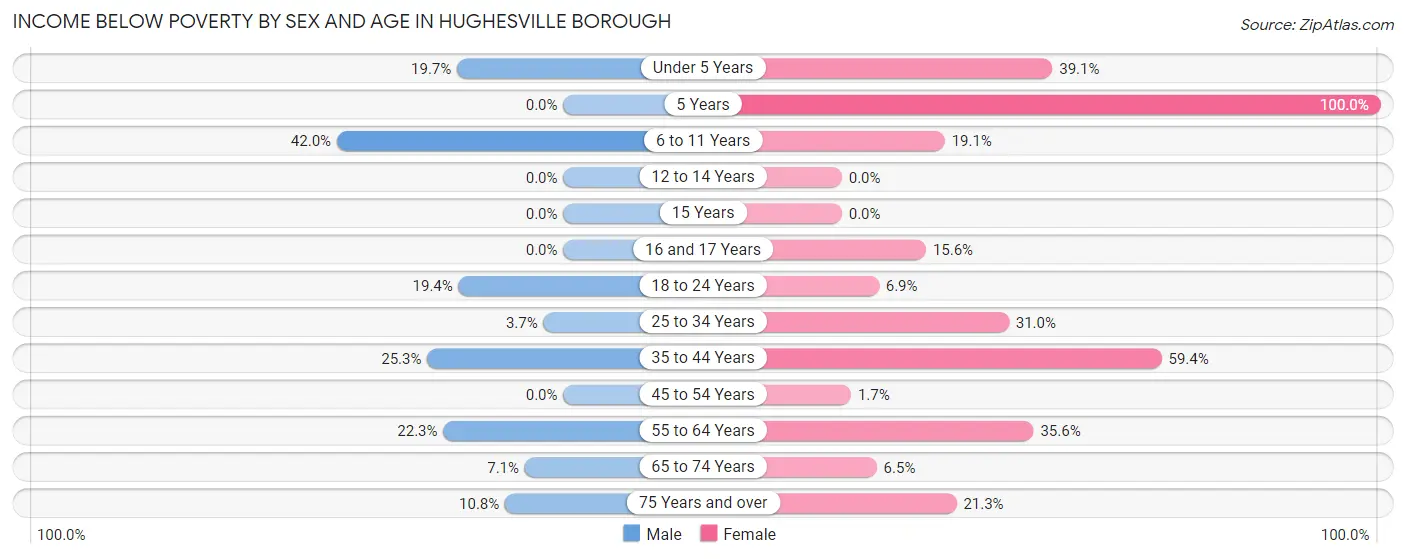
| Age Bracket | Male | Female |
| Under 5 Years | 14 (19.7%) | 34 (39.1%) |
| 5 Years | 0 (0.0%) | 18 (100.0%) |
| 6 to 11 Years | 29 (42.0%) | 17 (19.1%) |
| 12 to 14 Years | 0 (0.0%) | 0 (0.0%) |
| 15 Years | 0 (0.0%) | 0 (0.0%) |
| 16 and 17 Years | 0 (0.0%) | 5 (15.6%) |
| 18 to 24 Years | 14 (19.4%) | 7 (6.9%) |
| 25 to 34 Years | 8 (3.7%) | 53 (31.0%) |
| 35 to 44 Years | 25 (25.3%) | 92 (59.4%) |
| 45 to 54 Years | 0 (0.0%) | 5 (1.7%) |
| 55 to 64 Years | 51 (22.3%) | 37 (35.6%) |
| 65 to 74 Years | 5 (7.1%) | 9 (6.5%) |
| 75 Years and over | 4 (10.8%) | 20 (21.3%) |
| Total | 150 (13.4%) | 297 (21.7%) |
Income Above Poverty by Sex and Age in Hughesville borough
According to the poverty statistics in Hughesville borough, males aged 12 to 14 years and females aged 12 to 14 years are the age groups that are most secure financially, with 100.0% of males and 100.0% of females in these age groups living above the poverty line.
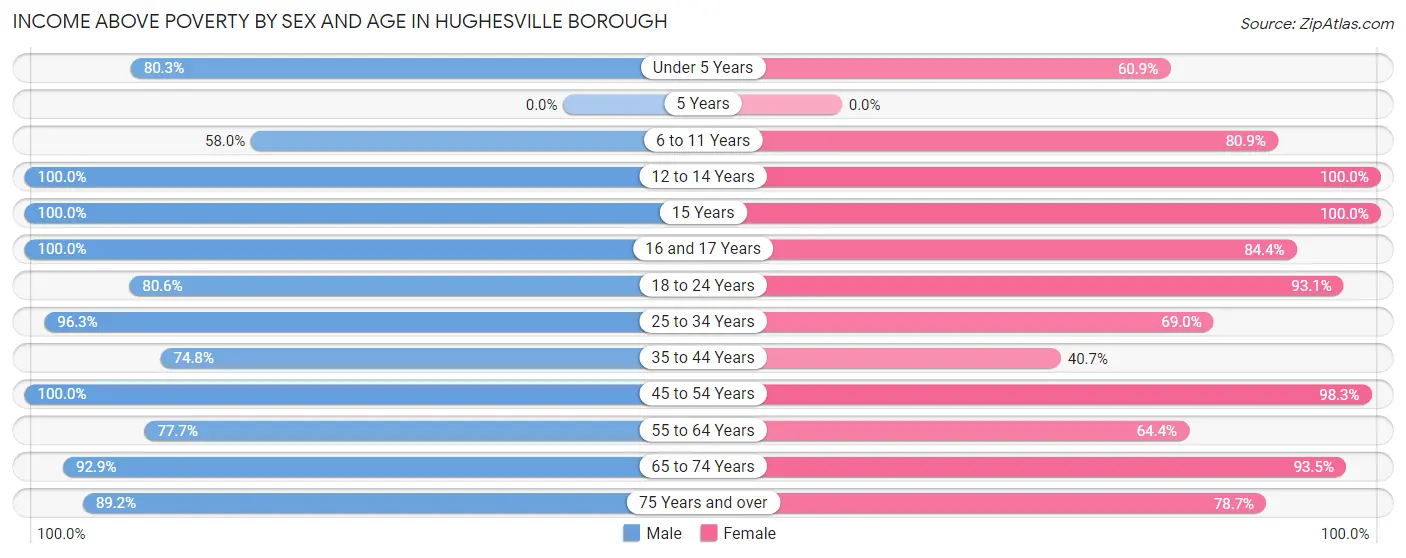
| Age Bracket | Male | Female |
| Under 5 Years | 57 (80.3%) | 53 (60.9%) |
| 5 Years | 0 (0.0%) | 0 (0.0%) |
| 6 to 11 Years | 40 (58.0%) | 72 (80.9%) |
| 12 to 14 Years | 18 (100.0%) | 69 (100.0%) |
| 15 Years | 19 (100.0%) | 17 (100.0%) |
| 16 and 17 Years | 41 (100.0%) | 27 (84.4%) |
| 18 to 24 Years | 58 (80.6%) | 95 (93.1%) |
| 25 to 34 Years | 210 (96.3%) | 118 (69.0%) |
| 35 to 44 Years | 74 (74.8%) | 63 (40.6%) |
| 45 to 54 Years | 178 (100.0%) | 287 (98.3%) |
| 55 to 64 Years | 178 (77.7%) | 67 (64.4%) |
| 65 to 74 Years | 65 (92.9%) | 130 (93.5%) |
| 75 Years and over | 33 (89.2%) | 74 (78.7%) |
| Total | 971 (86.6%) | 1,072 (78.3%) |
Income Below Poverty Among Married-Couple Families in Hughesville borough
The poverty statistics for married-couple families in Hughesville borough show that 10.5% or 60 of the total 569 families live below the poverty line. Families with no children have the highest poverty rate of 13.5%, comprising of 51 families. On the other hand, families with 3 or 4 children have the lowest poverty rate of 0.0%, which includes 0 families.
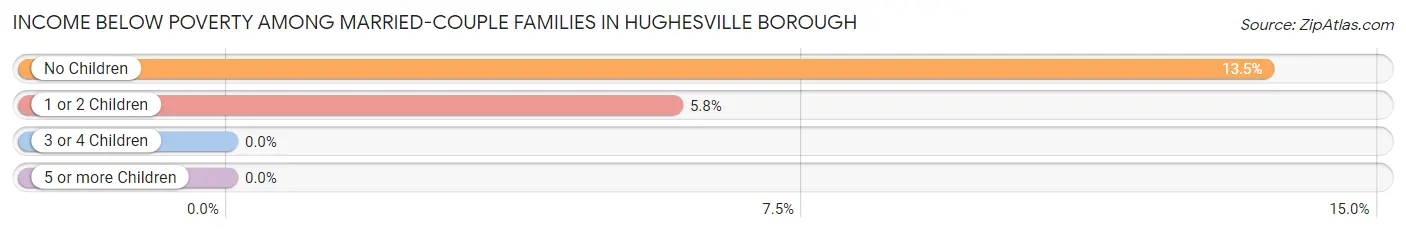
| Children | Above Poverty | Below Poverty |
| No Children | 326 (86.5%) | 51 (13.5%) |
| 1 or 2 Children | 146 (94.2%) | 9 (5.8%) |
| 3 or 4 Children | 36 (100.0%) | 0 (0.0%) |
| 5 or more Children | 1 (100.0%) | 0 (0.0%) |
| Total | 509 (89.5%) | 60 (10.5%) |
Income Below Poverty Among Single-Parent Households in Hughesville borough
According to the poverty data in Hughesville borough, 14.3% or 5 single-father households and 45.8% or 65 single-mother households are living below the poverty line. Among single-father households, those with no children have the highest poverty rate, with 5 households (100.0%) experiencing poverty. Likewise, among single-mother households, those with 3 or 4 children have the highest poverty rate, with 13 households (72.2%) falling below the poverty line.
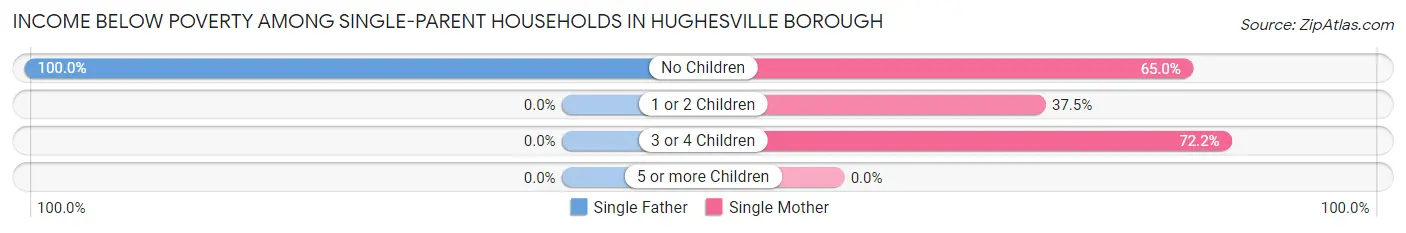
| Children | Single Father | Single Mother |
| No Children | 5 (100.0%) | 13 (65.0%) |
| 1 or 2 Children | 0 (0.0%) | 39 (37.5%) |
| 3 or 4 Children | 0 (0.0%) | 13 (72.2%) |
| 5 or more Children | 0 (0.0%) | 0 (0.0%) |
| Total | 5 (14.3%) | 65 (45.8%) |
Income Below Poverty Among Married-Couple vs Single-Parent Households in Hughesville borough
The poverty data for Hughesville borough shows that 60 of the married-couple family households (10.5%) and 70 of the single-parent households (39.6%) are living below the poverty level. Within the married-couple family households, those with no children have the highest poverty rate, with 51 households (13.5%) falling below the poverty line. Among the single-parent households, those with 3 or 4 children have the highest poverty rate, with 13 household (72.2%) living below poverty.
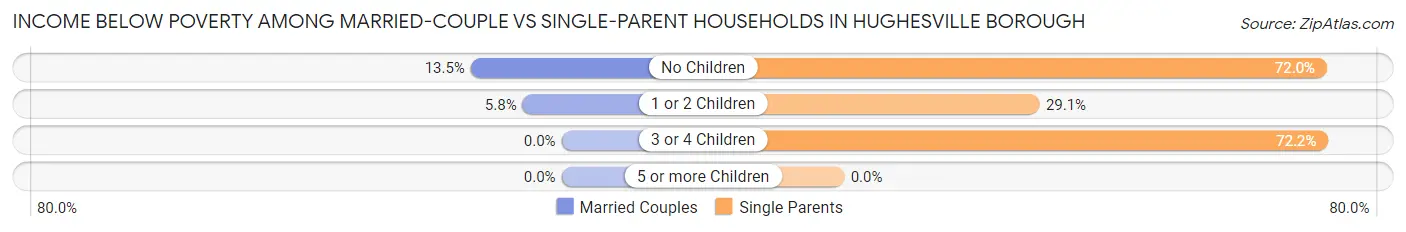
| Children | Married-Couple Families | Single-Parent Households |
| No Children | 51 (13.5%) | 18 (72.0%) |
| 1 or 2 Children | 9 (5.8%) | 39 (29.1%) |
| 3 or 4 Children | 0 (0.0%) | 13 (72.2%) |
| 5 or more Children | 0 (0.0%) | 0 (0.0%) |
| Total | 60 (10.5%) | 70 (39.6%) |
Race in Hughesville borough
The most populous races in Hughesville borough are White / Caucasian (2,339 | 93.1%), Two or more Races (96 | 3.8%), and Hispanic or Latino (87 | 3.5%).
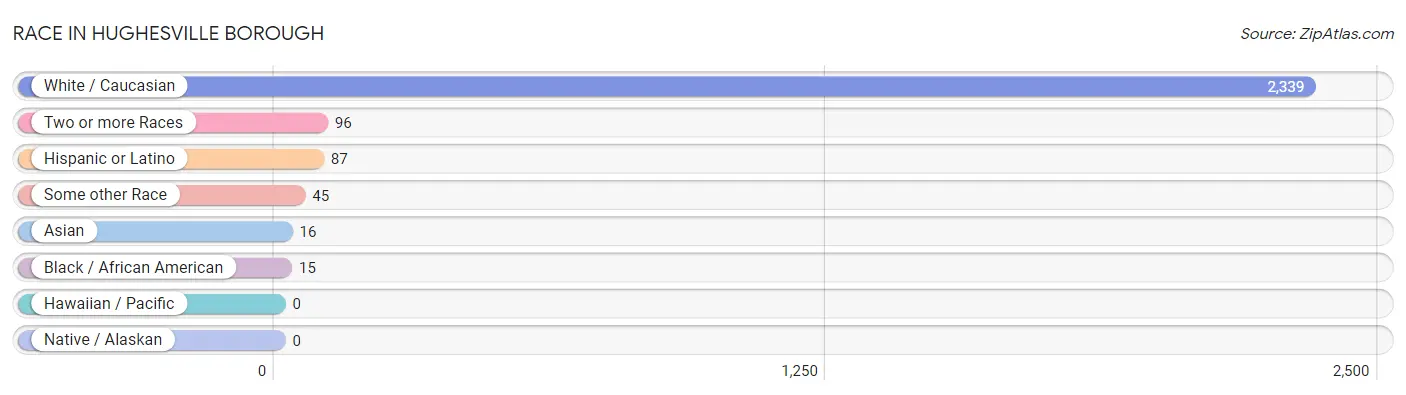
| Race | # Population | % Population |
| Asian | 16 | 0.6% |
| Black / African American | 15 | 0.6% |
| Hawaiian / Pacific | 0 | 0.0% |
| Hispanic or Latino | 87 | 3.5% |
| Native / Alaskan | 0 | 0.0% |
| White / Caucasian | 2,339 | 93.1% |
| Two or more Races | 96 | 3.8% |
| Some other Race | 45 | 1.8% |
| Total | 2,511 | 100.0% |
Ancestry in Hughesville borough
The most populous ancestries reported in Hughesville borough are German (771 | 30.7%), Irish (384 | 15.3%), English (257 | 10.2%), Italian (144 | 5.7%), and American (134 | 5.3%), together accounting for 67.3% of all Hughesville borough residents.
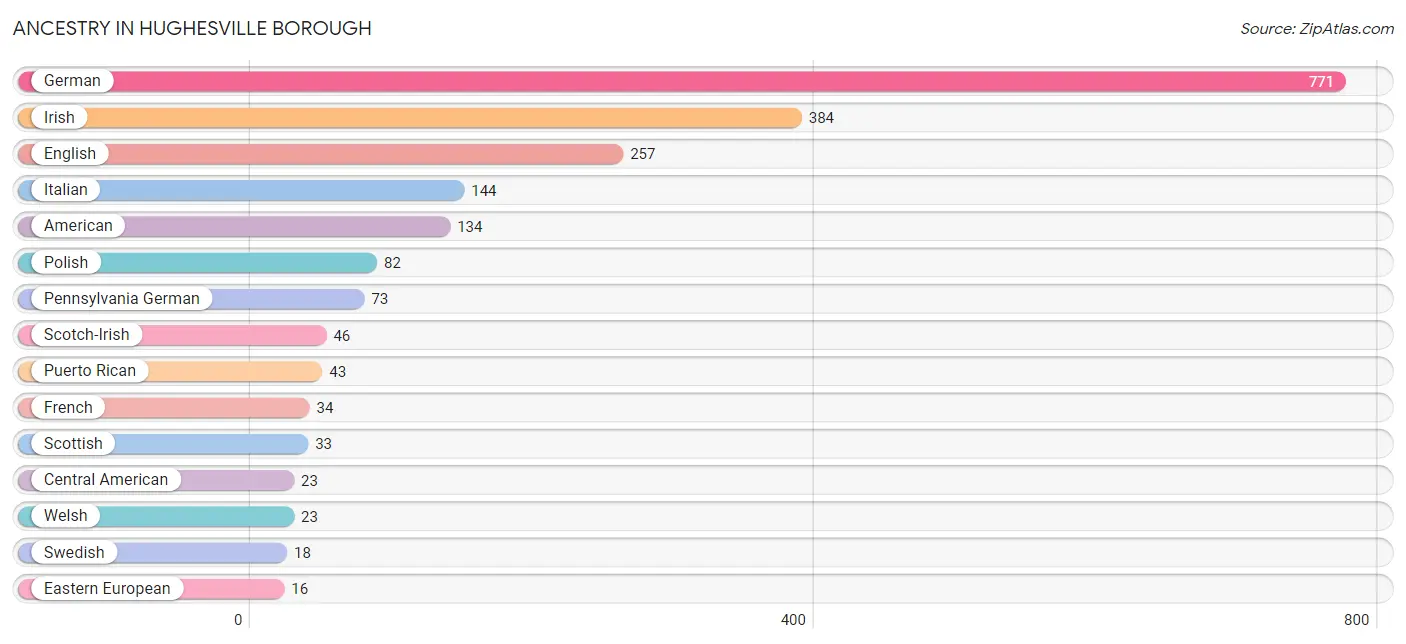
| Ancestry | # Population | % Population |
| African | 9 | 0.4% |
| American | 134 | 5.3% |
| British | 4 | 0.2% |
| Canadian | 5 | 0.2% |
| Central American | 23 | 0.9% |
| Cuban | 15 | 0.6% |
| Czech | 7 | 0.3% |
| Czechoslovakian | 5 | 0.2% |
| Dutch | 15 | 0.6% |
| Eastern European | 16 | 0.6% |
| English | 257 | 10.2% |
| French | 34 | 1.3% |
| German | 771 | 30.7% |
| Honduran | 8 | 0.3% |
| Hungarian | 6 | 0.2% |
| Indian (Asian) | 11 | 0.4% |
| Irish | 384 | 15.3% |
| Italian | 144 | 5.7% |
| Korean | 16 | 0.6% |
| Lithuanian | 8 | 0.3% |
| Pennsylvania German | 73 | 2.9% |
| Polish | 82 | 3.3% |
| Puerto Rican | 43 | 1.7% |
| Salvadoran | 15 | 0.6% |
| Scotch-Irish | 46 | 1.8% |
| Scottish | 33 | 1.3% |
| Slovak | 6 | 0.2% |
| Sri Lankan | 12 | 0.5% |
| Subsaharan African | 9 | 0.4% |
| Swedish | 18 | 0.7% |
| Swiss | 5 | 0.2% |
| Welsh | 23 | 0.9% | View All 32 Rows |
Immigrants in Hughesville borough
The most numerous immigrant groups reported in Hughesville borough came from Central America (23 | 0.9%), Latin America (23 | 0.9%), El Salvador (15 | 0.6%), Europe (14 | 0.6%), and Germany (14 | 0.6%), together accounting for 3.6% of all Hughesville borough residents.
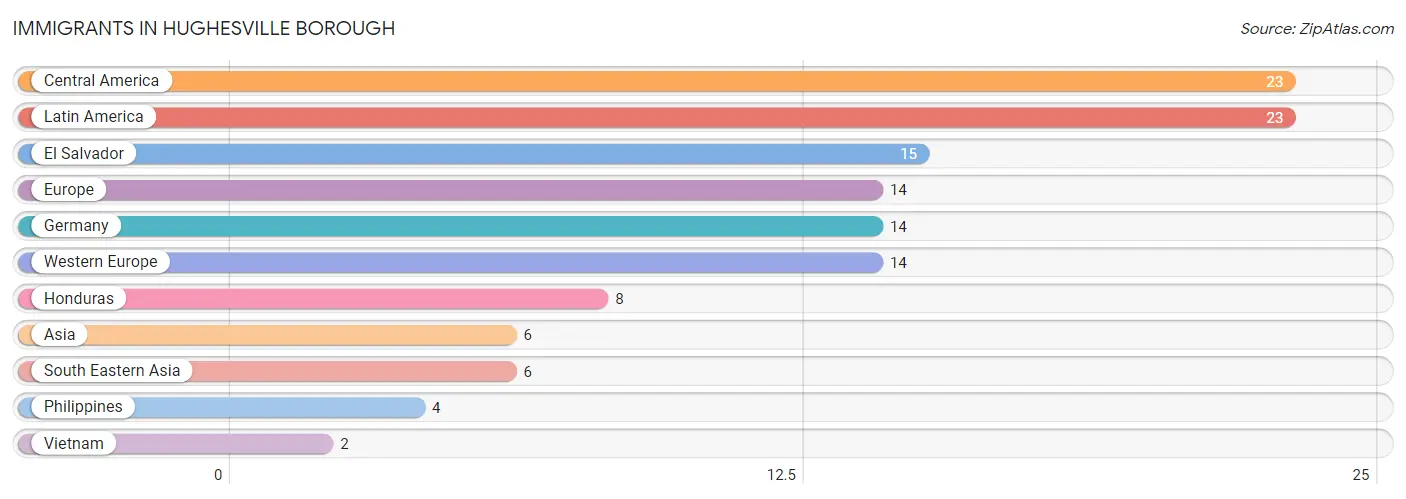
| Immigration Origin | # Population | % Population |
| Asia | 6 | 0.2% |
| Central America | 23 | 0.9% |
| El Salvador | 15 | 0.6% |
| Europe | 14 | 0.6% |
| Germany | 14 | 0.6% |
| Honduras | 8 | 0.3% |
| Latin America | 23 | 0.9% |
| Philippines | 4 | 0.2% |
| South Eastern Asia | 6 | 0.2% |
| Vietnam | 2 | 0.1% |
| Western Europe | 14 | 0.6% | View All 11 Rows |
Sex and Age in Hughesville borough
Sex and Age in Hughesville borough
The most populous age groups in Hughesville borough are 60 to 64 Years (170 | 14.9%) for men and 50 to 54 Years (207 | 15.1%) for women.
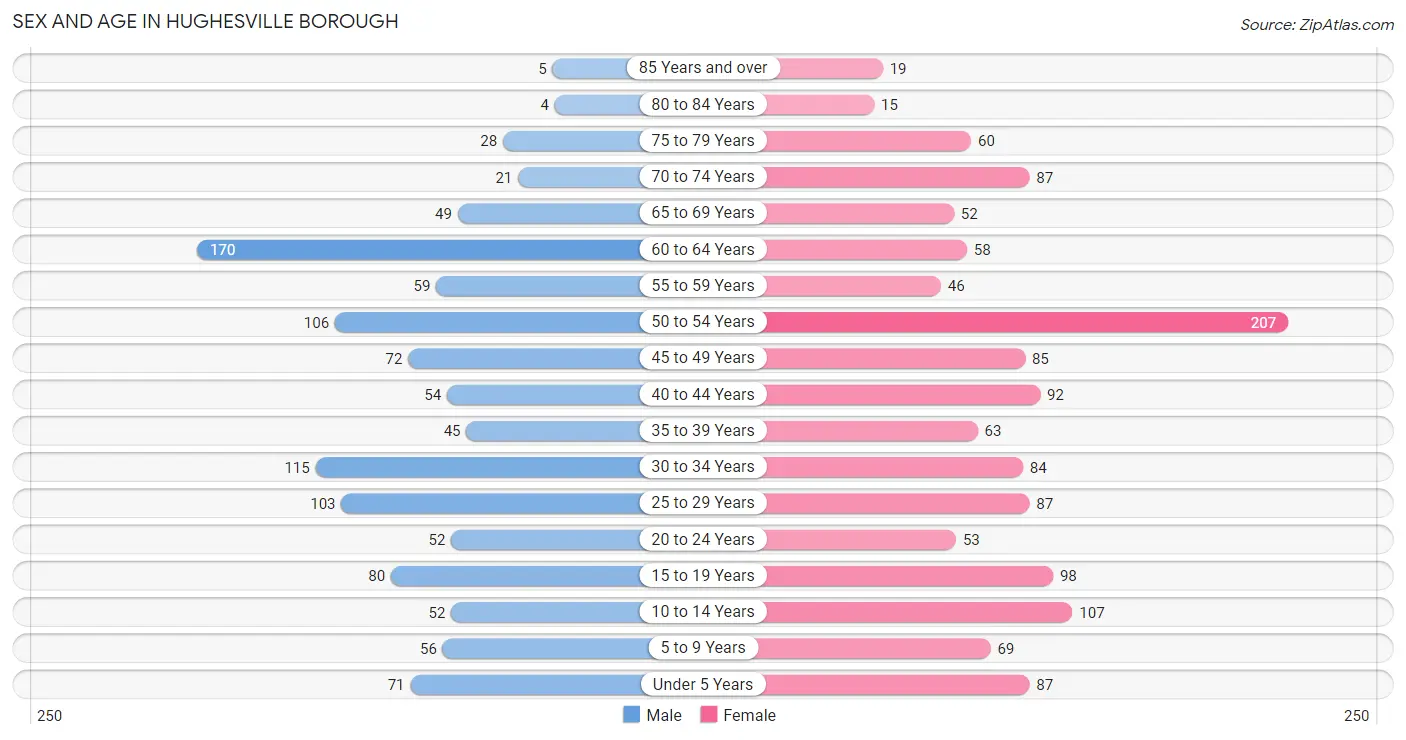
| Age Bracket | Male | Female |
| Under 5 Years | 71 (6.2%) | 87 (6.4%) |
| 5 to 9 Years | 56 (4.9%) | 69 (5.0%) |
| 10 to 14 Years | 52 (4.5%) | 107 (7.8%) |
| 15 to 19 Years | 80 (7.0%) | 98 (7.2%) |
| 20 to 24 Years | 52 (4.5%) | 53 (3.9%) |
| 25 to 29 Years | 103 (9.0%) | 87 (6.4%) |
| 30 to 34 Years | 115 (10.1%) | 84 (6.1%) |
| 35 to 39 Years | 45 (3.9%) | 63 (4.6%) |
| 40 to 44 Years | 54 (4.7%) | 92 (6.7%) |
| 45 to 49 Years | 72 (6.3%) | 85 (6.2%) |
| 50 to 54 Years | 106 (9.3%) | 207 (15.1%) |
| 55 to 59 Years | 59 (5.2%) | 46 (3.4%) |
| 60 to 64 Years | 170 (14.9%) | 58 (4.2%) |
| 65 to 69 Years | 49 (4.3%) | 52 (3.8%) |
| 70 to 74 Years | 21 (1.8%) | 87 (6.4%) |
| 75 to 79 Years | 28 (2.5%) | 60 (4.4%) |
| 80 to 84 Years | 4 (0.4%) | 15 (1.1%) |
| 85 Years and over | 5 (0.4%) | 19 (1.4%) |
| Total | 1,142 (100.0%) | 1,369 (100.0%) |
Families and Households in Hughesville borough
Median Family Size in Hughesville borough
The median family size in Hughesville borough is 2.65 persons per family, with married-couple families (569 | 76.3%) accounting for the largest median family size of 2.71 persons per family. On the other hand, single male/father families (35 | 4.7%) represent the smallest median family size with 2.14 persons per family.
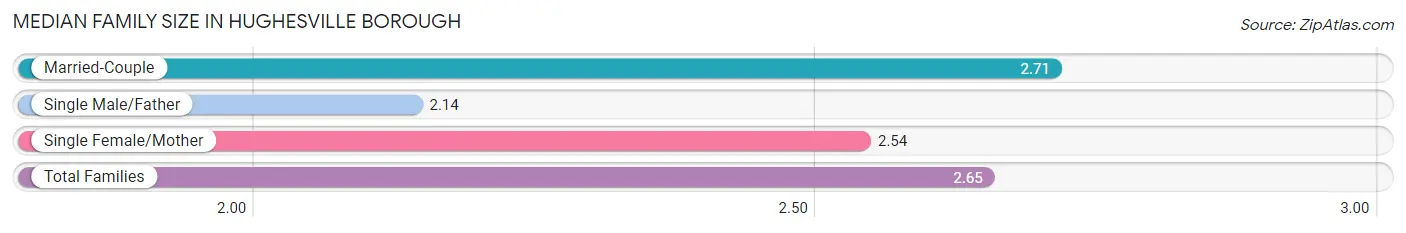
| Family Type | # Families | Family Size |
| Married-Couple | 569 (76.3%) | 2.71 |
| Single Male/Father | 35 (4.7%) | 2.14 |
| Single Female/Mother | 142 (19.0%) | 2.54 |
| Total Families | 746 (100.0%) | 2.65 |
Median Household Size in Hughesville borough
The median household size in Hughesville borough is 2.27 persons per household, with single male/father households (35 | 3.2%) accounting for the largest median household size of 2.8 persons per household. non-family households (362 | 32.7%) represent the smallest median household size with 1.25 persons per household.
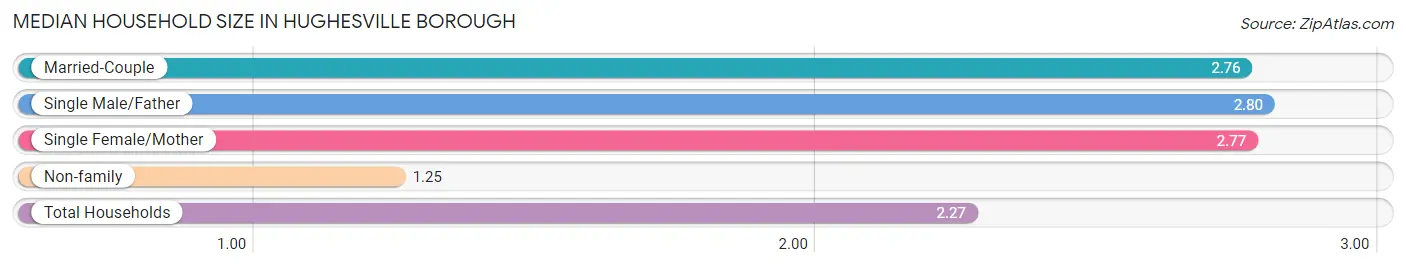
| Household Type | # Households | Household Size |
| Married-Couple | 569 (51.3%) | 2.76 |
| Single Male/Father | 35 (3.2%) | 2.80 |
| Single Female/Mother | 142 (12.8%) | 2.77 |
| Non-family | 362 (32.7%) | 1.25 |
| Total Households | 1,108 (100.0%) | 2.27 |
Household Size by Marriage Status in Hughesville borough
Out of a total of 1,108 households in Hughesville borough, 746 (67.3%) are family households, while 362 (32.7%) are nonfamily households. The most numerous type of family households are 2-person households, comprising 370, and the most common type of nonfamily households are 1-person households, comprising 278.
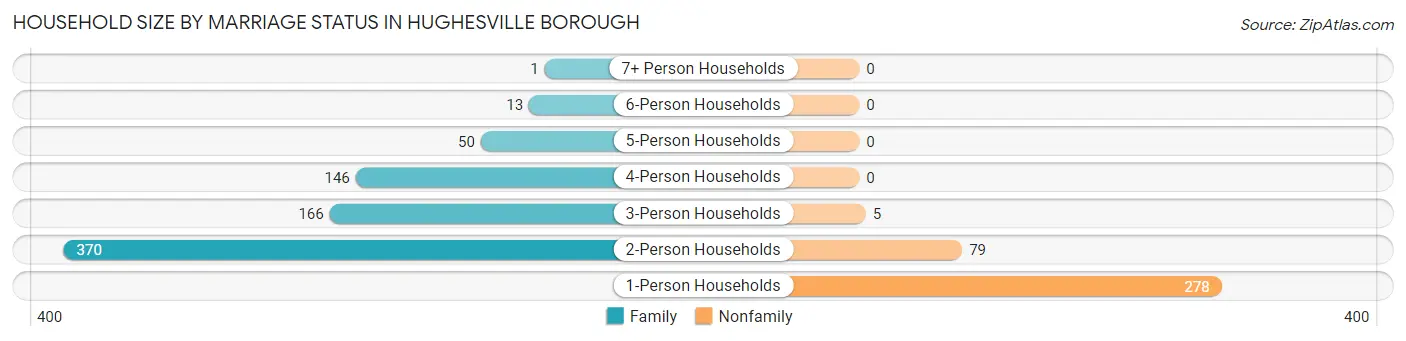
| Household Size | Family Households | Nonfamily Households |
| 1-Person Households | - | 278 (25.1%) |
| 2-Person Households | 370 (33.4%) | 79 (7.1%) |
| 3-Person Households | 166 (15.0%) | 5 (0.4%) |
| 4-Person Households | 146 (13.2%) | 0 (0.0%) |
| 5-Person Households | 50 (4.5%) | 0 (0.0%) |
| 6-Person Households | 13 (1.2%) | 0 (0.0%) |
| 7+ Person Households | 1 (0.1%) | 0 (0.0%) |
| Total | 746 (67.3%) | 362 (32.7%) |
Female Fertility in Hughesville borough
Fertility by Age in Hughesville borough
Average fertility rate in Hughesville borough is 79.0 births per 1,000 women. Women in the age bracket of 20 to 34 years have the highest fertility rate with 179.0 births per 1,000 women. Women in the age bracket of 20 to 34 years acount for 87.0% of all women with births.
| Age Bracket | Women with Births | Births / 1,000 Women |
| 15 to 19 years | 0 (0.0%) | 0.0 |
| 20 to 34 years | 40 (87.0%) | 179.0 |
| 35 to 50 years | 6 (13.0%) | 23.0 |
| Total | 46 (100.0%) | 79.0 |
Fertility by Age by Marriage Status in Hughesville borough
65.2% of women with births (46) in Hughesville borough are married. The highest percentage of unmarried women with births falls into 35 to 50 years age bracket with 50.0% of them unmarried at the time of birth, while the lowest percentage of unmarried women with births belong to 20 to 34 years age bracket with 32.5% of them unmarried.
| Age Bracket | Married | Unmarried |
| 15 to 19 years | 0 (0.0%) | 0 (0.0%) |
| 20 to 34 years | 27 (67.5%) | 13 (32.5%) |
| 35 to 50 years | 3 (50.0%) | 3 (50.0%) |
| Total | 30 (65.2%) | 16 (34.8%) |
Fertility by Education in Hughesville borough
| Educational Attainment | Women with Births | Births / 1,000 Women |
| Less than High School | 0 (0.0%) | 0.0 |
| High School Diploma | 13 (28.3%) | 69.0 |
| College or Associate's Degree | 0 (0.0%) | 0.0 |
| Bachelor's Degree | 33 (71.7%) | 217.0 |
| Graduate Degree | 0 (0.0%) | 0.0 |
| Total | 46 (100.0%) | 79.0 |
Fertility by Education by Marriage Status in Hughesville borough
34.8% of women with births in Hughesville borough are unmarried. Women with the educational attainment of bachelor's degree are most likely to be married with 90.9% of them married at childbirth, while women with the educational attainment of high school diploma are least likely to be married with 100.0% of them unmarried at childbirth.
| Educational Attainment | Married | Unmarried |
| Less than High School | 0 (0.0%) | 0 (0.0%) |
| High School Diploma | 0 (0.0%) | 13 (100.0%) |
| College or Associate's Degree | 0 (0.0%) | 0 (0.0%) |
| Bachelor's Degree | 30 (90.9%) | 3 (9.1%) |
| Graduate Degree | 0 (0.0%) | 0 (0.0%) |
| Total | 30 (65.2%) | 16 (34.8%) |
Employment Characteristics in Hughesville borough
Employment by Class of Employer in Hughesville borough
Among the 1,515 employed individuals in Hughesville borough, private company employees (1,077 | 71.1%), not-for-profit organizations (179 | 11.8%), and state government employees (165 | 10.9%) make up the most common classes of employment.
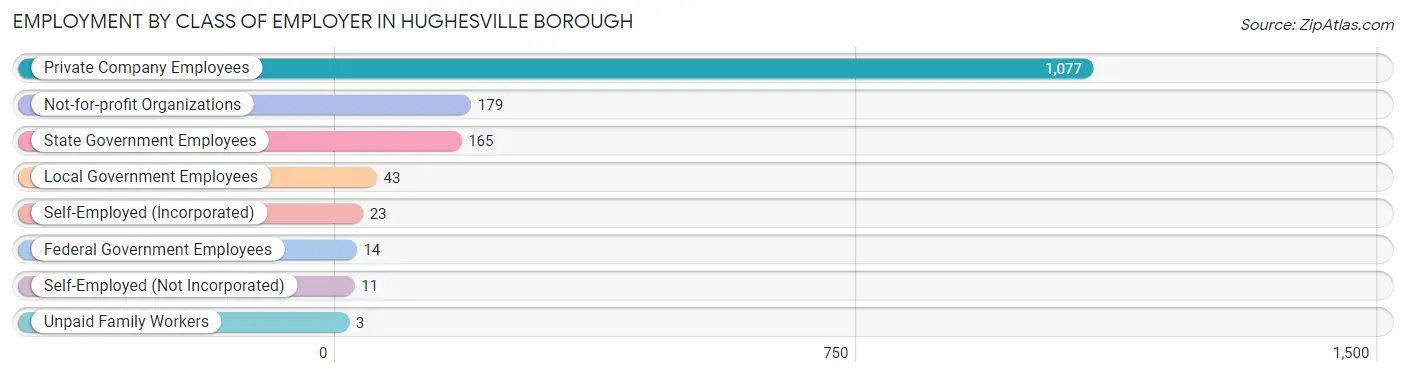
| Employer Class | # Employees | % Employees |
| Private Company Employees | 1,077 | 71.1% |
| Self-Employed (Incorporated) | 23 | 1.5% |
| Self-Employed (Not Incorporated) | 11 | 0.7% |
| Not-for-profit Organizations | 179 | 11.8% |
| Local Government Employees | 43 | 2.8% |
| State Government Employees | 165 | 10.9% |
| Federal Government Employees | 14 | 0.9% |
| Unpaid Family Workers | 3 | 0.2% |
| Total | 1,515 | 100.0% |
Employment Status by Age in Hughesville borough
According to the labor force statistics for Hughesville borough, out of the total population over 16 years of age (2,033), 78.8% or 1,602 individuals are in the labor force, with 4.2% or 67 of them unemployed. The age group with the highest labor force participation rate is 30 to 34 years, with 96.5% or 192 individuals in the labor force. Within the labor force, the 75 years and over age range has the highest percentage of unemployed individuals, with 23.5% or 4 of them being unemployed.
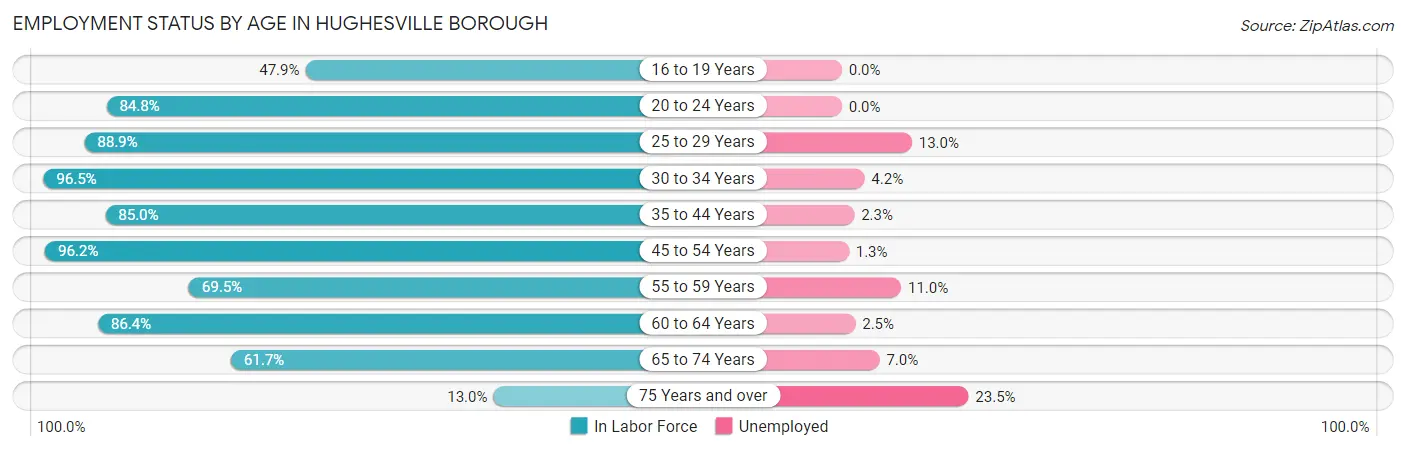
| Age Bracket | In Labor Force | Unemployed |
| 16 to 19 Years | 68 (47.9%) | 0 (0.0%) |
| 20 to 24 Years | 89 (84.8%) | 0 (0.0%) |
| 25 to 29 Years | 169 (88.9%) | 22 (13.0%) |
| 30 to 34 Years | 192 (96.5%) | 8 (4.2%) |
| 35 to 44 Years | 216 (85.0%) | 5 (2.3%) |
| 45 to 54 Years | 452 (96.2%) | 6 (1.3%) |
| 55 to 59 Years | 73 (69.5%) | 8 (11.0%) |
| 60 to 64 Years | 197 (86.4%) | 5 (2.5%) |
| 65 to 74 Years | 129 (61.7%) | 9 (7.0%) |
| 75 Years and over | 17 (13.0%) | 4 (23.5%) |
| Total | 1,602 (78.8%) | 67 (4.2%) |
Employment Status by Educational Attainment in Hughesville borough
According to labor force statistics for Hughesville borough, 89.8% of individuals (1,299) out of the total population between 25 and 64 years of age (1,446) are in the labor force, with 4.2% or 55 of them being unemployed. The group with the highest labor force participation rate are those with the educational attainment of less than high school, with 100.0% or 118 individuals in the labor force. Within the labor force, individuals with high school diploma education have the highest percentage of unemployment, with 9.9% or 42 of them being unemployed.
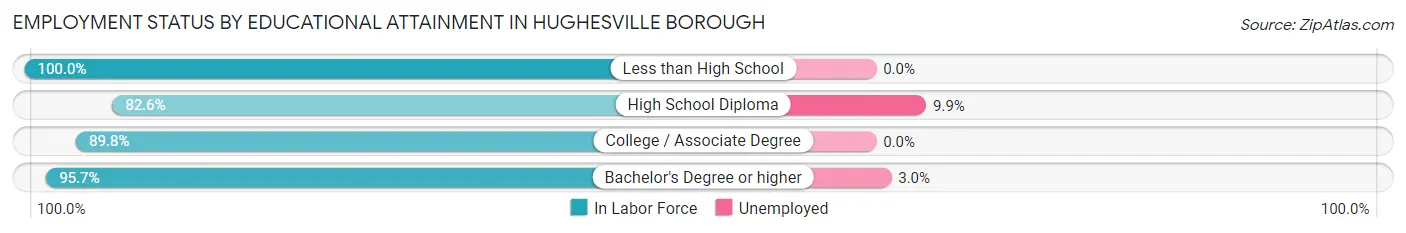
| Educational Attainment | In Labor Force | Unemployed |
| Less than High School | 118 (100.0%) | 0 (0.0%) |
| High School Diploma | 423 (82.6%) | 51 (9.9%) |
| College / Associate Degree | 353 (89.8%) | 0 (0.0%) |
| Bachelor's Degree or higher | 405 (95.7%) | 13 (3.0%) |
| Total | 1,299 (89.8%) | 61 (4.2%) |
Employment Occupations by Sex in Hughesville borough
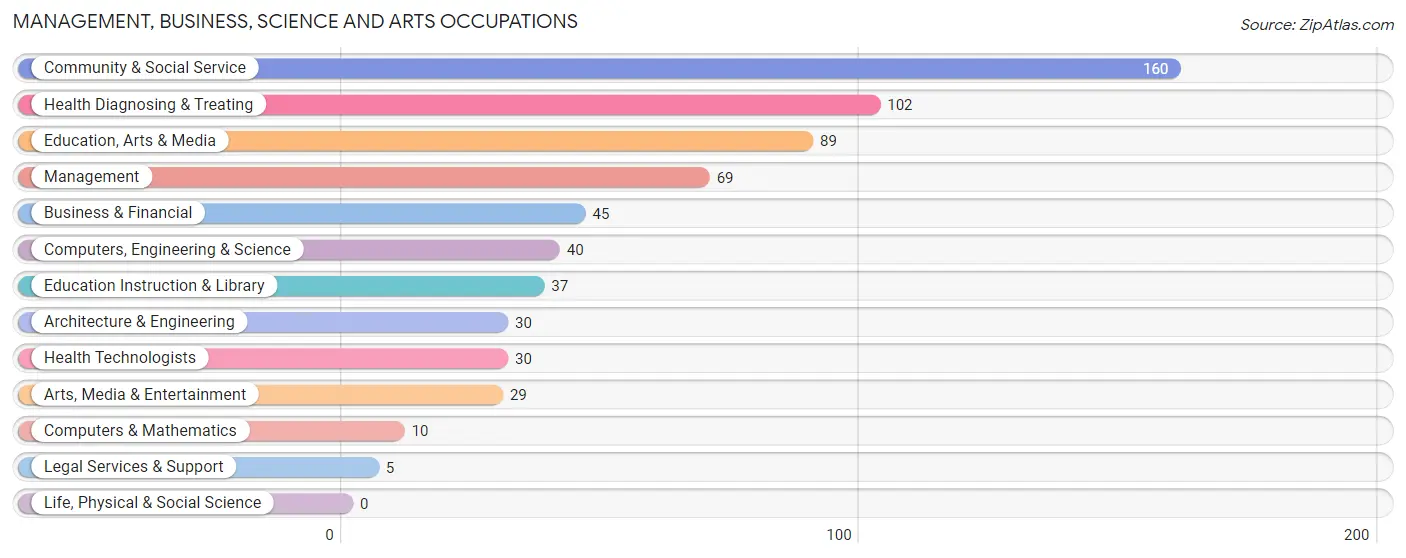
Management, Business, Science and Arts Occupations
The most common Management, Business, Science and Arts occupations in Hughesville borough are Community & Social Service (160 | 10.4%), Health Diagnosing & Treating (102 | 6.6%), Education, Arts & Media (89 | 5.8%), Management (69 | 4.5%), and Business & Financial (45 | 2.9%).
Management, Business, Science and Arts Occupations by Sex
Within the Management, Business, Science and Arts occupations in Hughesville borough, the most male-oriented occupations are Computers, Engineering & Science (100.0%), Computers & Mathematics (100.0%), and Architecture & Engineering (100.0%), while the most female-oriented occupations are Legal Services & Support (100.0%), Health Technologists (86.7%), and Education, Arts & Media (85.4%).
| Occupation | Male | Female |
| Management | 29 (42.0%) | 40 (58.0%) |
| Business & Financial | 14 (31.1%) | 31 (68.9%) |
| Computers, Engineering & Science | 40 (100.0%) | 0 (0.0%) |
| Computers & Mathematics | 10 (100.0%) | 0 (0.0%) |
| Architecture & Engineering | 30 (100.0%) | 0 (0.0%) |
| Life, Physical & Social Science | 0 (0.0%) | 0 (0.0%) |
| Community & Social Service | 37 (23.1%) | 123 (76.9%) |
| Education, Arts & Media | 13 (14.6%) | 76 (85.4%) |
| Legal Services & Support | 0 (0.0%) | 5 (100.0%) |
| Education Instruction & Library | 14 (37.8%) | 23 (62.2%) |
| Arts, Media & Entertainment | 10 (34.5%) | 19 (65.5%) |
| Health Diagnosing & Treating | 24 (23.5%) | 78 (76.5%) |
| Health Technologists | 4 (13.3%) | 26 (86.7%) |
| Total (Category) | 144 (34.6%) | 272 (65.4%) |
| Total (Overall) | 779 (50.7%) | 756 (49.2%) |
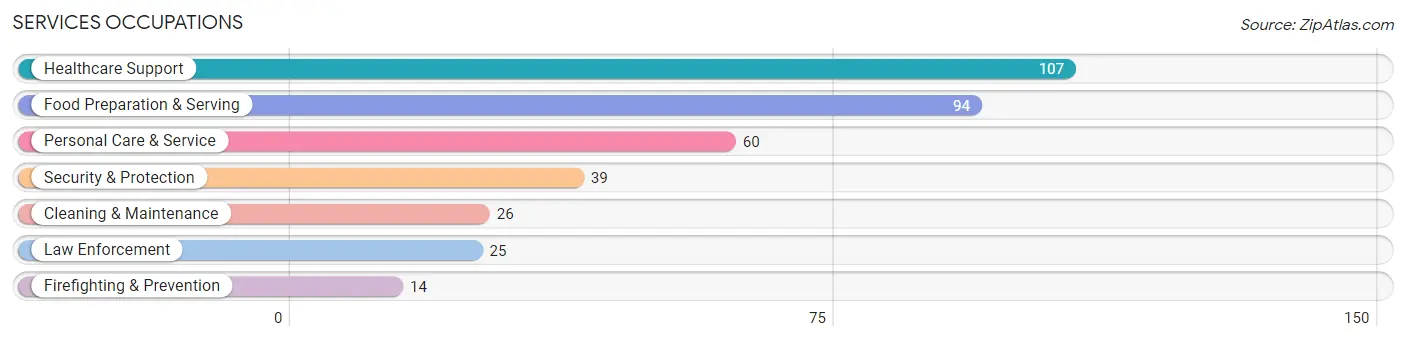
Services Occupations
The most common Services occupations in Hughesville borough are Healthcare Support (107 | 7.0%), Food Preparation & Serving (94 | 6.1%), Personal Care & Service (60 | 3.9%), Security & Protection (39 | 2.5%), and Cleaning & Maintenance (26 | 1.7%).
Services Occupations by Sex
Within the Services occupations in Hughesville borough, the most male-oriented occupations are Law Enforcement (76.0%), Security & Protection (74.4%), and Firefighting & Prevention (71.4%), while the most female-oriented occupations are Personal Care & Service (73.3%), Cleaning & Maintenance (61.5%), and Food Preparation & Serving (56.4%).
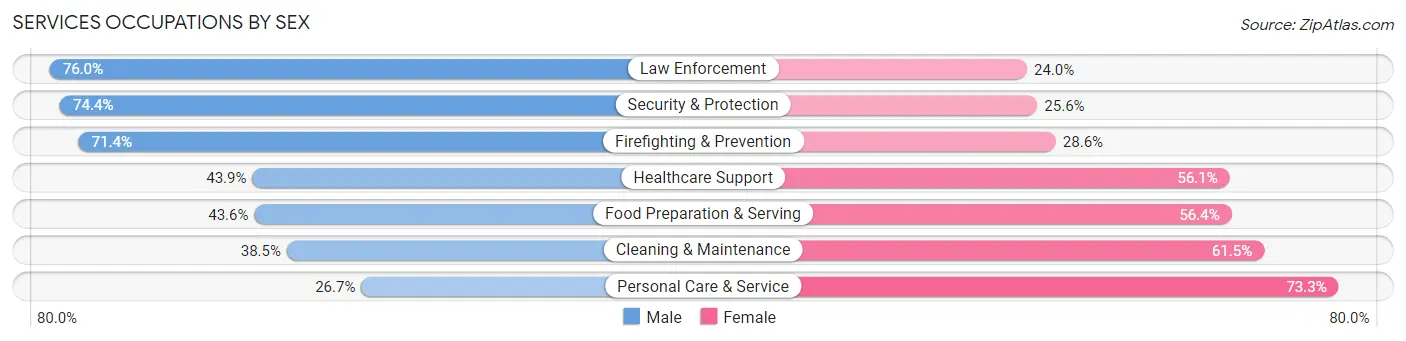
| Occupation | Male | Female |
| Healthcare Support | 47 (43.9%) | 60 (56.1%) |
| Security & Protection | 29 (74.4%) | 10 (25.6%) |
| Firefighting & Prevention | 10 (71.4%) | 4 (28.6%) |
| Law Enforcement | 19 (76.0%) | 6 (24.0%) |
| Food Preparation & Serving | 41 (43.6%) | 53 (56.4%) |
| Cleaning & Maintenance | 10 (38.5%) | 16 (61.5%) |
| Personal Care & Service | 16 (26.7%) | 44 (73.3%) |
| Total (Category) | 143 (43.9%) | 183 (56.1%) |
| Total (Overall) | 779 (50.7%) | 756 (49.2%) |
Sales and Office Occupations
The most common Sales and Office occupations in Hughesville borough are Sales & Related (340 | 22.2%), and Office & Administration (159 | 10.4%).

Sales and Office Occupations by Sex
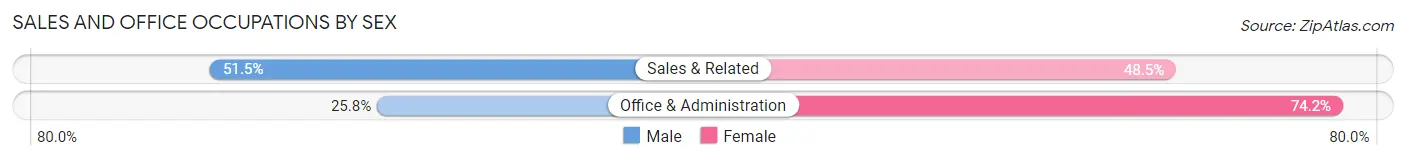
| Occupation | Male | Female |
| Sales & Related | 175 (51.5%) | 165 (48.5%) |
| Office & Administration | 41 (25.8%) | 118 (74.2%) |
| Total (Category) | 216 (43.3%) | 283 (56.7%) |
| Total (Overall) | 779 (50.7%) | 756 (49.2%) |
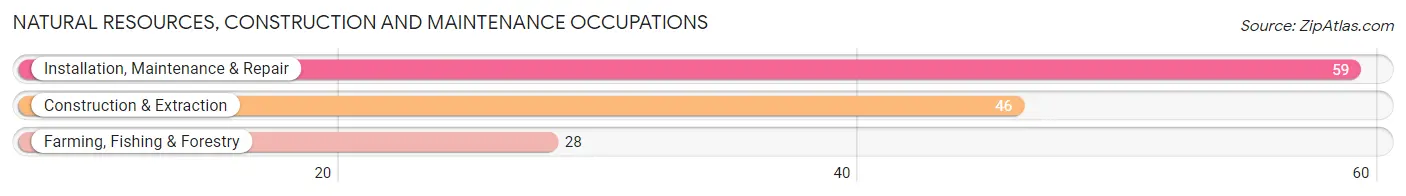
Natural Resources, Construction and Maintenance Occupations
The most common Natural Resources, Construction and Maintenance occupations in Hughesville borough are Installation, Maintenance & Repair (59 | 3.8%), Construction & Extraction (46 | 3.0%), and Farming, Fishing & Forestry (28 | 1.8%).
Natural Resources, Construction and Maintenance Occupations by Sex
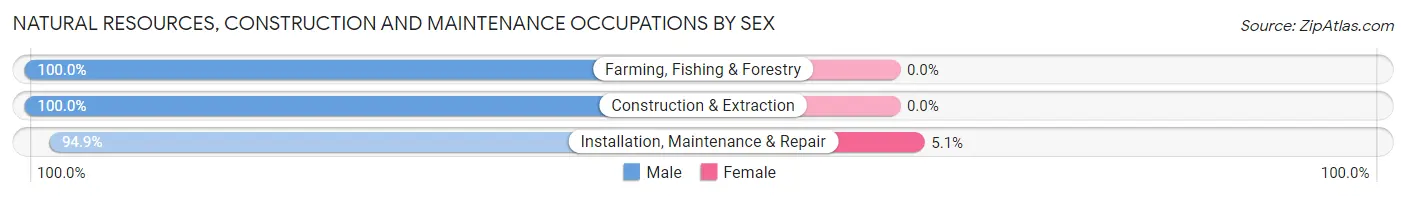
| Occupation | Male | Female |
| Farming, Fishing & Forestry | 28 (100.0%) | 0 (0.0%) |
| Construction & Extraction | 46 (100.0%) | 0 (0.0%) |
| Installation, Maintenance & Repair | 56 (94.9%) | 3 (5.1%) |
| Total (Category) | 130 (97.7%) | 3 (2.3%) |
| Total (Overall) | 779 (50.7%) | 756 (49.2%) |
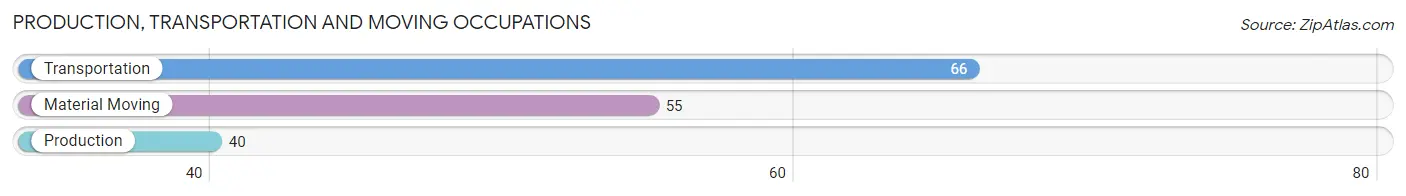
Production, Transportation and Moving Occupations
The most common Production, Transportation and Moving occupations in Hughesville borough are Transportation (66 | 4.3%), Material Moving (55 | 3.6%), and Production (40 | 2.6%).
Production, Transportation and Moving Occupations by Sex
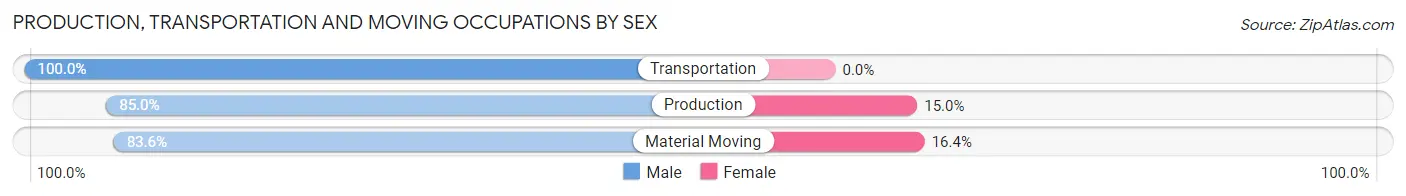
| Occupation | Male | Female |
| Production | 34 (85.0%) | 6 (15.0%) |
| Transportation | 66 (100.0%) | 0 (0.0%) |
| Material Moving | 46 (83.6%) | 9 (16.4%) |
| Total (Category) | 146 (90.7%) | 15 (9.3%) |
| Total (Overall) | 779 (50.7%) | 756 (49.2%) |
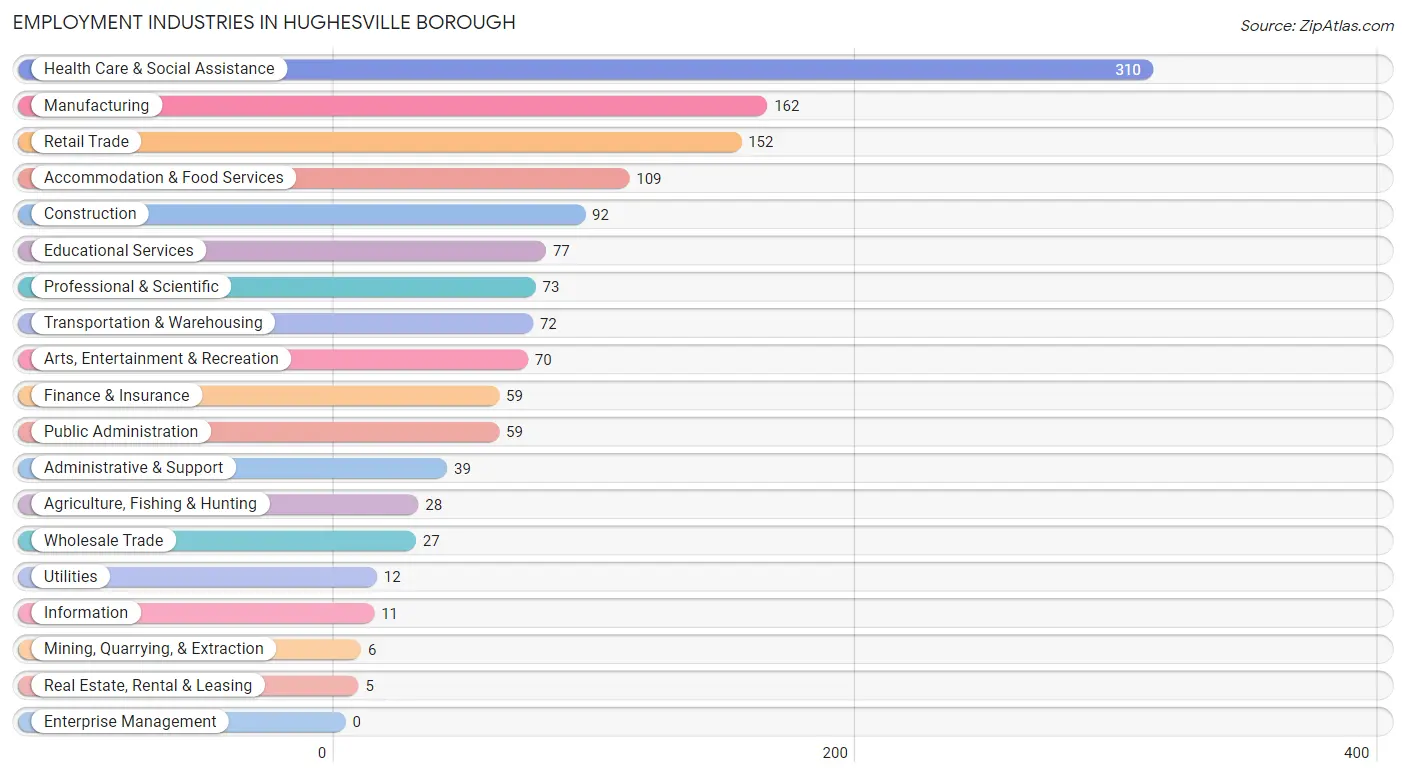
Employment Industries by Sex in Hughesville borough
Employment Industries in Hughesville borough
The major employment industries in Hughesville borough include Health Care & Social Assistance (310 | 20.2%), Manufacturing (162 | 10.5%), Retail Trade (152 | 9.9%), Accommodation & Food Services (109 | 7.1%), and Construction (92 | 6.0%).
Employment Industries by Sex in Hughesville borough
The Hughesville borough industries that see more men than women are Agriculture, Fishing & Hunting (100.0%), Mining, Quarrying, & Extraction (100.0%), and Wholesale Trade (100.0%), whereas the industries that tend to have a higher number of women are Arts, Entertainment & Recreation (100.0%), Administrative & Support (89.7%), and Finance & Insurance (81.4%).
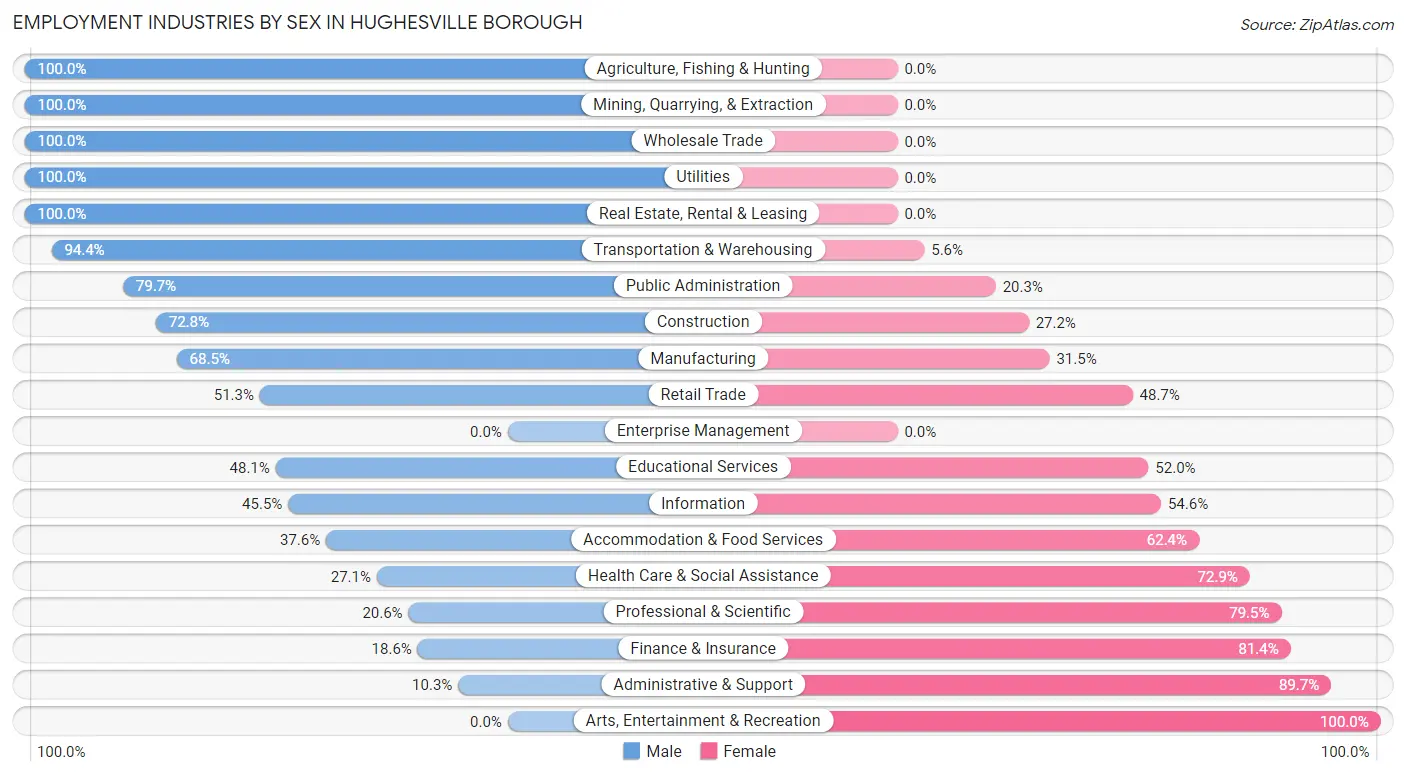
| Industry | Male | Female |
| Agriculture, Fishing & Hunting | 28 (100.0%) | 0 (0.0%) |
| Mining, Quarrying, & Extraction | 6 (100.0%) | 0 (0.0%) |
| Construction | 67 (72.8%) | 25 (27.2%) |
| Manufacturing | 111 (68.5%) | 51 (31.5%) |
| Wholesale Trade | 27 (100.0%) | 0 (0.0%) |
| Retail Trade | 78 (51.3%) | 74 (48.7%) |
| Transportation & Warehousing | 68 (94.4%) | 4 (5.6%) |
| Utilities | 12 (100.0%) | 0 (0.0%) |
| Information | 5 (45.5%) | 6 (54.5%) |
| Finance & Insurance | 11 (18.6%) | 48 (81.4%) |
| Real Estate, Rental & Leasing | 5 (100.0%) | 0 (0.0%) |
| Professional & Scientific | 15 (20.5%) | 58 (79.4%) |
| Enterprise Management | 0 (0.0%) | 0 (0.0%) |
| Administrative & Support | 4 (10.3%) | 35 (89.7%) |
| Educational Services | 37 (48.0%) | 40 (51.9%) |
| Health Care & Social Assistance | 84 (27.1%) | 226 (72.9%) |
| Arts, Entertainment & Recreation | 0 (0.0%) | 70 (100.0%) |
| Accommodation & Food Services | 41 (37.6%) | 68 (62.4%) |
| Public Administration | 47 (79.7%) | 12 (20.3%) |
| Total | 779 (50.7%) | 756 (49.2%) |
Education in Hughesville borough
School Enrollment in Hughesville borough
The most common levels of schooling among the 579 students in Hughesville borough are high school (173 | 29.9%), middle school (137 | 23.7%), and elementary school (107 | 18.5%).
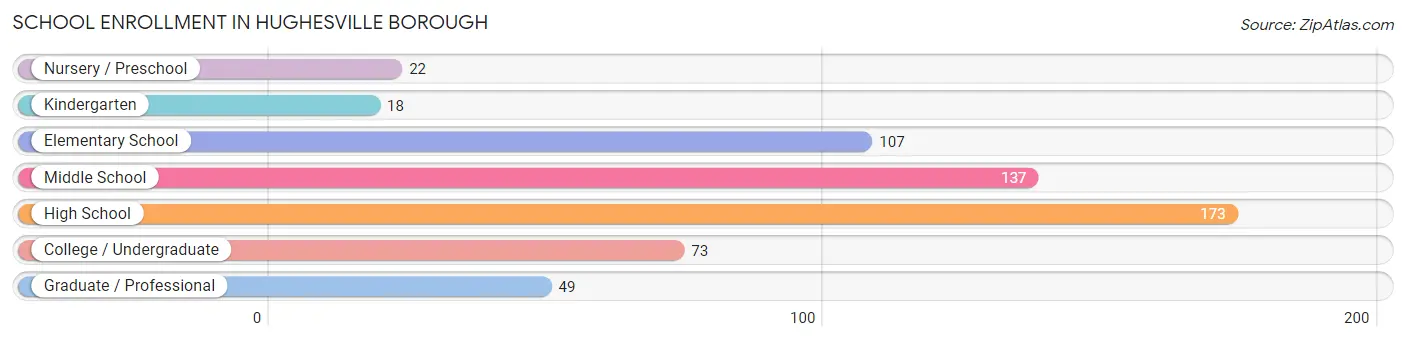
| School Level | # Students | % Students |
| Nursery / Preschool | 22 | 3.8% |
| Kindergarten | 18 | 3.1% |
| Elementary School | 107 | 18.5% |
| Middle School | 137 | 23.7% |
| High School | 173 | 29.9% |
| College / Undergraduate | 73 | 12.6% |
| Graduate / Professional | 49 | 8.5% |
| Total | 579 | 100.0% |
School Enrollment by Age by Funding Source in Hughesville borough
Out of a total of 579 students who are enrolled in schools in Hughesville borough, 40 (6.9%) attend a private institution, while the remaining 539 (93.1%) are enrolled in public schools. The age group of 35 years and over has the highest likelihood of being enrolled in private schools, with 14 (43.8% in the age bracket) enrolled. Conversely, the age group of 3 to 4 year olds has the lowest likelihood of being enrolled in a private school, with 22 (100.0% in the age bracket) attending a public institution.
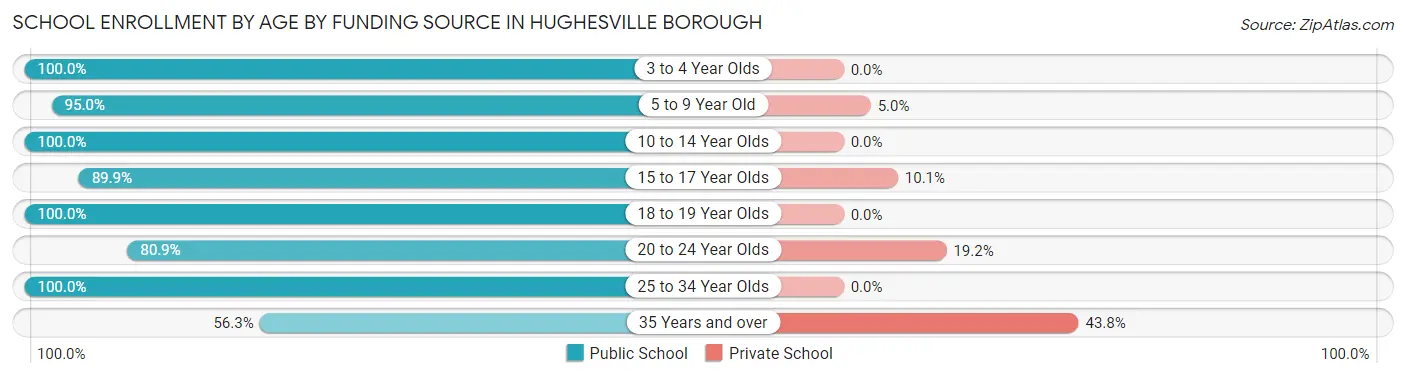
| Age Bracket | Public School | Private School |
| 3 to 4 Year Olds | 22 (100.0%) | 0 (0.0%) |
| 5 to 9 Year Old | 113 (95.0%) | 6 (5.0%) |
| 10 to 14 Year Olds | 159 (100.0%) | 0 (0.0%) |
| 15 to 17 Year Olds | 98 (89.9%) | 11 (10.1%) |
| 18 to 19 Year Olds | 53 (100.0%) | 0 (0.0%) |
| 20 to 24 Year Olds | 38 (80.8%) | 9 (19.2%) |
| 25 to 34 Year Olds | 38 (100.0%) | 0 (0.0%) |
| 35 Years and over | 18 (56.2%) | 14 (43.8%) |
| Total | 539 (93.1%) | 40 (6.9%) |
Educational Attainment by Field of Study in Hughesville borough
Business (140 | 28.6%), science & technology (62 | 12.7%), education (40 | 8.2%), arts & humanities (40 | 8.2%), and communications (37 | 7.5%) are the most common fields of study among 490 individuals in Hughesville borough who have obtained a bachelor's degree or higher.
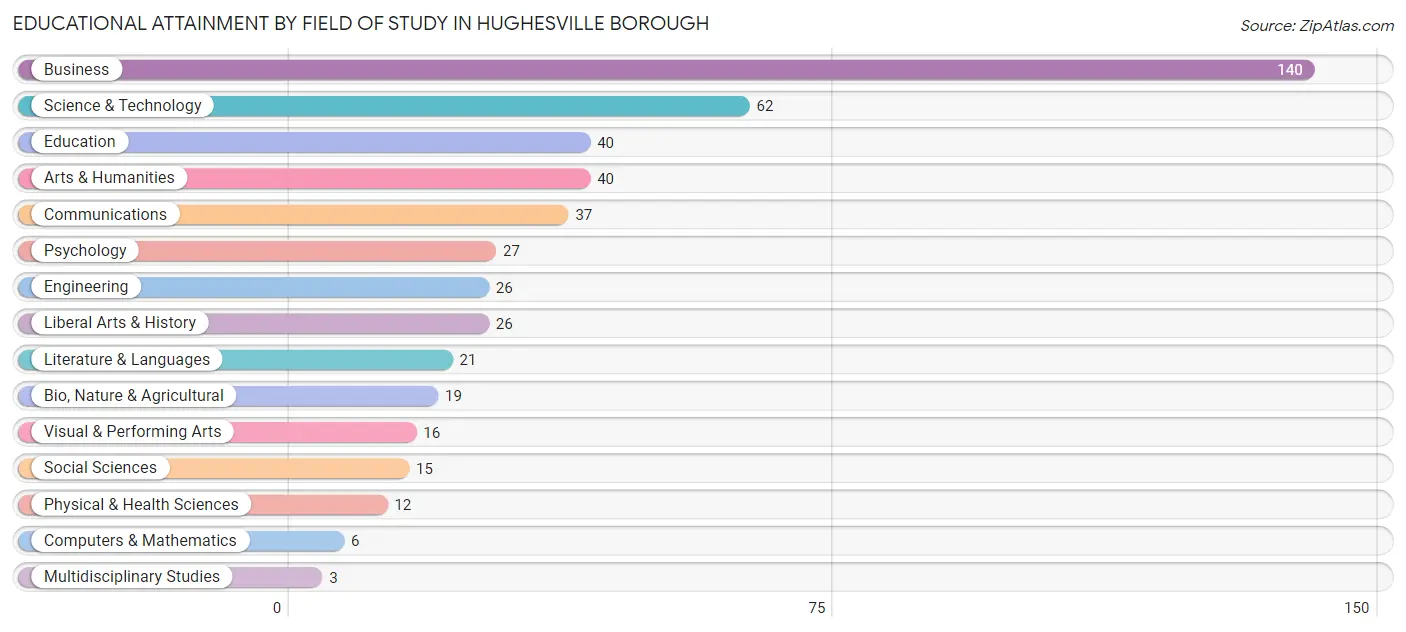
| Field of Study | # Graduates | % Graduates |
| Computers & Mathematics | 6 | 1.2% |
| Bio, Nature & Agricultural | 19 | 3.9% |
| Physical & Health Sciences | 12 | 2.5% |
| Psychology | 27 | 5.5% |
| Social Sciences | 15 | 3.1% |
| Engineering | 26 | 5.3% |
| Multidisciplinary Studies | 3 | 0.6% |
| Science & Technology | 62 | 12.7% |
| Business | 140 | 28.6% |
| Education | 40 | 8.2% |
| Literature & Languages | 21 | 4.3% |
| Liberal Arts & History | 26 | 5.3% |
| Visual & Performing Arts | 16 | 3.3% |
| Communications | 37 | 7.5% |
| Arts & Humanities | 40 | 8.2% |
| Total | 490 | 100.0% |
Transportation & Commute in Hughesville borough
Vehicle Availability by Sex in Hughesville borough
The most prevalent vehicle ownership categories in Hughesville borough are males with 2 vehicles (392, accounting for 50.8%) and females with 2 vehicles (356, making up 52.8%).
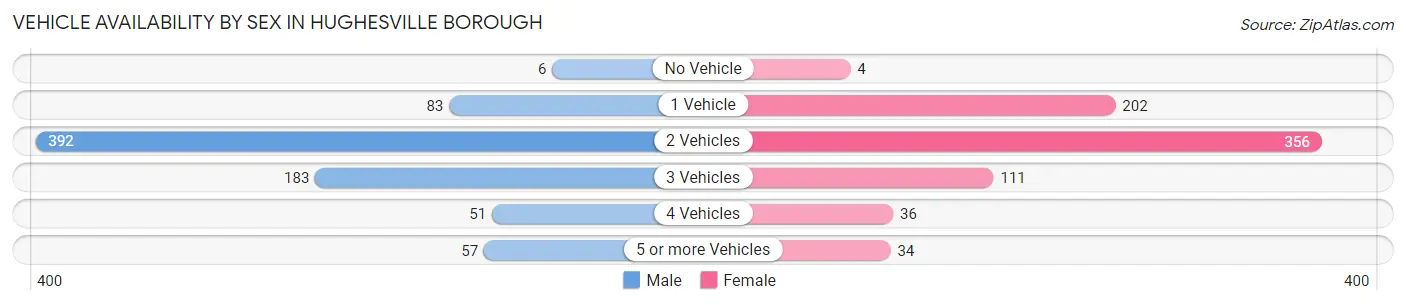
| Vehicles Available | Male | Female |
| No Vehicle | 6 (0.8%) | 4 (0.5%) |
| 1 Vehicle | 83 (10.7%) | 202 (27.2%) |
| 2 Vehicles | 392 (50.8%) | 356 (47.9%) |
| 3 Vehicles | 183 (23.7%) | 111 (14.9%) |
| 4 Vehicles | 51 (6.6%) | 36 (4.9%) |
| 5 or more Vehicles | 57 (7.4%) | 34 (4.6%) |
| Total | 772 (100.0%) | 743 (100.0%) |
Commute Time in Hughesville borough
The most frequently occuring commute durations in Hughesville borough are 15 to 19 minutes (236 commuters, 17.8%), 10 to 14 minutes (221 commuters, 16.7%), and 20 to 24 minutes (201 commuters, 15.1%).
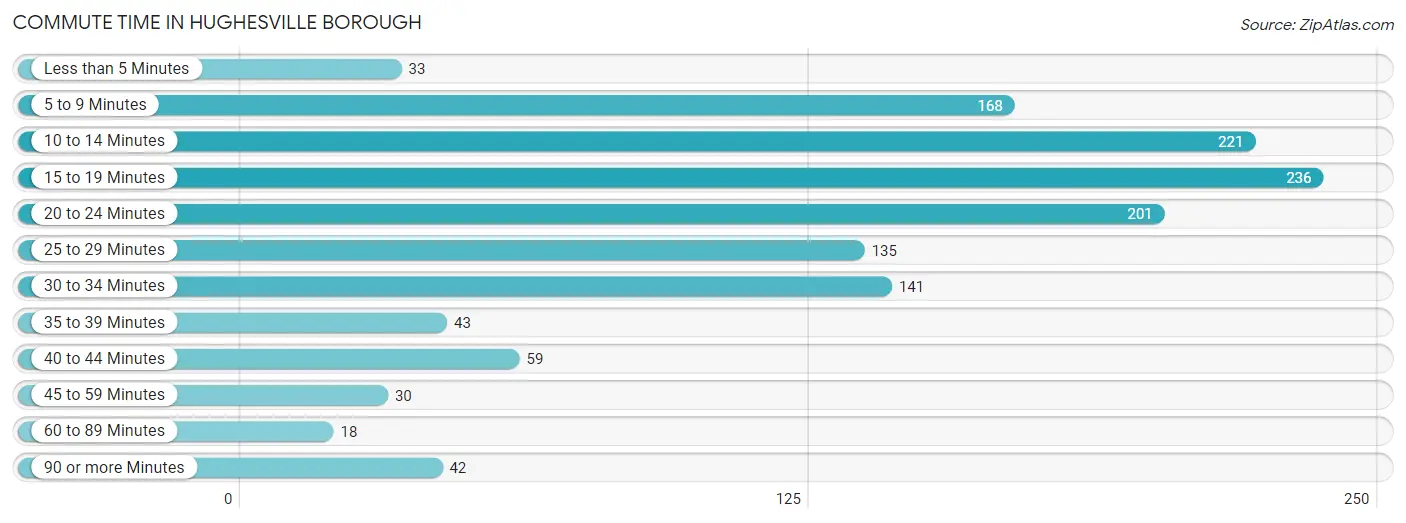
| Commute Time | # Commuters | % Commuters |
| Less than 5 Minutes | 33 | 2.5% |
| 5 to 9 Minutes | 168 | 12.7% |
| 10 to 14 Minutes | 221 | 16.7% |
| 15 to 19 Minutes | 236 | 17.8% |
| 20 to 24 Minutes | 201 | 15.1% |
| 25 to 29 Minutes | 135 | 10.2% |
| 30 to 34 Minutes | 141 | 10.6% |
| 35 to 39 Minutes | 43 | 3.2% |
| 40 to 44 Minutes | 59 | 4.4% |
| 45 to 59 Minutes | 30 | 2.3% |
| 60 to 89 Minutes | 18 | 1.4% |
| 90 or more Minutes | 42 | 3.2% |
Commute Time by Sex in Hughesville borough
The most common commute times in Hughesville borough are 20 to 24 minutes (114 commuters, 16.8%) for males and 15 to 19 minutes (155 commuters, 23.8%) for females.
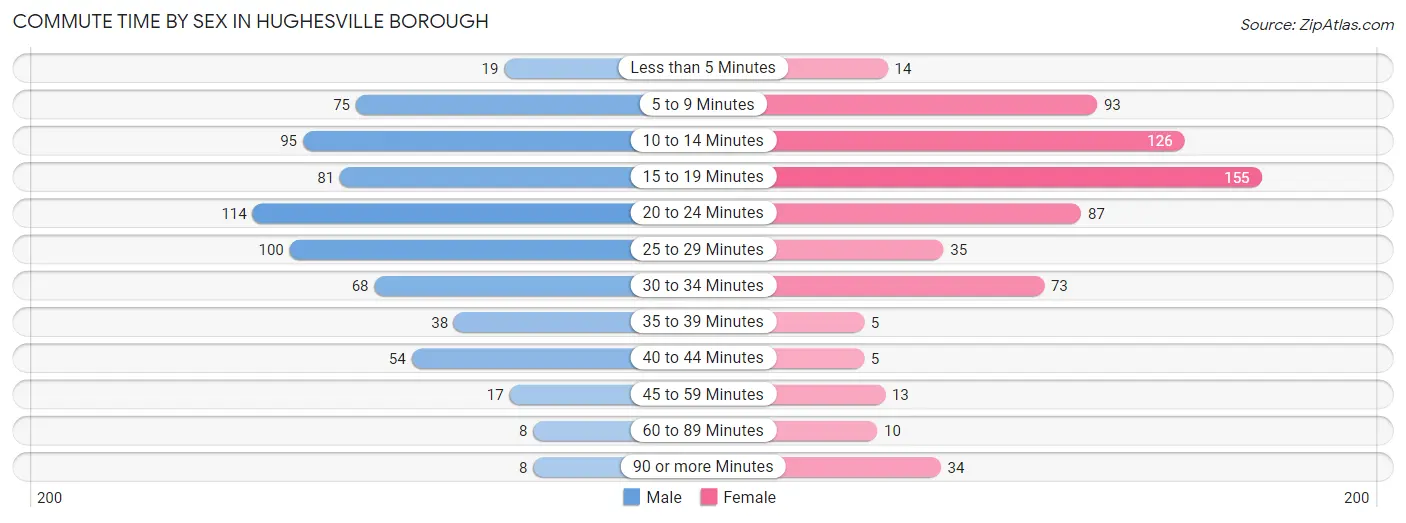
| Commute Time | Male | Female |
| Less than 5 Minutes | 19 (2.8%) | 14 (2.1%) |
| 5 to 9 Minutes | 75 (11.1%) | 93 (14.3%) |
| 10 to 14 Minutes | 95 (14.0%) | 126 (19.4%) |
| 15 to 19 Minutes | 81 (12.0%) | 155 (23.8%) |
| 20 to 24 Minutes | 114 (16.8%) | 87 (13.4%) |
| 25 to 29 Minutes | 100 (14.8%) | 35 (5.4%) |
| 30 to 34 Minutes | 68 (10.0%) | 73 (11.2%) |
| 35 to 39 Minutes | 38 (5.6%) | 5 (0.8%) |
| 40 to 44 Minutes | 54 (8.0%) | 5 (0.8%) |
| 45 to 59 Minutes | 17 (2.5%) | 13 (2.0%) |
| 60 to 89 Minutes | 8 (1.2%) | 10 (1.5%) |
| 90 or more Minutes | 8 (1.2%) | 34 (5.2%) |
Time of Departure to Work by Sex in Hughesville borough
The most frequent times of departure to work in Hughesville borough are 7:00 AM to 7:29 AM (119, 17.6%) for males and 8:30 AM to 8:59 AM (120, 18.5%) for females.
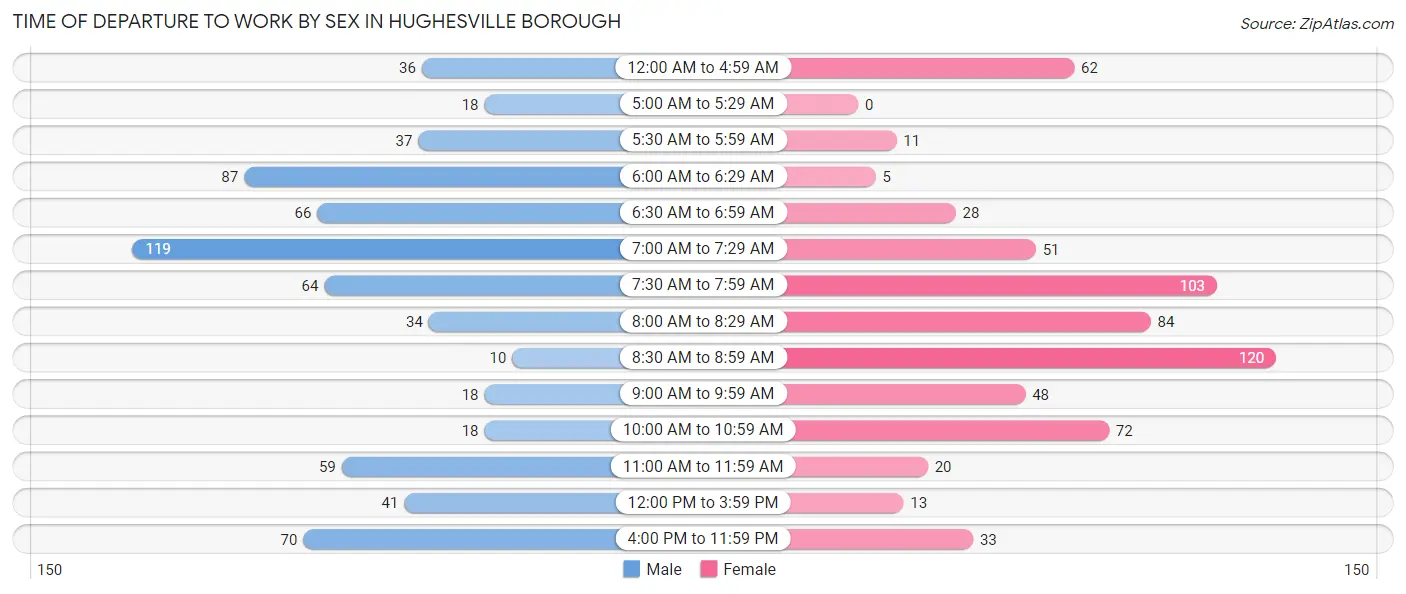
| Time of Departure | Male | Female |
| 12:00 AM to 4:59 AM | 36 (5.3%) | 62 (9.5%) |
| 5:00 AM to 5:29 AM | 18 (2.7%) | 0 (0.0%) |
| 5:30 AM to 5:59 AM | 37 (5.5%) | 11 (1.7%) |
| 6:00 AM to 6:29 AM | 87 (12.9%) | 5 (0.8%) |
| 6:30 AM to 6:59 AM | 66 (9.8%) | 28 (4.3%) |
| 7:00 AM to 7:29 AM | 119 (17.6%) | 51 (7.9%) |
| 7:30 AM to 7:59 AM | 64 (9.5%) | 103 (15.9%) |
| 8:00 AM to 8:29 AM | 34 (5.0%) | 84 (12.9%) |
| 8:30 AM to 8:59 AM | 10 (1.5%) | 120 (18.5%) |
| 9:00 AM to 9:59 AM | 18 (2.7%) | 48 (7.4%) |
| 10:00 AM to 10:59 AM | 18 (2.7%) | 72 (11.1%) |
| 11:00 AM to 11:59 AM | 59 (8.7%) | 20 (3.1%) |
| 12:00 PM to 3:59 PM | 41 (6.1%) | 13 (2.0%) |
| 4:00 PM to 11:59 PM | 70 (10.3%) | 33 (5.1%) |
| Total | 677 (100.0%) | 650 (100.0%) |
Housing Occupancy in Hughesville borough
Occupancy by Ownership in Hughesville borough
Of the total 1,108 dwellings in Hughesville borough, owner-occupied units account for 574 (51.8%), while renter-occupied units make up 534 (48.2%).
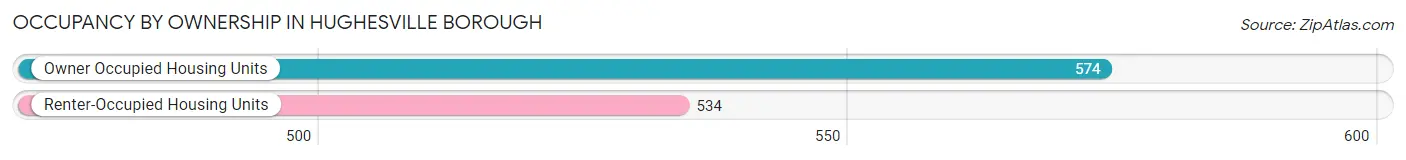
| Occupancy | # Housing Units | % Housing Units |
| Owner Occupied Housing Units | 574 | 51.8% |
| Renter-Occupied Housing Units | 534 | 48.2% |
| Total Occupied Housing Units | 1,108 | 100.0% |
Occupancy by Household Size in Hughesville borough
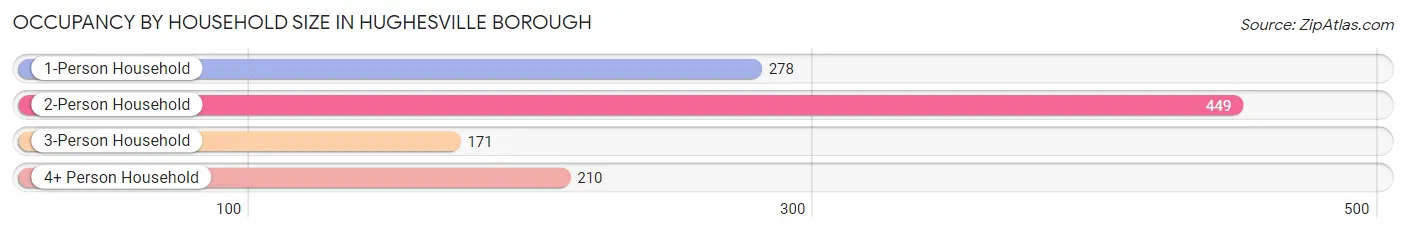
| Household Size | # Housing Units | % Housing Units |
| 1-Person Household | 278 | 25.1% |
| 2-Person Household | 449 | 40.5% |
| 3-Person Household | 171 | 15.4% |
| 4+ Person Household | 210 | 19.0% |
| Total Housing Units | 1,108 | 100.0% |
Occupancy by Ownership by Household Size in Hughesville borough
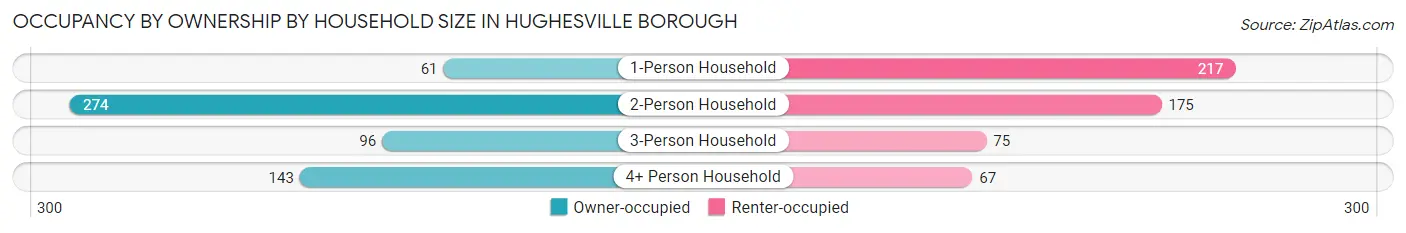
| Household Size | Owner-occupied | Renter-occupied |
| 1-Person Household | 61 (21.9%) | 217 (78.1%) |
| 2-Person Household | 274 (61.0%) | 175 (39.0%) |
| 3-Person Household | 96 (56.1%) | 75 (43.9%) |
| 4+ Person Household | 143 (68.1%) | 67 (31.9%) |
| Total Housing Units | 574 (51.8%) | 534 (48.2%) |
Occupancy by Educational Attainment in Hughesville borough
| Household Size | Owner-occupied | Renter-occupied |
| Less than High School | 19 (28.4%) | 48 (71.6%) |
| High School Diploma | 150 (47.0%) | 169 (53.0%) |
| College/Associate Degree | 179 (47.3%) | 199 (52.6%) |
| Bachelor's Degree or higher | 226 (65.7%) | 118 (34.3%) |
Occupancy by Age of Householder in Hughesville borough
| Age Bracket | # Households | % Households |
| Under 35 Years | 257 | 23.2% |
| 35 to 44 Years | 96 | 8.7% |
| 45 to 54 Years | 345 | 31.1% |
| 55 to 64 Years | 168 | 15.2% |
| 65 to 74 Years | 147 | 13.3% |
| 75 to 84 Years | 77 | 7.0% |
| 85 Years and Over | 18 | 1.6% |
| Total | 1,108 | 100.0% |
Housing Finances in Hughesville borough
Median Income by Occupancy in Hughesville borough
| Occupancy Type | # Households | Median Income |
| Owner-Occupied | 574 (51.8%) | $87,772 |
| Renter-Occupied | 534 (48.2%) | $33,750 |
| Average | 1,108 (100.0%) | $65,897 |
Occupancy by Householder Income Bracket in Hughesville borough
| Income Bracket | Owner-occupied | Renter-occupied |
| Less than $5,000 | 0 (0.0%) | 8 (1.5%) |
| $5,000 to $9,999 | 10 (1.7%) | 5 (0.9%) |
| $10,000 to $14,999 | 7 (1.2%) | 98 (18.3%) |
| $15,000 to $19,999 | 9 (1.6%) | 18 (3.4%) |
| $20,000 to $24,999 | 11 (1.9%) | 40 (7.5%) |
| $25,000 to $34,999 | 18 (3.1%) | 149 (27.9%) |
| $35,000 to $49,999 | 15 (2.6%) | 48 (9.0%) |
| $50,000 to $74,999 | 189 (32.9%) | 77 (14.4%) |
| $75,000 to $99,999 | 91 (15.9%) | 44 (8.2%) |
| $100,000 to $149,999 | 129 (22.5%) | 44 (8.2%) |
| $150,000 or more | 95 (16.6%) | 3 (0.6%) |
| Total | 574 (100.0%) | 534 (100.0%) |
Monthly Housing Cost Tiers in Hughesville borough
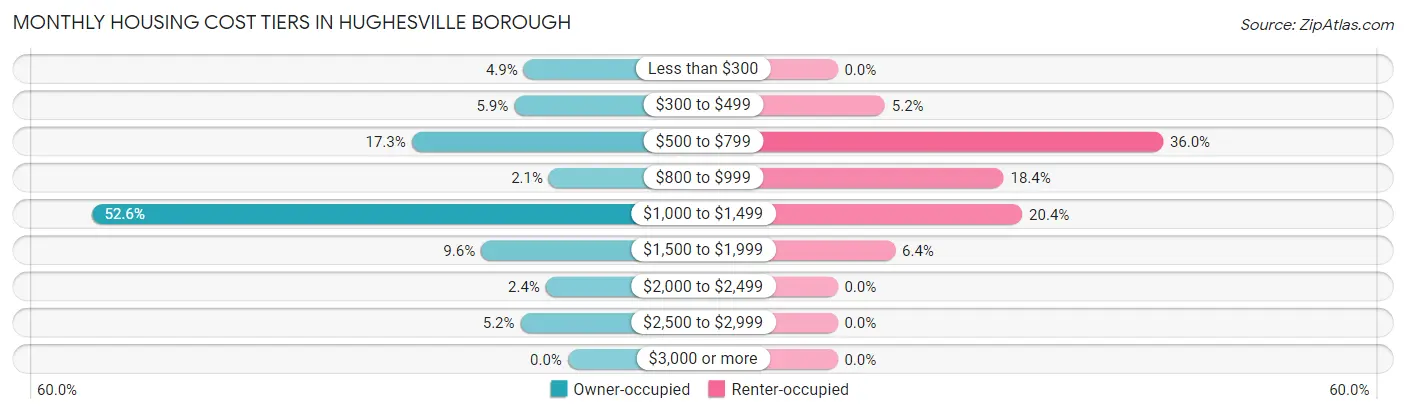
| Monthly Cost | Owner-occupied | Renter-occupied |
| Less than $300 | 28 (4.9%) | 0 (0.0%) |
| $300 to $499 | 34 (5.9%) | 28 (5.2%) |
| $500 to $799 | 99 (17.2%) | 192 (36.0%) |
| $800 to $999 | 12 (2.1%) | 98 (18.3%) |
| $1,000 to $1,499 | 302 (52.6%) | 109 (20.4%) |
| $1,500 to $1,999 | 55 (9.6%) | 34 (6.4%) |
| $2,000 to $2,499 | 14 (2.4%) | 0 (0.0%) |
| $2,500 to $2,999 | 30 (5.2%) | 0 (0.0%) |
| $3,000 or more | 0 (0.0%) | 0 (0.0%) |
| Total | 574 (100.0%) | 534 (100.0%) |
Physical Housing Characteristics in Hughesville borough
Housing Structures in Hughesville borough
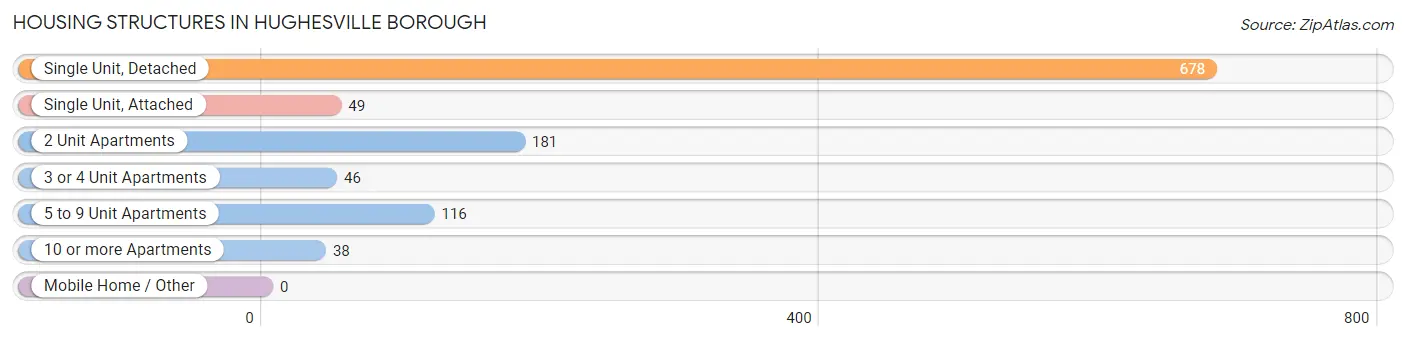
| Structure Type | # Housing Units | % Housing Units |
| Single Unit, Detached | 678 | 61.2% |
| Single Unit, Attached | 49 | 4.4% |
| 2 Unit Apartments | 181 | 16.3% |
| 3 or 4 Unit Apartments | 46 | 4.2% |
| 5 to 9 Unit Apartments | 116 | 10.5% |
| 10 or more Apartments | 38 | 3.4% |
| Mobile Home / Other | 0 | 0.0% |
| Total | 1,108 | 100.0% |
Housing Structures by Occupancy in Hughesville borough
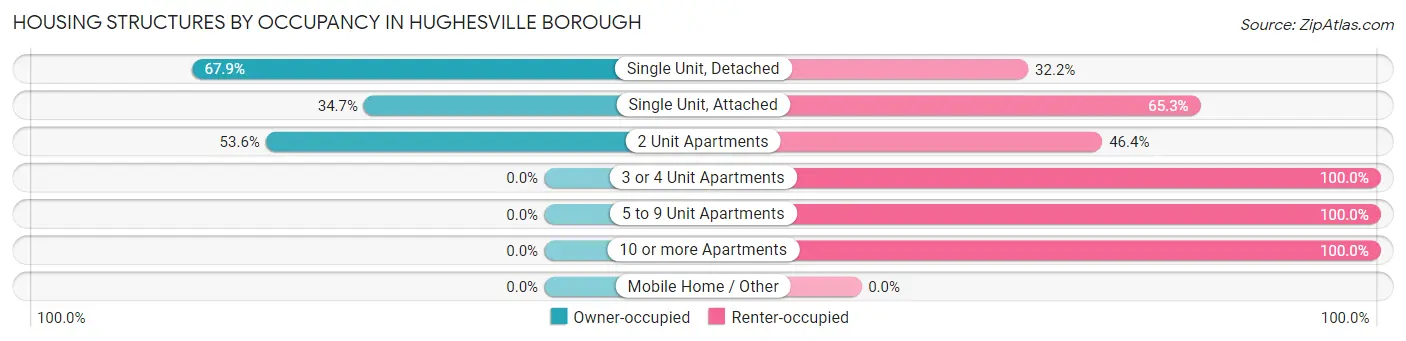
| Structure Type | Owner-occupied | Renter-occupied |
| Single Unit, Detached | 460 (67.8%) | 218 (32.2%) |
| Single Unit, Attached | 17 (34.7%) | 32 (65.3%) |
| 2 Unit Apartments | 97 (53.6%) | 84 (46.4%) |
| 3 or 4 Unit Apartments | 0 (0.0%) | 46 (100.0%) |
| 5 to 9 Unit Apartments | 0 (0.0%) | 116 (100.0%) |
| 10 or more Apartments | 0 (0.0%) | 38 (100.0%) |
| Mobile Home / Other | 0 (0.0%) | 0 (0.0%) |
| Total | 574 (51.8%) | 534 (48.2%) |
Housing Structures by Number of Rooms in Hughesville borough
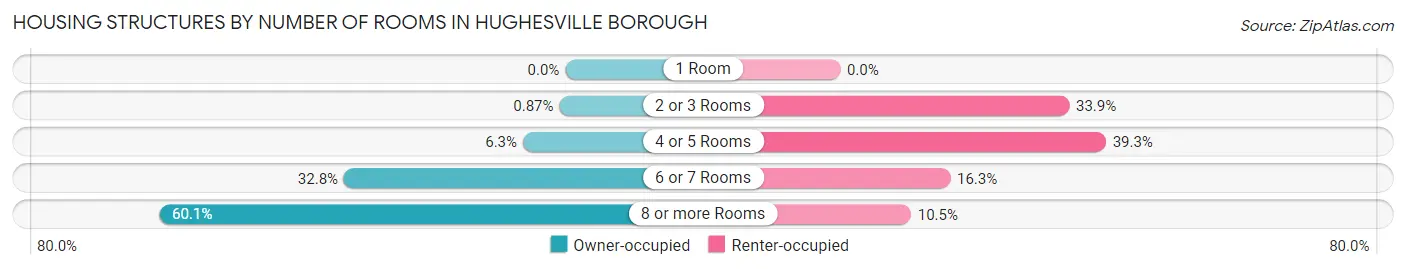
| Number of Rooms | Owner-occupied | Renter-occupied |
| 1 Room | 0 (0.0%) | 0 (0.0%) |
| 2 or 3 Rooms | 5 (0.9%) | 181 (33.9%) |
| 4 or 5 Rooms | 36 (6.3%) | 210 (39.3%) |
| 6 or 7 Rooms | 188 (32.8%) | 87 (16.3%) |
| 8 or more Rooms | 345 (60.1%) | 56 (10.5%) |
| Total | 574 (100.0%) | 534 (100.0%) |
Housing Structure by Heating Type in Hughesville borough
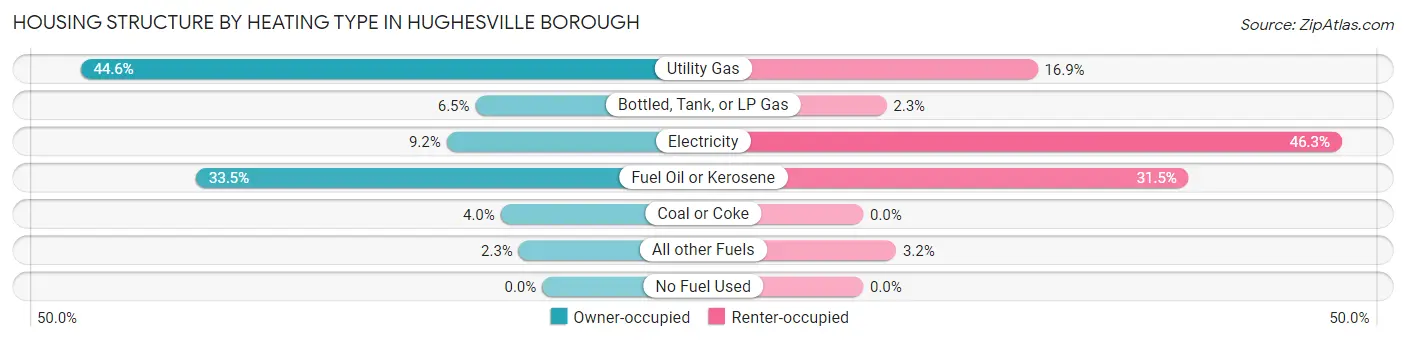
| Heating Type | Owner-occupied | Renter-occupied |
| Utility Gas | 256 (44.6%) | 90 (16.9%) |
| Bottled, Tank, or LP Gas | 37 (6.5%) | 12 (2.2%) |
| Electricity | 53 (9.2%) | 247 (46.3%) |
| Fuel Oil or Kerosene | 192 (33.5%) | 168 (31.5%) |
| Coal or Coke | 23 (4.0%) | 0 (0.0%) |
| All other Fuels | 13 (2.3%) | 17 (3.2%) |
| No Fuel Used | 0 (0.0%) | 0 (0.0%) |
| Total | 574 (100.0%) | 534 (100.0%) |
Household Vehicle Usage in Hughesville borough
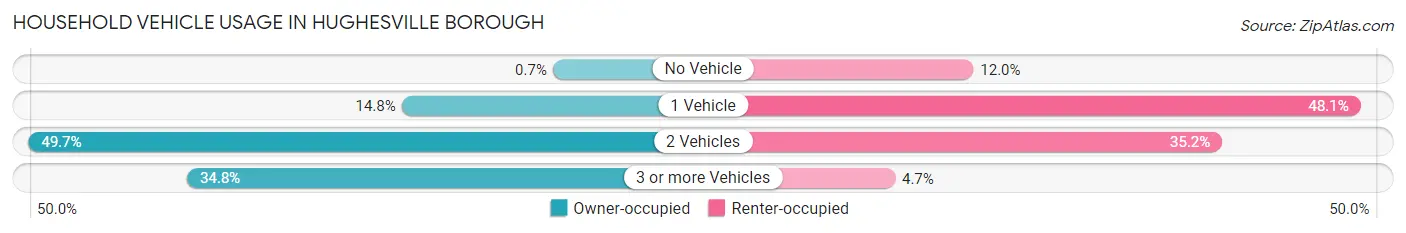
| Vehicles per Household | Owner-occupied | Renter-occupied |
| No Vehicle | 4 (0.7%) | 64 (12.0%) |
| 1 Vehicle | 85 (14.8%) | 257 (48.1%) |
| 2 Vehicles | 285 (49.6%) | 188 (35.2%) |
| 3 or more Vehicles | 200 (34.8%) | 25 (4.7%) |
| Total | 574 (100.0%) | 534 (100.0%) |
Real Estate & Mortgages in Hughesville borough
Real Estate and Mortgage Overview in Hughesville borough
| Characteristic | Without Mortgage | With Mortgage |
| Housing Units | 141 | 433 |
| Median Property Value | $139,700 | $184,100 |
| Median Household Income | $70,903 | $95 |
| Monthly Housing Costs | $516 | $0 |
| Real Estate Taxes | $2,425 | $11 |
Property Value by Mortgage Status in Hughesville borough
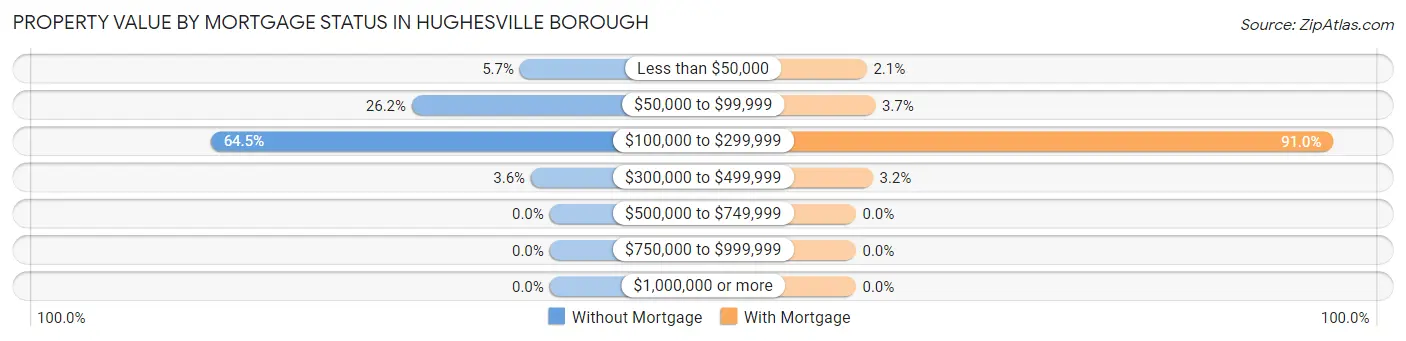
| Property Value | Without Mortgage | With Mortgage |
| Less than $50,000 | 8 (5.7%) | 9 (2.1%) |
| $50,000 to $99,999 | 37 (26.2%) | 16 (3.7%) |
| $100,000 to $299,999 | 91 (64.5%) | 394 (91.0%) |
| $300,000 to $499,999 | 5 (3.5%) | 14 (3.2%) |
| $500,000 to $749,999 | 0 (0.0%) | 0 (0.0%) |
| $750,000 to $999,999 | 0 (0.0%) | 0 (0.0%) |
| $1,000,000 or more | 0 (0.0%) | 0 (0.0%) |
| Total | 141 (100.0%) | 433 (100.0%) |
Household Income by Mortgage Status in Hughesville borough
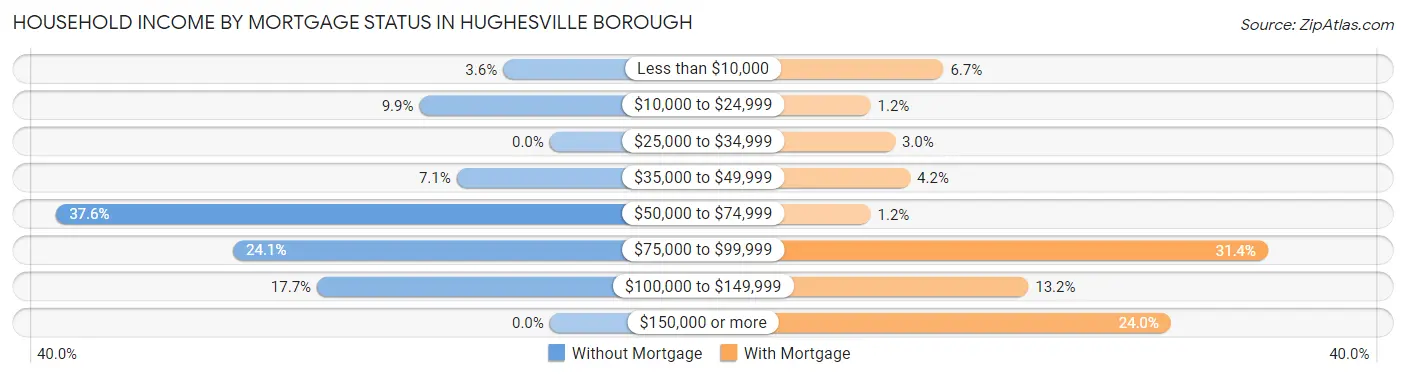
| Household Income | Without Mortgage | With Mortgage |
| Less than $10,000 | 5 (3.5%) | 29 (6.7%) |
| $10,000 to $24,999 | 14 (9.9%) | 5 (1.1%) |
| $25,000 to $34,999 | 0 (0.0%) | 13 (3.0%) |
| $35,000 to $49,999 | 10 (7.1%) | 18 (4.2%) |
| $50,000 to $74,999 | 53 (37.6%) | 5 (1.1%) |
| $75,000 to $99,999 | 34 (24.1%) | 136 (31.4%) |
| $100,000 to $149,999 | 25 (17.7%) | 57 (13.2%) |
| $150,000 or more | 0 (0.0%) | 104 (24.0%) |
| Total | 141 (100.0%) | 433 (100.0%) |
Property Value to Household Income Ratio in Hughesville borough
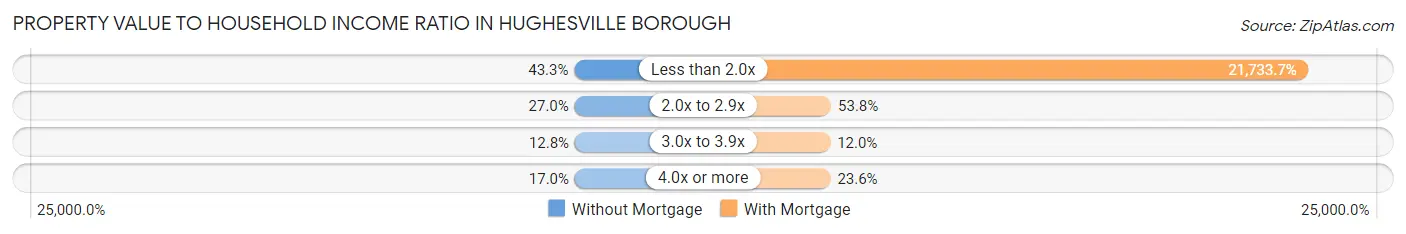
| Value-to-Income Ratio | Without Mortgage | With Mortgage |
| Less than 2.0x | 61 (43.3%) | 94,107 (21,733.7%) |
| 2.0x to 2.9x | 38 (27.0%) | 233 (53.8%) |
| 3.0x to 3.9x | 18 (12.8%) | 52 (12.0%) |
| 4.0x or more | 24 (17.0%) | 102 (23.6%) |
| Total | 141 (100.0%) | 433 (100.0%) |
Real Estate Taxes by Mortgage Status in Hughesville borough
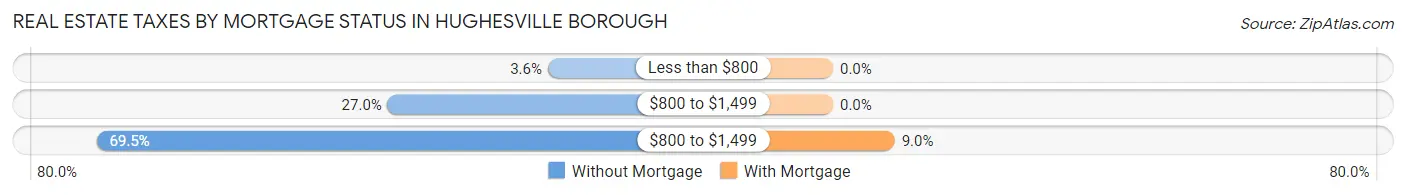
| Property Taxes | Without Mortgage | With Mortgage |
| Less than $800 | 5 (3.5%) | 0 (0.0%) |
| $800 to $1,499 | 38 (27.0%) | 0 (0.0%) |
| $800 to $1,499 | 98 (69.5%) | 39 (9.0%) |
| Total | 141 (100.0%) | 433 (100.0%) |
Health & Disability in Hughesville borough
Health Insurance Coverage by Age in Hughesville borough
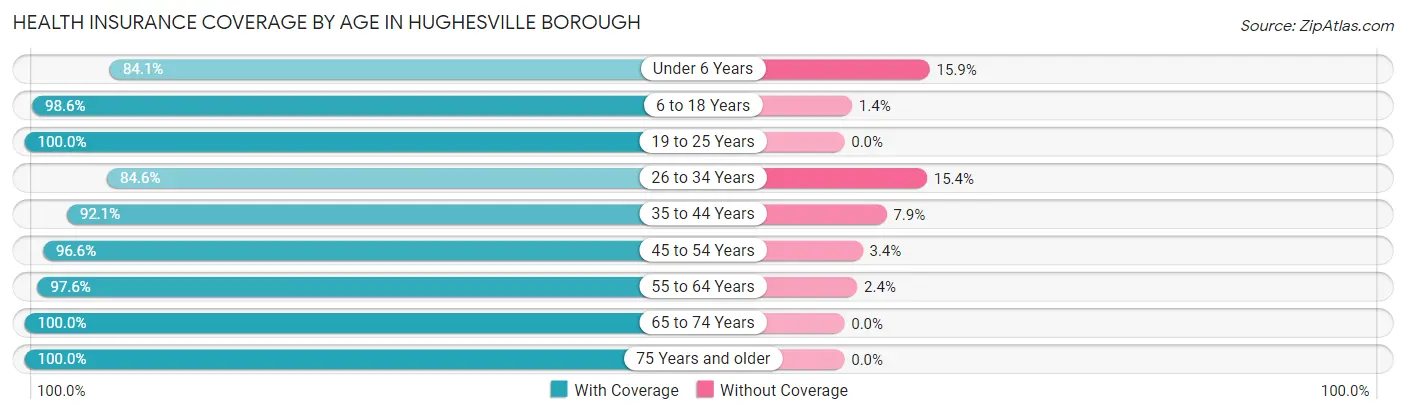
| Age Bracket | With Coverage | Without Coverage |
| Under 6 Years | 148 (84.1%) | 28 (15.9%) |
| 6 to 18 Years | 418 (98.6%) | 6 (1.4%) |
| 19 to 25 Years | 137 (100.0%) | 0 (0.0%) |
| 26 to 34 Years | 319 (84.6%) | 58 (15.4%) |
| 35 to 44 Years | 234 (92.1%) | 20 (7.9%) |
| 45 to 54 Years | 454 (96.6%) | 16 (3.4%) |
| 55 to 64 Years | 325 (97.6%) | 8 (2.4%) |
| 65 to 74 Years | 209 (100.0%) | 0 (0.0%) |
| 75 Years and older | 131 (100.0%) | 0 (0.0%) |
| Total | 2,375 (94.6%) | 136 (5.4%) |
Health Insurance Coverage by Citizenship Status in Hughesville borough
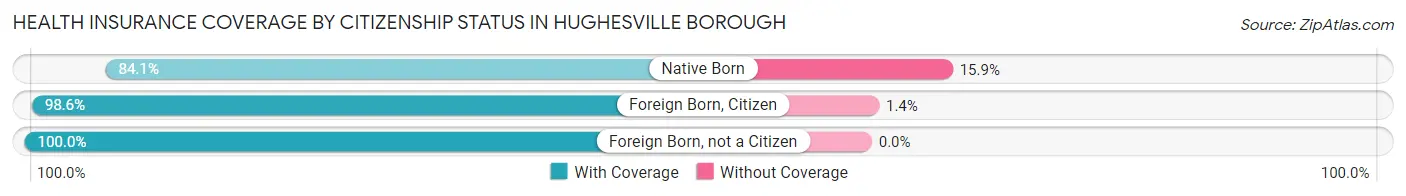
| Citizenship Status | With Coverage | Without Coverage |
| Native Born | 148 (84.1%) | 28 (15.9%) |
| Foreign Born, Citizen | 418 (98.6%) | 6 (1.4%) |
| Foreign Born, not a Citizen | 137 (100.0%) | 0 (0.0%) |
Health Insurance Coverage by Household Income in Hughesville borough
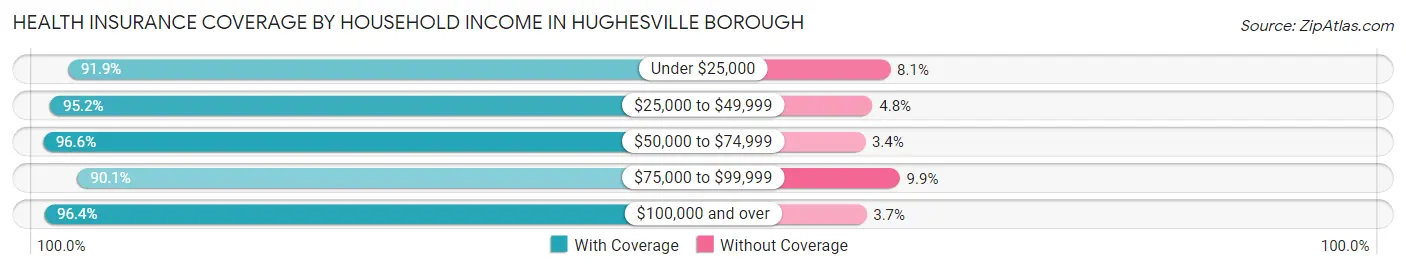
| Household Income | With Coverage | Without Coverage |
| Under $25,000 | 317 (91.9%) | 28 (8.1%) |
| $25,000 to $49,999 | 417 (95.2%) | 21 (4.8%) |
| $50,000 to $74,999 | 511 (96.6%) | 18 (3.4%) |
| $75,000 to $99,999 | 364 (90.1%) | 40 (9.9%) |
| $100,000 and over | 766 (96.4%) | 29 (3.6%) |
Public vs Private Health Insurance Coverage by Age in Hughesville borough
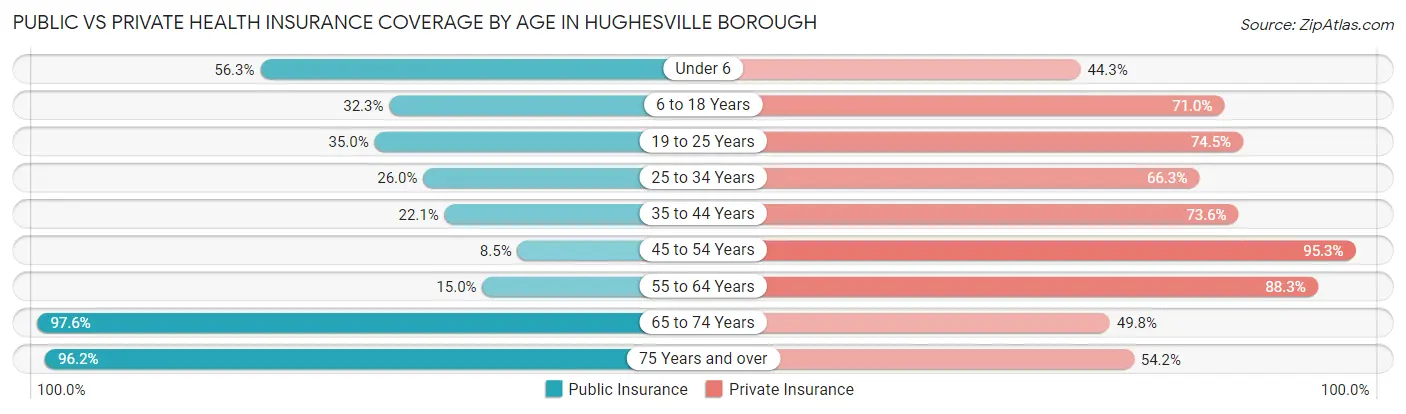
| Age Bracket | Public Insurance | Private Insurance |
| Under 6 | 99 (56.2%) | 78 (44.3%) |
| 6 to 18 Years | 137 (32.3%) | 301 (71.0%) |
| 19 to 25 Years | 48 (35.0%) | 102 (74.5%) |
| 25 to 34 Years | 98 (26.0%) | 250 (66.3%) |
| 35 to 44 Years | 56 (22.1%) | 187 (73.6%) |
| 45 to 54 Years | 40 (8.5%) | 448 (95.3%) |
| 55 to 64 Years | 50 (15.0%) | 294 (88.3%) |
| 65 to 74 Years | 204 (97.6%) | 104 (49.8%) |
| 75 Years and over | 126 (96.2%) | 71 (54.2%) |
| Total | 858 (34.2%) | 1,835 (73.1%) |
Disability Status by Sex by Age in Hughesville borough
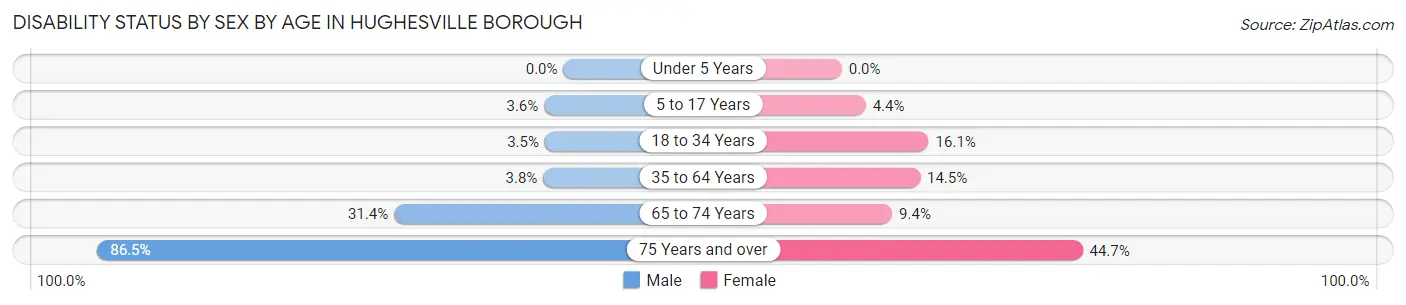
| Age Bracket | Male | Female |
| Under 5 Years | 0 (0.0%) | 0 (0.0%) |
| 5 to 17 Years | 6 (3.6%) | 10 (4.4%) |
| 18 to 34 Years | 10 (3.5%) | 44 (16.1%) |
| 35 to 64 Years | 19 (3.7%) | 80 (14.5%) |
| 65 to 74 Years | 22 (31.4%) | 13 (9.3%) |
| 75 Years and over | 32 (86.5%) | 42 (44.7%) |
Disability Class by Sex by Age in Hughesville borough
Disability Class: Hearing Difficulty
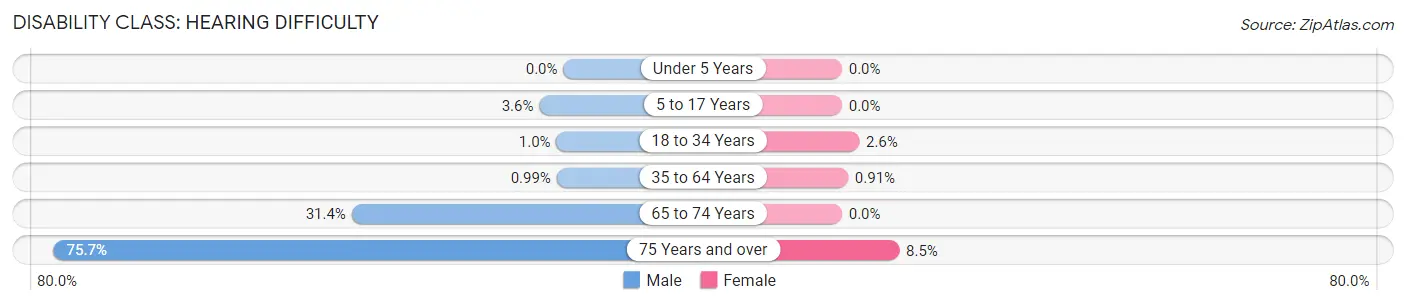
| Age Bracket | Male | Female |
| Under 5 Years | 0 (0.0%) | 0 (0.0%) |
| 5 to 17 Years | 6 (3.6%) | 0 (0.0%) |
| 18 to 34 Years | 3 (1.0%) | 7 (2.6%) |
| 35 to 64 Years | 5 (1.0%) | 5 (0.9%) |
| 65 to 74 Years | 22 (31.4%) | 0 (0.0%) |
| 75 Years and over | 28 (75.7%) | 8 (8.5%) |
Disability Class: Vision Difficulty
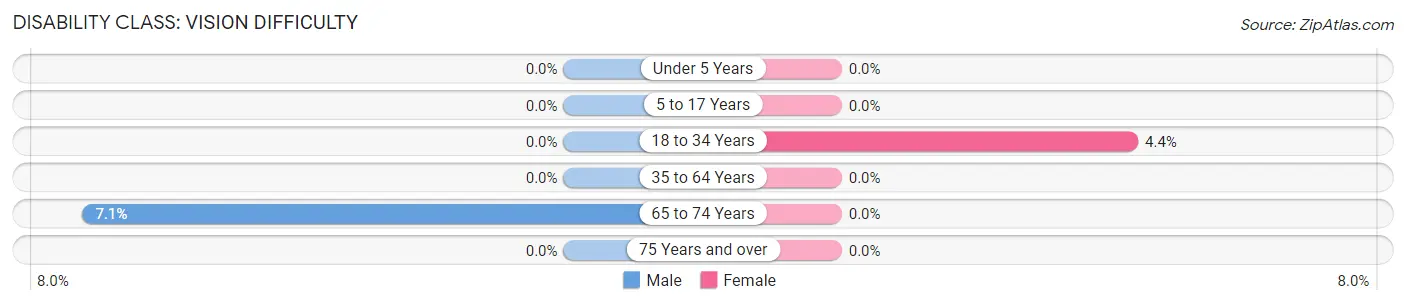
| Age Bracket | Male | Female |
| Under 5 Years | 0 (0.0%) | 0 (0.0%) |
| 5 to 17 Years | 0 (0.0%) | 0 (0.0%) |
| 18 to 34 Years | 0 (0.0%) | 12 (4.4%) |
| 35 to 64 Years | 0 (0.0%) | 0 (0.0%) |
| 65 to 74 Years | 5 (7.1%) | 0 (0.0%) |
| 75 Years and over | 0 (0.0%) | 0 (0.0%) |
Disability Class: Cognitive Difficulty
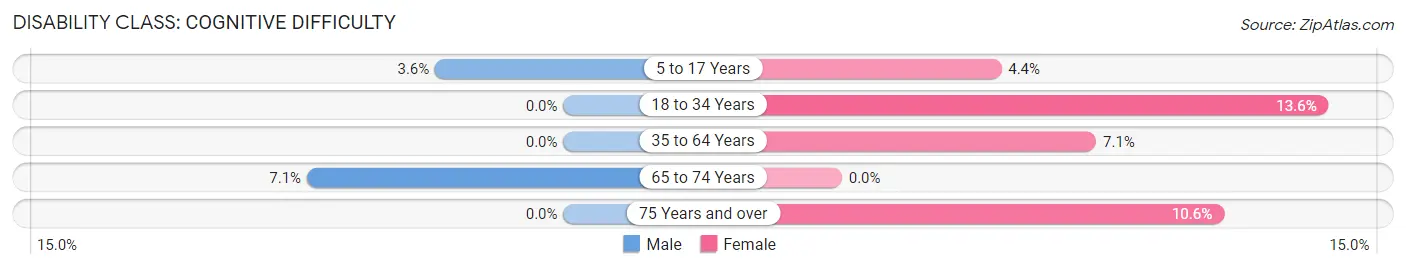
| Age Bracket | Male | Female |
| 5 to 17 Years | 6 (3.6%) | 10 (4.4%) |
| 18 to 34 Years | 0 (0.0%) | 37 (13.6%) |
| 35 to 64 Years | 0 (0.0%) | 39 (7.1%) |
| 65 to 74 Years | 5 (7.1%) | 0 (0.0%) |
| 75 Years and over | 0 (0.0%) | 10 (10.6%) |
Disability Class: Ambulatory Difficulty
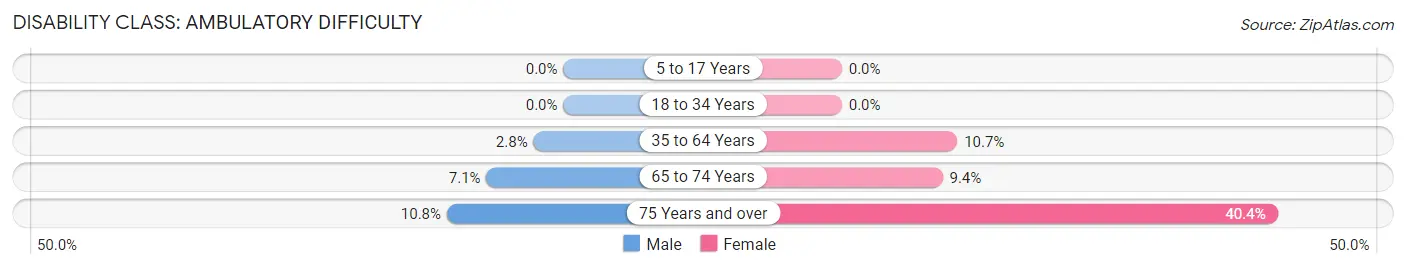
| Age Bracket | Male | Female |
| 5 to 17 Years | 0 (0.0%) | 0 (0.0%) |
| 18 to 34 Years | 0 (0.0%) | 0 (0.0%) |
| 35 to 64 Years | 14 (2.8%) | 59 (10.7%) |
| 65 to 74 Years | 5 (7.1%) | 13 (9.3%) |
| 75 Years and over | 4 (10.8%) | 38 (40.4%) |
Disability Class: Self-Care Difficulty
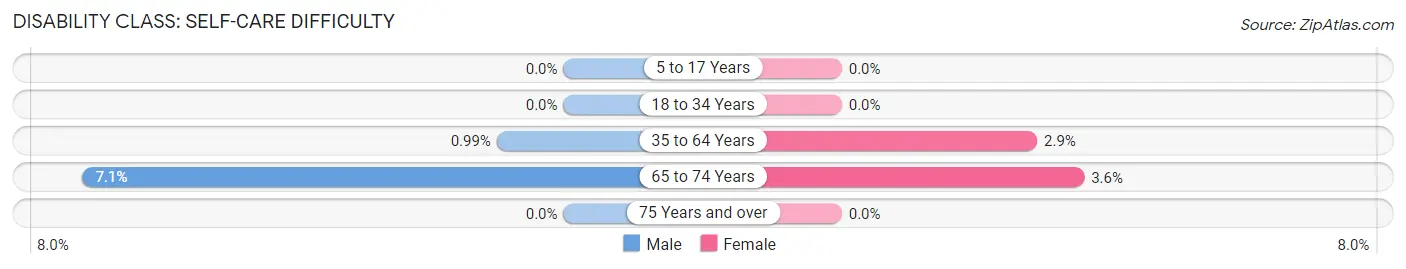
| Age Bracket | Male | Female |
| 5 to 17 Years | 0 (0.0%) | 0 (0.0%) |
| 18 to 34 Years | 0 (0.0%) | 0 (0.0%) |
| 35 to 64 Years | 5 (1.0%) | 16 (2.9%) |
| 65 to 74 Years | 5 (7.1%) | 5 (3.6%) |
| 75 Years and over | 0 (0.0%) | 0 (0.0%) |
Technology Access in Hughesville borough
Computing Device Access in Hughesville borough
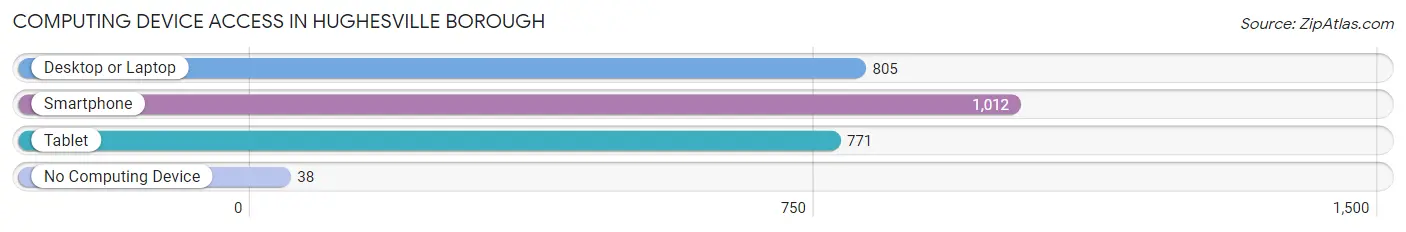
| Device Type | # Households | % Households |
| Desktop or Laptop | 805 | 72.7% |
| Smartphone | 1,012 | 91.3% |
| Tablet | 771 | 69.6% |
| No Computing Device | 38 | 3.4% |
| Total | 1,108 | 100.0% |
Internet Access in Hughesville borough
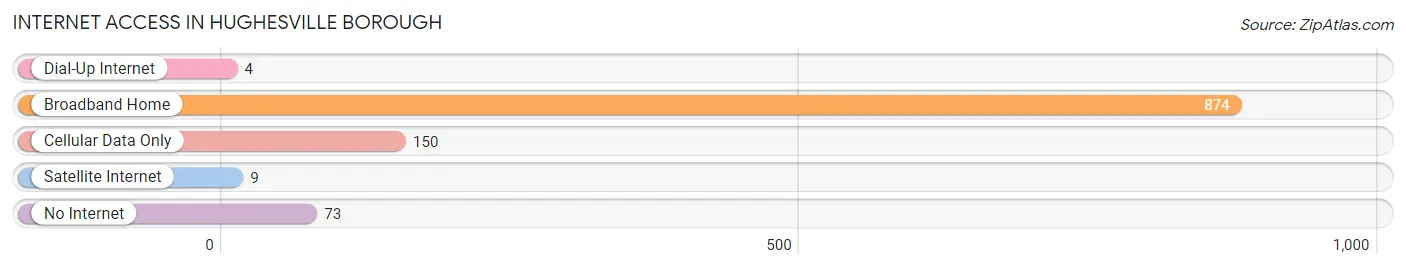
| Internet Type | # Households | % Households |
| Dial-Up Internet | 4 | 0.4% |
| Broadband Home | 874 | 78.9% |
| Cellular Data Only | 150 | 13.5% |
| Satellite Internet | 9 | 0.8% |
| No Internet | 73 | 6.6% |
| Total | 1,108 | 100.0% |
Hughesville borough Summary
Hughesville Borough is a small borough located in Lycoming County, Pennsylvania. It is situated in the eastern part of the county, approximately 10 miles south of Williamsport, the county seat. The borough is surrounded by Wolf Township to the north, Moreland Township to the east, Muncy Creek Township to the south, and Picture Rocks Borough to the west. The population of Hughesville Borough was 1,817 at the 2010 census.
History
The area that is now Hughesville Borough was first settled in the late 1700s by a group of German immigrants. The town was originally known as “Hoffman’s Settlement” after the first settler, John Hoffman. In 1810, the town was renamed “Hughesville” after the Hughes family, who had purchased a large tract of land in the area.
The town was officially incorporated as a borough in 1876. At the time, the town was a small agricultural community, with a population of just over 500. The town grew slowly over the next several decades, and by the turn of the century, the population had grown to 1,000.
In the early 1900s, the town began to experience a period of rapid growth. This was due in part to the construction of the Hughesville and Muncy Creek Railroad, which connected the town to Williamsport and other nearby towns. The railroad also brought new businesses to the area, including a brickyard, a sawmill, and a flour mill.
By the mid-1900s, Hughesville had become a thriving small town. The population had grown to over 1,500, and the town had become a center for commerce and industry. The town also had a thriving arts and culture scene, with several theaters, art galleries, and music venues.
Geography
Hughesville Borough is located in the eastern part of Lycoming County, approximately 10 miles south of Williamsport. The borough is situated in a rural area, with rolling hills and forests. The borough is bordered by Wolf Township to the north, Moreland Township to the east, Muncy Creek Township to the south, and Picture Rocks Borough to the west.
The borough covers an area of 1.2 square miles, all of which is land. The borough is located in the Susquehanna River watershed, and is drained by Muncy Creek, which flows through the center of the borough.
Economy
The economy of Hughesville Borough is largely based on agriculture and manufacturing. The borough is home to several farms, which produce a variety of crops, including corn, soybeans, hay, and wheat. The borough is also home to several manufacturing companies, which produce a variety of products, including furniture, paper products, and plastic products.
The borough is also home to several small businesses, including restaurants, retail stores, and service providers. The borough is also home to several medical facilities, including a hospital and several medical offices.
Demographics
As of the 2010 census, the population of Hughesville Borough was 1,817. The racial makeup of the borough was 97.3% White, 0.7% African American, 0.3% Native American, 0.3% Asian, 0.2% from other races, and 1.2% from two or more races. Hispanic or Latino of any race were 1.2% of the population.
The median household income in the borough was $41,250, and the median family income was $50,000. The per capita income in the borough was $20,845. About 11.2% of families and 14.2% of the population were below the poverty line, including 19.2% of those under age 18 and 8.2% of those age 65 or over.
Common Questions
What is Per Capita Income in Hughesville borough?
Per Capita income in Hughesville borough is $33,570.
What is the Median Family Income in Hughesville borough?
Median Family Income in Hughesville borough is $67,158.
What is the Median Household income in Hughesville borough?
Median Household Income in Hughesville borough is $65,897.
What is Income or Wage Gap in Hughesville borough?
Income or Wage Gap in Hughesville borough is 28.3%.
Women in Hughesville borough earn 71.7 cents for every dollar earned by a man.
What is Inequality or Gini Index in Hughesville borough?
Inequality or Gini Index in Hughesville borough is 0.42.
What is the Total Population of Hughesville borough?
Total Population of Hughesville borough is 2,511.
What is the Total Male Population of Hughesville borough?
Total Male Population of Hughesville borough is 1,142.
What is the Total Female Population of Hughesville borough?
Total Female Population of Hughesville borough is 1,369.
What is the Ratio of Males per 100 Females in Hughesville borough?
There are 83.42 Males per 100 Females in Hughesville borough.
What is the Ratio of Females per 100 Males in Hughesville borough?
There are 119.88 Females per 100 Males in Hughesville borough.
What is the Median Population Age in Hughesville borough?
Median Population Age in Hughesville borough is 41.0 Years.
What is the Average Family Size in Hughesville borough
Average Family Size in Hughesville borough is 2.6 People.
What is the Average Household Size in Hughesville borough
Average Household Size in Hughesville borough is 2.3 People.
How Large is the Labor Force in Hughesville borough?
There are 1,602 People in the Labor Forcein in Hughesville borough.
What is the Percentage of People in the Labor Force in Hughesville borough?
78.8% of People are in the Labor Force in Hughesville borough.
What is the Unemployment Rate in Hughesville borough?
Unemployment Rate in Hughesville borough is 4.2%.