West Mifflin borough, PA Map & Demographics
West Mifflin borough Overview
$33,952
PER CAPITA INCOME
$87,583
AVG FAMILY INCOME
$64,314
AVG HOUSEHOLD INCOME
13.4%
WAGE / INCOME GAP [ % ]
86.6¢/ $1
WAGE / INCOME GAP [ $ ]
$11,134
FAMILY INCOME DEFICIT
0.42
INEQUALITY / GINI INDEX
19,506
TOTAL POPULATION
9,723
MALE POPULATION
9,783
FEMALE POPULATION
99.39
MALES / 100 FEMALES
100.62
FEMALES / 100 MALES
45.2
MEDIAN AGE
3.1
AVG FAMILY SIZE
2.3
AVG HOUSEHOLD SIZE
10,261
LABOR FORCE [ PEOPLE ]
64.7%
PERCENT IN LABOR FORCE
8.9%
UNEMPLOYMENT RATE
Income in West Mifflin borough
Income Overview in West Mifflin borough
Per Capita Income in West Mifflin borough is $33,952, while median incomes of families and households are $87,583 and $64,314 respectively.
| Characteristic | Number | Measure |
| Per Capita Income | 19,506 | $33,952 |
| Median Family Income | 4,673 | $87,583 |
| Mean Family Income | 4,673 | $96,501 |
| Median Household Income | 8,300 | $64,314 |
| Mean Household Income | 8,300 | $77,753 |
| Income Deficit | 4,673 | $11,134 |
| Wage / Income Gap (%) | 19,506 | 13.42% |
| Wage / Income Gap ($) | 19,506 | 86.58¢ per $1 |
| Gini / Inequality Index | 19,506 | 0.42 |
Earnings by Sex in West Mifflin borough
Average Earnings in West Mifflin borough are $43,614, $46,504 for men and $40,264 for women, a difference of 13.4%.
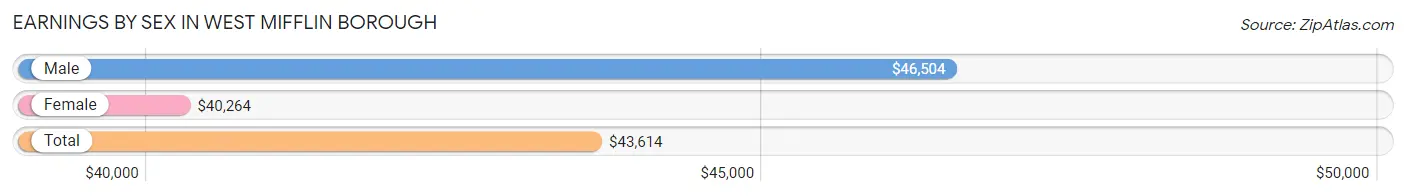
| Sex | Number | Average Earnings |
| Male | 5,491 (52.4%) | $46,504 |
| Female | 4,995 (47.6%) | $40,264 |
| Total | 10,486 (100.0%) | $43,614 |
Earnings by Sex by Income Bracket in West Mifflin borough
The most common earnings brackets in West Mifflin borough are $75,000 to $99,999 for men (816 | 14.9%) and $55,000 to $64,999 for women (540 | 10.8%).
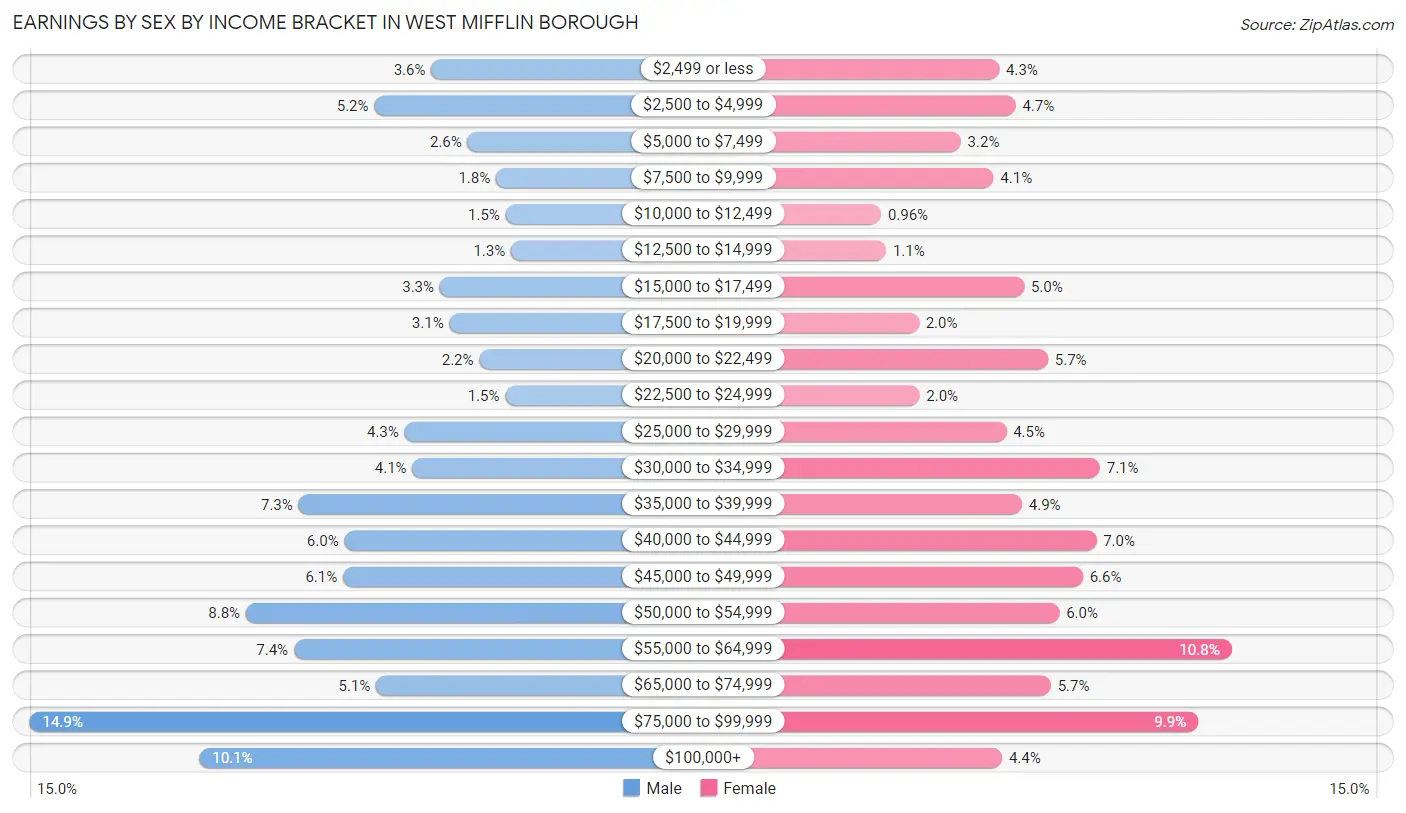
| Income | Male | Female |
| $2,499 or less | 196 (3.6%) | 214 (4.3%) |
| $2,500 to $4,999 | 284 (5.2%) | 237 (4.7%) |
| $5,000 to $7,499 | 140 (2.5%) | 160 (3.2%) |
| $7,500 to $9,999 | 96 (1.8%) | 206 (4.1%) |
| $10,000 to $12,499 | 81 (1.5%) | 48 (1.0%) |
| $12,500 to $14,999 | 73 (1.3%) | 55 (1.1%) |
| $15,000 to $17,499 | 183 (3.3%) | 249 (5.0%) |
| $17,500 to $19,999 | 168 (3.1%) | 101 (2.0%) |
| $20,000 to $22,499 | 122 (2.2%) | 282 (5.7%) |
| $22,500 to $24,999 | 82 (1.5%) | 102 (2.0%) |
| $25,000 to $29,999 | 237 (4.3%) | 224 (4.5%) |
| $30,000 to $34,999 | 225 (4.1%) | 355 (7.1%) |
| $35,000 to $39,999 | 401 (7.3%) | 246 (4.9%) |
| $40,000 to $44,999 | 330 (6.0%) | 350 (7.0%) |
| $45,000 to $49,999 | 332 (6.0%) | 331 (6.6%) |
| $50,000 to $54,999 | 482 (8.8%) | 298 (6.0%) |
| $55,000 to $64,999 | 408 (7.4%) | 540 (10.8%) |
| $65,000 to $74,999 | 281 (5.1%) | 286 (5.7%) |
| $75,000 to $99,999 | 816 (14.9%) | 493 (9.9%) |
| $100,000+ | 554 (10.1%) | 218 (4.4%) |
| Total | 5,491 (100.0%) | 4,995 (100.0%) |
Earnings by Sex by Educational Attainment in West Mifflin borough
Average earnings in West Mifflin borough are $50,907 for men and $43,250 for women, a difference of 15.0%. Men with an educational attainment of graduate degree enjoy the highest average annual earnings of $80,417, while those with less than high school education earn the least with $19,293. Women with an educational attainment of bachelor's degree earn the most with the average annual earnings of $56,213, while those with less than high school education have the smallest earnings of $8,344.
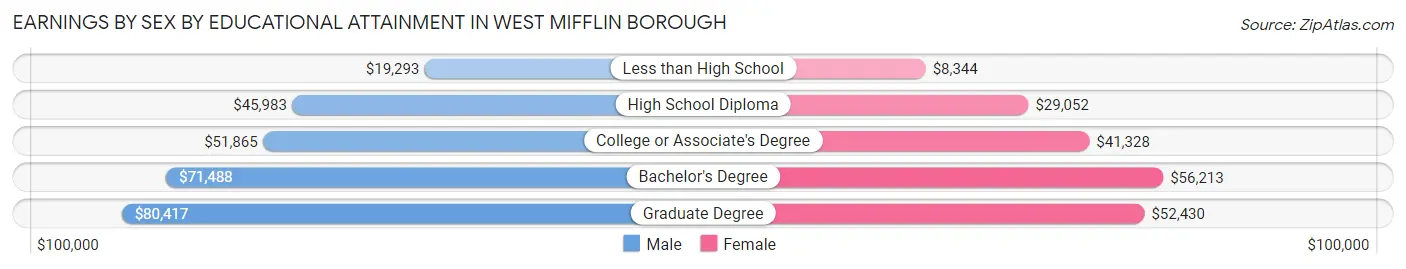
| Educational Attainment | Male Income | Female Income |
| Less than High School | $19,293 | $8,344 |
| High School Diploma | $45,983 | $29,052 |
| College or Associate's Degree | $51,865 | $41,328 |
| Bachelor's Degree | $71,488 | $56,213 |
| Graduate Degree | $80,417 | $52,430 |
| Total | $50,907 | $43,250 |
Family Income in West Mifflin borough
Family Income Brackets in West Mifflin borough
According to the West Mifflin borough family income data, there are 1,145 families falling into the $100,000 to $149,999 income range, which is the most common income bracket and makes up 24.5% of all families. Conversely, the $10,000 to $14,999 income bracket is the least frequent group with only 37 families (0.8%) belonging to this category.
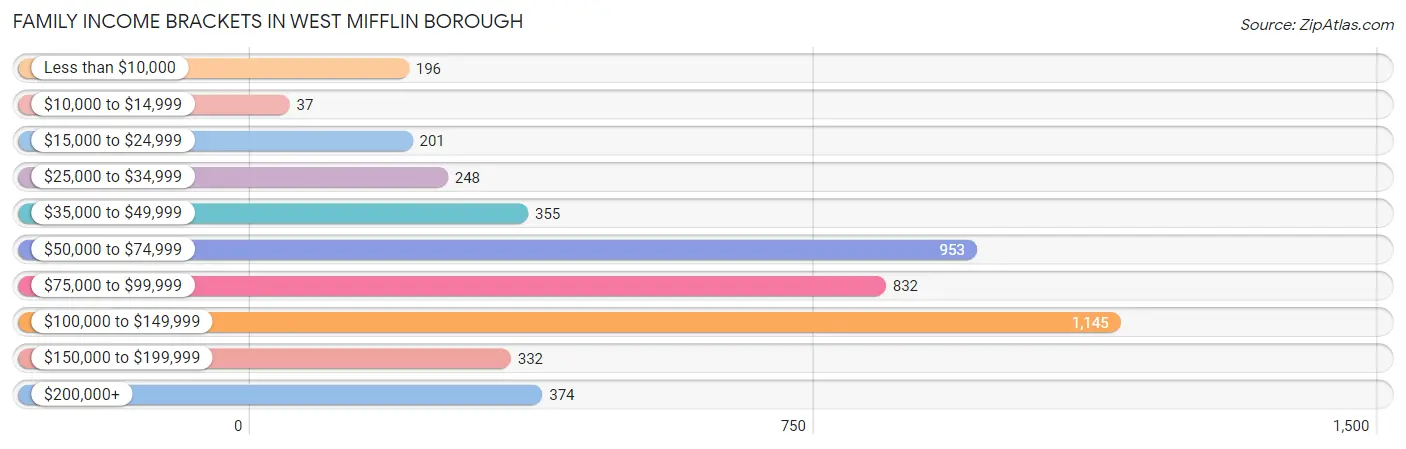
| Income Bracket | # Families | % Families |
| Less than $10,000 | 196 | 4.2% |
| $10,000 to $14,999 | 37 | 0.8% |
| $15,000 to $24,999 | 201 | 4.3% |
| $25,000 to $34,999 | 248 | 5.3% |
| $35,000 to $49,999 | 355 | 7.6% |
| $50,000 to $74,999 | 953 | 20.4% |
| $75,000 to $99,999 | 832 | 17.8% |
| $100,000 to $149,999 | 1,145 | 24.5% |
| $150,000 to $199,999 | 332 | 7.1% |
| $200,000+ | 374 | 8.0% |
Family Income by Famaliy Size in West Mifflin borough
4-person families (818 | 17.5%) account for the highest median family income in West Mifflin borough with $96,932 per family, while 2-person families (2,272 | 48.6%) have the highest median income of $37,420 per family member.
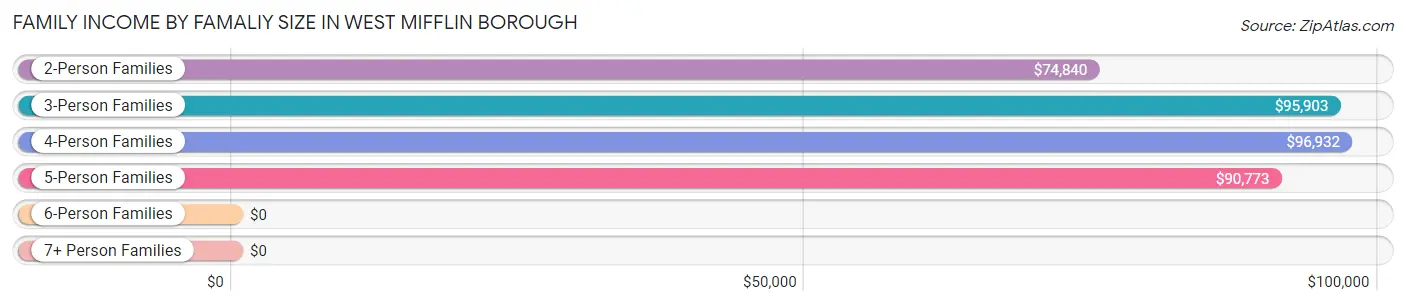
| Income Bracket | # Families | Median Income |
| 2-Person Families | 2,272 (48.6%) | $74,840 |
| 3-Person Families | 1,032 (22.1%) | $95,903 |
| 4-Person Families | 818 (17.5%) | $96,932 |
| 5-Person Families | 461 (9.9%) | $90,773 |
| 6-Person Families | 90 (1.9%) | $0 |
| 7+ Person Families | 0 (0.0%) | $0 |
| Total | 4,673 (100.0%) | $87,583 |
Family Income by Number of Earners in West Mifflin borough
The median family income in West Mifflin borough is $87,583, with families comprising 3+ earners (730) having the highest median family income of $127,500, while families with no earners (773) have the lowest median family income of $47,188, accounting for 15.6% and 16.5% of families, respectively.
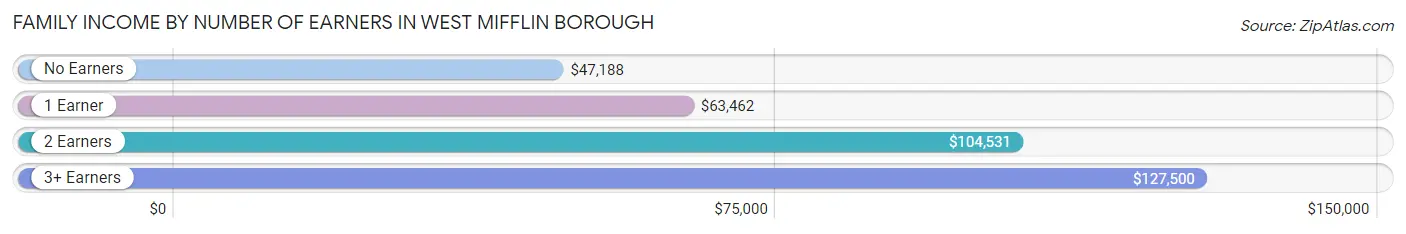
| Number of Earners | # Families | Median Income |
| No Earners | 773 (16.5%) | $47,188 |
| 1 Earner | 1,396 (29.9%) | $63,462 |
| 2 Earners | 1,774 (38.0%) | $104,531 |
| 3+ Earners | 730 (15.6%) | $127,500 |
| Total | 4,673 (100.0%) | $87,583 |
Household Income in West Mifflin borough
Household Income Brackets in West Mifflin borough
With 1,560 households falling in the category, the $100,000 to $149,999 income range is the most frequent in West Mifflin borough, accounting for 18.8% of all households. In contrast, only 257 households (3.1%) fall into the $10,000 to $14,999 income bracket, making it the least populous group.
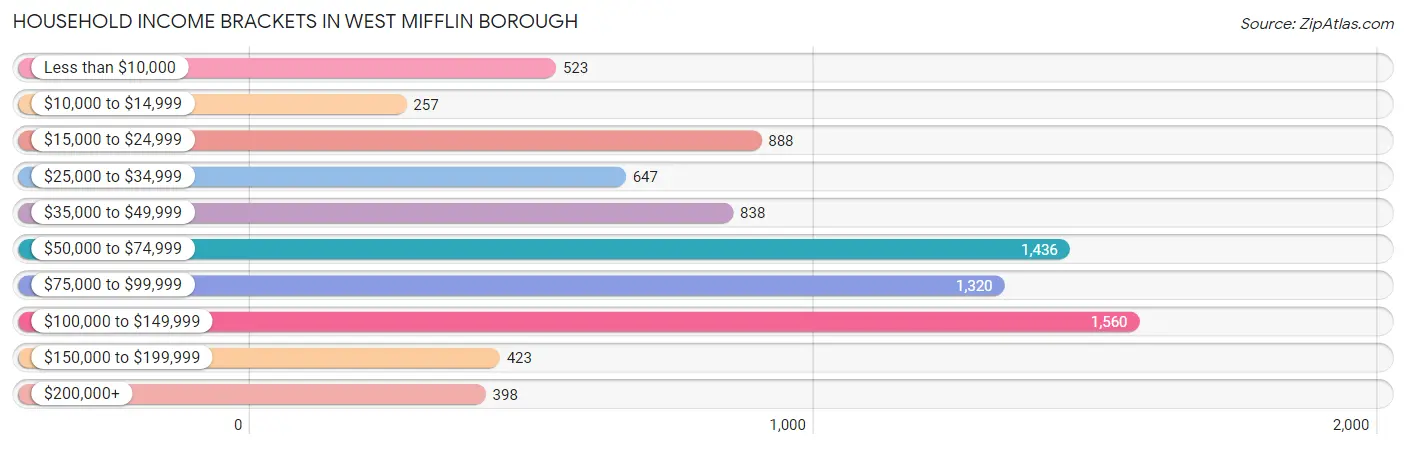
| Income Bracket | # Households | % Households |
| Less than $10,000 | 523 | 6.3% |
| $10,000 to $14,999 | 257 | 3.1% |
| $15,000 to $24,999 | 888 | 10.7% |
| $25,000 to $34,999 | 647 | 7.8% |
| $35,000 to $49,999 | 838 | 10.1% |
| $50,000 to $74,999 | 1,436 | 17.3% |
| $75,000 to $99,999 | 1,320 | 15.9% |
| $100,000 to $149,999 | 1,560 | 18.8% |
| $150,000 to $199,999 | 423 | 5.1% |
| $200,000+ | 398 | 4.8% |
Household Income by Householder Age in West Mifflin borough
The median household income in West Mifflin borough is $64,314, with the highest median household income of $87,774 found in the 25 to 44 years age bracket for the primary householder. A total of 1,840 households (22.2%) fall into this category. Meanwhile, the 15 to 24 years age bracket for the primary householder has the lowest median household income of $0, with 193 households (2.3%) in this group.
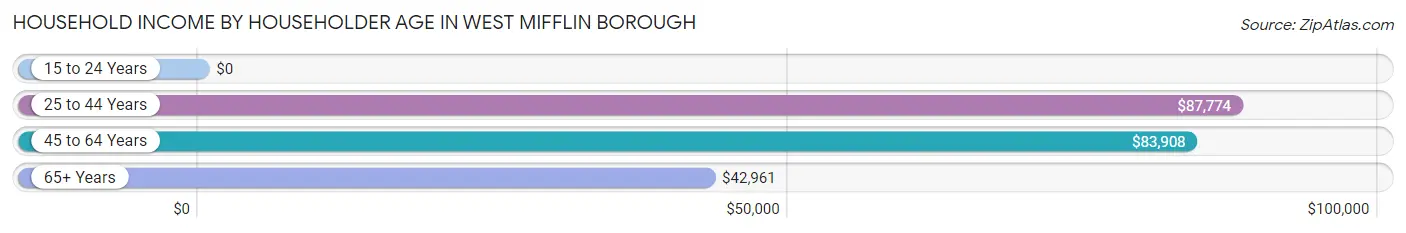
| Income Bracket | # Households | Median Income |
| 15 to 24 Years | 193 (2.3%) | $0 |
| 25 to 44 Years | 1,840 (22.2%) | $87,774 |
| 45 to 64 Years | 3,713 (44.7%) | $83,908 |
| 65+ Years | 2,554 (30.8%) | $42,961 |
| Total | 8,300 (100.0%) | $64,314 |
Poverty in West Mifflin borough
Income Below Poverty by Sex and Age in West Mifflin borough
With 12.6% poverty level for males and 13.9% for females among the residents of West Mifflin borough, 5 year old males and 6 to 11 year old females are the most vulnerable to poverty, with 29 males (64.4%) and 248 females (44.6%) in their respective age groups living below the poverty level.
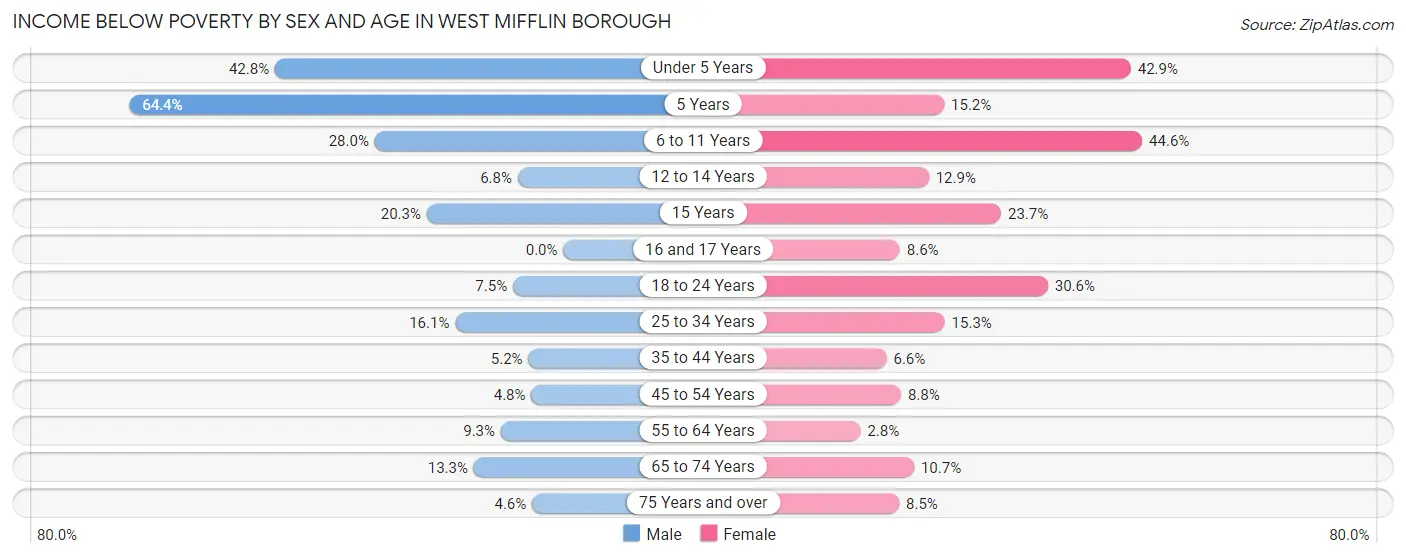
| Age Bracket | Male | Female |
| Under 5 Years | 179 (42.8%) | 191 (42.9%) |
| 5 Years | 29 (64.4%) | 41 (15.2%) |
| 6 to 11 Years | 249 (28.0%) | 248 (44.6%) |
| 12 to 14 Years | 20 (6.8%) | 43 (12.9%) |
| 15 Years | 43 (20.3%) | 22 (23.7%) |
| 16 and 17 Years | 0 (0.0%) | 5 (8.6%) |
| 18 to 24 Years | 52 (7.5%) | 182 (30.6%) |
| 25 to 34 Years | 211 (16.1%) | 191 (15.3%) |
| 35 to 44 Years | 43 (5.2%) | 65 (6.6%) |
| 45 to 54 Years | 64 (4.8%) | 121 (8.8%) |
| 55 to 64 Years | 157 (9.3%) | 47 (2.8%) |
| 65 to 74 Years | 146 (13.3%) | 116 (10.7%) |
| 75 Years and over | 21 (4.6%) | 85 (8.5%) |
| Total | 1,214 (12.6%) | 1,357 (13.9%) |
Income Above Poverty by Sex and Age in West Mifflin borough
According to the poverty statistics in West Mifflin borough, males aged 16 and 17 years and females aged 55 to 64 years are the age groups that are most secure financially, with 100.0% of males and 97.2% of females in these age groups living above the poverty line.
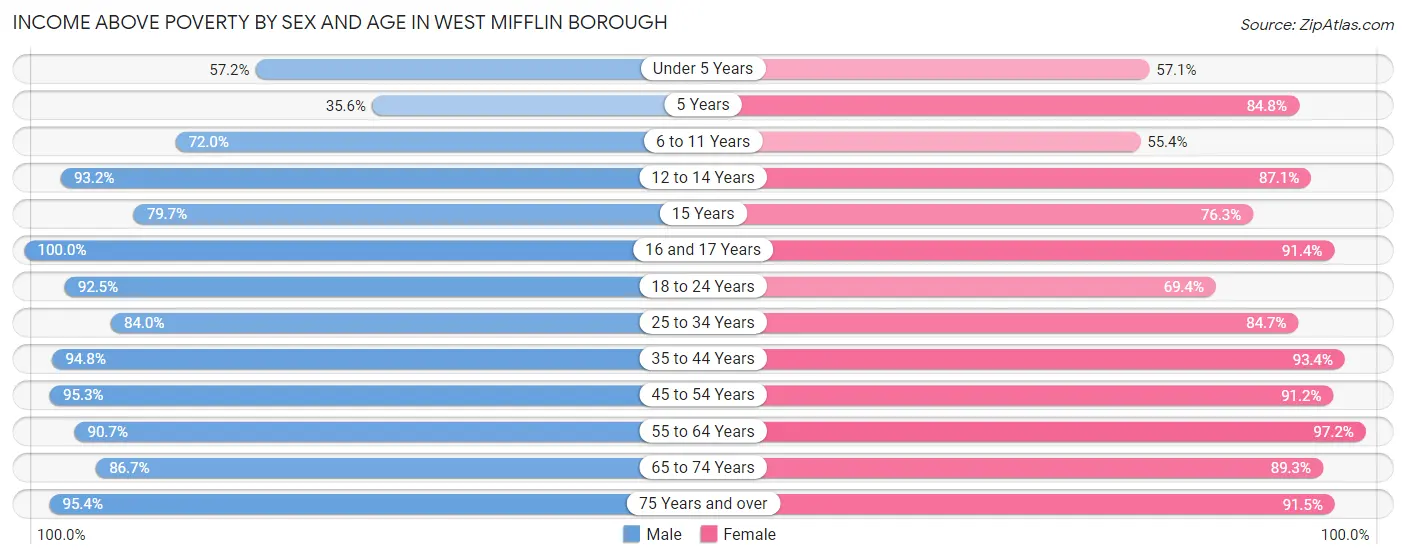
| Age Bracket | Male | Female |
| Under 5 Years | 239 (57.2%) | 254 (57.1%) |
| 5 Years | 16 (35.6%) | 229 (84.8%) |
| 6 to 11 Years | 640 (72.0%) | 308 (55.4%) |
| 12 to 14 Years | 276 (93.2%) | 290 (87.1%) |
| 15 Years | 169 (79.7%) | 71 (76.3%) |
| 16 and 17 Years | 327 (100.0%) | 53 (91.4%) |
| 18 to 24 Years | 643 (92.5%) | 413 (69.4%) |
| 25 to 34 Years | 1,104 (84.0%) | 1,060 (84.7%) |
| 35 to 44 Years | 786 (94.8%) | 914 (93.4%) |
| 45 to 54 Years | 1,284 (95.3%) | 1,255 (91.2%) |
| 55 to 64 Years | 1,535 (90.7%) | 1,650 (97.2%) |
| 65 to 74 Years | 952 (86.7%) | 966 (89.3%) |
| 75 Years and over | 432 (95.4%) | 914 (91.5%) |
| Total | 8,403 (87.4%) | 8,377 (86.1%) |
Income Below Poverty Among Married-Couple Families in West Mifflin borough
The poverty statistics for married-couple families in West Mifflin borough show that 5.5% or 190 of the total 3,480 families live below the poverty line. Families with 3 or 4 children have the highest poverty rate of 17.2%, comprising of 69 families. On the other hand, families with no children have the lowest poverty rate of 3.7%, which includes 85 families.
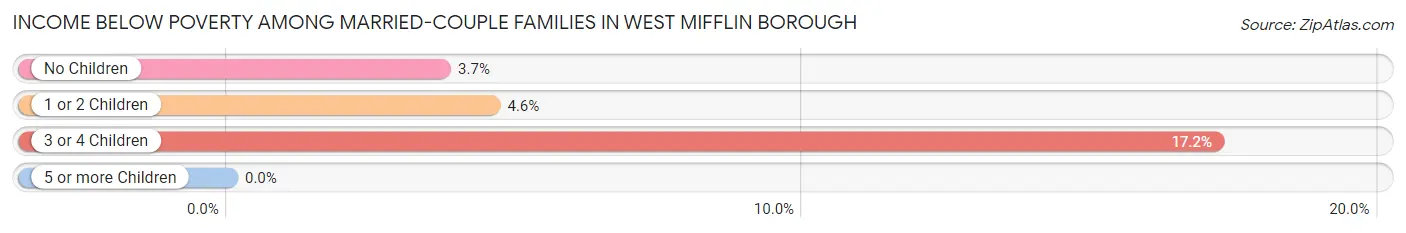
| Children | Above Poverty | Below Poverty |
| No Children | 2,206 (96.3%) | 85 (3.7%) |
| 1 or 2 Children | 751 (95.4%) | 36 (4.6%) |
| 3 or 4 Children | 333 (82.8%) | 69 (17.2%) |
| 5 or more Children | 0 (0.0%) | 0 (0.0%) |
| Total | 3,290 (94.5%) | 190 (5.5%) |
Income Below Poverty Among Single-Parent Households in West Mifflin borough
According to the poverty data in West Mifflin borough, 13.8% or 61 single-father households and 24.5% or 184 single-mother households are living below the poverty line. Among single-father households, those with 3 or 4 children have the highest poverty rate, with 49 households (75.4%) experiencing poverty. Likewise, among single-mother households, those with 3 or 4 children have the highest poverty rate, with 61 households (100.0%) falling below the poverty line.
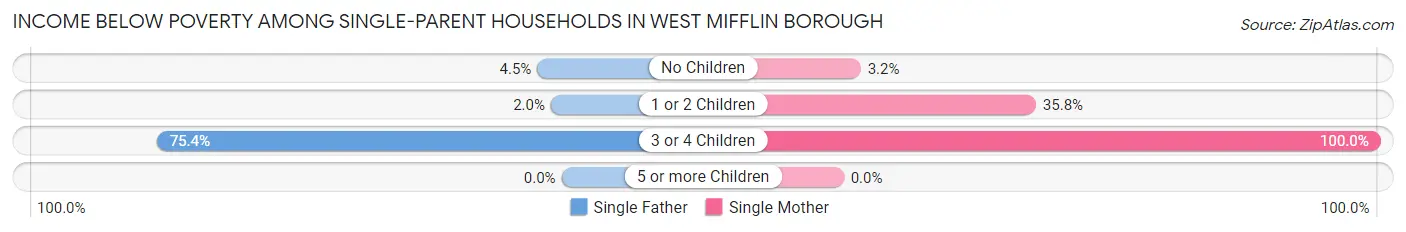
| Children | Single Father | Single Mother |
| No Children | 8 (4.5%) | 12 (3.2%) |
| 1 or 2 Children | 4 (2.0%) | 111 (35.8%) |
| 3 or 4 Children | 49 (75.4%) | 61 (100.0%) |
| 5 or more Children | 0 (0.0%) | 0 (0.0%) |
| Total | 61 (13.8%) | 184 (24.5%) |
Income Below Poverty Among Married-Couple vs Single-Parent Households in West Mifflin borough
The poverty data for West Mifflin borough shows that 190 of the married-couple family households (5.5%) and 245 of the single-parent households (20.5%) are living below the poverty level. Within the married-couple family households, those with 3 or 4 children have the highest poverty rate, with 69 households (17.2%) falling below the poverty line. Among the single-parent households, those with 3 or 4 children have the highest poverty rate, with 110 household (87.3%) living below poverty.
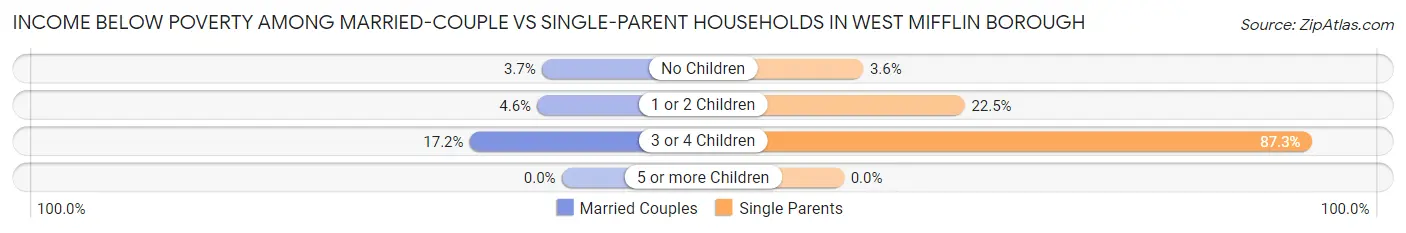
| Children | Married-Couple Families | Single-Parent Households |
| No Children | 85 (3.7%) | 20 (3.6%) |
| 1 or 2 Children | 36 (4.6%) | 115 (22.5%) |
| 3 or 4 Children | 69 (17.2%) | 110 (87.3%) |
| 5 or more Children | 0 (0.0%) | 0 (0.0%) |
| Total | 190 (5.5%) | 245 (20.5%) |
Race in West Mifflin borough
The most populous races in West Mifflin borough are White / Caucasian (16,449 | 84.3%), Black / African American (2,066 | 10.6%), and Two or more Races (684 | 3.5%).
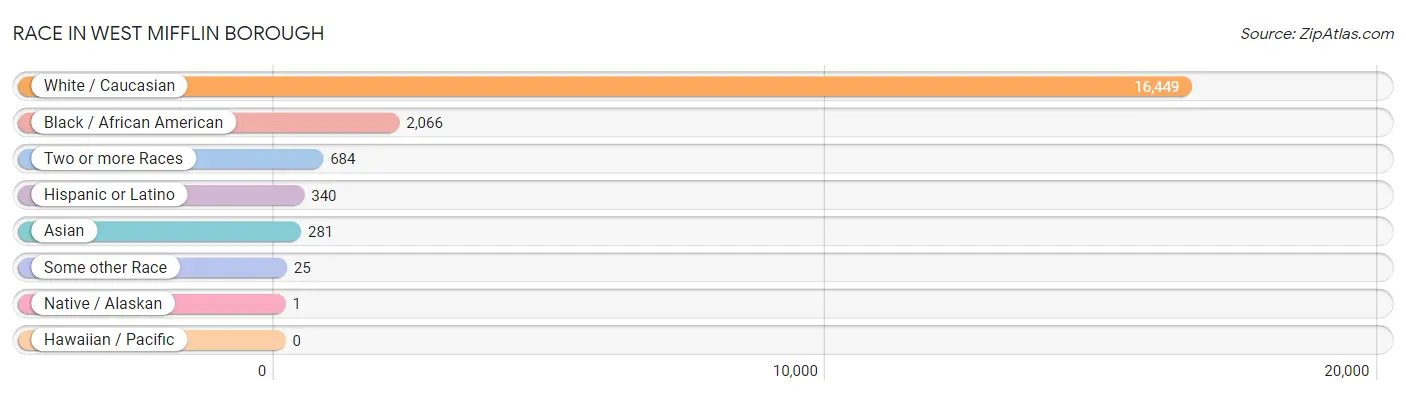
| Race | # Population | % Population |
| Asian | 281 | 1.4% |
| Black / African American | 2,066 | 10.6% |
| Hawaiian / Pacific | 0 | 0.0% |
| Hispanic or Latino | 340 | 1.7% |
| Native / Alaskan | 1 | 0.0% |
| White / Caucasian | 16,449 | 84.3% |
| Two or more Races | 684 | 3.5% |
| Some other Race | 25 | 0.1% |
| Total | 19,506 | 100.0% |
Ancestry in West Mifflin borough
The most populous ancestries reported in West Mifflin borough are Irish (3,732 | 19.1%), German (3,723 | 19.1%), Italian (3,524 | 18.1%), Slovak (2,225 | 11.4%), and Polish (1,762 | 9.0%), together accounting for 76.7% of all West Mifflin borough residents.
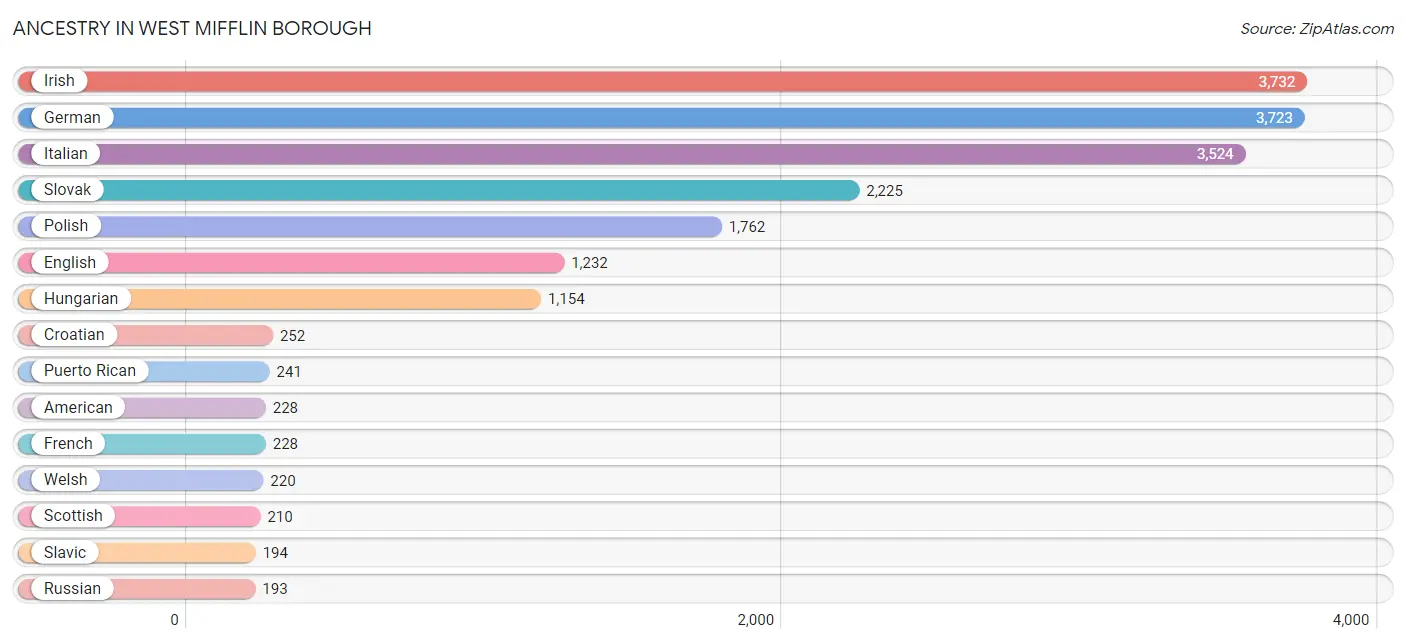
| Ancestry | # Population | % Population |
| African | 171 | 0.9% |
| Albanian | 8 | 0.0% |
| American | 228 | 1.2% |
| Arab | 108 | 0.5% |
| Austrian | 8 | 0.0% |
| Belgian | 19 | 0.1% |
| Blackfeet | 61 | 0.3% |
| British | 88 | 0.4% |
| Bulgarian | 3 | 0.0% |
| Burmese | 4 | 0.0% |
| Carpatho Rusyn | 57 | 0.3% |
| Cherokee | 1 | 0.0% |
| Croatian | 252 | 1.3% |
| Czech | 172 | 0.9% |
| Czechoslovakian | 38 | 0.2% |
| Dutch | 163 | 0.8% |
| Eastern European | 52 | 0.3% |
| English | 1,232 | 6.3% |
| European | 51 | 0.3% |
| French | 228 | 1.2% |
| French Canadian | 12 | 0.1% |
| German | 3,723 | 19.1% |
| Greek | 37 | 0.2% |
| Haitian | 14 | 0.1% |
| Hungarian | 1,154 | 5.9% |
| Irish | 3,732 | 19.1% |
| Iroquois | 10 | 0.1% |
| Israeli | 30 | 0.2% |
| Italian | 3,524 | 18.1% |
| Lebanese | 53 | 0.3% |
| Lithuanian | 186 | 0.9% |
| Mexican | 58 | 0.3% |
| Northern European | 30 | 0.2% |
| Norwegian | 11 | 0.1% |
| Pennsylvania German | 4 | 0.0% |
| Polish | 1,762 | 9.0% |
| Puerto Rican | 241 | 1.2% |
| Romanian | 6 | 0.0% |
| Russian | 193 | 1.0% |
| Scandinavian | 18 | 0.1% |
| Scotch-Irish | 108 | 0.5% |
| Scottish | 210 | 1.1% |
| Serbian | 176 | 0.9% |
| Slavic | 194 | 1.0% |
| Slovak | 2,225 | 11.4% |
| Slovene | 42 | 0.2% |
| Spaniard | 41 | 0.2% |
| Subsaharan African | 179 | 0.9% |
| Swedish | 108 | 0.5% |
| Syrian | 27 | 0.1% |
| Turkish | 6 | 0.0% |
| Ukrainian | 19 | 0.1% |
| Welsh | 220 | 1.1% |
| Yugoslavian | 10 | 0.1% | View All 54 Rows |
Immigrants in West Mifflin borough
The most numerous immigrant groups reported in West Mifflin borough came from Asia (141 | 0.7%), Europe (100 | 0.5%), Eastern Asia (90 | 0.5%), Korea (90 | 0.5%), and South Central Asia (51 | 0.3%), together accounting for 2.4% of all West Mifflin borough residents.
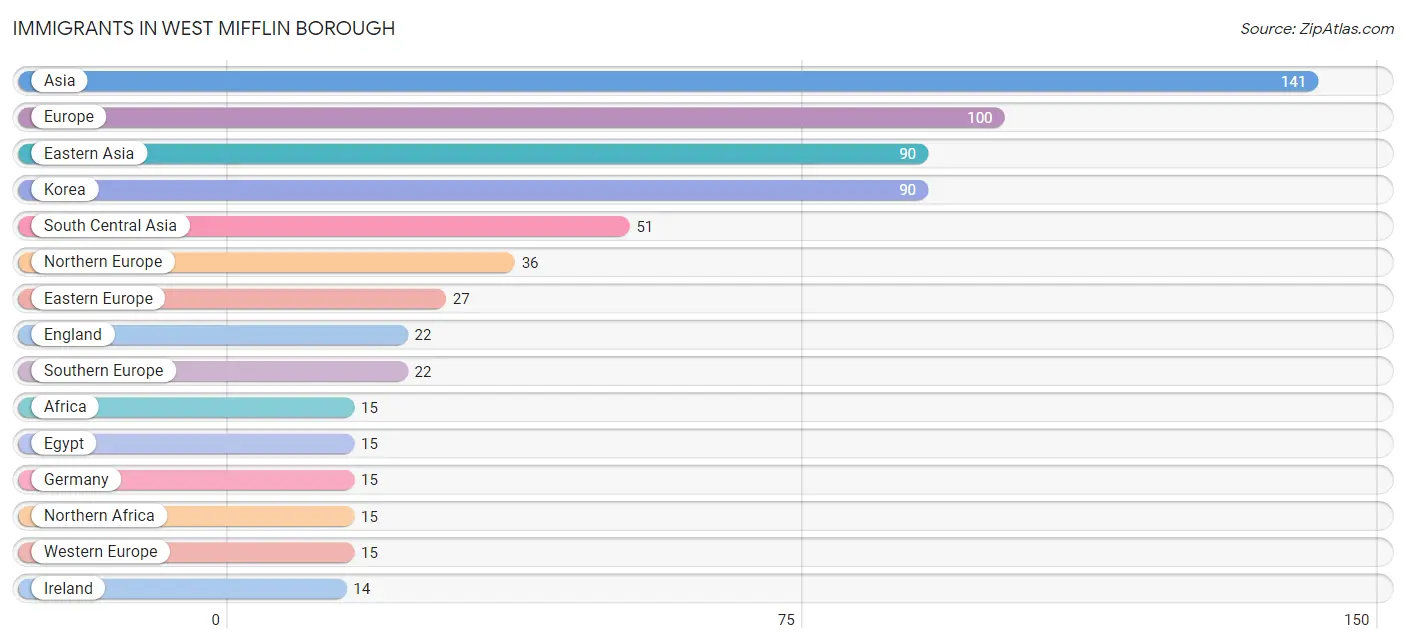
| Immigration Origin | # Population | % Population |
| Africa | 15 | 0.1% |
| Asia | 141 | 0.7% |
| Brazil | 3 | 0.0% |
| Central America | 1 | 0.0% |
| Eastern Asia | 90 | 0.5% |
| Eastern Europe | 27 | 0.1% |
| Egypt | 15 | 0.1% |
| England | 22 | 0.1% |
| Europe | 100 | 0.5% |
| Germany | 15 | 0.1% |
| Hungary | 11 | 0.1% |
| Ireland | 14 | 0.1% |
| Italy | 12 | 0.1% |
| Korea | 90 | 0.5% |
| Latin America | 4 | 0.0% |
| Mexico | 1 | 0.0% |
| Northern Africa | 15 | 0.1% |
| Northern Europe | 36 | 0.2% |
| South America | 3 | 0.0% |
| South Central Asia | 51 | 0.3% |
| Southern Europe | 22 | 0.1% |
| Spain | 10 | 0.1% |
| Sri Lanka | 1 | 0.0% |
| Uzbekistan | 14 | 0.1% |
| Western Europe | 15 | 0.1% | View All 25 Rows |
Sex and Age in West Mifflin borough
Sex and Age in West Mifflin borough
The most populous age groups in West Mifflin borough are 10 to 14 Years (978 | 10.1%) for men and 60 to 64 Years (1,015 | 10.4%) for women.
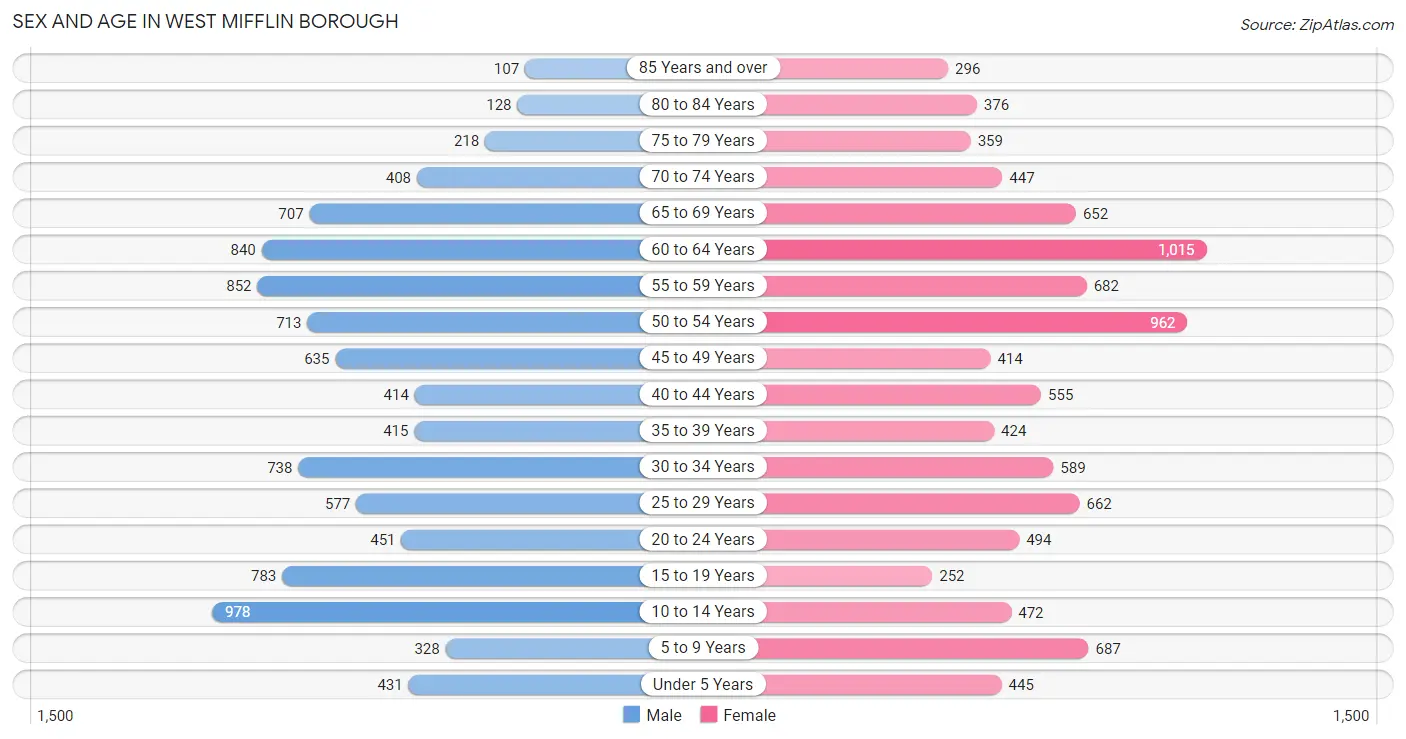
| Age Bracket | Male | Female |
| Under 5 Years | 431 (4.4%) | 445 (4.5%) |
| 5 to 9 Years | 328 (3.4%) | 687 (7.0%) |
| 10 to 14 Years | 978 (10.1%) | 472 (4.8%) |
| 15 to 19 Years | 783 (8.1%) | 252 (2.6%) |
| 20 to 24 Years | 451 (4.6%) | 494 (5.1%) |
| 25 to 29 Years | 577 (5.9%) | 662 (6.8%) |
| 30 to 34 Years | 738 (7.6%) | 589 (6.0%) |
| 35 to 39 Years | 415 (4.3%) | 424 (4.3%) |
| 40 to 44 Years | 414 (4.3%) | 555 (5.7%) |
| 45 to 49 Years | 635 (6.5%) | 414 (4.2%) |
| 50 to 54 Years | 713 (7.3%) | 962 (9.8%) |
| 55 to 59 Years | 852 (8.8%) | 682 (7.0%) |
| 60 to 64 Years | 840 (8.6%) | 1,015 (10.4%) |
| 65 to 69 Years | 707 (7.3%) | 652 (6.7%) |
| 70 to 74 Years | 408 (4.2%) | 447 (4.6%) |
| 75 to 79 Years | 218 (2.2%) | 359 (3.7%) |
| 80 to 84 Years | 128 (1.3%) | 376 (3.8%) |
| 85 Years and over | 107 (1.1%) | 296 (3.0%) |
| Total | 9,723 (100.0%) | 9,783 (100.0%) |
Families and Households in West Mifflin borough
Median Family Size in West Mifflin borough
The median family size in West Mifflin borough is 3.11 persons per family, with single female/mother families (750 | 16.1%) accounting for the largest median family size of 3.19 persons per family. On the other hand, single male/father families (443 | 9.5%) represent the smallest median family size with 2.93 persons per family.
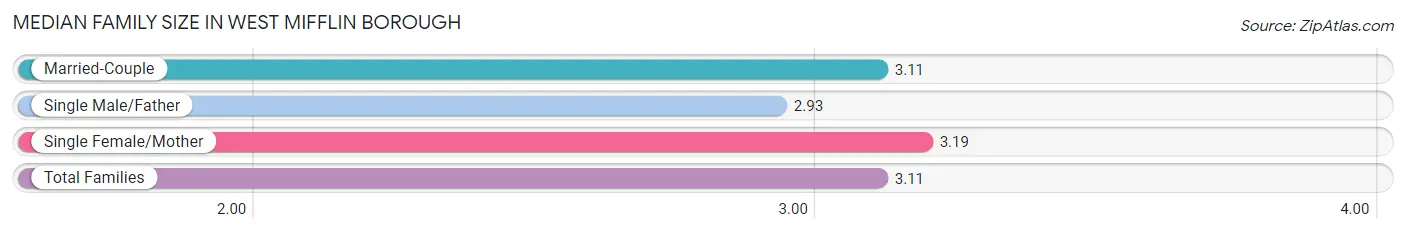
| Family Type | # Families | Family Size |
| Married-Couple | 3,480 (74.5%) | 3.11 |
| Single Male/Father | 443 (9.5%) | 2.93 |
| Single Female/Mother | 750 (16.1%) | 3.19 |
| Total Families | 4,673 (100.0%) | 3.11 |
Median Household Size in West Mifflin borough
The median household size in West Mifflin borough is 2.34 persons per household, with single female/mother households (750 | 9.0%) accounting for the largest median household size of 3.52 persons per household. non-family households (3,627 | 43.7%) represent the smallest median household size with 1.22 persons per household.
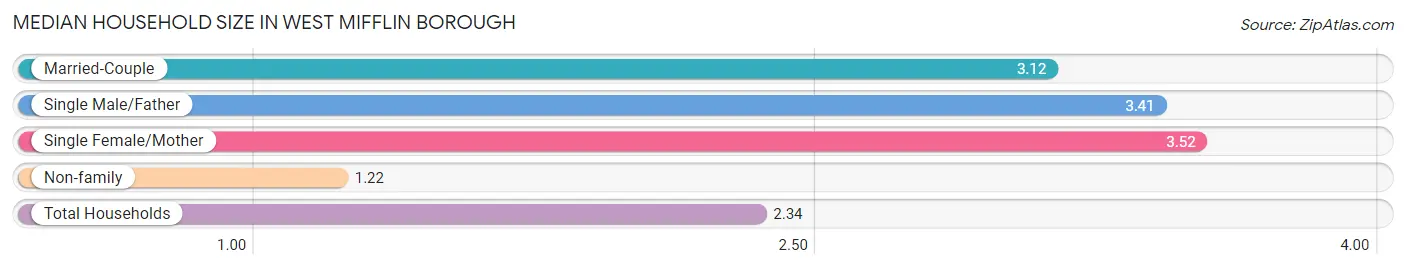
| Household Type | # Households | Household Size |
| Married-Couple | 3,480 (41.9%) | 3.12 |
| Single Male/Father | 443 (5.3%) | 3.41 |
| Single Female/Mother | 750 (9.0%) | 3.52 |
| Non-family | 3,627 (43.7%) | 1.22 |
| Total Households | 8,300 (100.0%) | 2.34 |
Household Size by Marriage Status in West Mifflin borough
Out of a total of 8,300 households in West Mifflin borough, 4,673 (56.3%) are family households, while 3,627 (43.7%) are nonfamily households. The most numerous type of family households are 2-person households, comprising 2,101, and the most common type of nonfamily households are 1-person households, comprising 3,030.
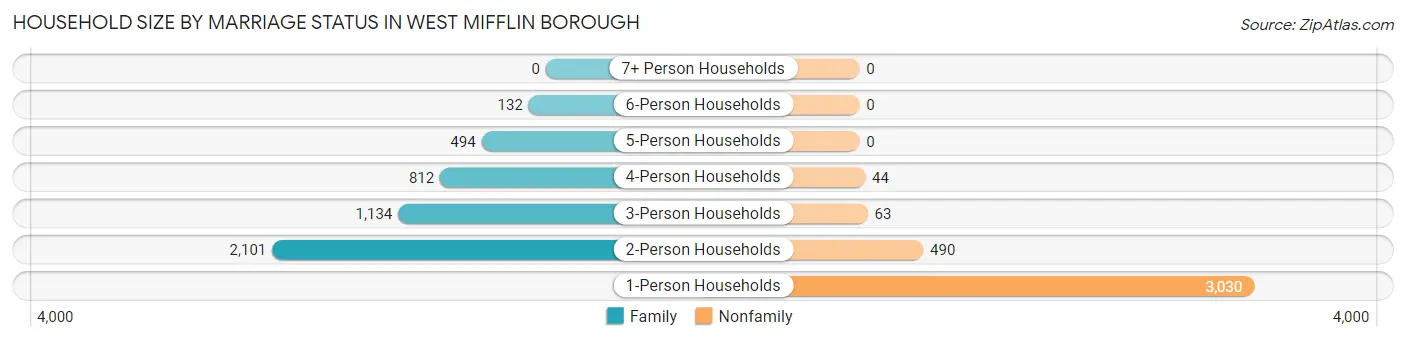
| Household Size | Family Households | Nonfamily Households |
| 1-Person Households | - | 3,030 (36.5%) |
| 2-Person Households | 2,101 (25.3%) | 490 (5.9%) |
| 3-Person Households | 1,134 (13.7%) | 63 (0.8%) |
| 4-Person Households | 812 (9.8%) | 44 (0.5%) |
| 5-Person Households | 494 (5.9%) | 0 (0.0%) |
| 6-Person Households | 132 (1.6%) | 0 (0.0%) |
| 7+ Person Households | 0 (0.0%) | 0 (0.0%) |
| Total | 4,673 (56.3%) | 3,627 (43.7%) |
Female Fertility in West Mifflin borough
Fertility by Age in West Mifflin borough
Average fertility rate in West Mifflin borough is 65.0 births per 1,000 women. Women in the age bracket of 20 to 34 years have the highest fertility rate with 113.0 births per 1,000 women. Women in the age bracket of 20 to 34 years acount for 83.8% of all women with births.
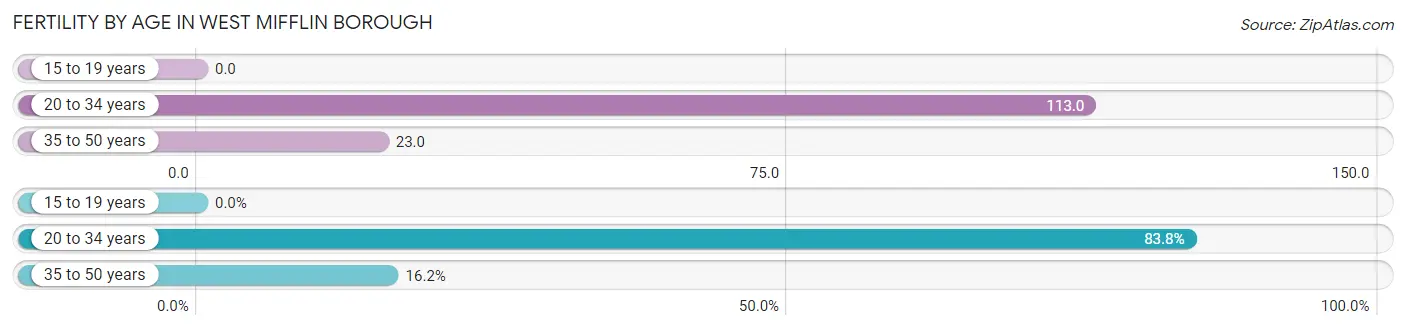
| Age Bracket | Women with Births | Births / 1,000 Women |
| 15 to 19 years | 0 (0.0%) | 0.0 |
| 20 to 34 years | 197 (83.8%) | 113.0 |
| 35 to 50 years | 38 (16.2%) | 23.0 |
| Total | 235 (100.0%) | 65.0 |
Fertility by Age by Marriage Status in West Mifflin borough
39.1% of women with births (235) in West Mifflin borough are married. The highest percentage of unmarried women with births falls into 35 to 50 years age bracket with 84.2% of them unmarried at the time of birth, while the lowest percentage of unmarried women with births belong to 20 to 34 years age bracket with 56.4% of them unmarried.
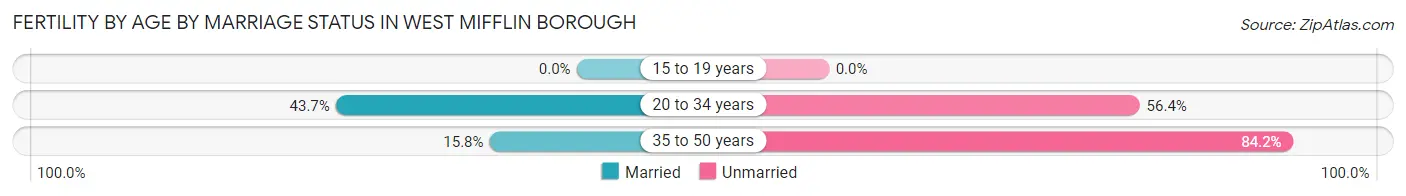
| Age Bracket | Married | Unmarried |
| 15 to 19 years | 0 (0.0%) | 0 (0.0%) |
| 20 to 34 years | 86 (43.6%) | 111 (56.4%) |
| 35 to 50 years | 6 (15.8%) | 32 (84.2%) |
| Total | 92 (39.2%) | 143 (60.9%) |
Fertility by Education in West Mifflin borough
Average fertility rate in West Mifflin borough is 65.0 births per 1,000 women. Women with the education attainment of less than high school have the highest fertility rate of 111.0 births per 1,000 women, while women with the education attainment of graduate degree have the lowest fertility at 45.0 births per 1,000 women. Women with the education attainment of college or associate's degree represent 38.7% of all women with births.
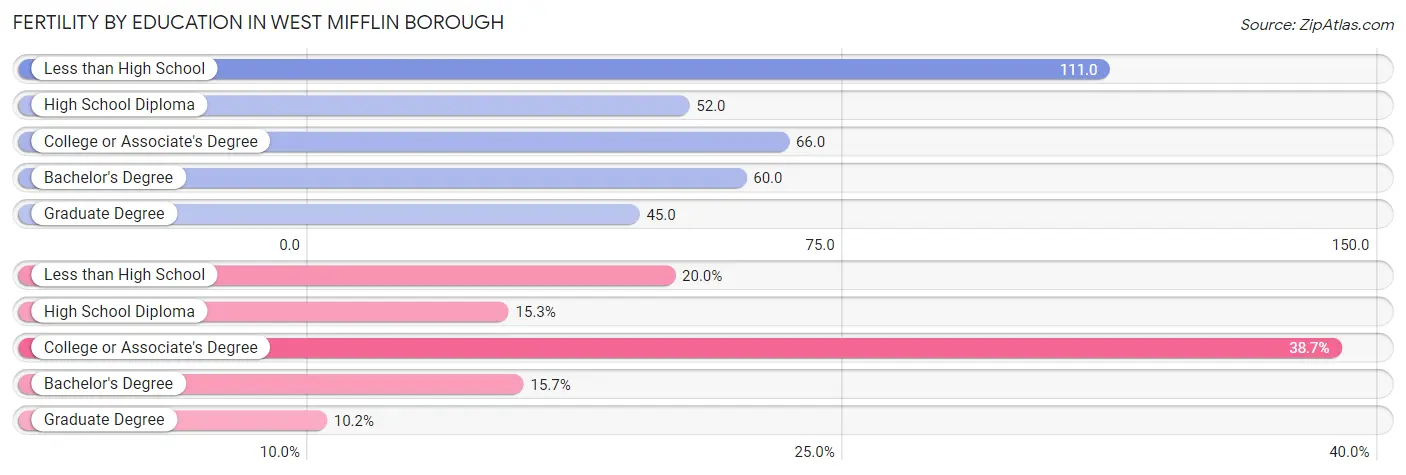
| Educational Attainment | Women with Births | Births / 1,000 Women |
| Less than High School | 47 (20.0%) | 111.0 |
| High School Diploma | 36 (15.3%) | 52.0 |
| College or Associate's Degree | 91 (38.7%) | 66.0 |
| Bachelor's Degree | 37 (15.7%) | 60.0 |
| Graduate Degree | 24 (10.2%) | 45.0 |
| Total | 235 (100.0%) | 65.0 |
Fertility by Education by Marriage Status in West Mifflin borough
60.9% of women with births in West Mifflin borough are unmarried. Women with the educational attainment of graduate degree are most likely to be married with 100.0% of them married at childbirth, while women with the educational attainment of bachelor's degree are least likely to be married with 86.5% of them unmarried at childbirth.
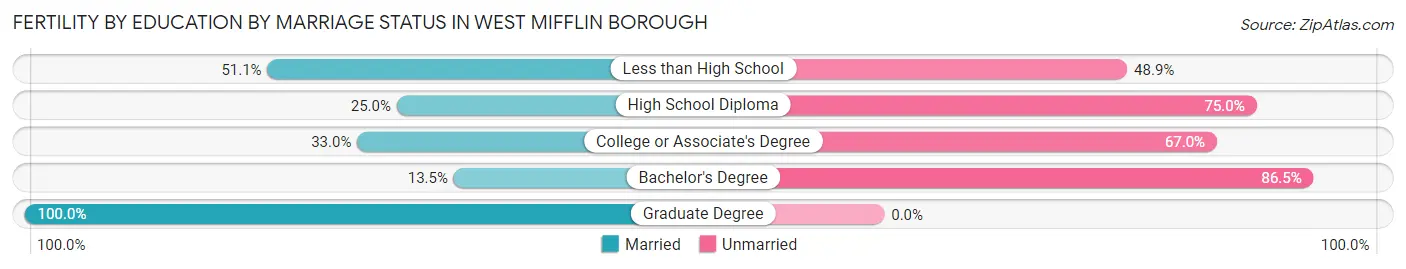
| Educational Attainment | Married | Unmarried |
| Less than High School | 24 (51.1%) | 23 (48.9%) |
| High School Diploma | 9 (25.0%) | 27 (75.0%) |
| College or Associate's Degree | 30 (33.0%) | 61 (67.0%) |
| Bachelor's Degree | 5 (13.5%) | 32 (86.5%) |
| Graduate Degree | 24 (100.0%) | 0 (0.0%) |
| Total | 92 (39.2%) | 143 (60.9%) |
Employment Characteristics in West Mifflin borough
Employment by Class of Employer in West Mifflin borough
Among the 9,211 employed individuals in West Mifflin borough, private company employees (6,260 | 68.0%), not-for-profit organizations (1,545 | 16.8%), and local government employees (508 | 5.5%) make up the most common classes of employment.
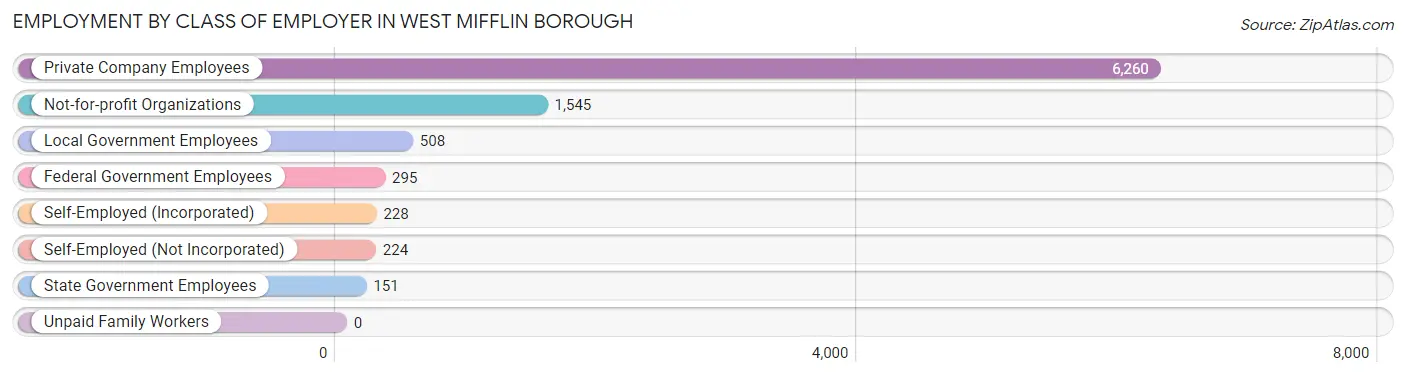
| Employer Class | # Employees | % Employees |
| Private Company Employees | 6,260 | 68.0% |
| Self-Employed (Incorporated) | 228 | 2.5% |
| Self-Employed (Not Incorporated) | 224 | 2.4% |
| Not-for-profit Organizations | 1,545 | 16.8% |
| Local Government Employees | 508 | 5.5% |
| State Government Employees | 151 | 1.6% |
| Federal Government Employees | 295 | 3.2% |
| Unpaid Family Workers | 0 | 0.0% |
| Total | 9,211 | 100.0% |
Employment Status by Age in West Mifflin borough
According to the labor force statistics for West Mifflin borough, out of the total population over 16 years of age (15,860), 64.7% or 10,261 individuals are in the labor force, with 8.9% or 913 of them unemployed. The age group with the highest labor force participation rate is 35 to 44 years, with 90.0% or 1,627 individuals in the labor force. Within the labor force, the 16 to 19 years age range has the highest percentage of unemployed individuals, with 37.6% or 163 of them being unemployed.
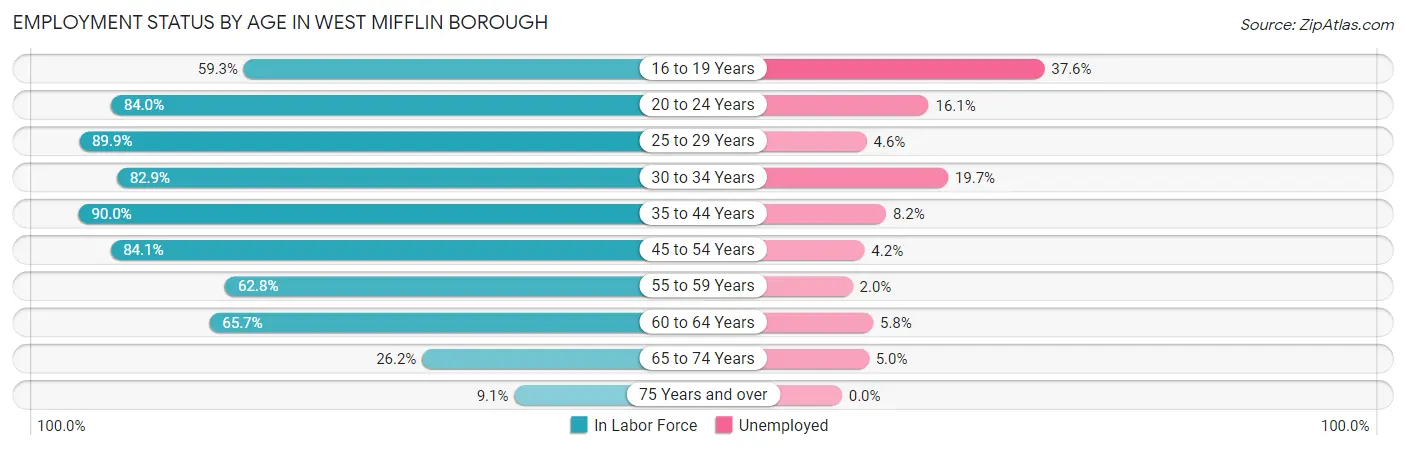
| Age Bracket | In Labor Force | Unemployed |
| 16 to 19 Years | 433 (59.3%) | 163 (37.6%) |
| 20 to 24 Years | 794 (84.0%) | 128 (16.1%) |
| 25 to 29 Years | 1,114 (89.9%) | 51 (4.6%) |
| 30 to 34 Years | 1,100 (82.9%) | 217 (19.7%) |
| 35 to 44 Years | 1,627 (90.0%) | 133 (8.2%) |
| 45 to 54 Years | 2,291 (84.1%) | 96 (4.2%) |
| 55 to 59 Years | 963 (62.8%) | 19 (2.0%) |
| 60 to 64 Years | 1,219 (65.7%) | 71 (5.8%) |
| 65 to 74 Years | 580 (26.2%) | 29 (5.0%) |
| 75 Years and over | 135 (9.1%) | 0 (0.0%) |
| Total | 10,261 (64.7%) | 913 (8.9%) |
Employment Status by Educational Attainment in West Mifflin borough
According to labor force statistics for West Mifflin borough, 79.3% of individuals (8,316) out of the total population between 25 and 64 years of age (10,487) are in the labor force, with 7.1% or 590 of them being unemployed. The group with the highest labor force participation rate are those with the educational attainment of bachelor's degree or higher, with 87.0% or 2,243 individuals in the labor force. Within the labor force, individuals with less than high school education have the highest percentage of unemployment, with 38.7% or 129 of them being unemployed.
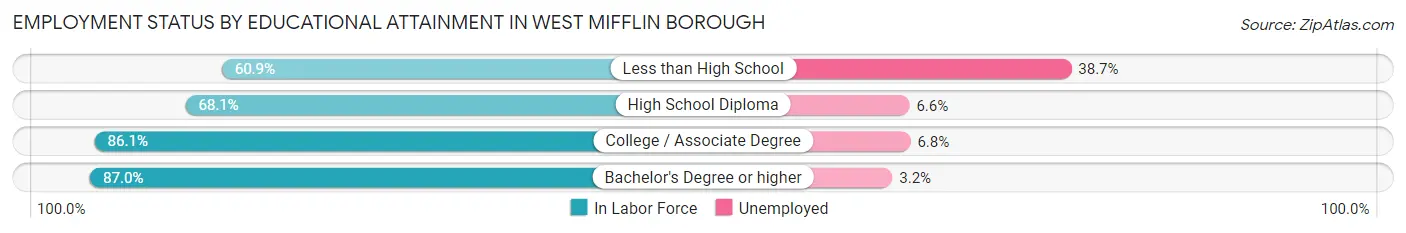
| Educational Attainment | In Labor Force | Unemployed |
| Less than High School | 333 (60.9%) | 212 (38.7%) |
| High School Diploma | 2,281 (68.1%) | 221 (6.6%) |
| College / Associate Degree | 3,454 (86.1%) | 273 (6.8%) |
| Bachelor's Degree or higher | 2,243 (87.0%) | 82 (3.2%) |
| Total | 8,316 (79.3%) | 745 (7.1%) |
Employment Occupations by Sex in West Mifflin borough
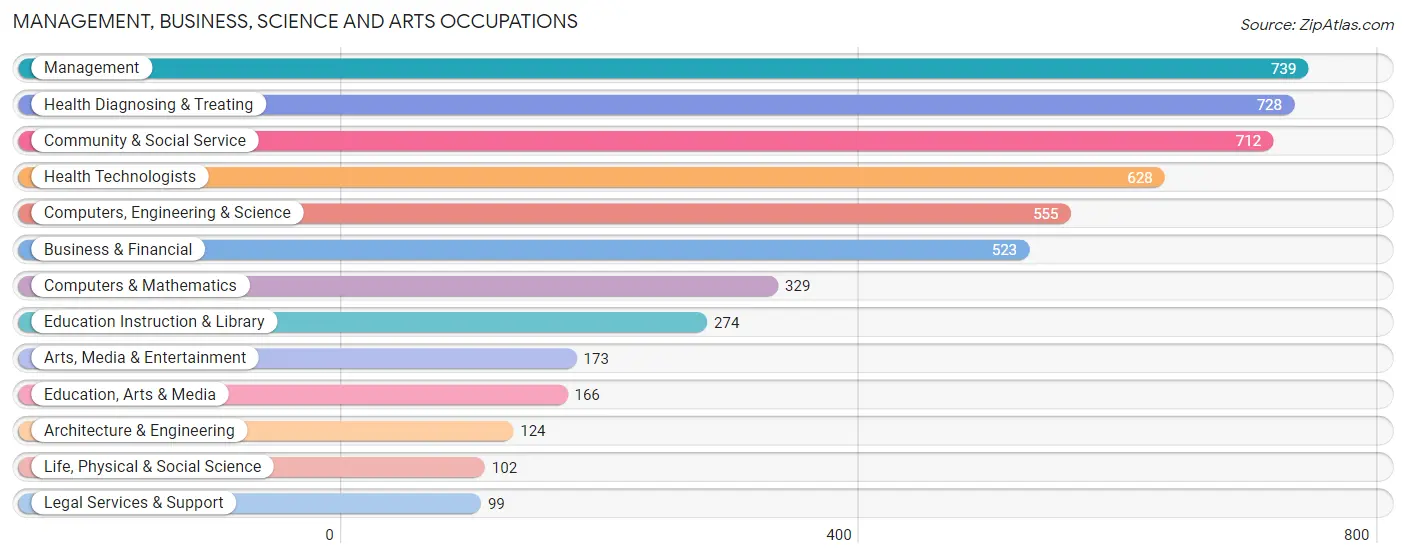
Management, Business, Science and Arts Occupations
The most common Management, Business, Science and Arts occupations in West Mifflin borough are Management (739 | 7.9%), Health Diagnosing & Treating (728 | 7.8%), Community & Social Service (712 | 7.6%), Health Technologists (628 | 6.7%), and Computers, Engineering & Science (555 | 5.9%).
Management, Business, Science and Arts Occupations by Sex
Within the Management, Business, Science and Arts occupations in West Mifflin borough, the most male-oriented occupations are Architecture & Engineering (100.0%), Management (72.7%), and Arts, Media & Entertainment (64.7%), while the most female-oriented occupations are Legal Services & Support (96.0%), Education, Arts & Media (95.8%), and Life, Physical & Social Science (95.1%).
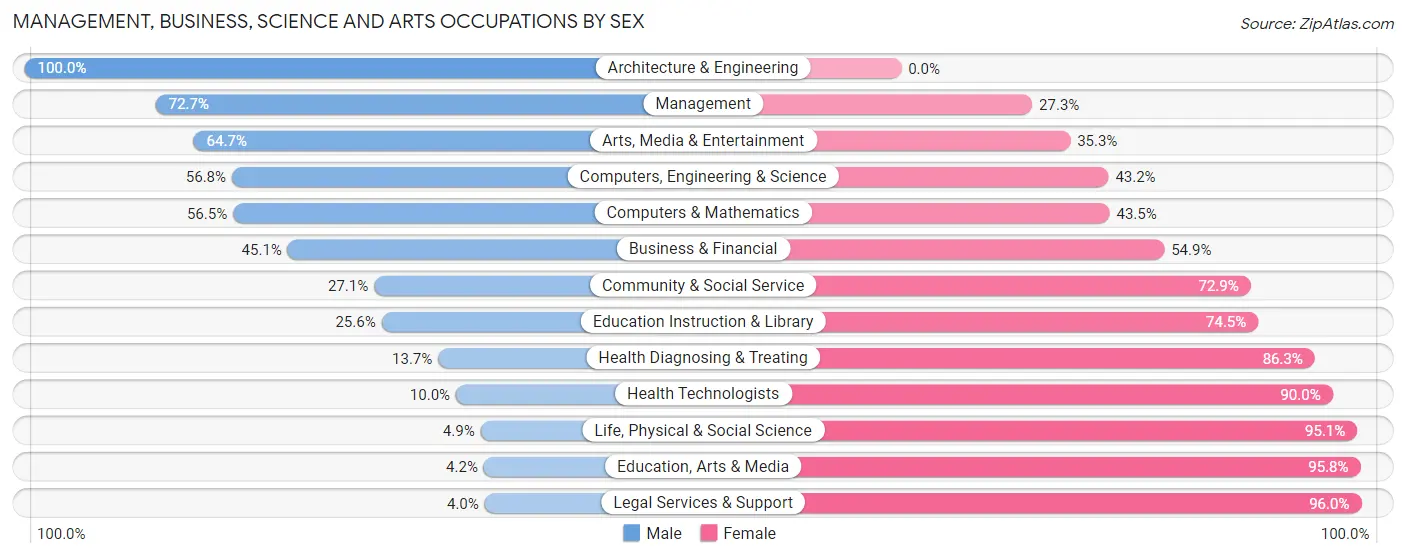
| Occupation | Male | Female |
| Management | 537 (72.7%) | 202 (27.3%) |
| Business & Financial | 236 (45.1%) | 287 (54.9%) |
| Computers, Engineering & Science | 315 (56.8%) | 240 (43.2%) |
| Computers & Mathematics | 186 (56.5%) | 143 (43.5%) |
| Architecture & Engineering | 124 (100.0%) | 0 (0.0%) |
| Life, Physical & Social Science | 5 (4.9%) | 97 (95.1%) |
| Community & Social Service | 193 (27.1%) | 519 (72.9%) |
| Education, Arts & Media | 7 (4.2%) | 159 (95.8%) |
| Legal Services & Support | 4 (4.0%) | 95 (96.0%) |
| Education Instruction & Library | 70 (25.6%) | 204 (74.5%) |
| Arts, Media & Entertainment | 112 (64.7%) | 61 (35.3%) |
| Health Diagnosing & Treating | 100 (13.7%) | 628 (86.3%) |
| Health Technologists | 63 (10.0%) | 565 (90.0%) |
| Total (Category) | 1,381 (42.4%) | 1,876 (57.6%) |
| Total (Overall) | 4,753 (50.8%) | 4,594 (49.1%) |
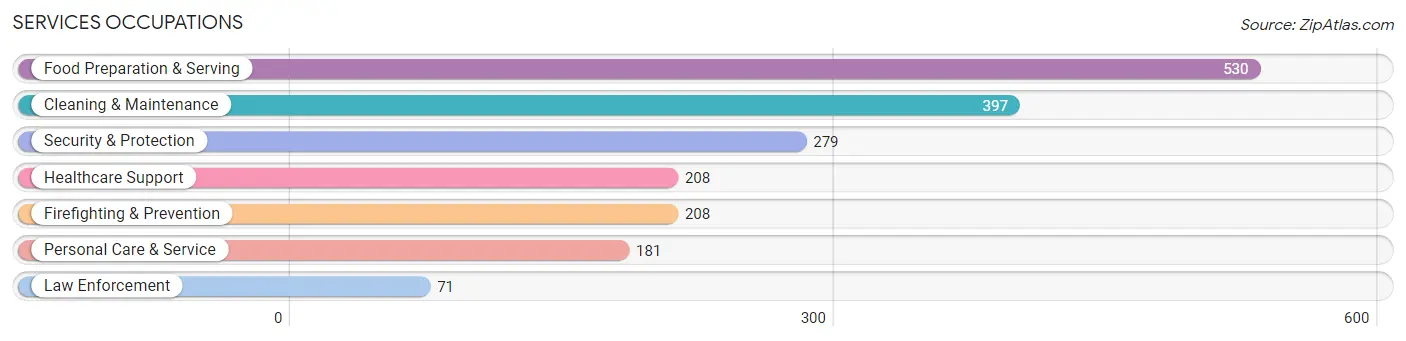
Services Occupations
The most common Services occupations in West Mifflin borough are Food Preparation & Serving (530 | 5.7%), Cleaning & Maintenance (397 | 4.3%), Security & Protection (279 | 3.0%), Healthcare Support (208 | 2.2%), and Firefighting & Prevention (208 | 2.2%).
Services Occupations by Sex
Within the Services occupations in West Mifflin borough, the most male-oriented occupations are Law Enforcement (93.0%), Security & Protection (90.7%), and Firefighting & Prevention (89.9%), while the most female-oriented occupations are Healthcare Support (96.6%), Personal Care & Service (86.2%), and Food Preparation & Serving (62.1%).
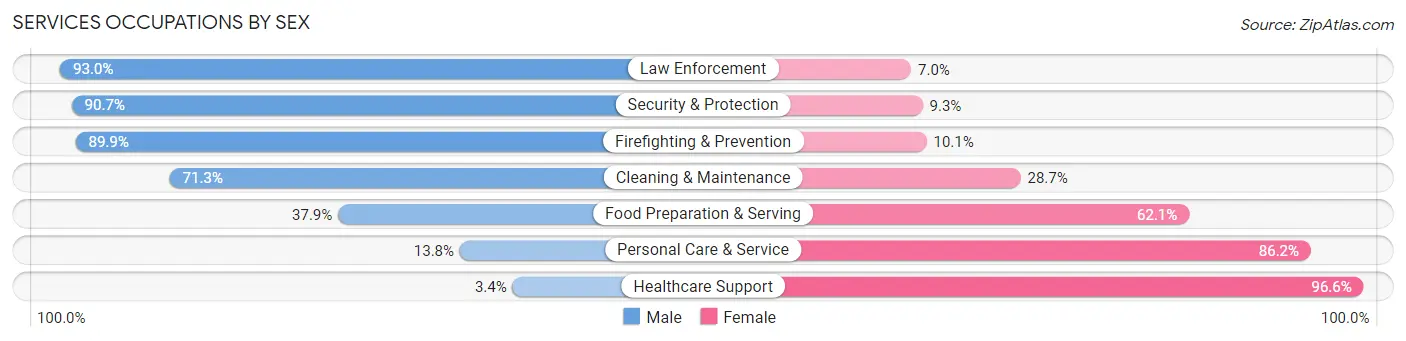
| Occupation | Male | Female |
| Healthcare Support | 7 (3.4%) | 201 (96.6%) |
| Security & Protection | 253 (90.7%) | 26 (9.3%) |
| Firefighting & Prevention | 187 (89.9%) | 21 (10.1%) |
| Law Enforcement | 66 (93.0%) | 5 (7.0%) |
| Food Preparation & Serving | 201 (37.9%) | 329 (62.1%) |
| Cleaning & Maintenance | 283 (71.3%) | 114 (28.7%) |
| Personal Care & Service | 25 (13.8%) | 156 (86.2%) |
| Total (Category) | 769 (48.2%) | 826 (51.8%) |
| Total (Overall) | 4,753 (50.8%) | 4,594 (49.1%) |
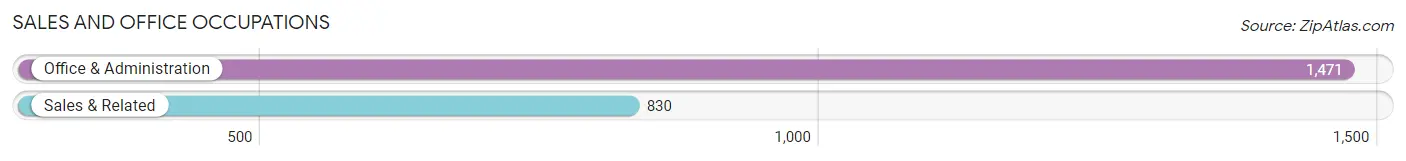
Sales and Office Occupations
The most common Sales and Office occupations in West Mifflin borough are Office & Administration (1,471 | 15.7%), and Sales & Related (830 | 8.9%).
Sales and Office Occupations by Sex
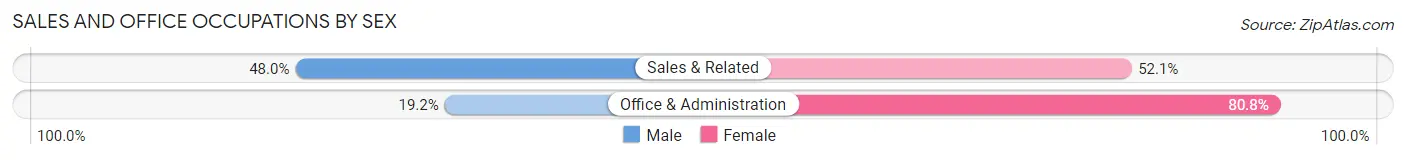
| Occupation | Male | Female |
| Sales & Related | 398 (47.9%) | 432 (52.0%) |
| Office & Administration | 283 (19.2%) | 1,188 (80.8%) |
| Total (Category) | 681 (29.6%) | 1,620 (70.4%) |
| Total (Overall) | 4,753 (50.8%) | 4,594 (49.1%) |
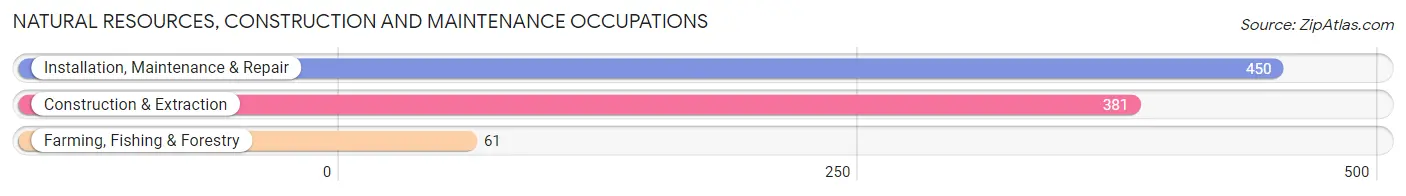
Natural Resources, Construction and Maintenance Occupations
The most common Natural Resources, Construction and Maintenance occupations in West Mifflin borough are Installation, Maintenance & Repair (450 | 4.8%), Construction & Extraction (381 | 4.1%), and Farming, Fishing & Forestry (61 | 0.6%).
Natural Resources, Construction and Maintenance Occupations by Sex
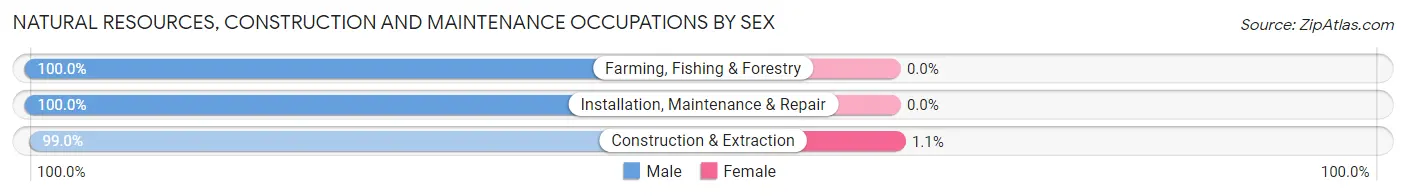
| Occupation | Male | Female |
| Farming, Fishing & Forestry | 61 (100.0%) | 0 (0.0%) |
| Construction & Extraction | 377 (99.0%) | 4 (1.1%) |
| Installation, Maintenance & Repair | 450 (100.0%) | 0 (0.0%) |
| Total (Category) | 888 (99.6%) | 4 (0.4%) |
| Total (Overall) | 4,753 (50.8%) | 4,594 (49.1%) |
Production, Transportation and Moving Occupations
The most common Production, Transportation and Moving occupations in West Mifflin borough are Material Moving (627 | 6.7%), Production (418 | 4.5%), and Transportation (257 | 2.8%).
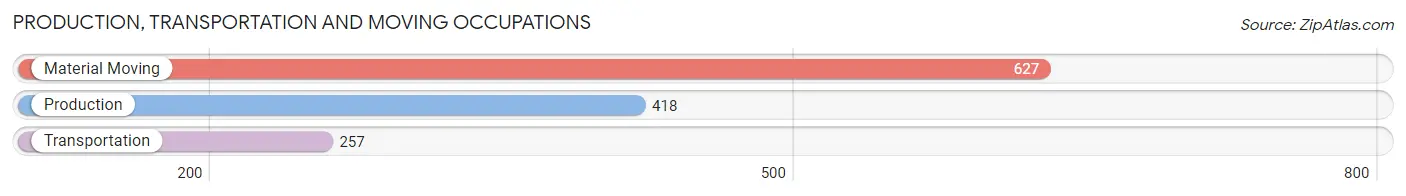
Production, Transportation and Moving Occupations by Sex
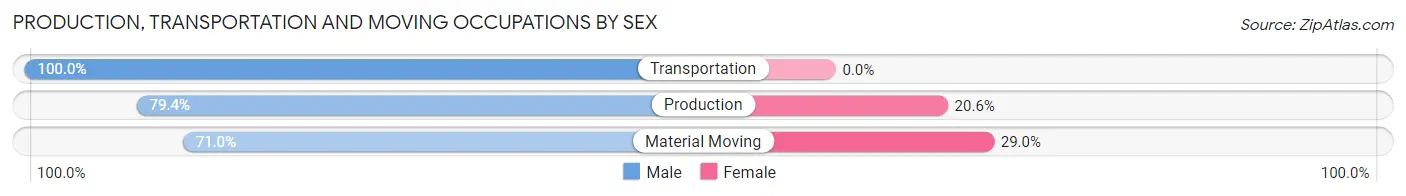
| Occupation | Male | Female |
| Production | 332 (79.4%) | 86 (20.6%) |
| Transportation | 257 (100.0%) | 0 (0.0%) |
| Material Moving | 445 (71.0%) | 182 (29.0%) |
| Total (Category) | 1,034 (79.4%) | 268 (20.6%) |
| Total (Overall) | 4,753 (50.8%) | 4,594 (49.1%) |
Employment Industries by Sex in West Mifflin borough
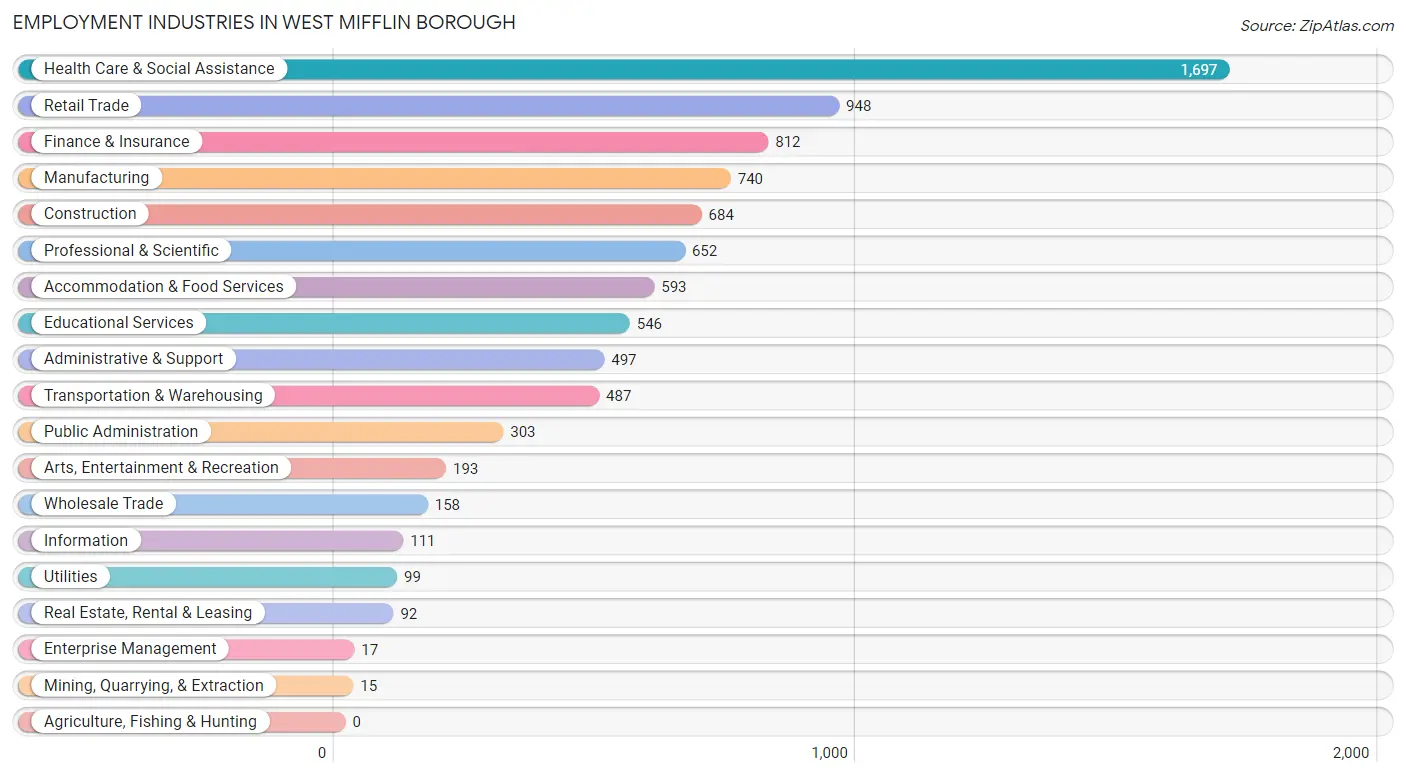
Employment Industries in West Mifflin borough
The major employment industries in West Mifflin borough include Health Care & Social Assistance (1,697 | 18.2%), Retail Trade (948 | 10.1%), Finance & Insurance (812 | 8.7%), Manufacturing (740 | 7.9%), and Construction (684 | 7.3%).
Employment Industries by Sex in West Mifflin borough
The West Mifflin borough industries that see more men than women are Mining, Quarrying, & Extraction (100.0%), Wholesale Trade (100.0%), and Transportation & Warehousing (89.1%), whereas the industries that tend to have a higher number of women are Health Care & Social Assistance (80.5%), Finance & Insurance (69.2%), and Arts, Entertainment & Recreation (68.9%).
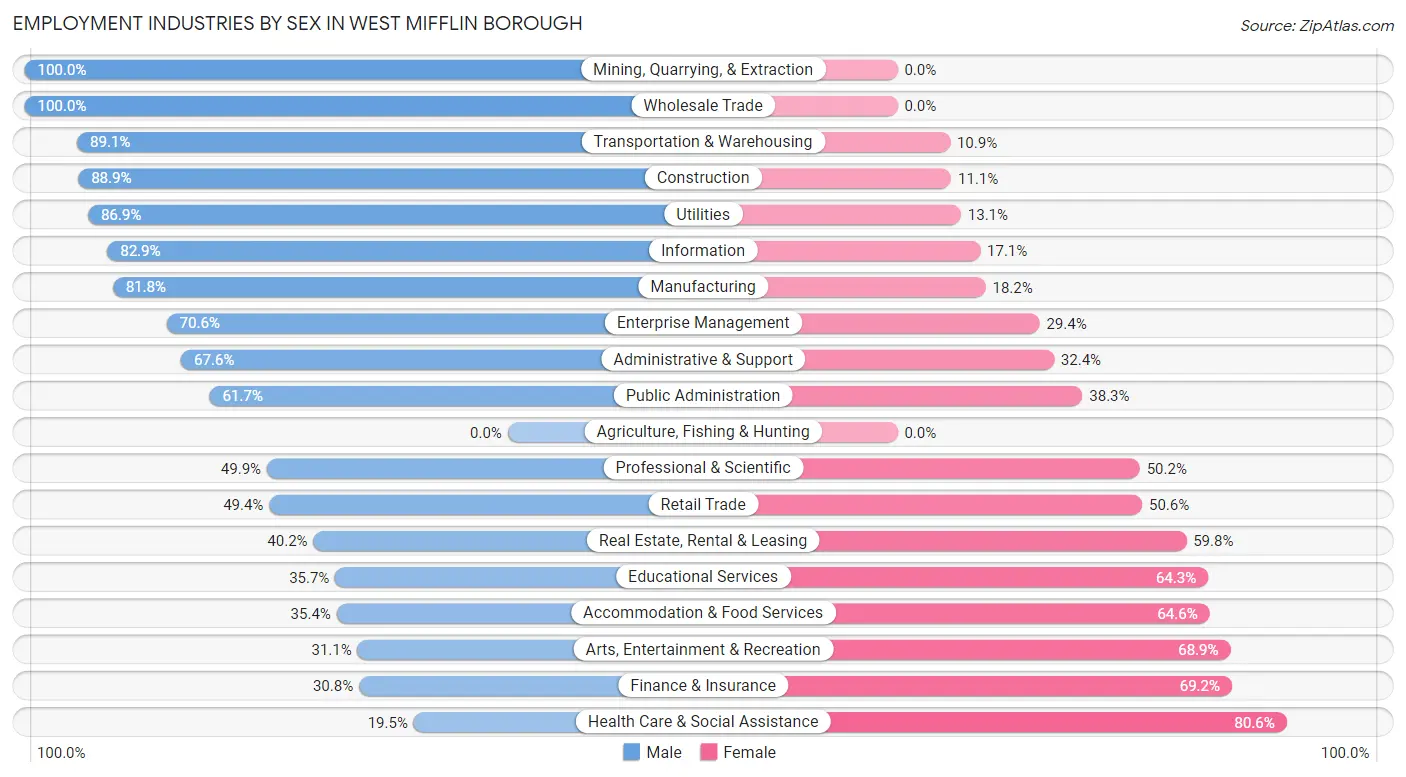
| Industry | Male | Female |
| Agriculture, Fishing & Hunting | 0 (0.0%) | 0 (0.0%) |
| Mining, Quarrying, & Extraction | 15 (100.0%) | 0 (0.0%) |
| Construction | 608 (88.9%) | 76 (11.1%) |
| Manufacturing | 605 (81.8%) | 135 (18.2%) |
| Wholesale Trade | 158 (100.0%) | 0 (0.0%) |
| Retail Trade | 468 (49.4%) | 480 (50.6%) |
| Transportation & Warehousing | 434 (89.1%) | 53 (10.9%) |
| Utilities | 86 (86.9%) | 13 (13.1%) |
| Information | 92 (82.9%) | 19 (17.1%) |
| Finance & Insurance | 250 (30.8%) | 562 (69.2%) |
| Real Estate, Rental & Leasing | 37 (40.2%) | 55 (59.8%) |
| Professional & Scientific | 325 (49.8%) | 327 (50.1%) |
| Enterprise Management | 12 (70.6%) | 5 (29.4%) |
| Administrative & Support | 336 (67.6%) | 161 (32.4%) |
| Educational Services | 195 (35.7%) | 351 (64.3%) |
| Health Care & Social Assistance | 330 (19.5%) | 1,367 (80.5%) |
| Arts, Entertainment & Recreation | 60 (31.1%) | 133 (68.9%) |
| Accommodation & Food Services | 210 (35.4%) | 383 (64.6%) |
| Public Administration | 187 (61.7%) | 116 (38.3%) |
| Total | 4,753 (50.8%) | 4,594 (49.1%) |
Education in West Mifflin borough
School Enrollment in West Mifflin borough
The most common levels of schooling among the 4,098 students in West Mifflin borough are middle school (1,087 | 26.5%), high school (938 | 22.9%), and elementary school (926 | 22.6%).
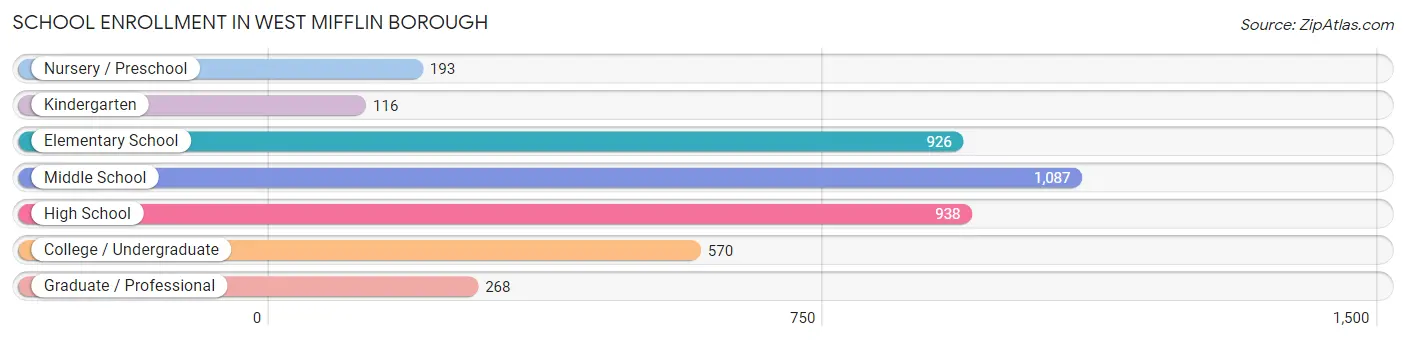
| School Level | # Students | % Students |
| Nursery / Preschool | 193 | 4.7% |
| Kindergarten | 116 | 2.8% |
| Elementary School | 926 | 22.6% |
| Middle School | 1,087 | 26.5% |
| High School | 938 | 22.9% |
| College / Undergraduate | 570 | 13.9% |
| Graduate / Professional | 268 | 6.5% |
| Total | 4,098 | 100.0% |
School Enrollment by Age by Funding Source in West Mifflin borough
Out of a total of 4,098 students who are enrolled in schools in West Mifflin borough, 697 (17.0%) attend a private institution, while the remaining 3,401 (83.0%) are enrolled in public schools. The age group of 3 to 4 year olds has the highest likelihood of being enrolled in private schools, with 121 (72.0% in the age bracket) enrolled. Conversely, the age group of 10 to 14 year olds has the lowest likelihood of being enrolled in a private school, with 1,364 (95.0% in the age bracket) attending a public institution.
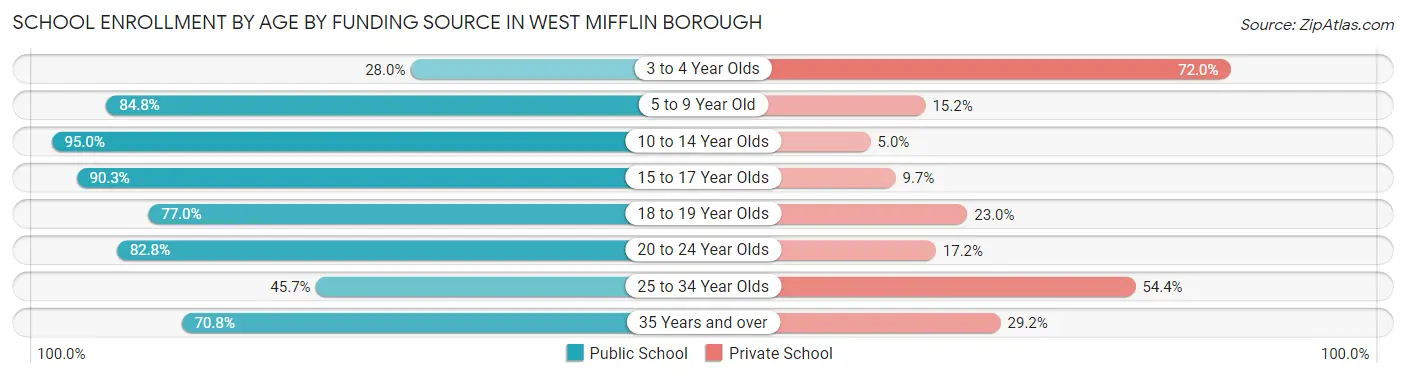
| Age Bracket | Public School | Private School |
| 3 to 4 Year Olds | 47 (28.0%) | 121 (72.0%) |
| 5 to 9 Year Old | 745 (84.8%) | 134 (15.2%) |
| 10 to 14 Year Olds | 1,364 (95.0%) | 72 (5.0%) |
| 15 to 17 Year Olds | 561 (90.3%) | 60 (9.7%) |
| 18 to 19 Year Olds | 147 (77.0%) | 44 (23.0%) |
| 20 to 24 Year Olds | 275 (82.8%) | 57 (17.2%) |
| 25 to 34 Year Olds | 126 (45.7%) | 150 (54.3%) |
| 35 Years and over | 138 (70.8%) | 57 (29.2%) |
| Total | 3,401 (83.0%) | 697 (17.0%) |
Educational Attainment by Field of Study in West Mifflin borough
Business (687 | 20.1%), science & technology (603 | 17.6%), education (376 | 11.0%), arts & humanities (264 | 7.7%), and psychology (235 | 6.9%) are the most common fields of study among 3,425 individuals in West Mifflin borough who have obtained a bachelor's degree or higher.
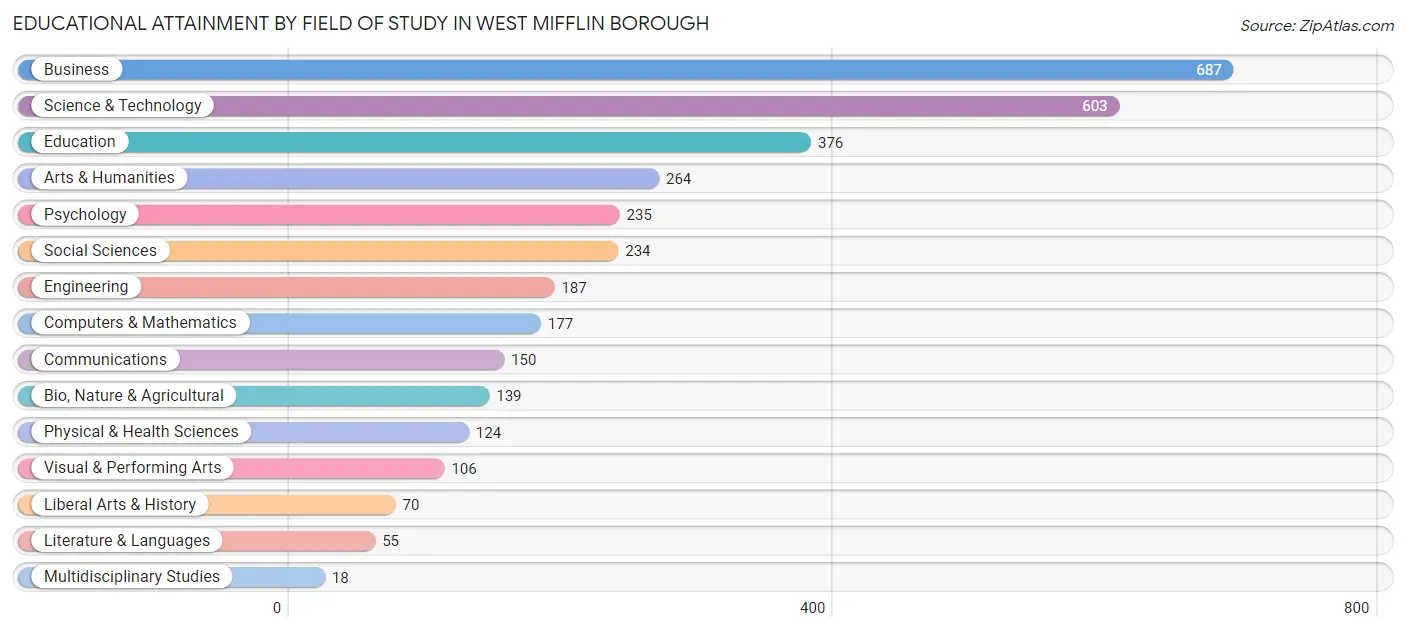
| Field of Study | # Graduates | % Graduates |
| Computers & Mathematics | 177 | 5.2% |
| Bio, Nature & Agricultural | 139 | 4.1% |
| Physical & Health Sciences | 124 | 3.6% |
| Psychology | 235 | 6.9% |
| Social Sciences | 234 | 6.8% |
| Engineering | 187 | 5.5% |
| Multidisciplinary Studies | 18 | 0.5% |
| Science & Technology | 603 | 17.6% |
| Business | 687 | 20.1% |
| Education | 376 | 11.0% |
| Literature & Languages | 55 | 1.6% |
| Liberal Arts & History | 70 | 2.0% |
| Visual & Performing Arts | 106 | 3.1% |
| Communications | 150 | 4.4% |
| Arts & Humanities | 264 | 7.7% |
| Total | 3,425 | 100.0% |
Transportation & Commute in West Mifflin borough
Vehicle Availability by Sex in West Mifflin borough
The most prevalent vehicle ownership categories in West Mifflin borough are males with 2 vehicles (2,131, accounting for 45.2%) and females with 2 vehicles (1,971, making up 47.5%).
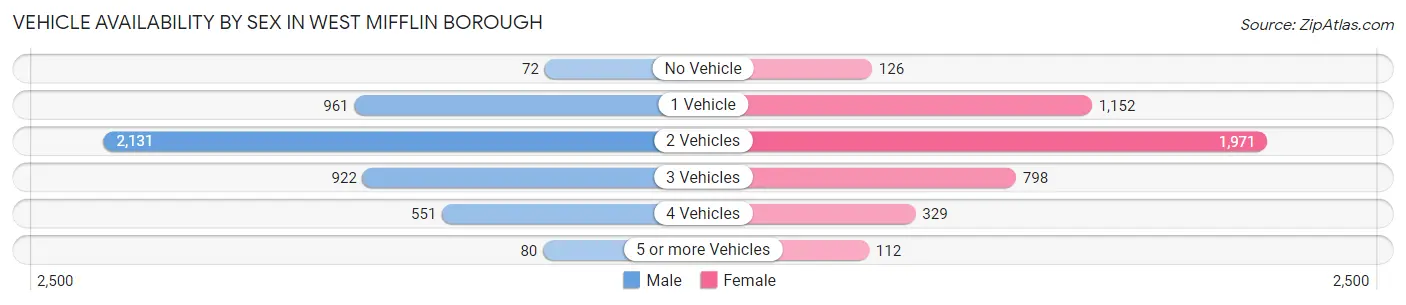
| Vehicles Available | Male | Female |
| No Vehicle | 72 (1.5%) | 126 (2.8%) |
| 1 Vehicle | 961 (20.4%) | 1,152 (25.7%) |
| 2 Vehicles | 2,131 (45.2%) | 1,971 (43.9%) |
| 3 Vehicles | 922 (19.6%) | 798 (17.8%) |
| 4 Vehicles | 551 (11.7%) | 329 (7.3%) |
| 5 or more Vehicles | 80 (1.7%) | 112 (2.5%) |
| Total | 4,717 (100.0%) | 4,488 (100.0%) |
Commute Time in West Mifflin borough
The most frequently occuring commute durations in West Mifflin borough are 30 to 34 minutes (1,456 commuters, 17.2%), 10 to 14 minutes (1,167 commuters, 13.8%), and 15 to 19 minutes (1,133 commuters, 13.4%).
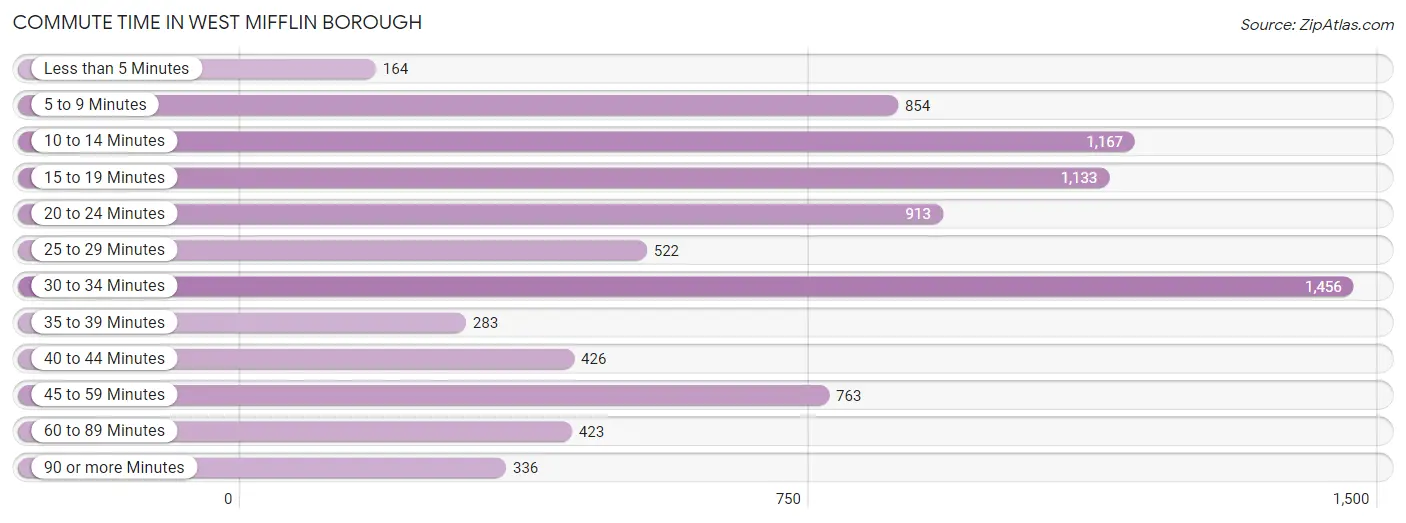
| Commute Time | # Commuters | % Commuters |
| Less than 5 Minutes | 164 | 1.9% |
| 5 to 9 Minutes | 854 | 10.1% |
| 10 to 14 Minutes | 1,167 | 13.8% |
| 15 to 19 Minutes | 1,133 | 13.4% |
| 20 to 24 Minutes | 913 | 10.8% |
| 25 to 29 Minutes | 522 | 6.2% |
| 30 to 34 Minutes | 1,456 | 17.2% |
| 35 to 39 Minutes | 283 | 3.4% |
| 40 to 44 Minutes | 426 | 5.1% |
| 45 to 59 Minutes | 763 | 9.0% |
| 60 to 89 Minutes | 423 | 5.0% |
| 90 or more Minutes | 336 | 4.0% |
Commute Time by Sex in West Mifflin borough
The most common commute times in West Mifflin borough are 30 to 34 minutes (865 commuters, 19.4%) for males and 30 to 34 minutes (591 commuters, 14.8%) for females.
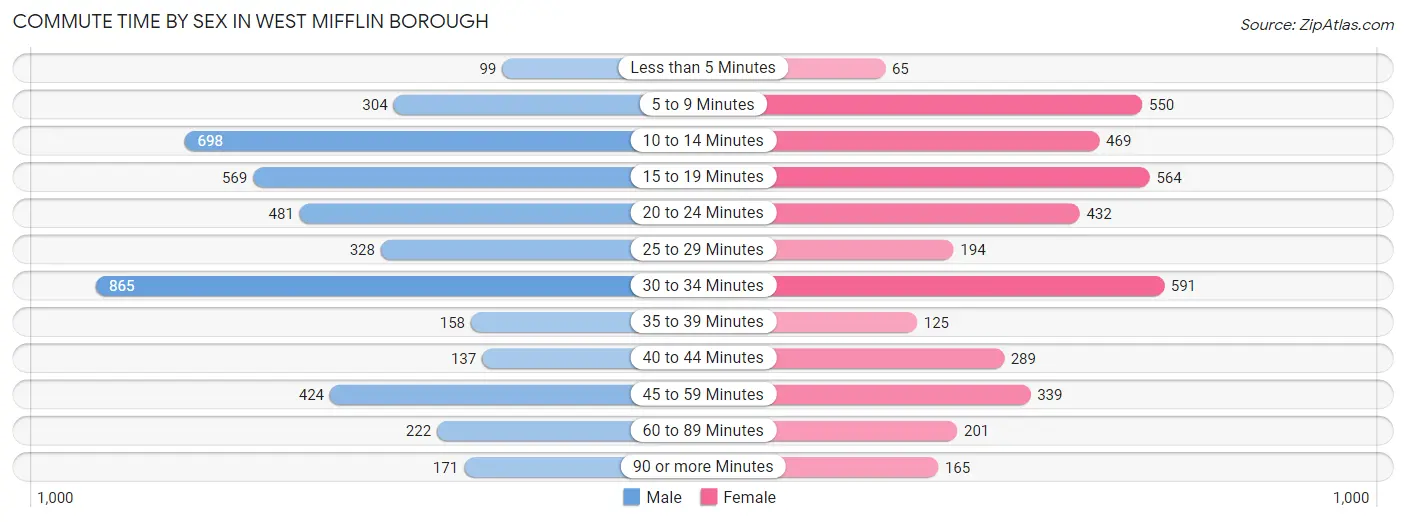
| Commute Time | Male | Female |
| Less than 5 Minutes | 99 (2.2%) | 65 (1.6%) |
| 5 to 9 Minutes | 304 (6.8%) | 550 (13.8%) |
| 10 to 14 Minutes | 698 (15.7%) | 469 (11.8%) |
| 15 to 19 Minutes | 569 (12.8%) | 564 (14.2%) |
| 20 to 24 Minutes | 481 (10.8%) | 432 (10.8%) |
| 25 to 29 Minutes | 328 (7.4%) | 194 (4.9%) |
| 30 to 34 Minutes | 865 (19.4%) | 591 (14.8%) |
| 35 to 39 Minutes | 158 (3.5%) | 125 (3.1%) |
| 40 to 44 Minutes | 137 (3.1%) | 289 (7.2%) |
| 45 to 59 Minutes | 424 (9.5%) | 339 (8.5%) |
| 60 to 89 Minutes | 222 (5.0%) | 201 (5.1%) |
| 90 or more Minutes | 171 (3.8%) | 165 (4.1%) |
Time of Departure to Work by Sex in West Mifflin borough
The most frequent times of departure to work in West Mifflin borough are 7:00 AM to 7:29 AM (763, 17.1%) for males and 6:30 AM to 6:59 AM (635, 15.9%) for females.
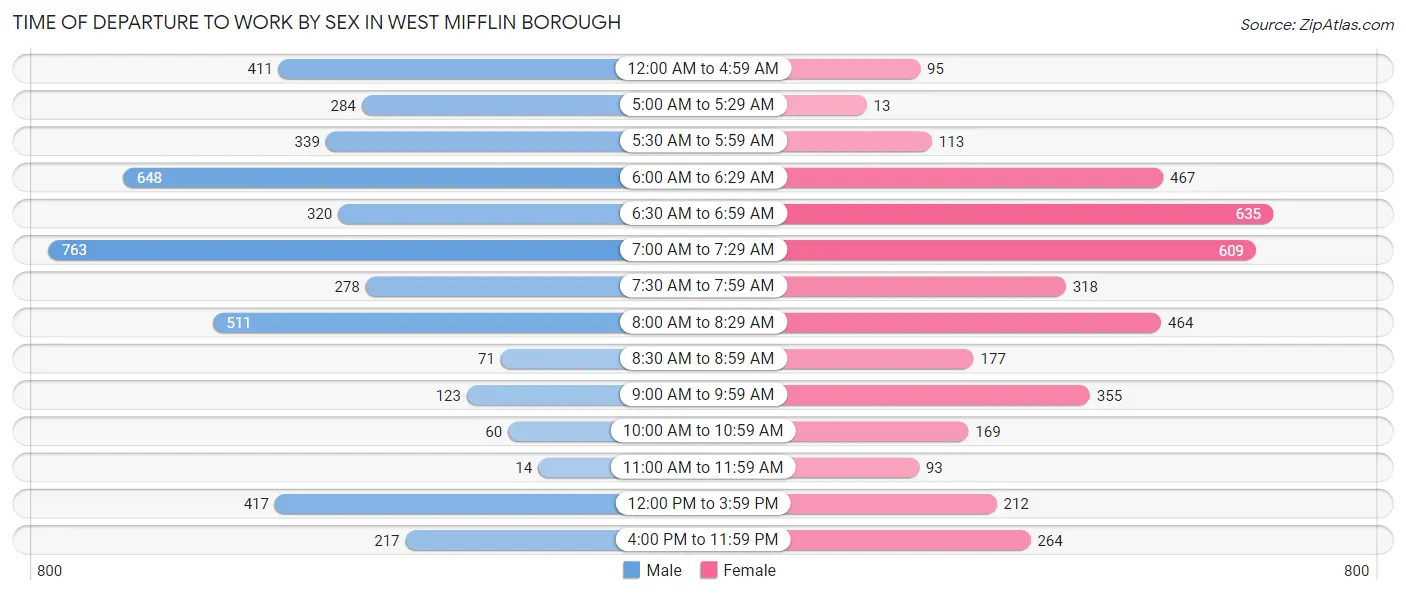
| Time of Departure | Male | Female |
| 12:00 AM to 4:59 AM | 411 (9.2%) | 95 (2.4%) |
| 5:00 AM to 5:29 AM | 284 (6.4%) | 13 (0.3%) |
| 5:30 AM to 5:59 AM | 339 (7.6%) | 113 (2.8%) |
| 6:00 AM to 6:29 AM | 648 (14.5%) | 467 (11.7%) |
| 6:30 AM to 6:59 AM | 320 (7.2%) | 635 (15.9%) |
| 7:00 AM to 7:29 AM | 763 (17.1%) | 609 (15.3%) |
| 7:30 AM to 7:59 AM | 278 (6.2%) | 318 (8.0%) |
| 8:00 AM to 8:29 AM | 511 (11.5%) | 464 (11.7%) |
| 8:30 AM to 8:59 AM | 71 (1.6%) | 177 (4.4%) |
| 9:00 AM to 9:59 AM | 123 (2.8%) | 355 (8.9%) |
| 10:00 AM to 10:59 AM | 60 (1.3%) | 169 (4.2%) |
| 11:00 AM to 11:59 AM | 14 (0.3%) | 93 (2.3%) |
| 12:00 PM to 3:59 PM | 417 (9.4%) | 212 (5.3%) |
| 4:00 PM to 11:59 PM | 217 (4.9%) | 264 (6.6%) |
| Total | 4,456 (100.0%) | 3,984 (100.0%) |
Housing Occupancy in West Mifflin borough
Occupancy by Ownership in West Mifflin borough
Of the total 8,300 dwellings in West Mifflin borough, owner-occupied units account for 6,626 (79.8%), while renter-occupied units make up 1,674 (20.2%).
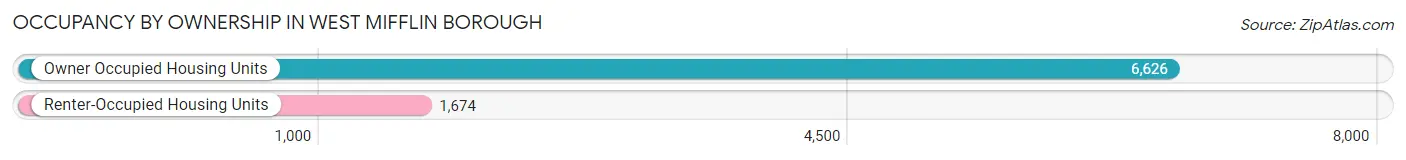
| Occupancy | # Housing Units | % Housing Units |
| Owner Occupied Housing Units | 6,626 | 79.8% |
| Renter-Occupied Housing Units | 1,674 | 20.2% |
| Total Occupied Housing Units | 8,300 | 100.0% |
Occupancy by Household Size in West Mifflin borough
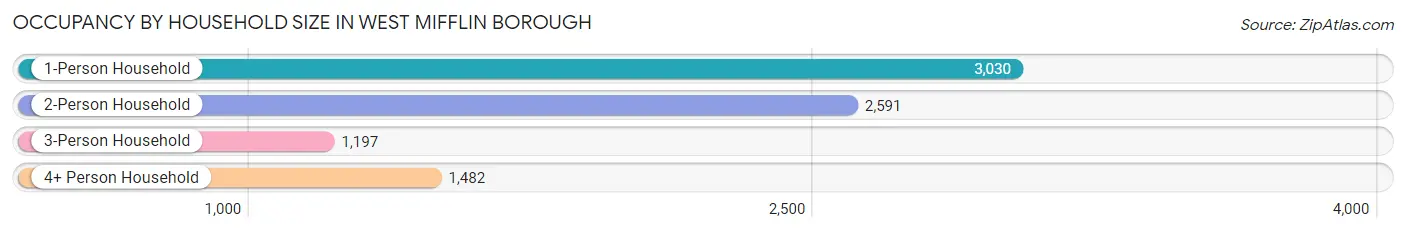
| Household Size | # Housing Units | % Housing Units |
| 1-Person Household | 3,030 | 36.5% |
| 2-Person Household | 2,591 | 31.2% |
| 3-Person Household | 1,197 | 14.4% |
| 4+ Person Household | 1,482 | 17.9% |
| Total Housing Units | 8,300 | 100.0% |
Occupancy by Ownership by Household Size in West Mifflin borough
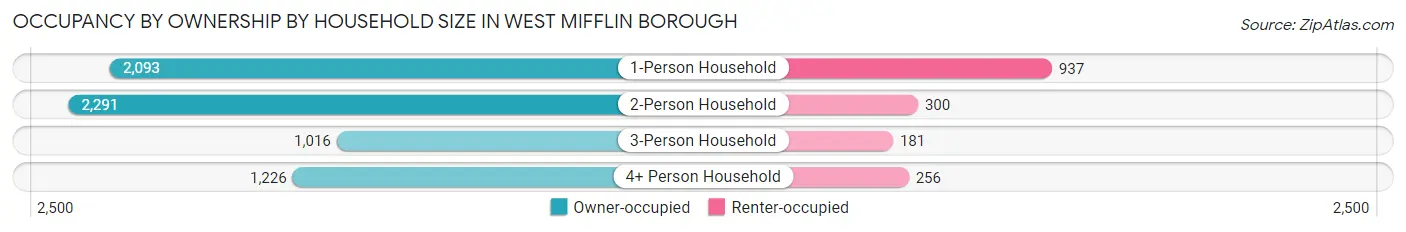
| Household Size | Owner-occupied | Renter-occupied |
| 1-Person Household | 2,093 (69.1%) | 937 (30.9%) |
| 2-Person Household | 2,291 (88.4%) | 300 (11.6%) |
| 3-Person Household | 1,016 (84.9%) | 181 (15.1%) |
| 4+ Person Household | 1,226 (82.7%) | 256 (17.3%) |
| Total Housing Units | 6,626 (79.8%) | 1,674 (20.2%) |
Occupancy by Educational Attainment in West Mifflin borough
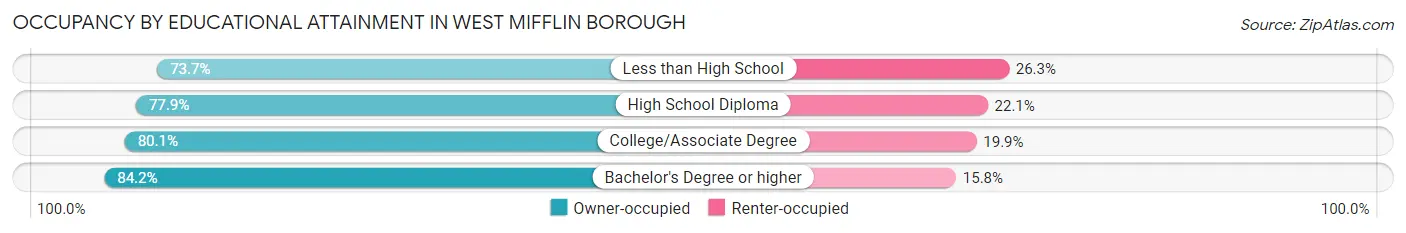
| Household Size | Owner-occupied | Renter-occupied |
| Less than High School | 339 (73.7%) | 121 (26.3%) |
| High School Diploma | 2,197 (77.9%) | 623 (22.1%) |
| College/Associate Degree | 2,699 (80.1%) | 669 (19.9%) |
| Bachelor's Degree or higher | 1,391 (84.2%) | 261 (15.8%) |
Occupancy by Age of Householder in West Mifflin borough
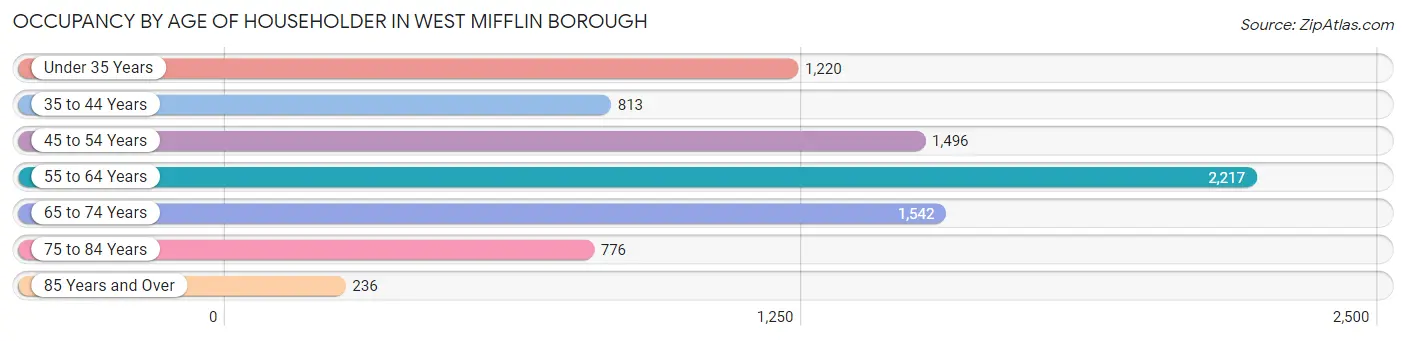
| Age Bracket | # Households | % Households |
| Under 35 Years | 1,220 | 14.7% |
| 35 to 44 Years | 813 | 9.8% |
| 45 to 54 Years | 1,496 | 18.0% |
| 55 to 64 Years | 2,217 | 26.7% |
| 65 to 74 Years | 1,542 | 18.6% |
| 75 to 84 Years | 776 | 9.3% |
| 85 Years and Over | 236 | 2.8% |
| Total | 8,300 | 100.0% |
Housing Finances in West Mifflin borough
Median Income by Occupancy in West Mifflin borough
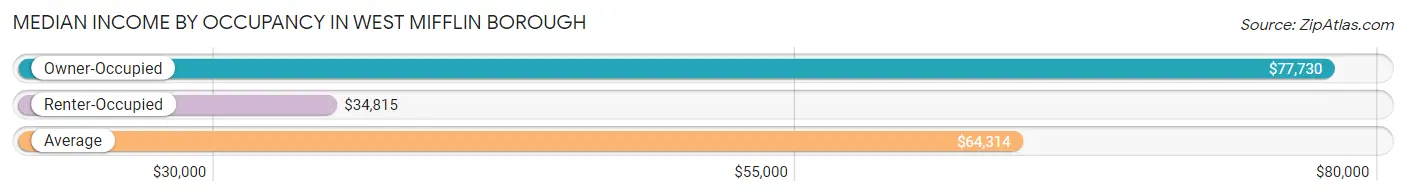
| Occupancy Type | # Households | Median Income |
| Owner-Occupied | 6,626 (79.8%) | $77,730 |
| Renter-Occupied | 1,674 (20.2%) | $34,815 |
| Average | 8,300 (100.0%) | $64,314 |
Occupancy by Householder Income Bracket in West Mifflin borough
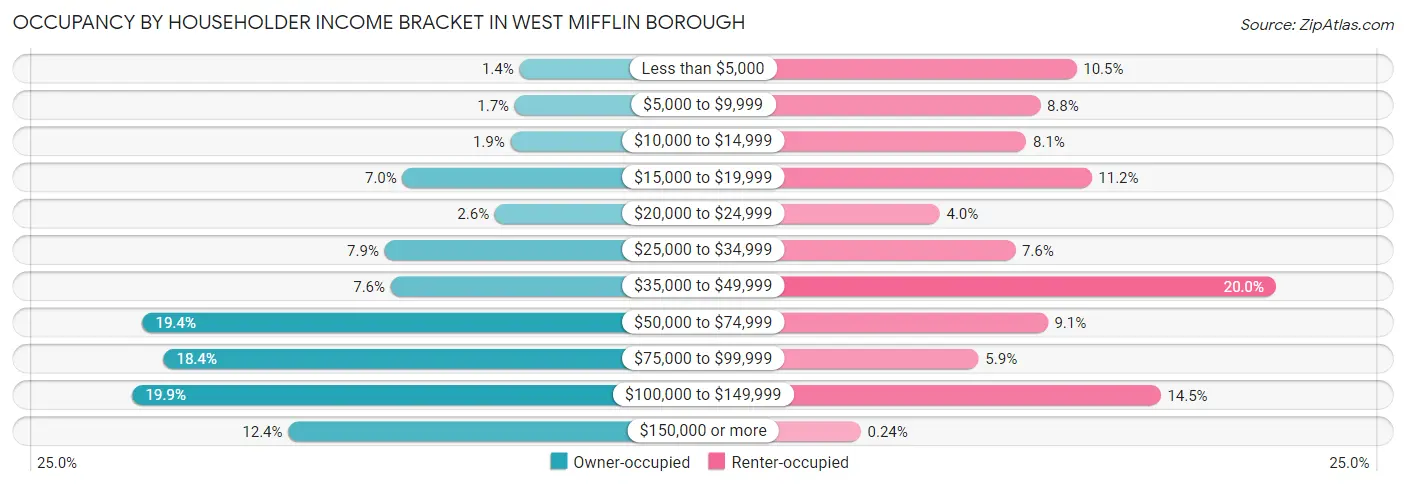
| Income Bracket | Owner-occupied | Renter-occupied |
| Less than $5,000 | 95 (1.4%) | 176 (10.5%) |
| $5,000 to $9,999 | 109 (1.7%) | 147 (8.8%) |
| $10,000 to $14,999 | 123 (1.9%) | 136 (8.1%) |
| $15,000 to $19,999 | 464 (7.0%) | 188 (11.2%) |
| $20,000 to $24,999 | 172 (2.6%) | 67 (4.0%) |
| $25,000 to $34,999 | 520 (7.9%) | 127 (7.6%) |
| $35,000 to $49,999 | 501 (7.6%) | 335 (20.0%) |
| $50,000 to $74,999 | 1,284 (19.4%) | 153 (9.1%) |
| $75,000 to $99,999 | 1,218 (18.4%) | 98 (5.9%) |
| $100,000 to $149,999 | 1,316 (19.9%) | 243 (14.5%) |
| $150,000 or more | 824 (12.4%) | 4 (0.2%) |
| Total | 6,626 (100.0%) | 1,674 (100.0%) |
Monthly Housing Cost Tiers in West Mifflin borough
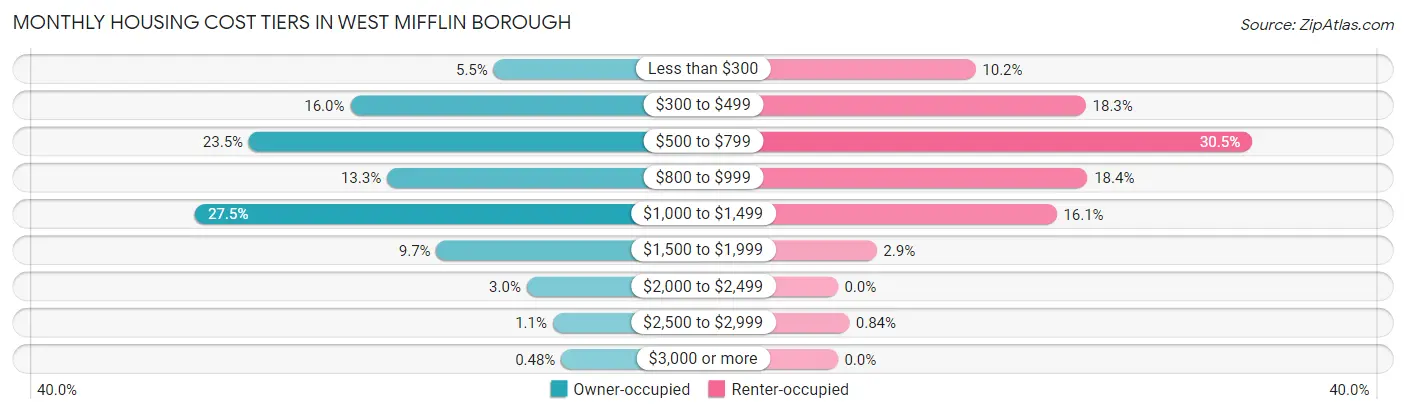
| Monthly Cost | Owner-occupied | Renter-occupied |
| Less than $300 | 362 (5.5%) | 170 (10.2%) |
| $300 to $499 | 1,061 (16.0%) | 306 (18.3%) |
| $500 to $799 | 1,556 (23.5%) | 511 (30.5%) |
| $800 to $999 | 882 (13.3%) | 308 (18.4%) |
| $1,000 to $1,499 | 1,819 (27.5%) | 270 (16.1%) |
| $1,500 to $1,999 | 641 (9.7%) | 48 (2.9%) |
| $2,000 to $2,499 | 200 (3.0%) | 0 (0.0%) |
| $2,500 to $2,999 | 73 (1.1%) | 14 (0.8%) |
| $3,000 or more | 32 (0.5%) | 0 (0.0%) |
| Total | 6,626 (100.0%) | 1,674 (100.0%) |
Physical Housing Characteristics in West Mifflin borough
Housing Structures in West Mifflin borough
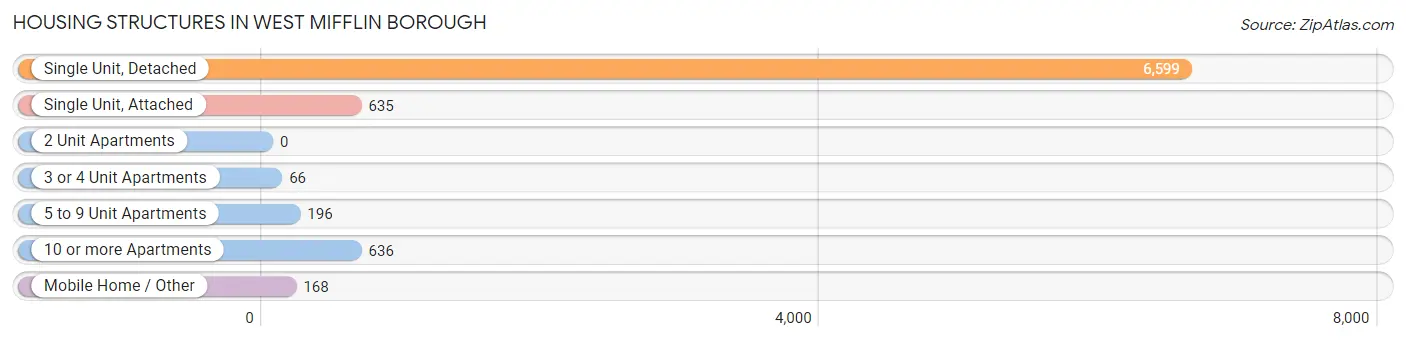
| Structure Type | # Housing Units | % Housing Units |
| Single Unit, Detached | 6,599 | 79.5% |
| Single Unit, Attached | 635 | 7.6% |
| 2 Unit Apartments | 0 | 0.0% |
| 3 or 4 Unit Apartments | 66 | 0.8% |
| 5 to 9 Unit Apartments | 196 | 2.4% |
| 10 or more Apartments | 636 | 7.7% |
| Mobile Home / Other | 168 | 2.0% |
| Total | 8,300 | 100.0% |
Housing Structures by Occupancy in West Mifflin borough
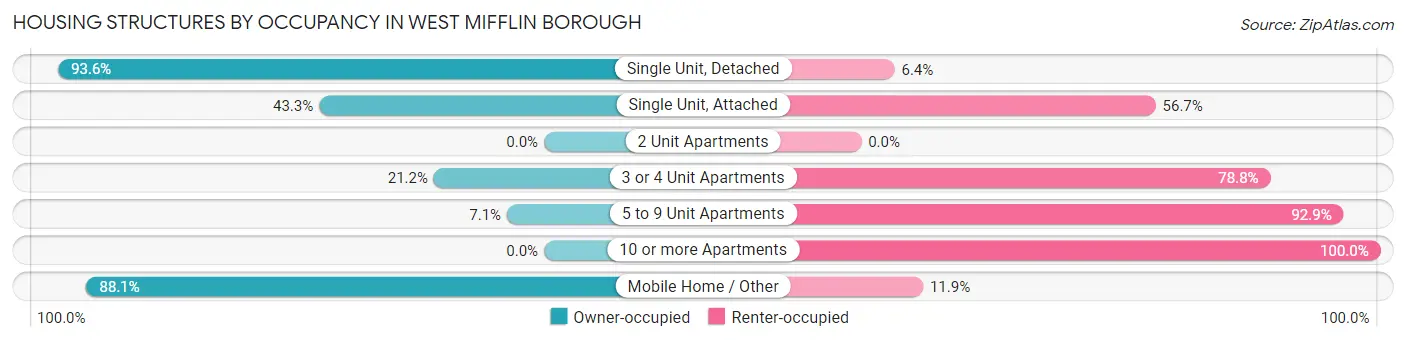
| Structure Type | Owner-occupied | Renter-occupied |
| Single Unit, Detached | 6,175 (93.6%) | 424 (6.4%) |
| Single Unit, Attached | 275 (43.3%) | 360 (56.7%) |
| 2 Unit Apartments | 0 (0.0%) | 0 (0.0%) |
| 3 or 4 Unit Apartments | 14 (21.2%) | 52 (78.8%) |
| 5 to 9 Unit Apartments | 14 (7.1%) | 182 (92.9%) |
| 10 or more Apartments | 0 (0.0%) | 636 (100.0%) |
| Mobile Home / Other | 148 (88.1%) | 20 (11.9%) |
| Total | 6,626 (79.8%) | 1,674 (20.2%) |
Housing Structures by Number of Rooms in West Mifflin borough
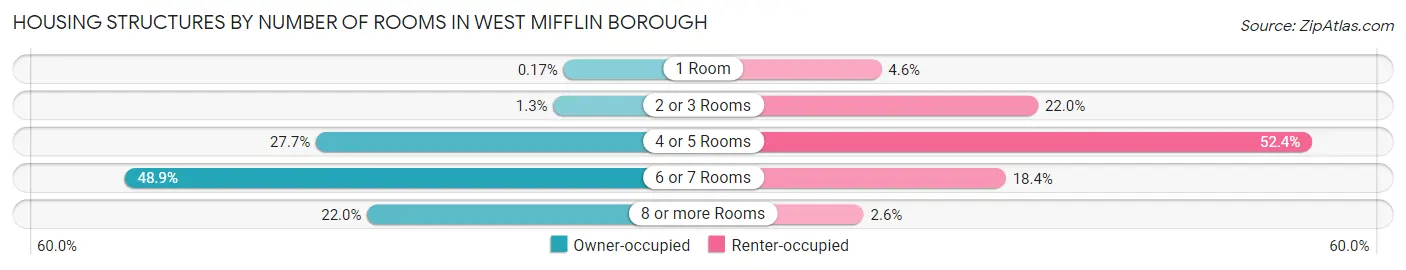
| Number of Rooms | Owner-occupied | Renter-occupied |
| 1 Room | 11 (0.2%) | 77 (4.6%) |
| 2 or 3 Rooms | 87 (1.3%) | 368 (22.0%) |
| 4 or 5 Rooms | 1,832 (27.7%) | 877 (52.4%) |
| 6 or 7 Rooms | 3,240 (48.9%) | 308 (18.4%) |
| 8 or more Rooms | 1,456 (22.0%) | 44 (2.6%) |
| Total | 6,626 (100.0%) | 1,674 (100.0%) |
Housing Structure by Heating Type in West Mifflin borough
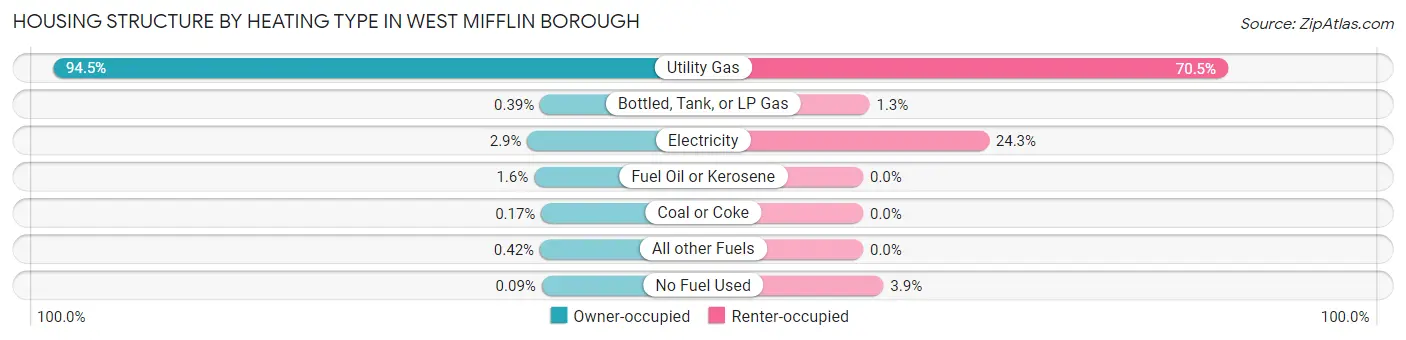
| Heating Type | Owner-occupied | Renter-occupied |
| Utility Gas | 6,263 (94.5%) | 1,180 (70.5%) |
| Bottled, Tank, or LP Gas | 26 (0.4%) | 21 (1.3%) |
| Electricity | 189 (2.9%) | 407 (24.3%) |
| Fuel Oil or Kerosene | 103 (1.5%) | 0 (0.0%) |
| Coal or Coke | 11 (0.2%) | 0 (0.0%) |
| All other Fuels | 28 (0.4%) | 0 (0.0%) |
| No Fuel Used | 6 (0.1%) | 66 (3.9%) |
| Total | 6,626 (100.0%) | 1,674 (100.0%) |
Household Vehicle Usage in West Mifflin borough
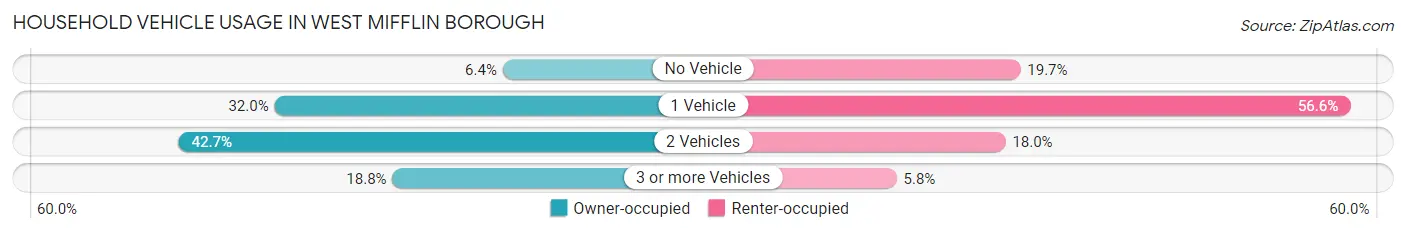
| Vehicles per Household | Owner-occupied | Renter-occupied |
| No Vehicle | 427 (6.4%) | 329 (19.7%) |
| 1 Vehicle | 2,121 (32.0%) | 947 (56.6%) |
| 2 Vehicles | 2,832 (42.7%) | 301 (18.0%) |
| 3 or more Vehicles | 1,246 (18.8%) | 97 (5.8%) |
| Total | 6,626 (100.0%) | 1,674 (100.0%) |
Real Estate & Mortgages in West Mifflin borough
Real Estate and Mortgage Overview in West Mifflin borough
| Characteristic | Without Mortgage | With Mortgage |
| Housing Units | 3,107 | 3,519 |
| Median Property Value | $112,000 | $127,300 |
| Median Household Income | $53,263 | $582 |
| Monthly Housing Costs | $540 | $32 |
| Real Estate Taxes | $2,553 | $5 |
Property Value by Mortgage Status in West Mifflin borough
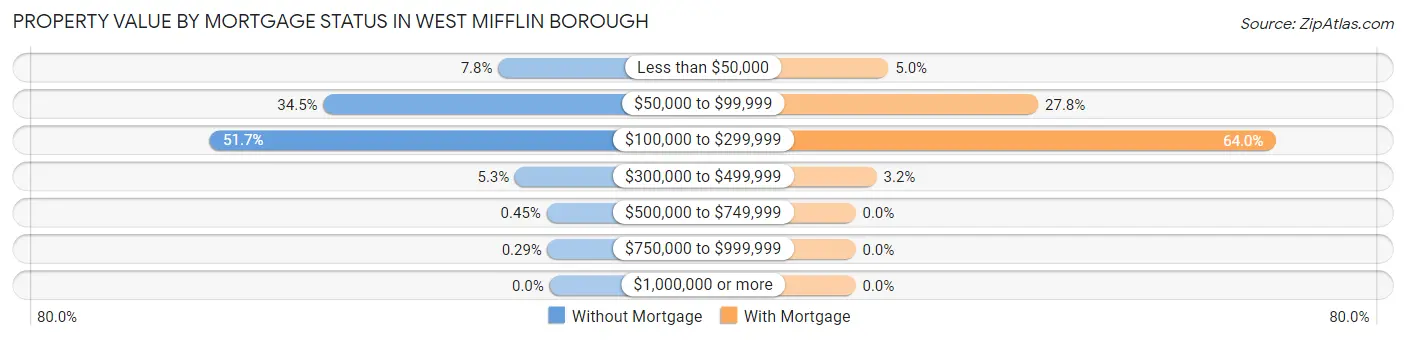
| Property Value | Without Mortgage | With Mortgage |
| Less than $50,000 | 243 (7.8%) | 176 (5.0%) |
| $50,000 to $99,999 | 1,071 (34.5%) | 979 (27.8%) |
| $100,000 to $299,999 | 1,607 (51.7%) | 2,251 (64.0%) |
| $300,000 to $499,999 | 163 (5.2%) | 113 (3.2%) |
| $500,000 to $749,999 | 14 (0.4%) | 0 (0.0%) |
| $750,000 to $999,999 | 9 (0.3%) | 0 (0.0%) |
| $1,000,000 or more | 0 (0.0%) | 0 (0.0%) |
| Total | 3,107 (100.0%) | 3,519 (100.0%) |
Household Income by Mortgage Status in West Mifflin borough
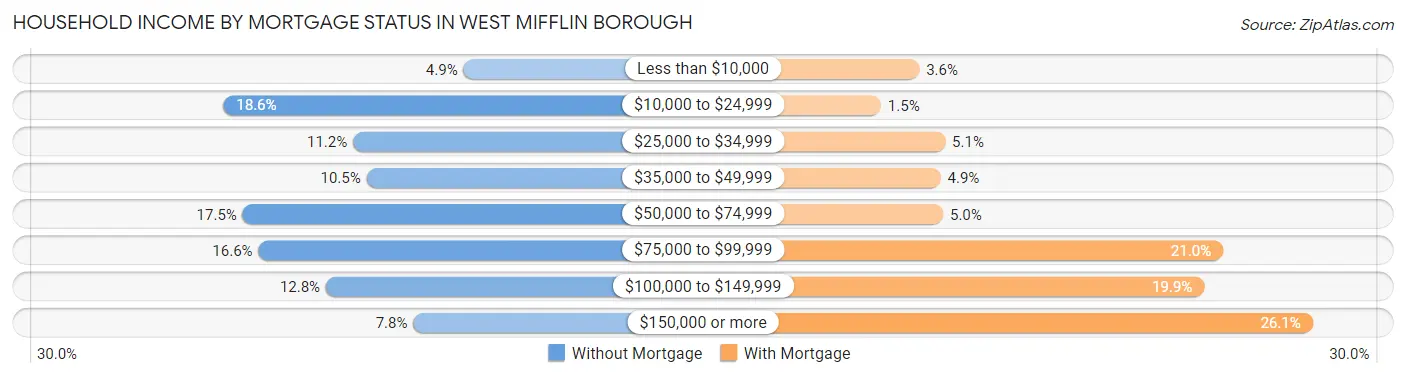
| Household Income | Without Mortgage | With Mortgage |
| Less than $10,000 | 153 (4.9%) | 128 (3.6%) |
| $10,000 to $24,999 | 579 (18.6%) | 51 (1.5%) |
| $25,000 to $34,999 | 349 (11.2%) | 180 (5.1%) |
| $35,000 to $49,999 | 325 (10.5%) | 171 (4.9%) |
| $50,000 to $74,999 | 545 (17.5%) | 176 (5.0%) |
| $75,000 to $99,999 | 517 (16.6%) | 739 (21.0%) |
| $100,000 to $149,999 | 397 (12.8%) | 701 (19.9%) |
| $150,000 or more | 242 (7.8%) | 919 (26.1%) |
| Total | 3,107 (100.0%) | 3,519 (100.0%) |
Property Value to Household Income Ratio in West Mifflin borough
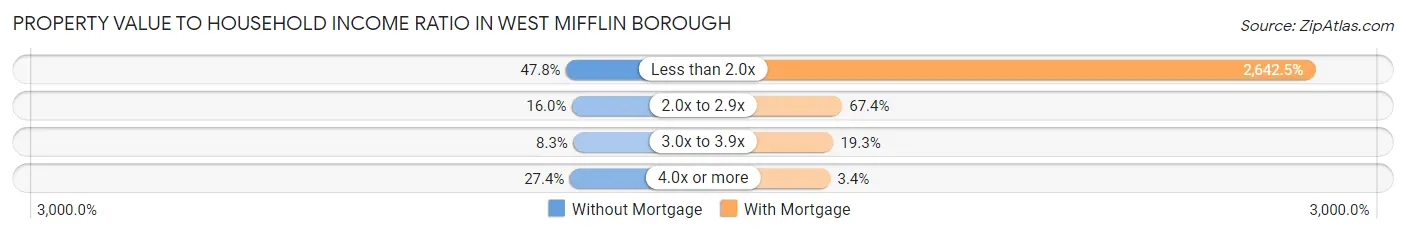
| Value-to-Income Ratio | Without Mortgage | With Mortgage |
| Less than 2.0x | 1,486 (47.8%) | 92,989 (2,642.5%) |
| 2.0x to 2.9x | 498 (16.0%) | 2,373 (67.4%) |
| 3.0x to 3.9x | 258 (8.3%) | 679 (19.3%) |
| 4.0x or more | 850 (27.4%) | 120 (3.4%) |
| Total | 3,107 (100.0%) | 3,519 (100.0%) |
Real Estate Taxes by Mortgage Status in West Mifflin borough
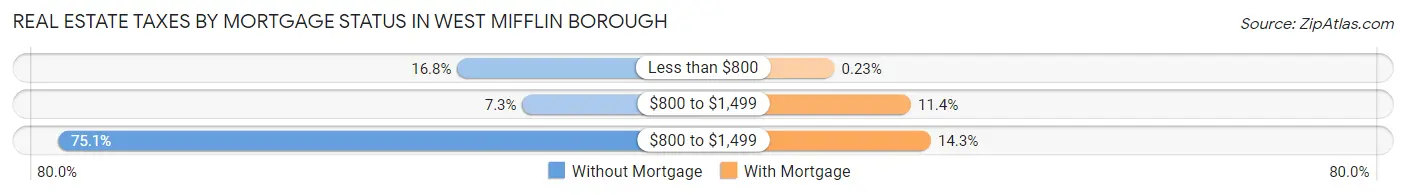
| Property Taxes | Without Mortgage | With Mortgage |
| Less than $800 | 521 (16.8%) | 8 (0.2%) |
| $800 to $1,499 | 226 (7.3%) | 401 (11.4%) |
| $800 to $1,499 | 2,334 (75.1%) | 504 (14.3%) |
| Total | 3,107 (100.0%) | 3,519 (100.0%) |
Health & Disability in West Mifflin borough
Health Insurance Coverage by Age in West Mifflin borough
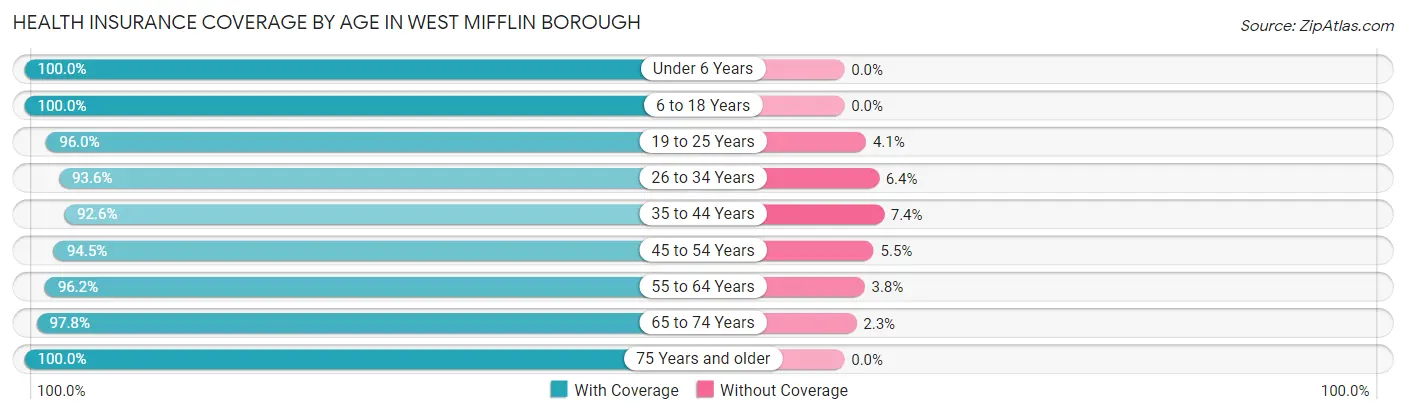
| Age Bracket | With Coverage | Without Coverage |
| Under 6 Years | 1,192 (100.0%) | 0 (0.0%) |
| 6 to 18 Years | 3,005 (100.0%) | 0 (0.0%) |
| 19 to 25 Years | 1,374 (96.0%) | 58 (4.1%) |
| 26 to 34 Years | 2,113 (93.6%) | 145 (6.4%) |
| 35 to 44 Years | 1,675 (92.6%) | 133 (7.4%) |
| 45 to 54 Years | 2,575 (94.5%) | 149 (5.5%) |
| 55 to 64 Years | 3,261 (96.2%) | 128 (3.8%) |
| 65 to 74 Years | 2,131 (97.8%) | 49 (2.2%) |
| 75 Years and older | 1,452 (100.0%) | 0 (0.0%) |
| Total | 18,778 (96.6%) | 662 (3.4%) |
Health Insurance Coverage by Citizenship Status in West Mifflin borough
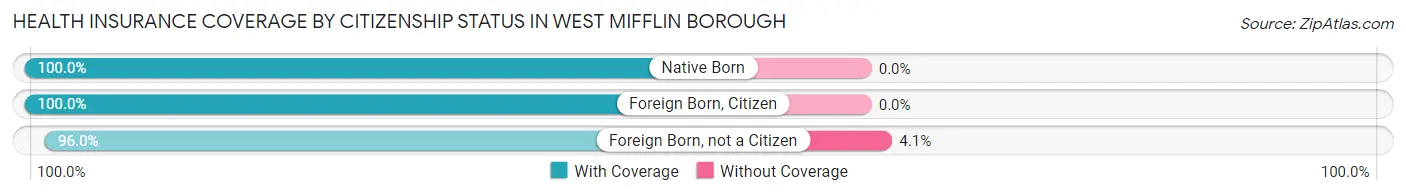
| Citizenship Status | With Coverage | Without Coverage |
| Native Born | 1,192 (100.0%) | 0 (0.0%) |
| Foreign Born, Citizen | 3,005 (100.0%) | 0 (0.0%) |
| Foreign Born, not a Citizen | 1,374 (96.0%) | 58 (4.1%) |
Health Insurance Coverage by Household Income in West Mifflin borough
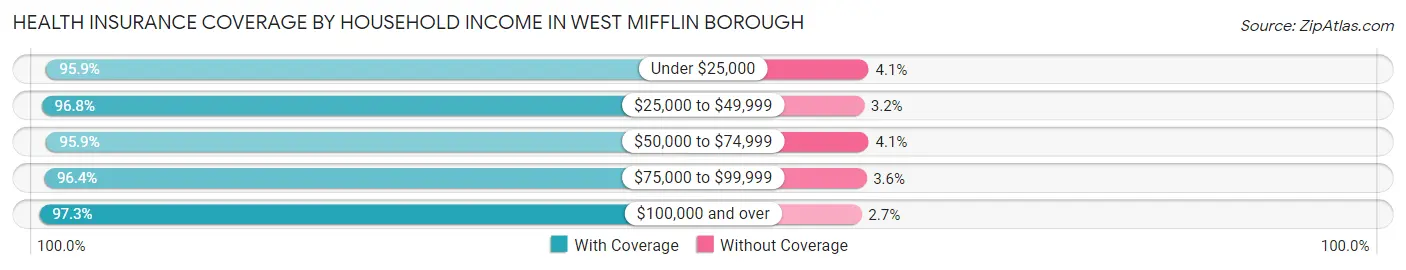
| Household Income | With Coverage | Without Coverage |
| Under $25,000 | 2,769 (95.9%) | 118 (4.1%) |
| $25,000 to $49,999 | 2,397 (96.8%) | 79 (3.2%) |
| $50,000 to $74,999 | 3,195 (95.9%) | 136 (4.1%) |
| $75,000 to $99,999 | 3,685 (96.4%) | 139 (3.6%) |
| $100,000 and over | 6,701 (97.3%) | 189 (2.7%) |
Public vs Private Health Insurance Coverage by Age in West Mifflin borough
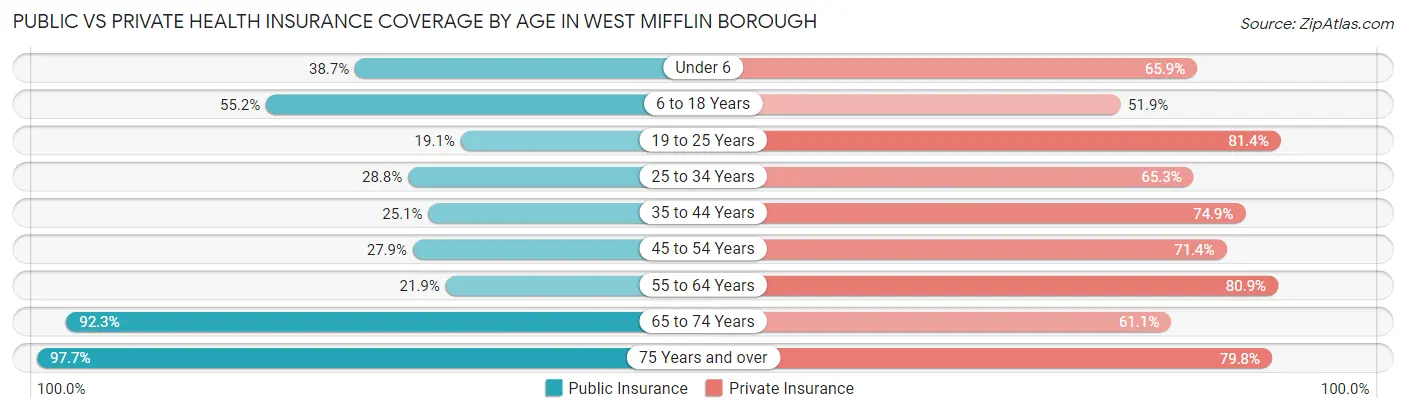
| Age Bracket | Public Insurance | Private Insurance |
| Under 6 | 461 (38.7%) | 786 (65.9%) |
| 6 to 18 Years | 1,658 (55.2%) | 1,558 (51.8%) |
| 19 to 25 Years | 273 (19.1%) | 1,166 (81.4%) |
| 25 to 34 Years | 651 (28.8%) | 1,474 (65.3%) |
| 35 to 44 Years | 453 (25.1%) | 1,354 (74.9%) |
| 45 to 54 Years | 761 (27.9%) | 1,944 (71.4%) |
| 55 to 64 Years | 741 (21.9%) | 2,743 (80.9%) |
| 65 to 74 Years | 2,011 (92.2%) | 1,332 (61.1%) |
| 75 Years and over | 1,418 (97.7%) | 1,159 (79.8%) |
| Total | 8,427 (43.3%) | 13,516 (69.5%) |
Disability Status by Sex by Age in West Mifflin borough
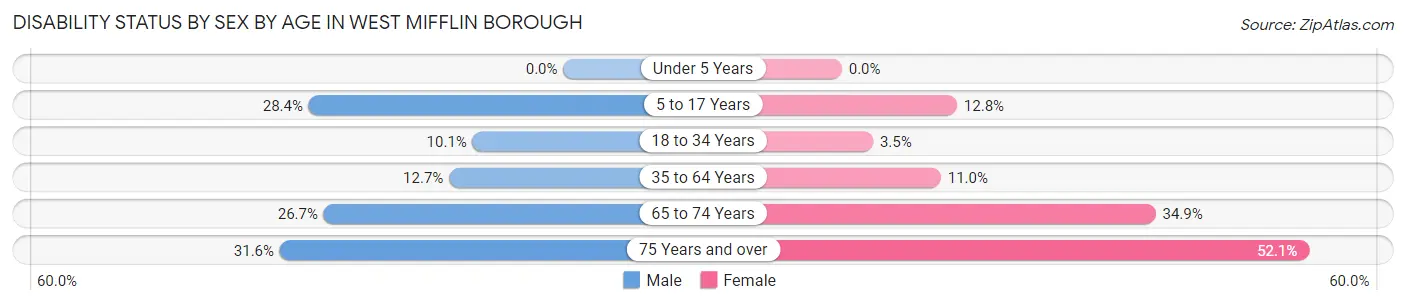
| Age Bracket | Male | Female |
| Under 5 Years | 0 (0.0%) | 0 (0.0%) |
| 5 to 17 Years | 523 (28.3%) | 168 (12.8%) |
| 18 to 34 Years | 203 (10.1%) | 64 (3.5%) |
| 35 to 64 Years | 492 (12.7%) | 447 (11.0%) |
| 65 to 74 Years | 293 (26.7%) | 378 (34.9%) |
| 75 Years and over | 143 (31.6%) | 520 (52.0%) |
Disability Class by Sex by Age in West Mifflin borough
Disability Class: Hearing Difficulty
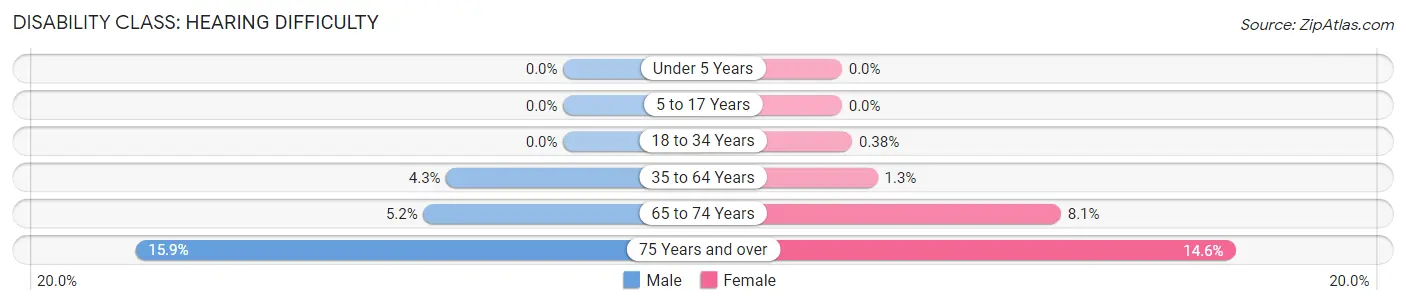
| Age Bracket | Male | Female |
| Under 5 Years | 0 (0.0%) | 0 (0.0%) |
| 5 to 17 Years | 0 (0.0%) | 0 (0.0%) |
| 18 to 34 Years | 0 (0.0%) | 7 (0.4%) |
| 35 to 64 Years | 168 (4.3%) | 54 (1.3%) |
| 65 to 74 Years | 57 (5.2%) | 88 (8.1%) |
| 75 Years and over | 72 (15.9%) | 146 (14.6%) |
Disability Class: Vision Difficulty
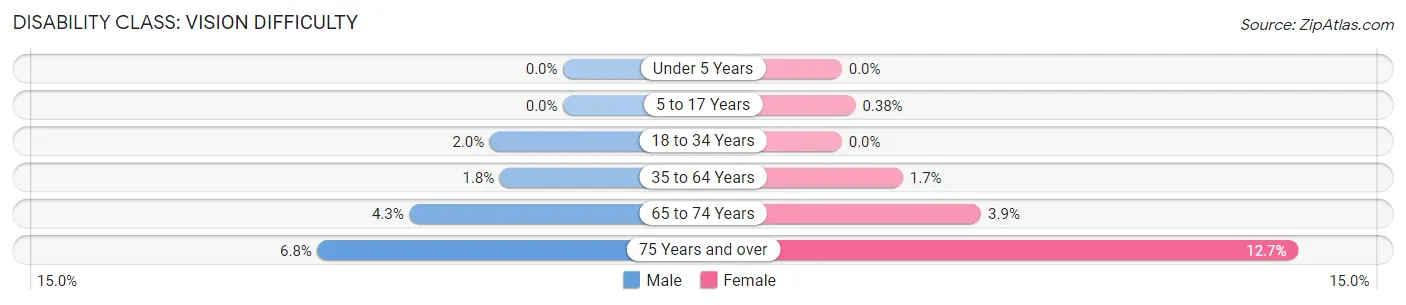
| Age Bracket | Male | Female |
| Under 5 Years | 0 (0.0%) | 0 (0.0%) |
| 5 to 17 Years | 0 (0.0%) | 5 (0.4%) |
| 18 to 34 Years | 41 (2.0%) | 0 (0.0%) |
| 35 to 64 Years | 68 (1.8%) | 69 (1.7%) |
| 65 to 74 Years | 47 (4.3%) | 42 (3.9%) |
| 75 Years and over | 31 (6.8%) | 127 (12.7%) |
Disability Class: Cognitive Difficulty
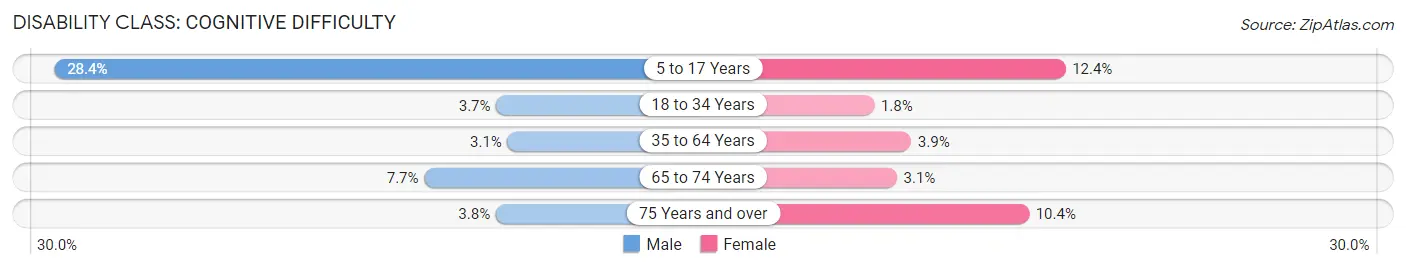
| Age Bracket | Male | Female |
| 5 to 17 Years | 523 (28.3%) | 163 (12.4%) |
| 18 to 34 Years | 75 (3.7%) | 33 (1.8%) |
| 35 to 64 Years | 120 (3.1%) | 156 (3.8%) |
| 65 to 74 Years | 85 (7.7%) | 33 (3.0%) |
| 75 Years and over | 17 (3.7%) | 104 (10.4%) |
Disability Class: Ambulatory Difficulty
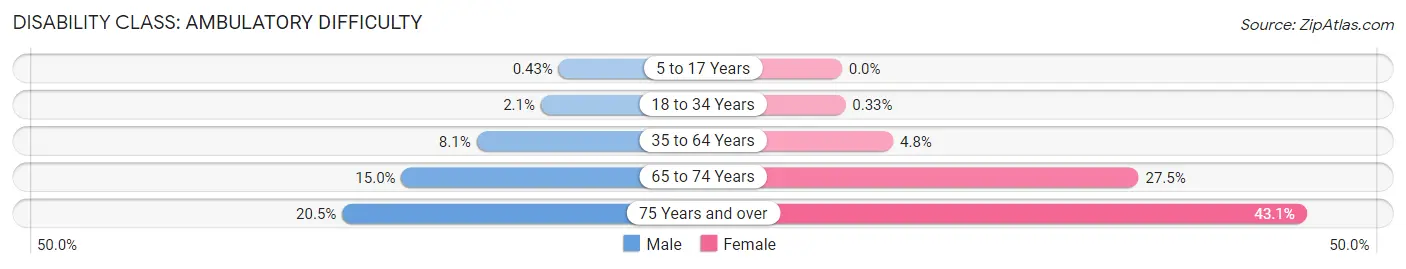
| Age Bracket | Male | Female |
| 5 to 17 Years | 8 (0.4%) | 0 (0.0%) |
| 18 to 34 Years | 42 (2.1%) | 6 (0.3%) |
| 35 to 64 Years | 312 (8.1%) | 193 (4.8%) |
| 65 to 74 Years | 165 (15.0%) | 298 (27.5%) |
| 75 Years and over | 93 (20.5%) | 431 (43.1%) |
Disability Class: Self-Care Difficulty
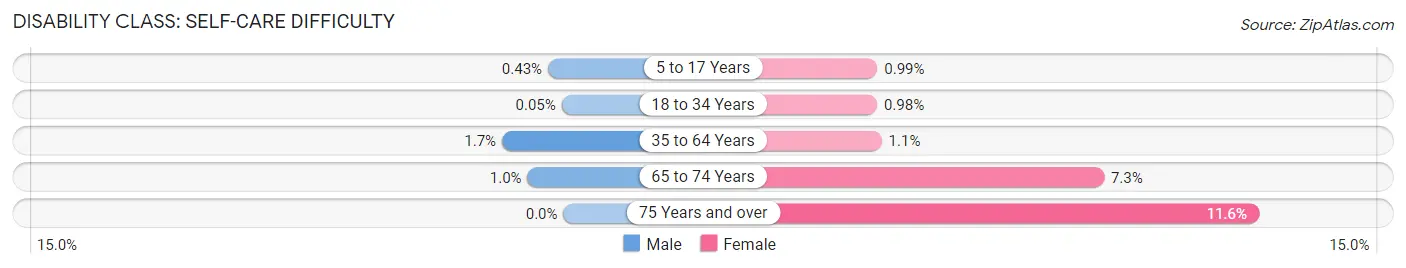
| Age Bracket | Male | Female |
| 5 to 17 Years | 8 (0.4%) | 13 (1.0%) |
| 18 to 34 Years | 1 (0.1%) | 18 (1.0%) |
| 35 to 64 Years | 66 (1.7%) | 45 (1.1%) |
| 65 to 74 Years | 11 (1.0%) | 79 (7.3%) |
| 75 Years and over | 0 (0.0%) | 116 (11.6%) |
Technology Access in West Mifflin borough
Computing Device Access in West Mifflin borough
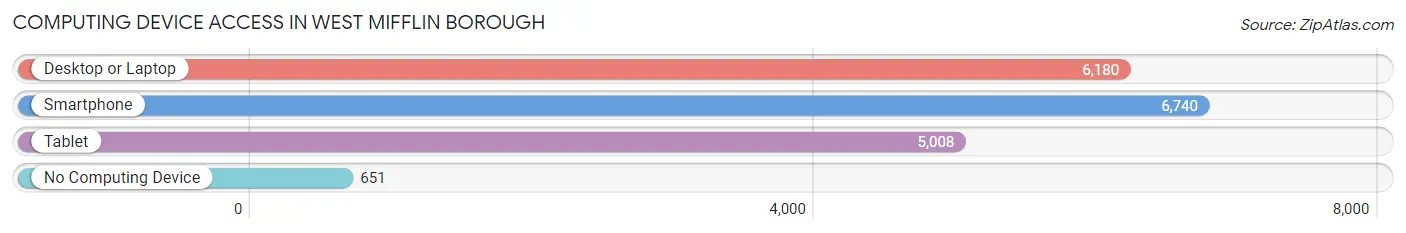
| Device Type | # Households | % Households |
| Desktop or Laptop | 6,180 | 74.5% |
| Smartphone | 6,740 | 81.2% |
| Tablet | 5,008 | 60.3% |
| No Computing Device | 651 | 7.8% |
| Total | 8,300 | 100.0% |
Internet Access in West Mifflin borough
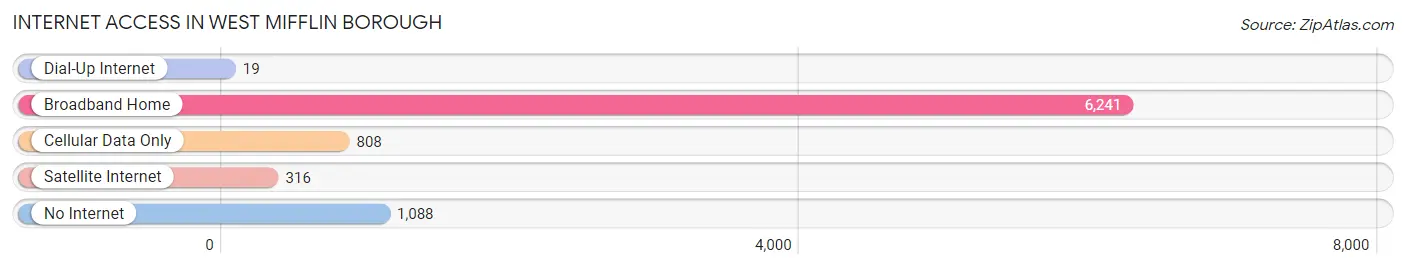
| Internet Type | # Households | % Households |
| Dial-Up Internet | 19 | 0.2% |
| Broadband Home | 6,241 | 75.2% |
| Cellular Data Only | 808 | 9.7% |
| Satellite Internet | 316 | 3.8% |
| No Internet | 1,088 | 13.1% |
| Total | 8,300 | 100.0% |
West Mifflin borough Summary
West Mifflin Borough is a borough located in Allegheny County, Pennsylvania. It is located approximately 10 miles southeast of Pittsburgh and is part of the Pittsburgh metropolitan area. The population of West Mifflin Borough was 20,313 at the 2010 census.
History
West Mifflin Borough was first settled in 1790 by John and Mary Ann Mifflin. The Mifflins were of English and German descent and had come to the area from Philadelphia. The Mifflins purchased a large tract of land from the Penn family and began to develop the area. The Mifflins named the area West Mifflin after their ancestral home in England.
In 1842, the area was officially incorporated as a borough. The borough was named after the Mifflins and the area was known as West Mifflin Borough.
The borough grew rapidly in the late 19th and early 20th centuries. The population of West Mifflin Borough increased from 1,000 in 1880 to over 10,000 by 1910. The borough was home to several steel mills and other industries, which provided employment for many of the residents.
In the 1950s, the borough began to experience a decline in population as many of the steel mills and other industries closed. The population of West Mifflin Borough decreased from 10,000 in 1950 to 8,000 in 1970.
Geography
West Mifflin Borough is located in Allegheny County, Pennsylvania. It is located approximately 10 miles southeast of Pittsburgh and is part of the Pittsburgh metropolitan area. The borough is bordered by the boroughs of Dravosburg, Duquesne, and McKeesport, and the townships of Elizabeth, Forward, and Jefferson.
The borough has a total area of 4.2 square miles, all of which is land. The borough is located in the Allegheny Plateau region of Pennsylvania and is mostly flat. The borough is located on the Monongahela River and is home to several parks and recreational areas.
Economy
West Mifflin Borough is home to several large employers, including U.S. Steel, Allegheny Technologies, and the West Mifflin School District. The borough is also home to several small businesses, including restaurants, retail stores, and service providers.
The median household income in West Mifflin Borough is $41,945, which is slightly lower than the national median of $50,046. The median home value in the borough is $90,000, which is lower than the national median of $184,700.
Demographics
As of the 2010 census, the population of West Mifflin Borough was 20,313. The racial makeup of the borough was 87.3% White, 8.7% African American, 0.3% Native American, 0.7% Asian, 0.1% Pacific Islander, and 2.9% from other races. Hispanic or Latino of any race were 2.3% of the population.
The median age in West Mifflin Borough is 41.3 years, which is slightly higher than the national median of 37.8 years. The median household income in the borough is $41,945, which is slightly lower than the national median of $50,046. The median home value in the borough is $90,000, which is lower than the national median of $184,700.
Conclusion
West Mifflin Borough is a borough located in Allegheny County, Pennsylvania. It is located approximately 10 miles southeast of Pittsburgh and is part of the Pittsburgh metropolitan area. The population of West Mifflin Borough was 20,313 at the 2010 census. The borough was first settled in 1790 by John and Mary Ann Mifflin and was officially incorporated as a borough in 1842. The borough has a total area of 4.2 square miles and is located in the Allegheny Plateau region of Pennsylvania. The borough is home to several large employers, including U.S. Steel, Allegheny Technologies, and the West Mifflin School District. The median household income in West Mifflin Borough is $41,945, which is slightly lower than the national median of $50,046. The racial makeup of the borough is 87.3% White, 8.7% African American, 0.3% Native American, 0.7% Asian, 0.1% Pacific Islander, and 2.9% from other races. The median age in West Mifflin Borough is 41.3 years, which is slightly higher than the national median of 37.8 years.
Common Questions
What is Per Capita Income in West Mifflin borough?
Per Capita income in West Mifflin borough is $33,952.
What is the Median Family Income in West Mifflin borough?
Median Family Income in West Mifflin borough is $87,583.
What is the Median Household income in West Mifflin borough?
Median Household Income in West Mifflin borough is $64,314.
What is Income or Wage Gap in West Mifflin borough?
Income or Wage Gap in West Mifflin borough is 13.4%.
Women in West Mifflin borough earn 86.6 cents for every dollar earned by a man.
What is Family Income Deficit in West Mifflin borough?
Family Income Deficit in West Mifflin borough is $11,134.
Families that are below poverty line in West Mifflin borough earn $11,134 less on average than the poverty threshold level.
What is Inequality or Gini Index in West Mifflin borough?
Inequality or Gini Index in West Mifflin borough is 0.42.
What is the Total Population of West Mifflin borough?
Total Population of West Mifflin borough is 19,506.
What is the Total Male Population of West Mifflin borough?
Total Male Population of West Mifflin borough is 9,723.
What is the Total Female Population of West Mifflin borough?
Total Female Population of West Mifflin borough is 9,783.
What is the Ratio of Males per 100 Females in West Mifflin borough?
There are 99.39 Males per 100 Females in West Mifflin borough.
What is the Ratio of Females per 100 Males in West Mifflin borough?
There are 100.62 Females per 100 Males in West Mifflin borough.
What is the Median Population Age in West Mifflin borough?
Median Population Age in West Mifflin borough is 45.2 Years.
What is the Average Family Size in West Mifflin borough
Average Family Size in West Mifflin borough is 3.1 People.
What is the Average Household Size in West Mifflin borough
Average Household Size in West Mifflin borough is 2.3 People.
How Large is the Labor Force in West Mifflin borough?
There are 10,261 People in the Labor Forcein in West Mifflin borough.
What is the Percentage of People in the Labor Force in West Mifflin borough?
64.7% of People are in the Labor Force in West Mifflin borough.
What is the Unemployment Rate in West Mifflin borough?
Unemployment Rate in West Mifflin borough is 8.9%.