Edinboro borough, PA Map & Demographics
Edinboro borough Overview
$25,252
PER CAPITA INCOME
$80,481
AVG FAMILY INCOME
$39,102
AVG HOUSEHOLD INCOME
0.51
INEQUALITY / GINI INDEX
4,958
TOTAL POPULATION
2,169
MALE POPULATION
2,789
FEMALE POPULATION
77.77
MALES / 100 FEMALES
128.58
FEMALES / 100 MALES
24.1
MEDIAN AGE
2.6
AVG FAMILY SIZE
2.1
AVG HOUSEHOLD SIZE
2,225
LABOR FORCE [ PEOPLE ]
50.4%
PERCENT IN LABOR FORCE
2.2%
UNEMPLOYMENT RATE
Income in Edinboro borough
Income Overview in Edinboro borough
Per Capita Income in Edinboro borough is $25,252, while median incomes of families and households are $80,481 and $39,102 respectively.
| Characteristic | Number | Measure |
| Per Capita Income | 4,958 | $25,252 |
| Median Family Income | 861 | $80,481 |
| Mean Family Income | 861 | $101,706 |
| Median Household Income | 1,767 | $39,102 |
| Mean Household Income | 1,767 | $67,670 |
| Income Deficit | 861 | $0 |
| Wage / Income Gap (%) | 4,958 | 0.00% |
| Wage / Income Gap ($) | 4,958 | 100.00¢ per $1 |
| Gini / Inequality Index | 4,958 | 0.51 |
Earnings by Sex in Edinboro borough
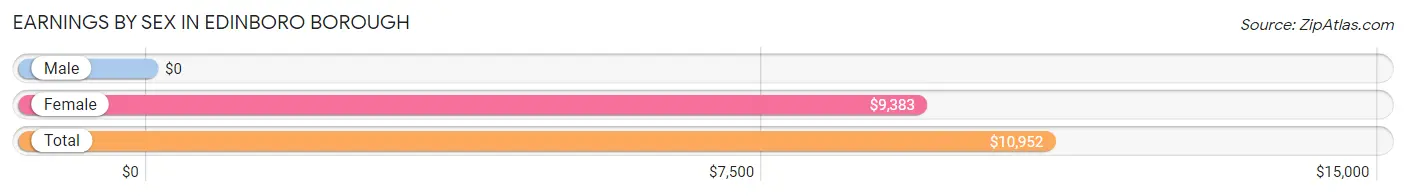
| Sex | Number | Average Earnings |
| Male | 1,317 (41.8%) | $0 |
| Female | 1,834 (58.2%) | $9,383 |
| Total | 3,151 (100.0%) | $10,952 |
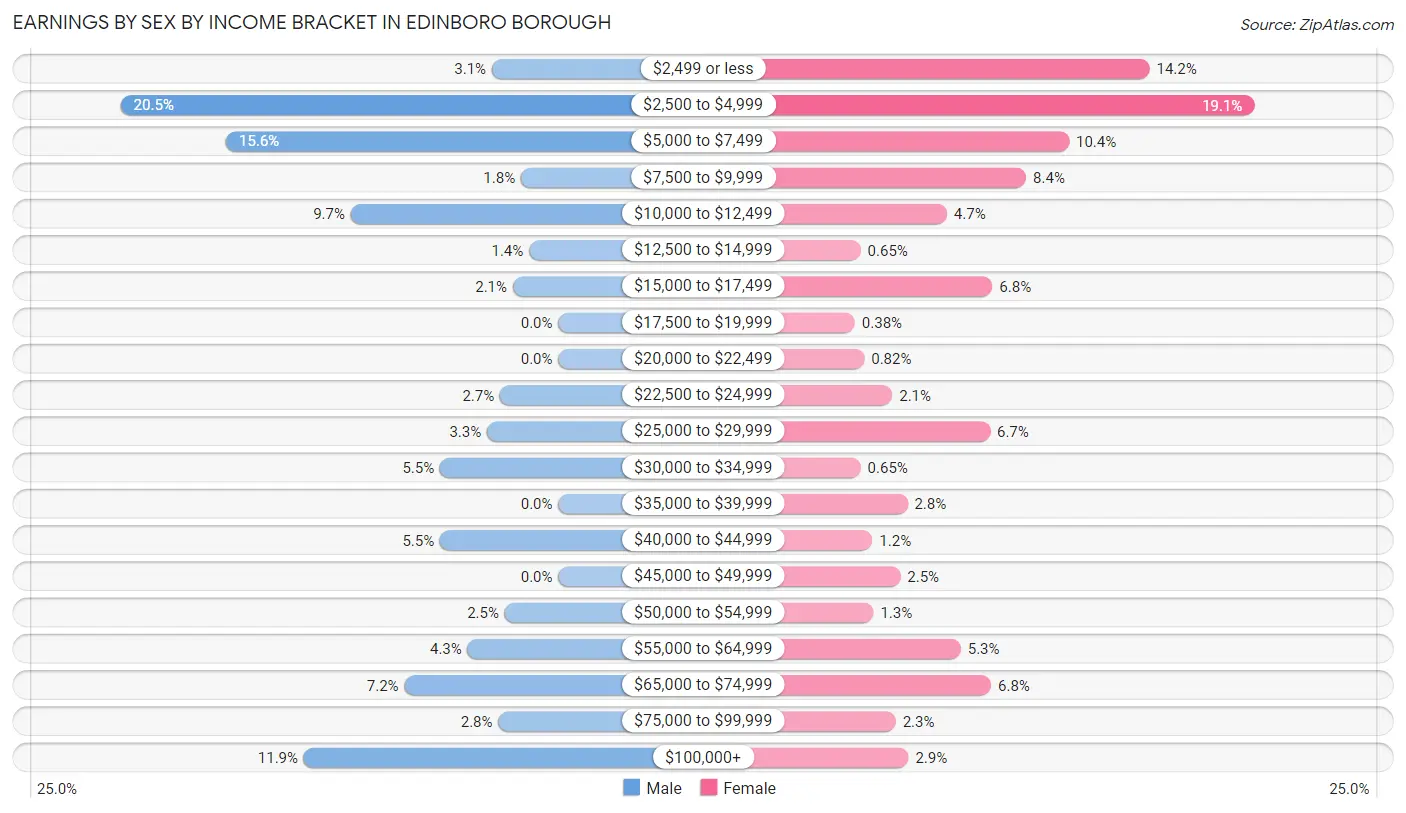
Earnings by Sex by Income Bracket in Edinboro borough
The most common earnings brackets in Edinboro borough are $2,500 to $4,999 for men (270 | 20.5%) and $2,500 to $4,999 for women (350 | 19.1%).
| Income | Male | Female |
| $2,499 or less | 41 (3.1%) | 260 (14.2%) |
| $2,500 to $4,999 | 270 (20.5%) | 350 (19.1%) |
| $5,000 to $7,499 | 205 (15.6%) | 191 (10.4%) |
| $7,500 to $9,999 | 23 (1.8%) | 154 (8.4%) |
| $10,000 to $12,499 | 128 (9.7%) | 86 (4.7%) |
| $12,500 to $14,999 | 18 (1.4%) | 12 (0.6%) |
| $15,000 to $17,499 | 28 (2.1%) | 125 (6.8%) |
| $17,500 to $19,999 | 0 (0.0%) | 7 (0.4%) |
| $20,000 to $22,499 | 0 (0.0%) | 15 (0.8%) |
| $22,500 to $24,999 | 36 (2.7%) | 39 (2.1%) |
| $25,000 to $29,999 | 44 (3.3%) | 123 (6.7%) |
| $30,000 to $34,999 | 73 (5.5%) | 12 (0.6%) |
| $35,000 to $39,999 | 0 (0.0%) | 52 (2.8%) |
| $40,000 to $44,999 | 73 (5.5%) | 22 (1.2%) |
| $45,000 to $49,999 | 0 (0.0%) | 46 (2.5%) |
| $50,000 to $54,999 | 33 (2.5%) | 23 (1.3%) |
| $55,000 to $64,999 | 56 (4.3%) | 98 (5.3%) |
| $65,000 to $74,999 | 95 (7.2%) | 124 (6.8%) |
| $75,000 to $99,999 | 37 (2.8%) | 42 (2.3%) |
| $100,000+ | 157 (11.9%) | 53 (2.9%) |
| Total | 1,317 (100.0%) | 1,834 (100.0%) |
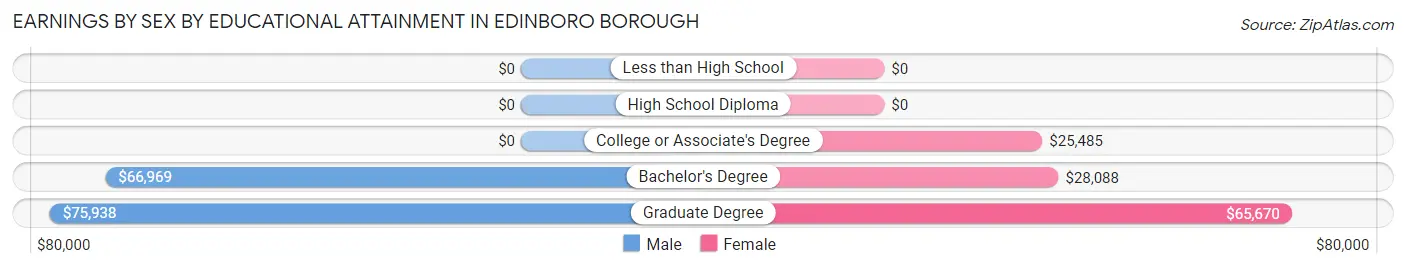
Earnings by Sex by Educational Attainment in Edinboro borough
Average earnings in Edinboro borough are $42,003 for men and $29,228 for women, a difference of 30.4%. Men with an educational attainment of graduate degree enjoy the highest average annual earnings of $75,938, while those with bachelor's degree education earn the least with $66,969. Women with an educational attainment of graduate degree earn the most with the average annual earnings of $65,670, while those with college or associate's degree education have the smallest earnings of $25,485.
| Educational Attainment | Male Income | Female Income |
| Less than High School | - | - |
| High School Diploma | - | - |
| College or Associate's Degree | - | - |
| Bachelor's Degree | $66,969 | $28,088 |
| Graduate Degree | $75,938 | $65,670 |
| Total | $42,003 | $29,228 |
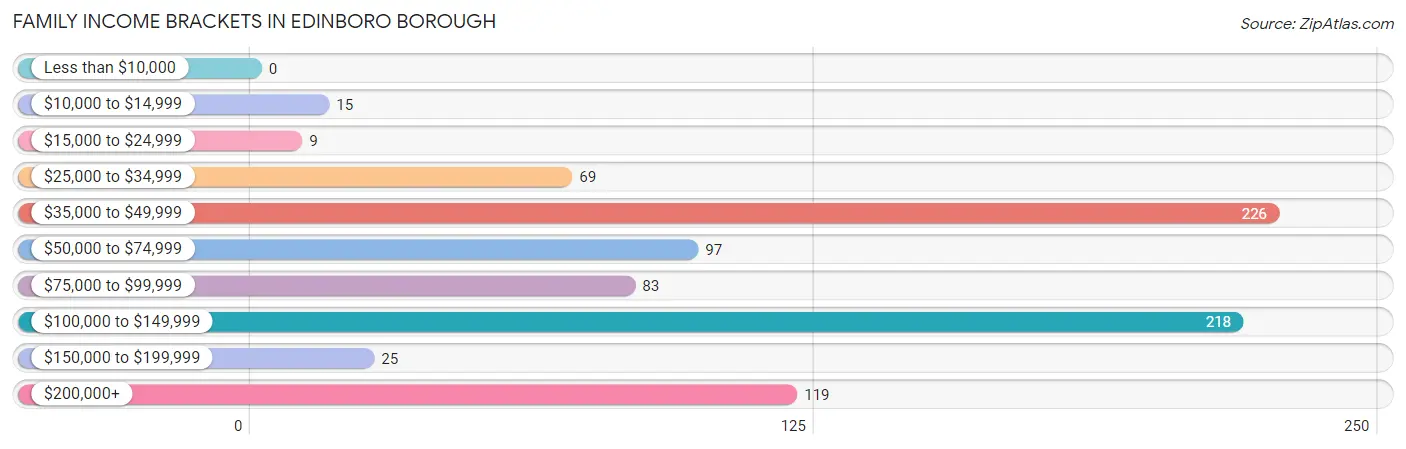
Family Income in Edinboro borough
Family Income Brackets in Edinboro borough
According to the Edinboro borough family income data, there are 226 families falling into the $35,000 to $49,999 income range, which is the most common income bracket and makes up 26.3% of all families.
| Income Bracket | # Families | % Families |
| Less than $10,000 | 0 | 0.0% |
| $10,000 to $14,999 | 15 | 1.7% |
| $15,000 to $24,999 | 9 | 1.0% |
| $25,000 to $34,999 | 69 | 8.0% |
| $35,000 to $49,999 | 226 | 26.2% |
| $50,000 to $74,999 | 97 | 11.3% |
| $75,000 to $99,999 | 83 | 9.6% |
| $100,000 to $149,999 | 218 | 25.3% |
| $150,000 to $199,999 | 25 | 2.9% |
| $200,000+ | 119 | 13.8% |
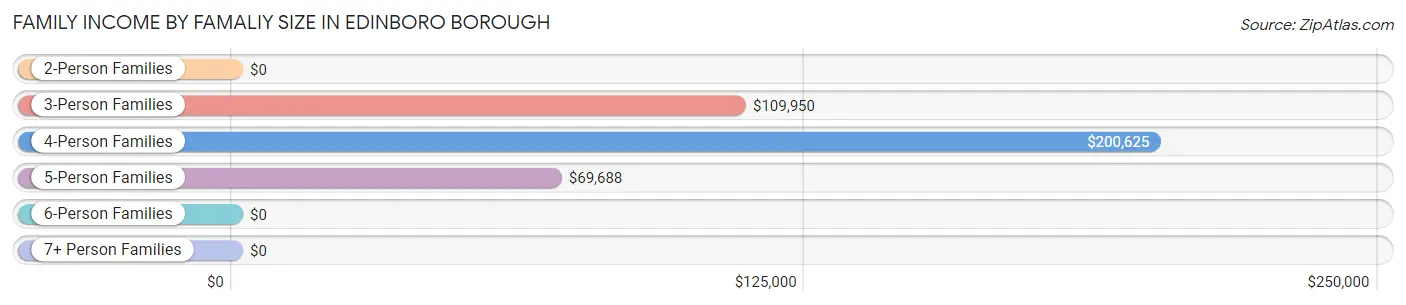
Family Income by Famaliy Size in Edinboro borough
4-person families (90 | 10.4%) account for the highest median family income in Edinboro borough with $200,625 per family, while 4-person families (90 | 10.4%) have the highest median income of $50,156 per family member.
| Income Bracket | # Families | Median Income |
| 2-Person Families | 539 (62.6%) | $0 |
| 3-Person Families | 149 (17.3%) | $109,950 |
| 4-Person Families | 90 (10.4%) | $200,625 |
| 5-Person Families | 47 (5.5%) | $69,688 |
| 6-Person Families | 36 (4.2%) | $0 |
| 7+ Person Families | 0 (0.0%) | $0 |
| Total | 861 (100.0%) | $80,481 |
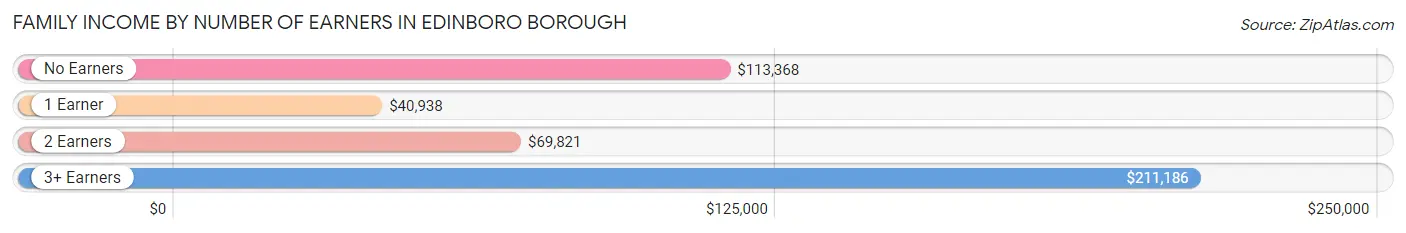
Family Income by Number of Earners in Edinboro borough
The median family income in Edinboro borough is $80,481, with families comprising 3+ earners (103) having the highest median family income of $211,186, while families with 1 earner (183) have the lowest median family income of $40,938, accounting for 12.0% and 21.2% of families, respectively.
| Number of Earners | # Families | Median Income |
| No Earners | 109 (12.7%) | $113,368 |
| 1 Earner | 183 (21.2%) | $40,938 |
| 2 Earners | 466 (54.1%) | $69,821 |
| 3+ Earners | 103 (12.0%) | $211,186 |
| Total | 861 (100.0%) | $80,481 |
Household Income in Edinboro borough
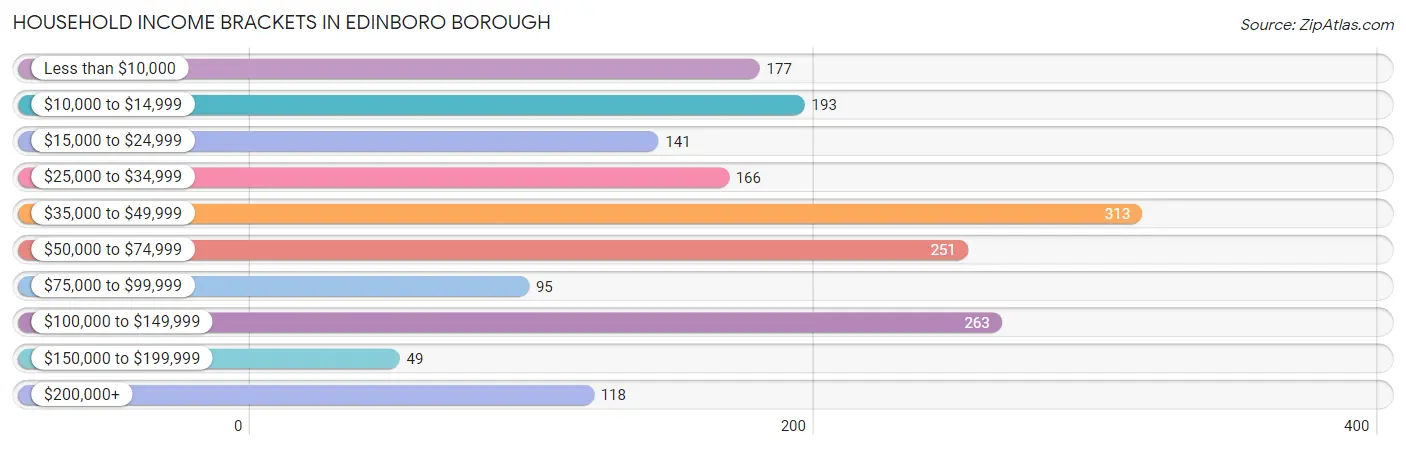
Household Income Brackets in Edinboro borough
With 313 households falling in the category, the $35,000 to $49,999 income range is the most frequent in Edinboro borough, accounting for 17.7% of all households. In contrast, only 49 households (2.8%) fall into the $150,000 to $199,999 income bracket, making it the least populous group.
| Income Bracket | # Households | % Households |
| Less than $10,000 | 177 | 10.0% |
| $10,000 to $14,999 | 193 | 10.9% |
| $15,000 to $24,999 | 141 | 8.0% |
| $25,000 to $34,999 | 166 | 9.4% |
| $35,000 to $49,999 | 313 | 17.7% |
| $50,000 to $74,999 | 251 | 14.2% |
| $75,000 to $99,999 | 95 | 5.4% |
| $100,000 to $149,999 | 263 | 14.9% |
| $150,000 to $199,999 | 49 | 2.8% |
| $200,000+ | 118 | 6.7% |
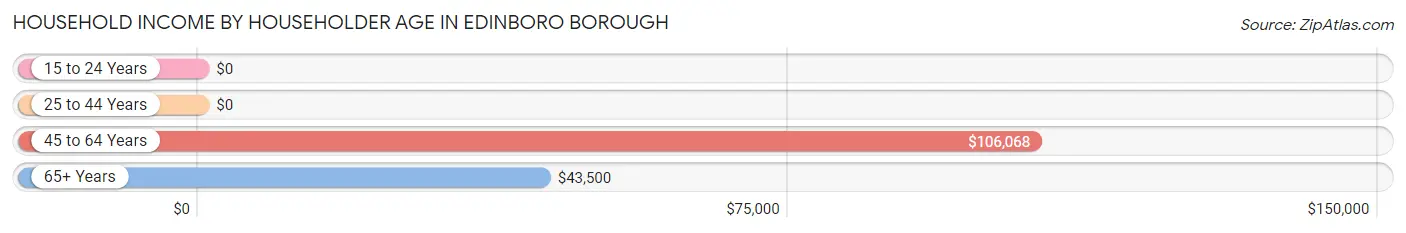
Household Income by Householder Age in Edinboro borough
The median household income in Edinboro borough is $39,102, with the highest median household income of $106,068 found in the 45 to 64 years age bracket for the primary householder. A total of 385 households (21.8%) fall into this category. Meanwhile, the 15 to 24 years age bracket for the primary householder has the lowest median household income of $0, with 314 households (17.8%) in this group.
| Income Bracket | # Households | Median Income |
| 15 to 24 Years | 314 (17.8%) | $0 |
| 25 to 44 Years | 740 (41.9%) | $0 |
| 45 to 64 Years | 385 (21.8%) | $106,068 |
| 65+ Years | 328 (18.6%) | $43,500 |
| Total | 1,767 (100.0%) | $39,102 |
Poverty in Edinboro borough
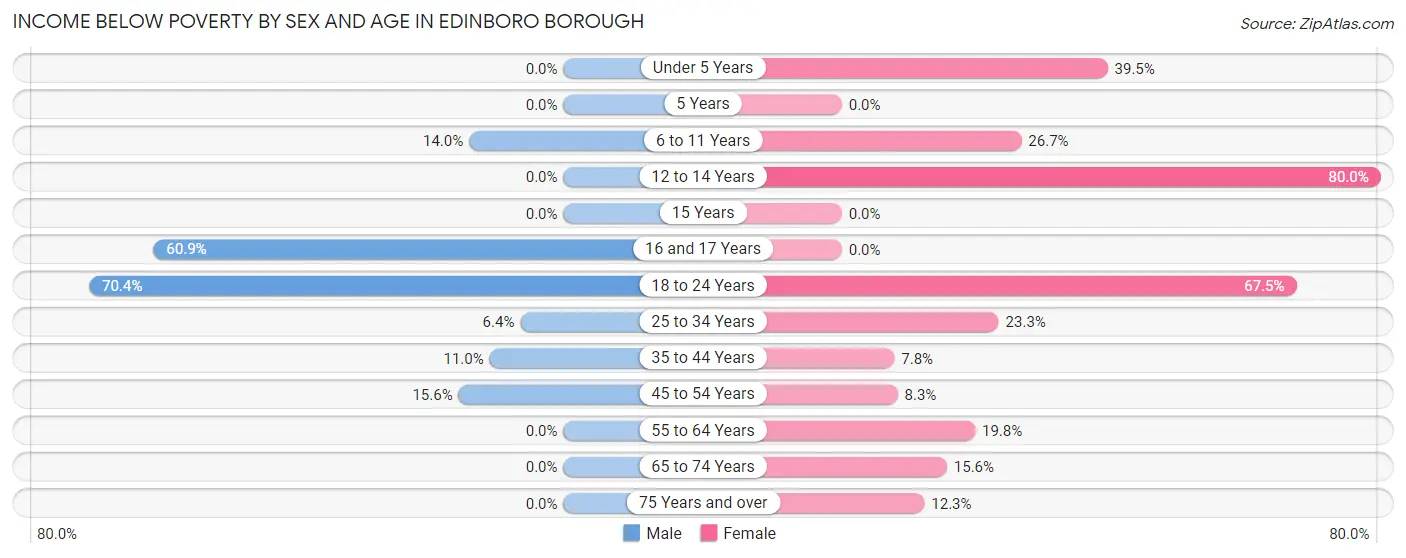
Income Below Poverty by Sex and Age in Edinboro borough
With 19.1% poverty level for males and 32.4% for females among the residents of Edinboro borough, 18 to 24 year old males and 12 to 14 year old females are the most vulnerable to poverty, with 231 males (70.4%) and 32 females (80.0%) in their respective age groups living below the poverty level.
| Age Bracket | Male | Female |
| Under 5 Years | 0 (0.0%) | 15 (39.5%) |
| 5 Years | 0 (0.0%) | 0 (0.0%) |
| 6 to 11 Years | 14 (14.0%) | 16 (26.7%) |
| 12 to 14 Years | 0 (0.0%) | 32 (80.0%) |
| 15 Years | 0 (0.0%) | 0 (0.0%) |
| 16 and 17 Years | 14 (60.9%) | 0 (0.0%) |
| 18 to 24 Years | 231 (70.4%) | 411 (67.5%) |
| 25 to 34 Years | 22 (6.4%) | 102 (23.3%) |
| 35 to 44 Years | 16 (11.0%) | 16 (7.8%) |
| 45 to 54 Years | 19 (15.6%) | 15 (8.3%) |
| 55 to 64 Years | 0 (0.0%) | 38 (19.8%) |
| 65 to 74 Years | 0 (0.0%) | 17 (15.6%) |
| 75 Years and over | 0 (0.0%) | 26 (12.3%) |
| Total | 316 (19.1%) | 688 (32.4%) |
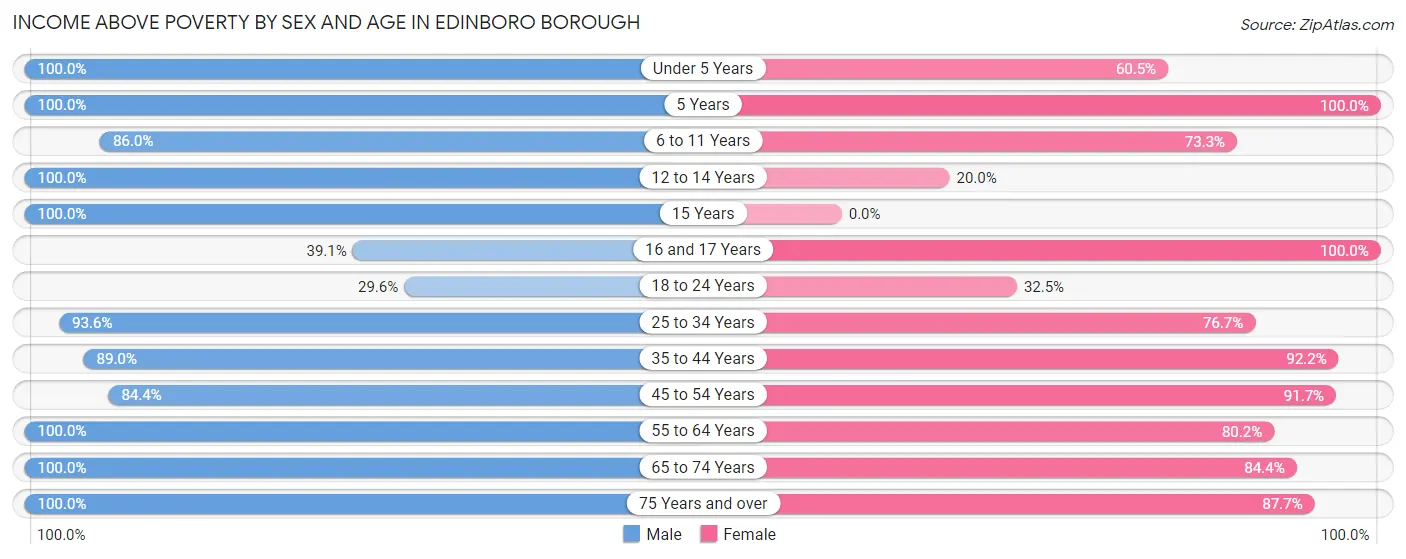
Income Above Poverty by Sex and Age in Edinboro borough
According to the poverty statistics in Edinboro borough, males aged under 5 years and females aged 5 years are the age groups that are most secure financially, with 100.0% of males and 100.0% of females in these age groups living above the poverty line.
| Age Bracket | Male | Female |
| Under 5 Years | 139 (100.0%) | 23 (60.5%) |
| 5 Years | 12 (100.0%) | 21 (100.0%) |
| 6 to 11 Years | 86 (86.0%) | 44 (73.3%) |
| 12 to 14 Years | 90 (100.0%) | 8 (20.0%) |
| 15 Years | 21 (100.0%) | 0 (0.0%) |
| 16 and 17 Years | 9 (39.1%) | 16 (100.0%) |
| 18 to 24 Years | 97 (29.6%) | 198 (32.5%) |
| 25 to 34 Years | 322 (93.6%) | 336 (76.7%) |
| 35 to 44 Years | 130 (89.0%) | 189 (92.2%) |
| 45 to 54 Years | 103 (84.4%) | 166 (91.7%) |
| 55 to 64 Years | 190 (100.0%) | 154 (80.2%) |
| 65 to 74 Years | 67 (100.0%) | 92 (84.4%) |
| 75 Years and over | 74 (100.0%) | 186 (87.7%) |
| Total | 1,340 (80.9%) | 1,433 (67.6%) |
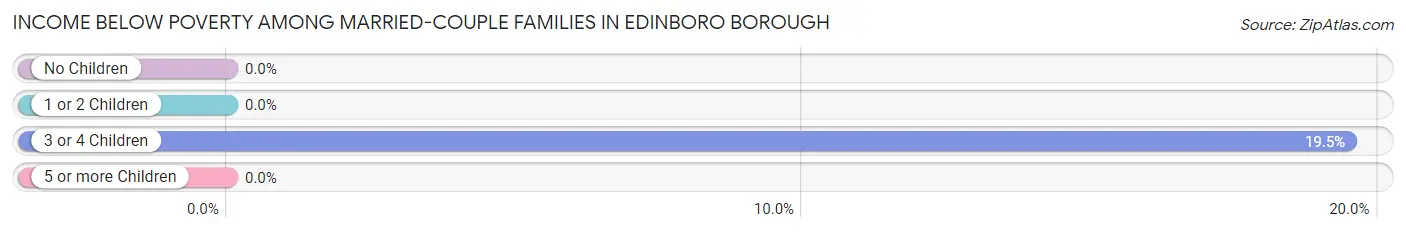
Income Below Poverty Among Married-Couple Families in Edinboro borough
The poverty statistics for married-couple families in Edinboro borough show that 2.2% or 15 of the total 679 families live below the poverty line. Families with 3 or 4 children have the highest poverty rate of 19.5%, comprising of 15 families. On the other hand, families with no children have the lowest poverty rate of 0.0%, which includes 0 families.
| Children | Above Poverty | Below Poverty |
| No Children | 522 (100.0%) | 0 (0.0%) |
| 1 or 2 Children | 80 (100.0%) | 0 (0.0%) |
| 3 or 4 Children | 62 (80.5%) | 15 (19.5%) |
| 5 or more Children | 0 (0.0%) | 0 (0.0%) |
| Total | 664 (97.8%) | 15 (2.2%) |
Income Below Poverty Among Single-Parent Households in Edinboro borough
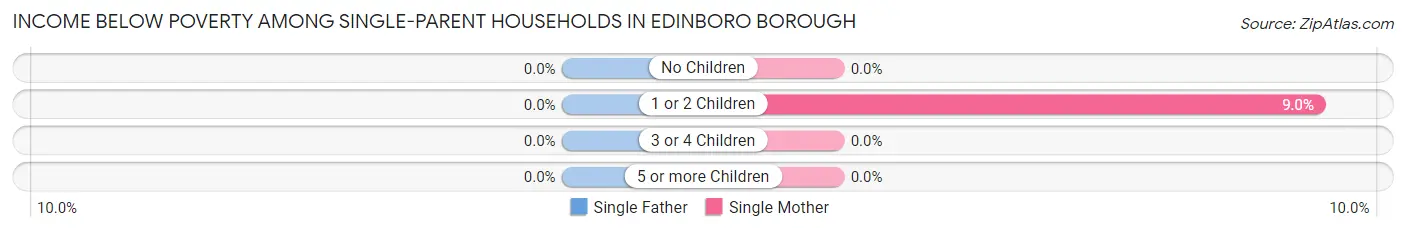
| Children | Single Father | Single Mother |
| No Children | 0 (0.0%) | 0 (0.0%) |
| 1 or 2 Children | 0 (0.0%) | 15 (9.0%) |
| 3 or 4 Children | 0 (0.0%) | 0 (0.0%) |
| 5 or more Children | 0 (0.0%) | 0 (0.0%) |
| Total | 0 (0.0%) | 15 (8.2%) |
Income Below Poverty Among Married-Couple vs Single-Parent Households in Edinboro borough
The poverty data for Edinboro borough shows that 15 of the married-couple family households (2.2%) and 15 of the single-parent households (8.2%) are living below the poverty level. Within the married-couple family households, those with 3 or 4 children have the highest poverty rate, with 15 households (19.5%) falling below the poverty line. Among the single-parent households, those with 1 or 2 children have the highest poverty rate, with 15 household (9.0%) living below poverty.
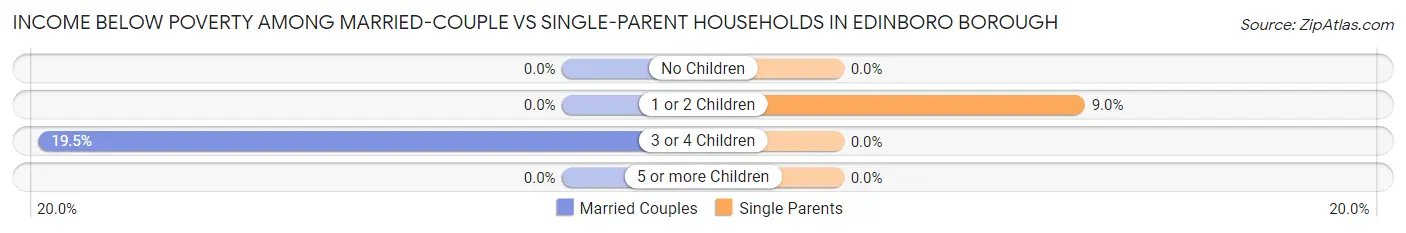
| Children | Married-Couple Families | Single-Parent Households |
| No Children | 0 (0.0%) | 0 (0.0%) |
| 1 or 2 Children | 0 (0.0%) | 15 (9.0%) |
| 3 or 4 Children | 15 (19.5%) | 0 (0.0%) |
| 5 or more Children | 0 (0.0%) | 0 (0.0%) |
| Total | 15 (2.2%) | 15 (8.2%) |
Race in Edinboro borough
The most populous races in Edinboro borough are White / Caucasian (4,715 | 95.1%), Two or more Races (125 | 2.5%), and Hispanic or Latino (105 | 2.1%).
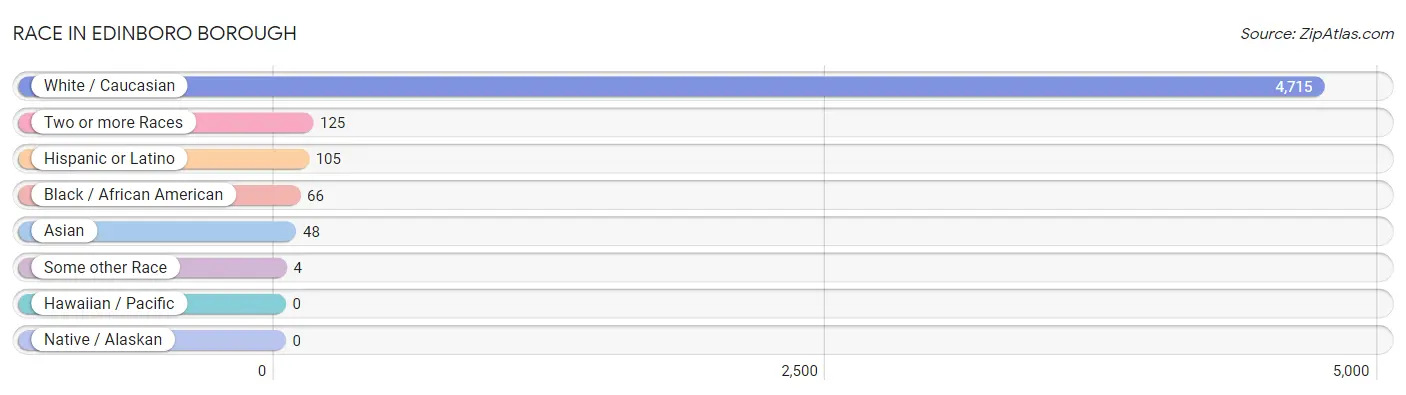
| Race | # Population | % Population |
| Asian | 48 | 1.0% |
| Black / African American | 66 | 1.3% |
| Hawaiian / Pacific | 0 | 0.0% |
| Hispanic or Latino | 105 | 2.1% |
| Native / Alaskan | 0 | 0.0% |
| White / Caucasian | 4,715 | 95.1% |
| Two or more Races | 125 | 2.5% |
| Some other Race | 4 | 0.1% |
| Total | 4,958 | 100.0% |
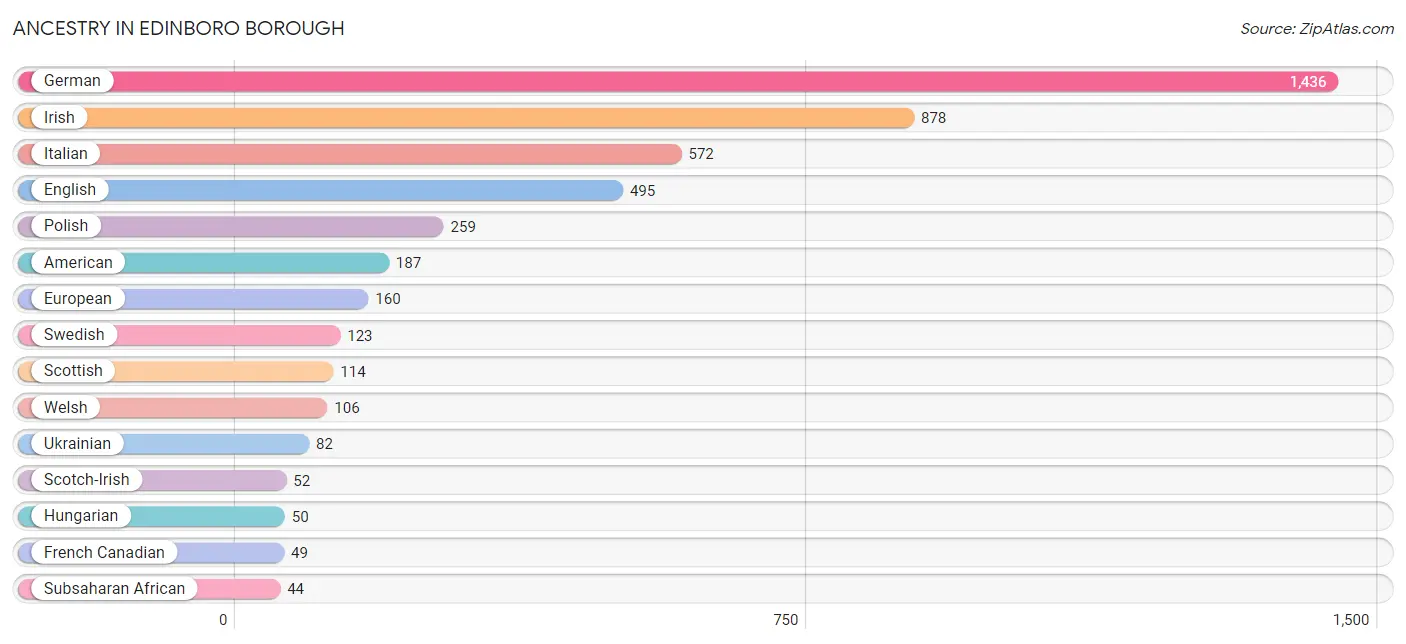
Ancestry in Edinboro borough
The most populous ancestries reported in Edinboro borough are German (1,436 | 29.0%), Irish (878 | 17.7%), Italian (572 | 11.5%), English (495 | 10.0%), and Polish (259 | 5.2%), together accounting for 73.4% of all Edinboro borough residents.
| Ancestry | # Population | % Population |
| African | 14 | 0.3% |
| American | 187 | 3.8% |
| British | 23 | 0.5% |
| Burmese | 10 | 0.2% |
| Central American | 37 | 0.7% |
| Central American Indian | 17 | 0.3% |
| Cherokee | 17 | 0.3% |
| Croatian | 24 | 0.5% |
| Czech | 5 | 0.1% |
| Danish | 15 | 0.3% |
| Delaware | 6 | 0.1% |
| Dominican | 9 | 0.2% |
| Ecuadorian | 2 | 0.0% |
| English | 495 | 10.0% |
| European | 160 | 3.2% |
| French | 13 | 0.3% |
| French Canadian | 49 | 1.0% |
| German | 1,436 | 29.0% |
| Guatemalan | 34 | 0.7% |
| Haitian | 3 | 0.1% |
| Honduran | 3 | 0.1% |
| Hungarian | 50 | 1.0% |
| Indian (Asian) | 31 | 0.6% |
| Irish | 878 | 17.7% |
| Iroquois | 17 | 0.3% |
| Italian | 572 | 11.5% |
| Macedonian | 9 | 0.2% |
| Mexican | 40 | 0.8% |
| Mongolian | 7 | 0.1% |
| Pennsylvania German | 4 | 0.1% |
| Polish | 259 | 5.2% |
| Portuguese | 15 | 0.3% |
| Puerto Rican | 13 | 0.3% |
| Romanian | 17 | 0.3% |
| Scandinavian | 4 | 0.1% |
| Scotch-Irish | 52 | 1.1% |
| Scottish | 114 | 2.3% |
| Senegalese | 27 | 0.5% |
| Serbian | 8 | 0.2% |
| Slovak | 13 | 0.3% |
| South American | 6 | 0.1% |
| Subsaharan African | 44 | 0.9% |
| Swedish | 123 | 2.5% |
| Ukrainian | 82 | 1.7% |
| Venezuelan | 4 | 0.1% |
| Vietnamese | 7 | 0.1% |
| Welsh | 106 | 2.1% |
| West Indian | 8 | 0.2% | View All 48 Rows |
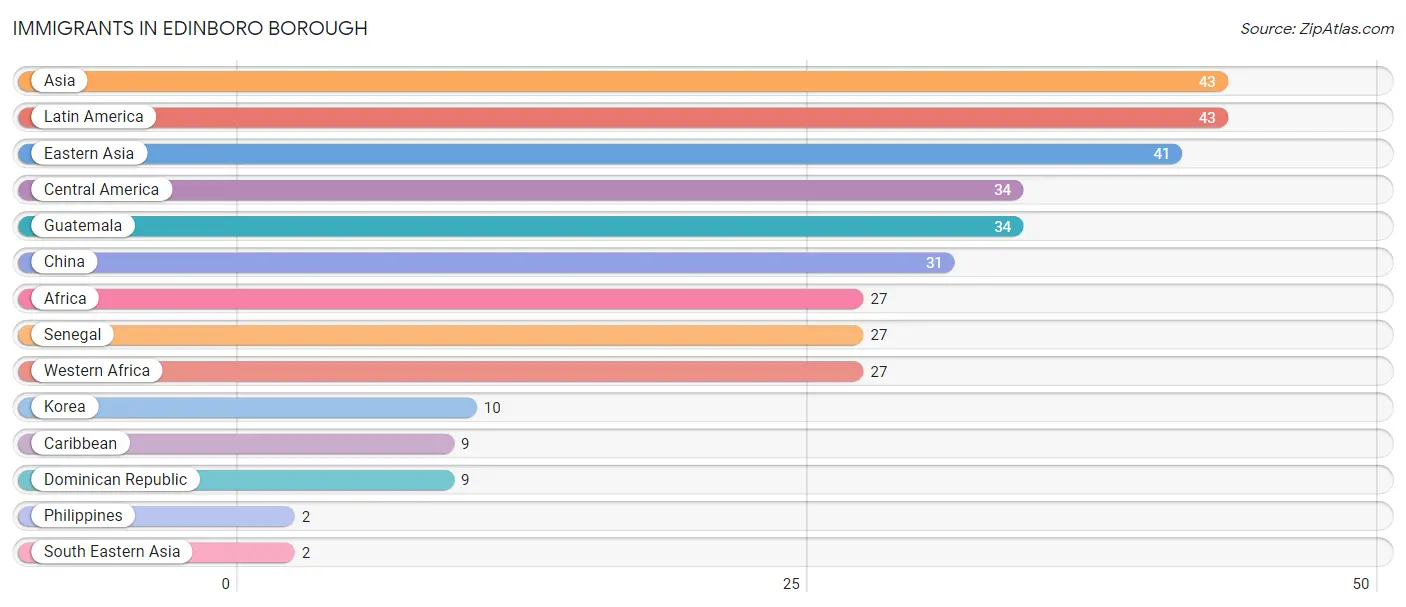
Immigrants in Edinboro borough
The most numerous immigrant groups reported in Edinboro borough came from Asia (43 | 0.9%), Latin America (43 | 0.9%), Eastern Asia (41 | 0.8%), Central America (34 | 0.7%), and Guatemala (34 | 0.7%), together accounting for 4.0% of all Edinboro borough residents.
| Immigration Origin | # Population | % Population |
| Africa | 27 | 0.5% |
| Asia | 43 | 0.9% |
| Caribbean | 9 | 0.2% |
| Central America | 34 | 0.7% |
| China | 31 | 0.6% |
| Dominican Republic | 9 | 0.2% |
| Eastern Asia | 41 | 0.8% |
| Guatemala | 34 | 0.7% |
| Korea | 10 | 0.2% |
| Latin America | 43 | 0.9% |
| Philippines | 2 | 0.0% |
| Senegal | 27 | 0.5% |
| South Eastern Asia | 2 | 0.0% |
| Western Africa | 27 | 0.5% | View All 14 Rows |
Sex and Age in Edinboro borough
Sex and Age in Edinboro borough
The most populous age groups in Edinboro borough are 20 to 24 Years (531 | 24.5%) for men and 20 to 24 Years (797 | 28.6%) for women.
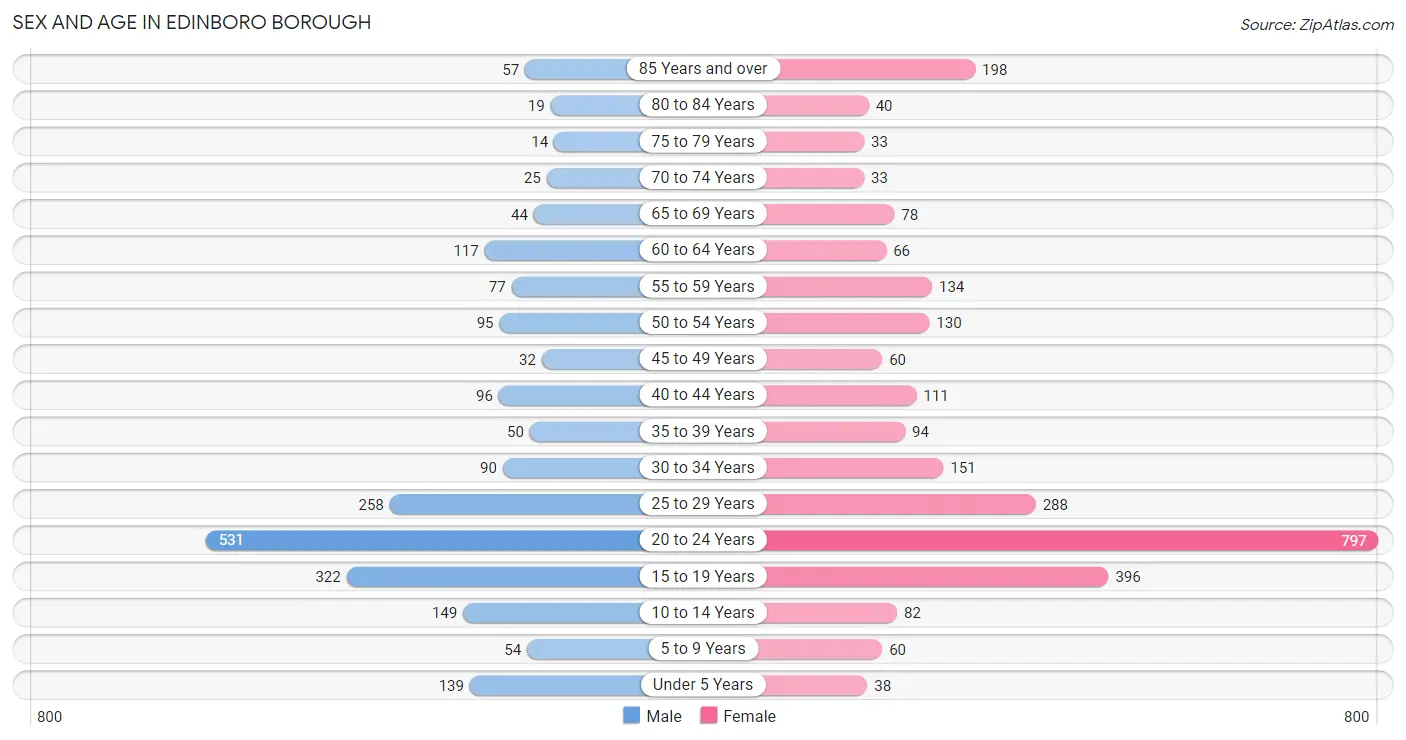
| Age Bracket | Male | Female |
| Under 5 Years | 139 (6.4%) | 38 (1.4%) |
| 5 to 9 Years | 54 (2.5%) | 60 (2.1%) |
| 10 to 14 Years | 149 (6.9%) | 82 (2.9%) |
| 15 to 19 Years | 322 (14.8%) | 396 (14.2%) |
| 20 to 24 Years | 531 (24.5%) | 797 (28.6%) |
| 25 to 29 Years | 258 (11.9%) | 288 (10.3%) |
| 30 to 34 Years | 90 (4.2%) | 151 (5.4%) |
| 35 to 39 Years | 50 (2.3%) | 94 (3.4%) |
| 40 to 44 Years | 96 (4.4%) | 111 (4.0%) |
| 45 to 49 Years | 32 (1.5%) | 60 (2.1%) |
| 50 to 54 Years | 95 (4.4%) | 130 (4.7%) |
| 55 to 59 Years | 77 (3.5%) | 134 (4.8%) |
| 60 to 64 Years | 117 (5.4%) | 66 (2.4%) |
| 65 to 69 Years | 44 (2.0%) | 78 (2.8%) |
| 70 to 74 Years | 25 (1.1%) | 33 (1.2%) |
| 75 to 79 Years | 14 (0.6%) | 33 (1.2%) |
| 80 to 84 Years | 19 (0.9%) | 40 (1.4%) |
| 85 Years and over | 57 (2.6%) | 198 (7.1%) |
| Total | 2,169 (100.0%) | 2,789 (100.0%) |
Families and Households in Edinboro borough
Median Family Size in Edinboro borough
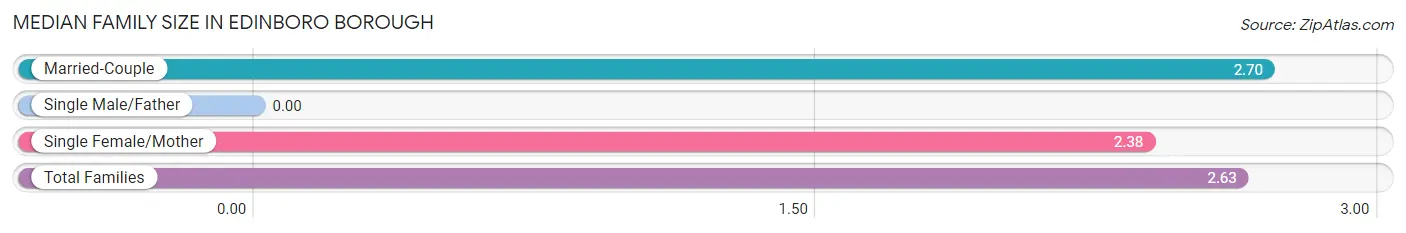
| Family Type | # Families | Family Size |
| Married-Couple | 679 (78.9%) | 2.70 |
| Single Male/Father | 0 (0.0%) | - |
| Single Female/Mother | 182 (21.1%) | 2.38 |
| Total Families | 861 (100.0%) | 2.63 |
Median Household Size in Edinboro borough
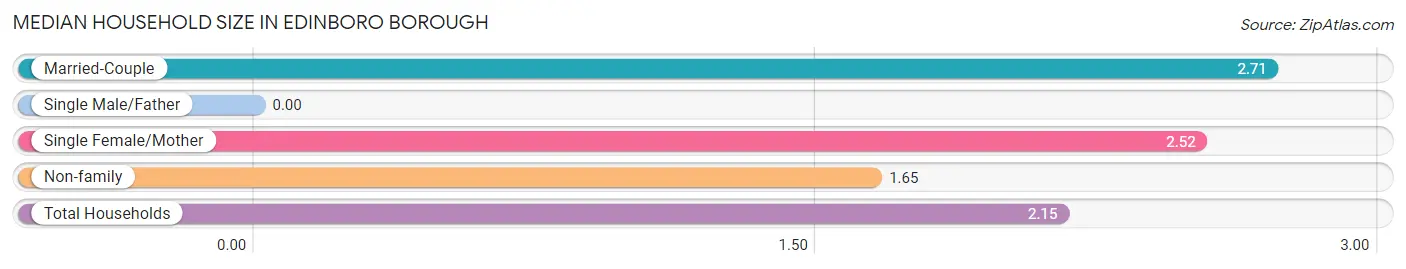
| Household Type | # Households | Household Size |
| Married-Couple | 679 (38.4%) | 2.71 |
| Single Male/Father | 0 (0.0%) | - |
| Single Female/Mother | 182 (10.3%) | 2.52 |
| Non-family | 906 (51.3%) | 1.65 |
| Total Households | 1,767 (100.0%) | 2.15 |
Household Size by Marriage Status in Edinboro borough
Out of a total of 1,767 households in Edinboro borough, 861 (48.7%) are family households, while 906 (51.3%) are nonfamily households. The most numerous type of family households are 2-person households, comprising 530, and the most common type of nonfamily households are 1-person households, comprising 576.
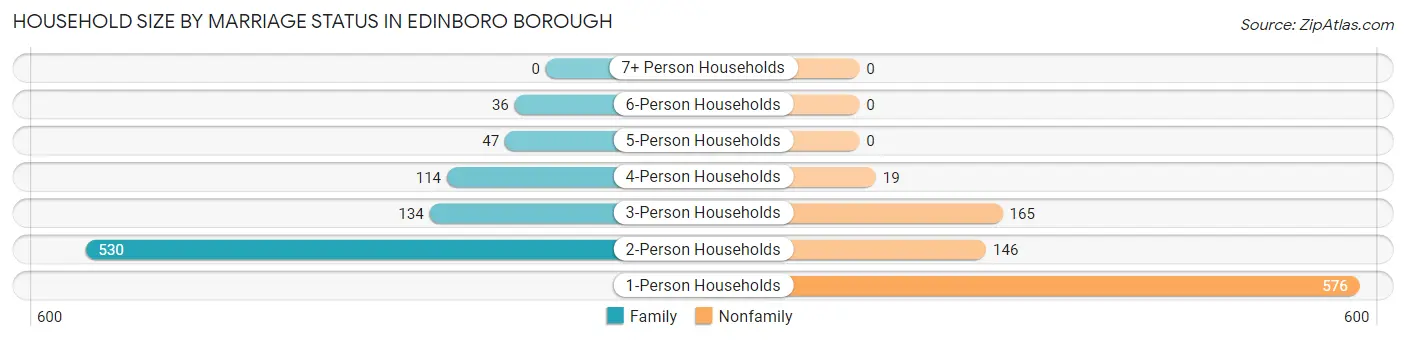
| Household Size | Family Households | Nonfamily Households |
| 1-Person Households | - | 576 (32.6%) |
| 2-Person Households | 530 (30.0%) | 146 (8.3%) |
| 3-Person Households | 134 (7.6%) | 165 (9.3%) |
| 4-Person Households | 114 (6.5%) | 19 (1.1%) |
| 5-Person Households | 47 (2.7%) | 0 (0.0%) |
| 6-Person Households | 36 (2.0%) | 0 (0.0%) |
| 7+ Person Households | 0 (0.0%) | 0 (0.0%) |
| Total | 861 (48.7%) | 906 (51.3%) |
Female Fertility in Edinboro borough
Fertility by Age in Edinboro borough
Average fertility rate in Edinboro borough is 17.0 births per 1,000 women. Women in the age bracket of 35 to 50 years have the highest fertility rate with 89.0 births per 1,000 women. Women in the age bracket of 35 to 50 years acount for 75.0% of all women with births.
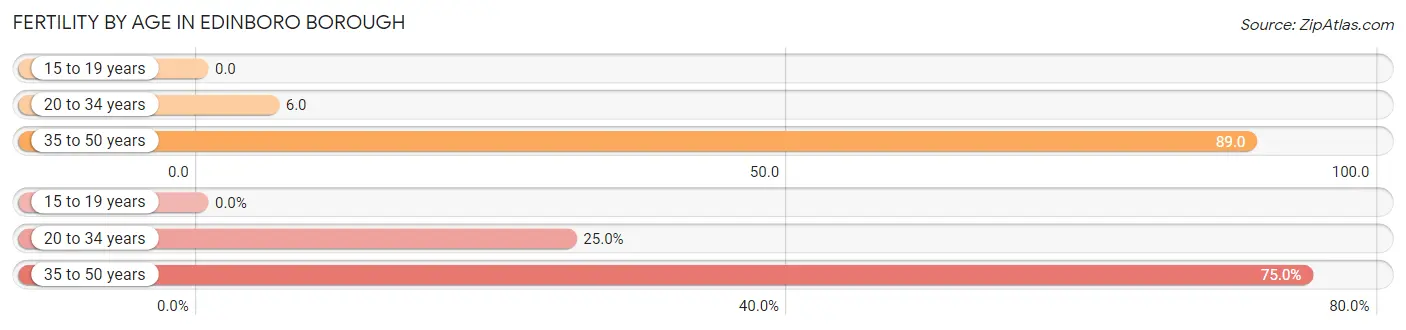
| Age Bracket | Women with Births | Births / 1,000 Women |
| 15 to 19 years | 0 (0.0%) | 0.0 |
| 20 to 34 years | 8 (25.0%) | 6.0 |
| 35 to 50 years | 24 (75.0%) | 89.0 |
| Total | 32 (100.0%) | 17.0 |
Fertility by Age by Marriage Status in Edinboro borough
25.0% of women with births (32) in Edinboro borough are married. The highest percentage of unmarried women with births falls into 35 to 50 years age bracket with 100.0% of them unmarried at the time of birth, while the lowest percentage of unmarried women with births belong to 20 to 34 years age bracket with 0.0% of them unmarried.
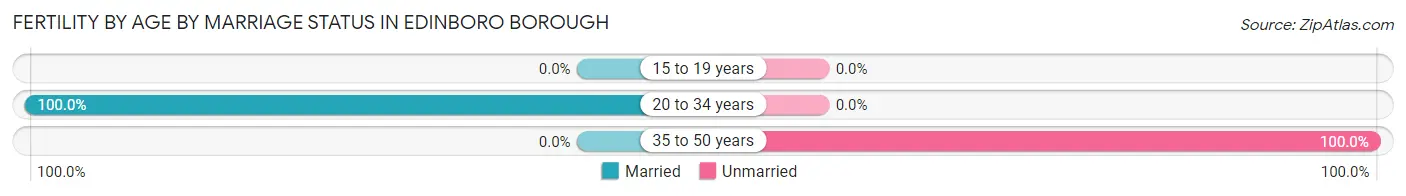
| Age Bracket | Married | Unmarried |
| 15 to 19 years | 0 (0.0%) | 0 (0.0%) |
| 20 to 34 years | 8 (100.0%) | 0 (0.0%) |
| 35 to 50 years | 0 (0.0%) | 24 (100.0%) |
| Total | 8 (25.0%) | 24 (75.0%) |
Fertility by Education in Edinboro borough
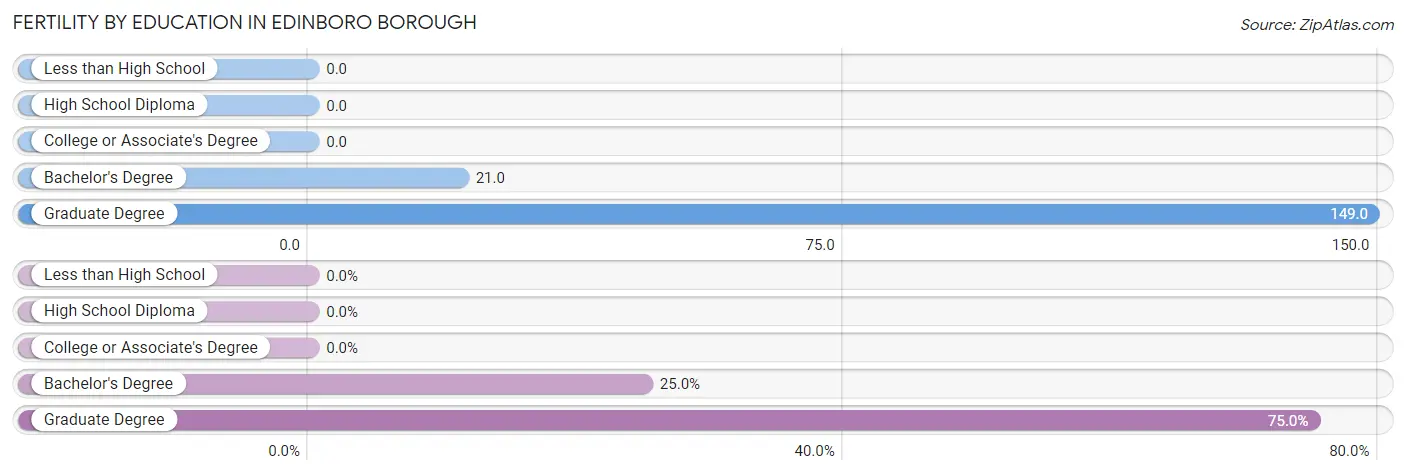
| Educational Attainment | Women with Births | Births / 1,000 Women |
| Less than High School | 0 (0.0%) | 0.0 |
| High School Diploma | 0 (0.0%) | 0.0 |
| College or Associate's Degree | 0 (0.0%) | 0.0 |
| Bachelor's Degree | 8 (25.0%) | 21.0 |
| Graduate Degree | 24 (75.0%) | 149.0 |
| Total | 32 (100.0%) | 17.0 |
Fertility by Education by Marriage Status in Edinboro borough
75.0% of women with births in Edinboro borough are unmarried. Women with the educational attainment of bachelor's degree are most likely to be married with 100.0% of them married at childbirth, while women with the educational attainment of graduate degree are least likely to be married with 100.0% of them unmarried at childbirth.
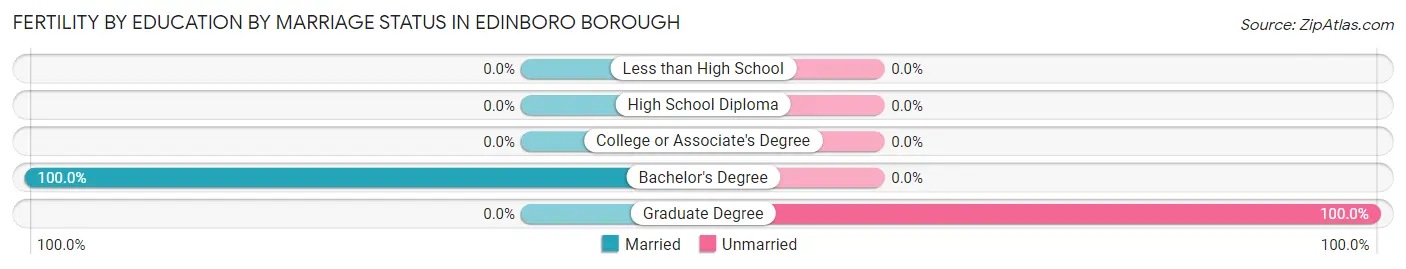
| Educational Attainment | Married | Unmarried |
| Less than High School | 0 (0.0%) | 0 (0.0%) |
| High School Diploma | 0 (0.0%) | 0 (0.0%) |
| College or Associate's Degree | 0 (0.0%) | 0 (0.0%) |
| Bachelor's Degree | 8 (100.0%) | 0 (0.0%) |
| Graduate Degree | 0 (0.0%) | 24 (100.0%) |
| Total | 8 (25.0%) | 24 (75.0%) |
Employment Characteristics in Edinboro borough
Employment by Class of Employer in Edinboro borough
Among the 2,137 employed individuals in Edinboro borough, private company employees (1,124 | 52.6%), not-for-profit organizations (323 | 15.1%), and local government employees (243 | 11.4%) make up the most common classes of employment.
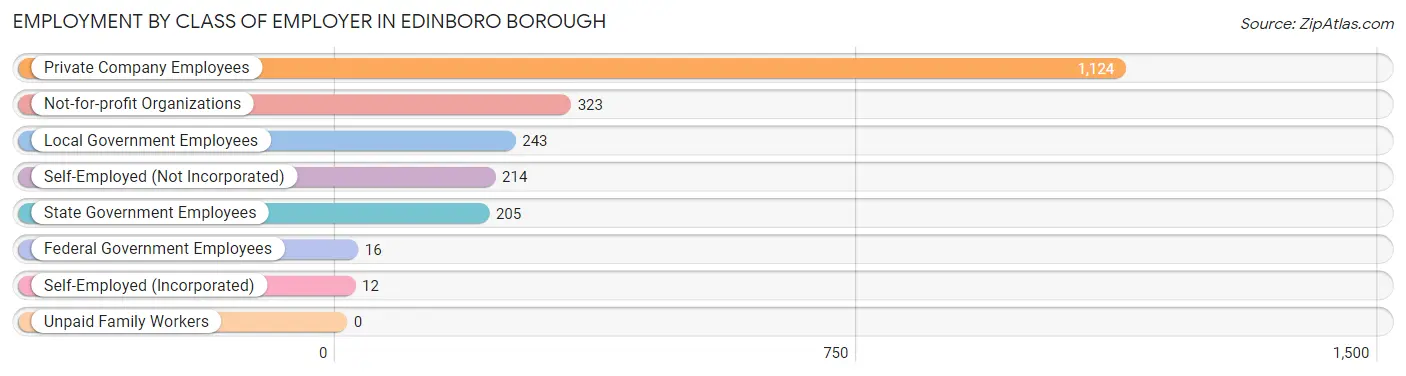
| Employer Class | # Employees | % Employees |
| Private Company Employees | 1,124 | 52.6% |
| Self-Employed (Incorporated) | 12 | 0.6% |
| Self-Employed (Not Incorporated) | 214 | 10.0% |
| Not-for-profit Organizations | 323 | 15.1% |
| Local Government Employees | 243 | 11.4% |
| State Government Employees | 205 | 9.6% |
| Federal Government Employees | 16 | 0.7% |
| Unpaid Family Workers | 0 | 0.0% |
| Total | 2,137 | 100.0% |
Employment Status by Age in Edinboro borough
According to the labor force statistics for Edinboro borough, out of the total population over 16 years of age (4,415), 50.4% or 2,225 individuals are in the labor force, with 2.2% or 49 of them unemployed. The age group with the highest labor force participation rate is 35 to 44 years, with 95.2% or 334 individuals in the labor force. Within the labor force, the 16 to 19 years age range has the highest percentage of unemployed individuals, with 19.1% or 36 of them being unemployed.
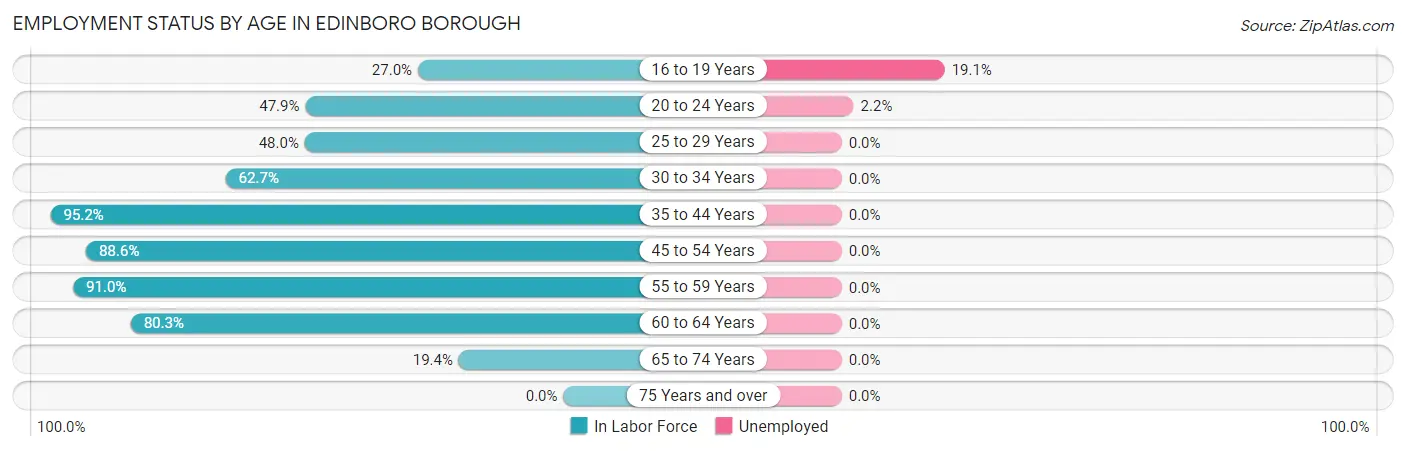
| Age Bracket | In Labor Force | Unemployed |
| 16 to 19 Years | 188 (27.0%) | 36 (19.1%) |
| 20 to 24 Years | 636 (47.9%) | 14 (2.2%) |
| 25 to 29 Years | 262 (48.0%) | 0 (0.0%) |
| 30 to 34 Years | 151 (62.7%) | 0 (0.0%) |
| 35 to 44 Years | 334 (95.2%) | 0 (0.0%) |
| 45 to 54 Years | 281 (88.6%) | 0 (0.0%) |
| 55 to 59 Years | 192 (91.0%) | 0 (0.0%) |
| 60 to 64 Years | 147 (80.3%) | 0 (0.0%) |
| 65 to 74 Years | 35 (19.4%) | 0 (0.0%) |
| 75 Years and over | 0 (0.0%) | 0 (0.0%) |
| Total | 2,225 (50.4%) | 49 (2.2%) |
Employment Status by Educational Attainment in Edinboro borough
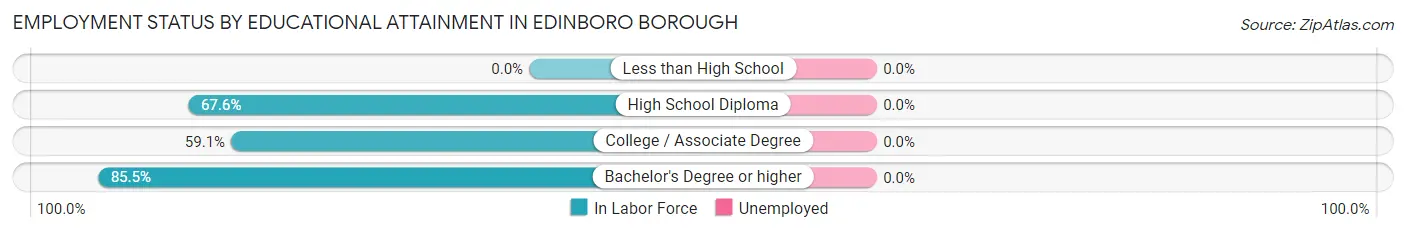
| Educational Attainment | In Labor Force | Unemployed |
| Less than High School | 0 (0.0%) | 0 (0.0%) |
| High School Diploma | 75 (67.6%) | 0 (0.0%) |
| College / Associate Degree | 301 (59.1%) | 0 (0.0%) |
| Bachelor's Degree or higher | 991 (85.5%) | 0 (0.0%) |
| Total | 1,366 (73.9%) | 0 (0.0%) |
Employment Occupations by Sex in Edinboro borough
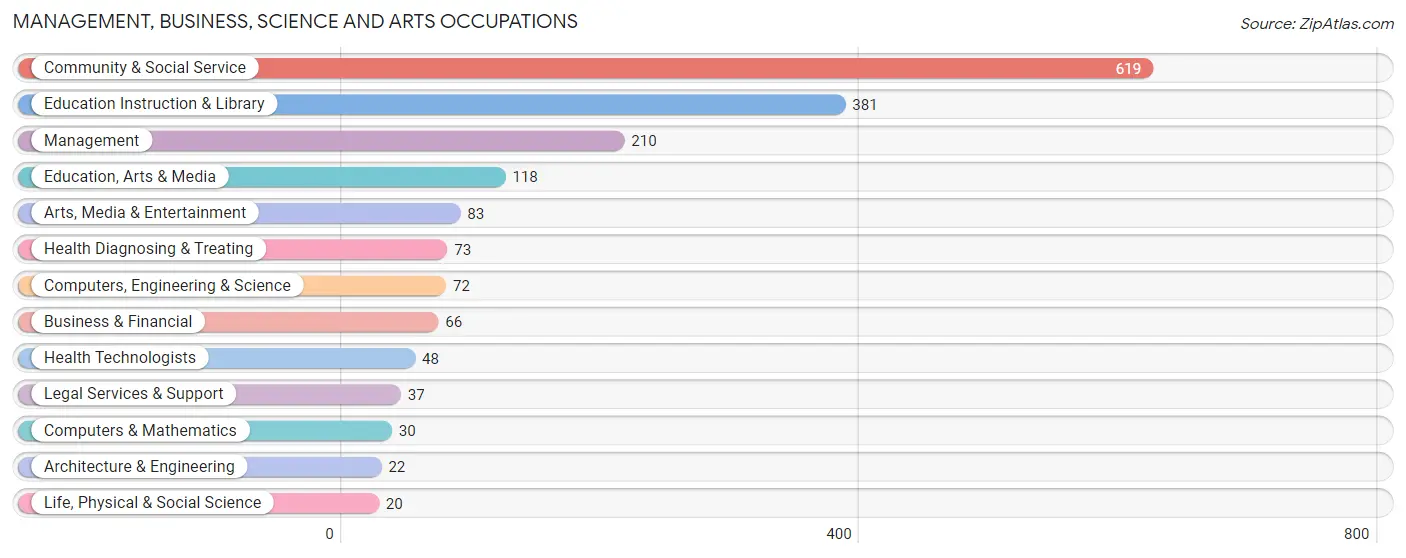
Management, Business, Science and Arts Occupations
The most common Management, Business, Science and Arts occupations in Edinboro borough are Community & Social Service (619 | 28.4%), Education Instruction & Library (381 | 17.5%), Management (210 | 9.7%), Education, Arts & Media (118 | 5.4%), and Arts, Media & Entertainment (83 | 3.8%).
Management, Business, Science and Arts Occupations by Sex
Within the Management, Business, Science and Arts occupations in Edinboro borough, the most male-oriented occupations are Life, Physical & Social Science (100.0%), Computers & Mathematics (76.7%), and Computers, Engineering & Science (59.7%), while the most female-oriented occupations are Architecture & Engineering (100.0%), Legal Services & Support (100.0%), and Health Diagnosing & Treating (84.9%).
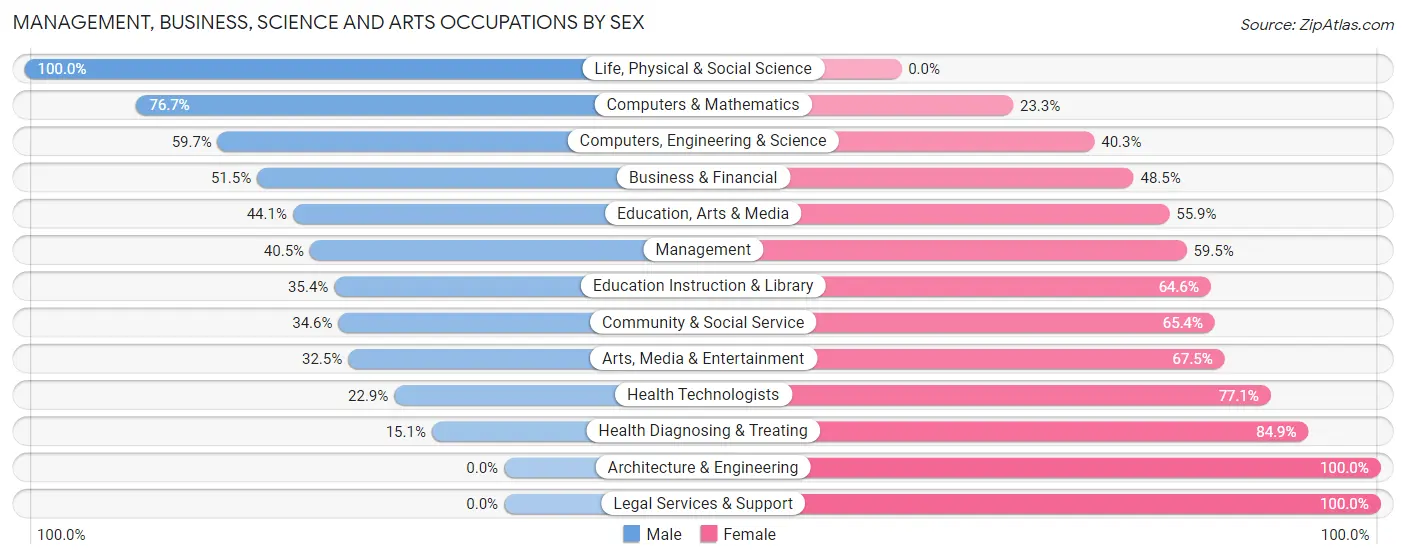
| Occupation | Male | Female |
| Management | 85 (40.5%) | 125 (59.5%) |
| Business & Financial | 34 (51.5%) | 32 (48.5%) |
| Computers, Engineering & Science | 43 (59.7%) | 29 (40.3%) |
| Computers & Mathematics | 23 (76.7%) | 7 (23.3%) |
| Architecture & Engineering | 0 (0.0%) | 22 (100.0%) |
| Life, Physical & Social Science | 20 (100.0%) | 0 (0.0%) |
| Community & Social Service | 214 (34.6%) | 405 (65.4%) |
| Education, Arts & Media | 52 (44.1%) | 66 (55.9%) |
| Legal Services & Support | 0 (0.0%) | 37 (100.0%) |
| Education Instruction & Library | 135 (35.4%) | 246 (64.6%) |
| Arts, Media & Entertainment | 27 (32.5%) | 56 (67.5%) |
| Health Diagnosing & Treating | 11 (15.1%) | 62 (84.9%) |
| Health Technologists | 11 (22.9%) | 37 (77.1%) |
| Total (Category) | 387 (37.2%) | 653 (62.8%) |
| Total (Overall) | 904 (41.5%) | 1,272 (58.5%) |
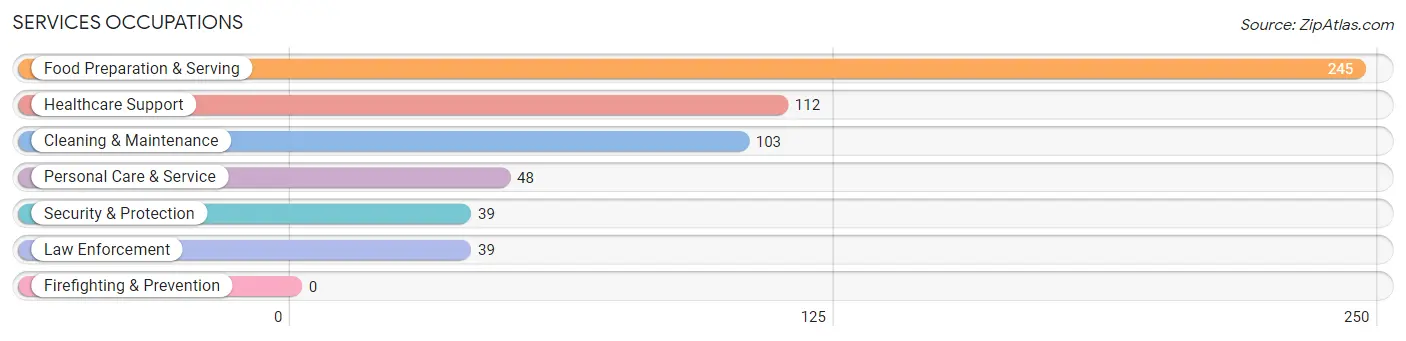
Services Occupations
The most common Services occupations in Edinboro borough are Food Preparation & Serving (245 | 11.3%), Healthcare Support (112 | 5.1%), Cleaning & Maintenance (103 | 4.7%), Personal Care & Service (48 | 2.2%), and Security & Protection (39 | 1.8%).
Services Occupations by Sex
Within the Services occupations in Edinboro borough, the most male-oriented occupations are Security & Protection (100.0%), Law Enforcement (100.0%), and Cleaning & Maintenance (73.8%), while the most female-oriented occupations are Personal Care & Service (100.0%), Healthcare Support (85.7%), and Food Preparation & Serving (78.8%).
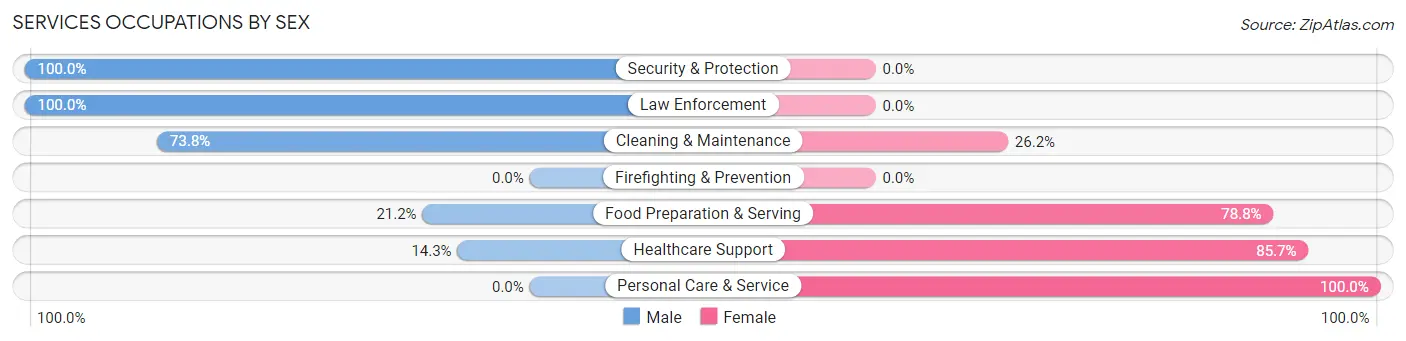
| Occupation | Male | Female |
| Healthcare Support | 16 (14.3%) | 96 (85.7%) |
| Security & Protection | 39 (100.0%) | 0 (0.0%) |
| Firefighting & Prevention | 0 (0.0%) | 0 (0.0%) |
| Law Enforcement | 39 (100.0%) | 0 (0.0%) |
| Food Preparation & Serving | 52 (21.2%) | 193 (78.8%) |
| Cleaning & Maintenance | 76 (73.8%) | 27 (26.2%) |
| Personal Care & Service | 0 (0.0%) | 48 (100.0%) |
| Total (Category) | 183 (33.5%) | 364 (66.5%) |
| Total (Overall) | 904 (41.5%) | 1,272 (58.5%) |
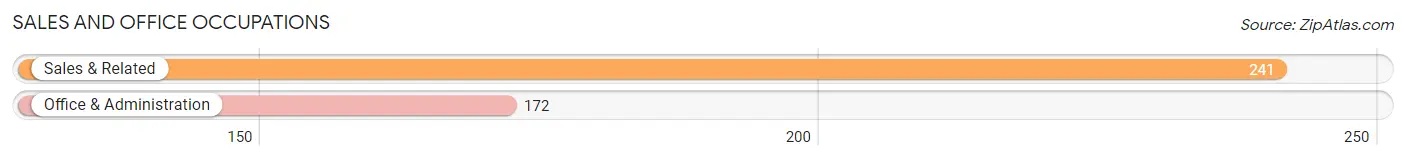
Sales and Office Occupations
The most common Sales and Office occupations in Edinboro borough are Sales & Related (241 | 11.1%), and Office & Administration (172 | 7.9%).
Sales and Office Occupations by Sex
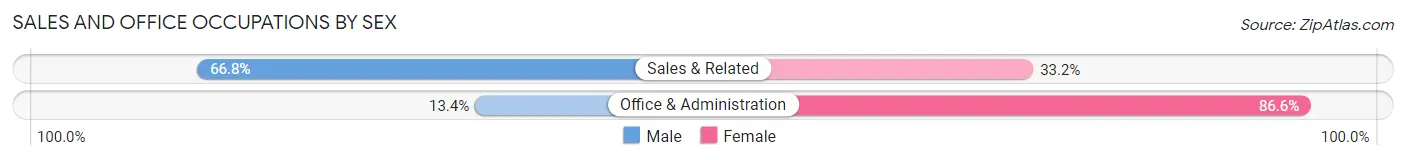
| Occupation | Male | Female |
| Sales & Related | 161 (66.8%) | 80 (33.2%) |
| Office & Administration | 23 (13.4%) | 149 (86.6%) |
| Total (Category) | 184 (44.6%) | 229 (55.4%) |
| Total (Overall) | 904 (41.5%) | 1,272 (58.5%) |
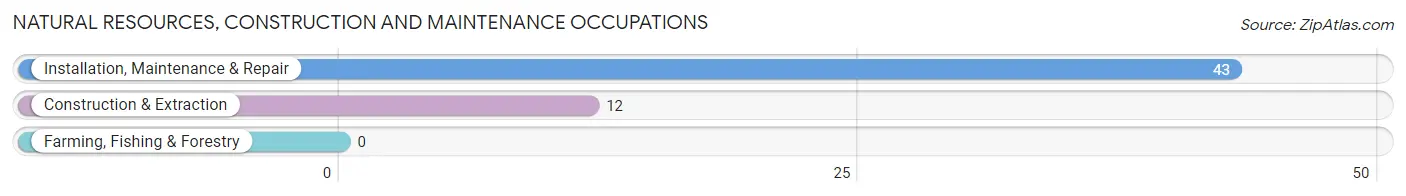
Natural Resources, Construction and Maintenance Occupations
The most common Natural Resources, Construction and Maintenance occupations in Edinboro borough are Installation, Maintenance & Repair (43 | 2.0%), and Construction & Extraction (12 | 0.5%).
Natural Resources, Construction and Maintenance Occupations by Sex
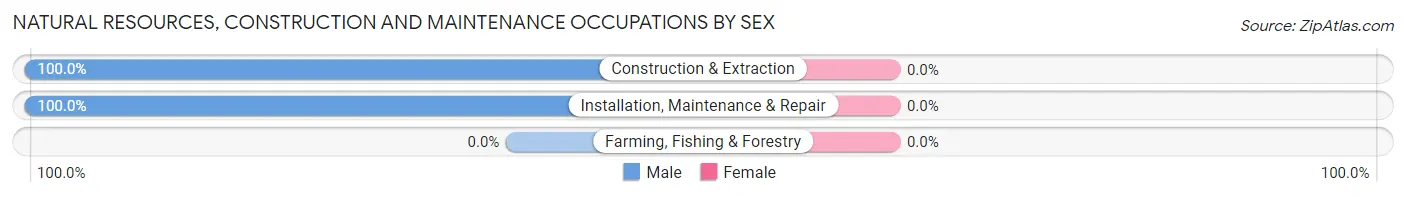
| Occupation | Male | Female |
| Farming, Fishing & Forestry | 0 (0.0%) | 0 (0.0%) |
| Construction & Extraction | 12 (100.0%) | 0 (0.0%) |
| Installation, Maintenance & Repair | 43 (100.0%) | 0 (0.0%) |
| Total (Category) | 55 (100.0%) | 0 (0.0%) |
| Total (Overall) | 904 (41.5%) | 1,272 (58.5%) |
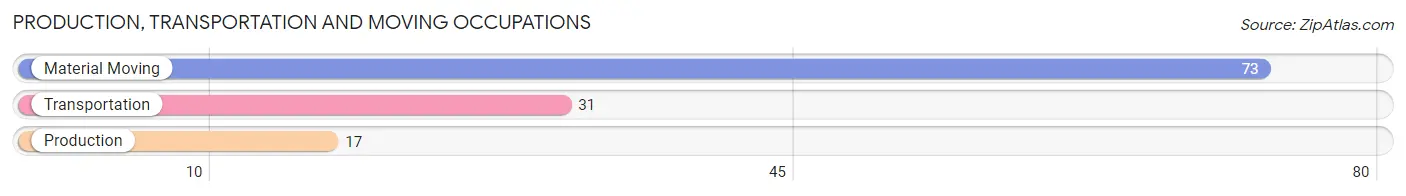
Production, Transportation and Moving Occupations
The most common Production, Transportation and Moving occupations in Edinboro borough are Material Moving (73 | 3.4%), Transportation (31 | 1.4%), and Production (17 | 0.8%).
Production, Transportation and Moving Occupations by Sex
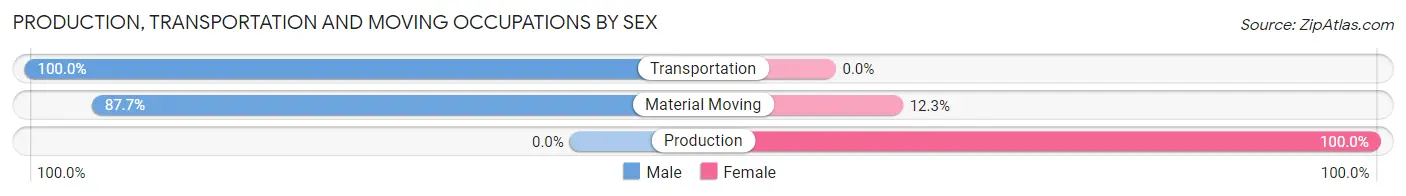
| Occupation | Male | Female |
| Production | 0 (0.0%) | 17 (100.0%) |
| Transportation | 31 (100.0%) | 0 (0.0%) |
| Material Moving | 64 (87.7%) | 9 (12.3%) |
| Total (Category) | 95 (78.5%) | 26 (21.5%) |
| Total (Overall) | 904 (41.5%) | 1,272 (58.5%) |
Employment Industries by Sex in Edinboro borough
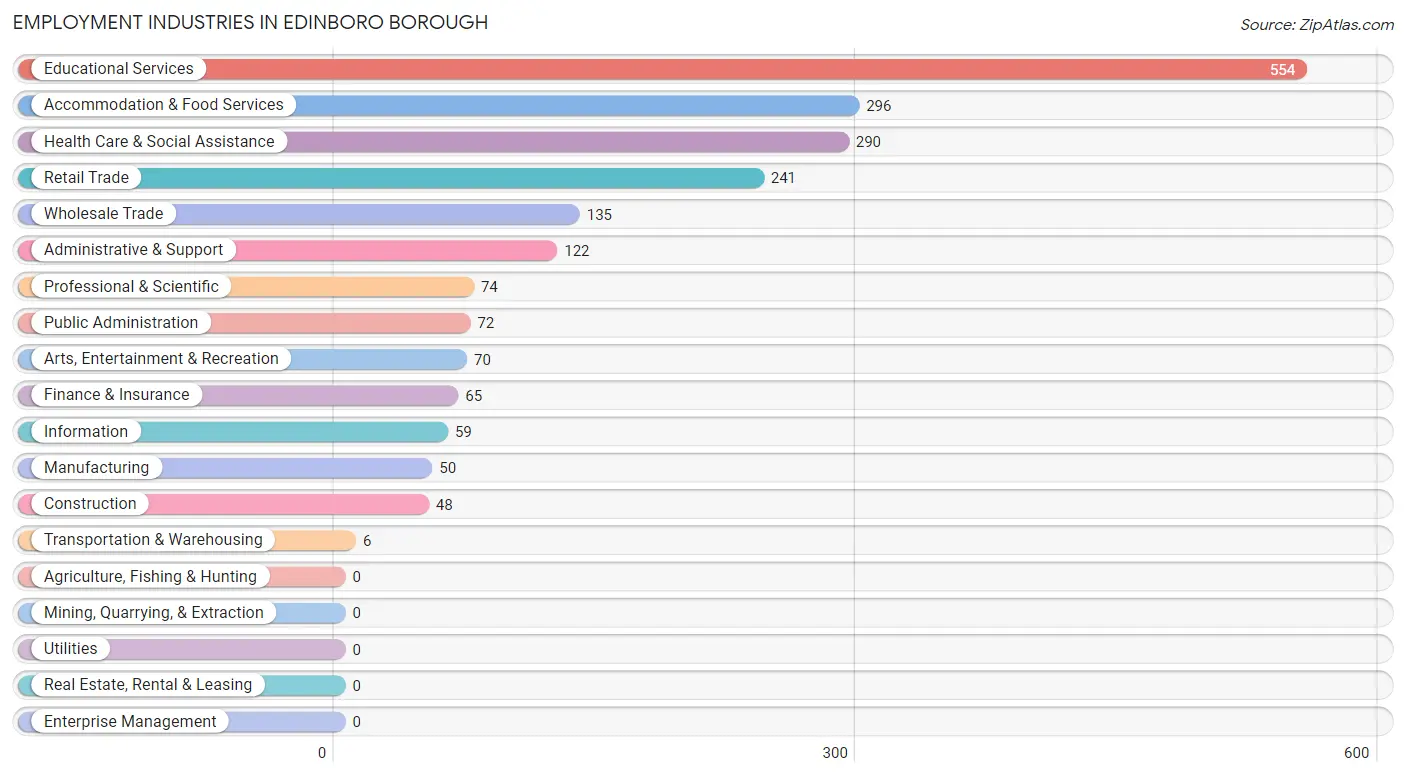
Employment Industries in Edinboro borough
The major employment industries in Edinboro borough include Educational Services (554 | 25.5%), Accommodation & Food Services (296 | 13.6%), Health Care & Social Assistance (290 | 13.3%), Retail Trade (241 | 11.1%), and Wholesale Trade (135 | 6.2%).
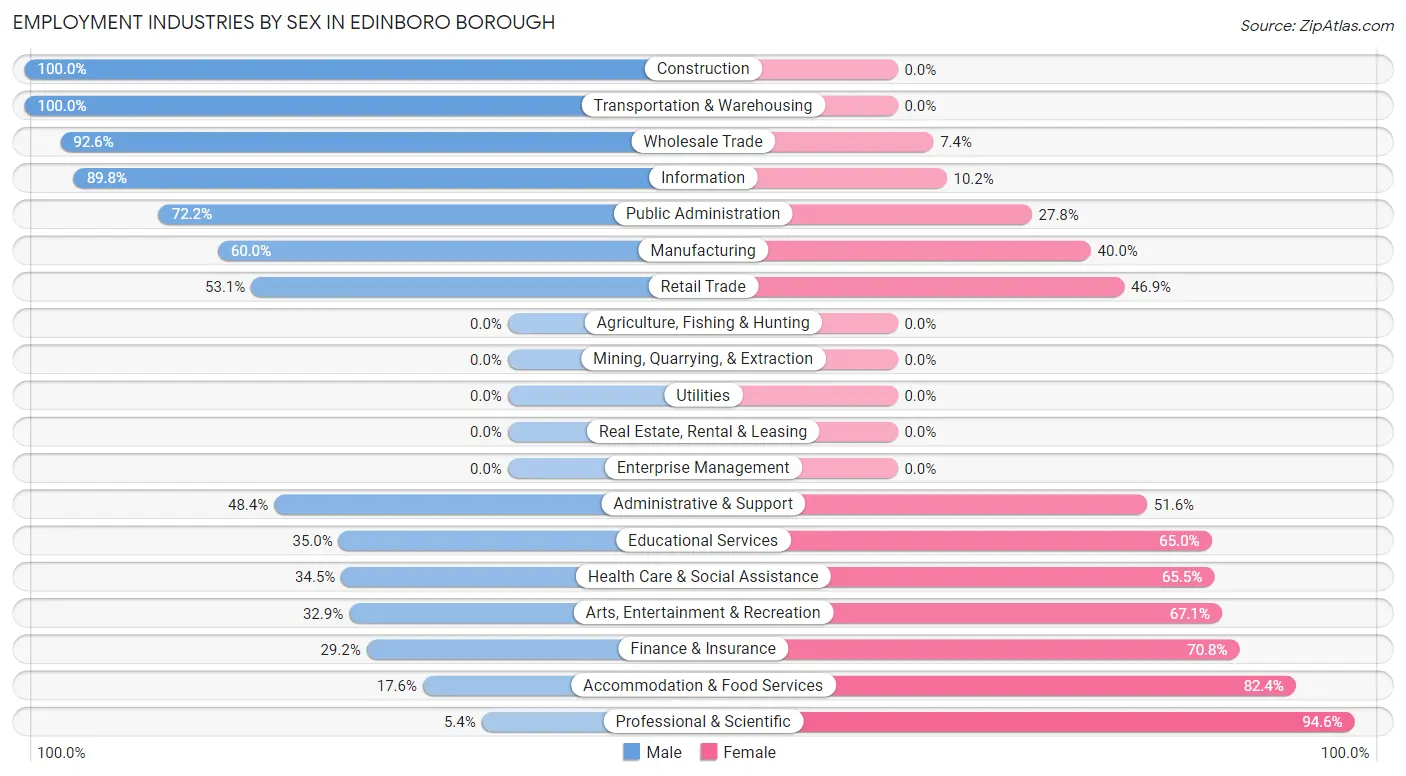
Employment Industries by Sex in Edinboro borough
The Edinboro borough industries that see more men than women are Construction (100.0%), Transportation & Warehousing (100.0%), and Wholesale Trade (92.6%), whereas the industries that tend to have a higher number of women are Professional & Scientific (94.6%), Accommodation & Food Services (82.4%), and Finance & Insurance (70.8%).
| Industry | Male | Female |
| Agriculture, Fishing & Hunting | 0 (0.0%) | 0 (0.0%) |
| Mining, Quarrying, & Extraction | 0 (0.0%) | 0 (0.0%) |
| Construction | 48 (100.0%) | 0 (0.0%) |
| Manufacturing | 30 (60.0%) | 20 (40.0%) |
| Wholesale Trade | 125 (92.6%) | 10 (7.4%) |
| Retail Trade | 128 (53.1%) | 113 (46.9%) |
| Transportation & Warehousing | 6 (100.0%) | 0 (0.0%) |
| Utilities | 0 (0.0%) | 0 (0.0%) |
| Information | 53 (89.8%) | 6 (10.2%) |
| Finance & Insurance | 19 (29.2%) | 46 (70.8%) |
| Real Estate, Rental & Leasing | 0 (0.0%) | 0 (0.0%) |
| Professional & Scientific | 4 (5.4%) | 70 (94.6%) |
| Enterprise Management | 0 (0.0%) | 0 (0.0%) |
| Administrative & Support | 59 (48.4%) | 63 (51.6%) |
| Educational Services | 194 (35.0%) | 360 (65.0%) |
| Health Care & Social Assistance | 100 (34.5%) | 190 (65.5%) |
| Arts, Entertainment & Recreation | 23 (32.9%) | 47 (67.1%) |
| Accommodation & Food Services | 52 (17.6%) | 244 (82.4%) |
| Public Administration | 52 (72.2%) | 20 (27.8%) |
| Total | 904 (41.5%) | 1,272 (58.5%) |
Education in Edinboro borough
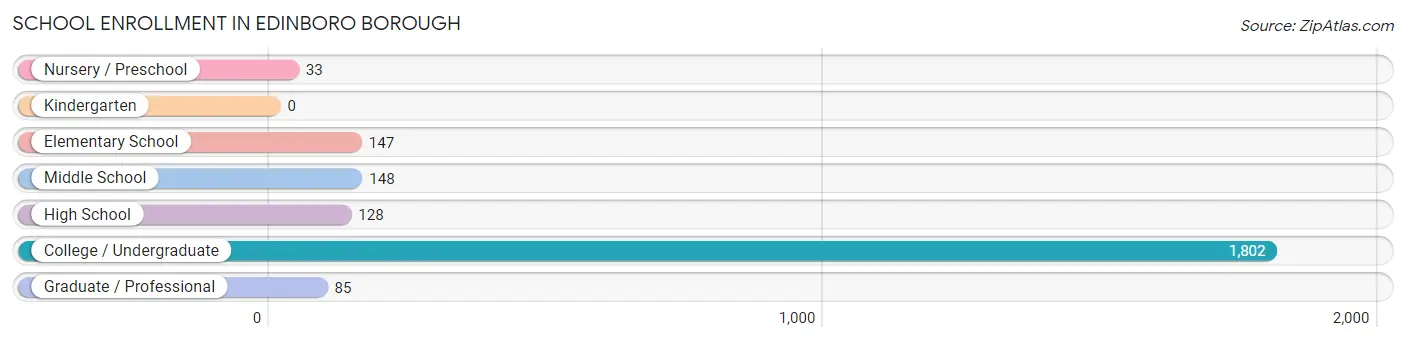
School Enrollment in Edinboro borough
The most common levels of schooling among the 2,343 students in Edinboro borough are college / undergraduate (1,802 | 76.9%), middle school (148 | 6.3%), and elementary school (147 | 6.3%).
| School Level | # Students | % Students |
| Nursery / Preschool | 33 | 1.4% |
| Kindergarten | 0 | 0.0% |
| Elementary School | 147 | 6.3% |
| Middle School | 148 | 6.3% |
| High School | 128 | 5.5% |
| College / Undergraduate | 1,802 | 76.9% |
| Graduate / Professional | 85 | 3.6% |
| Total | 2,343 | 100.0% |
School Enrollment by Age by Funding Source in Edinboro borough
Out of a total of 2,343 students who are enrolled in schools in Edinboro borough, 464 (19.8%) attend a private institution, while the remaining 1,879 (80.2%) are enrolled in public schools. The age group of 15 to 17 year olds has the highest likelihood of being enrolled in private schools, with 21 (35.0% in the age bracket) enrolled. Conversely, the age group of 25 to 34 year olds has the lowest likelihood of being enrolled in a private school, with 92 (100.0% in the age bracket) attending a public institution.
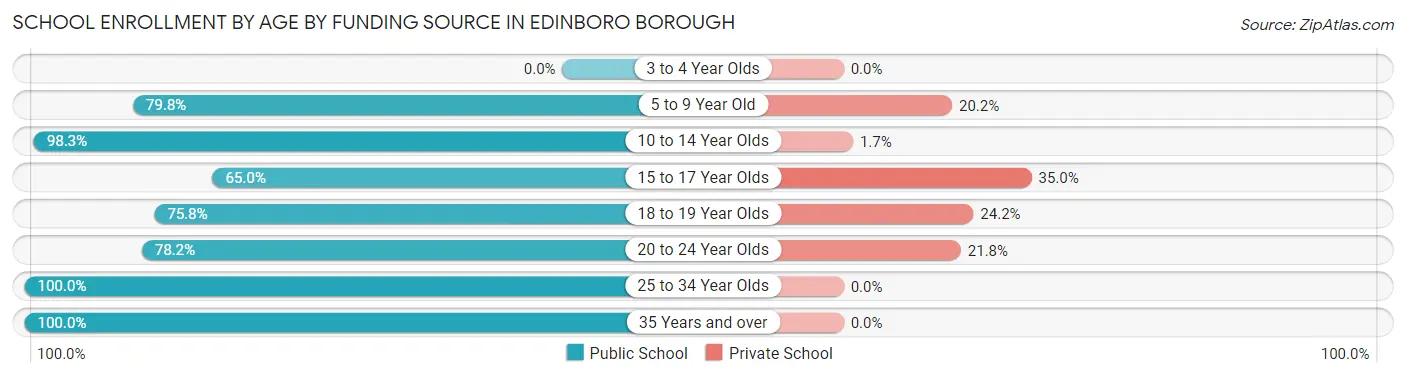
| Age Bracket | Public School | Private School |
| 3 to 4 Year Olds | 0 (0.0%) | 0 (0.0%) |
| 5 to 9 Year Old | 91 (79.8%) | 23 (20.2%) |
| 10 to 14 Year Olds | 227 (98.3%) | 4 (1.7%) |
| 15 to 17 Year Olds | 39 (65.0%) | 21 (35.0%) |
| 18 to 19 Year Olds | 499 (75.8%) | 159 (24.2%) |
| 20 to 24 Year Olds | 924 (78.2%) | 258 (21.8%) |
| 25 to 34 Year Olds | 92 (100.0%) | 0 (0.0%) |
| 35 Years and over | 6 (100.0%) | 0 (0.0%) |
| Total | 1,879 (80.2%) | 464 (19.8%) |
Educational Attainment by Field of Study in Edinboro borough
Education (399 | 26.7%), business (267 | 17.9%), communications (147 | 9.9%), liberal arts & history (106 | 7.1%), and science & technology (104 | 7.0%) are the most common fields of study among 1,492 individuals in Edinboro borough who have obtained a bachelor's degree or higher.
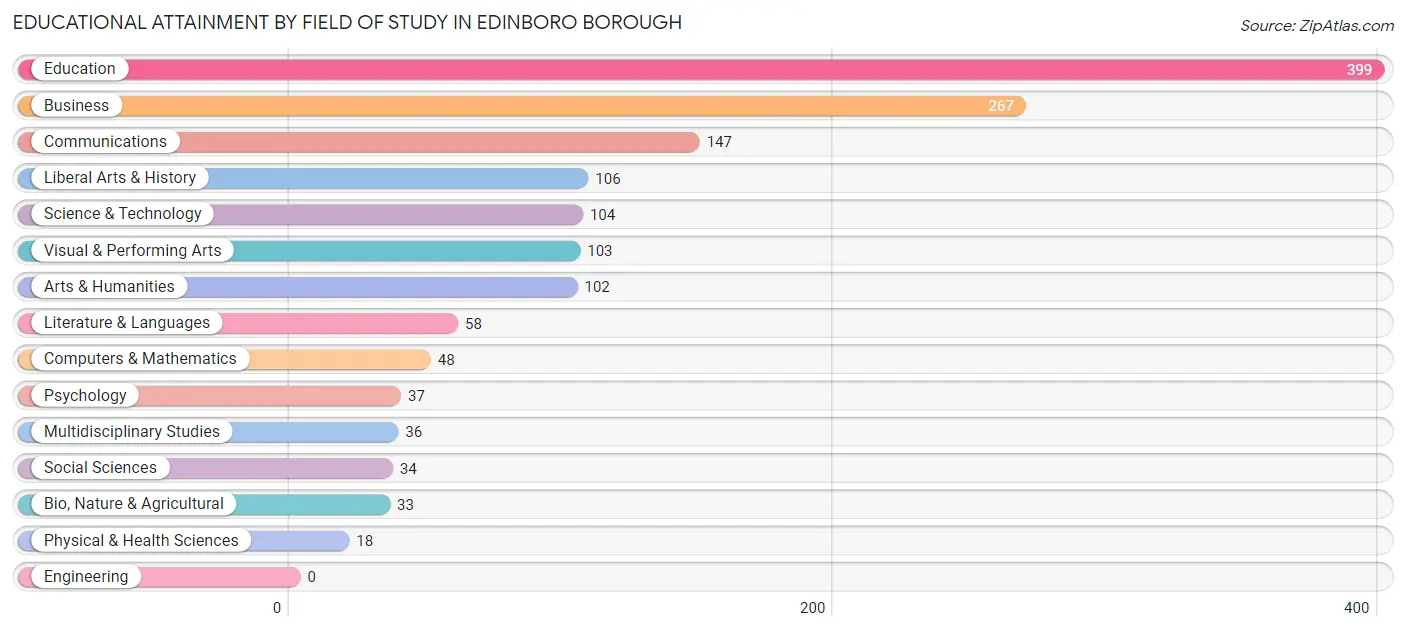
| Field of Study | # Graduates | % Graduates |
| Computers & Mathematics | 48 | 3.2% |
| Bio, Nature & Agricultural | 33 | 2.2% |
| Physical & Health Sciences | 18 | 1.2% |
| Psychology | 37 | 2.5% |
| Social Sciences | 34 | 2.3% |
| Engineering | 0 | 0.0% |
| Multidisciplinary Studies | 36 | 2.4% |
| Science & Technology | 104 | 7.0% |
| Business | 267 | 17.9% |
| Education | 399 | 26.7% |
| Literature & Languages | 58 | 3.9% |
| Liberal Arts & History | 106 | 7.1% |
| Visual & Performing Arts | 103 | 6.9% |
| Communications | 147 | 9.9% |
| Arts & Humanities | 102 | 6.8% |
| Total | 1,492 | 100.0% |
Transportation & Commute in Edinboro borough
Vehicle Availability by Sex in Edinboro borough
The most prevalent vehicle ownership categories in Edinboro borough are males with 2 vehicles (323, accounting for 40.5%) and females with 2 vehicles (347, making up 30.2%).
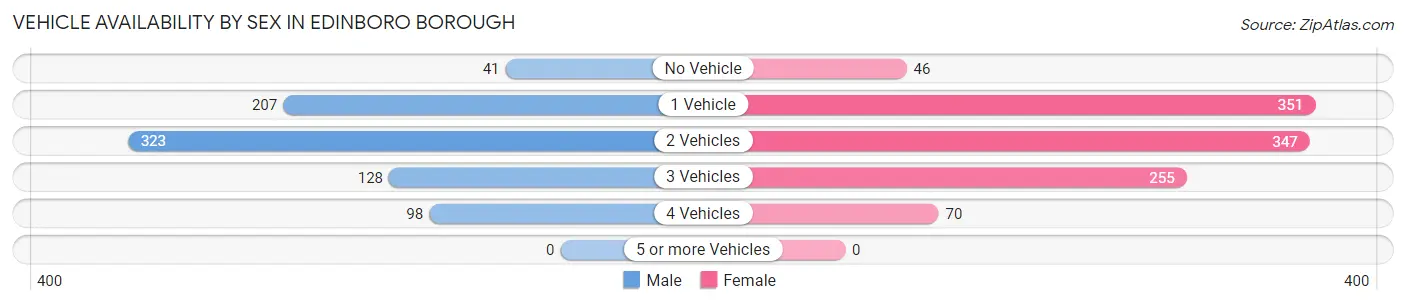
| Vehicles Available | Male | Female |
| No Vehicle | 41 (5.1%) | 46 (4.3%) |
| 1 Vehicle | 207 (26.0%) | 351 (32.8%) |
| 2 Vehicles | 323 (40.5%) | 347 (32.5%) |
| 3 Vehicles | 128 (16.1%) | 255 (23.8%) |
| 4 Vehicles | 98 (12.3%) | 70 (6.6%) |
| 5 or more Vehicles | 0 (0.0%) | 0 (0.0%) |
| Total | 797 (100.0%) | 1,069 (100.0%) |
Commute Time in Edinboro borough
The most frequently occuring commute durations in Edinboro borough are 10 to 14 minutes (450 commuters, 23.1%), 5 to 9 minutes (392 commuters, 20.1%), and less than 5 minutes (220 commuters, 11.3%).
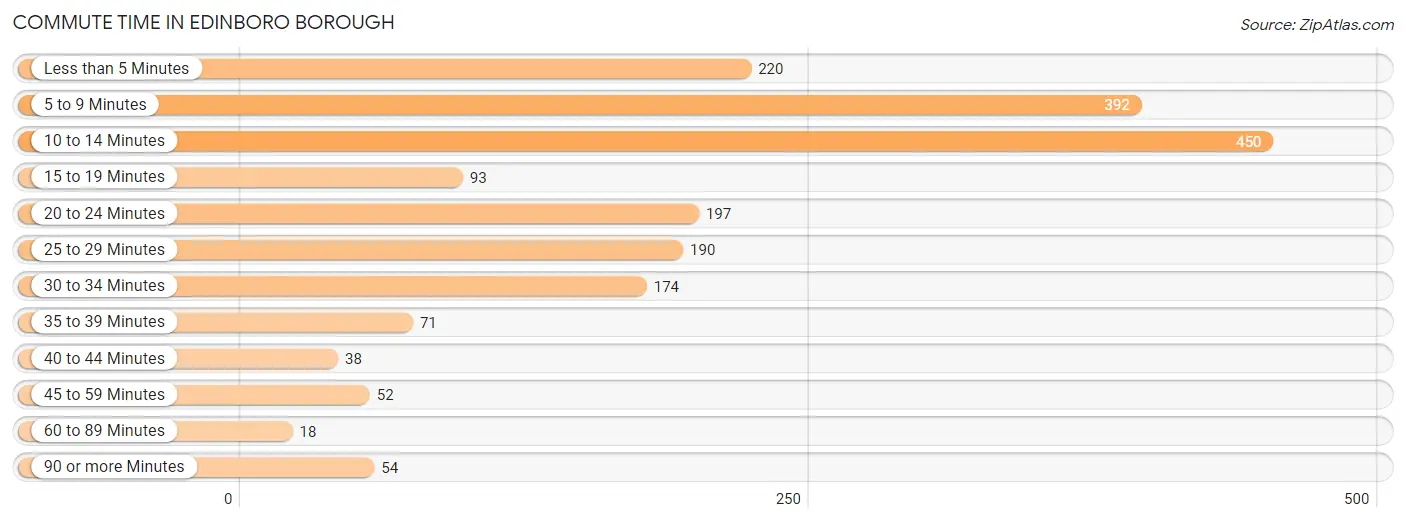
| Commute Time | # Commuters | % Commuters |
| Less than 5 Minutes | 220 | 11.3% |
| 5 to 9 Minutes | 392 | 20.1% |
| 10 to 14 Minutes | 450 | 23.1% |
| 15 to 19 Minutes | 93 | 4.8% |
| 20 to 24 Minutes | 197 | 10.1% |
| 25 to 29 Minutes | 190 | 9.8% |
| 30 to 34 Minutes | 174 | 8.9% |
| 35 to 39 Minutes | 71 | 3.6% |
| 40 to 44 Minutes | 38 | 1.9% |
| 45 to 59 Minutes | 52 | 2.7% |
| 60 to 89 Minutes | 18 | 0.9% |
| 90 or more Minutes | 54 | 2.8% |
Commute Time by Sex in Edinboro borough
The most common commute times in Edinboro borough are 10 to 14 minutes (187 commuters, 22.7%) for males and 5 to 9 minutes (315 commuters, 28.0%) for females.
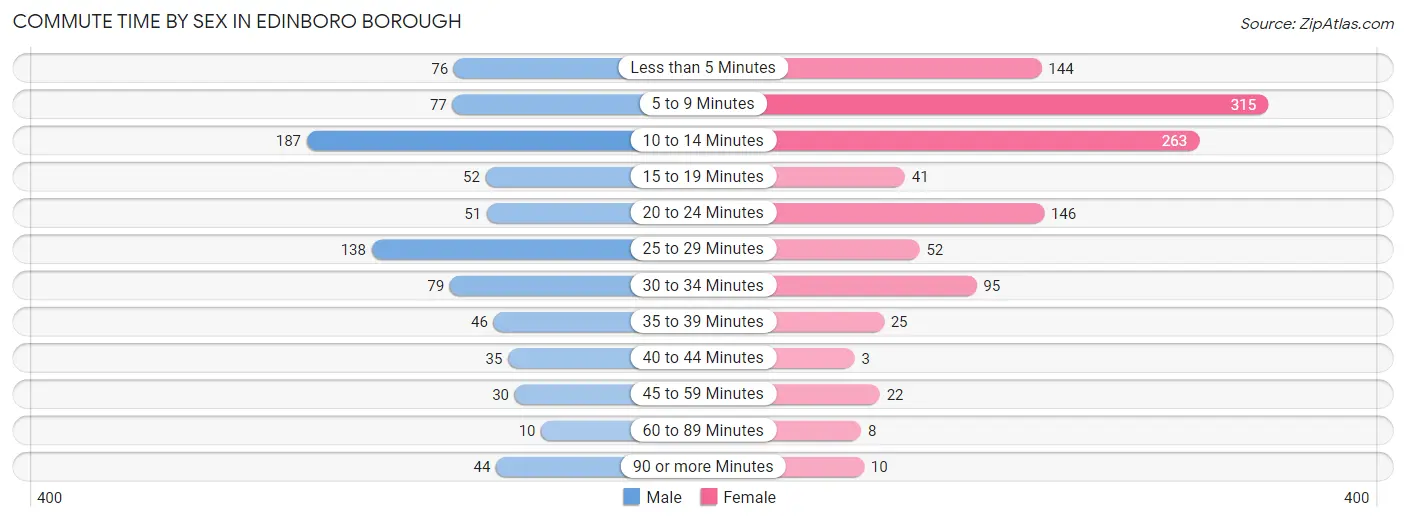
| Commute Time | Male | Female |
| Less than 5 Minutes | 76 (9.2%) | 144 (12.8%) |
| 5 to 9 Minutes | 77 (9.3%) | 315 (28.0%) |
| 10 to 14 Minutes | 187 (22.7%) | 263 (23.4%) |
| 15 to 19 Minutes | 52 (6.3%) | 41 (3.6%) |
| 20 to 24 Minutes | 51 (6.2%) | 146 (13.0%) |
| 25 to 29 Minutes | 138 (16.7%) | 52 (4.6%) |
| 30 to 34 Minutes | 79 (9.6%) | 95 (8.5%) |
| 35 to 39 Minutes | 46 (5.6%) | 25 (2.2%) |
| 40 to 44 Minutes | 35 (4.2%) | 3 (0.3%) |
| 45 to 59 Minutes | 30 (3.6%) | 22 (2.0%) |
| 60 to 89 Minutes | 10 (1.2%) | 8 (0.7%) |
| 90 or more Minutes | 44 (5.3%) | 10 (0.9%) |
Time of Departure to Work by Sex in Edinboro borough
The most frequent times of departure to work in Edinboro borough are 7:00 AM to 7:29 AM (235, 28.5%) for males and 7:00 AM to 7:29 AM (232, 20.6%) for females.
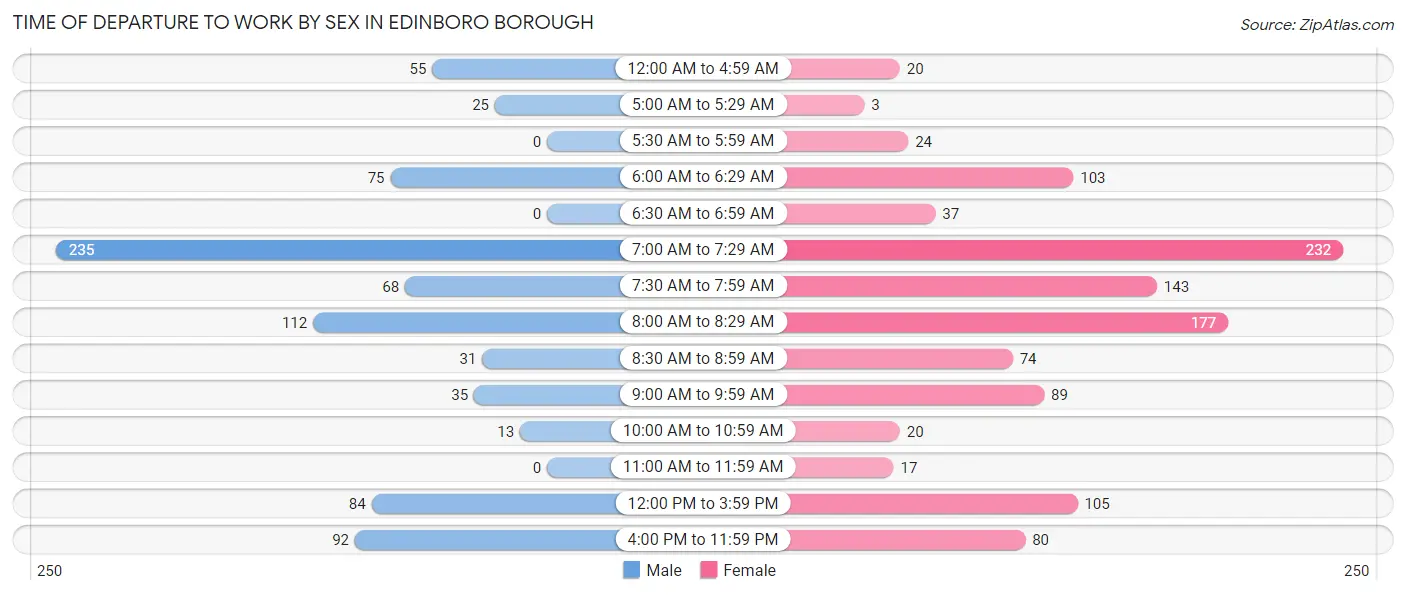
| Time of Departure | Male | Female |
| 12:00 AM to 4:59 AM | 55 (6.7%) | 20 (1.8%) |
| 5:00 AM to 5:29 AM | 25 (3.0%) | 3 (0.3%) |
| 5:30 AM to 5:59 AM | 0 (0.0%) | 24 (2.1%) |
| 6:00 AM to 6:29 AM | 75 (9.1%) | 103 (9.2%) |
| 6:30 AM to 6:59 AM | 0 (0.0%) | 37 (3.3%) |
| 7:00 AM to 7:29 AM | 235 (28.5%) | 232 (20.6%) |
| 7:30 AM to 7:59 AM | 68 (8.2%) | 143 (12.7%) |
| 8:00 AM to 8:29 AM | 112 (13.6%) | 177 (15.8%) |
| 8:30 AM to 8:59 AM | 31 (3.8%) | 74 (6.6%) |
| 9:00 AM to 9:59 AM | 35 (4.2%) | 89 (7.9%) |
| 10:00 AM to 10:59 AM | 13 (1.6%) | 20 (1.8%) |
| 11:00 AM to 11:59 AM | 0 (0.0%) | 17 (1.5%) |
| 12:00 PM to 3:59 PM | 84 (10.2%) | 105 (9.3%) |
| 4:00 PM to 11:59 PM | 92 (11.2%) | 80 (7.1%) |
| Total | 825 (100.0%) | 1,124 (100.0%) |
Housing Occupancy in Edinboro borough
Occupancy by Ownership in Edinboro borough
Of the total 1,767 dwellings in Edinboro borough, owner-occupied units account for 777 (44.0%), while renter-occupied units make up 990 (56.0%).
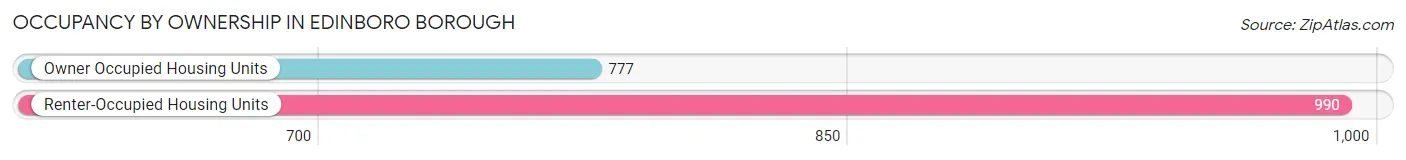
| Occupancy | # Housing Units | % Housing Units |
| Owner Occupied Housing Units | 777 | 44.0% |
| Renter-Occupied Housing Units | 990 | 56.0% |
| Total Occupied Housing Units | 1,767 | 100.0% |
Occupancy by Household Size in Edinboro borough
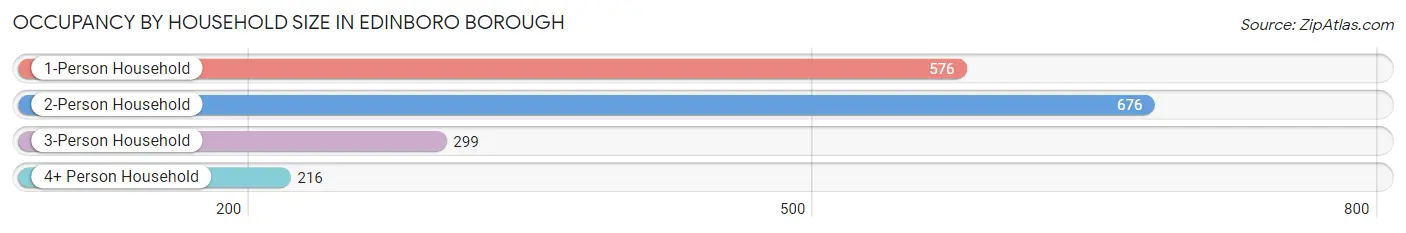
| Household Size | # Housing Units | % Housing Units |
| 1-Person Household | 576 | 32.6% |
| 2-Person Household | 676 | 38.3% |
| 3-Person Household | 299 | 16.9% |
| 4+ Person Household | 216 | 12.2% |
| Total Housing Units | 1,767 | 100.0% |
Occupancy by Ownership by Household Size in Edinboro borough
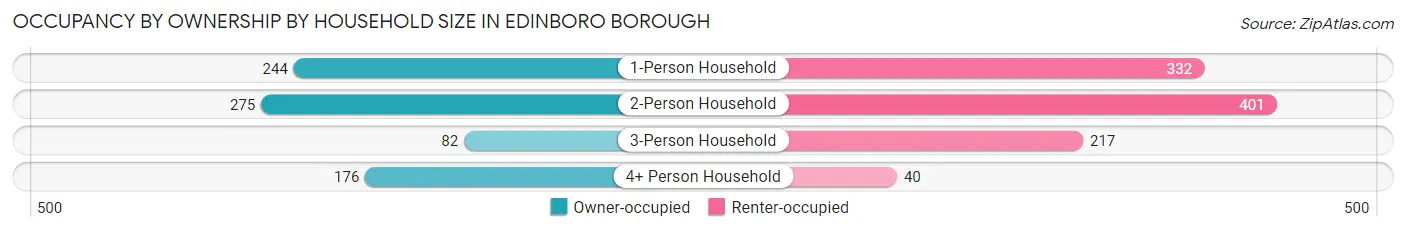
| Household Size | Owner-occupied | Renter-occupied |
| 1-Person Household | 244 (42.4%) | 332 (57.6%) |
| 2-Person Household | 275 (40.7%) | 401 (59.3%) |
| 3-Person Household | 82 (27.4%) | 217 (72.6%) |
| 4+ Person Household | 176 (81.5%) | 40 (18.5%) |
| Total Housing Units | 777 (44.0%) | 990 (56.0%) |
Occupancy by Educational Attainment in Edinboro borough
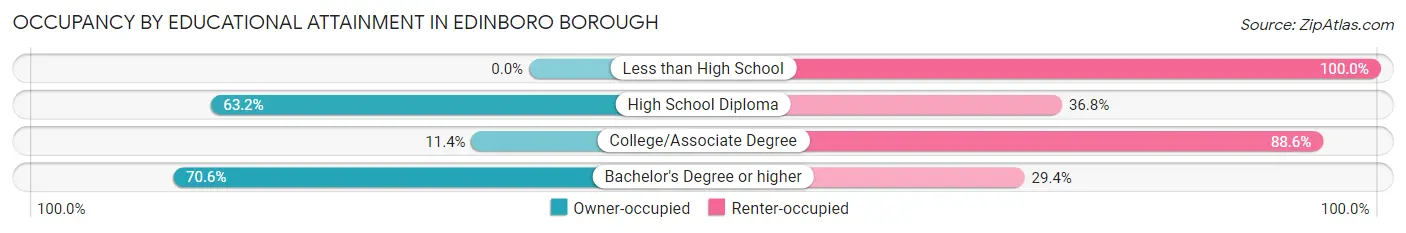
| Household Size | Owner-occupied | Renter-occupied |
| Less than High School | 0 (0.0%) | 84 (100.0%) |
| High School Diploma | 96 (63.2%) | 56 (36.8%) |
| College/Associate Degree | 77 (11.4%) | 598 (88.6%) |
| Bachelor's Degree or higher | 604 (70.6%) | 252 (29.4%) |
Occupancy by Age of Householder in Edinboro borough
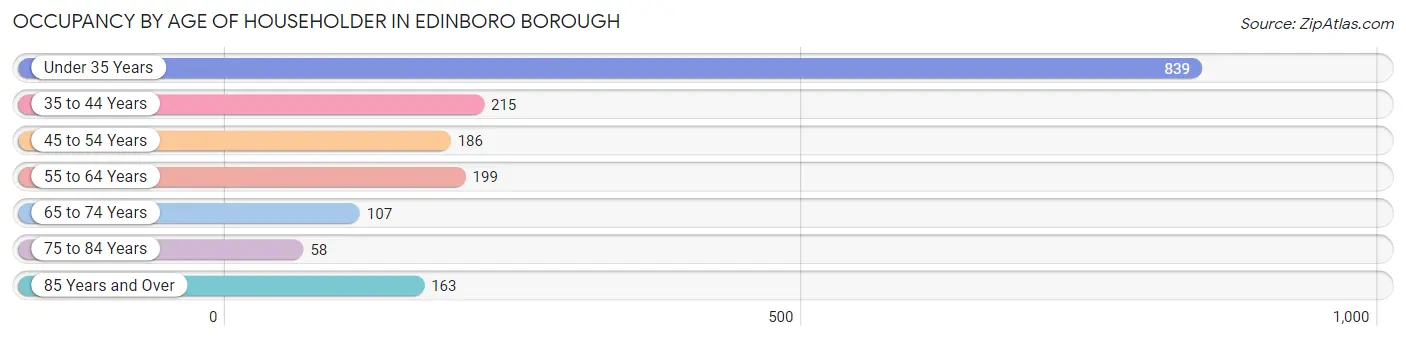
| Age Bracket | # Households | % Households |
| Under 35 Years | 839 | 47.5% |
| 35 to 44 Years | 215 | 12.2% |
| 45 to 54 Years | 186 | 10.5% |
| 55 to 64 Years | 199 | 11.3% |
| 65 to 74 Years | 107 | 6.1% |
| 75 to 84 Years | 58 | 3.3% |
| 85 Years and Over | 163 | 9.2% |
| Total | 1,767 | 100.0% |
Housing Finances in Edinboro borough
Median Income by Occupancy in Edinboro borough
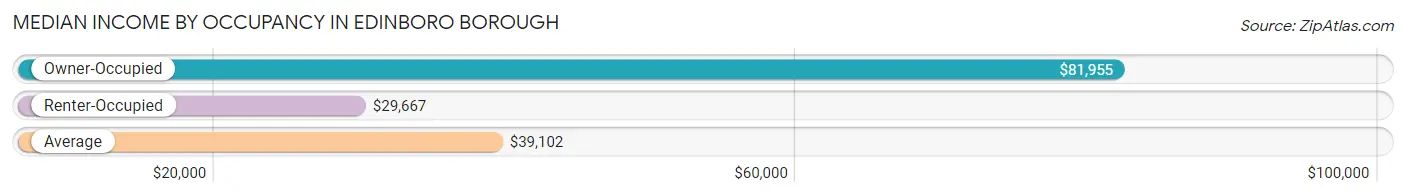
| Occupancy Type | # Households | Median Income |
| Owner-Occupied | 777 (44.0%) | $81,955 |
| Renter-Occupied | 990 (56.0%) | $29,667 |
| Average | 1,767 (100.0%) | $39,102 |
Occupancy by Householder Income Bracket in Edinboro borough
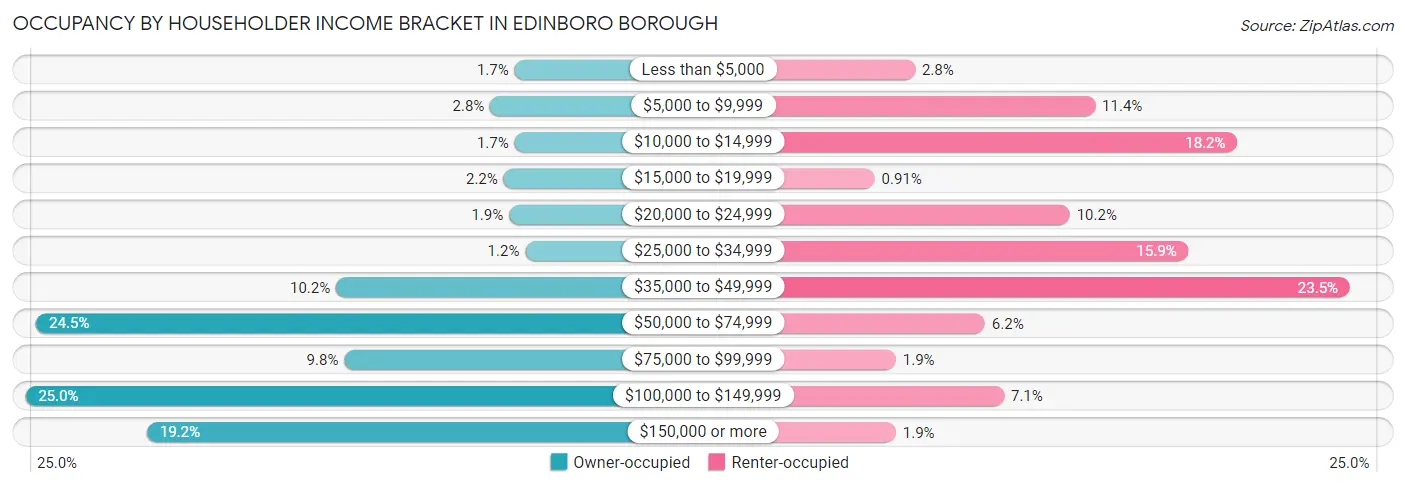
| Income Bracket | Owner-occupied | Renter-occupied |
| Less than $5,000 | 13 (1.7%) | 28 (2.8%) |
| $5,000 to $9,999 | 22 (2.8%) | 113 (11.4%) |
| $10,000 to $14,999 | 13 (1.7%) | 180 (18.2%) |
| $15,000 to $19,999 | 17 (2.2%) | 9 (0.9%) |
| $20,000 to $24,999 | 15 (1.9%) | 101 (10.2%) |
| $25,000 to $34,999 | 9 (1.2%) | 157 (15.9%) |
| $35,000 to $49,999 | 79 (10.2%) | 233 (23.5%) |
| $50,000 to $74,999 | 190 (24.4%) | 61 (6.2%) |
| $75,000 to $99,999 | 76 (9.8%) | 19 (1.9%) |
| $100,000 to $149,999 | 194 (25.0%) | 70 (7.1%) |
| $150,000 or more | 149 (19.2%) | 19 (1.9%) |
| Total | 777 (100.0%) | 990 (100.0%) |
Monthly Housing Cost Tiers in Edinboro borough
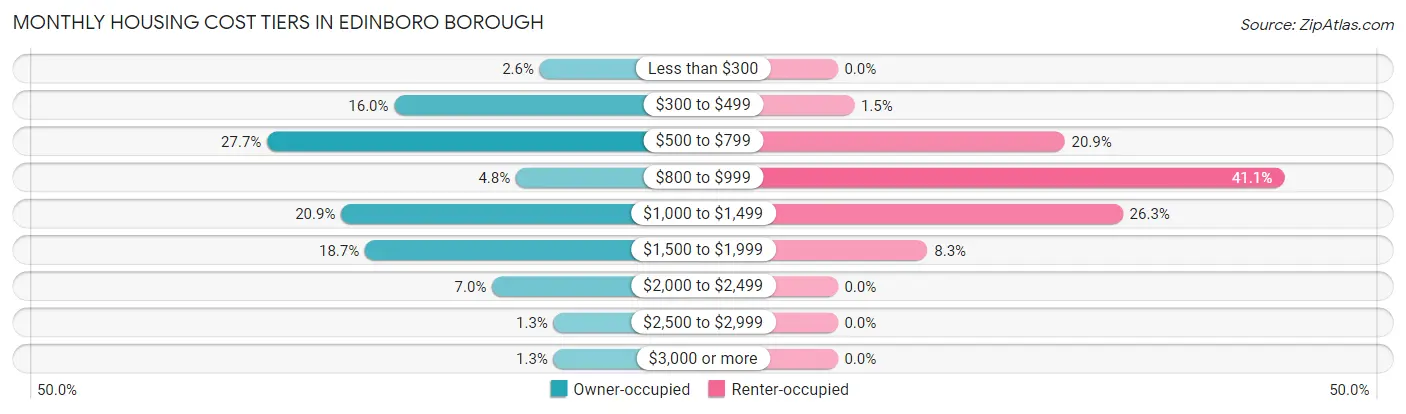
| Monthly Cost | Owner-occupied | Renter-occupied |
| Less than $300 | 20 (2.6%) | 0 (0.0%) |
| $300 to $499 | 124 (16.0%) | 15 (1.5%) |
| $500 to $799 | 215 (27.7%) | 207 (20.9%) |
| $800 to $999 | 37 (4.8%) | 407 (41.1%) |
| $1,000 to $1,499 | 162 (20.8%) | 260 (26.3%) |
| $1,500 to $1,999 | 145 (18.7%) | 82 (8.3%) |
| $2,000 to $2,499 | 54 (7.0%) | 0 (0.0%) |
| $2,500 to $2,999 | 10 (1.3%) | 0 (0.0%) |
| $3,000 or more | 10 (1.3%) | 0 (0.0%) |
| Total | 777 (100.0%) | 990 (100.0%) |
Physical Housing Characteristics in Edinboro borough
Housing Structures in Edinboro borough
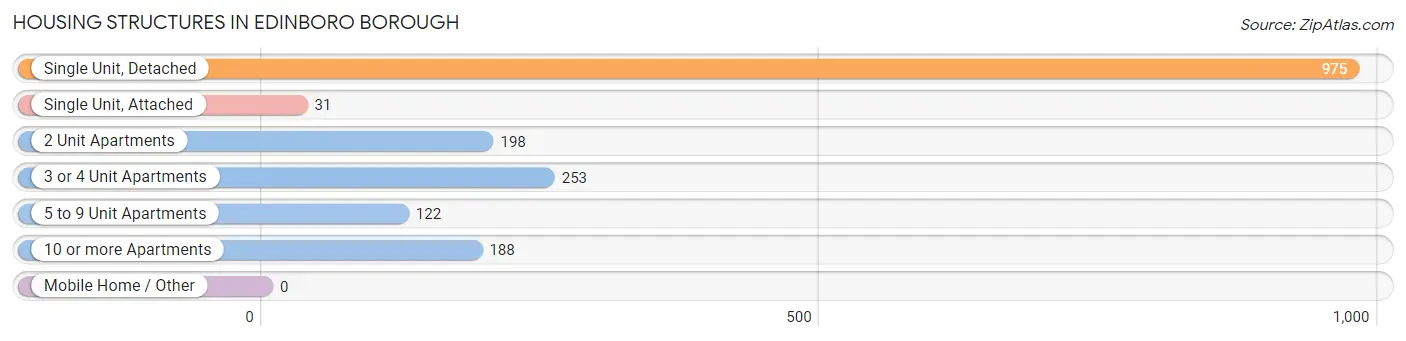
| Structure Type | # Housing Units | % Housing Units |
| Single Unit, Detached | 975 | 55.2% |
| Single Unit, Attached | 31 | 1.8% |
| 2 Unit Apartments | 198 | 11.2% |
| 3 or 4 Unit Apartments | 253 | 14.3% |
| 5 to 9 Unit Apartments | 122 | 6.9% |
| 10 or more Apartments | 188 | 10.6% |
| Mobile Home / Other | 0 | 0.0% |
| Total | 1,767 | 100.0% |
Housing Structures by Occupancy in Edinboro borough
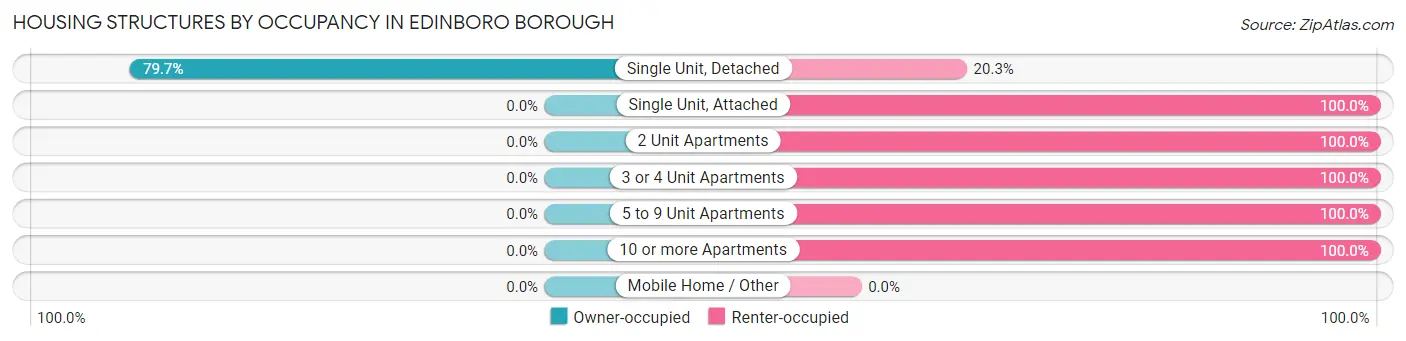
| Structure Type | Owner-occupied | Renter-occupied |
| Single Unit, Detached | 777 (79.7%) | 198 (20.3%) |
| Single Unit, Attached | 0 (0.0%) | 31 (100.0%) |
| 2 Unit Apartments | 0 (0.0%) | 198 (100.0%) |
| 3 or 4 Unit Apartments | 0 (0.0%) | 253 (100.0%) |
| 5 to 9 Unit Apartments | 0 (0.0%) | 122 (100.0%) |
| 10 or more Apartments | 0 (0.0%) | 188 (100.0%) |
| Mobile Home / Other | 0 (0.0%) | 0 (0.0%) |
| Total | 777 (44.0%) | 990 (56.0%) |
Housing Structures by Number of Rooms in Edinboro borough
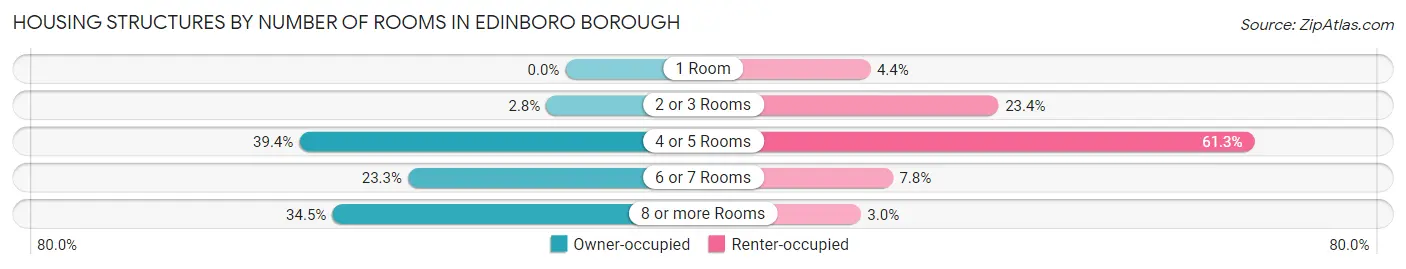
| Number of Rooms | Owner-occupied | Renter-occupied |
| 1 Room | 0 (0.0%) | 44 (4.4%) |
| 2 or 3 Rooms | 22 (2.8%) | 232 (23.4%) |
| 4 or 5 Rooms | 306 (39.4%) | 607 (61.3%) |
| 6 or 7 Rooms | 181 (23.3%) | 77 (7.8%) |
| 8 or more Rooms | 268 (34.5%) | 30 (3.0%) |
| Total | 777 (100.0%) | 990 (100.0%) |
Housing Structure by Heating Type in Edinboro borough
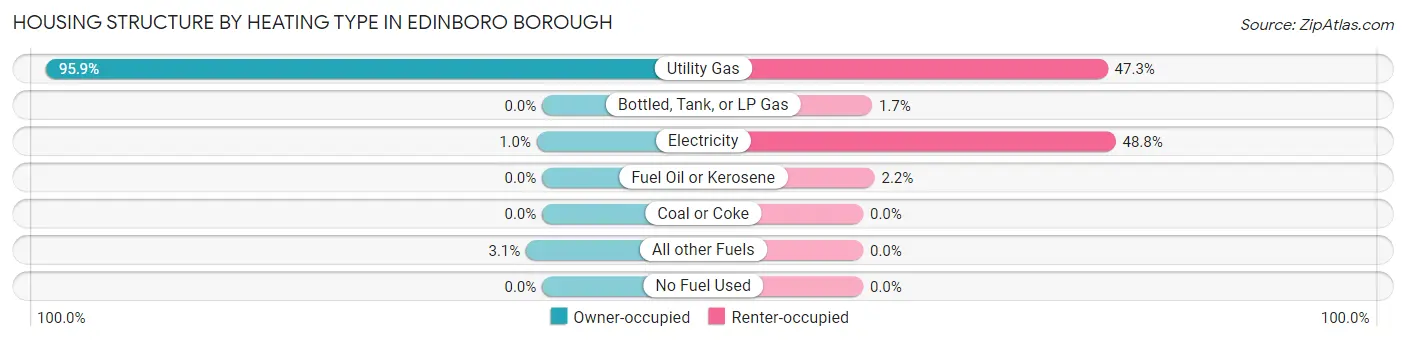
| Heating Type | Owner-occupied | Renter-occupied |
| Utility Gas | 745 (95.9%) | 468 (47.3%) |
| Bottled, Tank, or LP Gas | 0 (0.0%) | 17 (1.7%) |
| Electricity | 8 (1.0%) | 483 (48.8%) |
| Fuel Oil or Kerosene | 0 (0.0%) | 22 (2.2%) |
| Coal or Coke | 0 (0.0%) | 0 (0.0%) |
| All other Fuels | 24 (3.1%) | 0 (0.0%) |
| No Fuel Used | 0 (0.0%) | 0 (0.0%) |
| Total | 777 (100.0%) | 990 (100.0%) |
Household Vehicle Usage in Edinboro borough
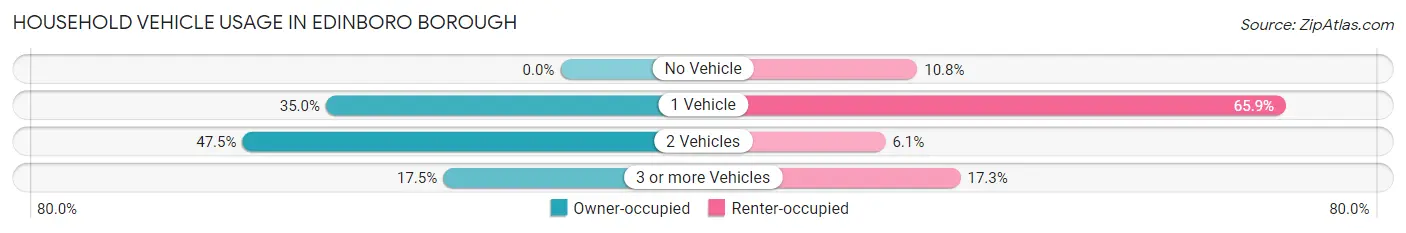
| Vehicles per Household | Owner-occupied | Renter-occupied |
| No Vehicle | 0 (0.0%) | 107 (10.8%) |
| 1 Vehicle | 272 (35.0%) | 652 (65.9%) |
| 2 Vehicles | 369 (47.5%) | 60 (6.1%) |
| 3 or more Vehicles | 136 (17.5%) | 171 (17.3%) |
| Total | 777 (100.0%) | 990 (100.0%) |
Real Estate & Mortgages in Edinboro borough
Real Estate and Mortgage Overview in Edinboro borough
| Characteristic | Without Mortgage | With Mortgage |
| Housing Units | 422 | 355 |
| Median Property Value | $183,300 | $222,600 |
| Median Household Income | $67,336 | $129 |
| Monthly Housing Costs | $550 | $10 |
| Real Estate Taxes | $2,148 | $0 |
Property Value by Mortgage Status in Edinboro borough
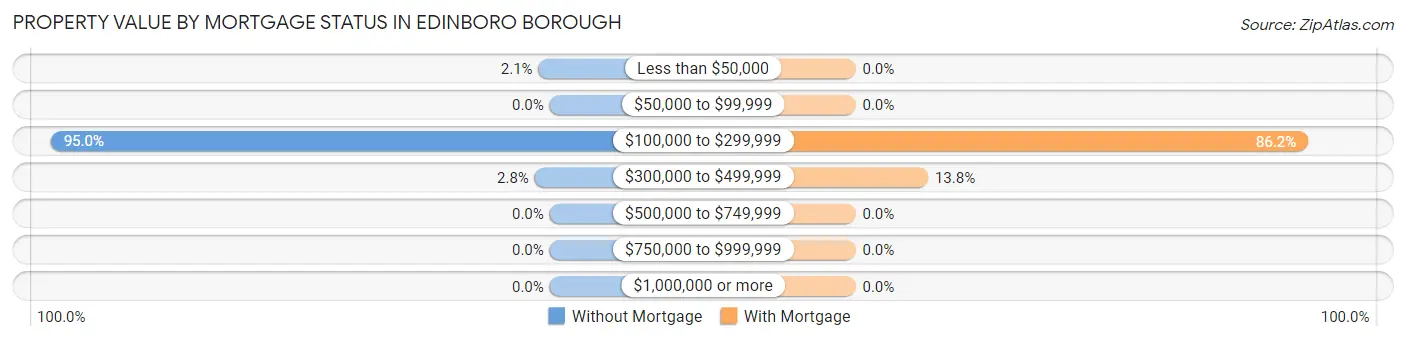
| Property Value | Without Mortgage | With Mortgage |
| Less than $50,000 | 9 (2.1%) | 0 (0.0%) |
| $50,000 to $99,999 | 0 (0.0%) | 0 (0.0%) |
| $100,000 to $299,999 | 401 (95.0%) | 306 (86.2%) |
| $300,000 to $499,999 | 12 (2.8%) | 49 (13.8%) |
| $500,000 to $749,999 | 0 (0.0%) | 0 (0.0%) |
| $750,000 to $999,999 | 0 (0.0%) | 0 (0.0%) |
| $1,000,000 or more | 0 (0.0%) | 0 (0.0%) |
| Total | 422 (100.0%) | 355 (100.0%) |
Household Income by Mortgage Status in Edinboro borough
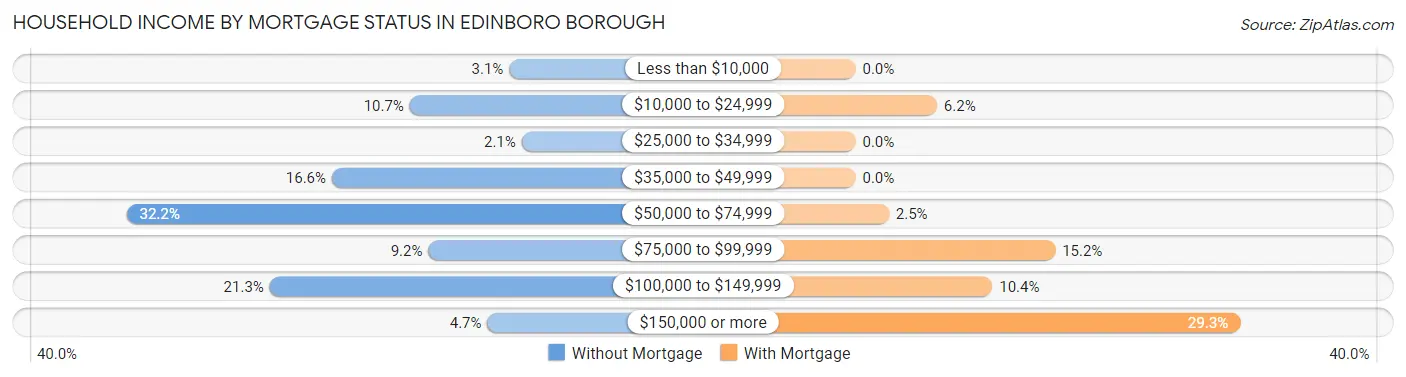
| Household Income | Without Mortgage | With Mortgage |
| Less than $10,000 | 13 (3.1%) | 0 (0.0%) |
| $10,000 to $24,999 | 45 (10.7%) | 22 (6.2%) |
| $25,000 to $34,999 | 9 (2.1%) | 0 (0.0%) |
| $35,000 to $49,999 | 70 (16.6%) | 0 (0.0%) |
| $50,000 to $74,999 | 136 (32.2%) | 9 (2.5%) |
| $75,000 to $99,999 | 39 (9.2%) | 54 (15.2%) |
| $100,000 to $149,999 | 90 (21.3%) | 37 (10.4%) |
| $150,000 or more | 20 (4.7%) | 104 (29.3%) |
| Total | 422 (100.0%) | 355 (100.0%) |
Property Value to Household Income Ratio in Edinboro borough
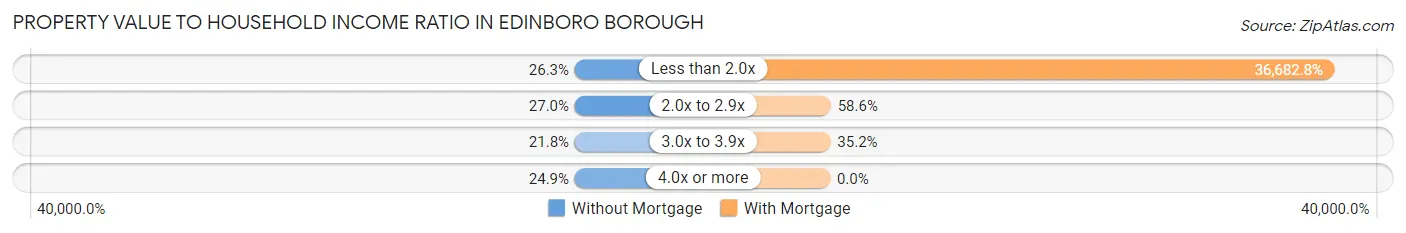
| Value-to-Income Ratio | Without Mortgage | With Mortgage |
| Less than 2.0x | 111 (26.3%) | 130,224 (36,682.8%) |
| 2.0x to 2.9x | 114 (27.0%) | 208 (58.6%) |
| 3.0x to 3.9x | 92 (21.8%) | 125 (35.2%) |
| 4.0x or more | 105 (24.9%) | 0 (0.0%) |
| Total | 422 (100.0%) | 355 (100.0%) |
Real Estate Taxes by Mortgage Status in Edinboro borough
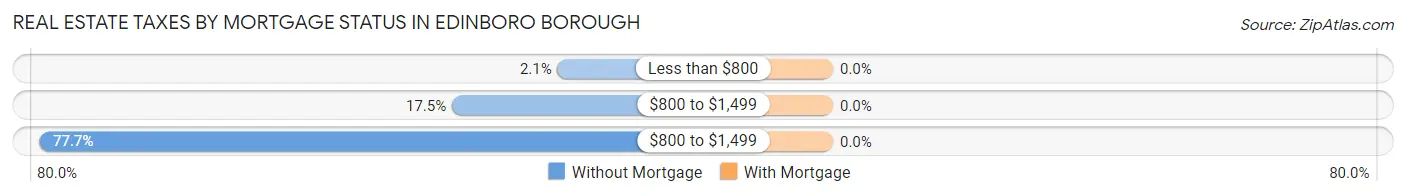
| Property Taxes | Without Mortgage | With Mortgage |
| Less than $800 | 9 (2.1%) | 0 (0.0%) |
| $800 to $1,499 | 74 (17.5%) | 0 (0.0%) |
| $800 to $1,499 | 328 (77.7%) | 0 (0.0%) |
| Total | 422 (100.0%) | 355 (100.0%) |
Health & Disability in Edinboro borough
Health Insurance Coverage by Age in Edinboro borough
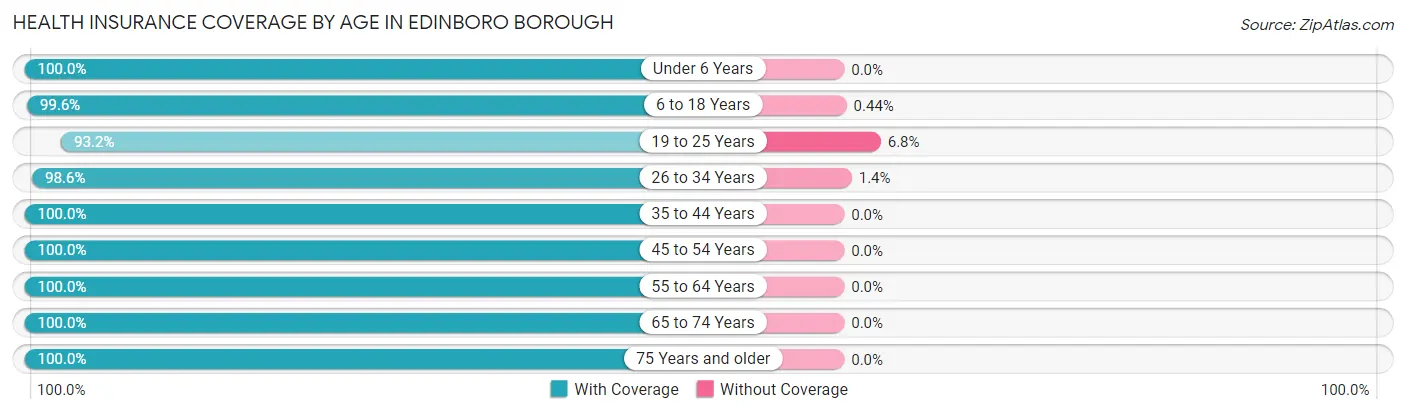
| Age Bracket | With Coverage | Without Coverage |
| Under 6 Years | 210 (100.0%) | 0 (0.0%) |
| 6 to 18 Years | 674 (99.6%) | 3 (0.4%) |
| 19 to 25 Years | 1,632 (93.2%) | 119 (6.8%) |
| 26 to 34 Years | 706 (98.6%) | 10 (1.4%) |
| 35 to 44 Years | 351 (100.0%) | 0 (0.0%) |
| 45 to 54 Years | 303 (100.0%) | 0 (0.0%) |
| 55 to 64 Years | 382 (100.0%) | 0 (0.0%) |
| 65 to 74 Years | 176 (100.0%) | 0 (0.0%) |
| 75 Years and older | 286 (100.0%) | 0 (0.0%) |
| Total | 4,720 (97.3%) | 132 (2.7%) |
Health Insurance Coverage by Citizenship Status in Edinboro borough
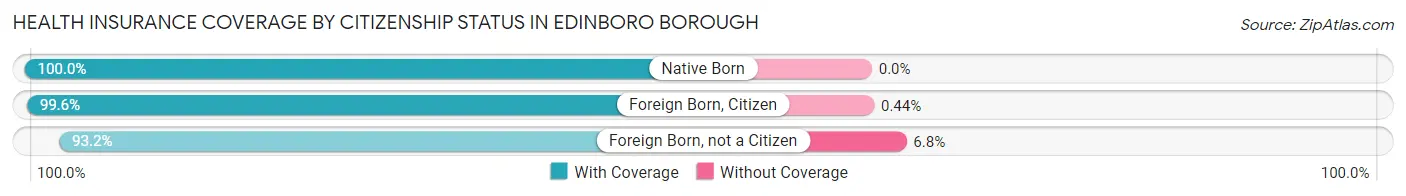
| Citizenship Status | With Coverage | Without Coverage |
| Native Born | 210 (100.0%) | 0 (0.0%) |
| Foreign Born, Citizen | 674 (99.6%) | 3 (0.4%) |
| Foreign Born, not a Citizen | 1,632 (93.2%) | 119 (6.8%) |
Health Insurance Coverage by Household Income in Edinboro borough
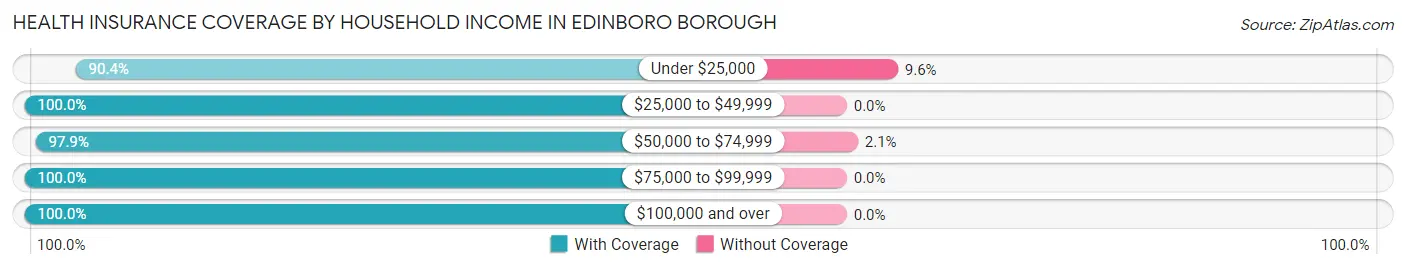
| Household Income | With Coverage | Without Coverage |
| Under $25,000 | 709 (90.4%) | 75 (9.6%) |
| $25,000 to $49,999 | 1,024 (100.0%) | 0 (0.0%) |
| $50,000 to $74,999 | 472 (97.9%) | 10 (2.1%) |
| $75,000 to $99,999 | 319 (100.0%) | 0 (0.0%) |
| $100,000 and over | 1,186 (100.0%) | 0 (0.0%) |
Public vs Private Health Insurance Coverage by Age in Edinboro borough
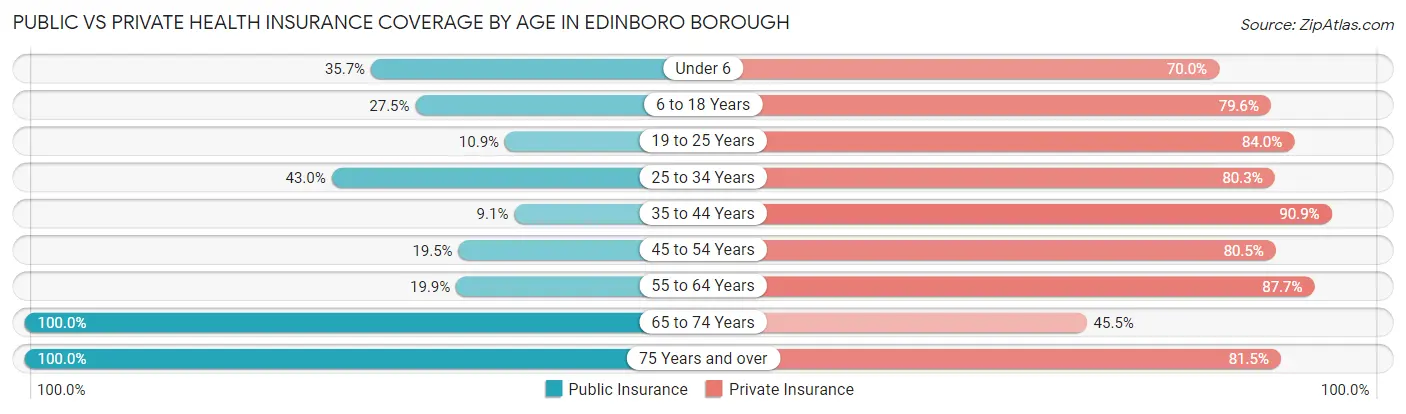
| Age Bracket | Public Insurance | Private Insurance |
| Under 6 | 75 (35.7%) | 147 (70.0%) |
| 6 to 18 Years | 186 (27.5%) | 539 (79.6%) |
| 19 to 25 Years | 190 (10.8%) | 1,470 (84.0%) |
| 25 to 34 Years | 308 (43.0%) | 575 (80.3%) |
| 35 to 44 Years | 32 (9.1%) | 319 (90.9%) |
| 45 to 54 Years | 59 (19.5%) | 244 (80.5%) |
| 55 to 64 Years | 76 (19.9%) | 335 (87.7%) |
| 65 to 74 Years | 176 (100.0%) | 80 (45.5%) |
| 75 Years and over | 286 (100.0%) | 233 (81.5%) |
| Total | 1,388 (28.6%) | 3,942 (81.2%) |
Disability Status by Sex by Age in Edinboro borough
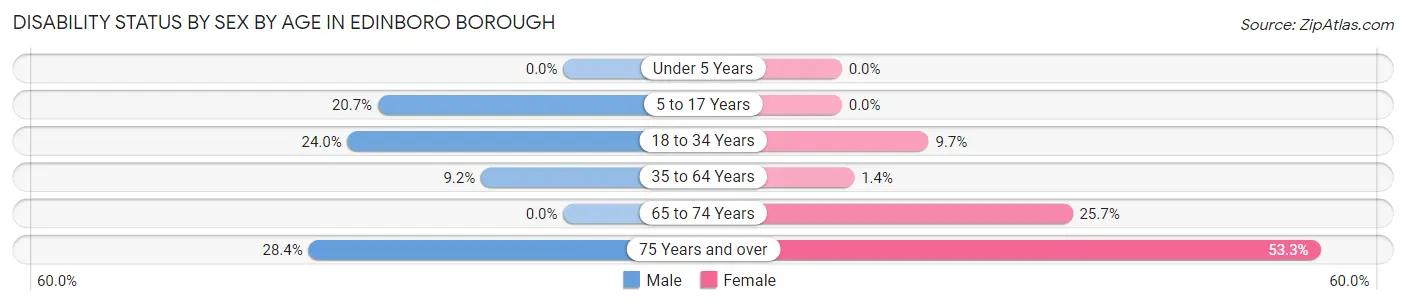
| Age Bracket | Male | Female |
| Under 5 Years | 0 (0.0%) | 0 (0.0%) |
| 5 to 17 Years | 51 (20.6%) | 0 (0.0%) |
| 18 to 34 Years | 278 (24.0%) | 156 (9.7%) |
| 35 to 64 Years | 42 (9.2%) | 8 (1.4%) |
| 65 to 74 Years | 0 (0.0%) | 28 (25.7%) |
| 75 Years and over | 21 (28.4%) | 113 (53.3%) |
Disability Class by Sex by Age in Edinboro borough
Disability Class: Hearing Difficulty
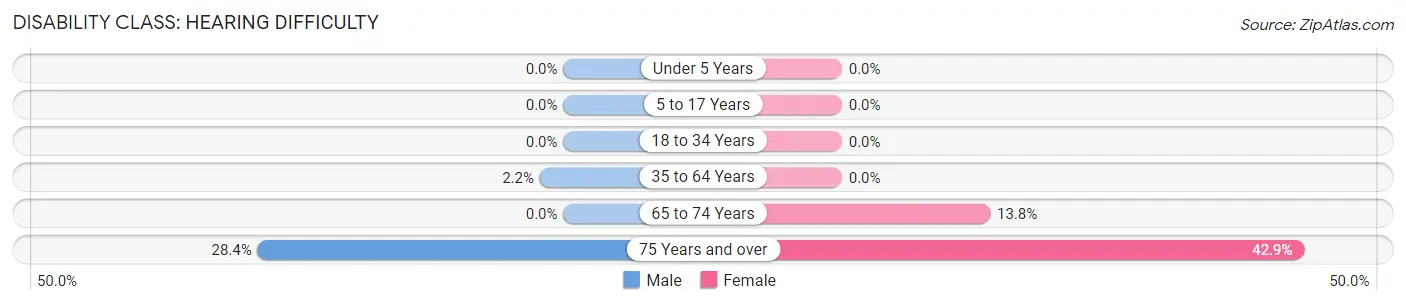
| Age Bracket | Male | Female |
| Under 5 Years | 0 (0.0%) | 0 (0.0%) |
| 5 to 17 Years | 0 (0.0%) | 0 (0.0%) |
| 18 to 34 Years | 0 (0.0%) | 0 (0.0%) |
| 35 to 64 Years | 10 (2.2%) | 0 (0.0%) |
| 65 to 74 Years | 0 (0.0%) | 15 (13.8%) |
| 75 Years and over | 21 (28.4%) | 91 (42.9%) |
Disability Class: Vision Difficulty
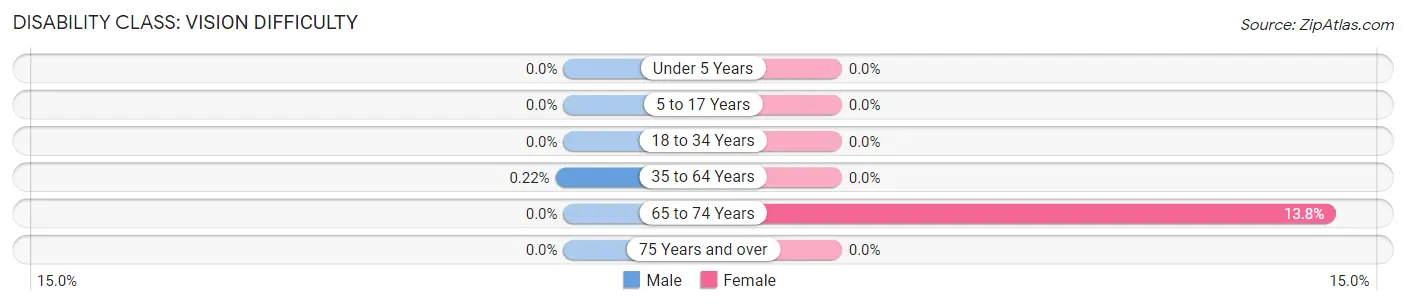
| Age Bracket | Male | Female |
| Under 5 Years | 0 (0.0%) | 0 (0.0%) |
| 5 to 17 Years | 0 (0.0%) | 0 (0.0%) |
| 18 to 34 Years | 0 (0.0%) | 0 (0.0%) |
| 35 to 64 Years | 1 (0.2%) | 0 (0.0%) |
| 65 to 74 Years | 0 (0.0%) | 15 (13.8%) |
| 75 Years and over | 0 (0.0%) | 0 (0.0%) |
Disability Class: Cognitive Difficulty
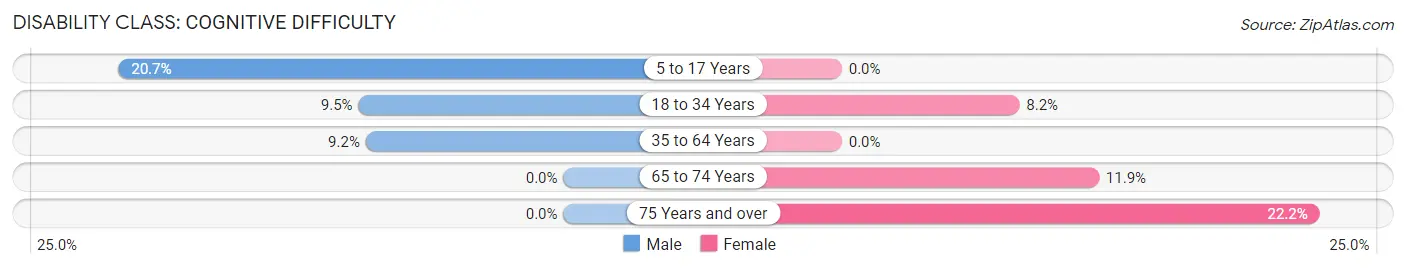
| Age Bracket | Male | Female |
| 5 to 17 Years | 51 (20.6%) | 0 (0.0%) |
| 18 to 34 Years | 110 (9.5%) | 133 (8.2%) |
| 35 to 64 Years | 42 (9.2%) | 0 (0.0%) |
| 65 to 74 Years | 0 (0.0%) | 13 (11.9%) |
| 75 Years and over | 0 (0.0%) | 47 (22.2%) |
Disability Class: Ambulatory Difficulty
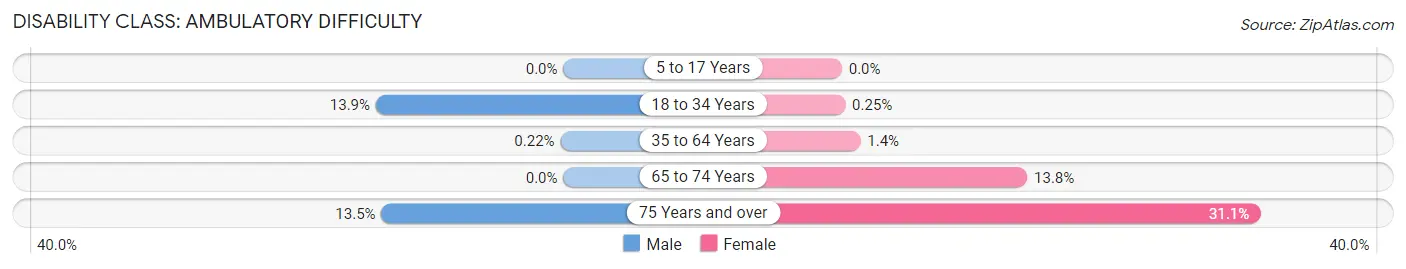
| Age Bracket | Male | Female |
| 5 to 17 Years | 0 (0.0%) | 0 (0.0%) |
| 18 to 34 Years | 161 (13.9%) | 4 (0.3%) |
| 35 to 64 Years | 1 (0.2%) | 8 (1.4%) |
| 65 to 74 Years | 0 (0.0%) | 15 (13.8%) |
| 75 Years and over | 10 (13.5%) | 66 (31.1%) |
Disability Class: Self-Care Difficulty
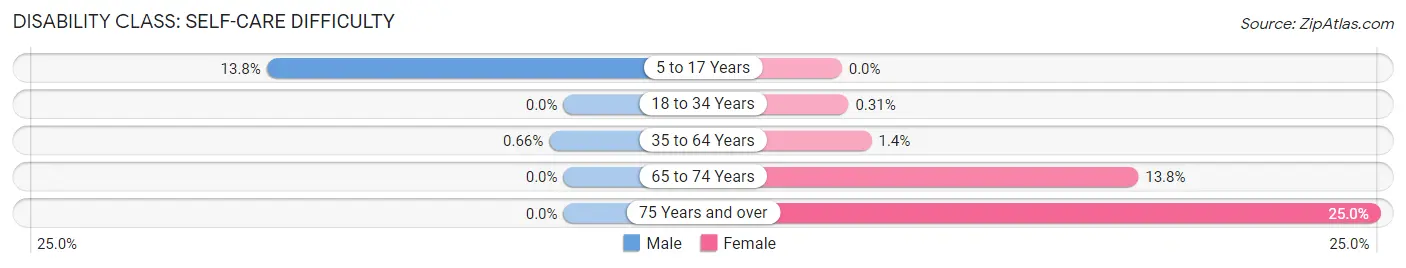
| Age Bracket | Male | Female |
| 5 to 17 Years | 34 (13.8%) | 0 (0.0%) |
| 18 to 34 Years | 0 (0.0%) | 5 (0.3%) |
| 35 to 64 Years | 3 (0.7%) | 8 (1.4%) |
| 65 to 74 Years | 0 (0.0%) | 15 (13.8%) |
| 75 Years and over | 0 (0.0%) | 53 (25.0%) |
Technology Access in Edinboro borough
Computing Device Access in Edinboro borough
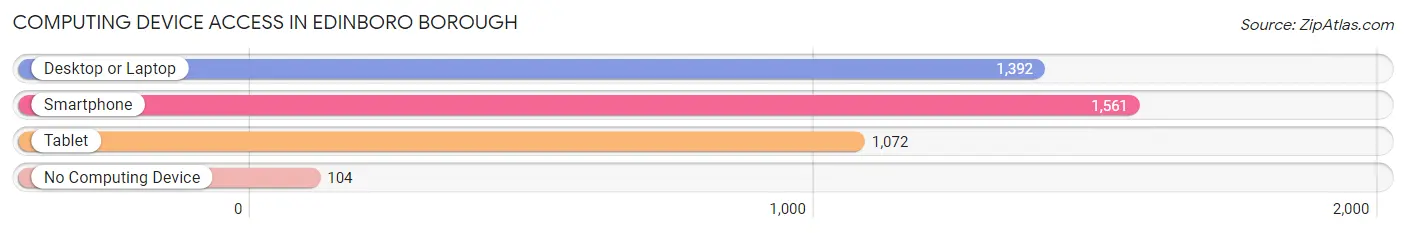
| Device Type | # Households | % Households |
| Desktop or Laptop | 1,392 | 78.8% |
| Smartphone | 1,561 | 88.3% |
| Tablet | 1,072 | 60.7% |
| No Computing Device | 104 | 5.9% |
| Total | 1,767 | 100.0% |
Internet Access in Edinboro borough
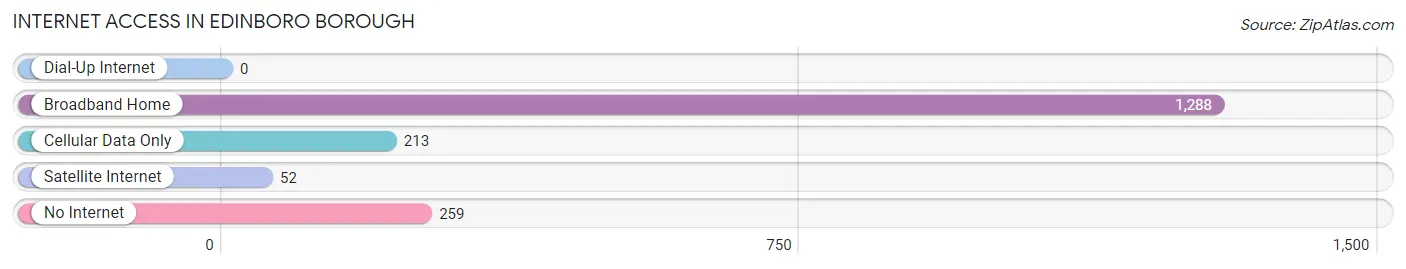
| Internet Type | # Households | % Households |
| Dial-Up Internet | 0 | 0.0% |
| Broadband Home | 1,288 | 72.9% |
| Cellular Data Only | 213 | 12.0% |
| Satellite Internet | 52 | 2.9% |
| No Internet | 259 | 14.7% |
| Total | 1,767 | 100.0% |
Edinboro borough Summary
Edinboro Borough is a small borough located in Erie County, Pennsylvania. It is situated in the northwestern corner of the state, approximately 20 miles south of the city of Erie. The borough is home to a population of approximately 6,000 people, and is part of the Erie Metropolitan Statistical Area.
History
Edinboro Borough was founded in 1851 by a group of settlers from Scotland. The town was named after the Scottish city of Edinburgh, and the settlers brought with them many of the customs and traditions of their homeland. The town quickly grew and prospered, and by the late 19th century it had become a popular tourist destination.
The town was also home to a number of educational institutions, including Edinboro University, which was founded in 1857. The university is now one of the largest in the state, and is home to over 8,000 students.
Geography
Edinboro Borough is located in the northwestern corner of Pennsylvania, approximately 20 miles south of the city of Erie. The borough is situated in a rural area, and is surrounded by rolling hills and farmland. The borough is located on the banks of French Creek, which flows through the town and provides a source of recreation for the residents.
The borough is located in a humid continental climate zone, and experiences cold winters and hot summers. The average annual temperature is around 50 degrees Fahrenheit, and the average annual precipitation is around 40 inches.
Economy
Edinboro Borough has a strong economy, which is largely based on education and tourism. The town is home to Edinboro University, which is one of the largest universities in the state. The university provides a large number of jobs for the local economy, and also attracts a large number of visitors to the town.
The town is also home to a number of small businesses, including restaurants, shops, and other services. The town is also home to a number of manufacturing companies, which provide a significant number of jobs for the local economy.
Demographics
As of the 2010 census, the population of Edinboro Borough was 6,000. The population is predominantly white, with a small percentage of African Americans, Hispanics, and other ethnicities. The median household income is around $45,000, and the median home value is around $150,000.
The town is home to a number of educational institutions, including Edinboro University, which is one of the largest universities in the state. The university provides a large number of jobs for the local economy, and also attracts a large number of visitors to the town.
Conclusion
Edinboro Borough is a small borough located in Erie County, Pennsylvania. It is situated in the northwestern corner of the state, approximately 20 miles south of the city of Erie. The borough is home to a population of approximately 6,000 people, and is part of the Erie Metropolitan Statistical Area. The town has a strong economy, which is largely based on education and tourism. The town is also home to a number of small businesses, including restaurants, shops, and other services. The town is also home to a number of manufacturing companies, which provide a significant number of jobs for the local economy. The population is predominantly white, with a small percentage of African Americans, Hispanics, and other ethnicities. The median household income is around $45,000, and the median home value is around $150,000.
Common Questions
What is Per Capita Income in Edinboro borough?
Per Capita income in Edinboro borough is $25,252.
What is the Median Family Income in Edinboro borough?
Median Family Income in Edinboro borough is $80,481.
What is the Median Household income in Edinboro borough?
Median Household Income in Edinboro borough is $39,102.
What is Inequality or Gini Index in Edinboro borough?
Inequality or Gini Index in Edinboro borough is 0.51.
What is the Total Population of Edinboro borough?
Total Population of Edinboro borough is 4,958.
What is the Total Male Population of Edinboro borough?
Total Male Population of Edinboro borough is 2,169.
What is the Total Female Population of Edinboro borough?
Total Female Population of Edinboro borough is 2,789.
What is the Ratio of Males per 100 Females in Edinboro borough?
There are 77.77 Males per 100 Females in Edinboro borough.
What is the Ratio of Females per 100 Males in Edinboro borough?
There are 128.58 Females per 100 Males in Edinboro borough.
What is the Median Population Age in Edinboro borough?
Median Population Age in Edinboro borough is 24.1 Years.
What is the Average Family Size in Edinboro borough
Average Family Size in Edinboro borough is 2.6 People.
What is the Average Household Size in Edinboro borough
Average Household Size in Edinboro borough is 2.1 People.
How Large is the Labor Force in Edinboro borough?
There are 2,225 People in the Labor Forcein in Edinboro borough.
What is the Percentage of People in the Labor Force in Edinboro borough?
50.4% of People are in the Labor Force in Edinboro borough.
What is the Unemployment Rate in Edinboro borough?
Unemployment Rate in Edinboro borough is 2.2%.