Laurel Run borough, PA Map & Demographics
Laurel Run borough Overview
$30,382
PER CAPITA INCOME
$65,625
AVG FAMILY INCOME
$49,250
AVG HOUSEHOLD INCOME
56.2%
WAGE / INCOME GAP [ % ]
43.8¢/ $1
WAGE / INCOME GAP [ $ ]
0.51
INEQUALITY / GINI INDEX
449
TOTAL POPULATION
266
MALE POPULATION
183
FEMALE POPULATION
145.36
MALES / 100 FEMALES
68.80
FEMALES / 100 MALES
52.6
MEDIAN AGE
2.8
AVG FAMILY SIZE
2.2
AVG HOUSEHOLD SIZE
194
LABOR FORCE [ PEOPLE ]
46.2%
PERCENT IN LABOR FORCE
22.7%
UNEMPLOYMENT RATE
Income in Laurel Run borough
Income Overview in Laurel Run borough
Per Capita Income in Laurel Run borough is $30,382, while median incomes of families and households are $65,625 and $49,250 respectively.
| Characteristic | Number | Measure |
| Per Capita Income | 449 | $30,382 |
| Median Family Income | 99 | $65,625 |
| Mean Family Income | 99 | $95,884 |
| Median Household Income | 171 | $49,250 |
| Mean Household Income | 171 | $74,084 |
| Income Deficit | 99 | $0 |
| Wage / Income Gap (%) | 449 | 56.25% |
| Wage / Income Gap ($) | 449 | 43.75¢ per $1 |
| Gini / Inequality Index | 449 | 0.51 |
Earnings by Sex in Laurel Run borough
Average Earnings in Laurel Run borough are $30,000, $40,000 for men and $17,500 for women, a difference of 56.2%.
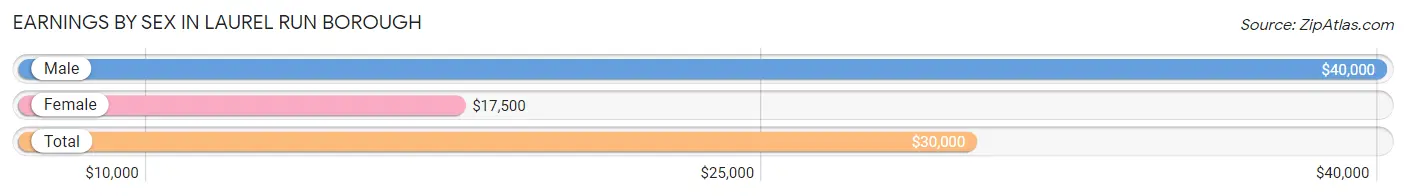
| Sex | Number | Average Earnings |
| Male | 90 (49.4%) | $40,000 |
| Female | 92 (50.5%) | $17,500 |
| Total | 182 (100.0%) | $30,000 |
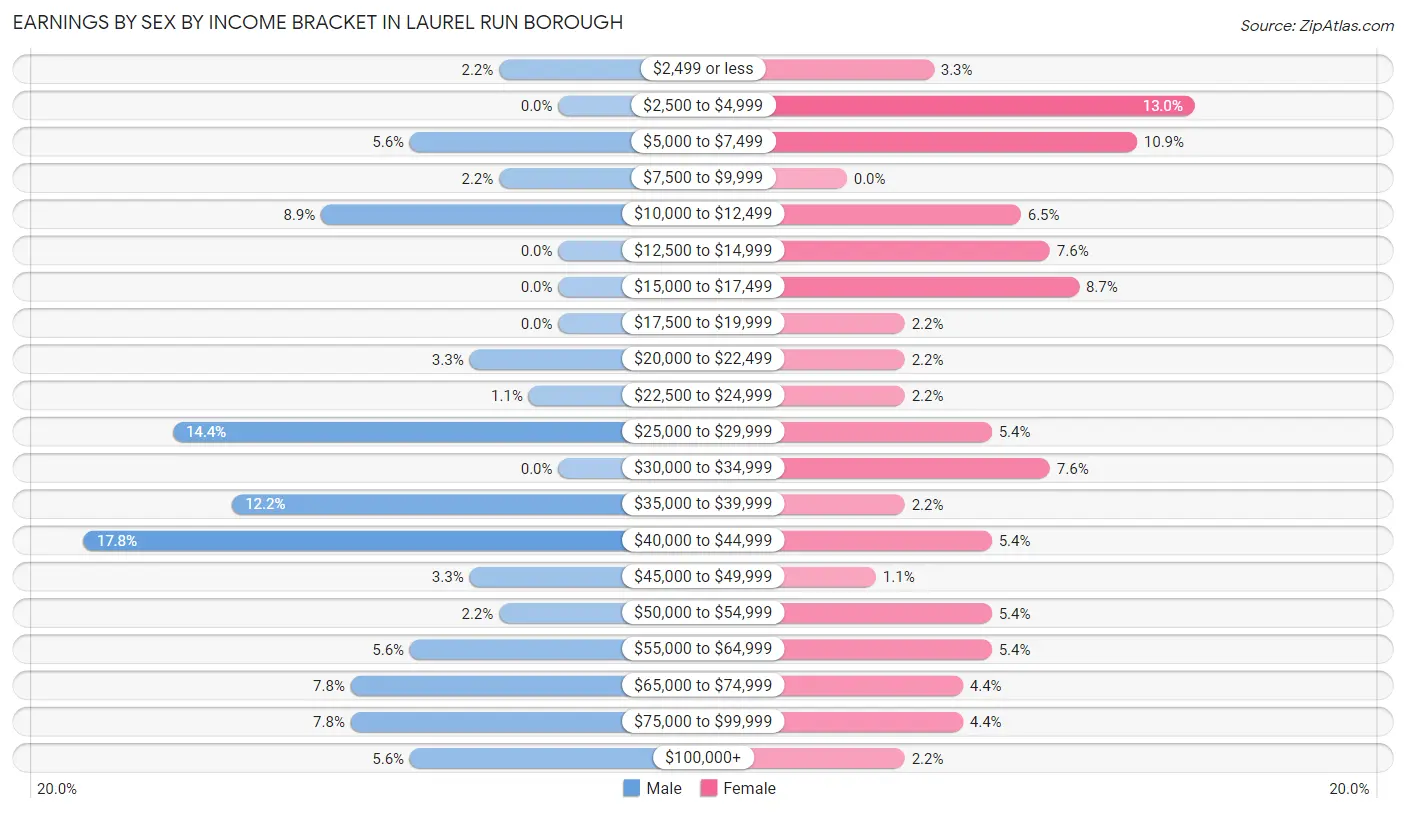
Earnings by Sex by Income Bracket in Laurel Run borough
The most common earnings brackets in Laurel Run borough are $40,000 to $44,999 for men (16 | 17.8%) and $2,500 to $4,999 for women (12 | 13.0%).
| Income | Male | Female |
| $2,499 or less | 2 (2.2%) | 3 (3.3%) |
| $2,500 to $4,999 | 0 (0.0%) | 12 (13.0%) |
| $5,000 to $7,499 | 5 (5.6%) | 10 (10.9%) |
| $7,500 to $9,999 | 2 (2.2%) | 0 (0.0%) |
| $10,000 to $12,499 | 8 (8.9%) | 6 (6.5%) |
| $12,500 to $14,999 | 0 (0.0%) | 7 (7.6%) |
| $15,000 to $17,499 | 0 (0.0%) | 8 (8.7%) |
| $17,500 to $19,999 | 0 (0.0%) | 2 (2.2%) |
| $20,000 to $22,499 | 3 (3.3%) | 2 (2.2%) |
| $22,500 to $24,999 | 1 (1.1%) | 2 (2.2%) |
| $25,000 to $29,999 | 13 (14.4%) | 5 (5.4%) |
| $30,000 to $34,999 | 0 (0.0%) | 7 (7.6%) |
| $35,000 to $39,999 | 11 (12.2%) | 2 (2.2%) |
| $40,000 to $44,999 | 16 (17.8%) | 5 (5.4%) |
| $45,000 to $49,999 | 3 (3.3%) | 1 (1.1%) |
| $50,000 to $54,999 | 2 (2.2%) | 5 (5.4%) |
| $55,000 to $64,999 | 5 (5.6%) | 5 (5.4%) |
| $65,000 to $74,999 | 7 (7.8%) | 4 (4.3%) |
| $75,000 to $99,999 | 7 (7.8%) | 4 (4.3%) |
| $100,000+ | 5 (5.6%) | 2 (2.2%) |
| Total | 90 (100.0%) | 92 (100.0%) |
Earnings by Sex by Educational Attainment in Laurel Run borough
Average earnings in Laurel Run borough are $41,250 for men and $18,125 for women, a difference of 56.1%. Men with an educational attainment of high school diploma enjoy the highest average annual earnings of $37,250, while those with high school diploma education earn the least with $37,250. Women with an educational attainment of college or associate's degree earn the most with the average annual earnings of $38,125, while those with high school diploma education have the smallest earnings of $15,179.
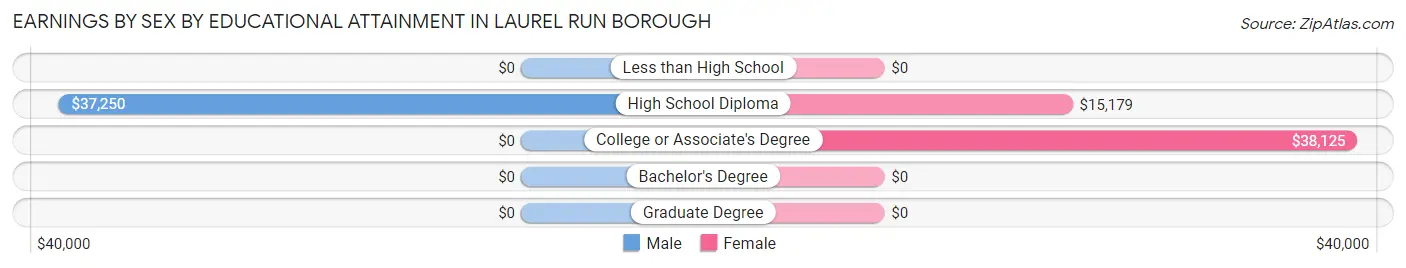
| Educational Attainment | Male Income | Female Income |
| Less than High School | - | - |
| High School Diploma | $37,250 | $15,179 |
| College or Associate's Degree | - | - |
| Bachelor's Degree | - | - |
| Graduate Degree | - | - |
| Total | $41,250 | $18,125 |
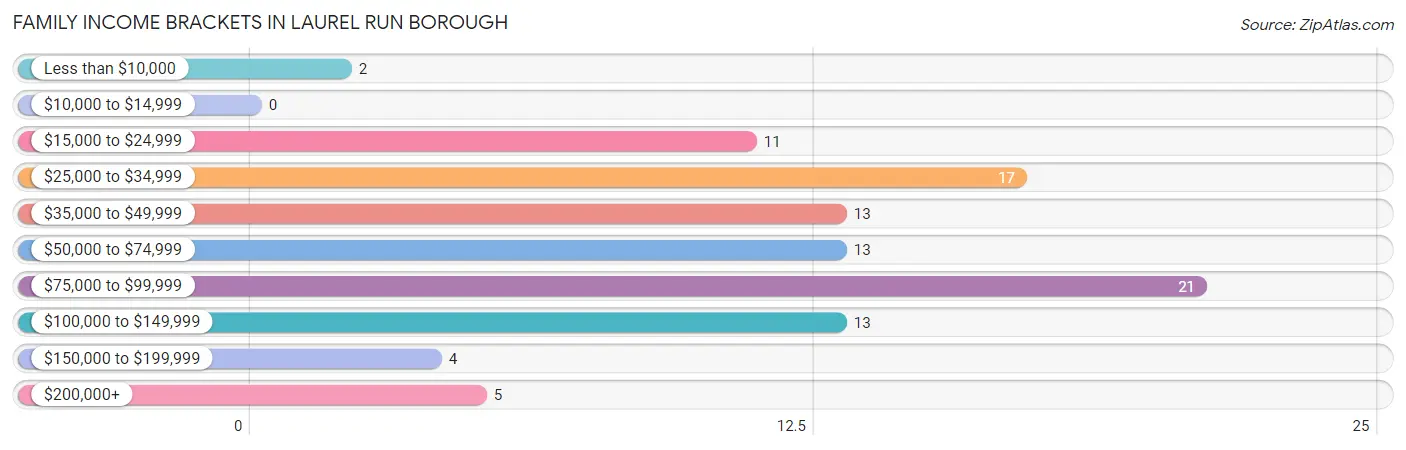
Family Income in Laurel Run borough
Family Income Brackets in Laurel Run borough
According to the Laurel Run borough family income data, there are 21 families falling into the $75,000 to $99,999 income range, which is the most common income bracket and makes up 21.2% of all families.
| Income Bracket | # Families | % Families |
| Less than $10,000 | 2 | 2.0% |
| $10,000 to $14,999 | 0 | 0.0% |
| $15,000 to $24,999 | 11 | 11.1% |
| $25,000 to $34,999 | 17 | 17.2% |
| $35,000 to $49,999 | 13 | 13.1% |
| $50,000 to $74,999 | 13 | 13.1% |
| $75,000 to $99,999 | 21 | 21.2% |
| $100,000 to $149,999 | 13 | 13.1% |
| $150,000 to $199,999 | 4 | 4.0% |
| $200,000+ | 5 | 5.1% |
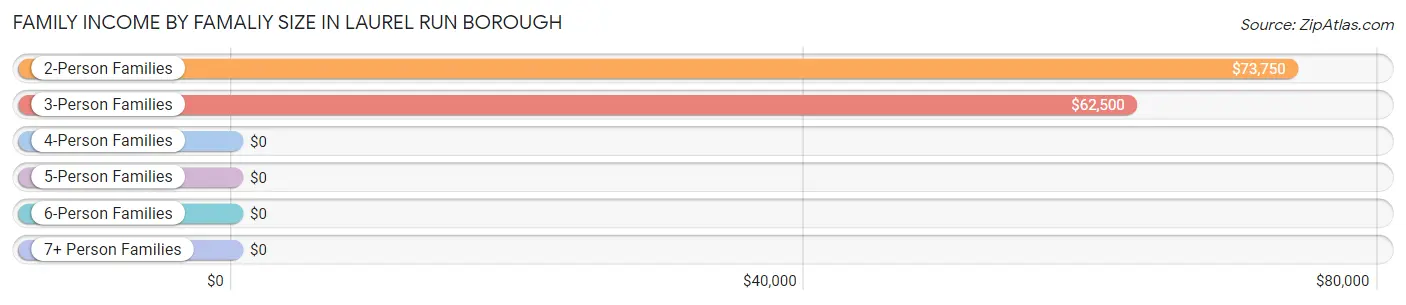
Family Income by Famaliy Size in Laurel Run borough
2-person families (54 | 54.5%) account for the highest median family income in Laurel Run borough with $73,750 per family, while 2-person families (54 | 54.5%) have the highest median income of $36,875 per family member.
| Income Bracket | # Families | Median Income |
| 2-Person Families | 54 (54.5%) | $73,750 |
| 3-Person Families | 20 (20.2%) | $62,500 |
| 4-Person Families | 14 (14.1%) | $0 |
| 5-Person Families | 11 (11.1%) | $0 |
| 6-Person Families | 0 (0.0%) | $0 |
| 7+ Person Families | 0 (0.0%) | $0 |
| Total | 99 (100.0%) | $65,625 |
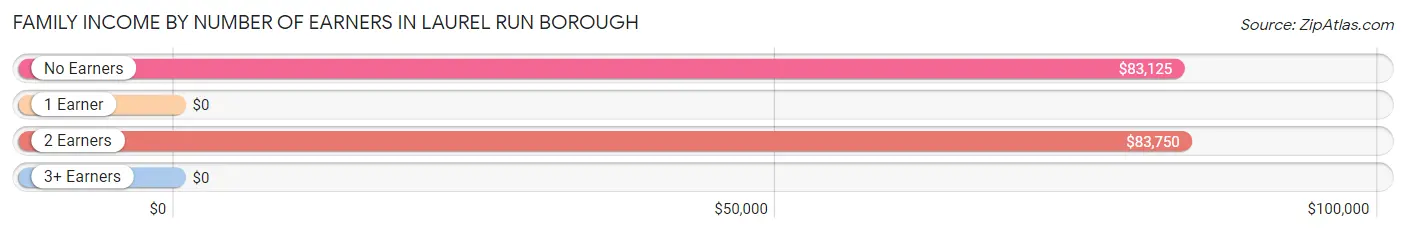
Family Income by Number of Earners in Laurel Run borough
| Number of Earners | # Families | Median Income |
| No Earners | 11 (11.1%) | $83,125 |
| 1 Earner | 48 (48.5%) | $0 |
| 2 Earners | 35 (35.3%) | $83,750 |
| 3+ Earners | 5 (5.1%) | $0 |
| Total | 99 (100.0%) | $65,625 |
Household Income in Laurel Run borough
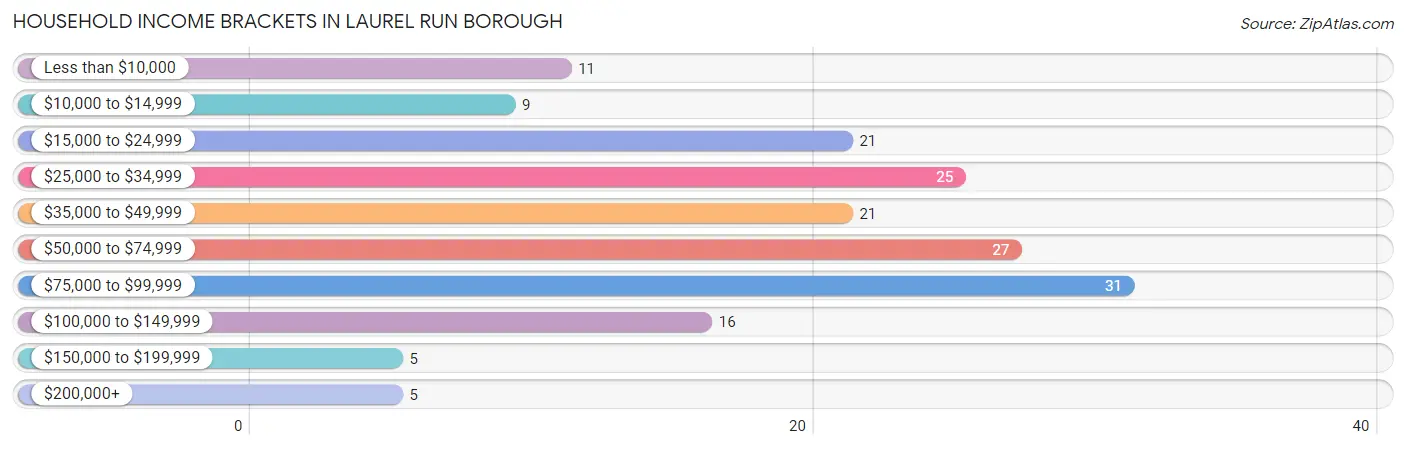
Household Income Brackets in Laurel Run borough
With 31 households falling in the category, the $75,000 to $99,999 income range is the most frequent in Laurel Run borough, accounting for 18.1% of all households. In contrast, only 5 households (2.9%) fall into the $150,000 to $199,999 income bracket, making it the least populous group.
| Income Bracket | # Households | % Households |
| Less than $10,000 | 11 | 6.4% |
| $10,000 to $14,999 | 9 | 5.3% |
| $15,000 to $24,999 | 21 | 12.3% |
| $25,000 to $34,999 | 25 | 14.6% |
| $35,000 to $49,999 | 21 | 12.3% |
| $50,000 to $74,999 | 27 | 15.8% |
| $75,000 to $99,999 | 31 | 18.1% |
| $100,000 to $149,999 | 16 | 9.4% |
| $150,000 to $199,999 | 5 | 2.9% |
| $200,000+ | 5 | 2.9% |
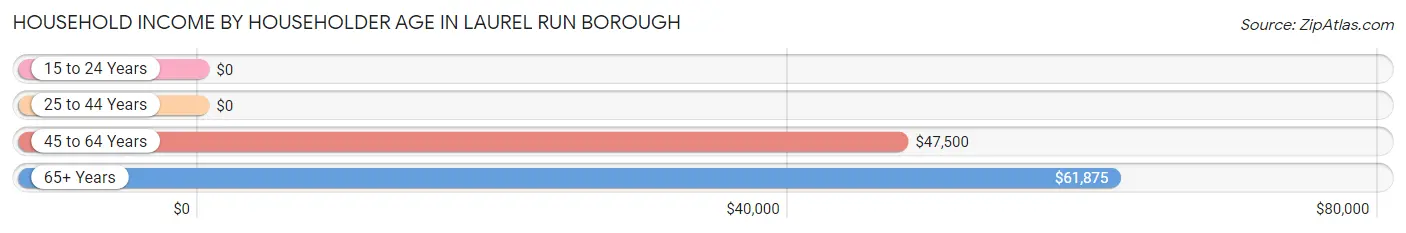
Household Income by Householder Age in Laurel Run borough
The median household income in Laurel Run borough is $49,250, with the highest median household income of $61,875 found in the 65+ years age bracket for the primary householder. A total of 64 households (37.4%) fall into this category. Meanwhile, the 15 to 24 years age bracket for the primary householder has the lowest median household income of $0, with 2 households (1.2%) in this group.
| Income Bracket | # Households | Median Income |
| 15 to 24 Years | 2 (1.2%) | $0 |
| 25 to 44 Years | 23 (13.5%) | $0 |
| 45 to 64 Years | 82 (47.9%) | $47,500 |
| 65+ Years | 64 (37.4%) | $61,875 |
| Total | 171 (100.0%) | $49,250 |
Poverty in Laurel Run borough
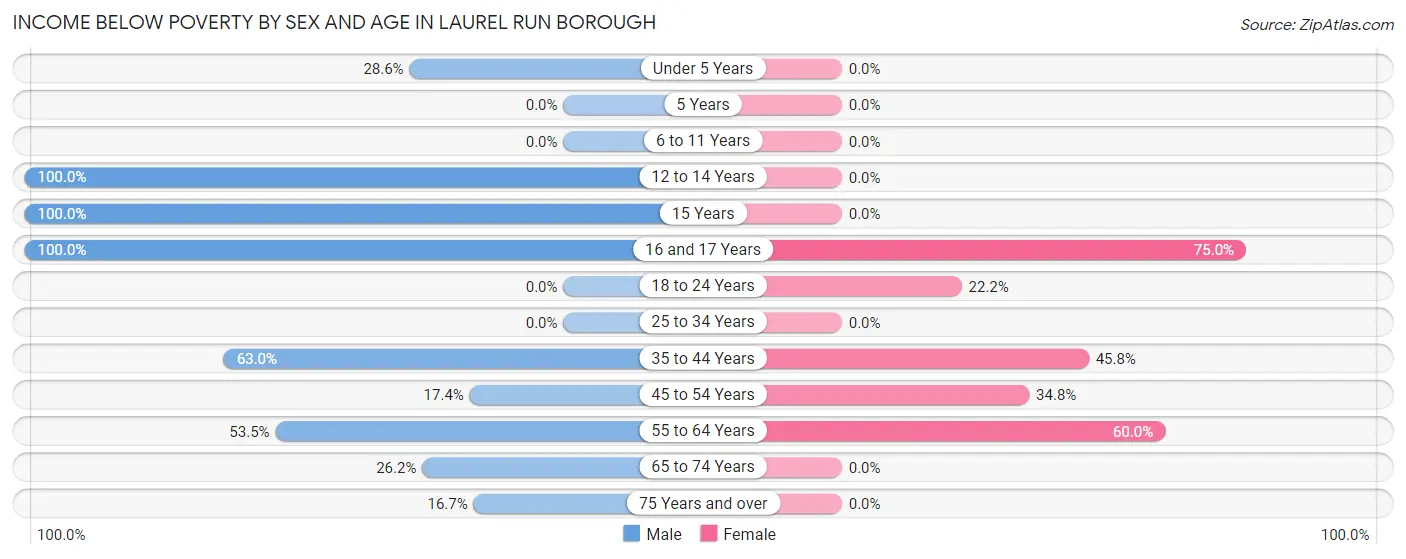
Income Below Poverty by Sex and Age in Laurel Run borough
With 43.5% poverty level for males and 34.4% for females among the residents of Laurel Run borough, 12 to 14 year old males and 16 and 17 year old females are the most vulnerable to poverty, with 2 males (100.0%) and 9 females (75.0%) in their respective age groups living below the poverty level.
| Age Bracket | Male | Female |
| Under 5 Years | 2 (28.6%) | 0 (0.0%) |
| 5 Years | 0 (0.0%) | 0 (0.0%) |
| 6 to 11 Years | 0 (0.0%) | 0 (0.0%) |
| 12 to 14 Years | 2 (100.0%) | 0 (0.0%) |
| 15 Years | 10 (100.0%) | 0 (0.0%) |
| 16 and 17 Years | 19 (100.0%) | 9 (75.0%) |
| 18 to 24 Years | 0 (0.0%) | 2 (22.2%) |
| 25 to 34 Years | 0 (0.0%) | 0 (0.0%) |
| 35 to 44 Years | 29 (63.0%) | 11 (45.8%) |
| 45 to 54 Years | 8 (17.4%) | 8 (34.8%) |
| 55 to 64 Years | 31 (53.4%) | 33 (60.0%) |
| 65 to 74 Years | 11 (26.2%) | 0 (0.0%) |
| 75 Years and over | 2 (16.7%) | 0 (0.0%) |
| Total | 114 (43.5%) | 63 (34.4%) |
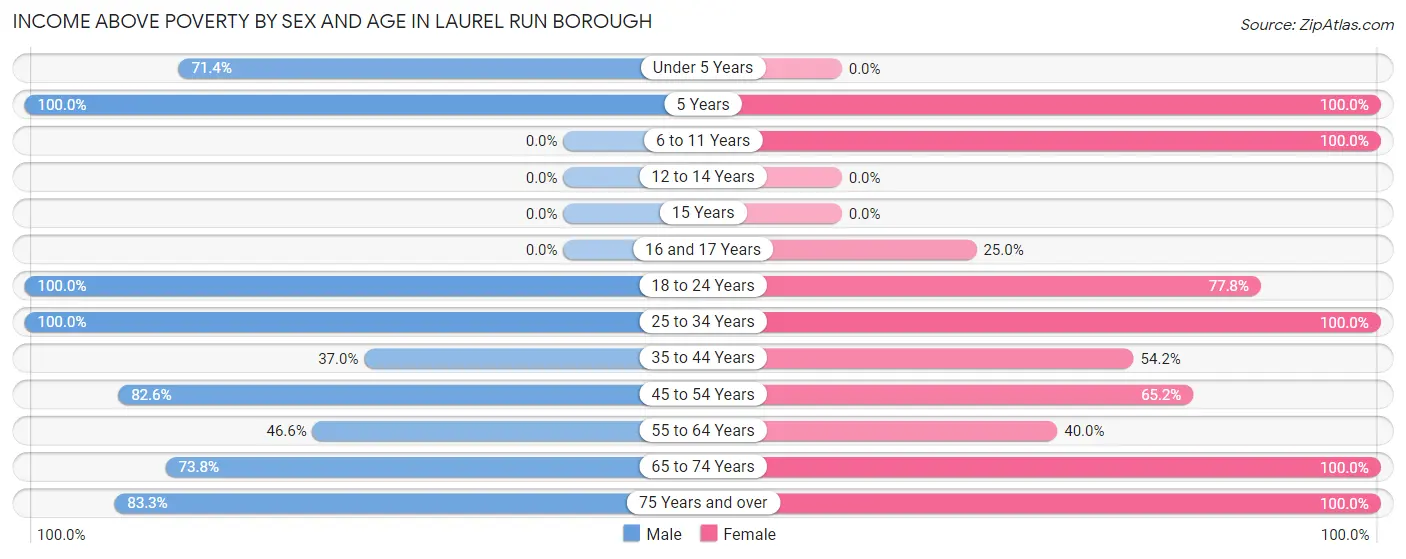
Income Above Poverty by Sex and Age in Laurel Run borough
According to the poverty statistics in Laurel Run borough, males aged 5 years and females aged 5 years are the age groups that are most secure financially, with 100.0% of males and 100.0% of females in these age groups living above the poverty line.
| Age Bracket | Male | Female |
| Under 5 Years | 5 (71.4%) | 0 (0.0%) |
| 5 Years | 2 (100.0%) | 3 (100.0%) |
| 6 to 11 Years | 0 (0.0%) | 1 (100.0%) |
| 12 to 14 Years | 0 (0.0%) | 0 (0.0%) |
| 15 Years | 0 (0.0%) | 0 (0.0%) |
| 16 and 17 Years | 0 (0.0%) | 3 (25.0%) |
| 18 to 24 Years | 10 (100.0%) | 7 (77.8%) |
| 25 to 34 Years | 8 (100.0%) | 6 (100.0%) |
| 35 to 44 Years | 17 (37.0%) | 13 (54.2%) |
| 45 to 54 Years | 38 (82.6%) | 15 (65.2%) |
| 55 to 64 Years | 27 (46.6%) | 22 (40.0%) |
| 65 to 74 Years | 31 (73.8%) | 38 (100.0%) |
| 75 Years and over | 10 (83.3%) | 12 (100.0%) |
| Total | 148 (56.5%) | 120 (65.6%) |
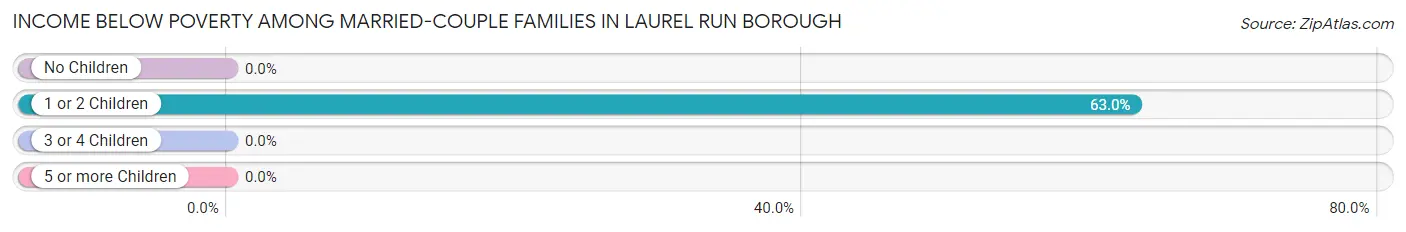
Income Below Poverty Among Married-Couple Families in Laurel Run borough
The poverty statistics for married-couple families in Laurel Run borough show that 23.6% or 17 of the total 72 families live below the poverty line. Families with 1 or 2 children have the highest poverty rate of 63.0%, comprising of 17 families. On the other hand, families with no children have the lowest poverty rate of 0.0%, which includes 0 families.
| Children | Above Poverty | Below Poverty |
| No Children | 45 (100.0%) | 0 (0.0%) |
| 1 or 2 Children | 10 (37.0%) | 17 (63.0%) |
| 3 or 4 Children | 0 (0.0%) | 0 (0.0%) |
| 5 or more Children | 0 (0.0%) | 0 (0.0%) |
| Total | 55 (76.4%) | 17 (23.6%) |
Income Below Poverty Among Single-Parent Households in Laurel Run borough
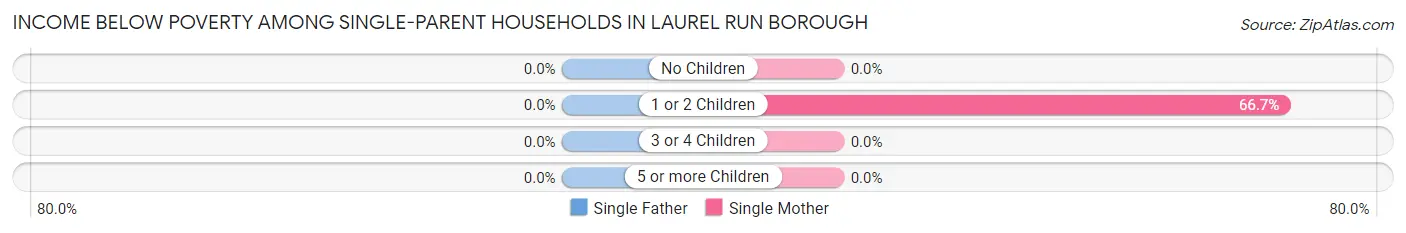
| Children | Single Father | Single Mother |
| No Children | 0 (0.0%) | 0 (0.0%) |
| 1 or 2 Children | 0 (0.0%) | 2 (66.7%) |
| 3 or 4 Children | 0 (0.0%) | 0 (0.0%) |
| 5 or more Children | 0 (0.0%) | 0 (0.0%) |
| Total | 0 (0.0%) | 2 (16.7%) |
Income Below Poverty Among Married-Couple vs Single-Parent Households in Laurel Run borough
The poverty data for Laurel Run borough shows that 17 of the married-couple family households (23.6%) and 2 of the single-parent households (7.4%) are living below the poverty level. Within the married-couple family households, those with 1 or 2 children have the highest poverty rate, with 17 households (63.0%) falling below the poverty line. Among the single-parent households, those with 1 or 2 children have the highest poverty rate, with 2 household (66.7%) living below poverty.
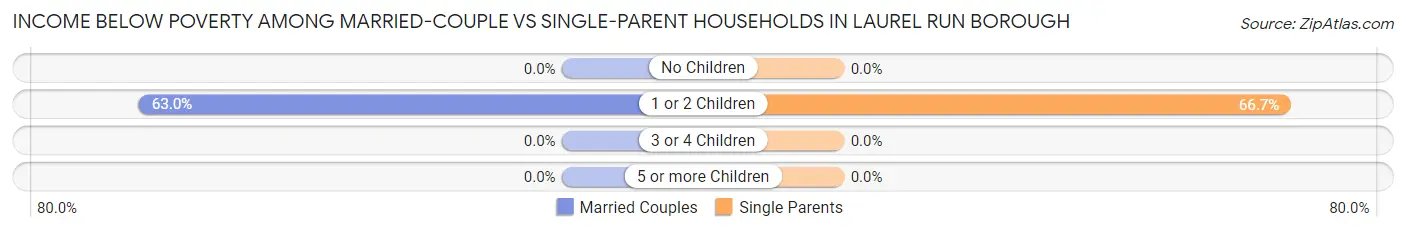
| Children | Married-Couple Families | Single-Parent Households |
| No Children | 0 (0.0%) | 0 (0.0%) |
| 1 or 2 Children | 17 (63.0%) | 2 (66.7%) |
| 3 or 4 Children | 0 (0.0%) | 0 (0.0%) |
| 5 or more Children | 0 (0.0%) | 0 (0.0%) |
| Total | 17 (23.6%) | 2 (7.4%) |
Race in Laurel Run borough
The most populous races in Laurel Run borough are White / Caucasian (367 | 81.7%), Some other Race (46 | 10.2%), and Two or more Races (31 | 6.9%).
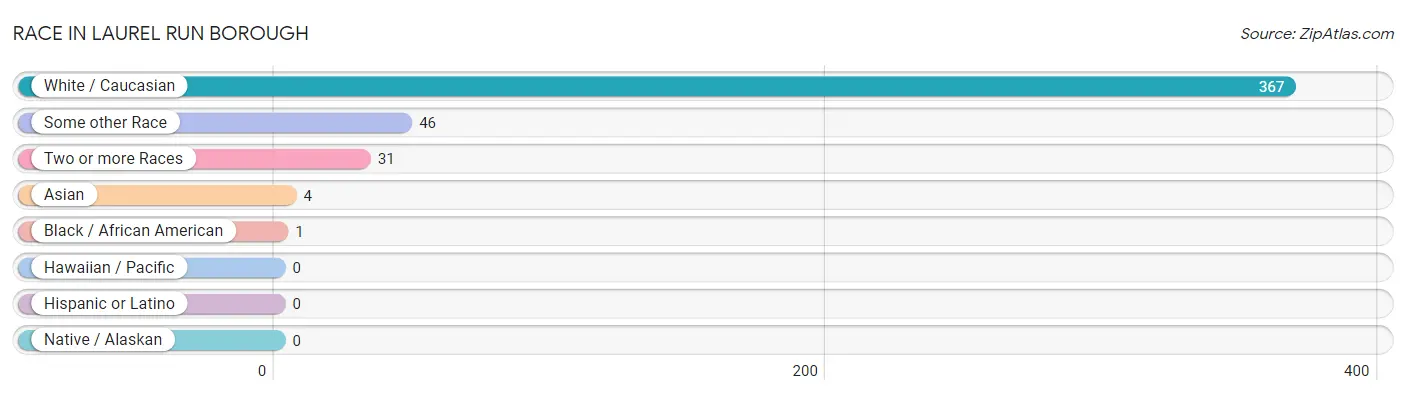
| Race | # Population | % Population |
| Asian | 4 | 0.9% |
| Black / African American | 1 | 0.2% |
| Hawaiian / Pacific | 0 | 0.0% |
| Hispanic or Latino | 0 | 0.0% |
| Native / Alaskan | 0 | 0.0% |
| White / Caucasian | 367 | 81.7% |
| Two or more Races | 31 | 6.9% |
| Some other Race | 46 | 10.2% |
| Total | 449 | 100.0% |
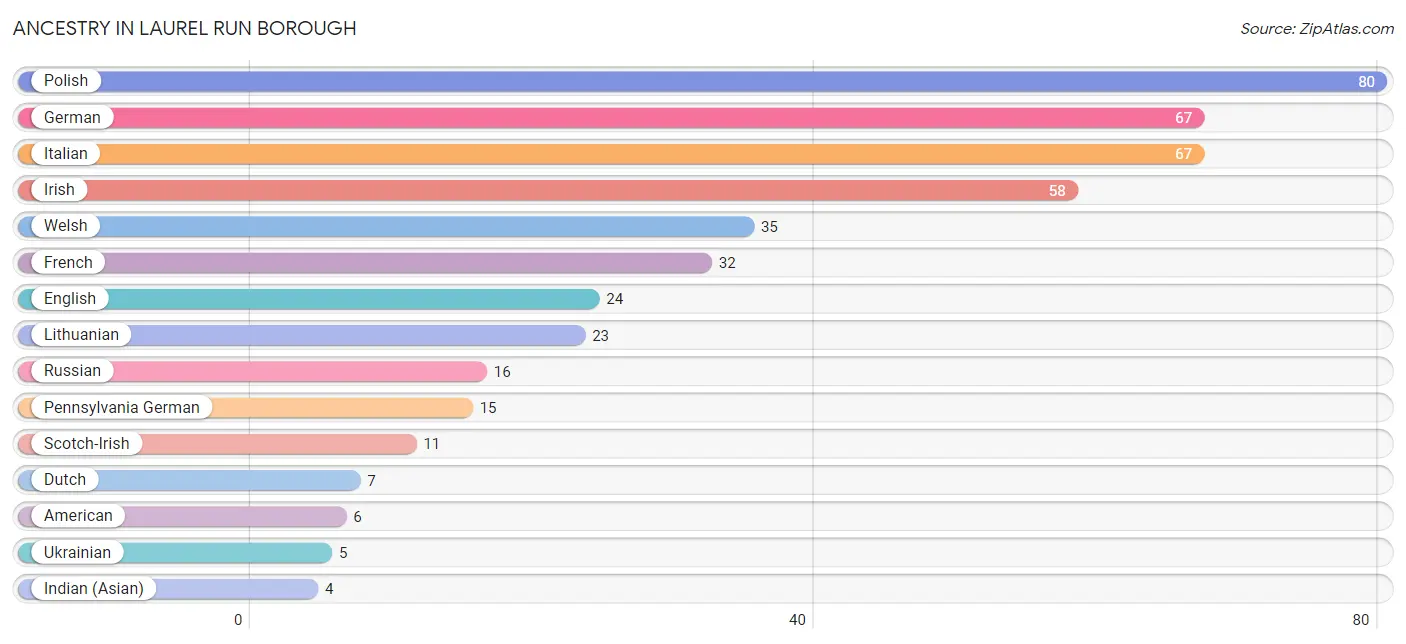
Ancestry in Laurel Run borough
The most populous ancestries reported in Laurel Run borough are Polish (80 | 17.8%), German (67 | 14.9%), Italian (67 | 14.9%), Irish (58 | 12.9%), and Welsh (35 | 7.8%), together accounting for 68.4% of all Laurel Run borough residents.
| Ancestry | # Population | % Population |
| American | 6 | 1.3% |
| Arab | 2 | 0.4% |
| British | 2 | 0.4% |
| Carpatho Rusyn | 2 | 0.4% |
| Dutch | 7 | 1.6% |
| English | 24 | 5.3% |
| French | 32 | 7.1% |
| German | 67 | 14.9% |
| Indian (Asian) | 4 | 0.9% |
| Irish | 58 | 12.9% |
| Italian | 67 | 14.9% |
| Lithuanian | 23 | 5.1% |
| Pennsylvania German | 15 | 3.3% |
| Polish | 80 | 17.8% |
| Russian | 16 | 3.6% |
| Scandinavian | 2 | 0.4% |
| Scotch-Irish | 11 | 2.5% |
| Syrian | 2 | 0.4% |
| Ukrainian | 5 | 1.1% |
| Welsh | 35 | 7.8% | View All 20 Rows |
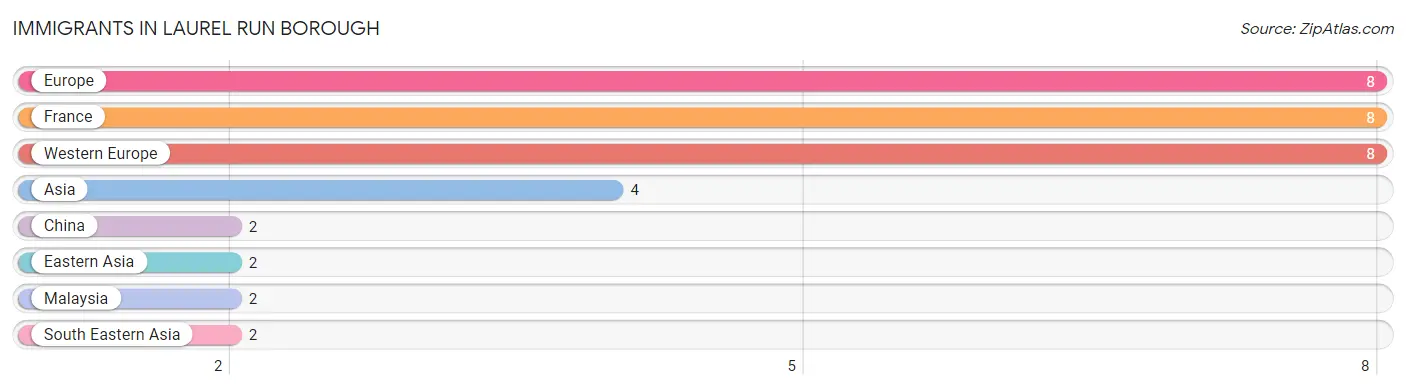
Immigrants in Laurel Run borough
The most numerous immigrant groups reported in Laurel Run borough came from Europe (8 | 1.8%), France (8 | 1.8%), Western Europe (8 | 1.8%), Asia (4 | 0.9%), and China (2 | 0.4%), together accounting for 6.7% of all Laurel Run borough residents.
| Immigration Origin | # Population | % Population |
| Asia | 4 | 0.9% |
| China | 2 | 0.4% |
| Eastern Asia | 2 | 0.4% |
| Europe | 8 | 1.8% |
| France | 8 | 1.8% |
| Malaysia | 2 | 0.4% |
| South Eastern Asia | 2 | 0.4% |
| Western Europe | 8 | 1.8% | View All 8 Rows |
Sex and Age in Laurel Run borough
Sex and Age in Laurel Run borough
The most populous age groups in Laurel Run borough are 60 to 64 Years (46 | 17.3%) for men and 60 to 64 Years (35 | 19.1%) for women.
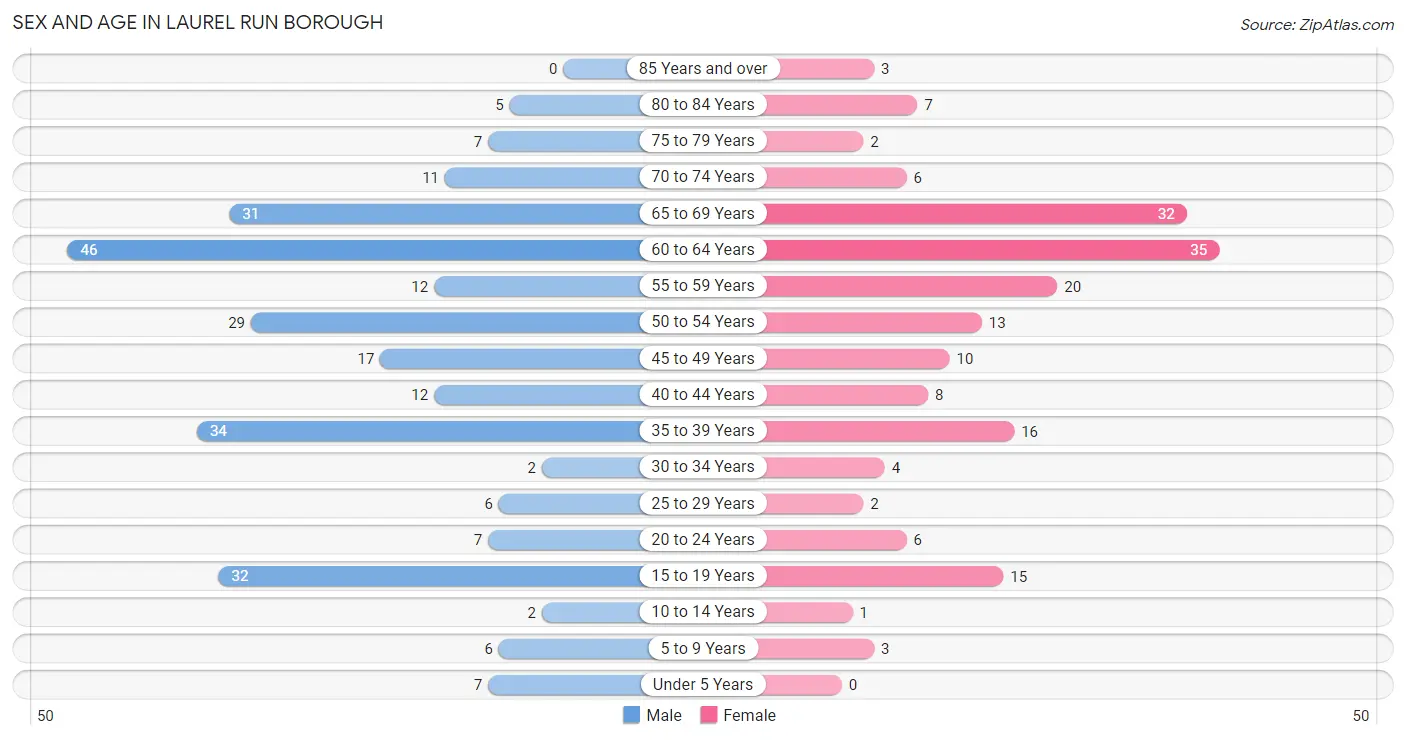
| Age Bracket | Male | Female |
| Under 5 Years | 7 (2.6%) | 0 (0.0%) |
| 5 to 9 Years | 6 (2.3%) | 3 (1.6%) |
| 10 to 14 Years | 2 (0.7%) | 1 (0.5%) |
| 15 to 19 Years | 32 (12.0%) | 15 (8.2%) |
| 20 to 24 Years | 7 (2.6%) | 6 (3.3%) |
| 25 to 29 Years | 6 (2.3%) | 2 (1.1%) |
| 30 to 34 Years | 2 (0.7%) | 4 (2.2%) |
| 35 to 39 Years | 34 (12.8%) | 16 (8.7%) |
| 40 to 44 Years | 12 (4.5%) | 8 (4.4%) |
| 45 to 49 Years | 17 (6.4%) | 10 (5.5%) |
| 50 to 54 Years | 29 (10.9%) | 13 (7.1%) |
| 55 to 59 Years | 12 (4.5%) | 20 (10.9%) |
| 60 to 64 Years | 46 (17.3%) | 35 (19.1%) |
| 65 to 69 Years | 31 (11.7%) | 32 (17.5%) |
| 70 to 74 Years | 11 (4.1%) | 6 (3.3%) |
| 75 to 79 Years | 7 (2.6%) | 2 (1.1%) |
| 80 to 84 Years | 5 (1.9%) | 7 (3.8%) |
| 85 Years and over | 0 (0.0%) | 3 (1.6%) |
| Total | 266 (100.0%) | 183 (100.0%) |
Families and Households in Laurel Run borough
Median Family Size in Laurel Run borough
The median family size in Laurel Run borough is 2.83 persons per family, with married-couple families (72 | 72.7%) accounting for the largest median family size of 3.04 persons per family. On the other hand, single male/father families (15 | 15.1%) represent the smallest median family size with 1.93 persons per family.
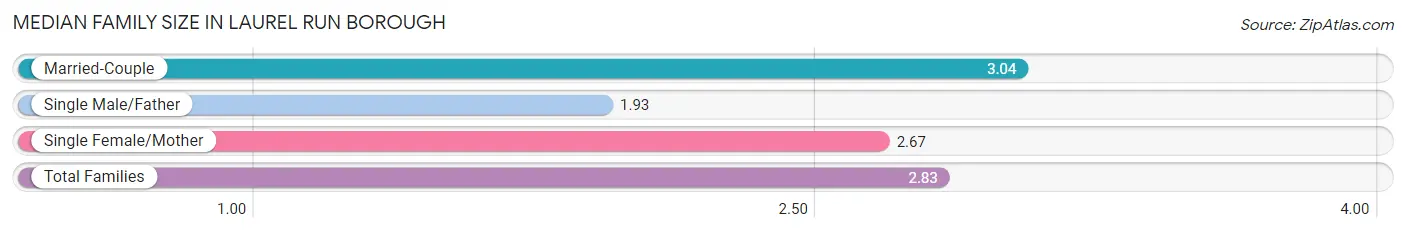
| Family Type | # Families | Family Size |
| Married-Couple | 72 (72.7%) | 3.04 |
| Single Male/Father | 15 (15.1%) | 1.93 |
| Single Female/Mother | 12 (12.1%) | 2.67 |
| Total Families | 99 (100.0%) | 2.83 |
Median Household Size in Laurel Run borough
The median household size in Laurel Run borough is 2.22 persons per household, with single female/mother households (12 | 7.0%) accounting for the largest median household size of 3.5 persons per household. non-family households (72 | 42.1%) represent the smallest median household size with 1.21 persons per household.
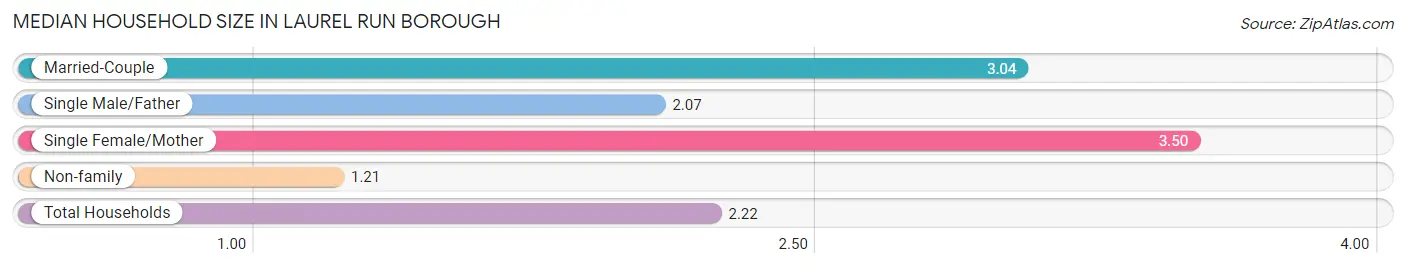
| Household Type | # Households | Household Size |
| Married-Couple | 72 (42.1%) | 3.04 |
| Single Male/Father | 15 (8.8%) | 2.07 |
| Single Female/Mother | 12 (7.0%) | 3.50 |
| Non-family | 72 (42.1%) | 1.21 |
| Total Households | 171 (100.0%) | 2.22 |
Household Size by Marriage Status in Laurel Run borough
Out of a total of 171 households in Laurel Run borough, 99 (57.9%) are family households, while 72 (42.1%) are nonfamily households. The most numerous type of family households are 2-person households, comprising 47, and the most common type of nonfamily households are 1-person households, comprising 56.
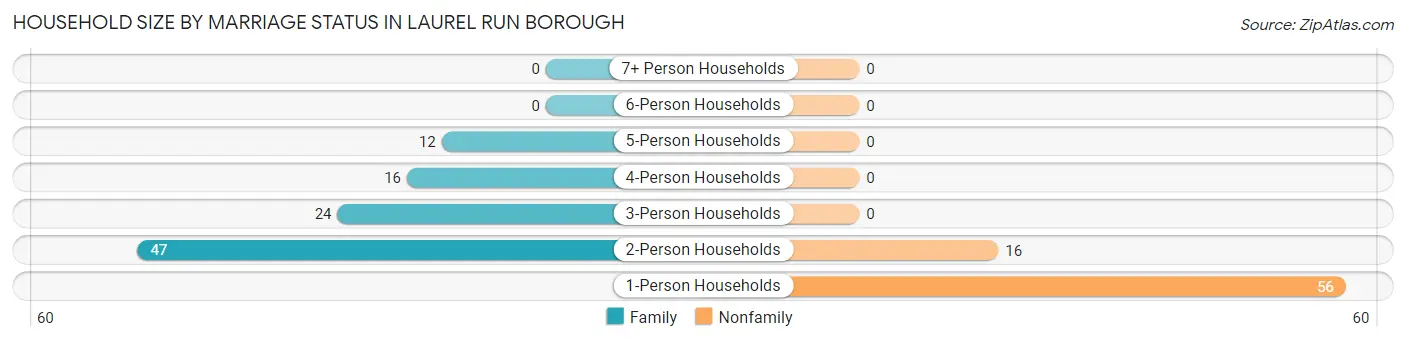
| Household Size | Family Households | Nonfamily Households |
| 1-Person Households | - | 56 (32.8%) |
| 2-Person Households | 47 (27.5%) | 16 (9.4%) |
| 3-Person Households | 24 (14.0%) | 0 (0.0%) |
| 4-Person Households | 16 (9.4%) | 0 (0.0%) |
| 5-Person Households | 12 (7.0%) | 0 (0.0%) |
| 6-Person Households | 0 (0.0%) | 0 (0.0%) |
| 7+ Person Households | 0 (0.0%) | 0 (0.0%) |
| Total | 99 (57.9%) | 72 (42.1%) |
Female Fertility in Laurel Run borough
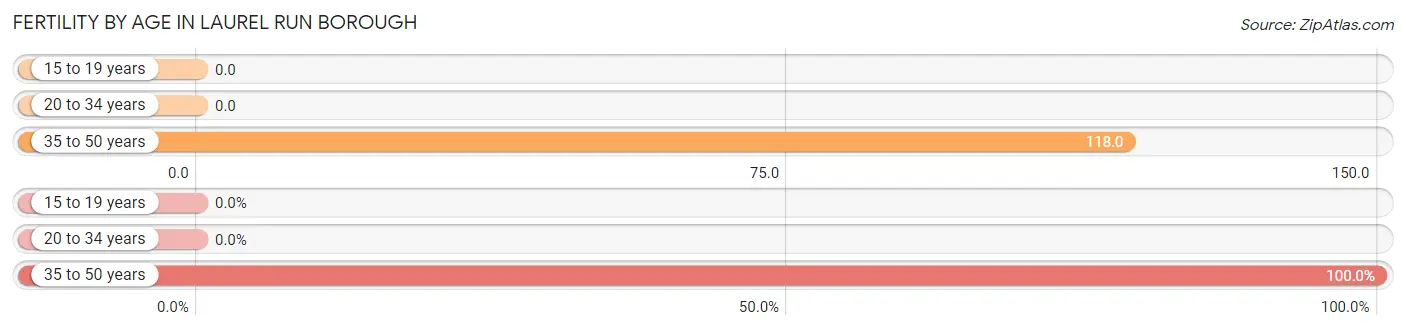
Fertility by Age in Laurel Run borough
Average fertility rate in Laurel Run borough is 66.0 births per 1,000 women. Women in the age bracket of 35 to 50 years have the highest fertility rate with 118.0 births per 1,000 women. Women in the age bracket of 35 to 50 years acount for 100.0% of all women with births.
| Age Bracket | Women with Births | Births / 1,000 Women |
| 15 to 19 years | 0 (0.0%) | 0.0 |
| 20 to 34 years | 0 (0.0%) | 0.0 |
| 35 to 50 years | 4 (100.0%) | 118.0 |
| Total | 4 (100.0%) | 66.0 |
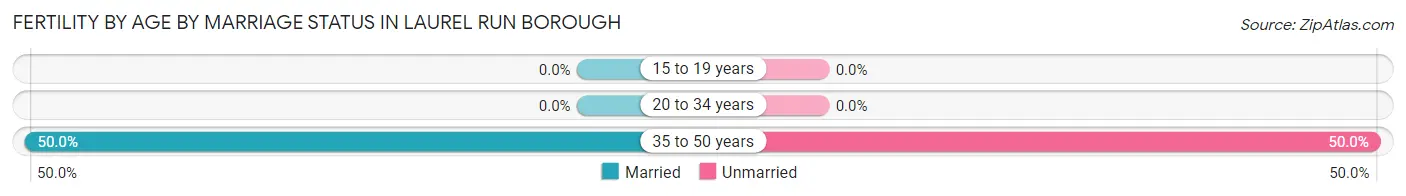
Fertility by Age by Marriage Status in Laurel Run borough
50.0% of women with births (4) in Laurel Run borough are married. The highest percentage of unmarried women with births falls into 35 to 50 years age bracket with 50.0% of them unmarried at the time of birth, while the lowest percentage of unmarried women with births belong to 35 to 50 years age bracket with 50.0% of them unmarried.
| Age Bracket | Married | Unmarried |
| 15 to 19 years | 0 (0.0%) | 0 (0.0%) |
| 20 to 34 years | 0 (0.0%) | 0 (0.0%) |
| 35 to 50 years | 2 (50.0%) | 2 (50.0%) |
| Total | 2 (50.0%) | 2 (50.0%) |
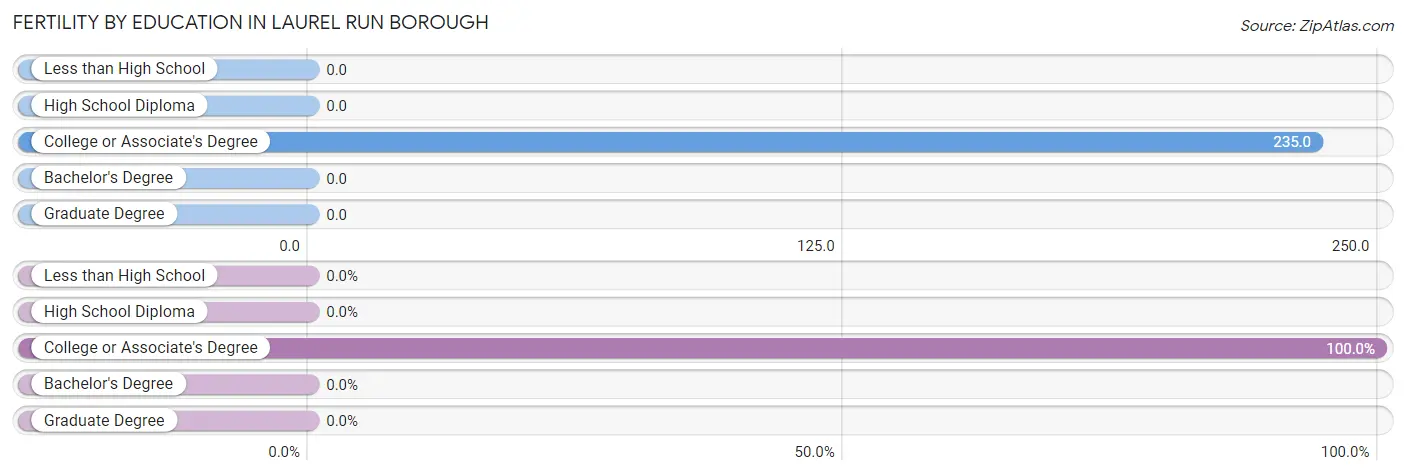
Fertility by Education in Laurel Run borough
| Educational Attainment | Women with Births | Births / 1,000 Women |
| Less than High School | 0 (0.0%) | 0.0 |
| High School Diploma | 0 (0.0%) | 0.0 |
| College or Associate's Degree | 4 (100.0%) | 235.0 |
| Bachelor's Degree | 0 (0.0%) | 0.0 |
| Graduate Degree | 0 (0.0%) | 0.0 |
| Total | 4 (100.0%) | 66.0 |
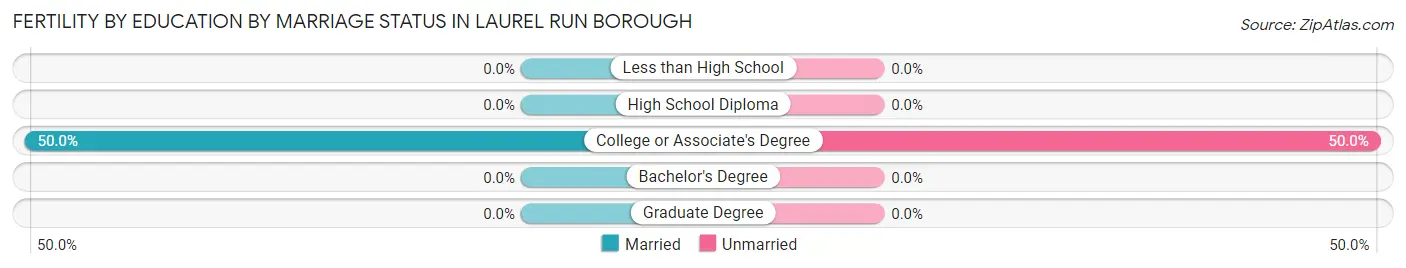
Fertility by Education by Marriage Status in Laurel Run borough
50.0% of women with births in Laurel Run borough are unmarried. Women with the educational attainment of college or associate's degree are most likely to be married with 50.0% of them married at childbirth, while women with the educational attainment of college or associate's degree are least likely to be married with 50.0% of them unmarried at childbirth.
| Educational Attainment | Married | Unmarried |
| Less than High School | 0 (0.0%) | 0 (0.0%) |
| High School Diploma | 0 (0.0%) | 0 (0.0%) |
| College or Associate's Degree | 2 (50.0%) | 2 (50.0%) |
| Bachelor's Degree | 0 (0.0%) | 0 (0.0%) |
| Graduate Degree | 0 (0.0%) | 0 (0.0%) |
| Total | 2 (50.0%) | 2 (50.0%) |
Employment Characteristics in Laurel Run borough
Employment by Class of Employer in Laurel Run borough
Among the 148 employed individuals in Laurel Run borough, private company employees (106 | 71.6%), not-for-profit organizations (10 | 6.8%), and local government employees (10 | 6.8%) make up the most common classes of employment.
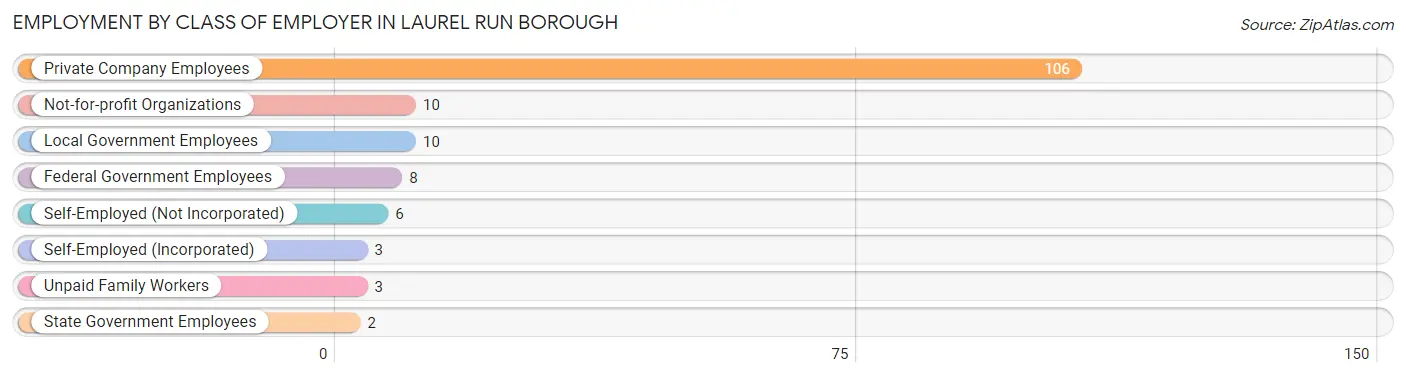
| Employer Class | # Employees | % Employees |
| Private Company Employees | 106 | 71.6% |
| Self-Employed (Incorporated) | 3 | 2.0% |
| Self-Employed (Not Incorporated) | 6 | 4.1% |
| Not-for-profit Organizations | 10 | 6.8% |
| Local Government Employees | 10 | 6.8% |
| State Government Employees | 2 | 1.3% |
| Federal Government Employees | 8 | 5.4% |
| Unpaid Family Workers | 3 | 2.0% |
| Total | 148 | 100.0% |
Employment Status by Age in Laurel Run borough
According to the labor force statistics for Laurel Run borough, out of the total population over 16 years of age (420), 46.2% or 194 individuals are in the labor force, with 22.7% or 44 of them unemployed. The age group with the highest labor force participation rate is 20 to 24 years, with 100.0% or 13 individuals in the labor force. Within the labor force, the 16 to 19 years age range has the highest percentage of unemployed individuals, with 88.0% or 22 of them being unemployed.
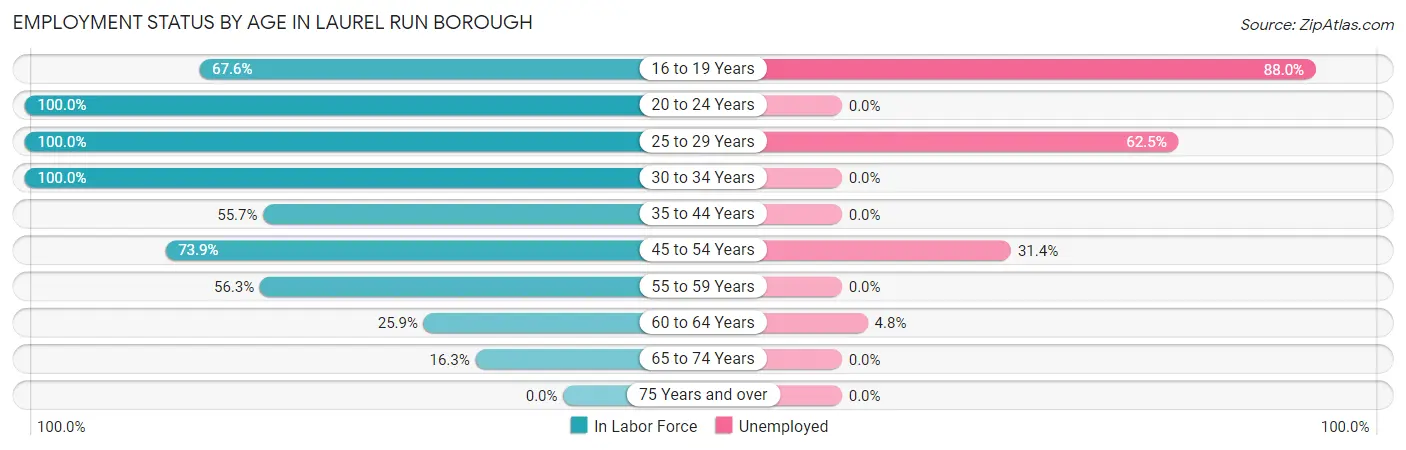
| Age Bracket | In Labor Force | Unemployed |
| 16 to 19 Years | 25 (67.6%) | 22 (88.0%) |
| 20 to 24 Years | 13 (100.0%) | 0 (0.0%) |
| 25 to 29 Years | 8 (100.0%) | 5 (62.5%) |
| 30 to 34 Years | 6 (100.0%) | 0 (0.0%) |
| 35 to 44 Years | 39 (55.7%) | 0 (0.0%) |
| 45 to 54 Years | 51 (73.9%) | 16 (31.4%) |
| 55 to 59 Years | 18 (56.3%) | 0 (0.0%) |
| 60 to 64 Years | 21 (25.9%) | 1 (4.8%) |
| 65 to 74 Years | 13 (16.3%) | 0 (0.0%) |
| 75 Years and over | 0 (0.0%) | 0 (0.0%) |
| Total | 194 (46.2%) | 44 (22.7%) |
Employment Status by Educational Attainment in Laurel Run borough
According to labor force statistics for Laurel Run borough, 53.8% of individuals (143) out of the total population between 25 and 64 years of age (266) are in the labor force, with 15.4% or 22 of them being unemployed. The group with the highest labor force participation rate are those with the educational attainment of bachelor's degree or higher, with 90.9% or 20 individuals in the labor force. Within the labor force, individuals with college / associate degree education have the highest percentage of unemployment, with 23.1% or 9 of them being unemployed.
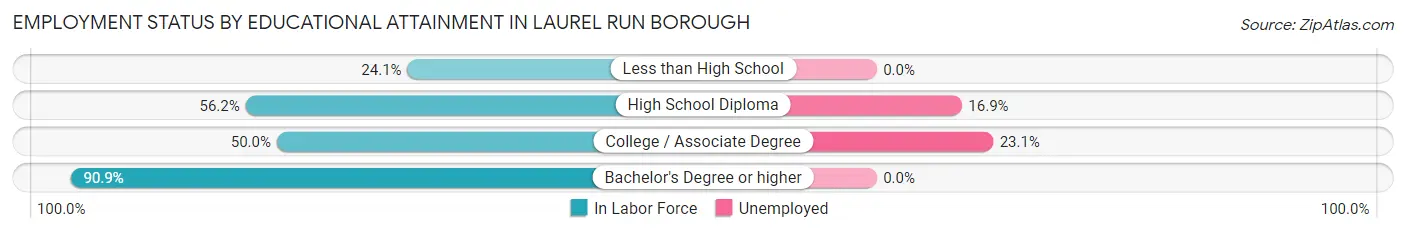
| Educational Attainment | In Labor Force | Unemployed |
| Less than High School | 7 (24.1%) | 0 (0.0%) |
| High School Diploma | 77 (56.2%) | 23 (16.9%) |
| College / Associate Degree | 39 (50.0%) | 18 (23.1%) |
| Bachelor's Degree or higher | 20 (90.9%) | 0 (0.0%) |
| Total | 143 (53.8%) | 41 (15.4%) |
Employment Occupations by Sex in Laurel Run borough
Management, Business, Science and Arts Occupations
The most common Management, Business, Science and Arts occupations in Laurel Run borough are Health Diagnosing & Treating (18 | 12.0%), Management (14 | 9.3%), Business & Financial (7 | 4.7%), Health Technologists (6 | 4.0%), and Computers, Engineering & Science (2 | 1.3%).
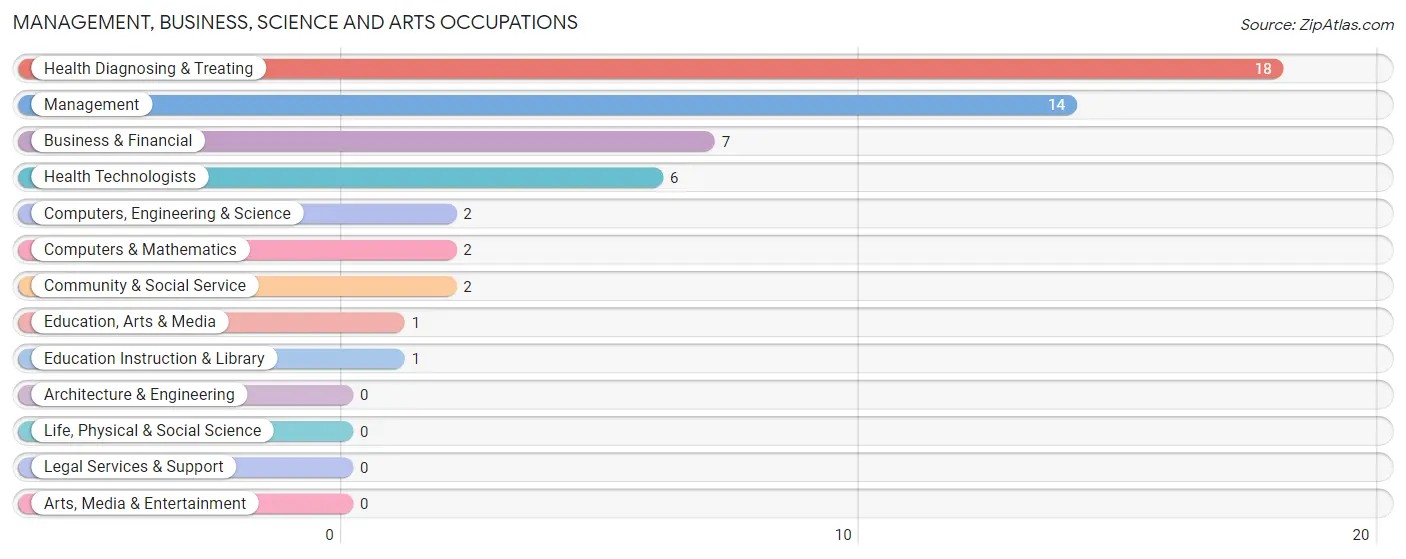
Management, Business, Science and Arts Occupations by Sex
Within the Management, Business, Science and Arts occupations in Laurel Run borough, the most male-oriented occupations are Computers, Engineering & Science (100.0%), Computers & Mathematics (100.0%), and Management (42.9%), while the most female-oriented occupations are Business & Financial (100.0%), Community & Social Service (100.0%), and Education, Arts & Media (100.0%).
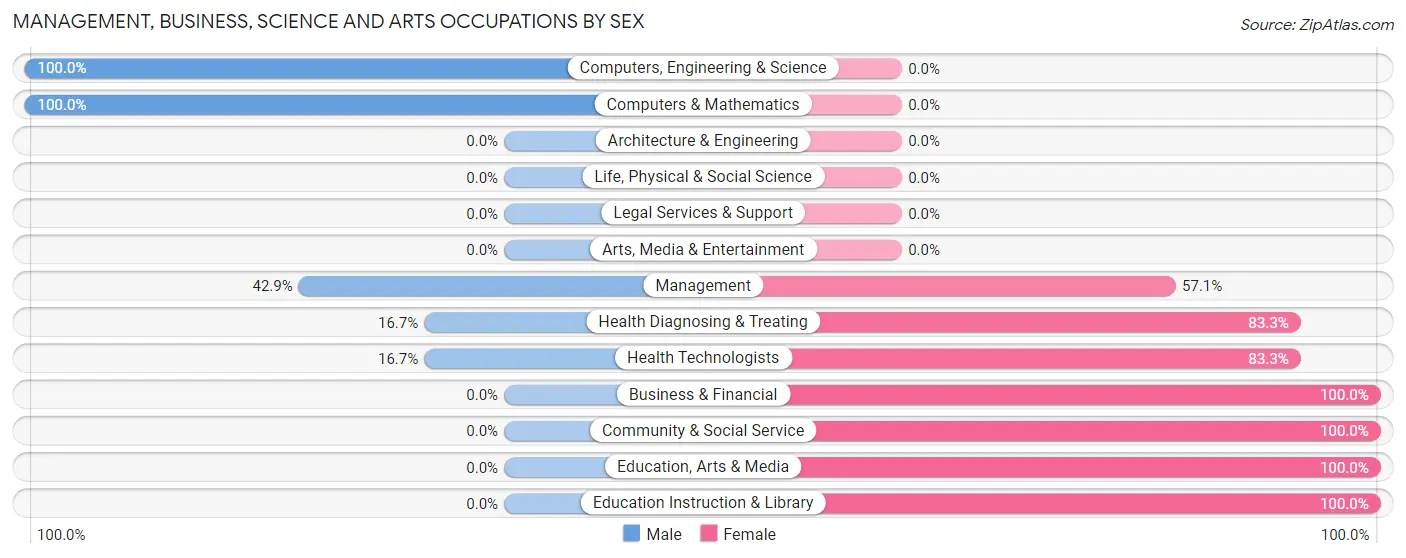
| Occupation | Male | Female |
| Management | 6 (42.9%) | 8 (57.1%) |
| Business & Financial | 0 (0.0%) | 7 (100.0%) |
| Computers, Engineering & Science | 2 (100.0%) | 0 (0.0%) |
| Computers & Mathematics | 2 (100.0%) | 0 (0.0%) |
| Architecture & Engineering | 0 (0.0%) | 0 (0.0%) |
| Life, Physical & Social Science | 0 (0.0%) | 0 (0.0%) |
| Community & Social Service | 0 (0.0%) | 2 (100.0%) |
| Education, Arts & Media | 0 (0.0%) | 1 (100.0%) |
| Legal Services & Support | 0 (0.0%) | 0 (0.0%) |
| Education Instruction & Library | 0 (0.0%) | 1 (100.0%) |
| Arts, Media & Entertainment | 0 (0.0%) | 0 (0.0%) |
| Health Diagnosing & Treating | 3 (16.7%) | 15 (83.3%) |
| Health Technologists | 1 (16.7%) | 5 (83.3%) |
| Total (Category) | 11 (25.6%) | 32 (74.4%) |
| Total (Overall) | 72 (48.0%) | 78 (52.0%) |
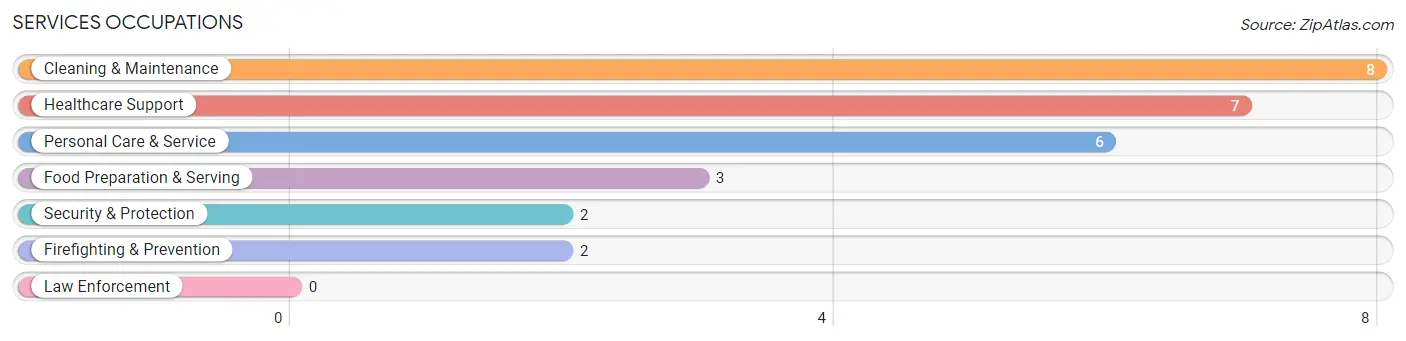
Services Occupations
The most common Services occupations in Laurel Run borough are Cleaning & Maintenance (8 | 5.3%), Healthcare Support (7 | 4.7%), Personal Care & Service (6 | 4.0%), Food Preparation & Serving (3 | 2.0%), and Security & Protection (2 | 1.3%).
Services Occupations by Sex
Within the Services occupations in Laurel Run borough, the most male-oriented occupations are Security & Protection (100.0%), Firefighting & Prevention (100.0%), and Personal Care & Service (66.7%), while the most female-oriented occupations are Healthcare Support (100.0%), Food Preparation & Serving (100.0%), and Cleaning & Maintenance (50.0%).
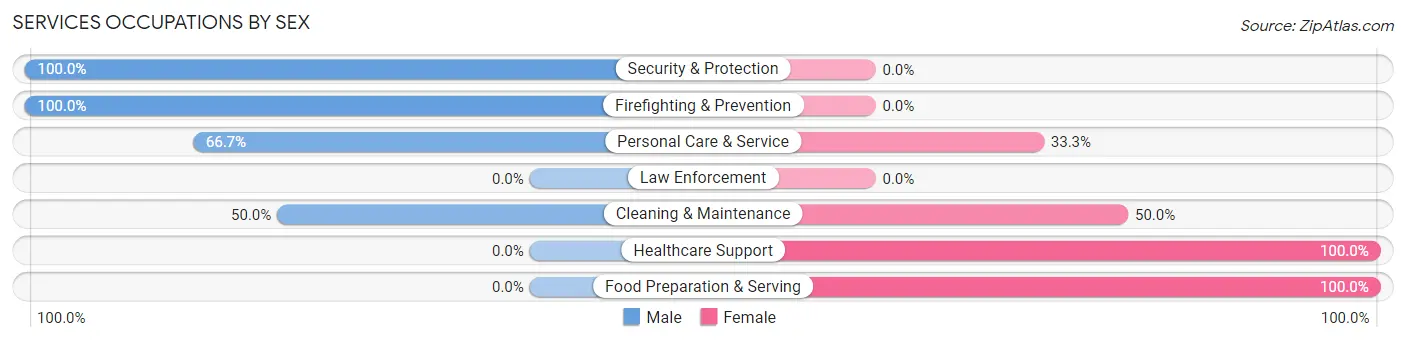
| Occupation | Male | Female |
| Healthcare Support | 0 (0.0%) | 7 (100.0%) |
| Security & Protection | 2 (100.0%) | 0 (0.0%) |
| Firefighting & Prevention | 2 (100.0%) | 0 (0.0%) |
| Law Enforcement | 0 (0.0%) | 0 (0.0%) |
| Food Preparation & Serving | 0 (0.0%) | 3 (100.0%) |
| Cleaning & Maintenance | 4 (50.0%) | 4 (50.0%) |
| Personal Care & Service | 4 (66.7%) | 2 (33.3%) |
| Total (Category) | 10 (38.5%) | 16 (61.5%) |
| Total (Overall) | 72 (48.0%) | 78 (52.0%) |
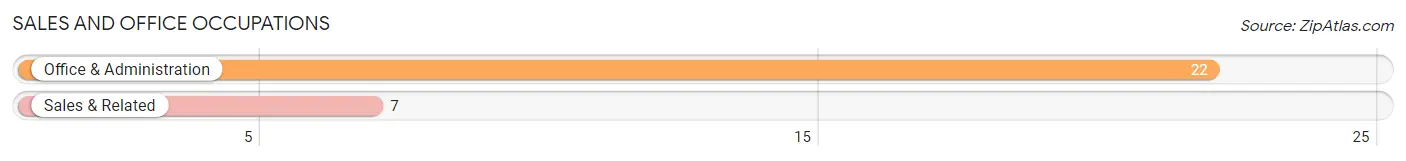
Sales and Office Occupations
The most common Sales and Office occupations in Laurel Run borough are Office & Administration (22 | 14.7%), and Sales & Related (7 | 4.7%).
Sales and Office Occupations by Sex
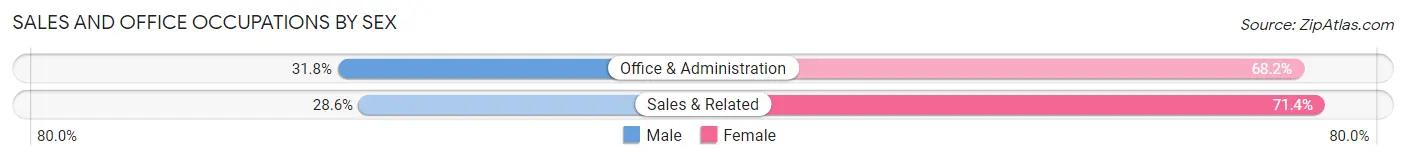
| Occupation | Male | Female |
| Sales & Related | 2 (28.6%) | 5 (71.4%) |
| Office & Administration | 7 (31.8%) | 15 (68.2%) |
| Total (Category) | 9 (31.0%) | 20 (69.0%) |
| Total (Overall) | 72 (48.0%) | 78 (52.0%) |
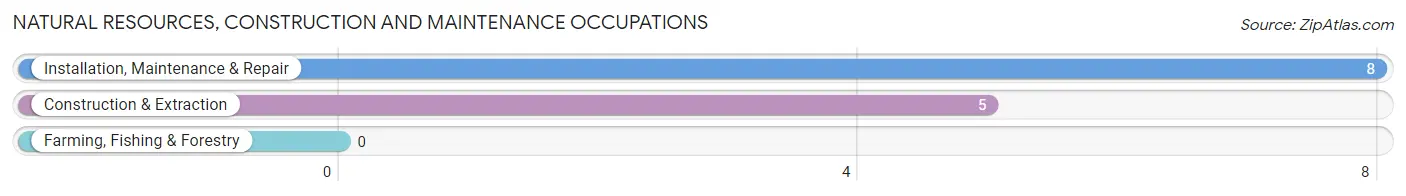
Natural Resources, Construction and Maintenance Occupations
The most common Natural Resources, Construction and Maintenance occupations in Laurel Run borough are Installation, Maintenance & Repair (8 | 5.3%), and Construction & Extraction (5 | 3.3%).
Natural Resources, Construction and Maintenance Occupations by Sex
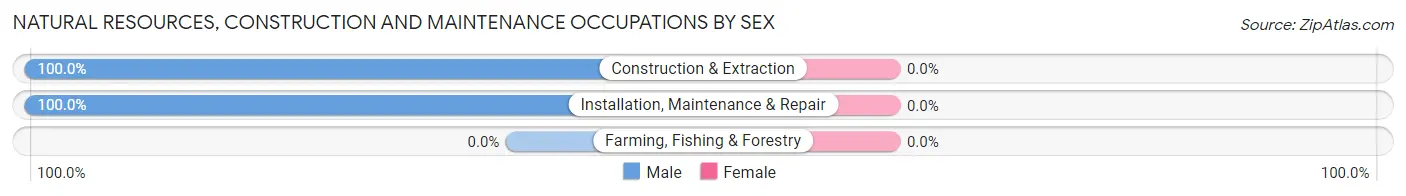
| Occupation | Male | Female |
| Farming, Fishing & Forestry | 0 (0.0%) | 0 (0.0%) |
| Construction & Extraction | 5 (100.0%) | 0 (0.0%) |
| Installation, Maintenance & Repair | 8 (100.0%) | 0 (0.0%) |
| Total (Category) | 13 (100.0%) | 0 (0.0%) |
| Total (Overall) | 72 (48.0%) | 78 (52.0%) |
Production, Transportation and Moving Occupations
The most common Production, Transportation and Moving occupations in Laurel Run borough are Material Moving (20 | 13.3%), Production (10 | 6.7%), and Transportation (9 | 6.0%).
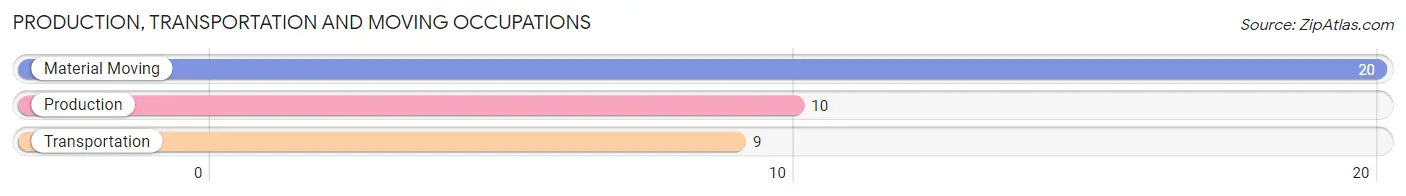
Production, Transportation and Moving Occupations by Sex
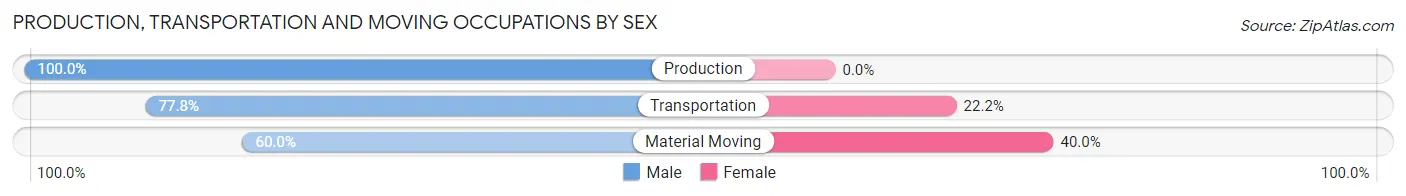
| Occupation | Male | Female |
| Production | 10 (100.0%) | 0 (0.0%) |
| Transportation | 7 (77.8%) | 2 (22.2%) |
| Material Moving | 12 (60.0%) | 8 (40.0%) |
| Total (Category) | 29 (74.4%) | 10 (25.6%) |
| Total (Overall) | 72 (48.0%) | 78 (52.0%) |
Employment Industries by Sex in Laurel Run borough
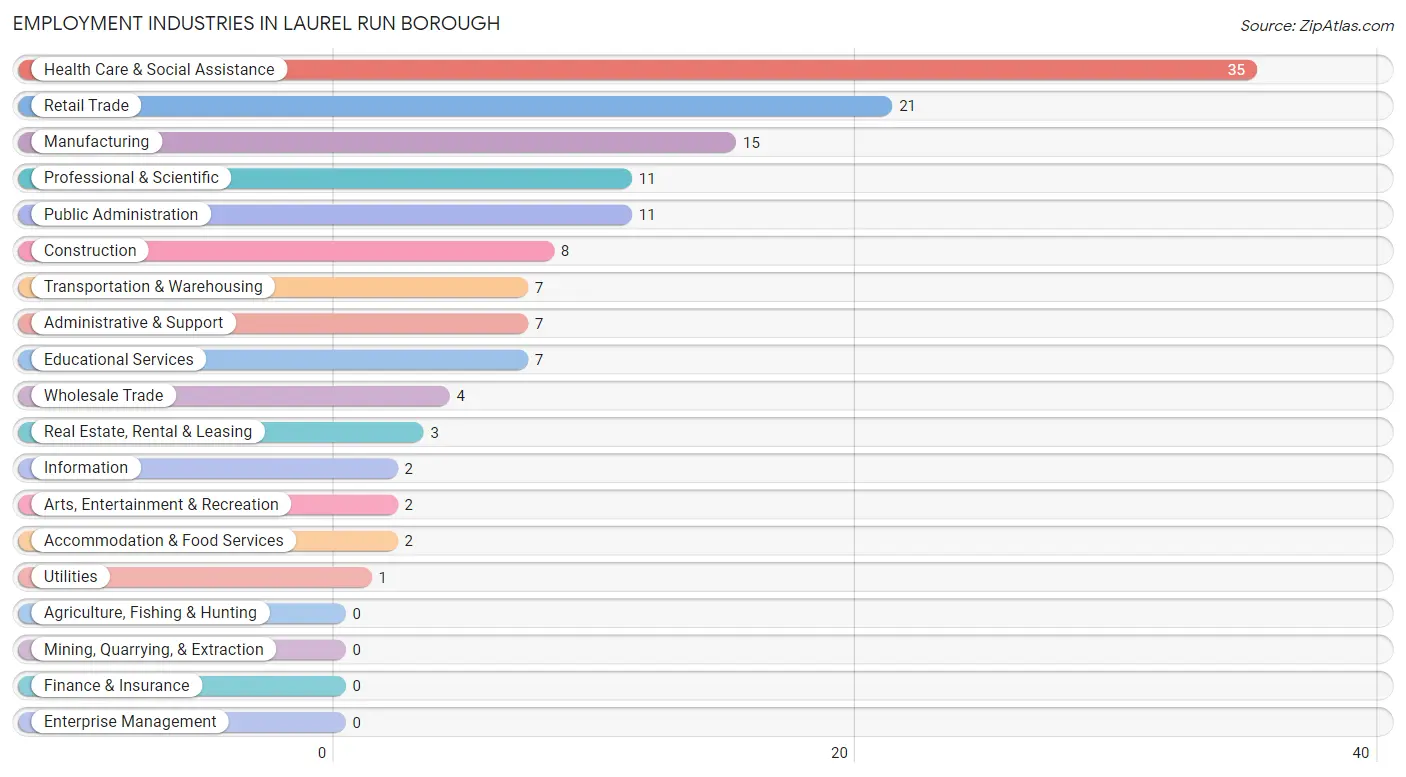
Employment Industries in Laurel Run borough
The major employment industries in Laurel Run borough include Health Care & Social Assistance (35 | 23.3%), Retail Trade (21 | 14.0%), Manufacturing (15 | 10.0%), Professional & Scientific (11 | 7.3%), and Public Administration (11 | 7.3%).
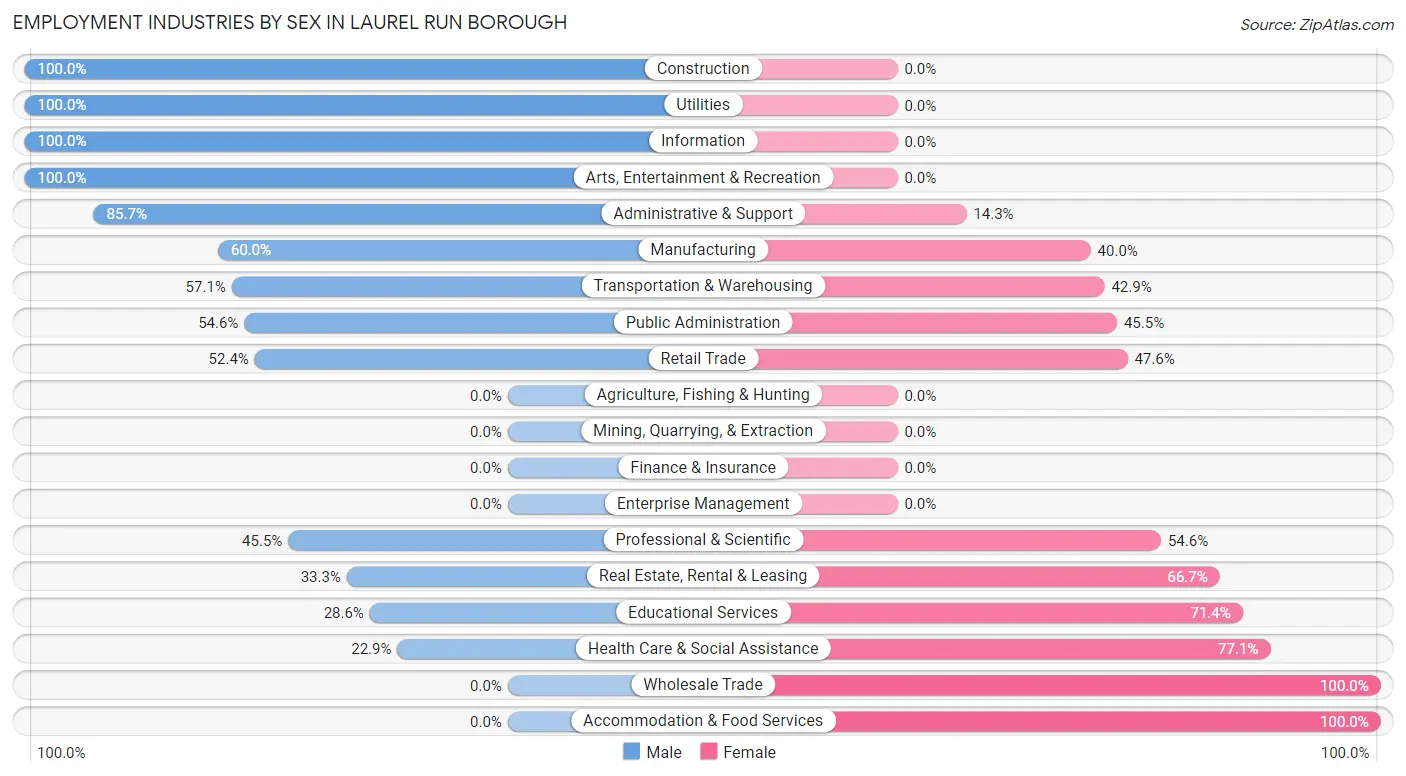
Employment Industries by Sex in Laurel Run borough
The Laurel Run borough industries that see more men than women are Construction (100.0%), Utilities (100.0%), and Information (100.0%), whereas the industries that tend to have a higher number of women are Wholesale Trade (100.0%), Accommodation & Food Services (100.0%), and Health Care & Social Assistance (77.1%).
| Industry | Male | Female |
| Agriculture, Fishing & Hunting | 0 (0.0%) | 0 (0.0%) |
| Mining, Quarrying, & Extraction | 0 (0.0%) | 0 (0.0%) |
| Construction | 8 (100.0%) | 0 (0.0%) |
| Manufacturing | 9 (60.0%) | 6 (40.0%) |
| Wholesale Trade | 0 (0.0%) | 4 (100.0%) |
| Retail Trade | 11 (52.4%) | 10 (47.6%) |
| Transportation & Warehousing | 4 (57.1%) | 3 (42.9%) |
| Utilities | 1 (100.0%) | 0 (0.0%) |
| Information | 2 (100.0%) | 0 (0.0%) |
| Finance & Insurance | 0 (0.0%) | 0 (0.0%) |
| Real Estate, Rental & Leasing | 1 (33.3%) | 2 (66.7%) |
| Professional & Scientific | 5 (45.5%) | 6 (54.5%) |
| Enterprise Management | 0 (0.0%) | 0 (0.0%) |
| Administrative & Support | 6 (85.7%) | 1 (14.3%) |
| Educational Services | 2 (28.6%) | 5 (71.4%) |
| Health Care & Social Assistance | 8 (22.9%) | 27 (77.1%) |
| Arts, Entertainment & Recreation | 2 (100.0%) | 0 (0.0%) |
| Accommodation & Food Services | 0 (0.0%) | 2 (100.0%) |
| Public Administration | 6 (54.5%) | 5 (45.5%) |
| Total | 72 (48.0%) | 78 (52.0%) |
Education in Laurel Run borough
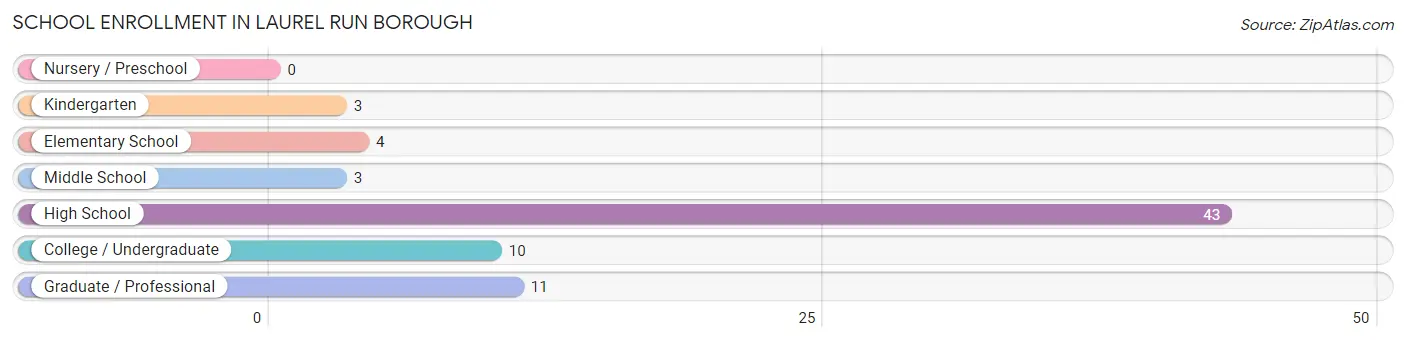
School Enrollment in Laurel Run borough
The most common levels of schooling among the 74 students in Laurel Run borough are high school (43 | 58.1%), graduate / professional (11 | 14.9%), and college / undergraduate (10 | 13.5%).
| School Level | # Students | % Students |
| Nursery / Preschool | 0 | 0.0% |
| Kindergarten | 3 | 4.1% |
| Elementary School | 4 | 5.4% |
| Middle School | 3 | 4.1% |
| High School | 43 | 58.1% |
| College / Undergraduate | 10 | 13.5% |
| Graduate / Professional | 11 | 14.9% |
| Total | 74 | 100.0% |
School Enrollment by Age by Funding Source in Laurel Run borough
Out of a total of 74 students who are enrolled in schools in Laurel Run borough, 31 (41.9%) attend a private institution, while the remaining 43 (58.1%) are enrolled in public schools. The age group of 5 to 9 year old has the highest likelihood of being enrolled in private schools, with 7 (100.0% in the age bracket) enrolled. Conversely, the age group of 10 to 14 year olds has the lowest likelihood of being enrolled in a private school, with 3 (100.0% in the age bracket) attending a public institution.
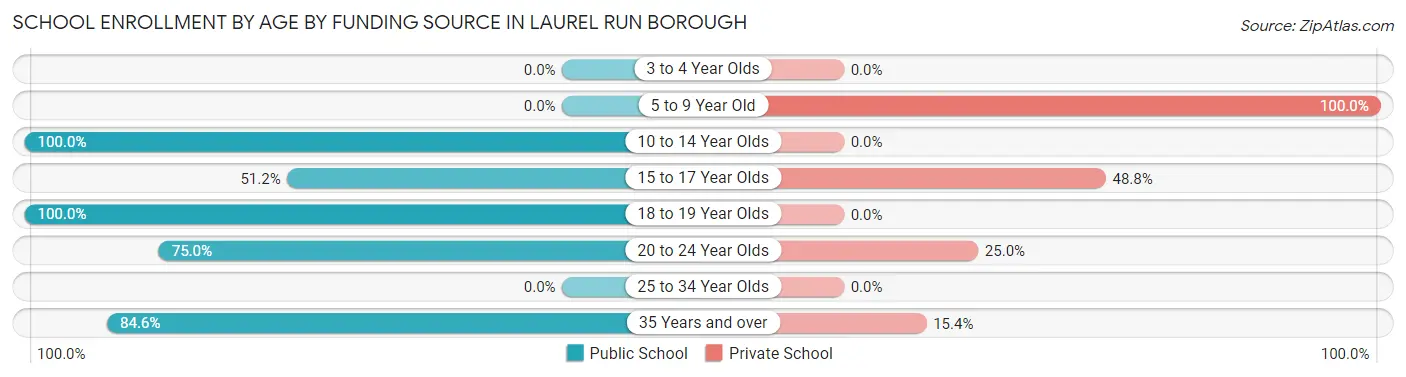
| Age Bracket | Public School | Private School |
| 3 to 4 Year Olds | 0 (0.0%) | 0 (0.0%) |
| 5 to 9 Year Old | 0 (0.0%) | 7 (100.0%) |
| 10 to 14 Year Olds | 3 (100.0%) | 0 (0.0%) |
| 15 to 17 Year Olds | 21 (51.2%) | 20 (48.8%) |
| 18 to 19 Year Olds | 2 (100.0%) | 0 (0.0%) |
| 20 to 24 Year Olds | 6 (75.0%) | 2 (25.0%) |
| 25 to 34 Year Olds | 0 (0.0%) | 0 (0.0%) |
| 35 Years and over | 11 (84.6%) | 2 (15.4%) |
| Total | 43 (58.1%) | 31 (41.9%) |
Educational Attainment by Field of Study in Laurel Run borough
Education (31 | 44.9%), business (14 | 20.3%), engineering (9 | 13.0%), science & technology (7 | 10.1%), and psychology (3 | 4.3%) are the most common fields of study among 69 individuals in Laurel Run borough who have obtained a bachelor's degree or higher.
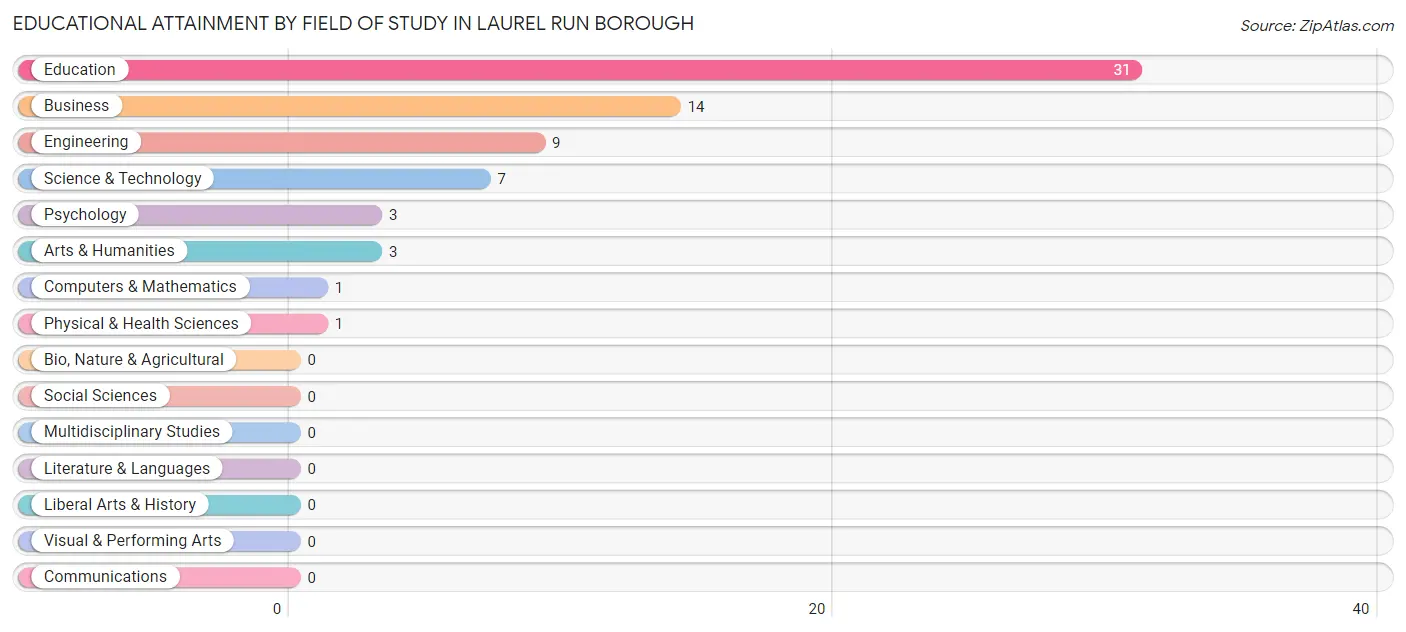
| Field of Study | # Graduates | % Graduates |
| Computers & Mathematics | 1 | 1.5% |
| Bio, Nature & Agricultural | 0 | 0.0% |
| Physical & Health Sciences | 1 | 1.5% |
| Psychology | 3 | 4.3% |
| Social Sciences | 0 | 0.0% |
| Engineering | 9 | 13.0% |
| Multidisciplinary Studies | 0 | 0.0% |
| Science & Technology | 7 | 10.1% |
| Business | 14 | 20.3% |
| Education | 31 | 44.9% |
| Literature & Languages | 0 | 0.0% |
| Liberal Arts & History | 0 | 0.0% |
| Visual & Performing Arts | 0 | 0.0% |
| Communications | 0 | 0.0% |
| Arts & Humanities | 3 | 4.3% |
| Total | 69 | 100.0% |
Transportation & Commute in Laurel Run borough
Vehicle Availability by Sex in Laurel Run borough
The most prevalent vehicle ownership categories in Laurel Run borough are males with 2 vehicles (23, accounting for 31.9%) and females with 2 vehicles (15, making up 30.3%).
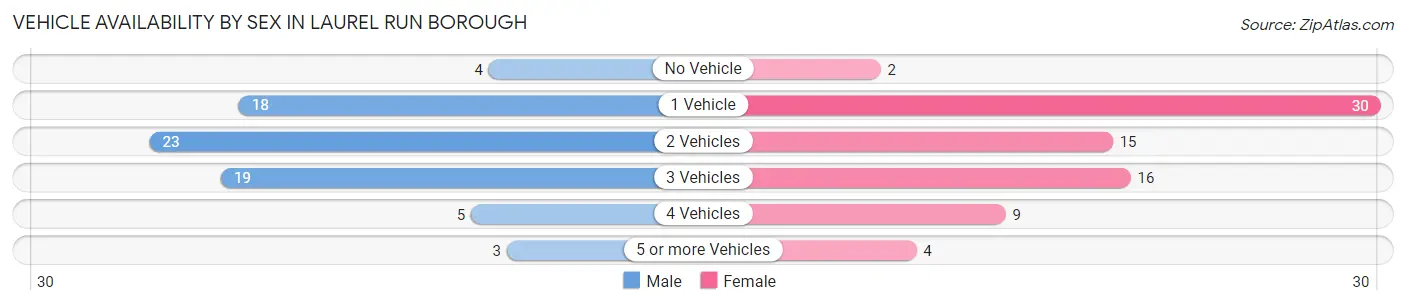
| Vehicles Available | Male | Female |
| No Vehicle | 4 (5.6%) | 2 (2.6%) |
| 1 Vehicle | 18 (25.0%) | 30 (39.5%) |
| 2 Vehicles | 23 (31.9%) | 15 (19.7%) |
| 3 Vehicles | 19 (26.4%) | 16 (21.0%) |
| 4 Vehicles | 5 (6.9%) | 9 (11.8%) |
| 5 or more Vehicles | 3 (4.2%) | 4 (5.3%) |
| Total | 72 (100.0%) | 76 (100.0%) |
Commute Time in Laurel Run borough
The most frequently occuring commute durations in Laurel Run borough are 10 to 14 minutes (36 commuters, 24.7%), 5 to 9 minutes (22 commuters, 15.1%), and 15 to 19 minutes (21 commuters, 14.4%).
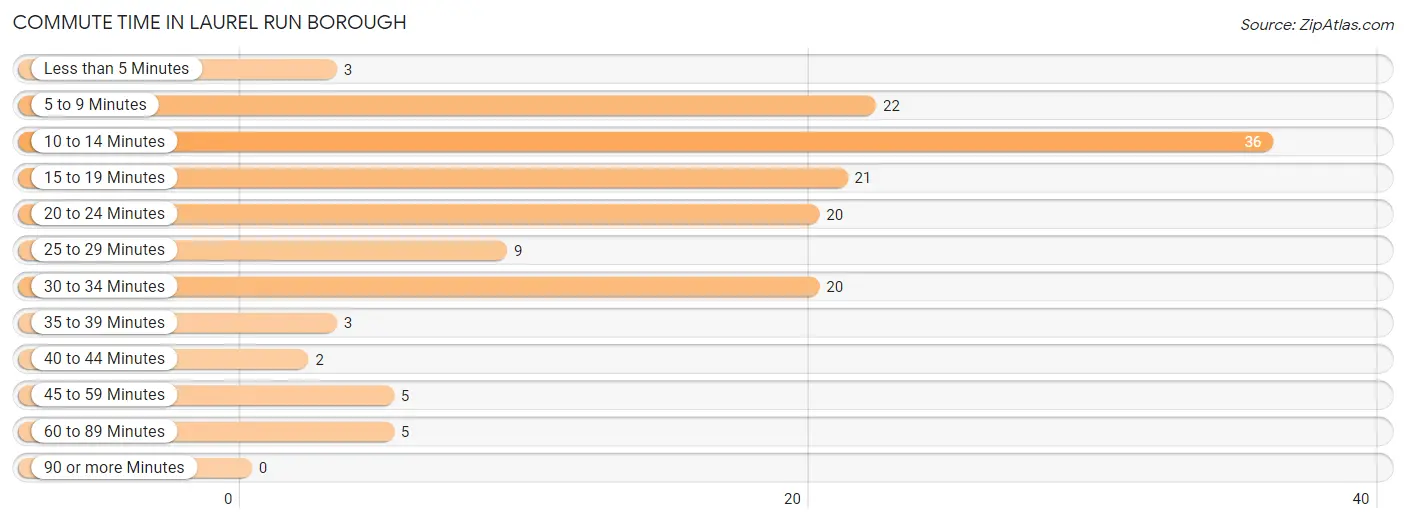
| Commute Time | # Commuters | % Commuters |
| Less than 5 Minutes | 3 | 2.1% |
| 5 to 9 Minutes | 22 | 15.1% |
| 10 to 14 Minutes | 36 | 24.7% |
| 15 to 19 Minutes | 21 | 14.4% |
| 20 to 24 Minutes | 20 | 13.7% |
| 25 to 29 Minutes | 9 | 6.2% |
| 30 to 34 Minutes | 20 | 13.7% |
| 35 to 39 Minutes | 3 | 2.1% |
| 40 to 44 Minutes | 2 | 1.4% |
| 45 to 59 Minutes | 5 | 3.4% |
| 60 to 89 Minutes | 5 | 3.4% |
| 90 or more Minutes | 0 | 0.0% |
Commute Time by Sex in Laurel Run borough
The most common commute times in Laurel Run borough are 10 to 14 minutes (17 commuters, 24.3%) for males and 10 to 14 minutes (19 commuters, 25.0%) for females.
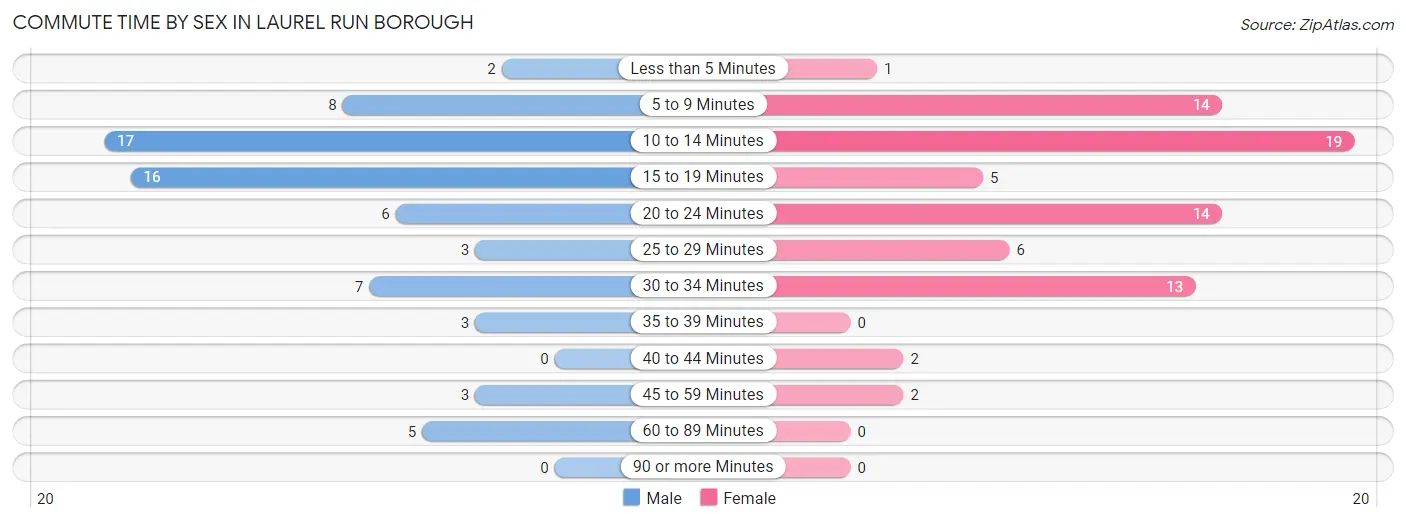
| Commute Time | Male | Female |
| Less than 5 Minutes | 2 (2.9%) | 1 (1.3%) |
| 5 to 9 Minutes | 8 (11.4%) | 14 (18.4%) |
| 10 to 14 Minutes | 17 (24.3%) | 19 (25.0%) |
| 15 to 19 Minutes | 16 (22.9%) | 5 (6.6%) |
| 20 to 24 Minutes | 6 (8.6%) | 14 (18.4%) |
| 25 to 29 Minutes | 3 (4.3%) | 6 (7.9%) |
| 30 to 34 Minutes | 7 (10.0%) | 13 (17.1%) |
| 35 to 39 Minutes | 3 (4.3%) | 0 (0.0%) |
| 40 to 44 Minutes | 0 (0.0%) | 2 (2.6%) |
| 45 to 59 Minutes | 3 (4.3%) | 2 (2.6%) |
| 60 to 89 Minutes | 5 (7.1%) | 0 (0.0%) |
| 90 or more Minutes | 0 (0.0%) | 0 (0.0%) |
Time of Departure to Work by Sex in Laurel Run borough
The most frequent times of departure to work in Laurel Run borough are 6:00 AM to 6:29 AM (24, 34.3%) for males and 8:30 AM to 8:59 AM (26, 34.2%) for females.
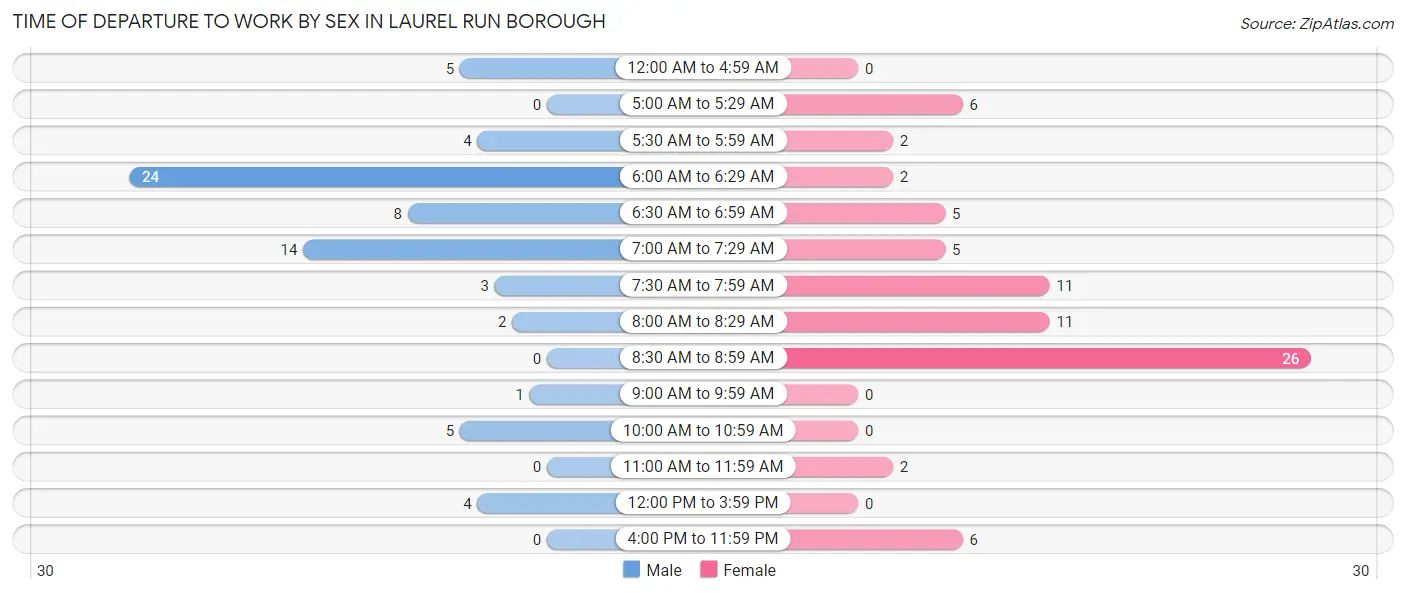
| Time of Departure | Male | Female |
| 12:00 AM to 4:59 AM | 5 (7.1%) | 0 (0.0%) |
| 5:00 AM to 5:29 AM | 0 (0.0%) | 6 (7.9%) |
| 5:30 AM to 5:59 AM | 4 (5.7%) | 2 (2.6%) |
| 6:00 AM to 6:29 AM | 24 (34.3%) | 2 (2.6%) |
| 6:30 AM to 6:59 AM | 8 (11.4%) | 5 (6.6%) |
| 7:00 AM to 7:29 AM | 14 (20.0%) | 5 (6.6%) |
| 7:30 AM to 7:59 AM | 3 (4.3%) | 11 (14.5%) |
| 8:00 AM to 8:29 AM | 2 (2.9%) | 11 (14.5%) |
| 8:30 AM to 8:59 AM | 0 (0.0%) | 26 (34.2%) |
| 9:00 AM to 9:59 AM | 1 (1.4%) | 0 (0.0%) |
| 10:00 AM to 10:59 AM | 5 (7.1%) | 0 (0.0%) |
| 11:00 AM to 11:59 AM | 0 (0.0%) | 2 (2.6%) |
| 12:00 PM to 3:59 PM | 4 (5.7%) | 0 (0.0%) |
| 4:00 PM to 11:59 PM | 0 (0.0%) | 6 (7.9%) |
| Total | 70 (100.0%) | 76 (100.0%) |
Housing Occupancy in Laurel Run borough
Occupancy by Ownership in Laurel Run borough
Of the total 171 dwellings in Laurel Run borough, owner-occupied units account for 158 (92.4%), while renter-occupied units make up 13 (7.6%).
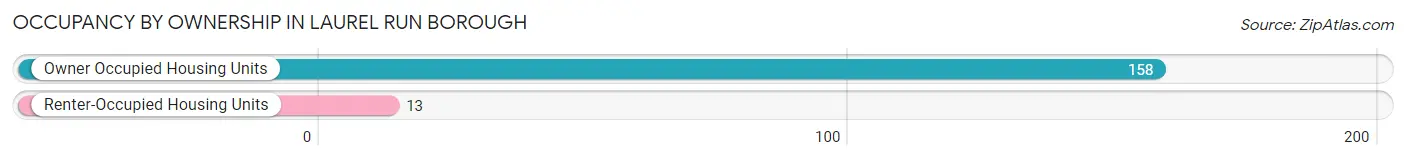
| Occupancy | # Housing Units | % Housing Units |
| Owner Occupied Housing Units | 158 | 92.4% |
| Renter-Occupied Housing Units | 13 | 7.6% |
| Total Occupied Housing Units | 171 | 100.0% |
Occupancy by Household Size in Laurel Run borough
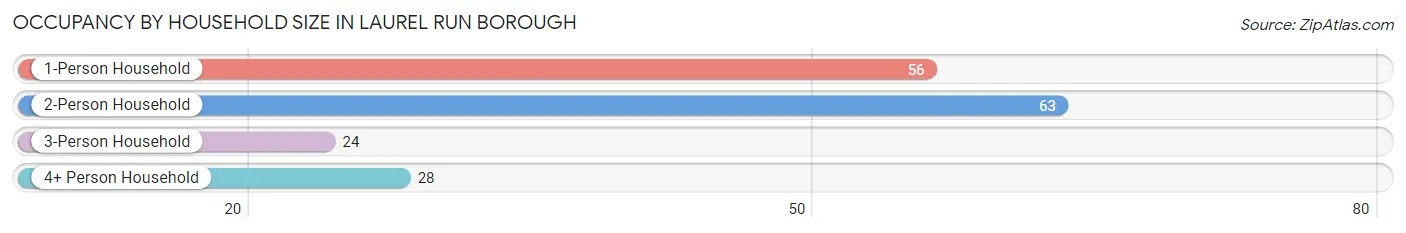
| Household Size | # Housing Units | % Housing Units |
| 1-Person Household | 56 | 32.8% |
| 2-Person Household | 63 | 36.8% |
| 3-Person Household | 24 | 14.0% |
| 4+ Person Household | 28 | 16.4% |
| Total Housing Units | 171 | 100.0% |
Occupancy by Ownership by Household Size in Laurel Run borough
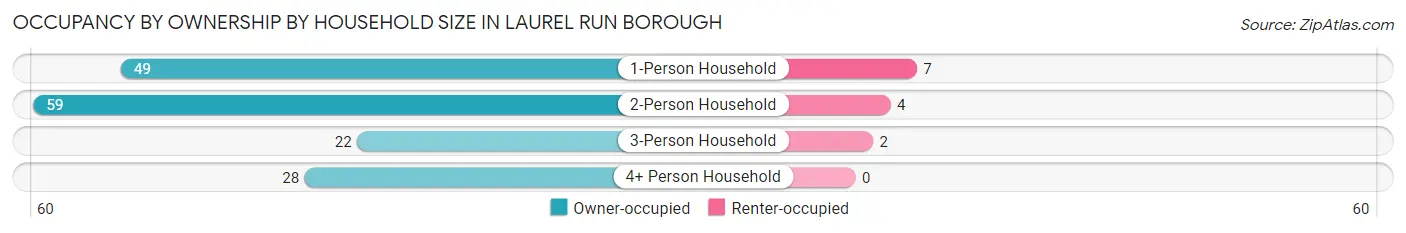
| Household Size | Owner-occupied | Renter-occupied |
| 1-Person Household | 49 (87.5%) | 7 (12.5%) |
| 2-Person Household | 59 (93.6%) | 4 (6.4%) |
| 3-Person Household | 22 (91.7%) | 2 (8.3%) |
| 4+ Person Household | 28 (100.0%) | 0 (0.0%) |
| Total Housing Units | 158 (92.4%) | 13 (7.6%) |
Occupancy by Educational Attainment in Laurel Run borough
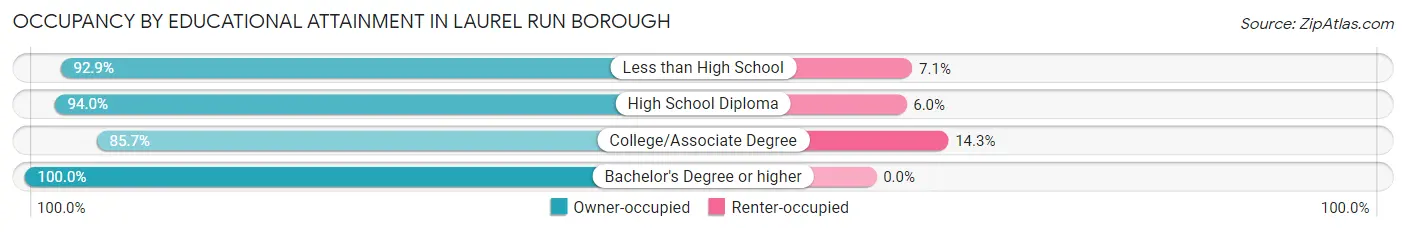
| Household Size | Owner-occupied | Renter-occupied |
| Less than High School | 26 (92.9%) | 2 (7.1%) |
| High School Diploma | 63 (94.0%) | 4 (6.0%) |
| College/Associate Degree | 42 (85.7%) | 7 (14.3%) |
| Bachelor's Degree or higher | 27 (100.0%) | 0 (0.0%) |
Occupancy by Age of Householder in Laurel Run borough
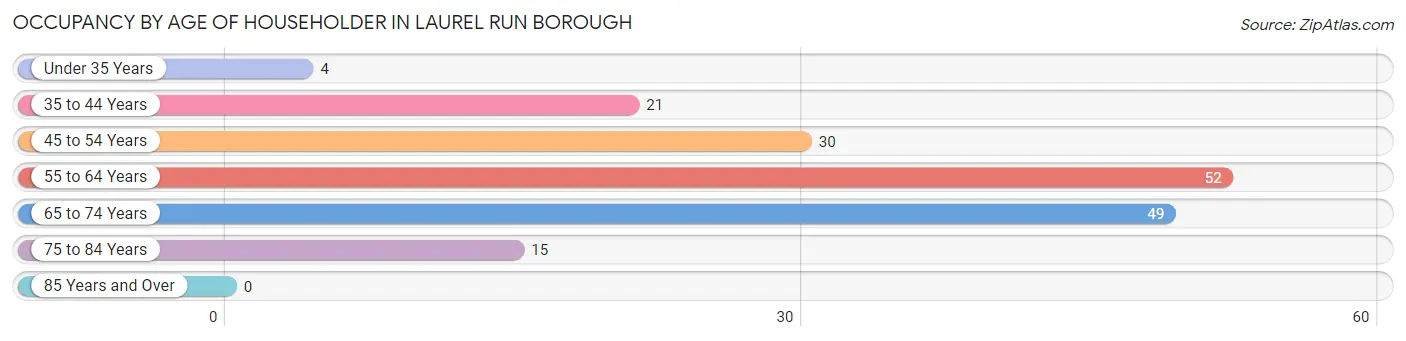
| Age Bracket | # Households | % Households |
| Under 35 Years | 4 | 2.3% |
| 35 to 44 Years | 21 | 12.3% |
| 45 to 54 Years | 30 | 17.5% |
| 55 to 64 Years | 52 | 30.4% |
| 65 to 74 Years | 49 | 28.6% |
| 75 to 84 Years | 15 | 8.8% |
| 85 Years and Over | 0 | 0.0% |
| Total | 171 | 100.0% |
Housing Finances in Laurel Run borough
Median Income by Occupancy in Laurel Run borough
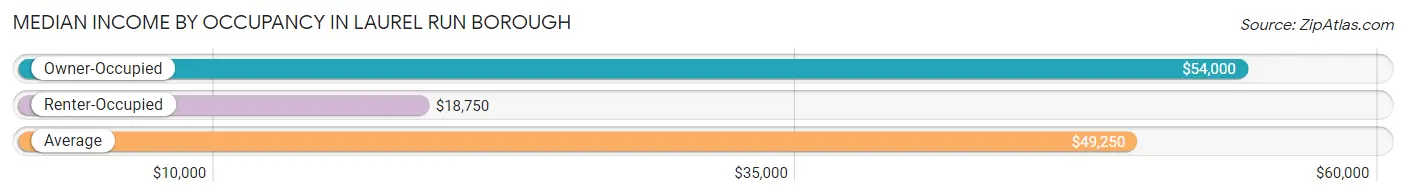
| Occupancy Type | # Households | Median Income |
| Owner-Occupied | 158 (92.4%) | $54,000 |
| Renter-Occupied | 13 (7.6%) | $18,750 |
| Average | 171 (100.0%) | $49,250 |
Occupancy by Householder Income Bracket in Laurel Run borough
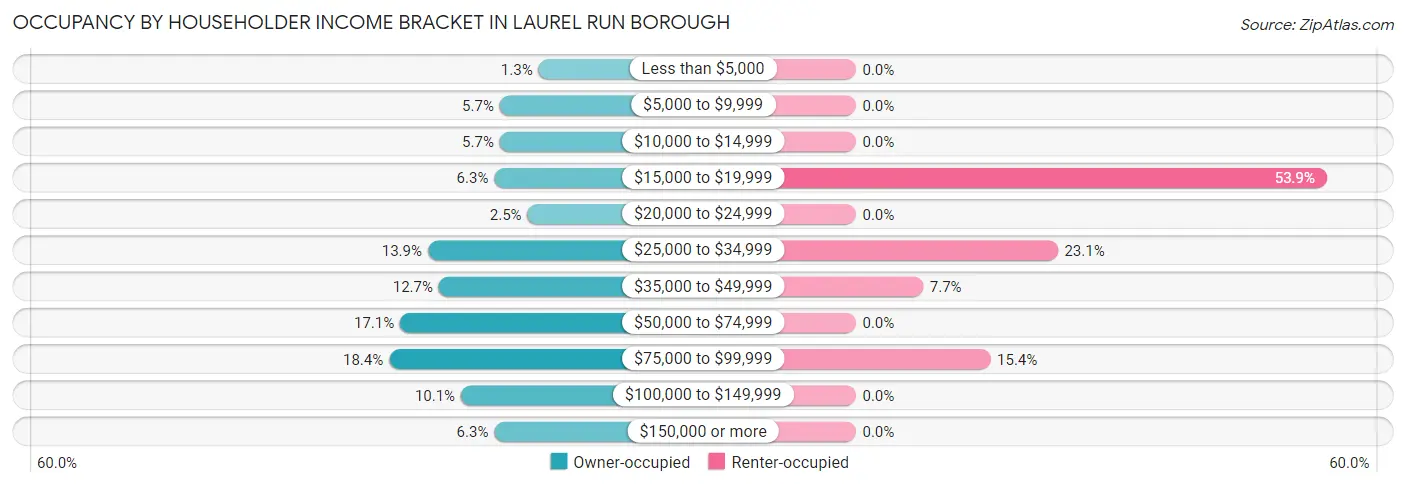
| Income Bracket | Owner-occupied | Renter-occupied |
| Less than $5,000 | 2 (1.3%) | 0 (0.0%) |
| $5,000 to $9,999 | 9 (5.7%) | 0 (0.0%) |
| $10,000 to $14,999 | 9 (5.7%) | 0 (0.0%) |
| $15,000 to $19,999 | 10 (6.3%) | 7 (53.8%) |
| $20,000 to $24,999 | 4 (2.5%) | 0 (0.0%) |
| $25,000 to $34,999 | 22 (13.9%) | 3 (23.1%) |
| $35,000 to $49,999 | 20 (12.7%) | 1 (7.7%) |
| $50,000 to $74,999 | 27 (17.1%) | 0 (0.0%) |
| $75,000 to $99,999 | 29 (18.3%) | 2 (15.4%) |
| $100,000 to $149,999 | 16 (10.1%) | 0 (0.0%) |
| $150,000 or more | 10 (6.3%) | 0 (0.0%) |
| Total | 158 (100.0%) | 13 (100.0%) |
Monthly Housing Cost Tiers in Laurel Run borough
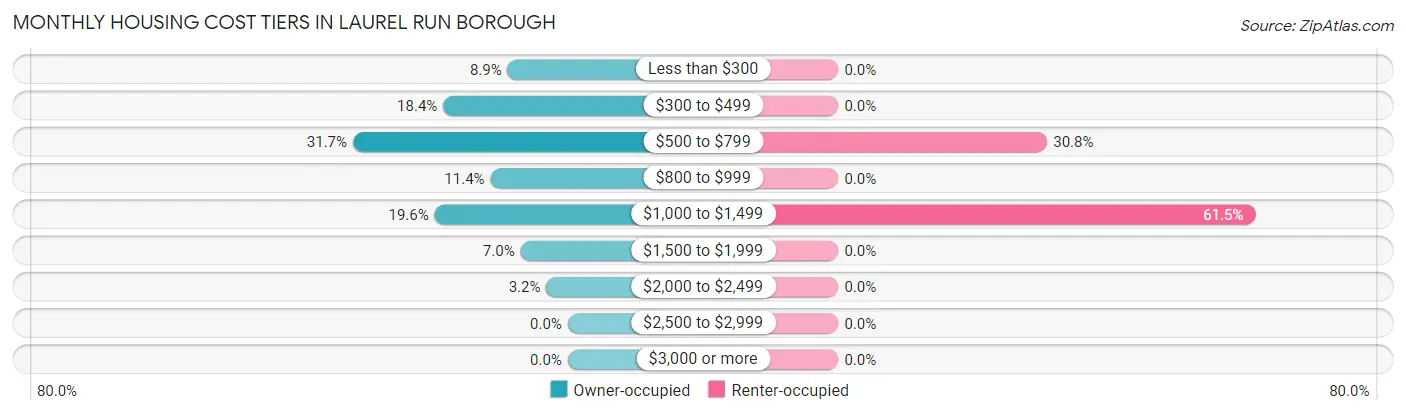
| Monthly Cost | Owner-occupied | Renter-occupied |
| Less than $300 | 14 (8.9%) | 0 (0.0%) |
| $300 to $499 | 29 (18.3%) | 0 (0.0%) |
| $500 to $799 | 50 (31.7%) | 4 (30.8%) |
| $800 to $999 | 18 (11.4%) | 0 (0.0%) |
| $1,000 to $1,499 | 31 (19.6%) | 8 (61.5%) |
| $1,500 to $1,999 | 11 (7.0%) | 0 (0.0%) |
| $2,000 to $2,499 | 5 (3.2%) | 0 (0.0%) |
| $2,500 to $2,999 | 0 (0.0%) | 0 (0.0%) |
| $3,000 or more | 0 (0.0%) | 0 (0.0%) |
| Total | 158 (100.0%) | 13 (100.0%) |
Physical Housing Characteristics in Laurel Run borough
Housing Structures in Laurel Run borough
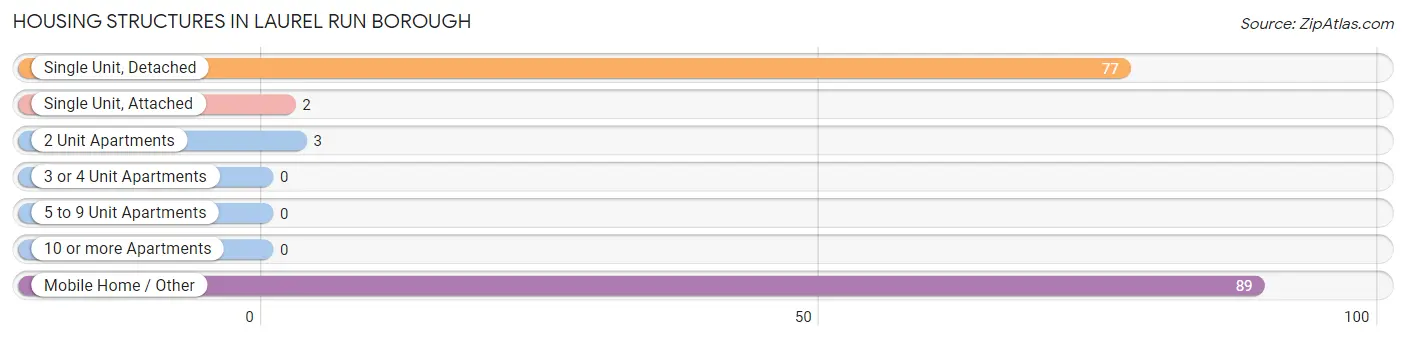
| Structure Type | # Housing Units | % Housing Units |
| Single Unit, Detached | 77 | 45.0% |
| Single Unit, Attached | 2 | 1.2% |
| 2 Unit Apartments | 3 | 1.8% |
| 3 or 4 Unit Apartments | 0 | 0.0% |
| 5 to 9 Unit Apartments | 0 | 0.0% |
| 10 or more Apartments | 0 | 0.0% |
| Mobile Home / Other | 89 | 52.0% |
| Total | 171 | 100.0% |
Housing Structures by Occupancy in Laurel Run borough
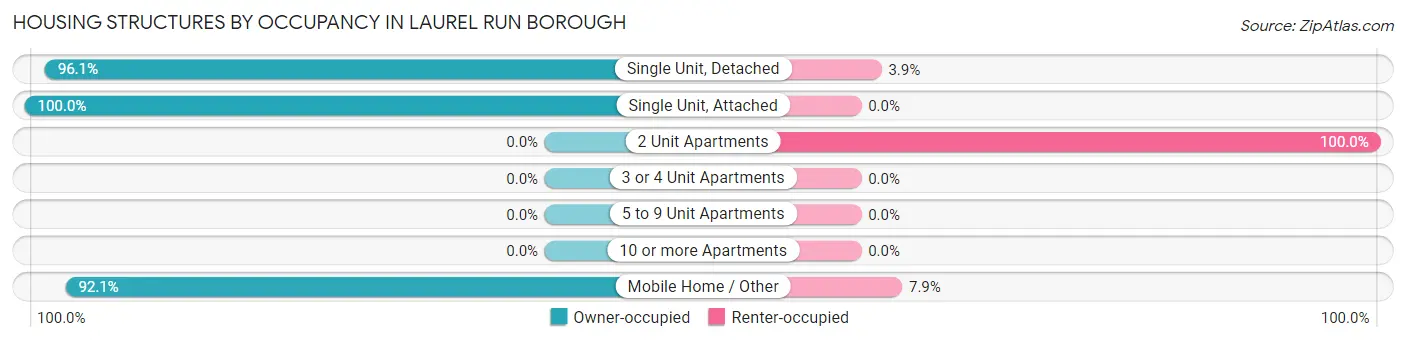
| Structure Type | Owner-occupied | Renter-occupied |
| Single Unit, Detached | 74 (96.1%) | 3 (3.9%) |
| Single Unit, Attached | 2 (100.0%) | 0 (0.0%) |
| 2 Unit Apartments | 0 (0.0%) | 3 (100.0%) |
| 3 or 4 Unit Apartments | 0 (0.0%) | 0 (0.0%) |
| 5 to 9 Unit Apartments | 0 (0.0%) | 0 (0.0%) |
| 10 or more Apartments | 0 (0.0%) | 0 (0.0%) |
| Mobile Home / Other | 82 (92.1%) | 7 (7.9%) |
| Total | 158 (92.4%) | 13 (7.6%) |
Housing Structures by Number of Rooms in Laurel Run borough
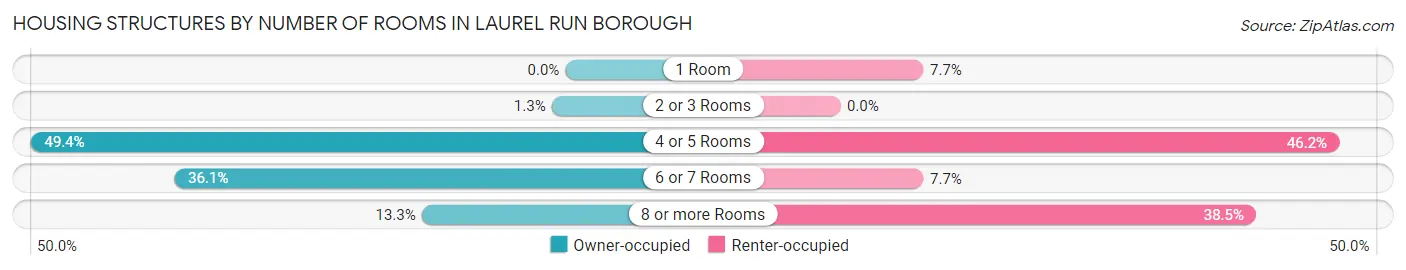
| Number of Rooms | Owner-occupied | Renter-occupied |
| 1 Room | 0 (0.0%) | 1 (7.7%) |
| 2 or 3 Rooms | 2 (1.3%) | 0 (0.0%) |
| 4 or 5 Rooms | 78 (49.4%) | 6 (46.2%) |
| 6 or 7 Rooms | 57 (36.1%) | 1 (7.7%) |
| 8 or more Rooms | 21 (13.3%) | 5 (38.5%) |
| Total | 158 (100.0%) | 13 (100.0%) |
Housing Structure by Heating Type in Laurel Run borough
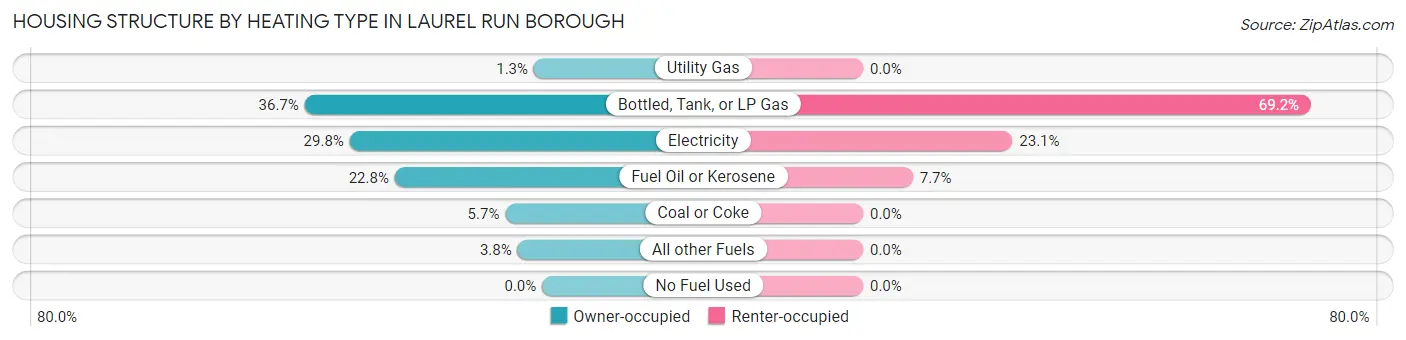
| Heating Type | Owner-occupied | Renter-occupied |
| Utility Gas | 2 (1.3%) | 0 (0.0%) |
| Bottled, Tank, or LP Gas | 58 (36.7%) | 9 (69.2%) |
| Electricity | 47 (29.7%) | 3 (23.1%) |
| Fuel Oil or Kerosene | 36 (22.8%) | 1 (7.7%) |
| Coal or Coke | 9 (5.7%) | 0 (0.0%) |
| All other Fuels | 6 (3.8%) | 0 (0.0%) |
| No Fuel Used | 0 (0.0%) | 0 (0.0%) |
| Total | 158 (100.0%) | 13 (100.0%) |
Household Vehicle Usage in Laurel Run borough
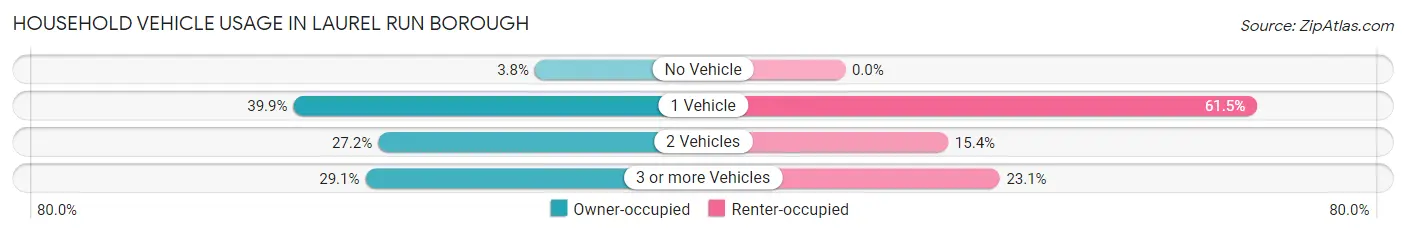
| Vehicles per Household | Owner-occupied | Renter-occupied |
| No Vehicle | 6 (3.8%) | 0 (0.0%) |
| 1 Vehicle | 63 (39.9%) | 8 (61.5%) |
| 2 Vehicles | 43 (27.2%) | 2 (15.4%) |
| 3 or more Vehicles | 46 (29.1%) | 3 (23.1%) |
| Total | 158 (100.0%) | 13 (100.0%) |
Real Estate & Mortgages in Laurel Run borough
Real Estate and Mortgage Overview in Laurel Run borough
| Characteristic | Without Mortgage | With Mortgage |
| Housing Units | 109 | 49 |
| Median Property Value | $51,000 | $97,500 |
| Median Household Income | $41,875 | $6 |
| Monthly Housing Costs | $633 | $0 |
| Real Estate Taxes | - | - |
Property Value by Mortgage Status in Laurel Run borough
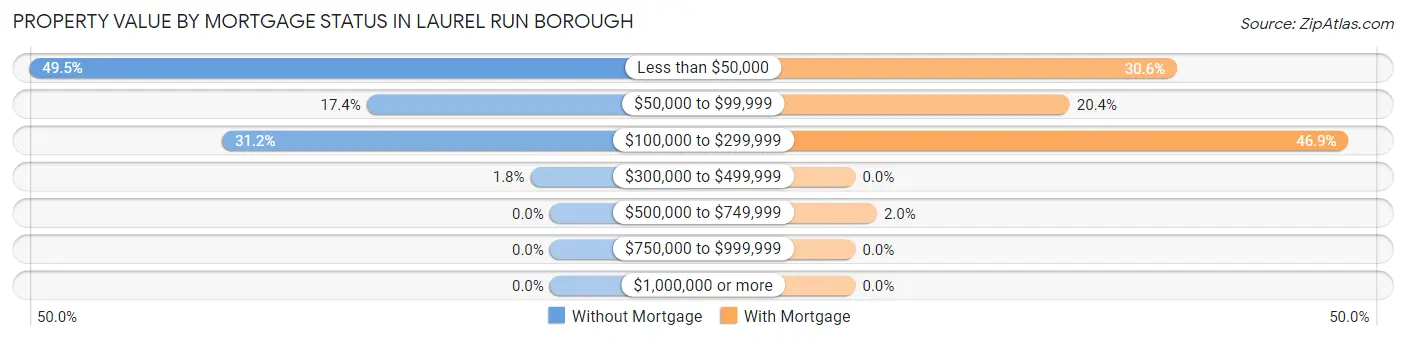
| Property Value | Without Mortgage | With Mortgage |
| Less than $50,000 | 54 (49.5%) | 15 (30.6%) |
| $50,000 to $99,999 | 19 (17.4%) | 10 (20.4%) |
| $100,000 to $299,999 | 34 (31.2%) | 23 (46.9%) |
| $300,000 to $499,999 | 2 (1.8%) | 0 (0.0%) |
| $500,000 to $749,999 | 0 (0.0%) | 1 (2.0%) |
| $750,000 to $999,999 | 0 (0.0%) | 0 (0.0%) |
| $1,000,000 or more | 0 (0.0%) | 0 (0.0%) |
| Total | 109 (100.0%) | 49 (100.0%) |
Household Income by Mortgage Status in Laurel Run borough
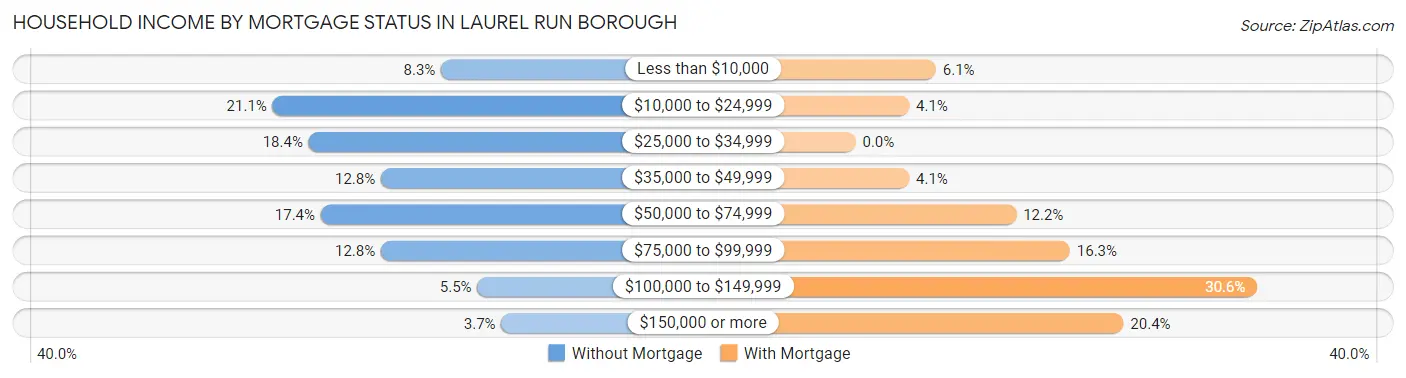
| Household Income | Without Mortgage | With Mortgage |
| Less than $10,000 | 9 (8.3%) | 3 (6.1%) |
| $10,000 to $24,999 | 23 (21.1%) | 2 (4.1%) |
| $25,000 to $34,999 | 20 (18.3%) | 0 (0.0%) |
| $35,000 to $49,999 | 14 (12.8%) | 2 (4.1%) |
| $50,000 to $74,999 | 19 (17.4%) | 6 (12.2%) |
| $75,000 to $99,999 | 14 (12.8%) | 8 (16.3%) |
| $100,000 to $149,999 | 6 (5.5%) | 15 (30.6%) |
| $150,000 or more | 4 (3.7%) | 10 (20.4%) |
| Total | 109 (100.0%) | 49 (100.0%) |
Property Value to Household Income Ratio in Laurel Run borough
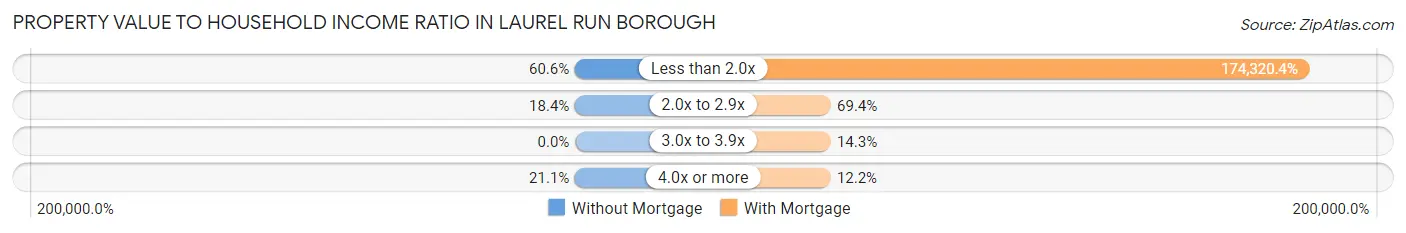
| Value-to-Income Ratio | Without Mortgage | With Mortgage |
| Less than 2.0x | 66 (60.6%) | 85,417 (174,320.4%) |
| 2.0x to 2.9x | 20 (18.3%) | 34 (69.4%) |
| 3.0x to 3.9x | 0 (0.0%) | 7 (14.3%) |
| 4.0x or more | 23 (21.1%) | 6 (12.2%) |
| Total | 109 (100.0%) | 49 (100.0%) |
Real Estate Taxes by Mortgage Status in Laurel Run borough
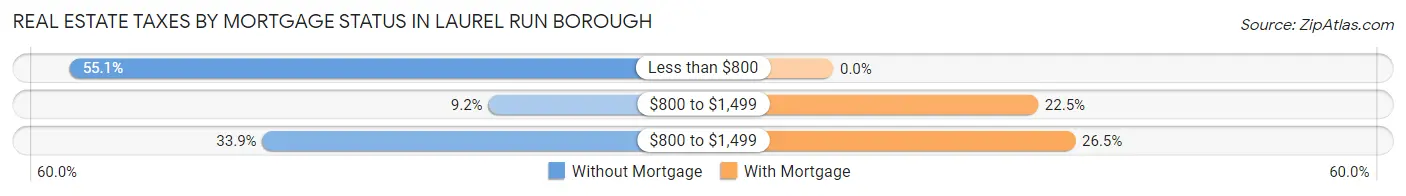
| Property Taxes | Without Mortgage | With Mortgage |
| Less than $800 | 60 (55.0%) | 0 (0.0%) |
| $800 to $1,499 | 10 (9.2%) | 11 (22.5%) |
| $800 to $1,499 | 37 (33.9%) | 13 (26.5%) |
| Total | 109 (100.0%) | 49 (100.0%) |
Health & Disability in Laurel Run borough
Health Insurance Coverage by Age in Laurel Run borough
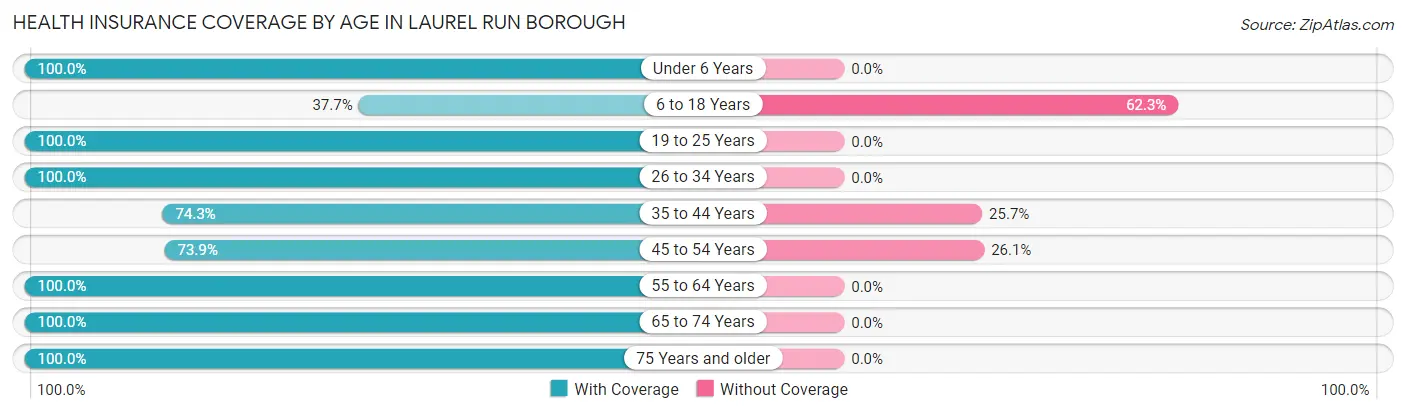
| Age Bracket | With Coverage | Without Coverage |
| Under 6 Years | 12 (100.0%) | 0 (0.0%) |
| 6 to 18 Years | 20 (37.7%) | 33 (62.3%) |
| 19 to 25 Years | 21 (100.0%) | 0 (0.0%) |
| 26 to 34 Years | 7 (100.0%) | 0 (0.0%) |
| 35 to 44 Years | 52 (74.3%) | 18 (25.7%) |
| 45 to 54 Years | 51 (73.9%) | 18 (26.1%) |
| 55 to 64 Years | 113 (100.0%) | 0 (0.0%) |
| 65 to 74 Years | 80 (100.0%) | 0 (0.0%) |
| 75 Years and older | 24 (100.0%) | 0 (0.0%) |
| Total | 380 (84.6%) | 69 (15.4%) |
Health Insurance Coverage by Citizenship Status in Laurel Run borough
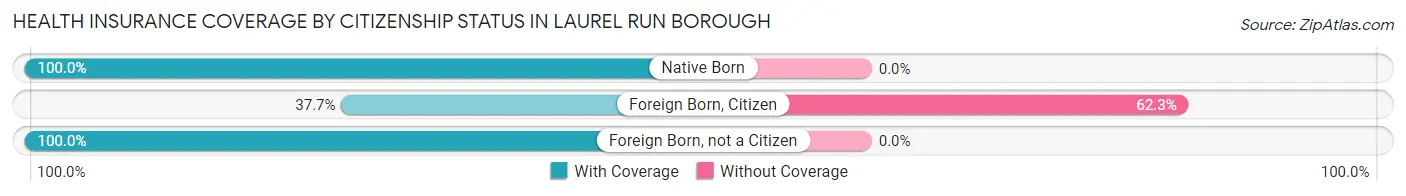
| Citizenship Status | With Coverage | Without Coverage |
| Native Born | 12 (100.0%) | 0 (0.0%) |
| Foreign Born, Citizen | 20 (37.7%) | 33 (62.3%) |
| Foreign Born, not a Citizen | 21 (100.0%) | 0 (0.0%) |
Health Insurance Coverage by Household Income in Laurel Run borough
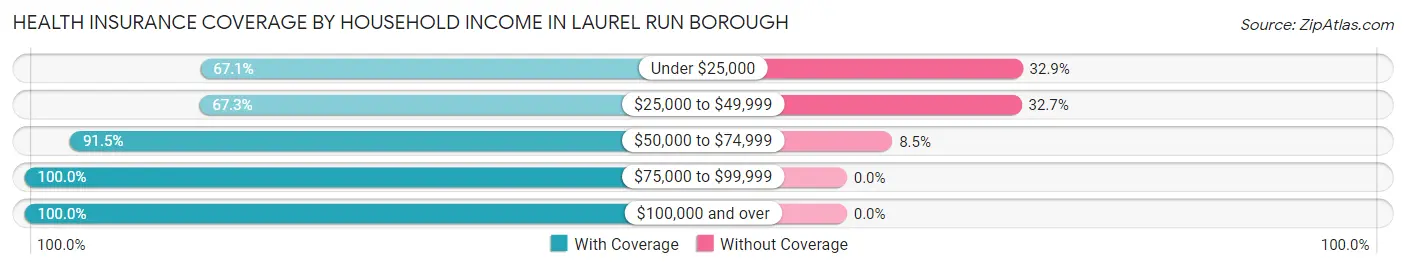
| Household Income | With Coverage | Without Coverage |
| Under $25,000 | 57 (67.1%) | 28 (32.9%) |
| $25,000 to $49,999 | 76 (67.3%) | 37 (32.7%) |
| $50,000 to $74,999 | 43 (91.5%) | 4 (8.5%) |
| $75,000 to $99,999 | 58 (100.0%) | 0 (0.0%) |
| $100,000 and over | 76 (100.0%) | 0 (0.0%) |
Public vs Private Health Insurance Coverage by Age in Laurel Run borough
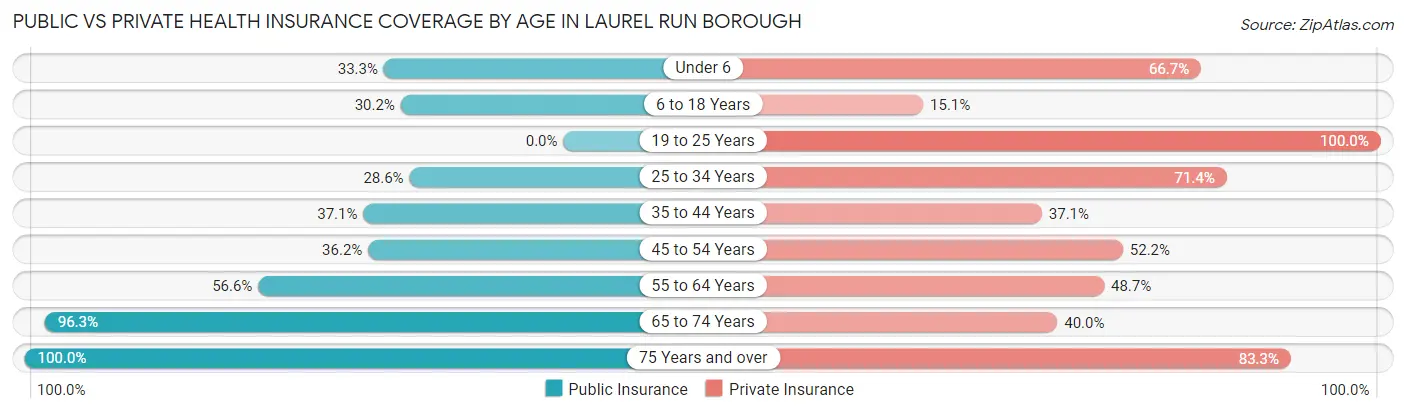
| Age Bracket | Public Insurance | Private Insurance |
| Under 6 | 4 (33.3%) | 8 (66.7%) |
| 6 to 18 Years | 16 (30.2%) | 8 (15.1%) |
| 19 to 25 Years | 0 (0.0%) | 21 (100.0%) |
| 25 to 34 Years | 2 (28.6%) | 5 (71.4%) |
| 35 to 44 Years | 26 (37.1%) | 26 (37.1%) |
| 45 to 54 Years | 25 (36.2%) | 36 (52.2%) |
| 55 to 64 Years | 64 (56.6%) | 55 (48.7%) |
| 65 to 74 Years | 77 (96.3%) | 32 (40.0%) |
| 75 Years and over | 24 (100.0%) | 20 (83.3%) |
| Total | 238 (53.0%) | 211 (47.0%) |
Disability Status by Sex by Age in Laurel Run borough
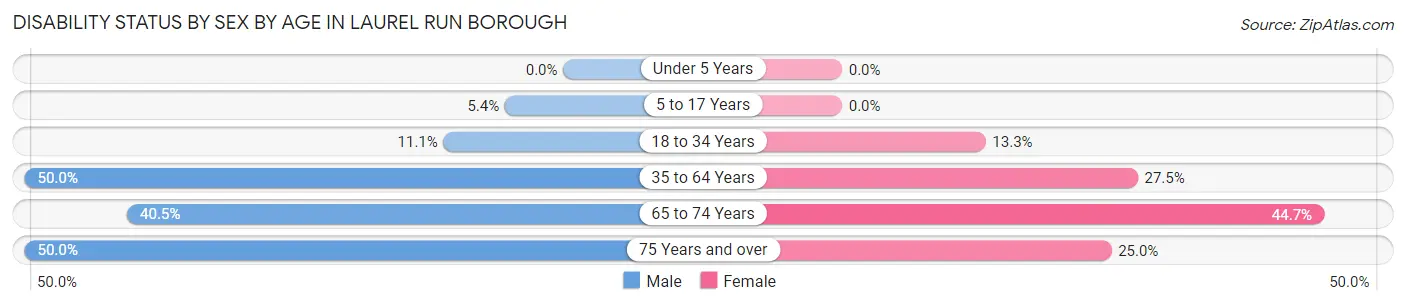
| Age Bracket | Male | Female |
| Under 5 Years | 0 (0.0%) | 0 (0.0%) |
| 5 to 17 Years | 2 (5.4%) | 0 (0.0%) |
| 18 to 34 Years | 2 (11.1%) | 2 (13.3%) |
| 35 to 64 Years | 75 (50.0%) | 28 (27.5%) |
| 65 to 74 Years | 17 (40.5%) | 17 (44.7%) |
| 75 Years and over | 6 (50.0%) | 3 (25.0%) |
Disability Class by Sex by Age in Laurel Run borough
Disability Class: Hearing Difficulty
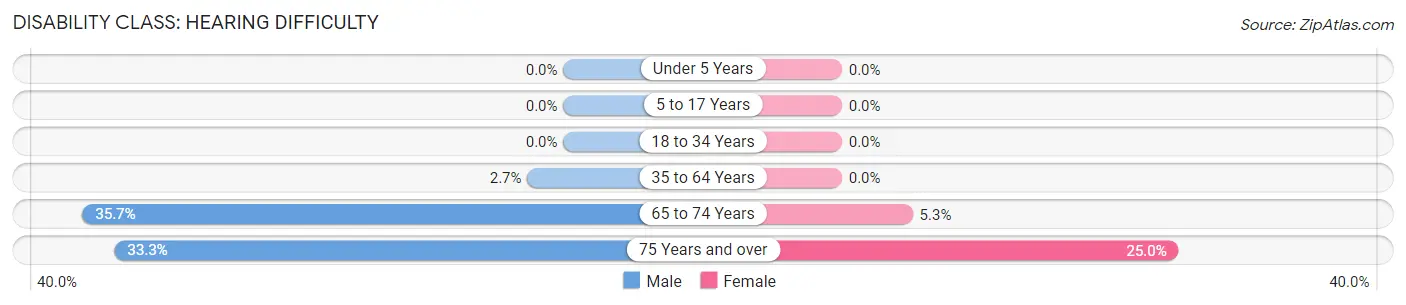
| Age Bracket | Male | Female |
| Under 5 Years | 0 (0.0%) | 0 (0.0%) |
| 5 to 17 Years | 0 (0.0%) | 0 (0.0%) |
| 18 to 34 Years | 0 (0.0%) | 0 (0.0%) |
| 35 to 64 Years | 4 (2.7%) | 0 (0.0%) |
| 65 to 74 Years | 15 (35.7%) | 2 (5.3%) |
| 75 Years and over | 4 (33.3%) | 3 (25.0%) |
Disability Class: Vision Difficulty
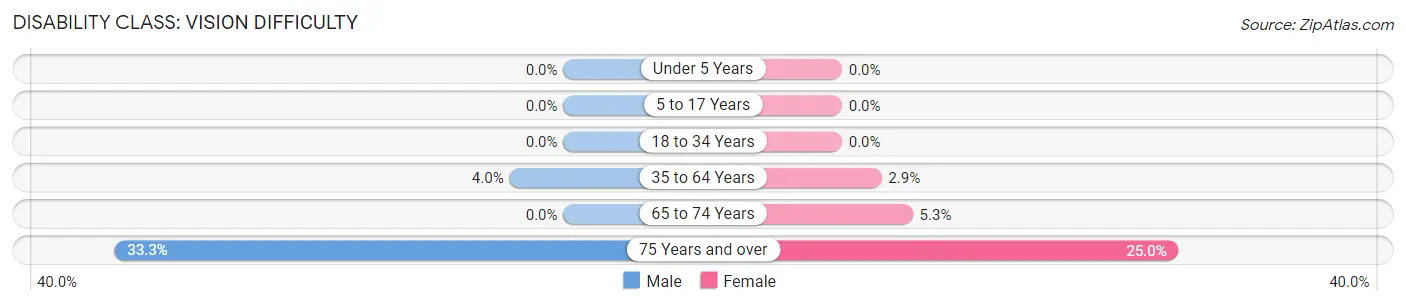
| Age Bracket | Male | Female |
| Under 5 Years | 0 (0.0%) | 0 (0.0%) |
| 5 to 17 Years | 0 (0.0%) | 0 (0.0%) |
| 18 to 34 Years | 0 (0.0%) | 0 (0.0%) |
| 35 to 64 Years | 6 (4.0%) | 3 (2.9%) |
| 65 to 74 Years | 0 (0.0%) | 2 (5.3%) |
| 75 Years and over | 4 (33.3%) | 3 (25.0%) |
Disability Class: Cognitive Difficulty
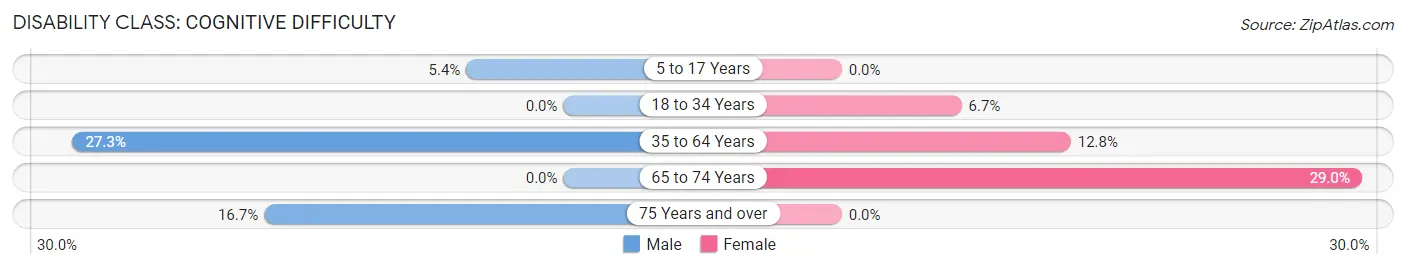
| Age Bracket | Male | Female |
| 5 to 17 Years | 2 (5.4%) | 0 (0.0%) |
| 18 to 34 Years | 0 (0.0%) | 1 (6.7%) |
| 35 to 64 Years | 41 (27.3%) | 13 (12.8%) |
| 65 to 74 Years | 0 (0.0%) | 11 (28.9%) |
| 75 Years and over | 2 (16.7%) | 0 (0.0%) |
Disability Class: Ambulatory Difficulty
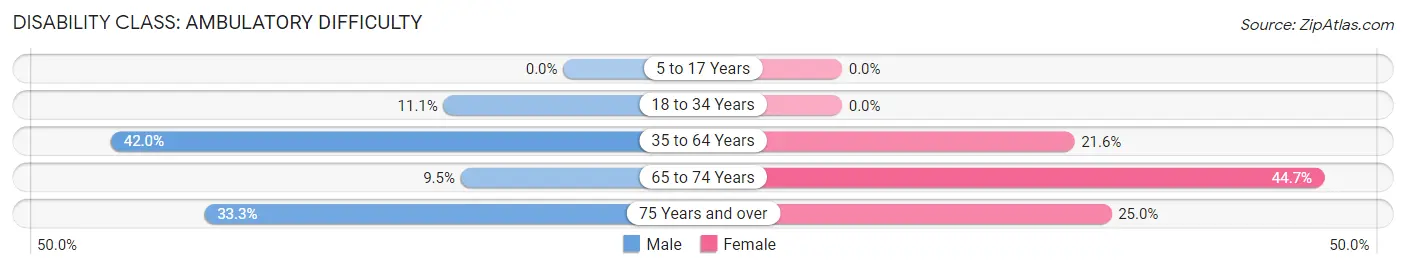
| Age Bracket | Male | Female |
| 5 to 17 Years | 0 (0.0%) | 0 (0.0%) |
| 18 to 34 Years | 2 (11.1%) | 0 (0.0%) |
| 35 to 64 Years | 63 (42.0%) | 22 (21.6%) |
| 65 to 74 Years | 4 (9.5%) | 17 (44.7%) |
| 75 Years and over | 4 (33.3%) | 3 (25.0%) |
Disability Class: Self-Care Difficulty
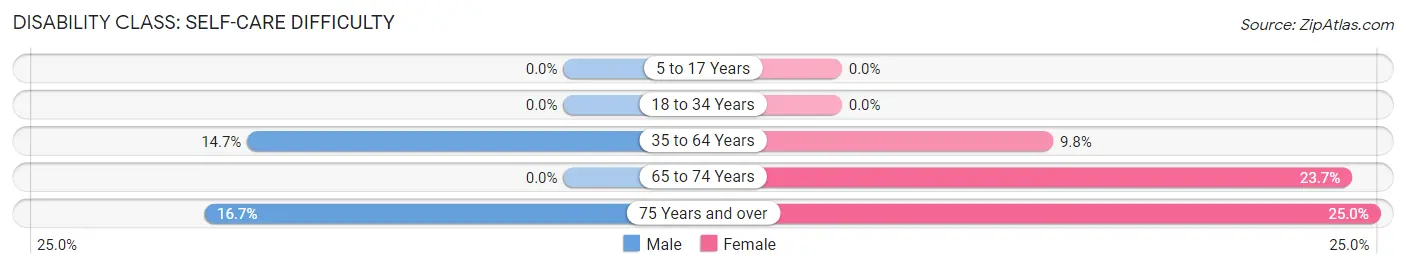
| Age Bracket | Male | Female |
| 5 to 17 Years | 0 (0.0%) | 0 (0.0%) |
| 18 to 34 Years | 0 (0.0%) | 0 (0.0%) |
| 35 to 64 Years | 22 (14.7%) | 10 (9.8%) |
| 65 to 74 Years | 0 (0.0%) | 9 (23.7%) |
| 75 Years and over | 2 (16.7%) | 3 (25.0%) |
Technology Access in Laurel Run borough
Computing Device Access in Laurel Run borough
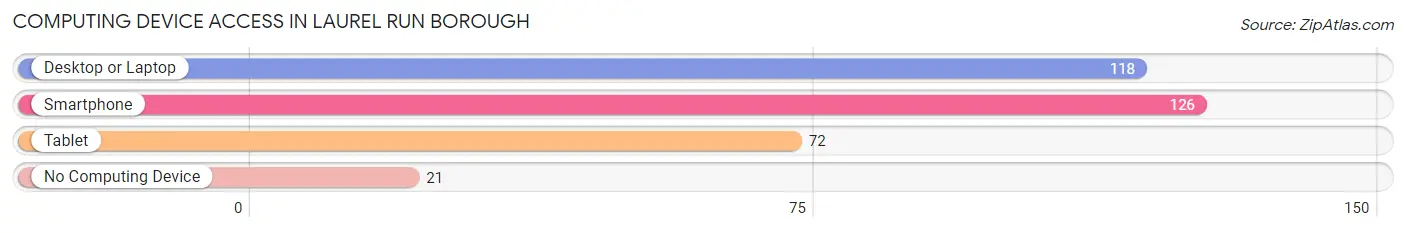
| Device Type | # Households | % Households |
| Desktop or Laptop | 118 | 69.0% |
| Smartphone | 126 | 73.7% |
| Tablet | 72 | 42.1% |
| No Computing Device | 21 | 12.3% |
| Total | 171 | 100.0% |
Internet Access in Laurel Run borough
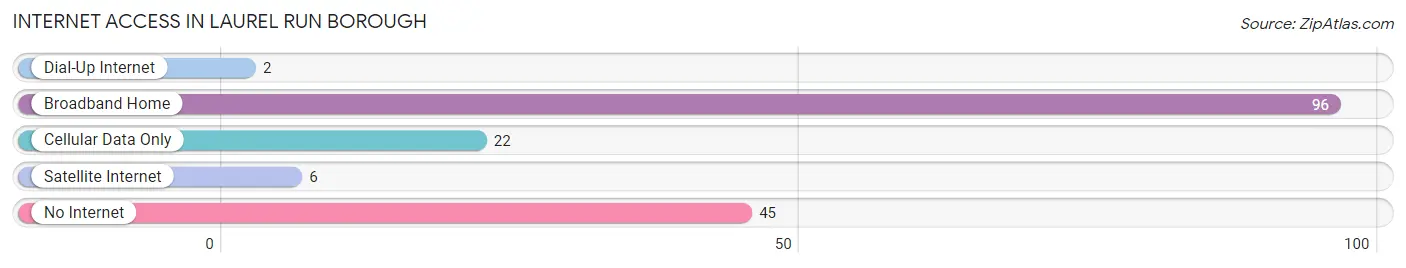
| Internet Type | # Households | % Households |
| Dial-Up Internet | 2 | 1.2% |
| Broadband Home | 96 | 56.1% |
| Cellular Data Only | 22 | 12.9% |
| Satellite Internet | 6 | 3.5% |
| No Internet | 45 | 26.3% |
| Total | 171 | 100.0% |
Laurel Run borough Summary
Laurel Run Borough is a small borough located in Luzerne County, Pennsylvania. It is situated in the Wyoming Valley, a region of the state known for its rich history and culture. The borough is located in the heart of the valley, just south of Wilkes-Barre and north of Nanticoke. The population of Laurel Run Borough was 1,845 at the 2010 census.
History
The area that is now Laurel Run Borough was first settled in the late 1700s by a group of Welsh immigrants. The area was originally known as “Llwynog”, which is Welsh for “Laurel Run”. The name was changed to Laurel Run Borough in 1845 when it was incorporated as a borough.
The area was a major coal mining center in the late 19th and early 20th centuries. The coal industry was the main source of employment for the residents of Laurel Run Borough. The coal mines were eventually closed in the 1950s, and the borough has since become a quiet residential community.
Geography
Laurel Run Borough is located in the Wyoming Valley of northeastern Pennsylvania. It is situated in the southern part of Luzerne County, just south of Wilkes-Barre and north of Nanticoke. The borough is bordered by the Susquehanna River to the east and the Nescopeck Creek to the west.
The borough has a total area of 1.2 square miles, all of which is land. The terrain is mostly flat, with some rolling hills in the northern part of the borough.
Economy
The economy of Laurel Run Borough is largely based on the service industry. The borough is home to several small businesses, including restaurants, retail stores, and professional services. The borough also has a few manufacturing companies, including a plastics factory and a metal fabrication plant.
The borough is also home to a few small farms, which produce a variety of fruits and vegetables. The farms also provide employment for some of the borough’s residents.
Demographics
As of the 2010 census, the population of Laurel Run Borough was 1,845. The racial makeup of the borough was 97.3% White, 0.9% African American, 0.2% Native American, 0.3% Asian, and 1.3% from other races. Hispanic or Latino of any race were 1.7% of the population.
The median household income in the borough was $37,917, and the median family income was $45,938. The per capita income was $19,945. About 11.3% of the population was below the poverty line.
The population of Laurel Run Borough is largely made up of families. About 57.3% of the population is married, and the median age is 41. The borough is also home to a large number of senior citizens, with about 20.3% of the population over the age of 65.
Common Questions
What is Per Capita Income in Laurel Run borough?
Per Capita income in Laurel Run borough is $30,382.
What is the Median Family Income in Laurel Run borough?
Median Family Income in Laurel Run borough is $65,625.
What is the Median Household income in Laurel Run borough?
Median Household Income in Laurel Run borough is $49,250.
What is Income or Wage Gap in Laurel Run borough?
Income or Wage Gap in Laurel Run borough is 56.2%.
Women in Laurel Run borough earn 43.8 cents for every dollar earned by a man.
What is Inequality or Gini Index in Laurel Run borough?
Inequality or Gini Index in Laurel Run borough is 0.51.
What is the Total Population of Laurel Run borough?
Total Population of Laurel Run borough is 449.
What is the Total Male Population of Laurel Run borough?
Total Male Population of Laurel Run borough is 266.
What is the Total Female Population of Laurel Run borough?
Total Female Population of Laurel Run borough is 183.
What is the Ratio of Males per 100 Females in Laurel Run borough?
There are 145.36 Males per 100 Females in Laurel Run borough.
What is the Ratio of Females per 100 Males in Laurel Run borough?
There are 68.80 Females per 100 Males in Laurel Run borough.
What is the Median Population Age in Laurel Run borough?
Median Population Age in Laurel Run borough is 52.6 Years.
What is the Average Family Size in Laurel Run borough
Average Family Size in Laurel Run borough is 2.8 People.
What is the Average Household Size in Laurel Run borough
Average Household Size in Laurel Run borough is 2.2 People.
How Large is the Labor Force in Laurel Run borough?
There are 194 People in the Labor Forcein in Laurel Run borough.
What is the Percentage of People in the Labor Force in Laurel Run borough?
46.2% of People are in the Labor Force in Laurel Run borough.
What is the Unemployment Rate in Laurel Run borough?
Unemployment Rate in Laurel Run borough is 22.7%.