Sellersville borough, PA Map & Demographics
Sellersville borough Overview
$36,810
PER CAPITA INCOME
$100,625
AVG FAMILY INCOME
$86,276
AVG HOUSEHOLD INCOME
23.8%
WAGE / INCOME GAP [ % ]
76.2¢/ $1
WAGE / INCOME GAP [ $ ]
0.32
INEQUALITY / GINI INDEX
4,537
TOTAL POPULATION
2,222
MALE POPULATION
2,315
FEMALE POPULATION
95.98
MALES / 100 FEMALES
104.19
FEMALES / 100 MALES
37.5
MEDIAN AGE
3.0
AVG FAMILY SIZE
2.5
AVG HOUSEHOLD SIZE
2,824
LABOR FORCE [ PEOPLE ]
78.2%
PERCENT IN LABOR FORCE
3.3%
UNEMPLOYMENT RATE
Income in Sellersville borough
Income Overview in Sellersville borough
Per Capita Income in Sellersville borough is $36,810, while median incomes of families and households are $100,625 and $86,276 respectively.
| Characteristic | Number | Measure |
| Per Capita Income | 4,537 | $36,810 |
| Median Family Income | 1,169 | $100,625 |
| Mean Family Income | 1,169 | $104,198 |
| Median Household Income | 1,810 | $86,276 |
| Mean Household Income | 1,810 | $90,046 |
| Income Deficit | 1,169 | $0 |
| Wage / Income Gap (%) | 4,537 | 23.81% |
| Wage / Income Gap ($) | 4,537 | 76.19¢ per $1 |
| Gini / Inequality Index | 4,537 | 0.32 |
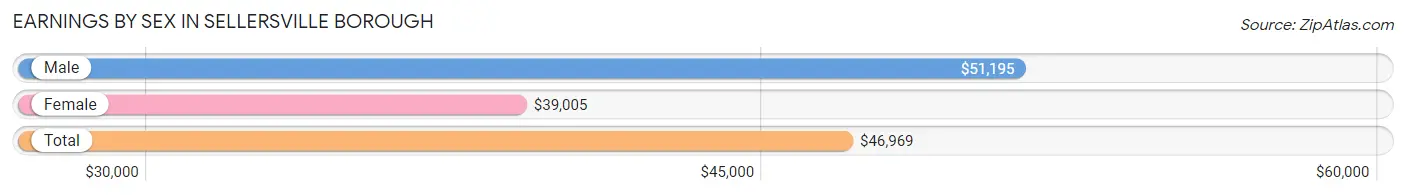
Earnings by Sex in Sellersville borough
Average Earnings in Sellersville borough are $46,969, $51,195 for men and $39,005 for women, a difference of 23.8%.
| Sex | Number | Average Earnings |
| Male | 1,433 (49.5%) | $51,195 |
| Female | 1,461 (50.5%) | $39,005 |
| Total | 2,894 (100.0%) | $46,969 |
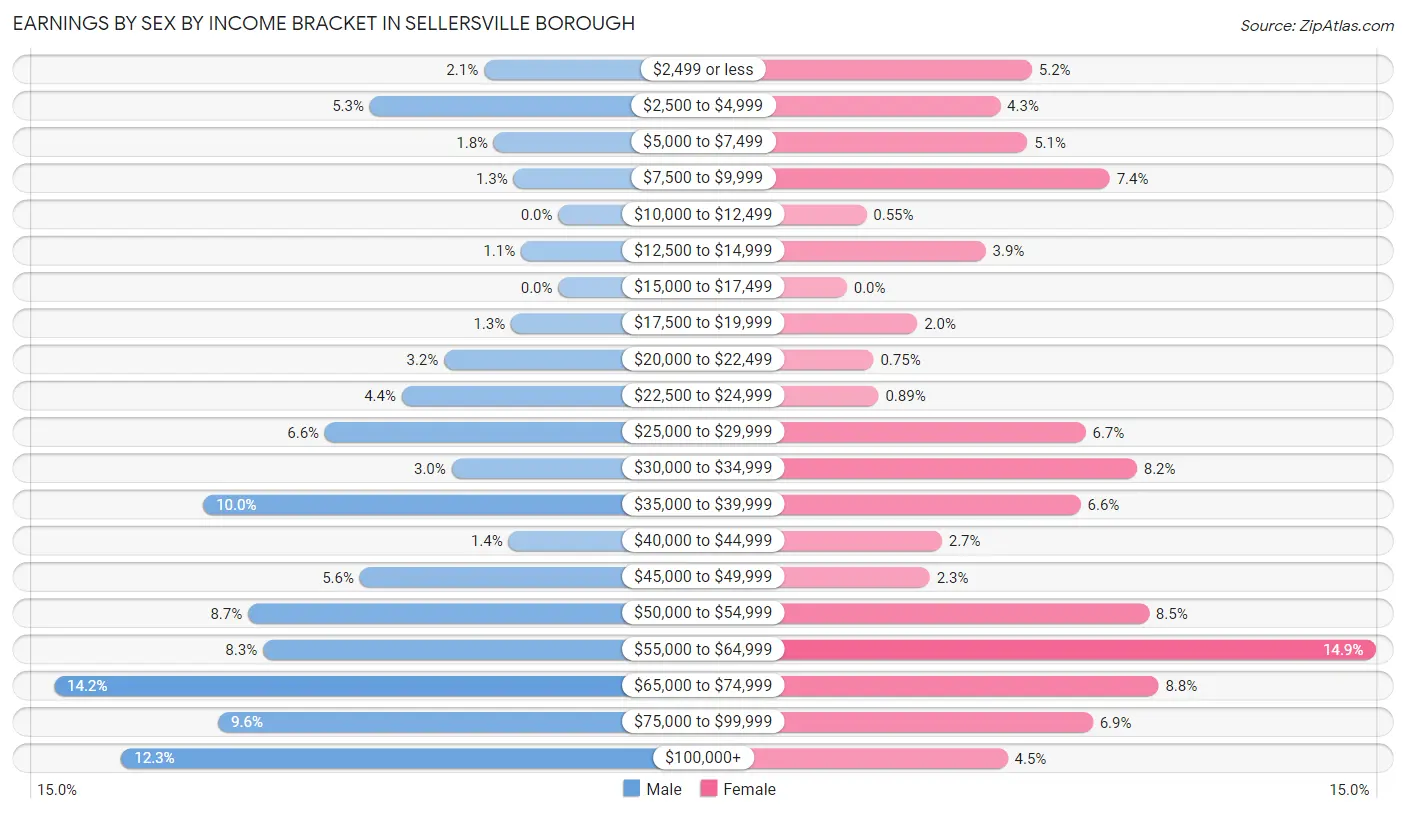
Earnings by Sex by Income Bracket in Sellersville borough
The most common earnings brackets in Sellersville borough are $65,000 to $74,999 for men (203 | 14.2%) and $55,000 to $64,999 for women (217 | 14.8%).
| Income | Male | Female |
| $2,499 or less | 30 (2.1%) | 76 (5.2%) |
| $2,500 to $4,999 | 76 (5.3%) | 63 (4.3%) |
| $5,000 to $7,499 | 26 (1.8%) | 74 (5.1%) |
| $7,500 to $9,999 | 18 (1.3%) | 108 (7.4%) |
| $10,000 to $12,499 | 0 (0.0%) | 8 (0.5%) |
| $12,500 to $14,999 | 15 (1.1%) | 57 (3.9%) |
| $15,000 to $17,499 | 0 (0.0%) | 0 (0.0%) |
| $17,500 to $19,999 | 19 (1.3%) | 29 (2.0%) |
| $20,000 to $22,499 | 46 (3.2%) | 11 (0.7%) |
| $22,500 to $24,999 | 63 (4.4%) | 13 (0.9%) |
| $25,000 to $29,999 | 94 (6.6%) | 98 (6.7%) |
| $30,000 to $34,999 | 43 (3.0%) | 119 (8.2%) |
| $35,000 to $39,999 | 143 (10.0%) | 96 (6.6%) |
| $40,000 to $44,999 | 20 (1.4%) | 39 (2.7%) |
| $45,000 to $49,999 | 80 (5.6%) | 34 (2.3%) |
| $50,000 to $54,999 | 125 (8.7%) | 124 (8.5%) |
| $55,000 to $64,999 | 119 (8.3%) | 217 (14.8%) |
| $65,000 to $74,999 | 203 (14.2%) | 128 (8.8%) |
| $75,000 to $99,999 | 137 (9.6%) | 101 (6.9%) |
| $100,000+ | 176 (12.3%) | 66 (4.5%) |
| Total | 1,433 (100.0%) | 1,461 (100.0%) |
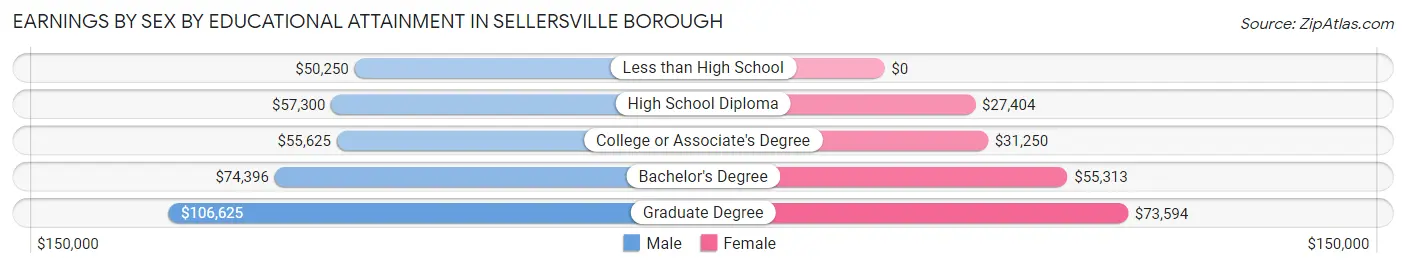
Earnings by Sex by Educational Attainment in Sellersville borough
Average earnings in Sellersville borough are $58,488 for men and $41,346 for women, a difference of 29.3%. Men with an educational attainment of graduate degree enjoy the highest average annual earnings of $106,625, while those with less than high school education earn the least with $50,250. Women with an educational attainment of graduate degree earn the most with the average annual earnings of $73,594, while those with high school diploma education have the smallest earnings of $27,404.
| Educational Attainment | Male Income | Female Income |
| Less than High School | $50,250 | $0 |
| High School Diploma | $57,300 | $27,404 |
| College or Associate's Degree | $55,625 | $31,250 |
| Bachelor's Degree | $74,396 | $55,313 |
| Graduate Degree | $106,625 | $73,594 |
| Total | $58,488 | $41,346 |
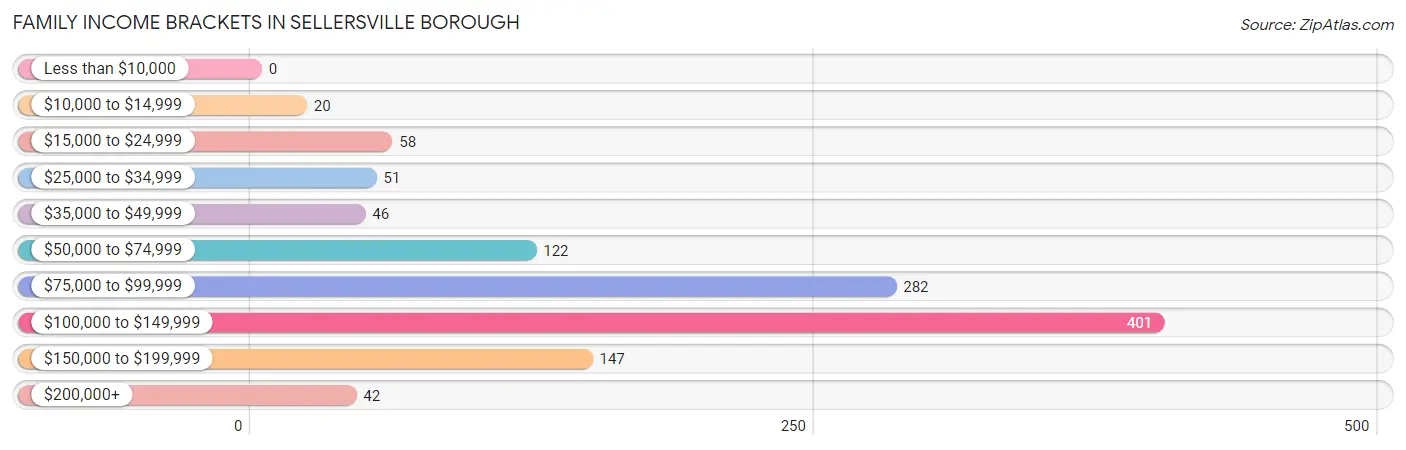
Family Income in Sellersville borough
Family Income Brackets in Sellersville borough
According to the Sellersville borough family income data, there are 401 families falling into the $100,000 to $149,999 income range, which is the most common income bracket and makes up 34.3% of all families.
| Income Bracket | # Families | % Families |
| Less than $10,000 | 0 | 0.0% |
| $10,000 to $14,999 | 20 | 1.7% |
| $15,000 to $24,999 | 58 | 5.0% |
| $25,000 to $34,999 | 51 | 4.4% |
| $35,000 to $49,999 | 46 | 3.9% |
| $50,000 to $74,999 | 122 | 10.4% |
| $75,000 to $99,999 | 282 | 24.1% |
| $100,000 to $149,999 | 401 | 34.3% |
| $150,000 to $199,999 | 147 | 12.6% |
| $200,000+ | 42 | 3.6% |
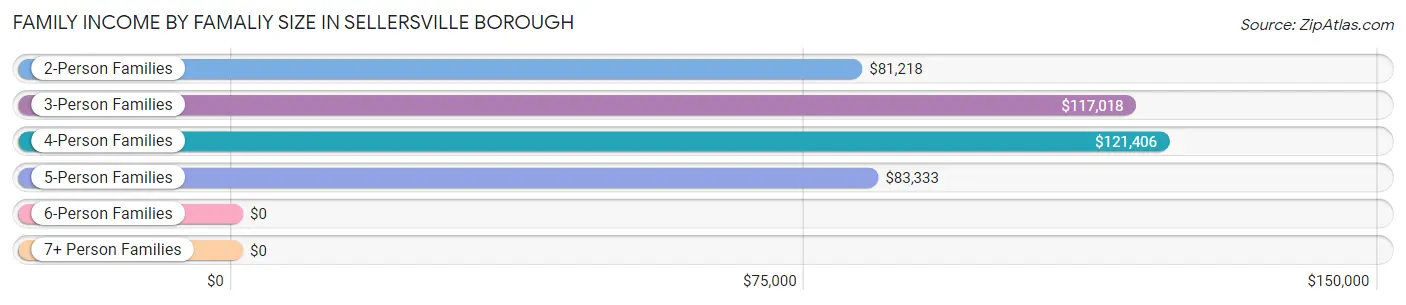
Family Income by Famaliy Size in Sellersville borough
4-person families (205 | 17.5%) account for the highest median family income in Sellersville borough with $121,406 per family, while 2-person families (508 | 43.5%) have the highest median income of $40,609 per family member.
| Income Bracket | # Families | Median Income |
| 2-Person Families | 508 (43.5%) | $81,218 |
| 3-Person Families | 356 (30.4%) | $117,018 |
| 4-Person Families | 205 (17.5%) | $121,406 |
| 5-Person Families | 82 (7.0%) | $83,333 |
| 6-Person Families | 18 (1.5%) | $0 |
| 7+ Person Families | 0 (0.0%) | $0 |
| Total | 1,169 (100.0%) | $100,625 |
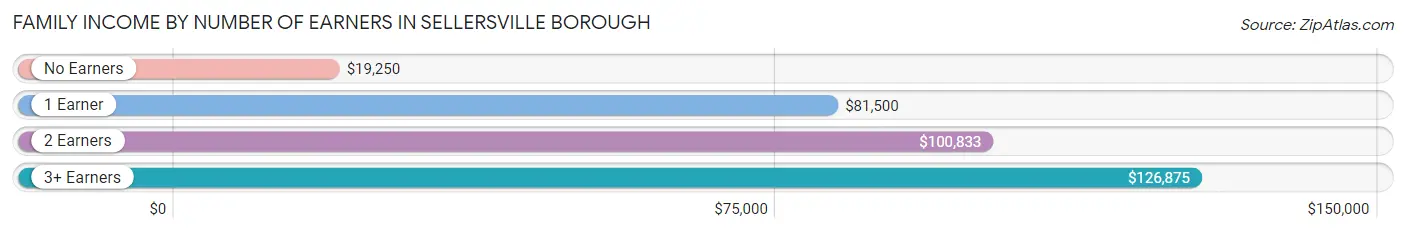
Family Income by Number of Earners in Sellersville borough
The median family income in Sellersville borough is $100,625, with families comprising 3+ earners (209) having the highest median family income of $126,875, while families with no earners (82) have the lowest median family income of $19,250, accounting for 17.9% and 7.0% of families, respectively.
| Number of Earners | # Families | Median Income |
| No Earners | 82 (7.0%) | $19,250 |
| 1 Earner | 330 (28.2%) | $81,500 |
| 2 Earners | 548 (46.9%) | $100,833 |
| 3+ Earners | 209 (17.9%) | $126,875 |
| Total | 1,169 (100.0%) | $100,625 |
Household Income in Sellersville borough
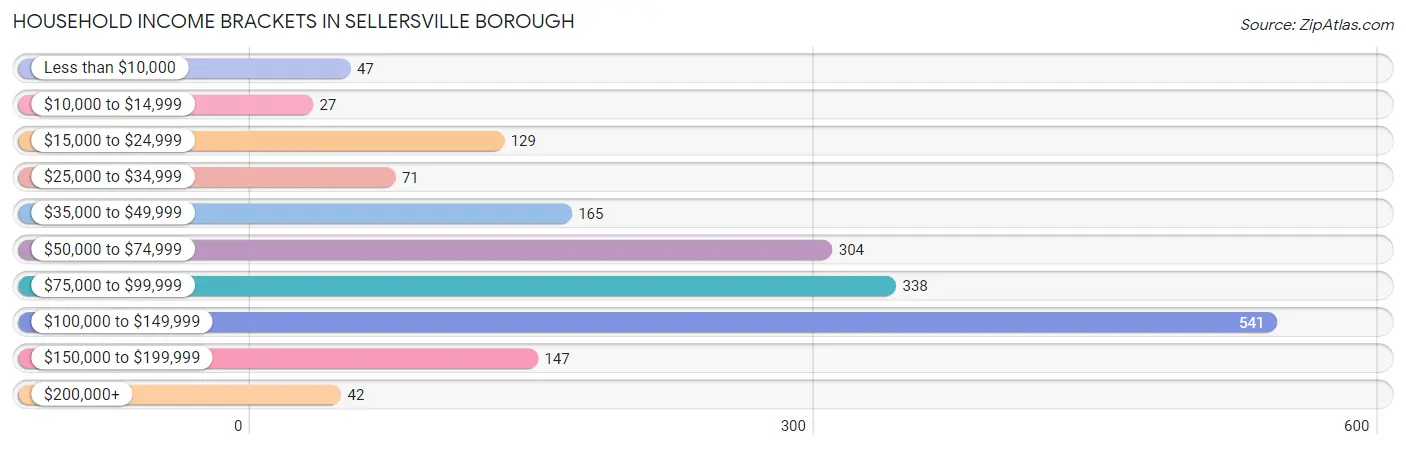
Household Income Brackets in Sellersville borough
With 541 households falling in the category, the $100,000 to $149,999 income range is the most frequent in Sellersville borough, accounting for 29.9% of all households. In contrast, only 27 households (1.5%) fall into the $10,000 to $14,999 income bracket, making it the least populous group.
| Income Bracket | # Households | % Households |
| Less than $10,000 | 47 | 2.6% |
| $10,000 to $14,999 | 27 | 1.5% |
| $15,000 to $24,999 | 129 | 7.1% |
| $25,000 to $34,999 | 71 | 3.9% |
| $35,000 to $49,999 | 165 | 9.1% |
| $50,000 to $74,999 | 304 | 16.8% |
| $75,000 to $99,999 | 338 | 18.7% |
| $100,000 to $149,999 | 541 | 29.9% |
| $150,000 to $199,999 | 147 | 8.1% |
| $200,000+ | 42 | 2.3% |
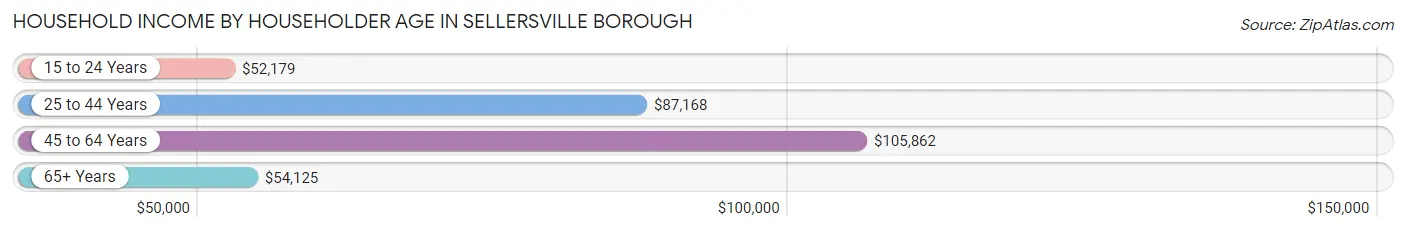
Household Income by Householder Age in Sellersville borough
The median household income in Sellersville borough is $86,276, with the highest median household income of $105,862 found in the 45 to 64 years age bracket for the primary householder. A total of 636 households (35.1%) fall into this category. Meanwhile, the 15 to 24 years age bracket for the primary householder has the lowest median household income of $52,179, with 61 households (3.4%) in this group.
| Income Bracket | # Households | Median Income |
| 15 to 24 Years | 61 (3.4%) | $52,179 |
| 25 to 44 Years | 753 (41.6%) | $87,168 |
| 45 to 64 Years | 636 (35.1%) | $105,862 |
| 65+ Years | 360 (19.9%) | $54,125 |
| Total | 1,810 (100.0%) | $86,276 |
Poverty in Sellersville borough
Income Below Poverty by Sex and Age in Sellersville borough
With 7.5% poverty level for males and 5.0% for females among the residents of Sellersville borough, 75 year old and over males and 35 to 44 year old females are the most vulnerable to poverty, with 14 males (20.9%) and 52 females (12.9%) in their respective age groups living below the poverty level.
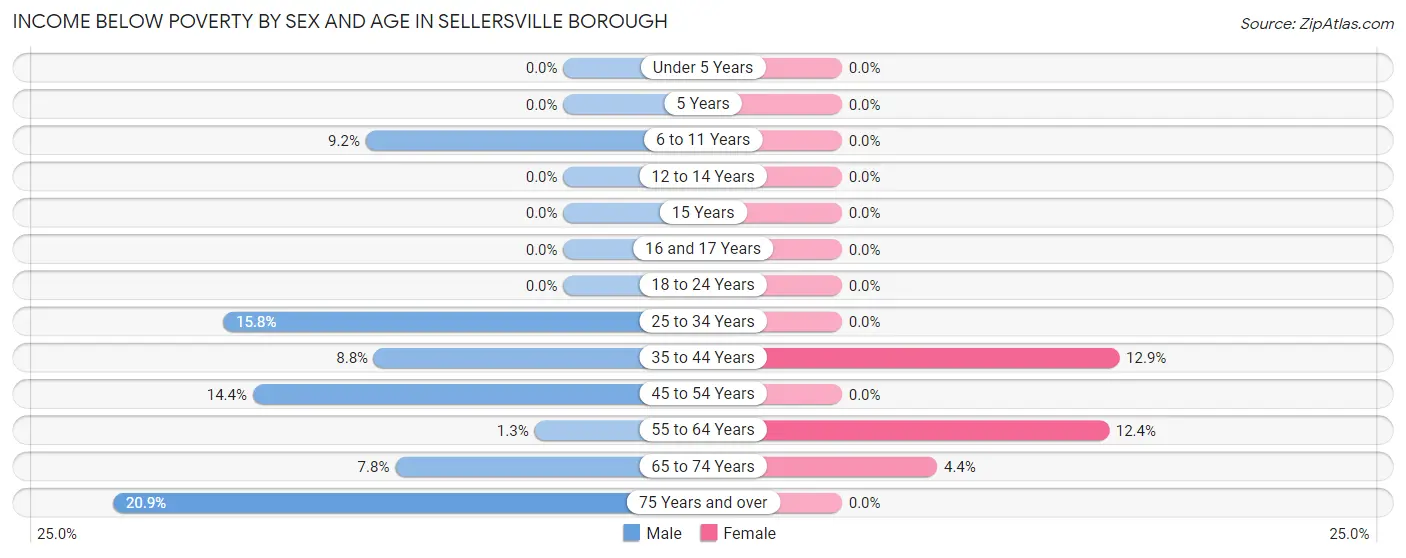
| Age Bracket | Male | Female |
| Under 5 Years | 0 (0.0%) | 0 (0.0%) |
| 5 Years | 0 (0.0%) | 0 (0.0%) |
| 6 to 11 Years | 20 (9.2%) | 0 (0.0%) |
| 12 to 14 Years | 0 (0.0%) | 0 (0.0%) |
| 15 Years | 0 (0.0%) | 0 (0.0%) |
| 16 and 17 Years | 0 (0.0%) | 0 (0.0%) |
| 18 to 24 Years | 0 (0.0%) | 0 (0.0%) |
| 25 to 34 Years | 54 (15.8%) | 0 (0.0%) |
| 35 to 44 Years | 32 (8.8%) | 52 (12.9%) |
| 45 to 54 Years | 32 (14.4%) | 0 (0.0%) |
| 55 to 64 Years | 4 (1.3%) | 54 (12.4%) |
| 65 to 74 Years | 11 (7.8%) | 8 (4.4%) |
| 75 Years and over | 14 (20.9%) | 0 (0.0%) |
| Total | 167 (7.5%) | 114 (5.0%) |
Income Above Poverty by Sex and Age in Sellersville borough
According to the poverty statistics in Sellersville borough, males aged under 5 years and females aged under 5 years are the age groups that are most secure financially, with 100.0% of males and 100.0% of females in these age groups living above the poverty line.
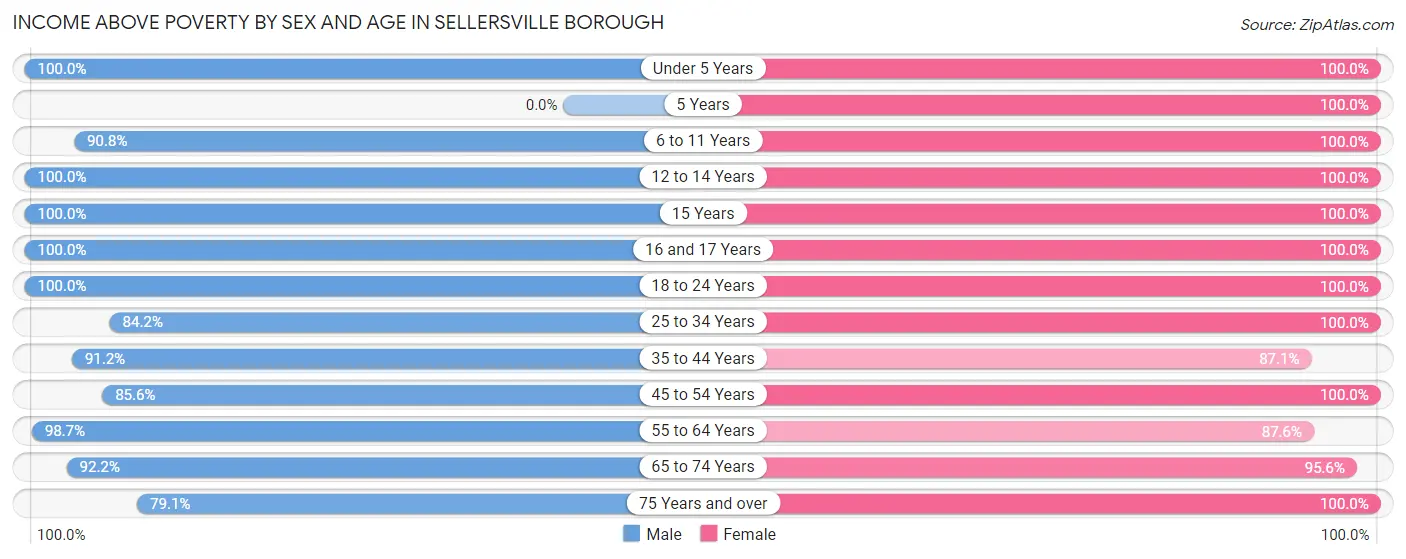
| Age Bracket | Male | Female |
| Under 5 Years | 134 (100.0%) | 111 (100.0%) |
| 5 Years | 0 (0.0%) | 16 (100.0%) |
| 6 to 11 Years | 198 (90.8%) | 204 (100.0%) |
| 12 to 14 Years | 60 (100.0%) | 95 (100.0%) |
| 15 Years | 60 (100.0%) | 17 (100.0%) |
| 16 and 17 Years | 61 (100.0%) | 21 (100.0%) |
| 18 to 24 Years | 255 (100.0%) | 147 (100.0%) |
| 25 to 34 Years | 288 (84.2%) | 339 (100.0%) |
| 35 to 44 Years | 332 (91.2%) | 352 (87.1%) |
| 45 to 54 Years | 190 (85.6%) | 188 (100.0%) |
| 55 to 64 Years | 294 (98.7%) | 382 (87.6%) |
| 65 to 74 Years | 130 (92.2%) | 173 (95.6%) |
| 75 Years and over | 53 (79.1%) | 145 (100.0%) |
| Total | 2,055 (92.5%) | 2,190 (95.1%) |
Income Below Poverty Among Married-Couple Families in Sellersville borough
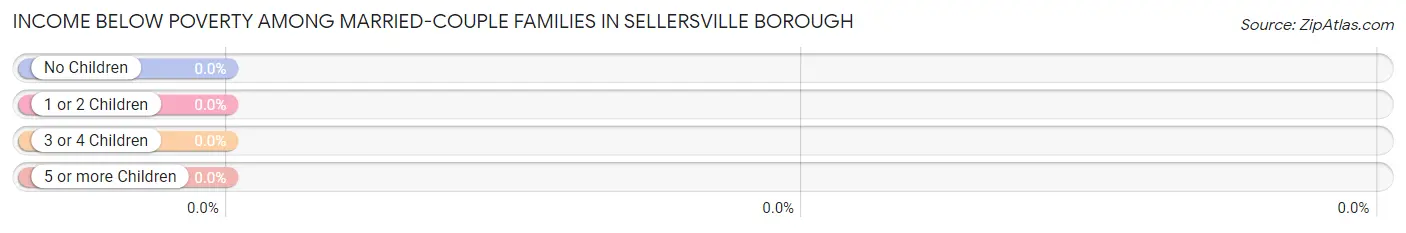
| Children | Above Poverty | Below Poverty |
| No Children | 426 (100.0%) | 0 (0.0%) |
| 1 or 2 Children | 344 (100.0%) | 0 (0.0%) |
| 3 or 4 Children | 37 (100.0%) | 0 (0.0%) |
| 5 or more Children | 0 (0.0%) | 0 (0.0%) |
| Total | 807 (100.0%) | 0 (0.0%) |
Income Below Poverty Among Single-Parent Households in Sellersville borough
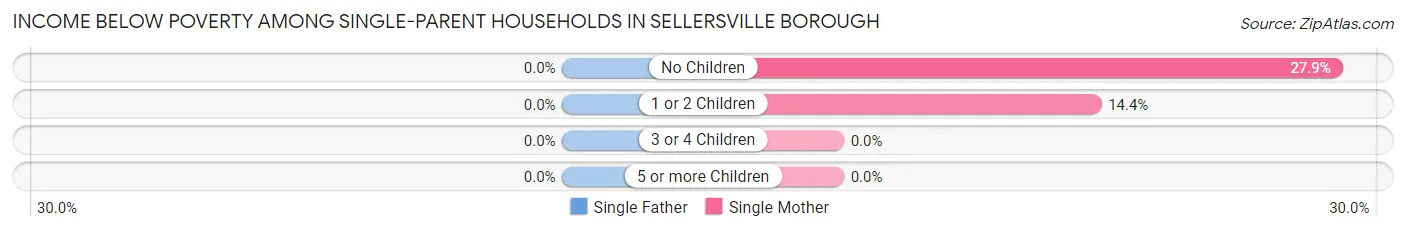
| Children | Single Father | Single Mother |
| No Children | 0 (0.0%) | 34 (27.9%) |
| 1 or 2 Children | 0 (0.0%) | 20 (14.4%) |
| 3 or 4 Children | 0 (0.0%) | 0 (0.0%) |
| 5 or more Children | 0 (0.0%) | 0 (0.0%) |
| Total | 0 (0.0%) | 54 (20.7%) |
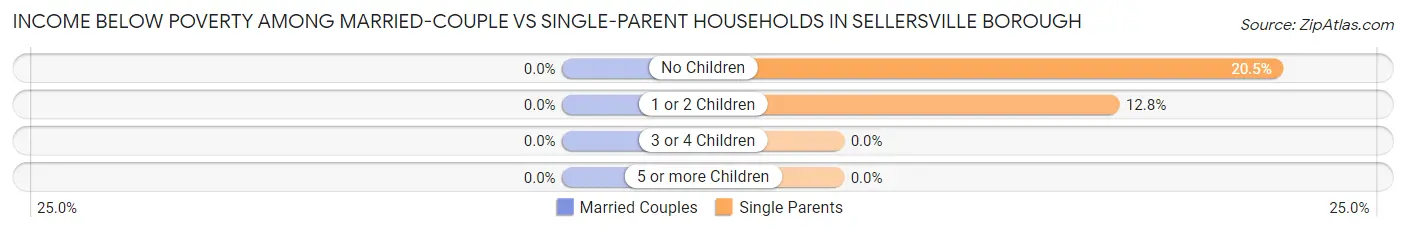
Income Below Poverty Among Married-Couple vs Single-Parent Households in Sellersville borough
| Children | Married-Couple Families | Single-Parent Households |
| No Children | 0 (0.0%) | 34 (20.5%) |
| 1 or 2 Children | 0 (0.0%) | 20 (12.8%) |
| 3 or 4 Children | 0 (0.0%) | 0 (0.0%) |
| 5 or more Children | 0 (0.0%) | 0 (0.0%) |
| Total | 0 (0.0%) | 54 (14.9%) |
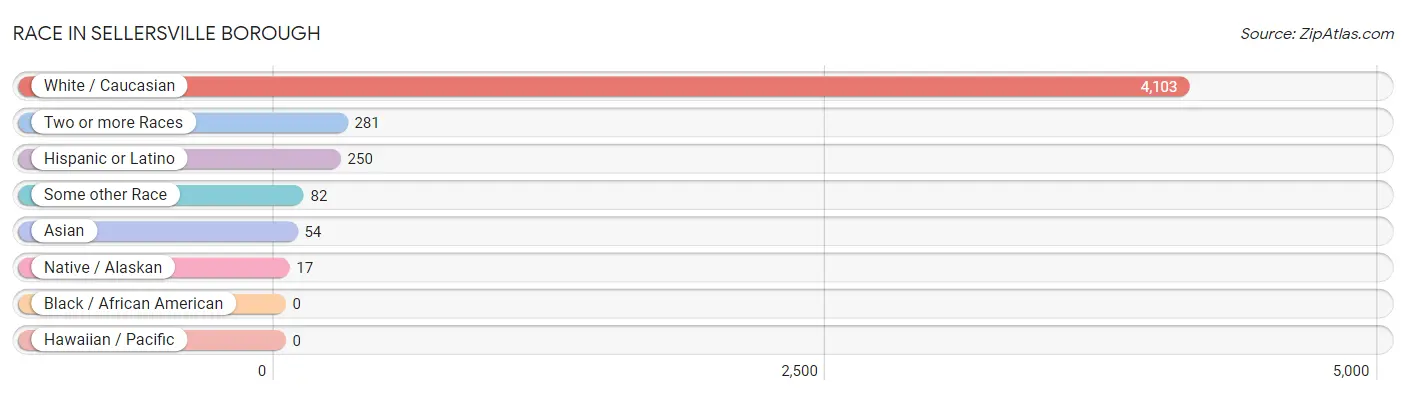
Race in Sellersville borough
The most populous races in Sellersville borough are White / Caucasian (4,103 | 90.4%), Two or more Races (281 | 6.2%), and Hispanic or Latino (250 | 5.5%).
| Race | # Population | % Population |
| Asian | 54 | 1.2% |
| Black / African American | 0 | 0.0% |
| Hawaiian / Pacific | 0 | 0.0% |
| Hispanic or Latino | 250 | 5.5% |
| Native / Alaskan | 17 | 0.4% |
| White / Caucasian | 4,103 | 90.4% |
| Two or more Races | 281 | 6.2% |
| Some other Race | 82 | 1.8% |
| Total | 4,537 | 100.0% |
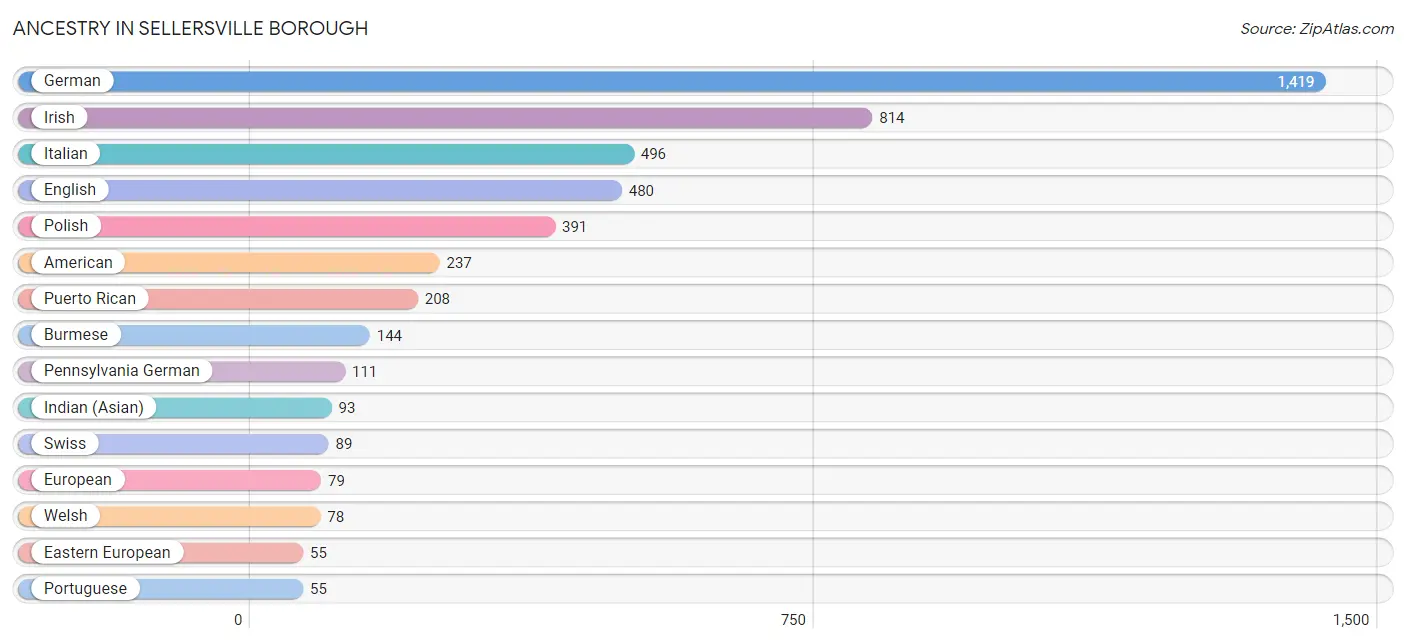
Ancestry in Sellersville borough
The most populous ancestries reported in Sellersville borough are German (1,419 | 31.3%), Irish (814 | 17.9%), Italian (496 | 10.9%), English (480 | 10.6%), and Polish (391 | 8.6%), together accounting for 79.4% of all Sellersville borough residents.
| Ancestry | # Population | % Population |
| American | 237 | 5.2% |
| Blackfeet | 17 | 0.4% |
| British | 52 | 1.1% |
| Burmese | 144 | 3.2% |
| Canadian | 8 | 0.2% |
| Celtic | 32 | 0.7% |
| Cherokee | 17 | 0.4% |
| Czech | 41 | 0.9% |
| Czechoslovakian | 35 | 0.8% |
| Danish | 10 | 0.2% |
| Dutch | 23 | 0.5% |
| Eastern European | 55 | 1.2% |
| English | 480 | 10.6% |
| European | 79 | 1.7% |
| French | 50 | 1.1% |
| French Canadian | 22 | 0.5% |
| German | 1,419 | 31.3% |
| Hungarian | 43 | 0.9% |
| Indian (Asian) | 93 | 2.1% |
| Irish | 814 | 17.9% |
| Italian | 496 | 10.9% |
| Korean | 54 | 1.2% |
| Lithuanian | 17 | 0.4% |
| Pennsylvania German | 111 | 2.5% |
| Polish | 391 | 8.6% |
| Portuguese | 55 | 1.2% |
| Puerto Rican | 208 | 4.6% |
| Romanian | 26 | 0.6% |
| Scotch-Irish | 32 | 0.7% |
| Scottish | 32 | 0.7% |
| Serbian | 13 | 0.3% |
| Slovak | 5 | 0.1% |
| Swedish | 13 | 0.3% |
| Swiss | 89 | 2.0% |
| Ukrainian | 37 | 0.8% |
| Welsh | 78 | 1.7% | View All 36 Rows |
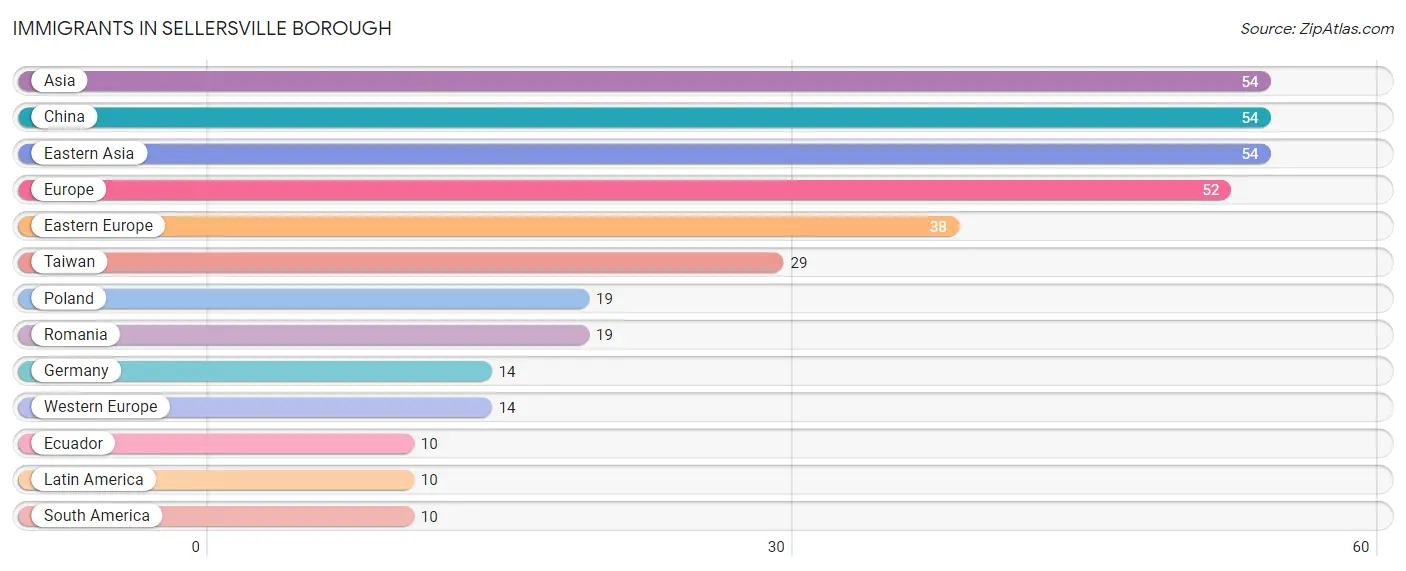
Immigrants in Sellersville borough
The most numerous immigrant groups reported in Sellersville borough came from Asia (54 | 1.2%), China (54 | 1.2%), Eastern Asia (54 | 1.2%), Europe (52 | 1.1%), and Eastern Europe (38 | 0.8%), together accounting for 5.6% of all Sellersville borough residents.
| Immigration Origin | # Population | % Population |
| Asia | 54 | 1.2% |
| China | 54 | 1.2% |
| Eastern Asia | 54 | 1.2% |
| Eastern Europe | 38 | 0.8% |
| Ecuador | 10 | 0.2% |
| Europe | 52 | 1.1% |
| Germany | 14 | 0.3% |
| Latin America | 10 | 0.2% |
| Poland | 19 | 0.4% |
| Romania | 19 | 0.4% |
| South America | 10 | 0.2% |
| Taiwan | 29 | 0.6% |
| Western Europe | 14 | 0.3% | View All 13 Rows |
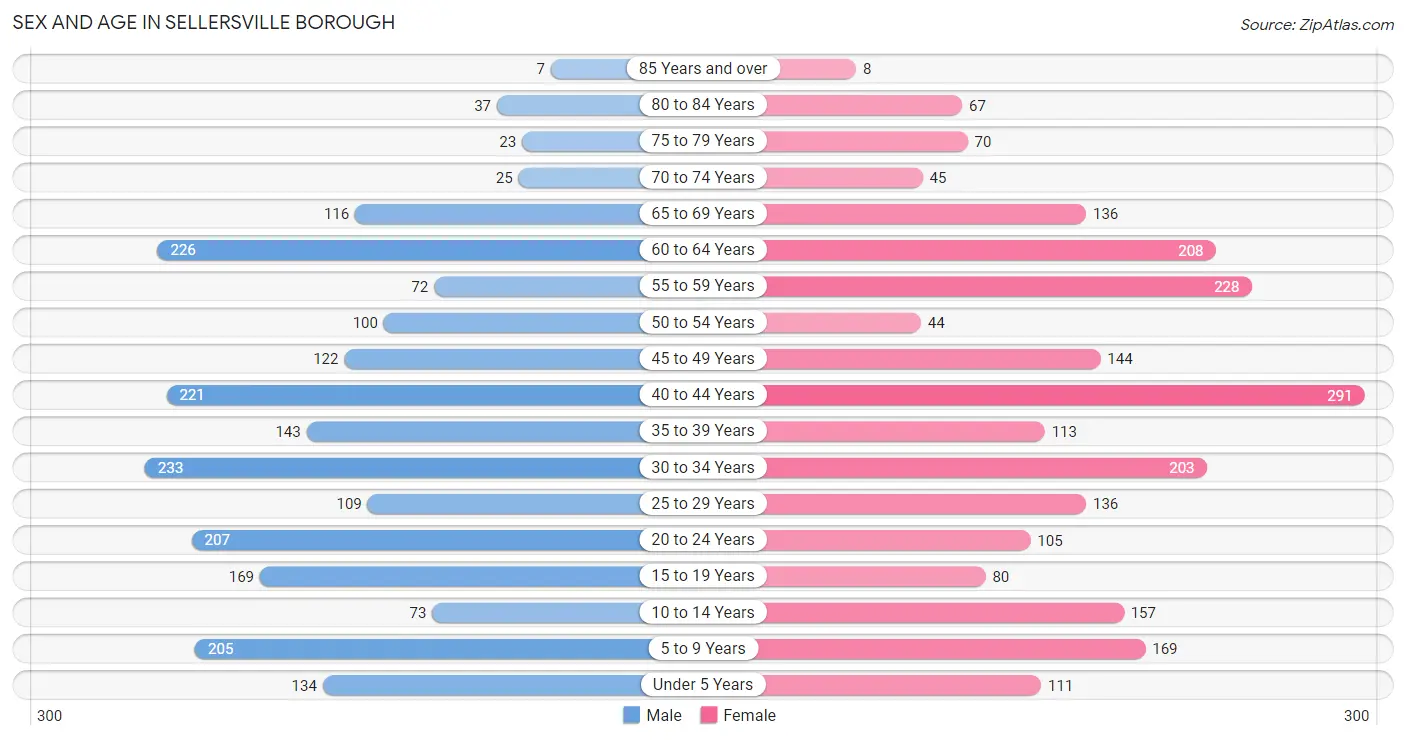
Sex and Age in Sellersville borough
Sex and Age in Sellersville borough
The most populous age groups in Sellersville borough are 30 to 34 Years (233 | 10.5%) for men and 40 to 44 Years (291 | 12.6%) for women.
| Age Bracket | Male | Female |
| Under 5 Years | 134 (6.0%) | 111 (4.8%) |
| 5 to 9 Years | 205 (9.2%) | 169 (7.3%) |
| 10 to 14 Years | 73 (3.3%) | 157 (6.8%) |
| 15 to 19 Years | 169 (7.6%) | 80 (3.5%) |
| 20 to 24 Years | 207 (9.3%) | 105 (4.5%) |
| 25 to 29 Years | 109 (4.9%) | 136 (5.9%) |
| 30 to 34 Years | 233 (10.5%) | 203 (8.8%) |
| 35 to 39 Years | 143 (6.4%) | 113 (4.9%) |
| 40 to 44 Years | 221 (10.0%) | 291 (12.6%) |
| 45 to 49 Years | 122 (5.5%) | 144 (6.2%) |
| 50 to 54 Years | 100 (4.5%) | 44 (1.9%) |
| 55 to 59 Years | 72 (3.2%) | 228 (9.9%) |
| 60 to 64 Years | 226 (10.2%) | 208 (9.0%) |
| 65 to 69 Years | 116 (5.2%) | 136 (5.9%) |
| 70 to 74 Years | 25 (1.1%) | 45 (1.9%) |
| 75 to 79 Years | 23 (1.0%) | 70 (3.0%) |
| 80 to 84 Years | 37 (1.7%) | 67 (2.9%) |
| 85 Years and over | 7 (0.3%) | 8 (0.4%) |
| Total | 2,222 (100.0%) | 2,315 (100.0%) |
Families and Households in Sellersville borough
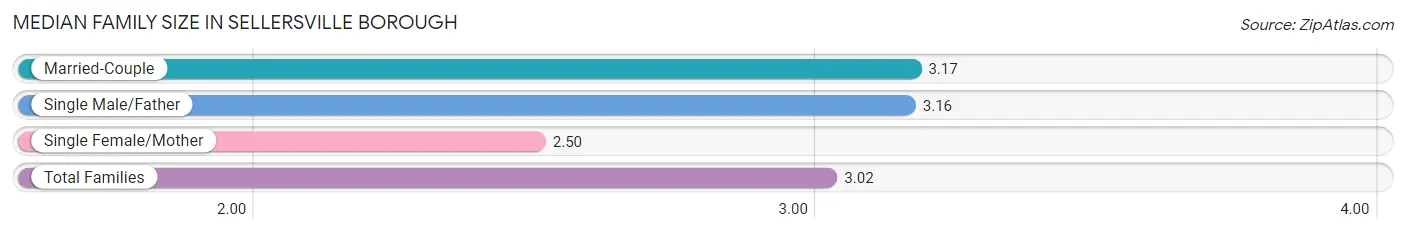
Median Family Size in Sellersville borough
The median family size in Sellersville borough is 3.02 persons per family, with married-couple families (807 | 69.0%) accounting for the largest median family size of 3.17 persons per family. On the other hand, single female/mother families (261 | 22.3%) represent the smallest median family size with 2.50 persons per family.
| Family Type | # Families | Family Size |
| Married-Couple | 807 (69.0%) | 3.17 |
| Single Male/Father | 101 (8.6%) | 3.16 |
| Single Female/Mother | 261 (22.3%) | 2.50 |
| Total Families | 1,169 (100.0%) | 3.02 |
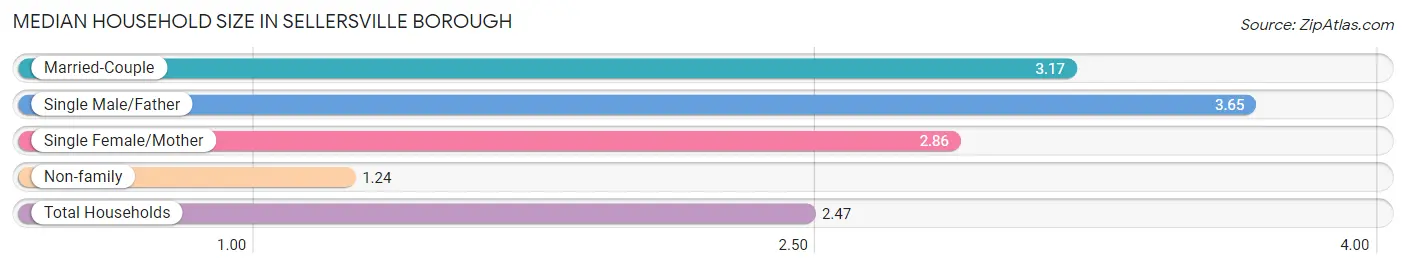
Median Household Size in Sellersville borough
The median household size in Sellersville borough is 2.47 persons per household, with single male/father households (101 | 5.6%) accounting for the largest median household size of 3.65 persons per household. non-family households (641 | 35.4%) represent the smallest median household size with 1.24 persons per household.
| Household Type | # Households | Household Size |
| Married-Couple | 807 (44.6%) | 3.17 |
| Single Male/Father | 101 (5.6%) | 3.65 |
| Single Female/Mother | 261 (14.4%) | 2.86 |
| Non-family | 641 (35.4%) | 1.24 |
| Total Households | 1,810 (100.0%) | 2.47 |
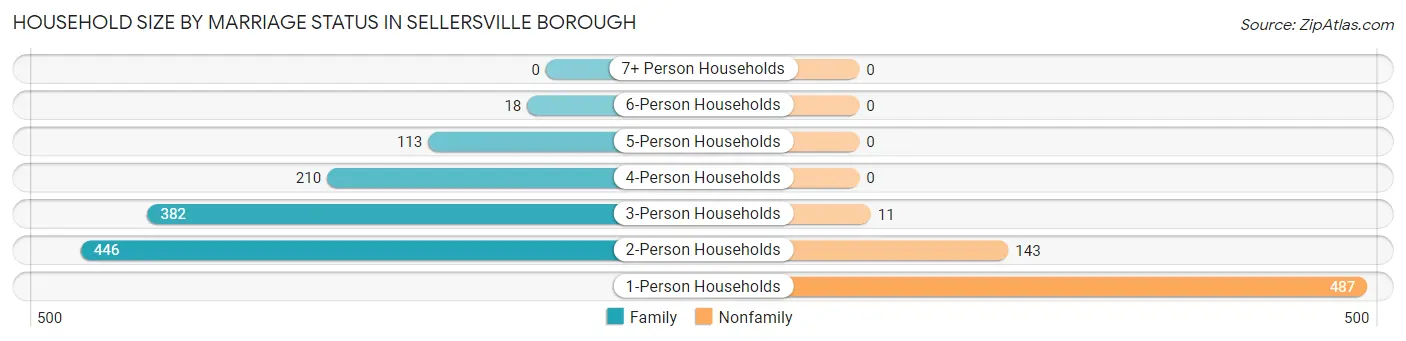
Household Size by Marriage Status in Sellersville borough
Out of a total of 1,810 households in Sellersville borough, 1,169 (64.6%) are family households, while 641 (35.4%) are nonfamily households. The most numerous type of family households are 2-person households, comprising 446, and the most common type of nonfamily households are 1-person households, comprising 487.
| Household Size | Family Households | Nonfamily Households |
| 1-Person Households | - | 487 (26.9%) |
| 2-Person Households | 446 (24.6%) | 143 (7.9%) |
| 3-Person Households | 382 (21.1%) | 11 (0.6%) |
| 4-Person Households | 210 (11.6%) | 0 (0.0%) |
| 5-Person Households | 113 (6.2%) | 0 (0.0%) |
| 6-Person Households | 18 (1.0%) | 0 (0.0%) |
| 7+ Person Households | 0 (0.0%) | 0 (0.0%) |
| Total | 1,169 (64.6%) | 641 (35.4%) |
Female Fertility in Sellersville borough
Fertility by Age in Sellersville borough
Average fertility rate in Sellersville borough is 73.0 births per 1,000 women. Women in the age bracket of 20 to 34 years have the highest fertility rate with 110.0 births per 1,000 women. Women in the age bracket of 20 to 34 years acount for 62.0% of all women with births.
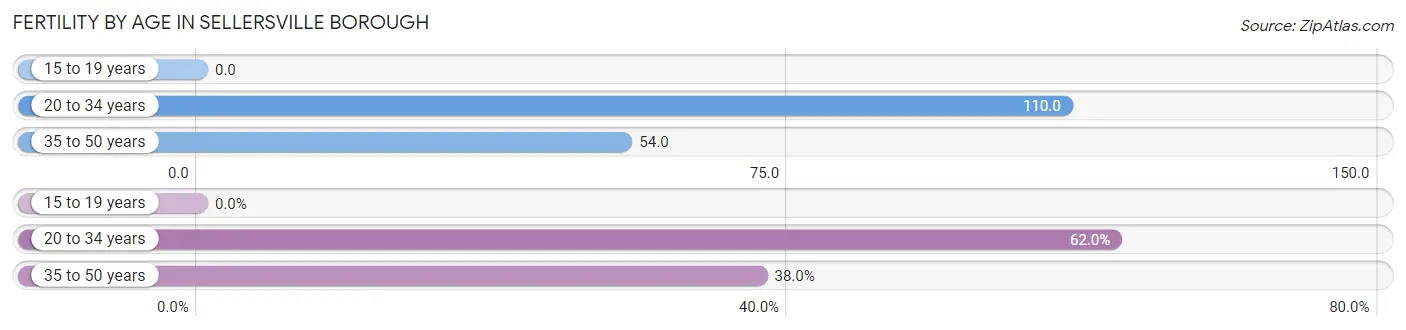
| Age Bracket | Women with Births | Births / 1,000 Women |
| 15 to 19 years | 0 (0.0%) | 0.0 |
| 20 to 34 years | 49 (62.0%) | 110.0 |
| 35 to 50 years | 30 (38.0%) | 54.0 |
| Total | 79 (100.0%) | 73.0 |
Fertility by Age by Marriage Status in Sellersville borough
91.1% of women with births (79) in Sellersville borough are married. The highest percentage of unmarried women with births falls into 35 to 50 years age bracket with 23.3% of them unmarried at the time of birth, while the lowest percentage of unmarried women with births belong to 20 to 34 years age bracket with 0.0% of them unmarried.
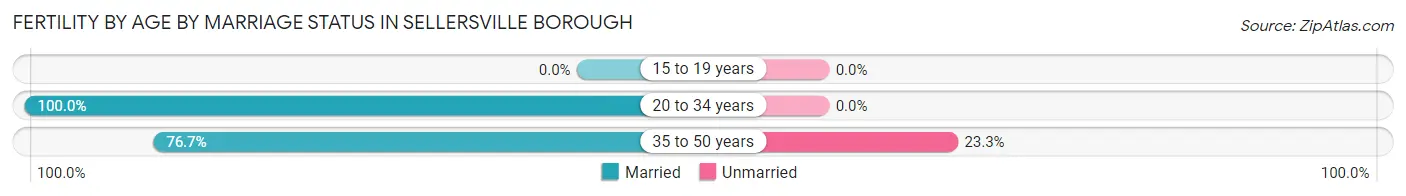
| Age Bracket | Married | Unmarried |
| 15 to 19 years | 0 (0.0%) | 0 (0.0%) |
| 20 to 34 years | 49 (100.0%) | 0 (0.0%) |
| 35 to 50 years | 23 (76.7%) | 7 (23.3%) |
| Total | 72 (91.1%) | 7 (8.9%) |
Fertility by Education in Sellersville borough
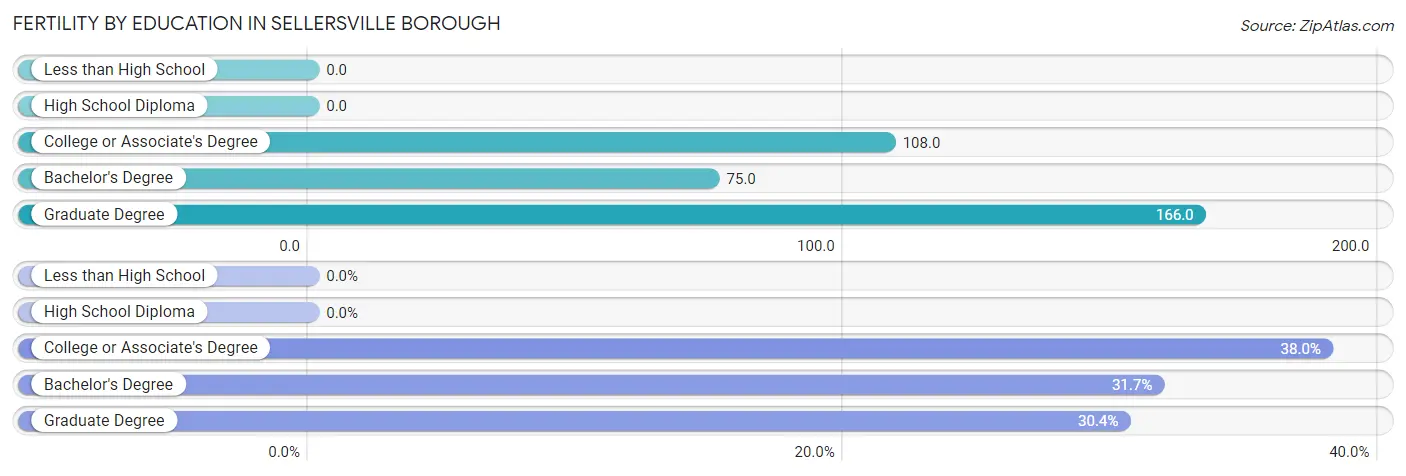
| Educational Attainment | Women with Births | Births / 1,000 Women |
| Less than High School | 0 (0.0%) | 0.0 |
| High School Diploma | 0 (0.0%) | 0.0 |
| College or Associate's Degree | 30 (38.0%) | 108.0 |
| Bachelor's Degree | 25 (31.7%) | 75.0 |
| Graduate Degree | 24 (30.4%) | 166.0 |
| Total | 79 (100.0%) | 73.0 |
Fertility by Education by Marriage Status in Sellersville borough
8.9% of women with births in Sellersville borough are unmarried. Women with the educational attainment of bachelor's degree are most likely to be married with 100.0% of them married at childbirth, while women with the educational attainment of college or associate's degree are least likely to be married with 23.3% of them unmarried at childbirth.
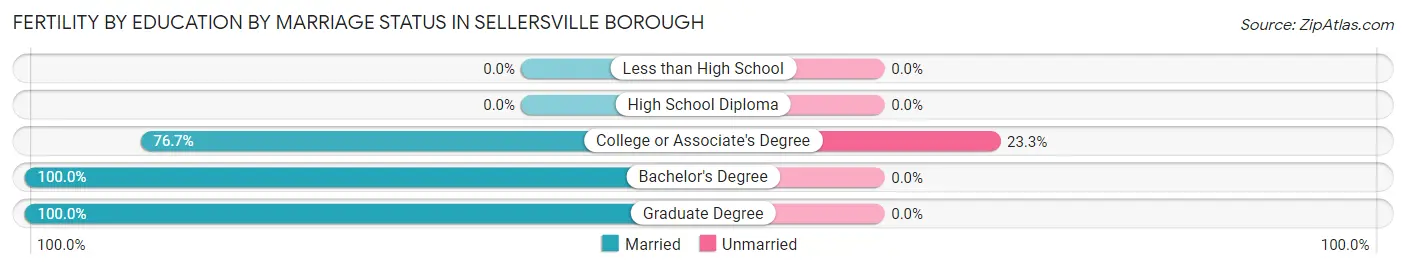
| Educational Attainment | Married | Unmarried |
| Less than High School | 0 (0.0%) | 0 (0.0%) |
| High School Diploma | 0 (0.0%) | 0 (0.0%) |
| College or Associate's Degree | 23 (76.7%) | 7 (23.3%) |
| Bachelor's Degree | 25 (100.0%) | 0 (0.0%) |
| Graduate Degree | 24 (100.0%) | 0 (0.0%) |
| Total | 72 (91.1%) | 7 (8.9%) |
Employment Characteristics in Sellersville borough
Employment by Class of Employer in Sellersville borough
Among the 2,696 employed individuals in Sellersville borough, private company employees (1,815 | 67.3%), not-for-profit organizations (494 | 18.3%), and local government employees (224 | 8.3%) make up the most common classes of employment.
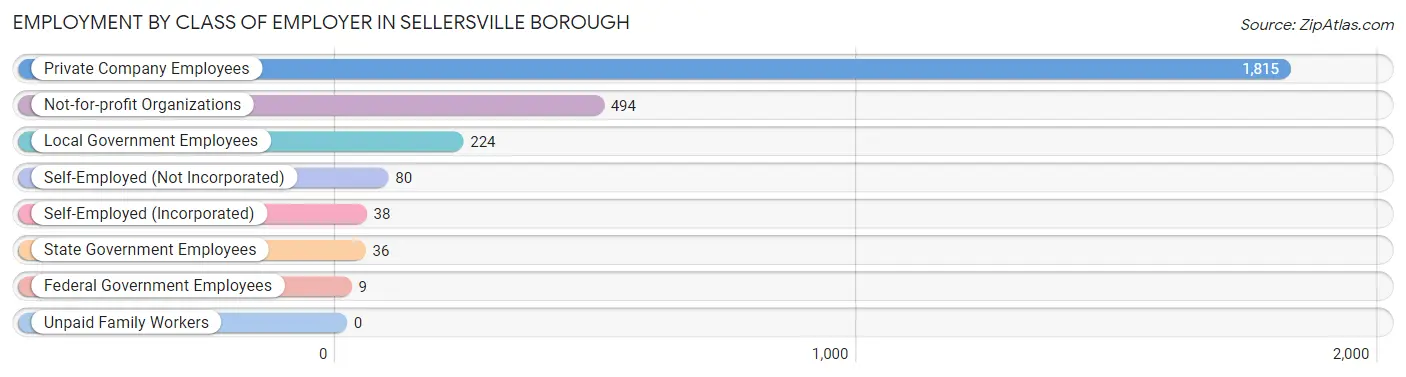
| Employer Class | # Employees | % Employees |
| Private Company Employees | 1,815 | 67.3% |
| Self-Employed (Incorporated) | 38 | 1.4% |
| Self-Employed (Not Incorporated) | 80 | 3.0% |
| Not-for-profit Organizations | 494 | 18.3% |
| Local Government Employees | 224 | 8.3% |
| State Government Employees | 36 | 1.3% |
| Federal Government Employees | 9 | 0.3% |
| Unpaid Family Workers | 0 | 0.0% |
| Total | 2,696 | 100.0% |
Employment Status by Age in Sellersville borough
According to the labor force statistics for Sellersville borough, out of the total population over 16 years of age (3,611), 78.2% or 2,824 individuals are in the labor force, with 3.3% or 93 of them unemployed. The age group with the highest labor force participation rate is 25 to 29 years, with 100.0% or 245 individuals in the labor force. Within the labor force, the 65 to 74 years age range has the highest percentage of unemployed individuals, with 15.6% or 26 of them being unemployed.
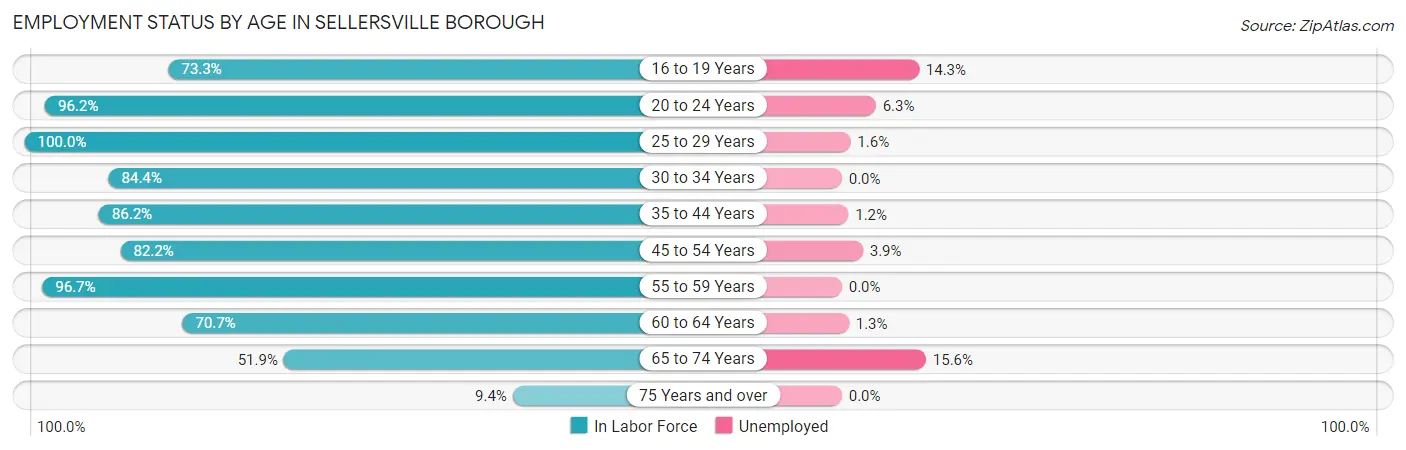
| Age Bracket | In Labor Force | Unemployed |
| 16 to 19 Years | 126 (73.3%) | 18 (14.3%) |
| 20 to 24 Years | 300 (96.2%) | 19 (6.3%) |
| 25 to 29 Years | 245 (100.0%) | 4 (1.6%) |
| 30 to 34 Years | 368 (84.4%) | 0 (0.0%) |
| 35 to 44 Years | 662 (86.2%) | 8 (1.2%) |
| 45 to 54 Years | 337 (82.2%) | 13 (3.9%) |
| 55 to 59 Years | 290 (96.7%) | 0 (0.0%) |
| 60 to 64 Years | 307 (70.7%) | 4 (1.3%) |
| 65 to 74 Years | 167 (51.9%) | 26 (15.6%) |
| 75 Years and over | 20 (9.4%) | 0 (0.0%) |
| Total | 2,824 (78.2%) | 93 (3.3%) |
Employment Status by Educational Attainment in Sellersville borough
According to labor force statistics for Sellersville borough, 85.2% of individuals (2,209) out of the total population between 25 and 64 years of age (2,593) are in the labor force, with 1.3% or 29 of them being unemployed. The group with the highest labor force participation rate are those with the educational attainment of bachelor's degree or higher, with 91.6% or 830 individuals in the labor force. Within the labor force, individuals with less than high school education have the highest percentage of unemployment, with 3.8% or 4 of them being unemployed.
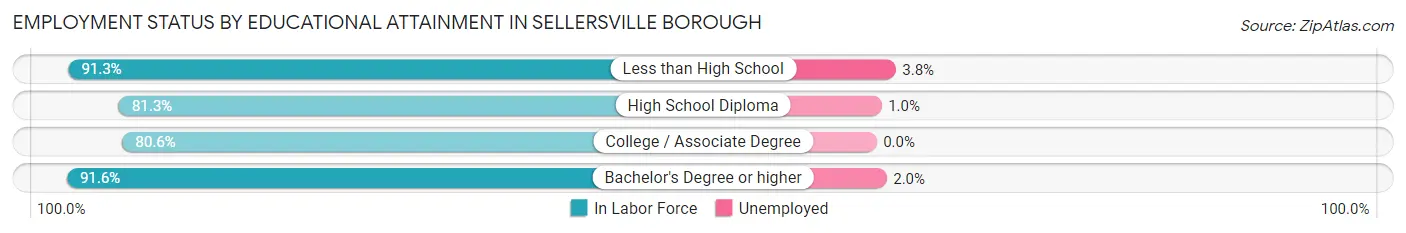
| Educational Attainment | In Labor Force | Unemployed |
| Less than High School | 105 (91.3%) | 4 (3.8%) |
| High School Diploma | 805 (81.3%) | 10 (1.0%) |
| College / Associate Degree | 469 (80.6%) | 0 (0.0%) |
| Bachelor's Degree or higher | 830 (91.6%) | 18 (2.0%) |
| Total | 2,209 (85.2%) | 34 (1.3%) |
Employment Occupations by Sex in Sellersville borough
Management, Business, Science and Arts Occupations
The most common Management, Business, Science and Arts occupations in Sellersville borough are Community & Social Service (295 | 10.8%), Management (249 | 9.1%), Health Diagnosing & Treating (176 | 6.5%), Computers, Engineering & Science (169 | 6.2%), and Education Instruction & Library (156 | 5.7%).
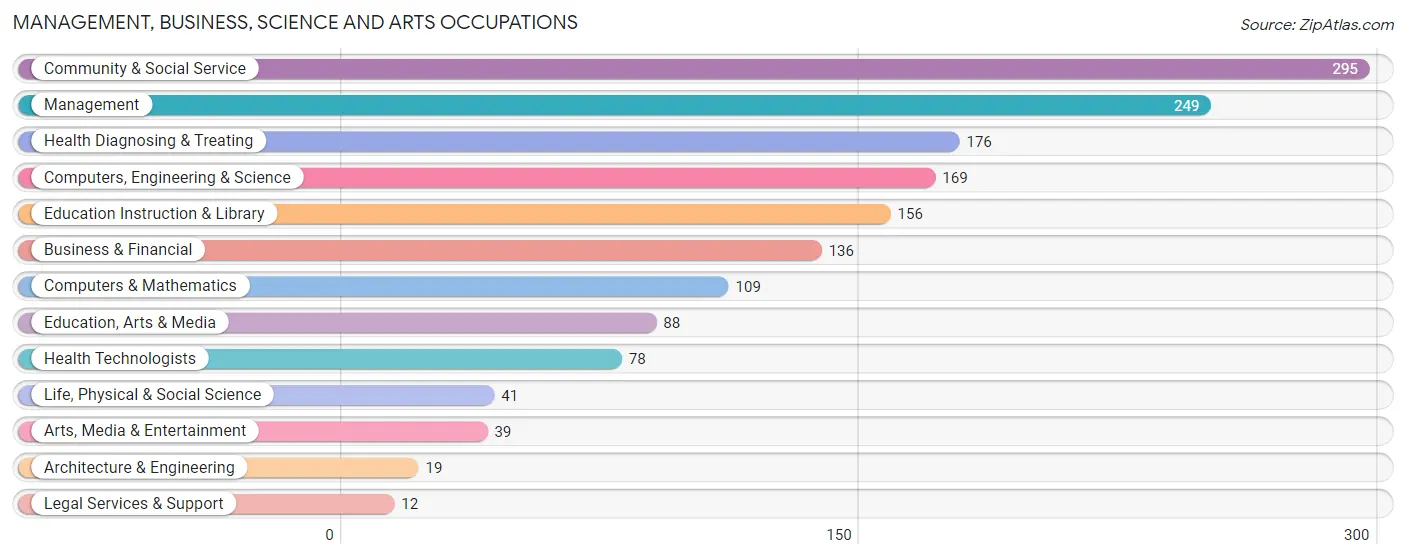
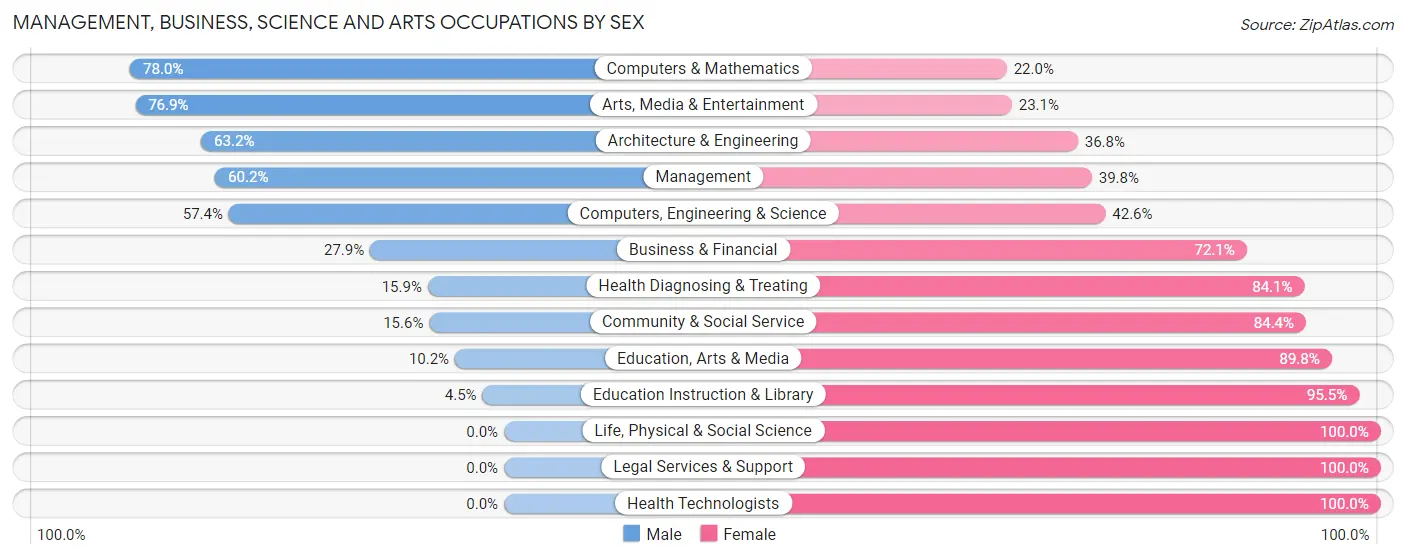
Management, Business, Science and Arts Occupations by Sex
Within the Management, Business, Science and Arts occupations in Sellersville borough, the most male-oriented occupations are Computers & Mathematics (78.0%), Arts, Media & Entertainment (76.9%), and Architecture & Engineering (63.2%), while the most female-oriented occupations are Life, Physical & Social Science (100.0%), Legal Services & Support (100.0%), and Health Technologists (100.0%).
| Occupation | Male | Female |
| Management | 150 (60.2%) | 99 (39.8%) |
| Business & Financial | 38 (27.9%) | 98 (72.1%) |
| Computers, Engineering & Science | 97 (57.4%) | 72 (42.6%) |
| Computers & Mathematics | 85 (78.0%) | 24 (22.0%) |
| Architecture & Engineering | 12 (63.2%) | 7 (36.8%) |
| Life, Physical & Social Science | 0 (0.0%) | 41 (100.0%) |
| Community & Social Service | 46 (15.6%) | 249 (84.4%) |
| Education, Arts & Media | 9 (10.2%) | 79 (89.8%) |
| Legal Services & Support | 0 (0.0%) | 12 (100.0%) |
| Education Instruction & Library | 7 (4.5%) | 149 (95.5%) |
| Arts, Media & Entertainment | 30 (76.9%) | 9 (23.1%) |
| Health Diagnosing & Treating | 28 (15.9%) | 148 (84.1%) |
| Health Technologists | 0 (0.0%) | 78 (100.0%) |
| Total (Category) | 359 (35.0%) | 666 (65.0%) |
| Total (Overall) | 1,373 (50.3%) | 1,357 (49.7%) |
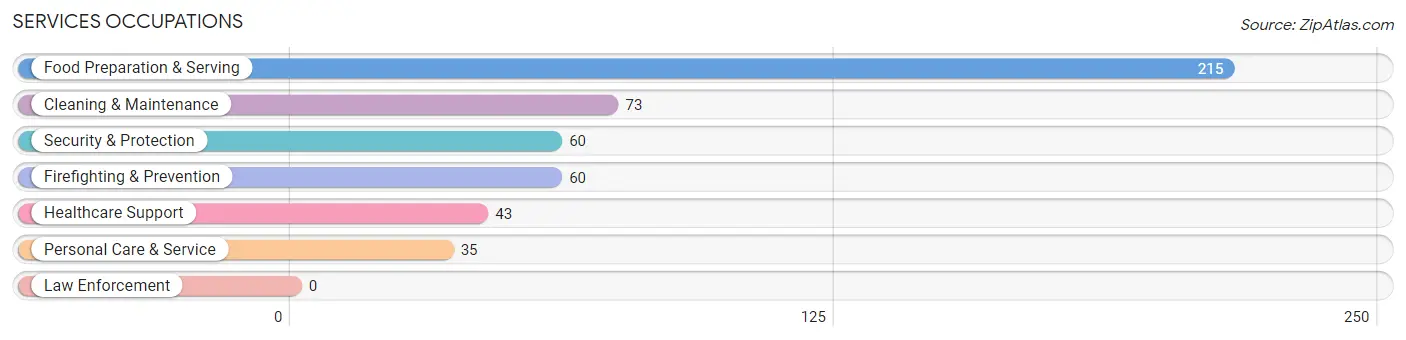
Services Occupations
The most common Services occupations in Sellersville borough are Food Preparation & Serving (215 | 7.9%), Cleaning & Maintenance (73 | 2.7%), Security & Protection (60 | 2.2%), Firefighting & Prevention (60 | 2.2%), and Healthcare Support (43 | 1.6%).
Services Occupations by Sex
Within the Services occupations in Sellersville borough, the most male-oriented occupations are Security & Protection (83.3%), Firefighting & Prevention (83.3%), and Cleaning & Maintenance (79.4%), while the most female-oriented occupations are Personal Care & Service (88.6%), Healthcare Support (79.1%), and Food Preparation & Serving (60.9%).
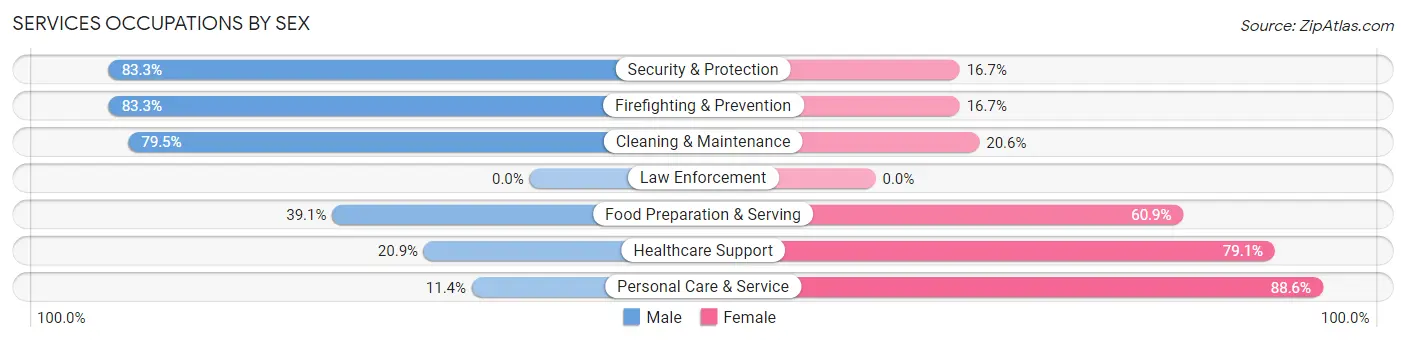
| Occupation | Male | Female |
| Healthcare Support | 9 (20.9%) | 34 (79.1%) |
| Security & Protection | 50 (83.3%) | 10 (16.7%) |
| Firefighting & Prevention | 50 (83.3%) | 10 (16.7%) |
| Law Enforcement | 0 (0.0%) | 0 (0.0%) |
| Food Preparation & Serving | 84 (39.1%) | 131 (60.9%) |
| Cleaning & Maintenance | 58 (79.4%) | 15 (20.5%) |
| Personal Care & Service | 4 (11.4%) | 31 (88.6%) |
| Total (Category) | 205 (48.1%) | 221 (51.9%) |
| Total (Overall) | 1,373 (50.3%) | 1,357 (49.7%) |
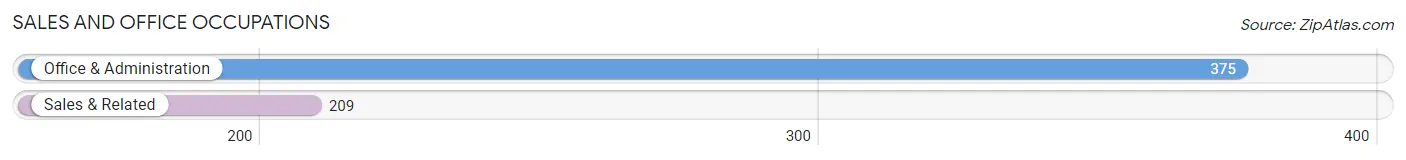
Sales and Office Occupations
The most common Sales and Office occupations in Sellersville borough are Office & Administration (375 | 13.7%), and Sales & Related (209 | 7.7%).
Sales and Office Occupations by Sex
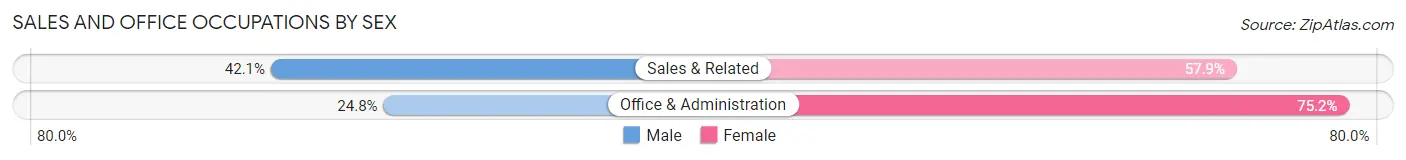
| Occupation | Male | Female |
| Sales & Related | 88 (42.1%) | 121 (57.9%) |
| Office & Administration | 93 (24.8%) | 282 (75.2%) |
| Total (Category) | 181 (31.0%) | 403 (69.0%) |
| Total (Overall) | 1,373 (50.3%) | 1,357 (49.7%) |
Natural Resources, Construction and Maintenance Occupations
The most common Natural Resources, Construction and Maintenance occupations in Sellersville borough are Construction & Extraction (149 | 5.5%), and Installation, Maintenance & Repair (126 | 4.6%).
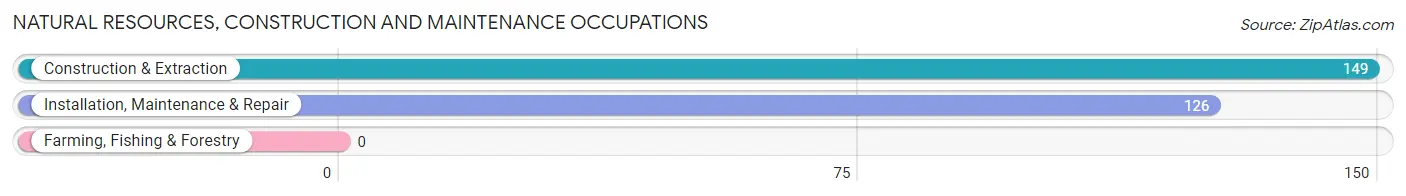
Natural Resources, Construction and Maintenance Occupations by Sex

| Occupation | Male | Female |
| Farming, Fishing & Forestry | 0 (0.0%) | 0 (0.0%) |
| Construction & Extraction | 149 (100.0%) | 0 (0.0%) |
| Installation, Maintenance & Repair | 126 (100.0%) | 0 (0.0%) |
| Total (Category) | 275 (100.0%) | 0 (0.0%) |
| Total (Overall) | 1,373 (50.3%) | 1,357 (49.7%) |
Production, Transportation and Moving Occupations
The most common Production, Transportation and Moving occupations in Sellersville borough are Production (296 | 10.8%), Material Moving (69 | 2.5%), and Transportation (55 | 2.0%).
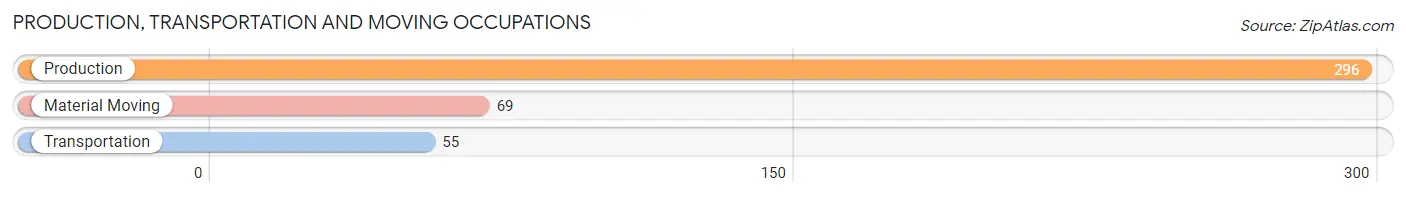
Production, Transportation and Moving Occupations by Sex
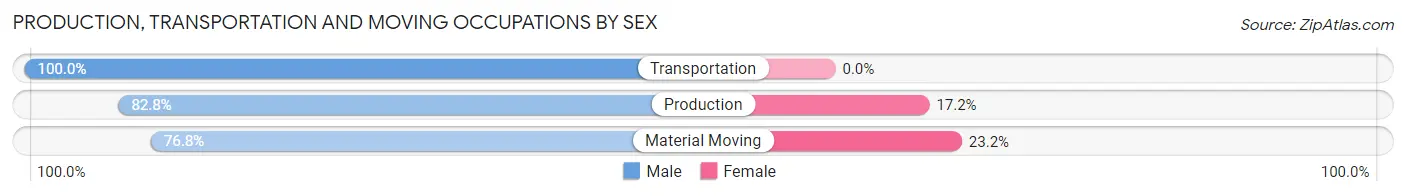
| Occupation | Male | Female |
| Production | 245 (82.8%) | 51 (17.2%) |
| Transportation | 55 (100.0%) | 0 (0.0%) |
| Material Moving | 53 (76.8%) | 16 (23.2%) |
| Total (Category) | 353 (84.1%) | 67 (16.0%) |
| Total (Overall) | 1,373 (50.3%) | 1,357 (49.7%) |
Employment Industries by Sex in Sellersville borough
Employment Industries in Sellersville borough
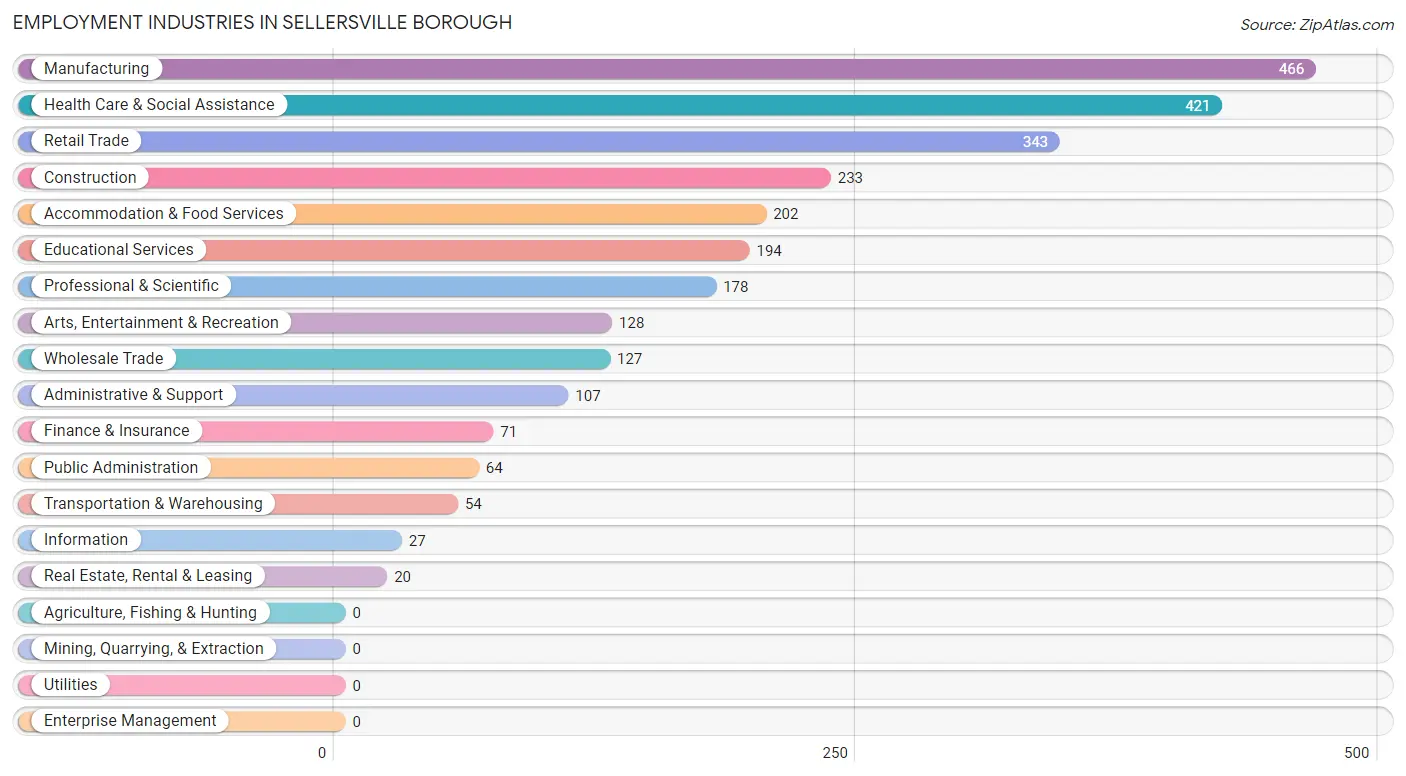
The major employment industries in Sellersville borough include Manufacturing (466 | 17.1%), Health Care & Social Assistance (421 | 15.4%), Retail Trade (343 | 12.6%), Construction (233 | 8.5%), and Accommodation & Food Services (202 | 7.4%).
Employment Industries by Sex in Sellersville borough
The Sellersville borough industries that see more men than women are Transportation & Warehousing (100.0%), Real Estate, Rental & Leasing (100.0%), and Construction (95.7%), whereas the industries that tend to have a higher number of women are Health Care & Social Assistance (86.2%), Public Administration (82.8%), and Finance & Insurance (80.3%).
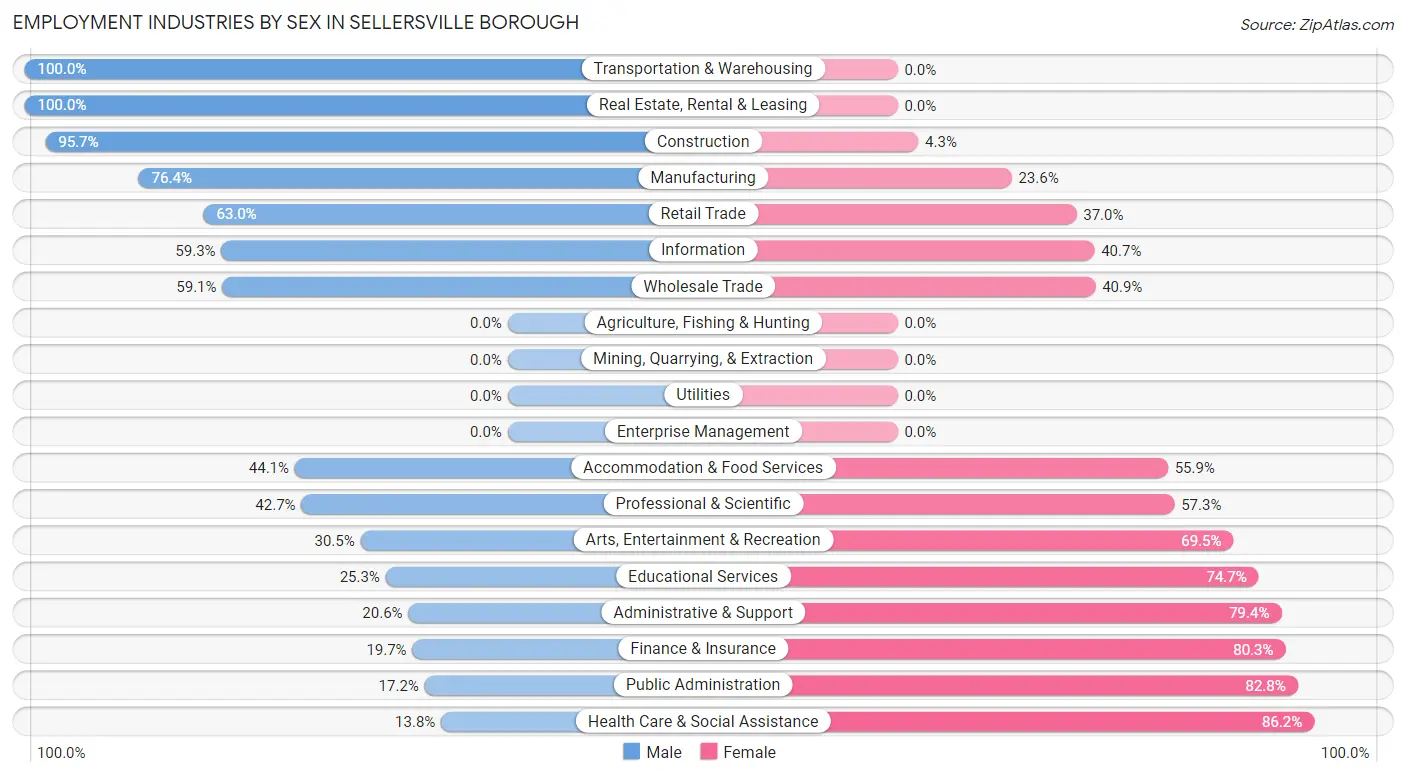
| Industry | Male | Female |
| Agriculture, Fishing & Hunting | 0 (0.0%) | 0 (0.0%) |
| Mining, Quarrying, & Extraction | 0 (0.0%) | 0 (0.0%) |
| Construction | 223 (95.7%) | 10 (4.3%) |
| Manufacturing | 356 (76.4%) | 110 (23.6%) |
| Wholesale Trade | 75 (59.1%) | 52 (40.9%) |
| Retail Trade | 216 (63.0%) | 127 (37.0%) |
| Transportation & Warehousing | 54 (100.0%) | 0 (0.0%) |
| Utilities | 0 (0.0%) | 0 (0.0%) |
| Information | 16 (59.3%) | 11 (40.7%) |
| Finance & Insurance | 14 (19.7%) | 57 (80.3%) |
| Real Estate, Rental & Leasing | 20 (100.0%) | 0 (0.0%) |
| Professional & Scientific | 76 (42.7%) | 102 (57.3%) |
| Enterprise Management | 0 (0.0%) | 0 (0.0%) |
| Administrative & Support | 22 (20.6%) | 85 (79.4%) |
| Educational Services | 49 (25.3%) | 145 (74.7%) |
| Health Care & Social Assistance | 58 (13.8%) | 363 (86.2%) |
| Arts, Entertainment & Recreation | 39 (30.5%) | 89 (69.5%) |
| Accommodation & Food Services | 89 (44.1%) | 113 (55.9%) |
| Public Administration | 11 (17.2%) | 53 (82.8%) |
| Total | 1,373 (50.3%) | 1,357 (49.7%) |
Education in Sellersville borough
School Enrollment in Sellersville borough
The most common levels of schooling among the 995 students in Sellersville borough are elementary school (346 | 34.8%), high school (240 | 24.1%), and middle school (153 | 15.4%).
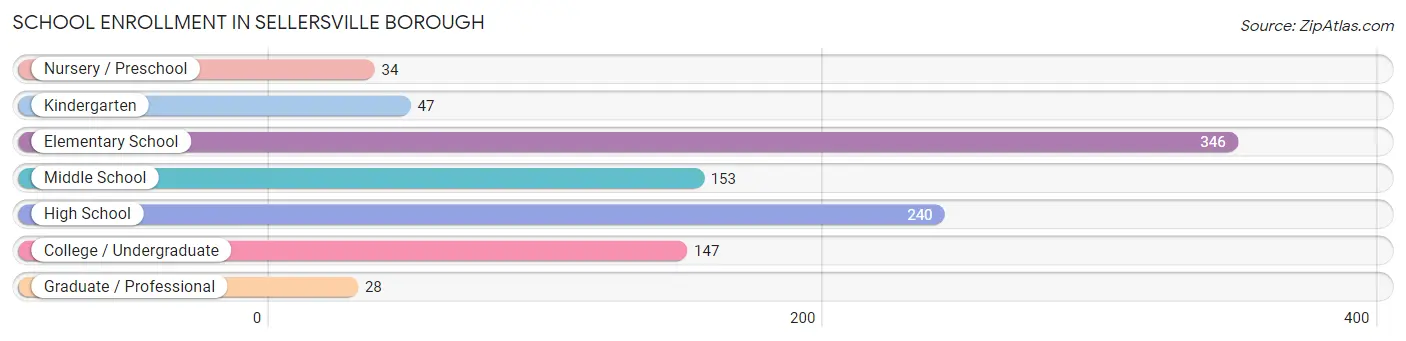
| School Level | # Students | % Students |
| Nursery / Preschool | 34 | 3.4% |
| Kindergarten | 47 | 4.7% |
| Elementary School | 346 | 34.8% |
| Middle School | 153 | 15.4% |
| High School | 240 | 24.1% |
| College / Undergraduate | 147 | 14.8% |
| Graduate / Professional | 28 | 2.8% |
| Total | 995 | 100.0% |
School Enrollment by Age by Funding Source in Sellersville borough
Out of a total of 995 students who are enrolled in schools in Sellersville borough, 146 (14.7%) attend a private institution, while the remaining 849 (85.3%) are enrolled in public schools. The age group of 3 to 4 year olds has the highest likelihood of being enrolled in private schools, with 25 (100.0% in the age bracket) enrolled. Conversely, the age group of 18 to 19 year olds has the lowest likelihood of being enrolled in a private school, with 72 (100.0% in the age bracket) attending a public institution.
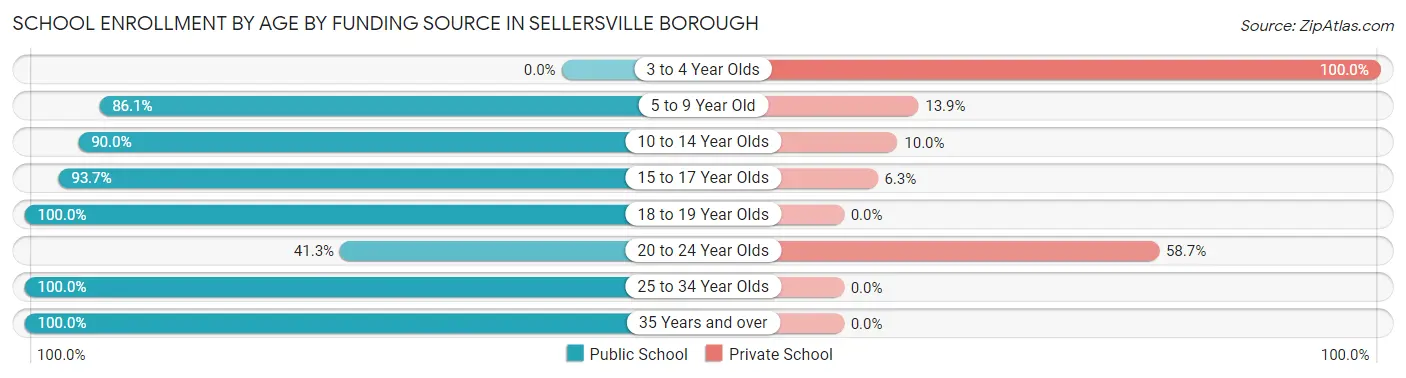
| Age Bracket | Public School | Private School |
| 3 to 4 Year Olds | 0 (0.0%) | 25 (100.0%) |
| 5 to 9 Year Old | 316 (86.1%) | 51 (13.9%) |
| 10 to 14 Year Olds | 207 (90.0%) | 23 (10.0%) |
| 15 to 17 Year Olds | 149 (93.7%) | 10 (6.3%) |
| 18 to 19 Year Olds | 72 (100.0%) | 0 (0.0%) |
| 20 to 24 Year Olds | 26 (41.3%) | 37 (58.7%) |
| 25 to 34 Year Olds | 18 (100.0%) | 0 (0.0%) |
| 35 Years and over | 61 (100.0%) | 0 (0.0%) |
| Total | 849 (85.3%) | 146 (14.7%) |
Educational Attainment by Field of Study in Sellersville borough
Business (189 | 15.8%), liberal arts & history (132 | 11.0%), education (109 | 9.1%), science & technology (98 | 8.2%), and bio, nature & agricultural (92 | 7.7%) are the most common fields of study among 1,200 individuals in Sellersville borough who have obtained a bachelor's degree or higher.
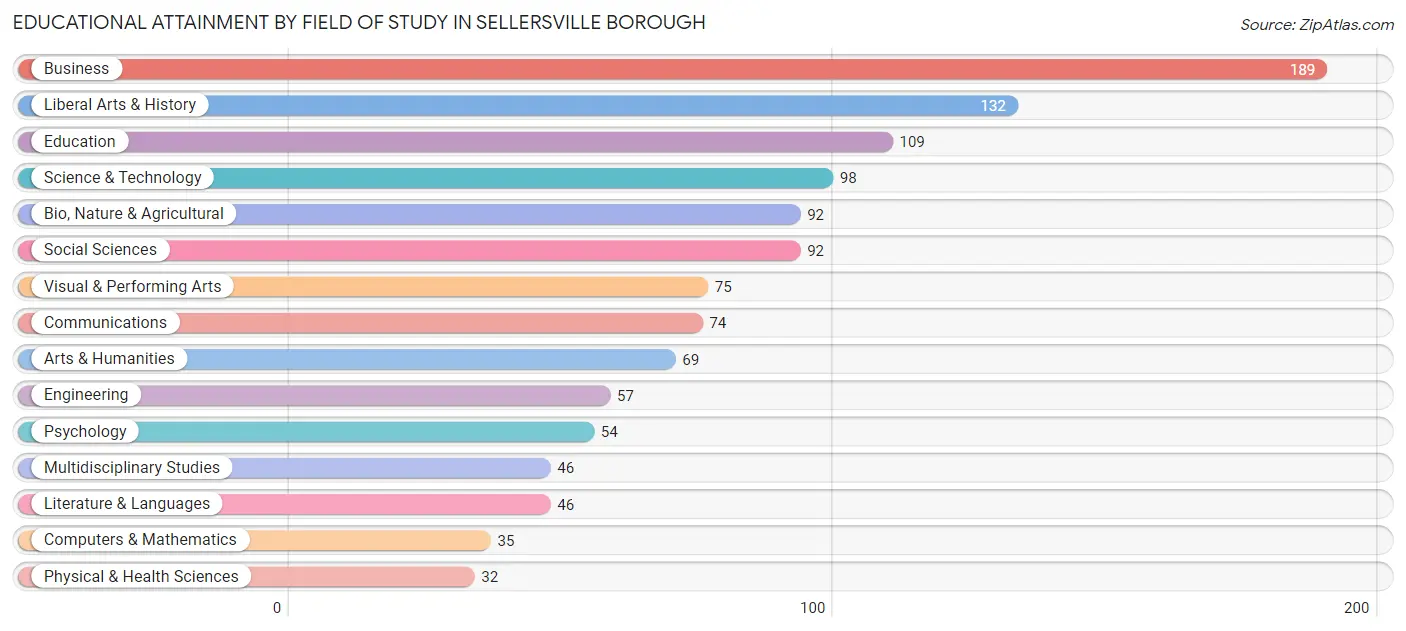
| Field of Study | # Graduates | % Graduates |
| Computers & Mathematics | 35 | 2.9% |
| Bio, Nature & Agricultural | 92 | 7.7% |
| Physical & Health Sciences | 32 | 2.7% |
| Psychology | 54 | 4.5% |
| Social Sciences | 92 | 7.7% |
| Engineering | 57 | 4.8% |
| Multidisciplinary Studies | 46 | 3.8% |
| Science & Technology | 98 | 8.2% |
| Business | 189 | 15.8% |
| Education | 109 | 9.1% |
| Literature & Languages | 46 | 3.8% |
| Liberal Arts & History | 132 | 11.0% |
| Visual & Performing Arts | 75 | 6.2% |
| Communications | 74 | 6.2% |
| Arts & Humanities | 69 | 5.8% |
| Total | 1,200 | 100.0% |
Transportation & Commute in Sellersville borough
Vehicle Availability by Sex in Sellersville borough
The most prevalent vehicle ownership categories in Sellersville borough are males with 2 vehicles (556, accounting for 41.1%) and females with 2 vehicles (523, making up 41.7%).
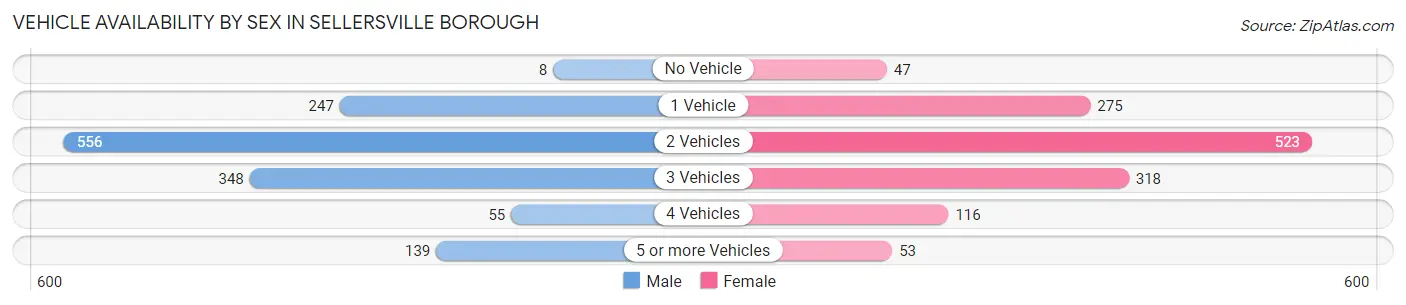
| Vehicles Available | Male | Female |
| No Vehicle | 8 (0.6%) | 47 (3.5%) |
| 1 Vehicle | 247 (18.3%) | 275 (20.6%) |
| 2 Vehicles | 556 (41.1%) | 523 (39.3%) |
| 3 Vehicles | 348 (25.7%) | 318 (23.9%) |
| 4 Vehicles | 55 (4.1%) | 116 (8.7%) |
| 5 or more Vehicles | 139 (10.3%) | 53 (4.0%) |
| Total | 1,353 (100.0%) | 1,332 (100.0%) |
Commute Time in Sellersville borough
The most frequently occuring commute durations in Sellersville borough are 30 to 34 minutes (392 commuters, 16.2%), 20 to 24 minutes (362 commuters, 15.0%), and 5 to 9 minutes (343 commuters, 14.2%).
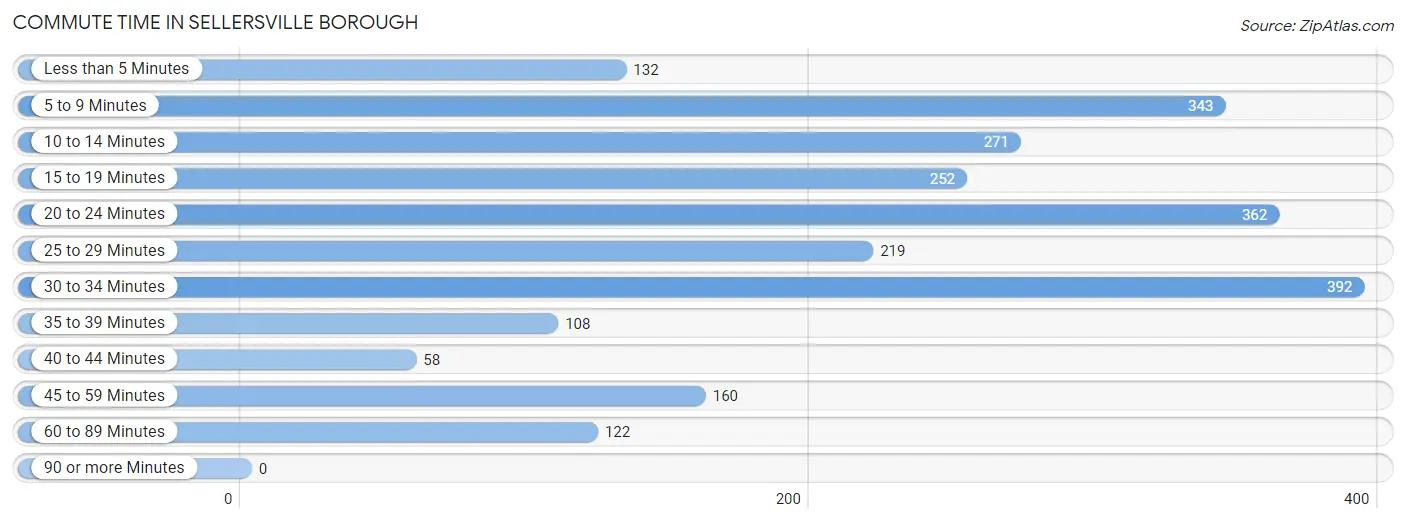
| Commute Time | # Commuters | % Commuters |
| Less than 5 Minutes | 132 | 5.5% |
| 5 to 9 Minutes | 343 | 14.2% |
| 10 to 14 Minutes | 271 | 11.2% |
| 15 to 19 Minutes | 252 | 10.4% |
| 20 to 24 Minutes | 362 | 15.0% |
| 25 to 29 Minutes | 219 | 9.0% |
| 30 to 34 Minutes | 392 | 16.2% |
| 35 to 39 Minutes | 108 | 4.5% |
| 40 to 44 Minutes | 58 | 2.4% |
| 45 to 59 Minutes | 160 | 6.6% |
| 60 to 89 Minutes | 122 | 5.0% |
| 90 or more Minutes | 0 | 0.0% |
Commute Time by Sex in Sellersville borough
The most common commute times in Sellersville borough are 20 to 24 minutes (270 commuters, 21.6%) for males and 10 to 14 minutes (184 commuters, 15.7%) for females.
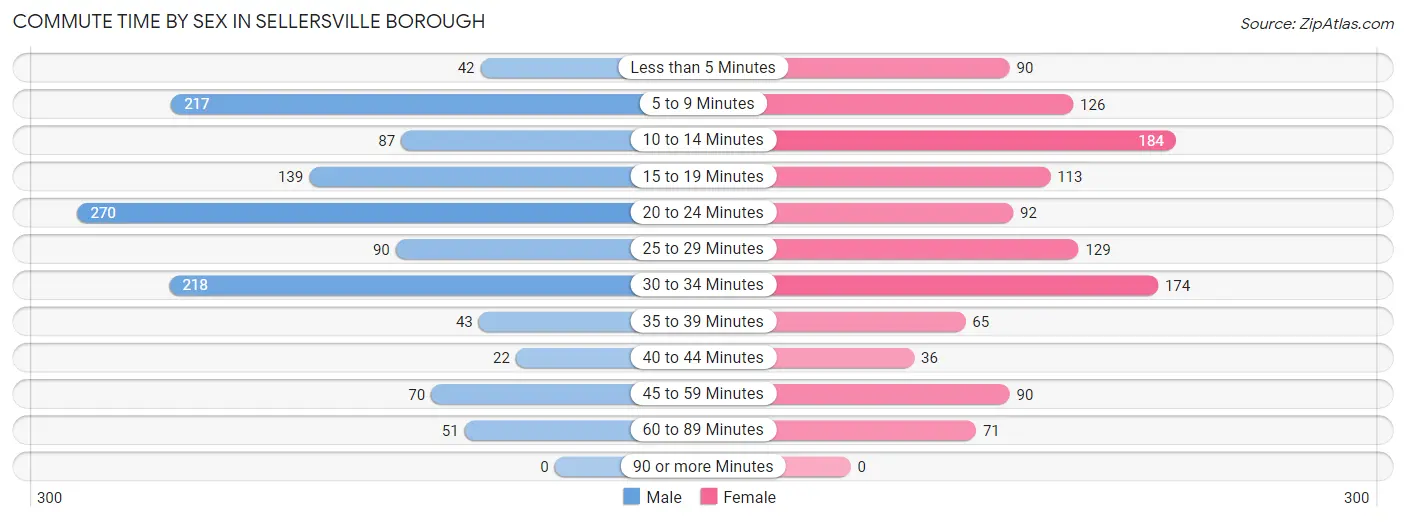
| Commute Time | Male | Female |
| Less than 5 Minutes | 42 (3.4%) | 90 (7.7%) |
| 5 to 9 Minutes | 217 (17.4%) | 126 (10.8%) |
| 10 to 14 Minutes | 87 (7.0%) | 184 (15.7%) |
| 15 to 19 Minutes | 139 (11.1%) | 113 (9.7%) |
| 20 to 24 Minutes | 270 (21.6%) | 92 (7.9%) |
| 25 to 29 Minutes | 90 (7.2%) | 129 (11.0%) |
| 30 to 34 Minutes | 218 (17.4%) | 174 (14.9%) |
| 35 to 39 Minutes | 43 (3.4%) | 65 (5.6%) |
| 40 to 44 Minutes | 22 (1.8%) | 36 (3.1%) |
| 45 to 59 Minutes | 70 (5.6%) | 90 (7.7%) |
| 60 to 89 Minutes | 51 (4.1%) | 71 (6.1%) |
| 90 or more Minutes | 0 (0.0%) | 0 (0.0%) |
Time of Departure to Work by Sex in Sellersville borough
The most frequent times of departure to work in Sellersville borough are 6:00 AM to 6:29 AM (349, 27.9%) for males and 8:00 AM to 8:29 AM (213, 18.2%) for females.
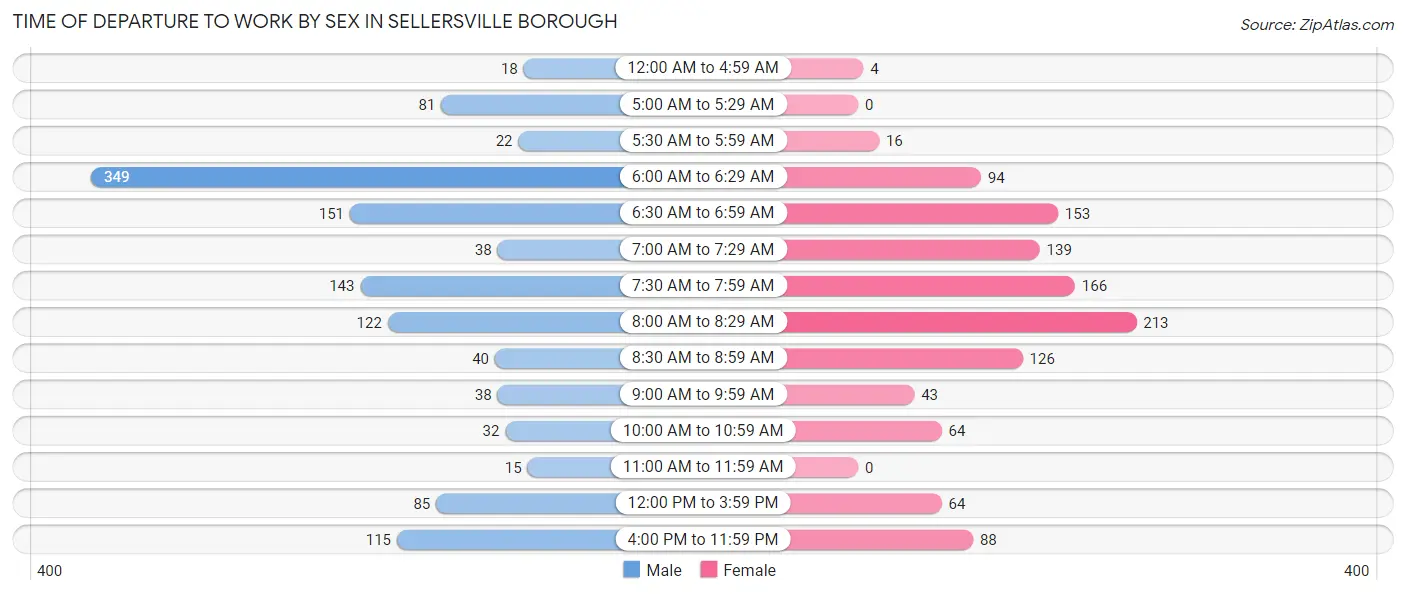
| Time of Departure | Male | Female |
| 12:00 AM to 4:59 AM | 18 (1.4%) | 4 (0.3%) |
| 5:00 AM to 5:29 AM | 81 (6.5%) | 0 (0.0%) |
| 5:30 AM to 5:59 AM | 22 (1.8%) | 16 (1.4%) |
| 6:00 AM to 6:29 AM | 349 (27.9%) | 94 (8.0%) |
| 6:30 AM to 6:59 AM | 151 (12.1%) | 153 (13.1%) |
| 7:00 AM to 7:29 AM | 38 (3.0%) | 139 (11.9%) |
| 7:30 AM to 7:59 AM | 143 (11.5%) | 166 (14.2%) |
| 8:00 AM to 8:29 AM | 122 (9.8%) | 213 (18.2%) |
| 8:30 AM to 8:59 AM | 40 (3.2%) | 126 (10.8%) |
| 9:00 AM to 9:59 AM | 38 (3.0%) | 43 (3.7%) |
| 10:00 AM to 10:59 AM | 32 (2.6%) | 64 (5.5%) |
| 11:00 AM to 11:59 AM | 15 (1.2%) | 0 (0.0%) |
| 12:00 PM to 3:59 PM | 85 (6.8%) | 64 (5.5%) |
| 4:00 PM to 11:59 PM | 115 (9.2%) | 88 (7.5%) |
| Total | 1,249 (100.0%) | 1,170 (100.0%) |
Housing Occupancy in Sellersville borough
Occupancy by Ownership in Sellersville borough
Of the total 1,810 dwellings in Sellersville borough, owner-occupied units account for 1,158 (64.0%), while renter-occupied units make up 652 (36.0%).
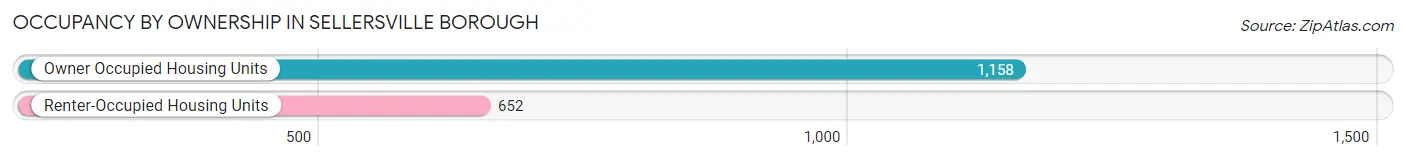
| Occupancy | # Housing Units | % Housing Units |
| Owner Occupied Housing Units | 1,158 | 64.0% |
| Renter-Occupied Housing Units | 652 | 36.0% |
| Total Occupied Housing Units | 1,810 | 100.0% |
Occupancy by Household Size in Sellersville borough
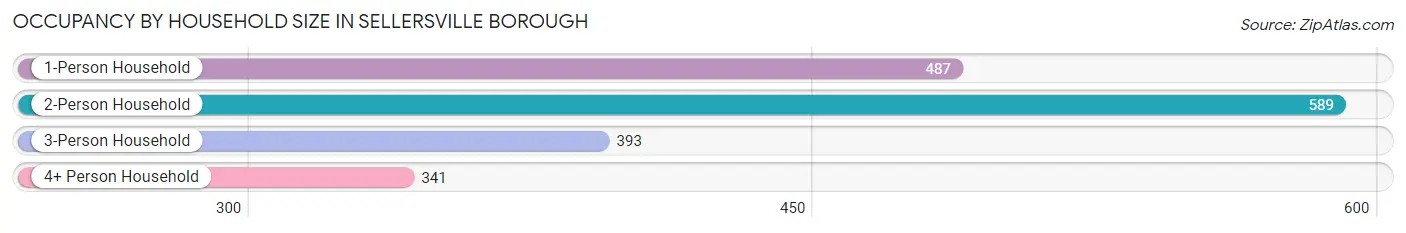
| Household Size | # Housing Units | % Housing Units |
| 1-Person Household | 487 | 26.9% |
| 2-Person Household | 589 | 32.5% |
| 3-Person Household | 393 | 21.7% |
| 4+ Person Household | 341 | 18.8% |
| Total Housing Units | 1,810 | 100.0% |
Occupancy by Ownership by Household Size in Sellersville borough
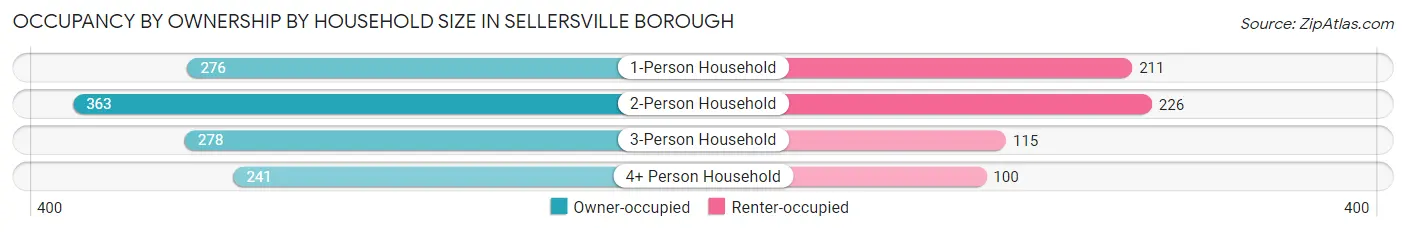
| Household Size | Owner-occupied | Renter-occupied |
| 1-Person Household | 276 (56.7%) | 211 (43.3%) |
| 2-Person Household | 363 (61.6%) | 226 (38.4%) |
| 3-Person Household | 278 (70.7%) | 115 (29.3%) |
| 4+ Person Household | 241 (70.7%) | 100 (29.3%) |
| Total Housing Units | 1,158 (64.0%) | 652 (36.0%) |
Occupancy by Educational Attainment in Sellersville borough
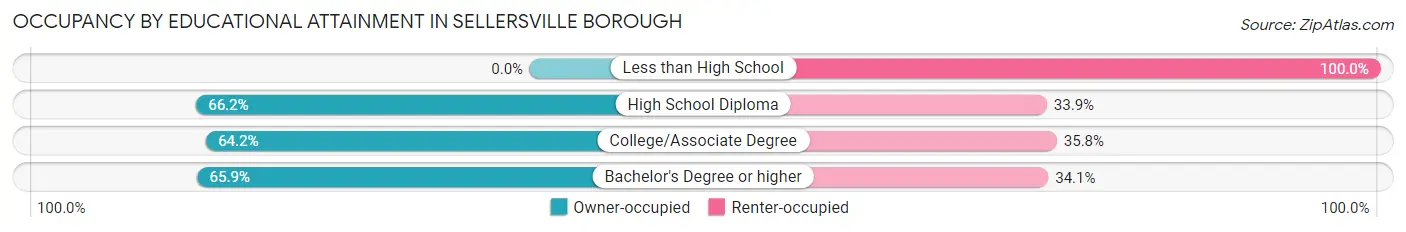
| Household Size | Owner-occupied | Renter-occupied |
| Less than High School | 0 (0.0%) | 42 (100.0%) |
| High School Diploma | 344 (66.1%) | 176 (33.9%) |
| College/Associate Degree | 310 (64.2%) | 173 (35.8%) |
| Bachelor's Degree or higher | 504 (65.9%) | 261 (34.1%) |
Occupancy by Age of Householder in Sellersville borough
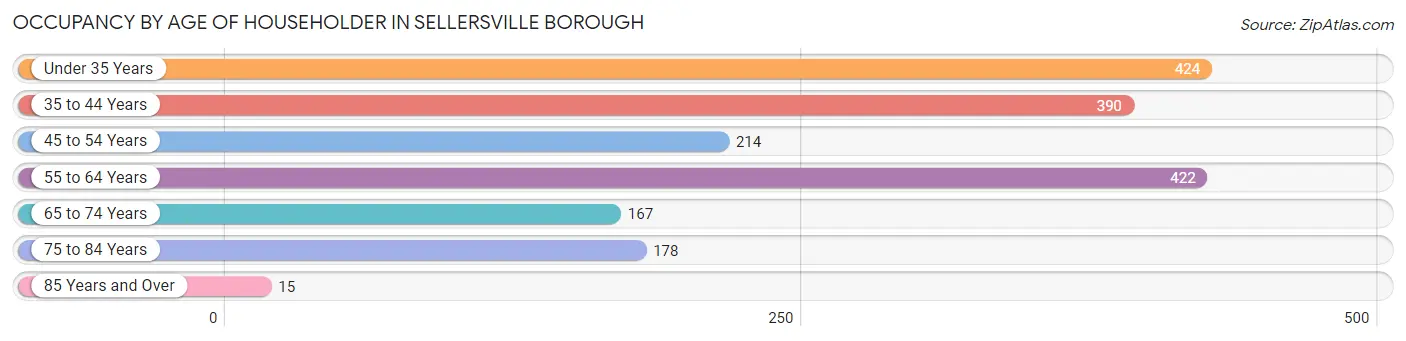
| Age Bracket | # Households | % Households |
| Under 35 Years | 424 | 23.4% |
| 35 to 44 Years | 390 | 21.5% |
| 45 to 54 Years | 214 | 11.8% |
| 55 to 64 Years | 422 | 23.3% |
| 65 to 74 Years | 167 | 9.2% |
| 75 to 84 Years | 178 | 9.8% |
| 85 Years and Over | 15 | 0.8% |
| Total | 1,810 | 100.0% |
Housing Finances in Sellersville borough
Median Income by Occupancy in Sellersville borough
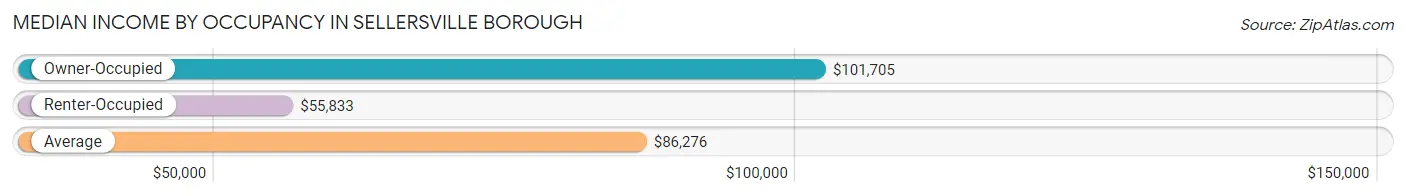
| Occupancy Type | # Households | Median Income |
| Owner-Occupied | 1,158 (64.0%) | $101,705 |
| Renter-Occupied | 652 (36.0%) | $55,833 |
| Average | 1,810 (100.0%) | $86,276 |
Occupancy by Householder Income Bracket in Sellersville borough
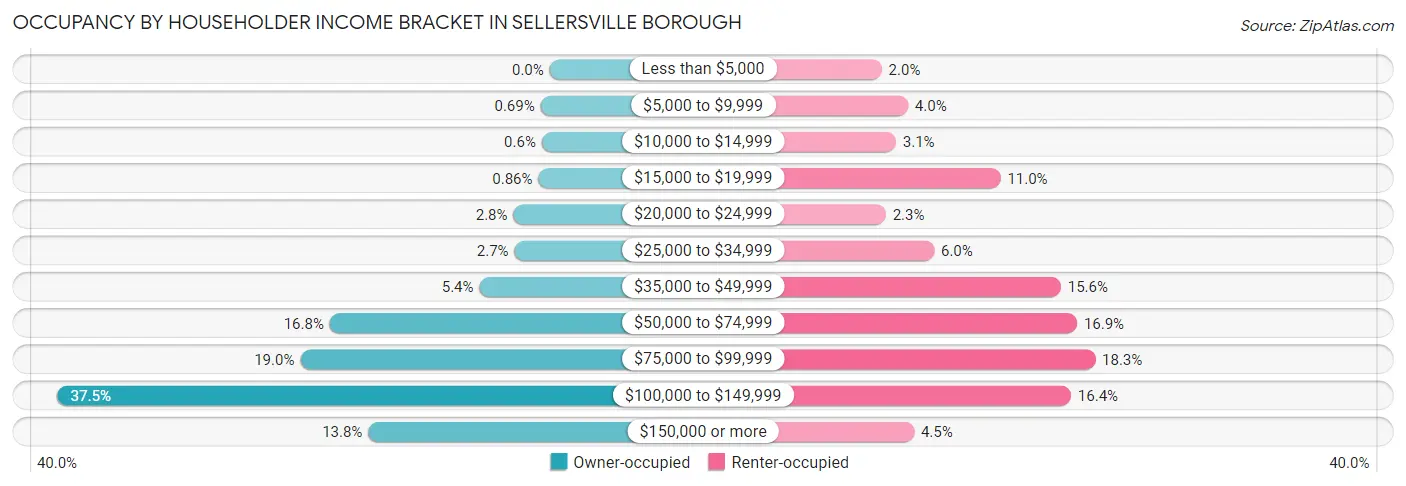
| Income Bracket | Owner-occupied | Renter-occupied |
| Less than $5,000 | 0 (0.0%) | 13 (2.0%) |
| $5,000 to $9,999 | 8 (0.7%) | 26 (4.0%) |
| $10,000 to $14,999 | 7 (0.6%) | 20 (3.1%) |
| $15,000 to $19,999 | 10 (0.9%) | 72 (11.0%) |
| $20,000 to $24,999 | 32 (2.8%) | 15 (2.3%) |
| $25,000 to $34,999 | 31 (2.7%) | 39 (6.0%) |
| $35,000 to $49,999 | 62 (5.3%) | 102 (15.6%) |
| $50,000 to $74,999 | 194 (16.8%) | 110 (16.9%) |
| $75,000 to $99,999 | 220 (19.0%) | 119 (18.2%) |
| $100,000 to $149,999 | 434 (37.5%) | 107 (16.4%) |
| $150,000 or more | 160 (13.8%) | 29 (4.4%) |
| Total | 1,158 (100.0%) | 652 (100.0%) |
Monthly Housing Cost Tiers in Sellersville borough
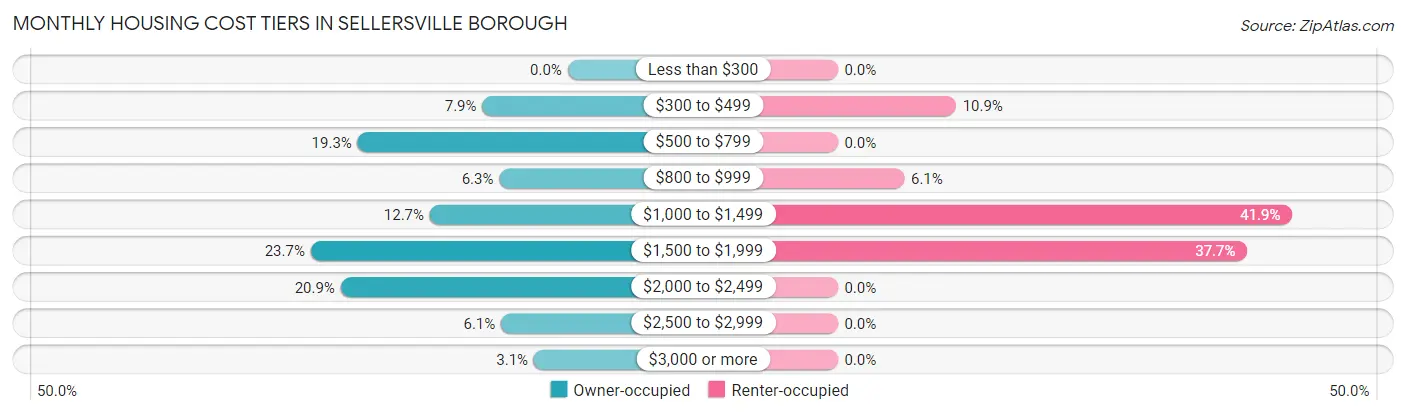
| Monthly Cost | Owner-occupied | Renter-occupied |
| Less than $300 | 0 (0.0%) | 0 (0.0%) |
| $300 to $499 | 91 (7.9%) | 71 (10.9%) |
| $500 to $799 | 224 (19.3%) | 0 (0.0%) |
| $800 to $999 | 73 (6.3%) | 40 (6.1%) |
| $1,000 to $1,499 | 147 (12.7%) | 273 (41.9%) |
| $1,500 to $1,999 | 274 (23.7%) | 246 (37.7%) |
| $2,000 to $2,499 | 242 (20.9%) | 0 (0.0%) |
| $2,500 to $2,999 | 71 (6.1%) | 0 (0.0%) |
| $3,000 or more | 36 (3.1%) | 0 (0.0%) |
| Total | 1,158 (100.0%) | 652 (100.0%) |
Physical Housing Characteristics in Sellersville borough
Housing Structures in Sellersville borough
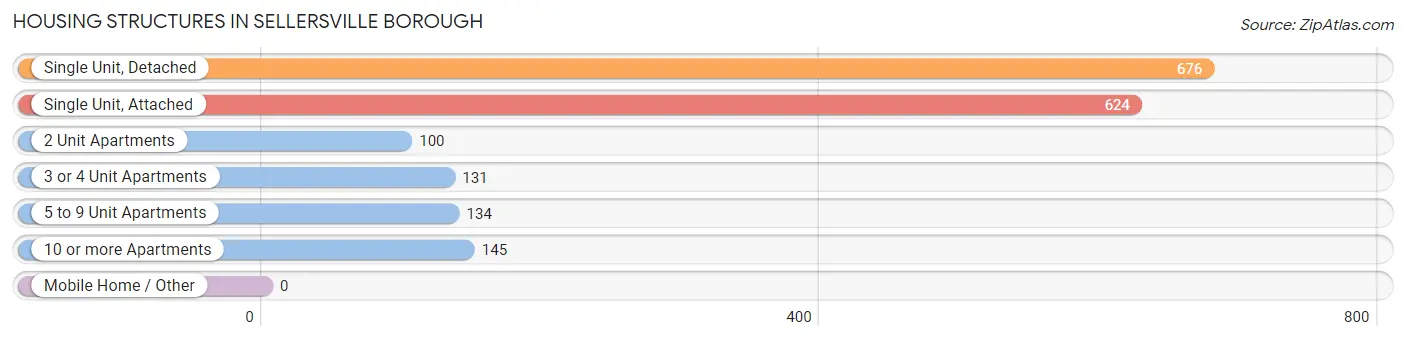
| Structure Type | # Housing Units | % Housing Units |
| Single Unit, Detached | 676 | 37.3% |
| Single Unit, Attached | 624 | 34.5% |
| 2 Unit Apartments | 100 | 5.5% |
| 3 or 4 Unit Apartments | 131 | 7.2% |
| 5 to 9 Unit Apartments | 134 | 7.4% |
| 10 or more Apartments | 145 | 8.0% |
| Mobile Home / Other | 0 | 0.0% |
| Total | 1,810 | 100.0% |
Housing Structures by Occupancy in Sellersville borough
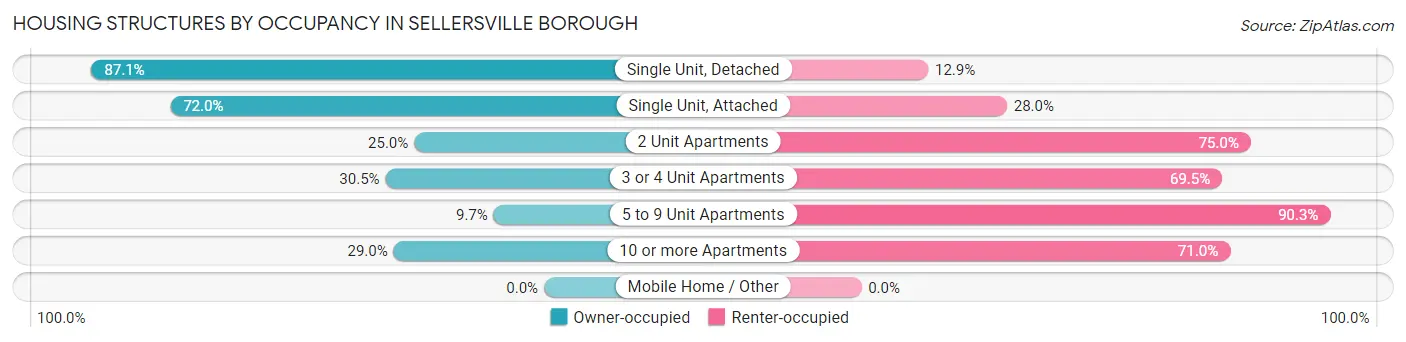
| Structure Type | Owner-occupied | Renter-occupied |
| Single Unit, Detached | 589 (87.1%) | 87 (12.9%) |
| Single Unit, Attached | 449 (72.0%) | 175 (28.0%) |
| 2 Unit Apartments | 25 (25.0%) | 75 (75.0%) |
| 3 or 4 Unit Apartments | 40 (30.5%) | 91 (69.5%) |
| 5 to 9 Unit Apartments | 13 (9.7%) | 121 (90.3%) |
| 10 or more Apartments | 42 (29.0%) | 103 (71.0%) |
| Mobile Home / Other | 0 (0.0%) | 0 (0.0%) |
| Total | 1,158 (64.0%) | 652 (36.0%) |
Housing Structures by Number of Rooms in Sellersville borough
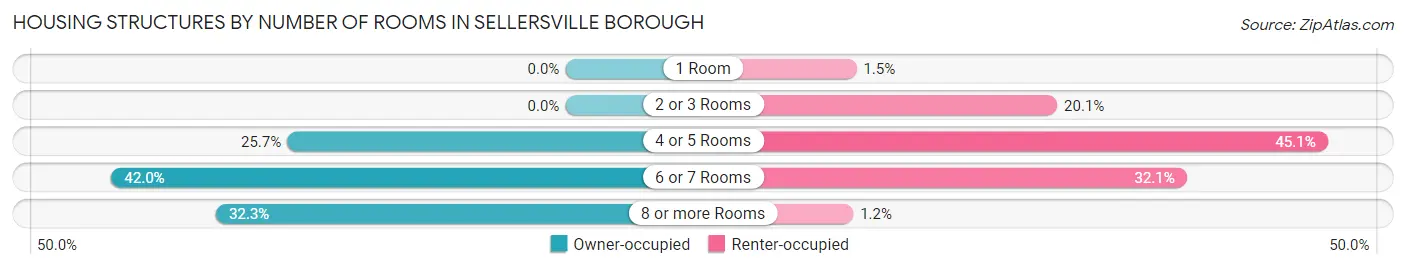
| Number of Rooms | Owner-occupied | Renter-occupied |
| 1 Room | 0 (0.0%) | 10 (1.5%) |
| 2 or 3 Rooms | 0 (0.0%) | 131 (20.1%) |
| 4 or 5 Rooms | 298 (25.7%) | 294 (45.1%) |
| 6 or 7 Rooms | 486 (42.0%) | 209 (32.1%) |
| 8 or more Rooms | 374 (32.3%) | 8 (1.2%) |
| Total | 1,158 (100.0%) | 652 (100.0%) |
Housing Structure by Heating Type in Sellersville borough
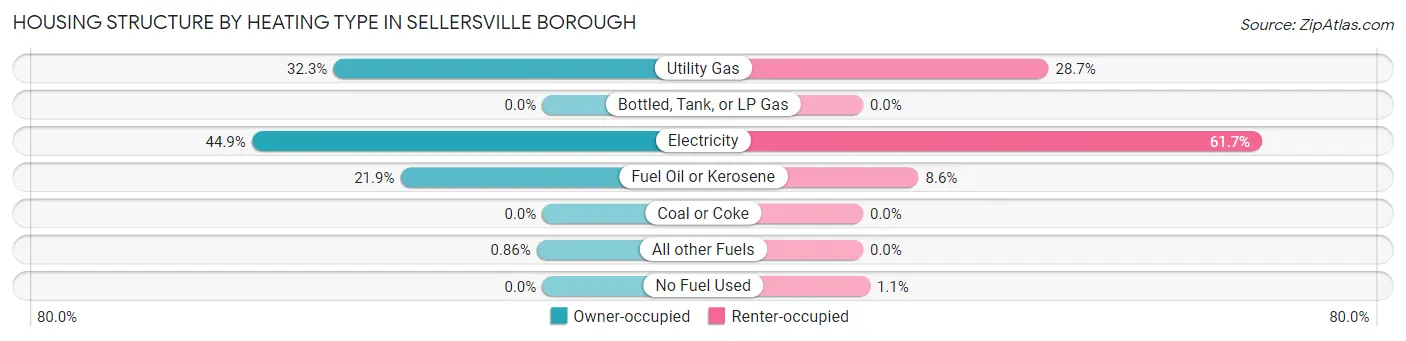
| Heating Type | Owner-occupied | Renter-occupied |
| Utility Gas | 374 (32.3%) | 187 (28.7%) |
| Bottled, Tank, or LP Gas | 0 (0.0%) | 0 (0.0%) |
| Electricity | 520 (44.9%) | 402 (61.7%) |
| Fuel Oil or Kerosene | 254 (21.9%) | 56 (8.6%) |
| Coal or Coke | 0 (0.0%) | 0 (0.0%) |
| All other Fuels | 10 (0.9%) | 0 (0.0%) |
| No Fuel Used | 0 (0.0%) | 7 (1.1%) |
| Total | 1,158 (100.0%) | 652 (100.0%) |
Household Vehicle Usage in Sellersville borough
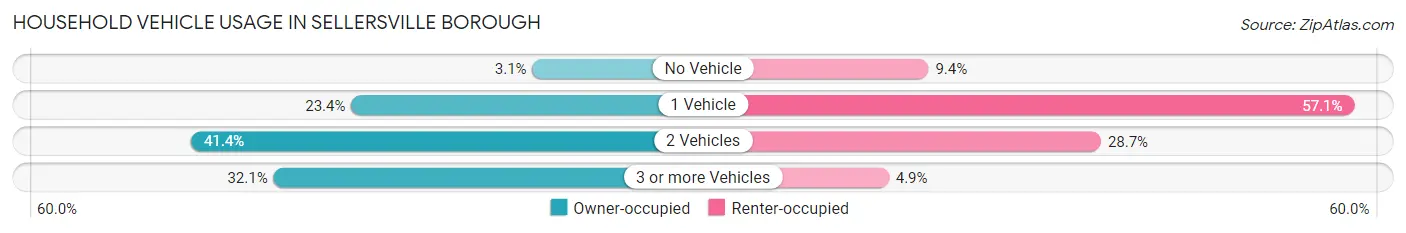
| Vehicles per Household | Owner-occupied | Renter-occupied |
| No Vehicle | 36 (3.1%) | 61 (9.4%) |
| 1 Vehicle | 271 (23.4%) | 372 (57.1%) |
| 2 Vehicles | 479 (41.4%) | 187 (28.7%) |
| 3 or more Vehicles | 372 (32.1%) | 32 (4.9%) |
| Total | 1,158 (100.0%) | 652 (100.0%) |
Real Estate & Mortgages in Sellersville borough
Real Estate and Mortgage Overview in Sellersville borough
| Characteristic | Without Mortgage | With Mortgage |
| Housing Units | 323 | 835 |
| Median Property Value | $272,700 | $277,900 |
| Median Household Income | $73,490 | $140 |
| Monthly Housing Costs | $643 | $36 |
| Real Estate Taxes | $3,540 | $0 |
Property Value by Mortgage Status in Sellersville borough
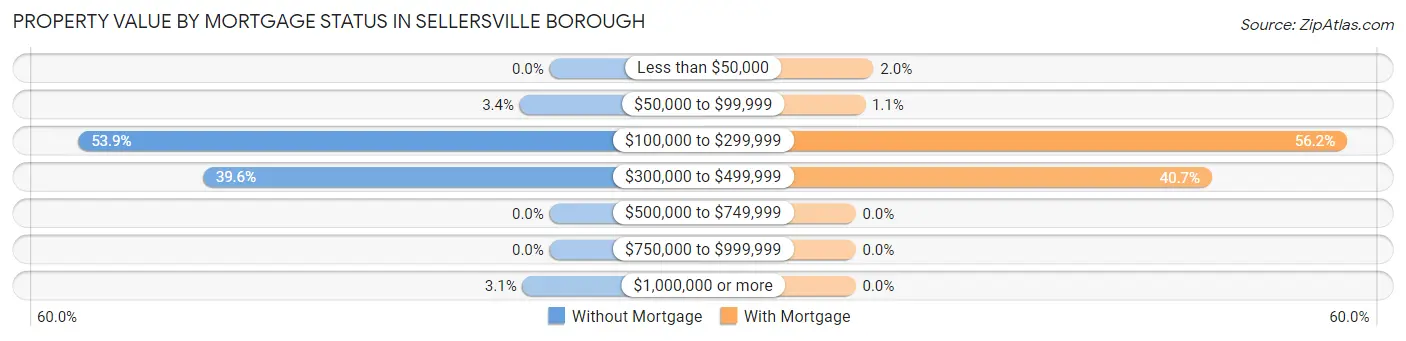
| Property Value | Without Mortgage | With Mortgage |
| Less than $50,000 | 0 (0.0%) | 17 (2.0%) |
| $50,000 to $99,999 | 11 (3.4%) | 9 (1.1%) |
| $100,000 to $299,999 | 174 (53.9%) | 469 (56.2%) |
| $300,000 to $499,999 | 128 (39.6%) | 340 (40.7%) |
| $500,000 to $749,999 | 0 (0.0%) | 0 (0.0%) |
| $750,000 to $999,999 | 0 (0.0%) | 0 (0.0%) |
| $1,000,000 or more | 10 (3.1%) | 0 (0.0%) |
| Total | 323 (100.0%) | 835 (100.0%) |
Household Income by Mortgage Status in Sellersville borough
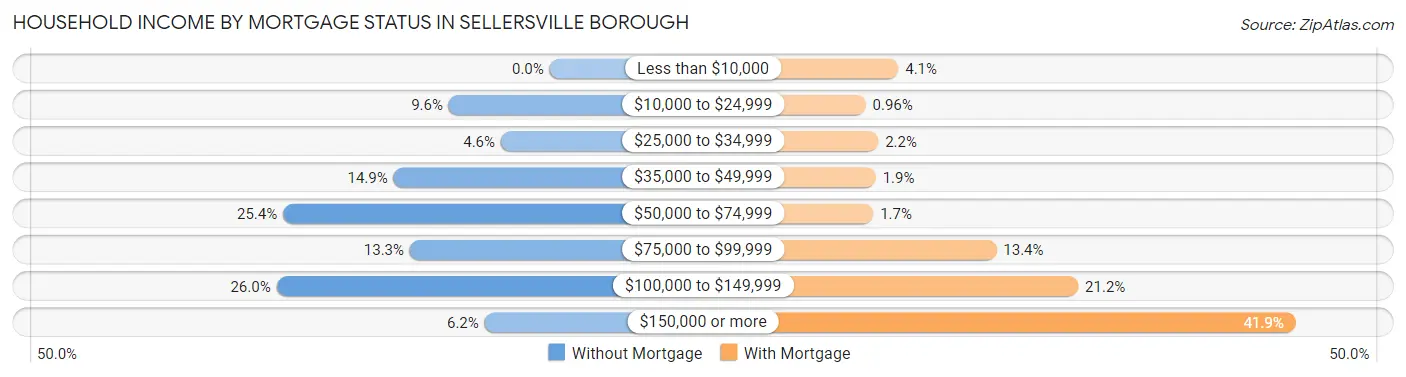
| Household Income | Without Mortgage | With Mortgage |
| Less than $10,000 | 0 (0.0%) | 34 (4.1%) |
| $10,000 to $24,999 | 31 (9.6%) | 8 (1.0%) |
| $25,000 to $34,999 | 15 (4.6%) | 18 (2.2%) |
| $35,000 to $49,999 | 48 (14.9%) | 16 (1.9%) |
| $50,000 to $74,999 | 82 (25.4%) | 14 (1.7%) |
| $75,000 to $99,999 | 43 (13.3%) | 112 (13.4%) |
| $100,000 to $149,999 | 84 (26.0%) | 177 (21.2%) |
| $150,000 or more | 20 (6.2%) | 350 (41.9%) |
| Total | 323 (100.0%) | 835 (100.0%) |
Property Value to Household Income Ratio in Sellersville borough
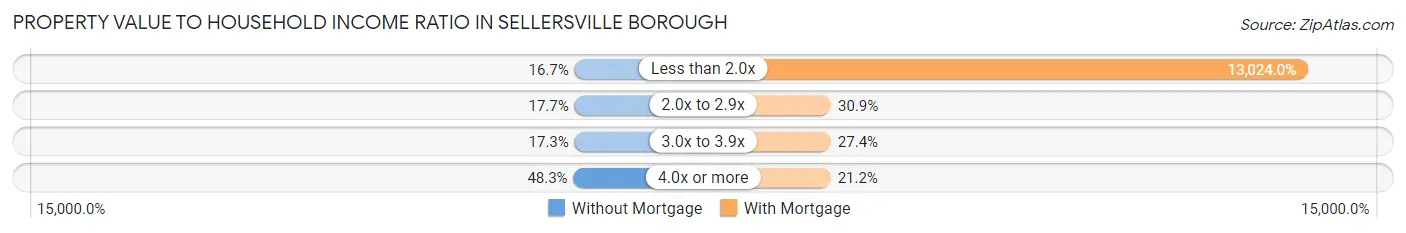
| Value-to-Income Ratio | Without Mortgage | With Mortgage |
| Less than 2.0x | 54 (16.7%) | 108,750 (13,023.9%) |
| 2.0x to 2.9x | 57 (17.6%) | 258 (30.9%) |
| 3.0x to 3.9x | 56 (17.3%) | 229 (27.4%) |
| 4.0x or more | 156 (48.3%) | 177 (21.2%) |
| Total | 323 (100.0%) | 835 (100.0%) |
Real Estate Taxes by Mortgage Status in Sellersville borough
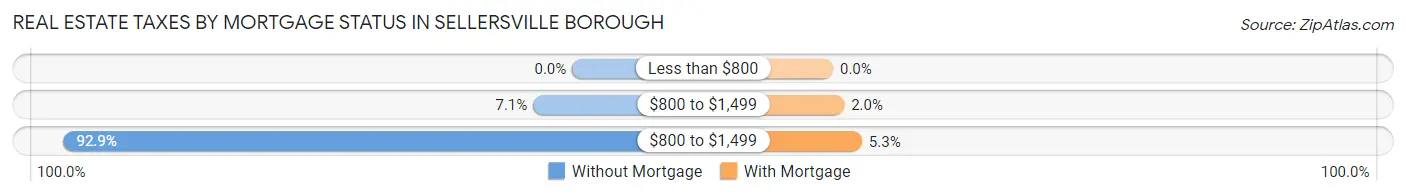
| Property Taxes | Without Mortgage | With Mortgage |
| Less than $800 | 0 (0.0%) | 0 (0.0%) |
| $800 to $1,499 | 23 (7.1%) | 17 (2.0%) |
| $800 to $1,499 | 300 (92.9%) | 44 (5.3%) |
| Total | 323 (100.0%) | 835 (100.0%) |
Health & Disability in Sellersville borough
Health Insurance Coverage by Age in Sellersville borough
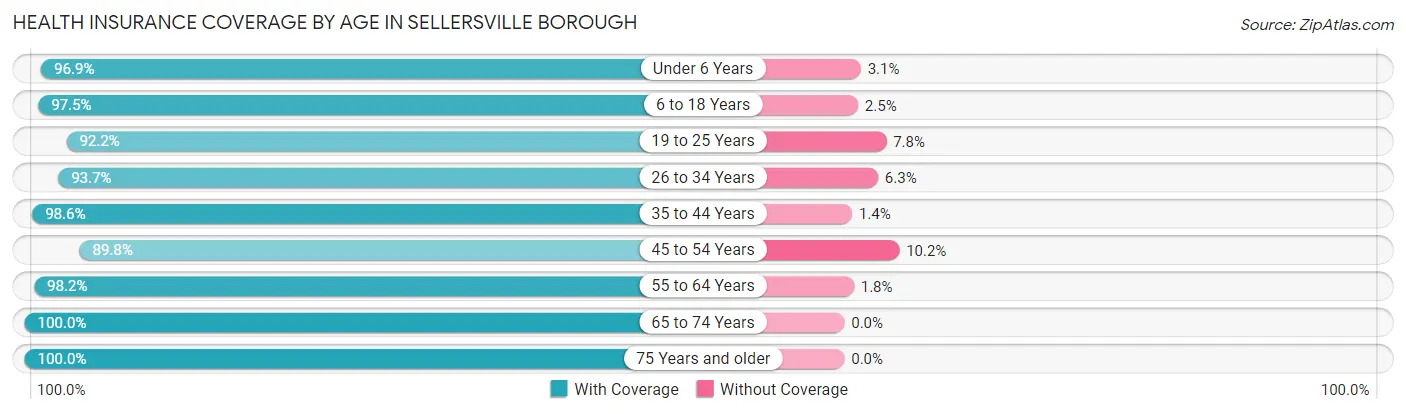
| Age Bracket | With Coverage | Without Coverage |
| Under 6 Years | 253 (96.9%) | 8 (3.1%) |
| 6 to 18 Years | 728 (97.5%) | 19 (2.5%) |
| 19 to 25 Years | 425 (92.2%) | 36 (7.8%) |
| 26 to 34 Years | 583 (93.7%) | 39 (6.3%) |
| 35 to 44 Years | 757 (98.6%) | 11 (1.4%) |
| 45 to 54 Years | 368 (89.8%) | 42 (10.2%) |
| 55 to 64 Years | 721 (98.2%) | 13 (1.8%) |
| 65 to 74 Years | 322 (100.0%) | 0 (0.0%) |
| 75 Years and older | 212 (100.0%) | 0 (0.0%) |
| Total | 4,369 (96.3%) | 168 (3.7%) |
Health Insurance Coverage by Citizenship Status in Sellersville borough
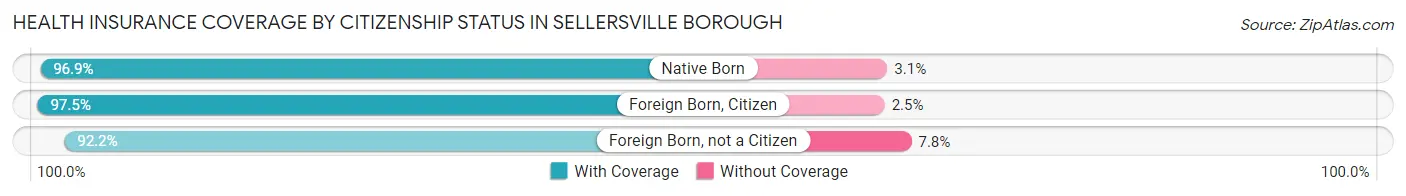
| Citizenship Status | With Coverage | Without Coverage |
| Native Born | 253 (96.9%) | 8 (3.1%) |
| Foreign Born, Citizen | 728 (97.5%) | 19 (2.5%) |
| Foreign Born, not a Citizen | 425 (92.2%) | 36 (7.8%) |
Health Insurance Coverage by Household Income in Sellersville borough
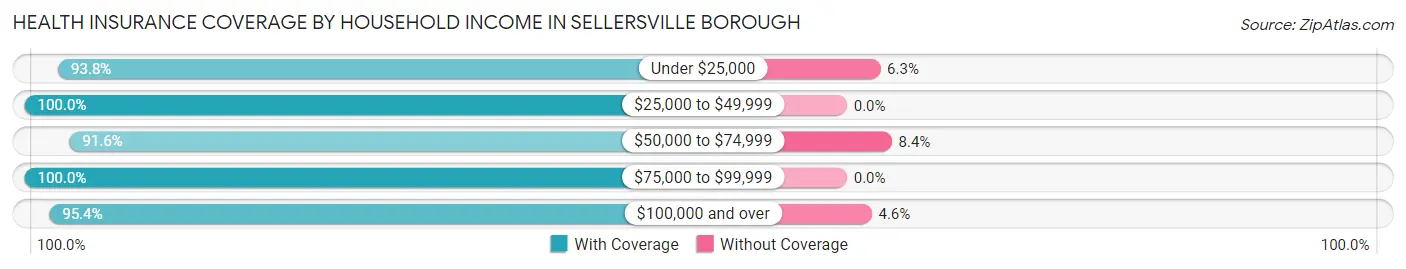
| Household Income | With Coverage | Without Coverage |
| Under $25,000 | 315 (93.8%) | 21 (6.2%) |
| $25,000 to $49,999 | 405 (100.0%) | 0 (0.0%) |
| $50,000 to $74,999 | 480 (91.6%) | 44 (8.4%) |
| $75,000 to $99,999 | 1,047 (100.0%) | 0 (0.0%) |
| $100,000 and over | 2,059 (95.4%) | 100 (4.6%) |
Public vs Private Health Insurance Coverage by Age in Sellersville borough
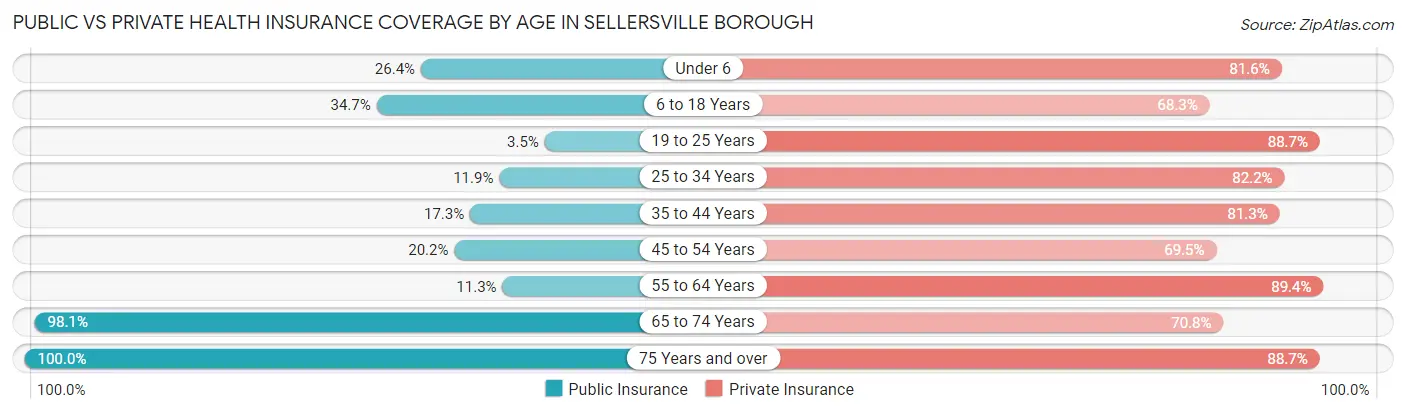
| Age Bracket | Public Insurance | Private Insurance |
| Under 6 | 69 (26.4%) | 213 (81.6%) |
| 6 to 18 Years | 259 (34.7%) | 510 (68.3%) |
| 19 to 25 Years | 16 (3.5%) | 409 (88.7%) |
| 25 to 34 Years | 74 (11.9%) | 511 (82.2%) |
| 35 to 44 Years | 133 (17.3%) | 624 (81.2%) |
| 45 to 54 Years | 83 (20.2%) | 285 (69.5%) |
| 55 to 64 Years | 83 (11.3%) | 656 (89.4%) |
| 65 to 74 Years | 316 (98.1%) | 228 (70.8%) |
| 75 Years and over | 212 (100.0%) | 188 (88.7%) |
| Total | 1,245 (27.4%) | 3,624 (79.9%) |
Disability Status by Sex by Age in Sellersville borough
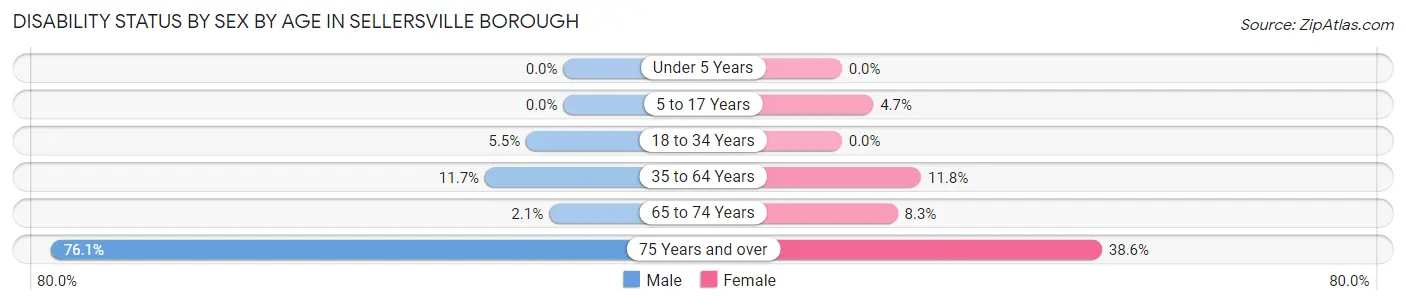
| Age Bracket | Male | Female |
| Under 5 Years | 0 (0.0%) | 0 (0.0%) |
| 5 to 17 Years | 0 (0.0%) | 17 (4.7%) |
| 18 to 34 Years | 33 (5.5%) | 0 (0.0%) |
| 35 to 64 Years | 103 (11.7%) | 121 (11.8%) |
| 65 to 74 Years | 3 (2.1%) | 15 (8.3%) |
| 75 Years and over | 51 (76.1%) | 56 (38.6%) |
Disability Class by Sex by Age in Sellersville borough
Disability Class: Hearing Difficulty
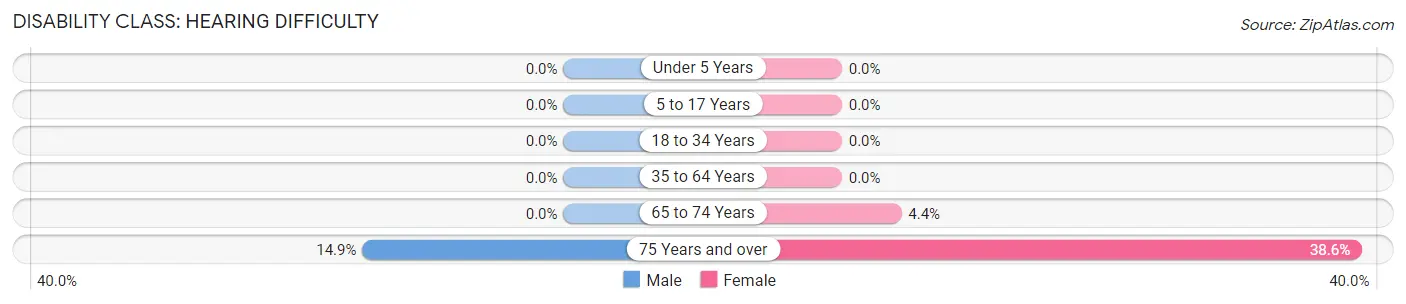
| Age Bracket | Male | Female |
| Under 5 Years | 0 (0.0%) | 0 (0.0%) |
| 5 to 17 Years | 0 (0.0%) | 0 (0.0%) |
| 18 to 34 Years | 0 (0.0%) | 0 (0.0%) |
| 35 to 64 Years | 0 (0.0%) | 0 (0.0%) |
| 65 to 74 Years | 0 (0.0%) | 8 (4.4%) |
| 75 Years and over | 10 (14.9%) | 56 (38.6%) |
Disability Class: Vision Difficulty
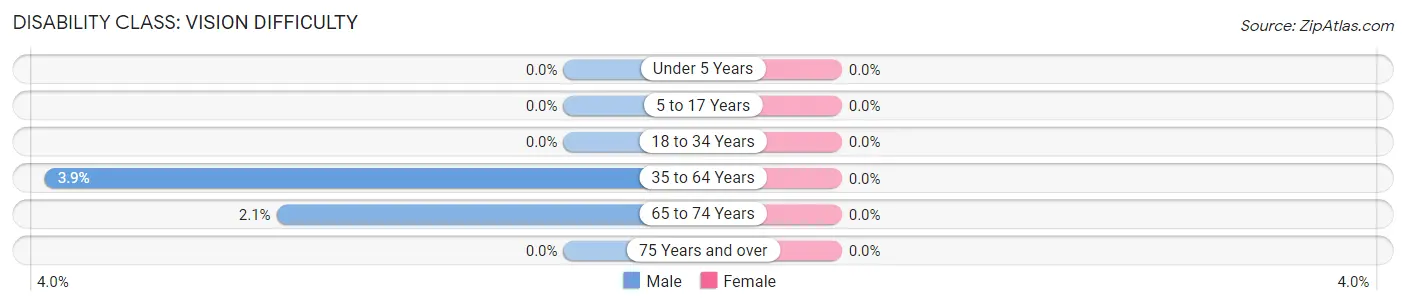
| Age Bracket | Male | Female |
| Under 5 Years | 0 (0.0%) | 0 (0.0%) |
| 5 to 17 Years | 0 (0.0%) | 0 (0.0%) |
| 18 to 34 Years | 0 (0.0%) | 0 (0.0%) |
| 35 to 64 Years | 34 (3.8%) | 0 (0.0%) |
| 65 to 74 Years | 3 (2.1%) | 0 (0.0%) |
| 75 Years and over | 0 (0.0%) | 0 (0.0%) |
Disability Class: Cognitive Difficulty
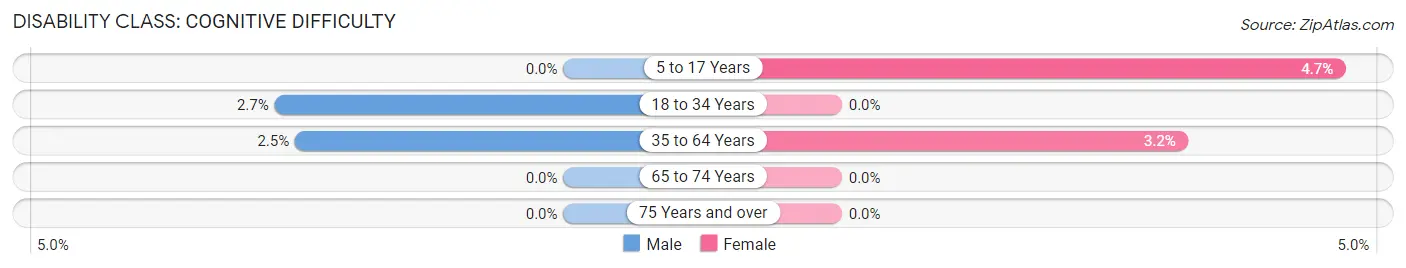
| Age Bracket | Male | Female |
| 5 to 17 Years | 0 (0.0%) | 17 (4.7%) |
| 18 to 34 Years | 16 (2.7%) | 0 (0.0%) |
| 35 to 64 Years | 22 (2.5%) | 33 (3.2%) |
| 65 to 74 Years | 0 (0.0%) | 0 (0.0%) |
| 75 Years and over | 0 (0.0%) | 0 (0.0%) |
Disability Class: Ambulatory Difficulty
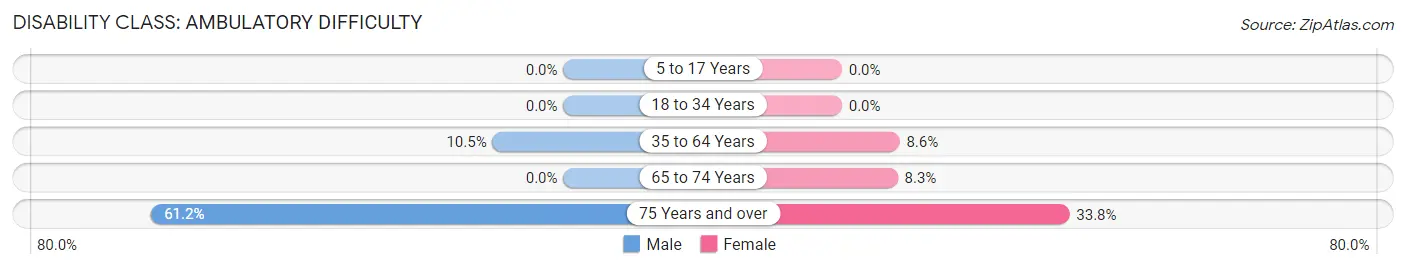
| Age Bracket | Male | Female |
| 5 to 17 Years | 0 (0.0%) | 0 (0.0%) |
| 18 to 34 Years | 0 (0.0%) | 0 (0.0%) |
| 35 to 64 Years | 93 (10.5%) | 88 (8.6%) |
| 65 to 74 Years | 0 (0.0%) | 15 (8.3%) |
| 75 Years and over | 41 (61.2%) | 49 (33.8%) |
Disability Class: Self-Care Difficulty
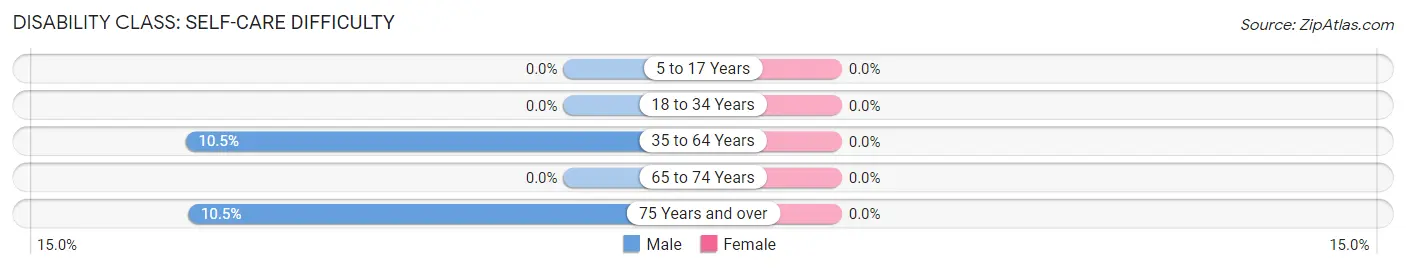
| Age Bracket | Male | Female |
| 5 to 17 Years | 0 (0.0%) | 0 (0.0%) |
| 18 to 34 Years | 0 (0.0%) | 0 (0.0%) |
| 35 to 64 Years | 93 (10.5%) | 0 (0.0%) |
| 65 to 74 Years | 0 (0.0%) | 0 (0.0%) |
| 75 Years and over | 7 (10.4%) | 0 (0.0%) |
Technology Access in Sellersville borough
Computing Device Access in Sellersville borough
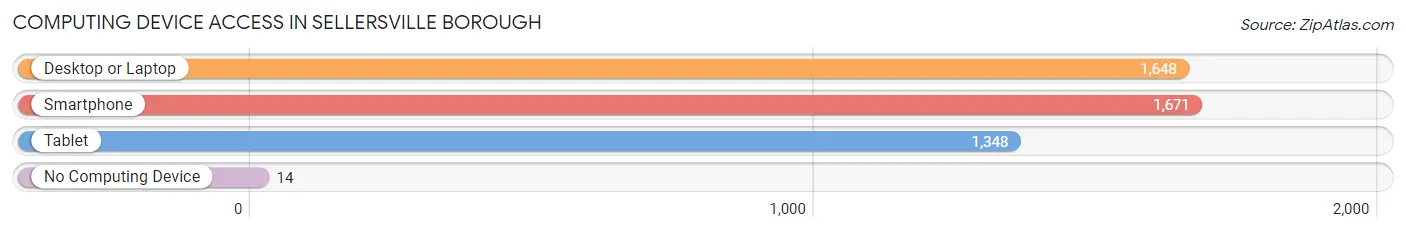
| Device Type | # Households | % Households |
| Desktop or Laptop | 1,648 | 91.0% |
| Smartphone | 1,671 | 92.3% |
| Tablet | 1,348 | 74.5% |
| No Computing Device | 14 | 0.8% |
| Total | 1,810 | 100.0% |
Internet Access in Sellersville borough
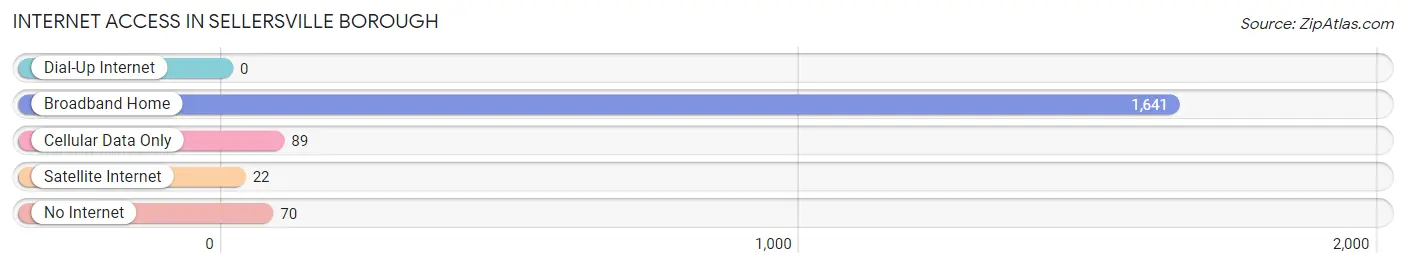
| Internet Type | # Households | % Households |
| Dial-Up Internet | 0 | 0.0% |
| Broadband Home | 1,641 | 90.7% |
| Cellular Data Only | 89 | 4.9% |
| Satellite Internet | 22 | 1.2% |
| No Internet | 70 | 3.9% |
| Total | 1,810 | 100.0% |
Sellersville borough Summary
Sellersville Borough is a small borough located in Bucks County, Pennsylvania. It is situated in the southeastern corner of the county, approximately 25 miles north of Philadelphia. The borough is bordered by West Rockhill Township to the north, East Rockhill Township to the east, Perkasie Borough to the south, and Hilltown Township to the west. As of the 2010 census, the population of Sellersville was 4,249.
History
Sellersville was founded in 1874 by William Sellers, a prominent Philadelphia industrialist. The borough was incorporated in 1876 and was named after Sellers. The town was originally a small farming community, but it soon developed into a thriving industrial center. The Sellersville Foundry and Machine Company, established in 1876, was the first major industry in the borough. The company manufactured a variety of products, including agricultural implements, tools, and machinery.
In the late 19th century, Sellersville was a popular destination for summer vacationers. The town was home to several resorts, including the Sellersville Hotel, which was built in 1891. The hotel was a popular destination for wealthy Philadelphians, who would come to the town to escape the summer heat.
Geography
Sellersville is located at 40°20'N 75°17'W (40.33, -75.28). According to the United States Census Bureau, the borough has a total area of 1.2 square miles, all of which is land.
The borough is located in the Delaware Valley, a region of rolling hills and valleys. The borough is situated in the southeastern corner of Bucks County, approximately 25 miles north of Philadelphia. The borough is bordered by West Rockhill Township to the north, East Rockhill Township to the east, Perkasie Borough to the south, and Hilltown Township to the west.
Economy
Sellersville is a small, rural community with a diverse economy. The borough is home to several small businesses, including restaurants, retail stores, and professional services. The borough is also home to several industrial and manufacturing companies, including the Sellersville Foundry and Machine Company, which was established in 1876.
The borough is also home to several large employers, including Grand View Hospital, which is located in the borough. The hospital is the largest employer in the borough, with over 1,000 employees.
Demographics
As of the 2010 census, there were 4,249 people, 1,717 households, and 1,093 families residing in the borough. The population density was 3,541.2 people per square mile. The racial makeup of the borough was 94.2% White, 1.3% African American, 0.2% Native American, 1.3% Asian, 0.1% Pacific Islander, 1.3% from other races, and 1.6% from two or more races. Hispanic or Latino of any race were 3.7% of the population.
The median age in the borough was 41.2 years. 22.2% of residents were under the age of 18; 6.7% were between the ages of 18 and 24; 25.2% were from 25 to 44; 28.3% were from 45 to 64; and 17.6% were 65 years of age or older. The gender makeup of the borough was 48.2% male and 51.8% female.
The median income for a household in the borough was $60,938, and the median income for a family was $71,944. Males had a median income of $50,000 versus $37,500 for females. The per capita income for the borough was $27,945. About 4.2% of families and 5.3% of the population were below the poverty line, including 6.3% of those under age 18 and 4.2% of those age 65 or over.
Common Questions
What is Per Capita Income in Sellersville borough?
Per Capita income in Sellersville borough is $36,810.
What is the Median Family Income in Sellersville borough?
Median Family Income in Sellersville borough is $100,625.
What is the Median Household income in Sellersville borough?
Median Household Income in Sellersville borough is $86,276.
What is Income or Wage Gap in Sellersville borough?
Income or Wage Gap in Sellersville borough is 23.8%.
Women in Sellersville borough earn 76.2 cents for every dollar earned by a man.
What is Inequality or Gini Index in Sellersville borough?
Inequality or Gini Index in Sellersville borough is 0.32.
What is the Total Population of Sellersville borough?
Total Population of Sellersville borough is 4,537.
What is the Total Male Population of Sellersville borough?
Total Male Population of Sellersville borough is 2,222.
What is the Total Female Population of Sellersville borough?
Total Female Population of Sellersville borough is 2,315.
What is the Ratio of Males per 100 Females in Sellersville borough?
There are 95.98 Males per 100 Females in Sellersville borough.
What is the Ratio of Females per 100 Males in Sellersville borough?
There are 104.19 Females per 100 Males in Sellersville borough.
What is the Median Population Age in Sellersville borough?
Median Population Age in Sellersville borough is 37.5 Years.
What is the Average Family Size in Sellersville borough
Average Family Size in Sellersville borough is 3.0 People.
What is the Average Household Size in Sellersville borough
Average Household Size in Sellersville borough is 2.5 People.
How Large is the Labor Force in Sellersville borough?
There are 2,824 People in the Labor Forcein in Sellersville borough.
What is the Percentage of People in the Labor Force in Sellersville borough?
78.2% of People are in the Labor Force in Sellersville borough.
What is the Unemployment Rate in Sellersville borough?
Unemployment Rate in Sellersville borough is 3.3%.