Olyphant borough, PA Map & Demographics
Olyphant borough Overview
$30,528
PER CAPITA INCOME
$62,111
AVG FAMILY INCOME
$60,120
AVG HOUSEHOLD INCOME
29.6%
WAGE / INCOME GAP [ % ]
70.4¢/ $1
WAGE / INCOME GAP [ $ ]
0.38
INEQUALITY / GINI INDEX
5,372
TOTAL POPULATION
2,753
MALE POPULATION
2,619
FEMALE POPULATION
105.12
MALES / 100 FEMALES
95.13
FEMALES / 100 MALES
40.2
MEDIAN AGE
3.0
AVG FAMILY SIZE
2.3
AVG HOUSEHOLD SIZE
2,742
LABOR FORCE [ PEOPLE ]
63.7%
PERCENT IN LABOR FORCE
3.9%
UNEMPLOYMENT RATE
Income in Olyphant borough
Income Overview in Olyphant borough
Per Capita Income in Olyphant borough is $30,528, while median incomes of families and households are $62,111 and $60,120 respectively.
| Characteristic | Number | Measure |
| Per Capita Income | 5,372 | $30,528 |
| Median Family Income | 1,350 | $62,111 |
| Mean Family Income | 1,350 | $79,590 |
| Median Household Income | 2,309 | $60,120 |
| Mean Household Income | 2,309 | $70,337 |
| Income Deficit | 1,350 | $0 |
| Wage / Income Gap (%) | 5,372 | 29.60% |
| Wage / Income Gap ($) | 5,372 | 70.40¢ per $1 |
| Gini / Inequality Index | 5,372 | 0.38 |
Earnings by Sex in Olyphant borough
Average Earnings in Olyphant borough are $38,855, $46,422 for men and $32,683 for women, a difference of 29.6%.
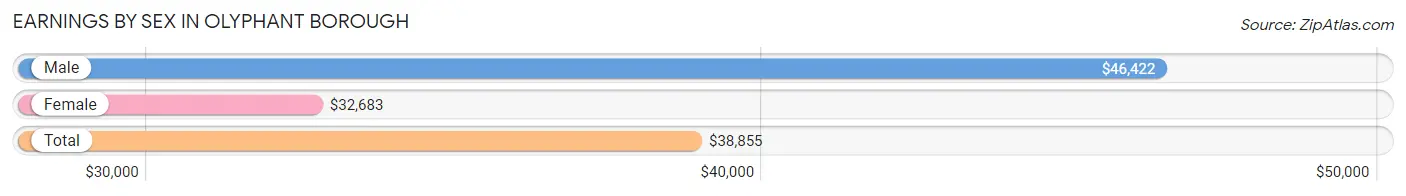
| Sex | Number | Average Earnings |
| Male | 1,361 (48.8%) | $46,422 |
| Female | 1,429 (51.2%) | $32,683 |
| Total | 2,790 (100.0%) | $38,855 |
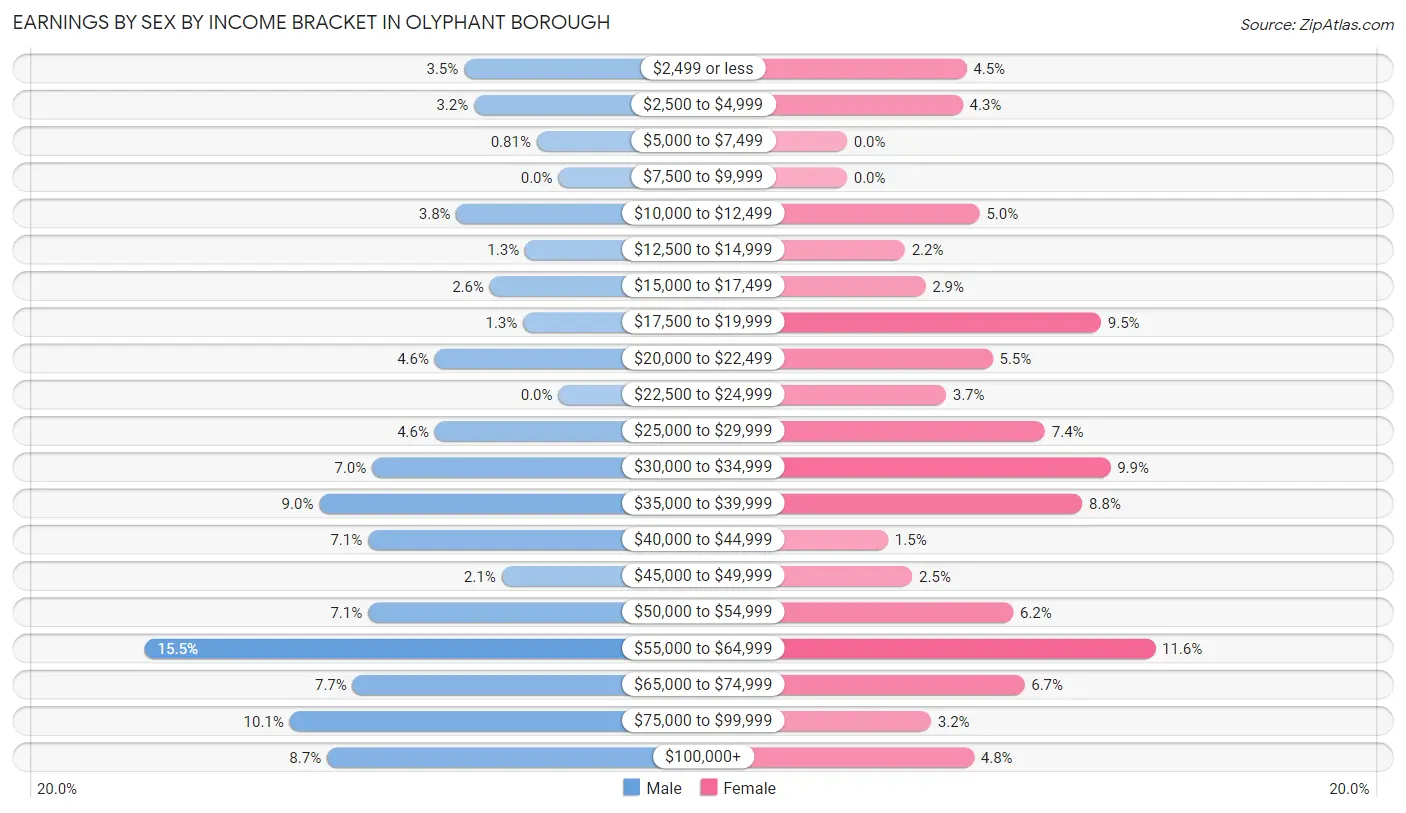
Earnings by Sex by Income Bracket in Olyphant borough
The most common earnings brackets in Olyphant borough are $55,000 to $64,999 for men (211 | 15.5%) and $55,000 to $64,999 for women (165 | 11.6%).
| Income | Male | Female |
| $2,499 or less | 48 (3.5%) | 64 (4.5%) |
| $2,500 to $4,999 | 43 (3.2%) | 62 (4.3%) |
| $5,000 to $7,499 | 11 (0.8%) | 0 (0.0%) |
| $7,500 to $9,999 | 0 (0.0%) | 0 (0.0%) |
| $10,000 to $12,499 | 52 (3.8%) | 71 (5.0%) |
| $12,500 to $14,999 | 17 (1.3%) | 31 (2.2%) |
| $15,000 to $17,499 | 35 (2.6%) | 42 (2.9%) |
| $17,500 to $19,999 | 18 (1.3%) | 136 (9.5%) |
| $20,000 to $22,499 | 63 (4.6%) | 78 (5.5%) |
| $22,500 to $24,999 | 0 (0.0%) | 53 (3.7%) |
| $25,000 to $29,999 | 63 (4.6%) | 106 (7.4%) |
| $30,000 to $34,999 | 95 (7.0%) | 141 (9.9%) |
| $35,000 to $39,999 | 122 (9.0%) | 126 (8.8%) |
| $40,000 to $44,999 | 97 (7.1%) | 22 (1.5%) |
| $45,000 to $49,999 | 29 (2.1%) | 35 (2.5%) |
| $50,000 to $54,999 | 97 (7.1%) | 89 (6.2%) |
| $55,000 to $64,999 | 211 (15.5%) | 165 (11.6%) |
| $65,000 to $74,999 | 105 (7.7%) | 95 (6.7%) |
| $75,000 to $99,999 | 137 (10.1%) | 45 (3.2%) |
| $100,000+ | 118 (8.7%) | 68 (4.8%) |
| Total | 1,361 (100.0%) | 1,429 (100.0%) |
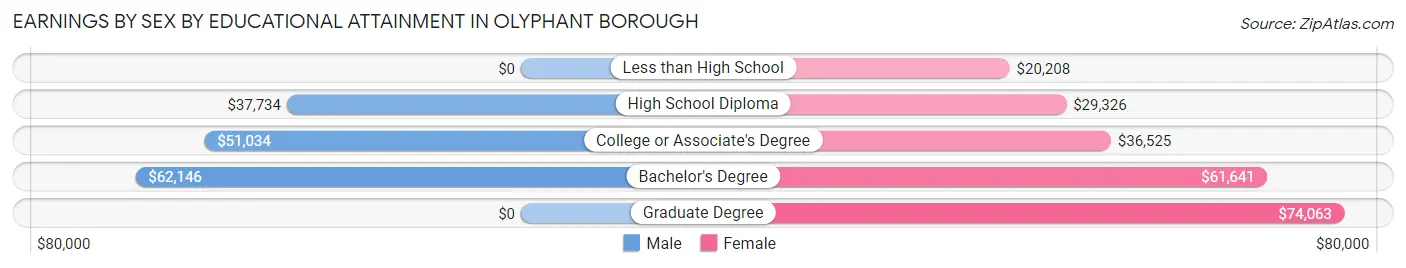
Earnings by Sex by Educational Attainment in Olyphant borough
Average earnings in Olyphant borough are $52,181 for men and $34,967 for women, a difference of 33.0%. Men with an educational attainment of bachelor's degree enjoy the highest average annual earnings of $62,146, while those with high school diploma education earn the least with $37,734. Women with an educational attainment of graduate degree earn the most with the average annual earnings of $74,063, while those with less than high school education have the smallest earnings of $20,208.
| Educational Attainment | Male Income | Female Income |
| Less than High School | - | - |
| High School Diploma | $37,734 | $29,326 |
| College or Associate's Degree | $51,034 | $36,525 |
| Bachelor's Degree | $62,146 | $61,641 |
| Graduate Degree | - | - |
| Total | $52,181 | $34,967 |
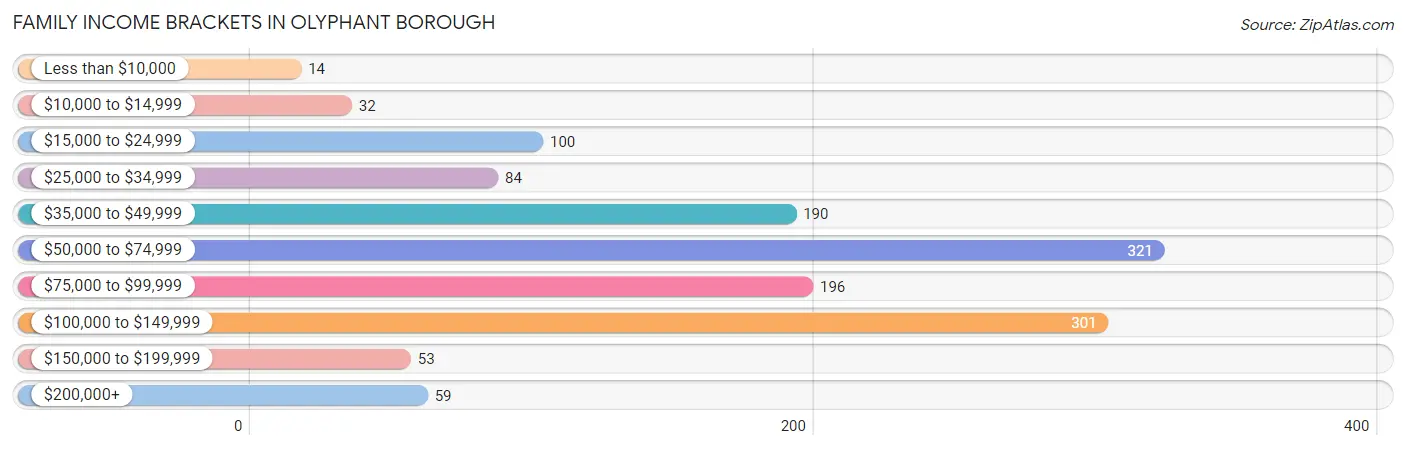
Family Income in Olyphant borough
Family Income Brackets in Olyphant borough
According to the Olyphant borough family income data, there are 321 families falling into the $50,000 to $74,999 income range, which is the most common income bracket and makes up 23.8% of all families. Conversely, the less than $10,000 income bracket is the least frequent group with only 14 families (1.0%) belonging to this category.
| Income Bracket | # Families | % Families |
| Less than $10,000 | 14 | 1.0% |
| $10,000 to $14,999 | 32 | 2.4% |
| $15,000 to $24,999 | 100 | 7.4% |
| $25,000 to $34,999 | 84 | 6.2% |
| $35,000 to $49,999 | 190 | 14.1% |
| $50,000 to $74,999 | 321 | 23.8% |
| $75,000 to $99,999 | 196 | 14.5% |
| $100,000 to $149,999 | 301 | 22.3% |
| $150,000 to $199,999 | 53 | 3.9% |
| $200,000+ | 59 | 4.4% |
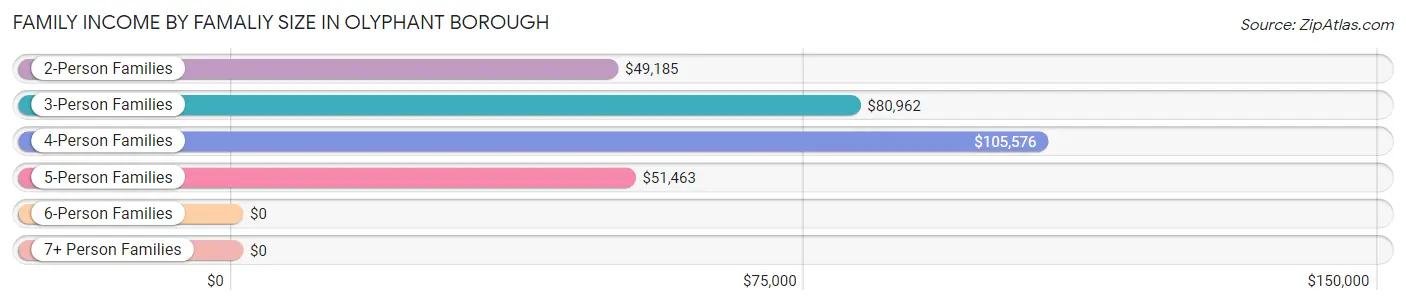
Family Income by Famaliy Size in Olyphant borough
4-person families (267 | 19.8%) account for the highest median family income in Olyphant borough with $105,576 per family, while 3-person families (438 | 32.4%) have the highest median income of $26,987 per family member.
| Income Bracket | # Families | Median Income |
| 2-Person Families | 553 (41.0%) | $49,185 |
| 3-Person Families | 438 (32.4%) | $80,962 |
| 4-Person Families | 267 (19.8%) | $105,576 |
| 5-Person Families | 92 (6.8%) | $51,463 |
| 6-Person Families | 0 (0.0%) | $0 |
| 7+ Person Families | 0 (0.0%) | $0 |
| Total | 1,350 (100.0%) | $62,111 |
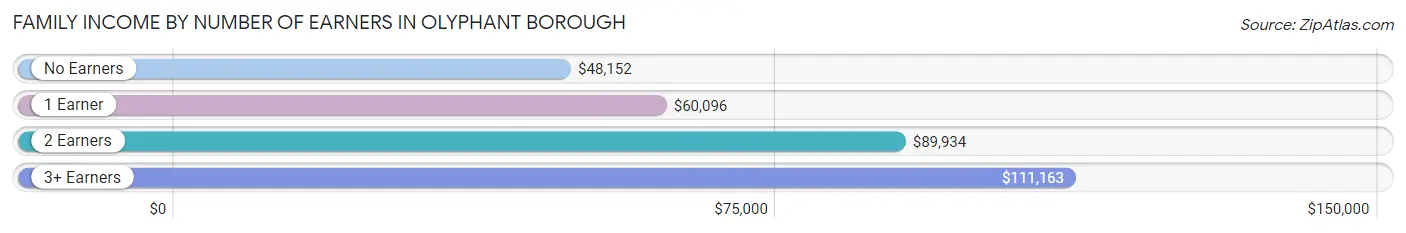
Family Income by Number of Earners in Olyphant borough
The median family income in Olyphant borough is $62,111, with families comprising 3+ earners (140) having the highest median family income of $111,163, while families with no earners (182) have the lowest median family income of $48,152, accounting for 10.4% and 13.5% of families, respectively.
| Number of Earners | # Families | Median Income |
| No Earners | 182 (13.5%) | $48,152 |
| 1 Earner | 577 (42.7%) | $60,096 |
| 2 Earners | 451 (33.4%) | $89,934 |
| 3+ Earners | 140 (10.4%) | $111,163 |
| Total | 1,350 (100.0%) | $62,111 |
Household Income in Olyphant borough
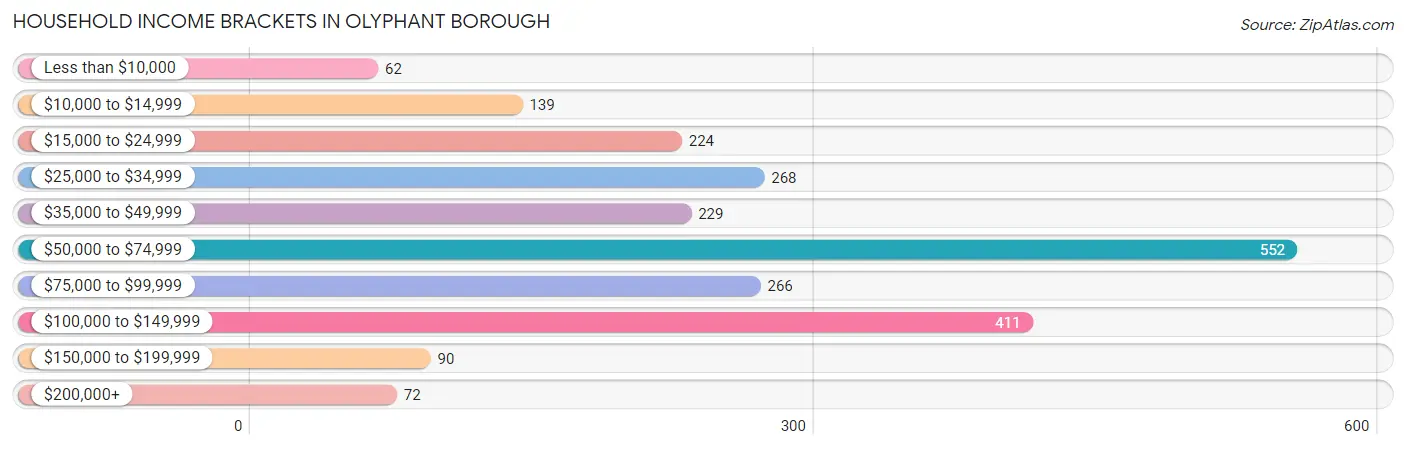
Household Income Brackets in Olyphant borough
With 552 households falling in the category, the $50,000 to $74,999 income range is the most frequent in Olyphant borough, accounting for 23.9% of all households. In contrast, only 62 households (2.7%) fall into the less than $10,000 income bracket, making it the least populous group.
| Income Bracket | # Households | % Households |
| Less than $10,000 | 62 | 2.7% |
| $10,000 to $14,999 | 139 | 6.0% |
| $15,000 to $24,999 | 224 | 9.7% |
| $25,000 to $34,999 | 268 | 11.6% |
| $35,000 to $49,999 | 229 | 9.9% |
| $50,000 to $74,999 | 552 | 23.9% |
| $75,000 to $99,999 | 266 | 11.5% |
| $100,000 to $149,999 | 411 | 17.8% |
| $150,000 to $199,999 | 90 | 3.9% |
| $200,000+ | 72 | 3.1% |
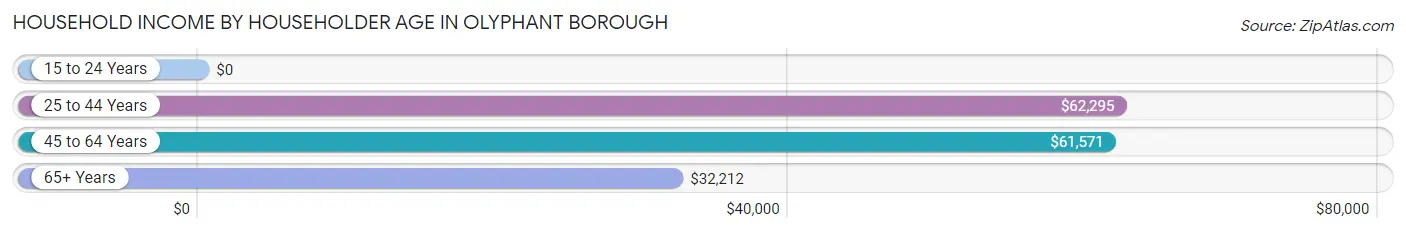
Household Income by Householder Age in Olyphant borough
The median household income in Olyphant borough is $60,120, with the highest median household income of $62,295 found in the 25 to 44 years age bracket for the primary householder. A total of 759 households (32.9%) fall into this category.
| Income Bracket | # Households | Median Income |
| 15 to 24 Years | 0 (0.0%) | $0 |
| 25 to 44 Years | 759 (32.9%) | $62,295 |
| 45 to 64 Years | 939 (40.7%) | $61,571 |
| 65+ Years | 611 (26.5%) | $32,212 |
| Total | 2,309 (100.0%) | $60,120 |
Poverty in Olyphant borough
Income Below Poverty by Sex and Age in Olyphant borough
With 8.7% poverty level for males and 10.5% for females among the residents of Olyphant borough, 65 to 74 year old males and 75 year old and over females are the most vulnerable to poverty, with 49 males (22.2%) and 72 females (22.6%) in their respective age groups living below the poverty level.
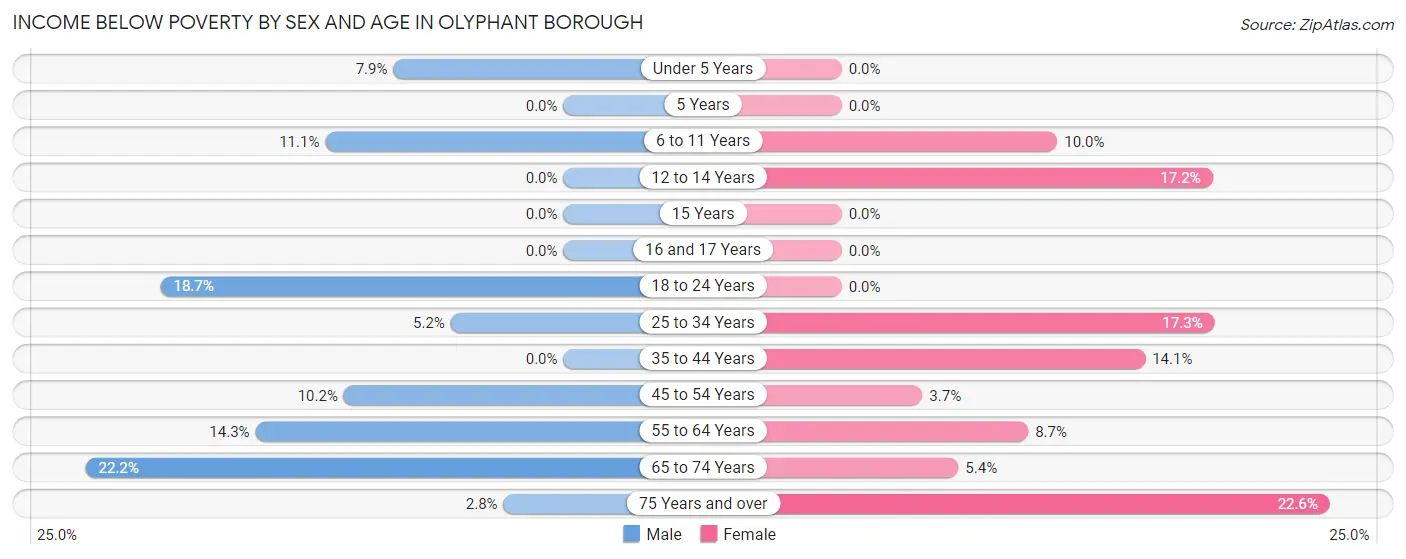
| Age Bracket | Male | Female |
| Under 5 Years | 21 (7.9%) | 0 (0.0%) |
| 5 Years | 0 (0.0%) | 0 (0.0%) |
| 6 to 11 Years | 41 (11.1%) | 17 (10.0%) |
| 12 to 14 Years | 0 (0.0%) | 16 (17.2%) |
| 15 Years | 0 (0.0%) | 0 (0.0%) |
| 16 and 17 Years | 0 (0.0%) | 0 (0.0%) |
| 18 to 24 Years | 20 (18.7%) | 0 (0.0%) |
| 25 to 34 Years | 17 (5.2%) | 59 (17.3%) |
| 35 to 44 Years | 0 (0.0%) | 58 (14.1%) |
| 45 to 54 Years | 44 (10.2%) | 15 (3.7%) |
| 55 to 64 Years | 45 (14.3%) | 23 (8.6%) |
| 65 to 74 Years | 49 (22.2%) | 14 (5.4%) |
| 75 Years and over | 4 (2.8%) | 72 (22.6%) |
| Total | 241 (8.7%) | 274 (10.5%) |
Income Above Poverty by Sex and Age in Olyphant borough
According to the poverty statistics in Olyphant borough, males aged 5 years and females aged under 5 years are the age groups that are most secure financially, with 100.0% of males and 100.0% of females in these age groups living above the poverty line.
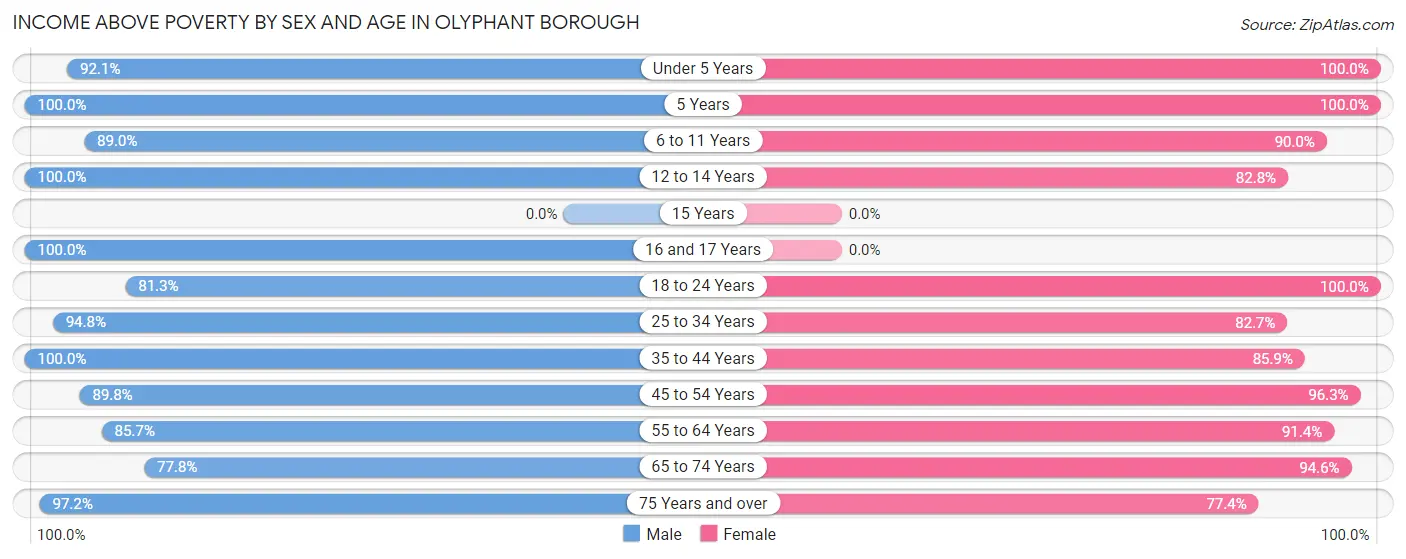
| Age Bracket | Male | Female |
| Under 5 Years | 245 (92.1%) | 45 (100.0%) |
| 5 Years | 39 (100.0%) | 43 (100.0%) |
| 6 to 11 Years | 330 (88.9%) | 153 (90.0%) |
| 12 to 14 Years | 40 (100.0%) | 77 (82.8%) |
| 15 Years | 0 (0.0%) | 0 (0.0%) |
| 16 and 17 Years | 190 (100.0%) | 0 (0.0%) |
| 18 to 24 Years | 87 (81.3%) | 271 (100.0%) |
| 25 to 34 Years | 308 (94.8%) | 282 (82.7%) |
| 35 to 44 Years | 303 (100.0%) | 354 (85.9%) |
| 45 to 54 Years | 388 (89.8%) | 386 (96.3%) |
| 55 to 64 Years | 270 (85.7%) | 243 (91.3%) |
| 65 to 74 Years | 172 (77.8%) | 245 (94.6%) |
| 75 Years and over | 140 (97.2%) | 246 (77.4%) |
| Total | 2,512 (91.2%) | 2,345 (89.5%) |
Income Below Poverty Among Married-Couple Families in Olyphant borough
The poverty statistics for married-couple families in Olyphant borough show that 2.1% or 17 of the total 812 families live below the poverty line. Families with 1 or 2 children have the highest poverty rate of 6.2%, comprising of 17 families. On the other hand, families with no children have the lowest poverty rate of 0.0%, which includes 0 families.
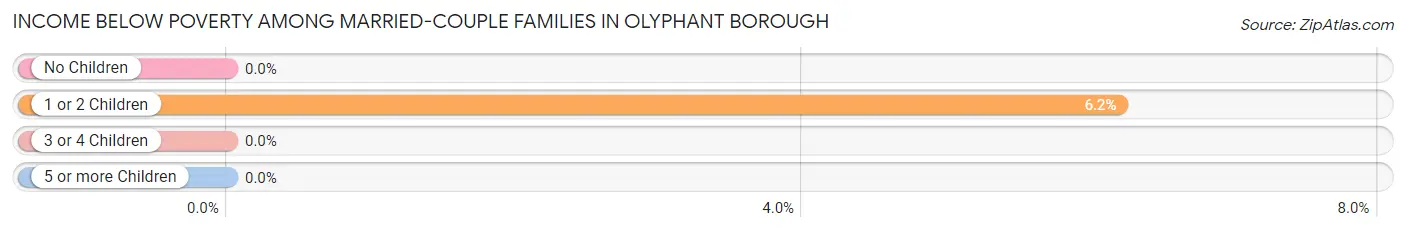
| Children | Above Poverty | Below Poverty |
| No Children | 509 (100.0%) | 0 (0.0%) |
| 1 or 2 Children | 257 (93.8%) | 17 (6.2%) |
| 3 or 4 Children | 29 (100.0%) | 0 (0.0%) |
| 5 or more Children | 0 (0.0%) | 0 (0.0%) |
| Total | 795 (97.9%) | 17 (2.1%) |
Income Below Poverty Among Single-Parent Households in Olyphant borough
According to the poverty data in Olyphant borough, 8.5% or 16 single-father households and 10.0% or 35 single-mother households are living below the poverty line. Among single-father households, those with no children have the highest poverty rate, with 16 households (39.0%) experiencing poverty. Likewise, among single-mother households, those with 3 or 4 children have the highest poverty rate, with 22 households (61.1%) falling below the poverty line.
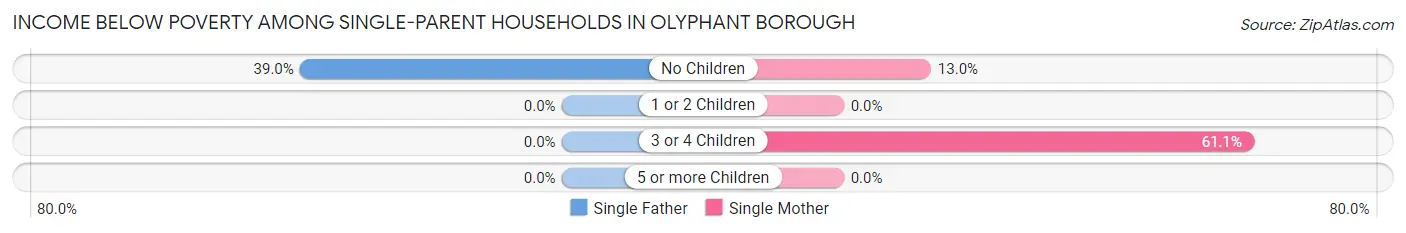
| Children | Single Father | Single Mother |
| No Children | 16 (39.0%) | 13 (13.0%) |
| 1 or 2 Children | 0 (0.0%) | 0 (0.0%) |
| 3 or 4 Children | 0 (0.0%) | 22 (61.1%) |
| 5 or more Children | 0 (0.0%) | 0 (0.0%) |
| Total | 16 (8.5%) | 35 (10.0%) |
Income Below Poverty Among Married-Couple vs Single-Parent Households in Olyphant borough
The poverty data for Olyphant borough shows that 17 of the married-couple family households (2.1%) and 51 of the single-parent households (9.5%) are living below the poverty level. Within the married-couple family households, those with 1 or 2 children have the highest poverty rate, with 17 households (6.2%) falling below the poverty line. Among the single-parent households, those with 3 or 4 children have the highest poverty rate, with 22 household (22.0%) living below poverty.
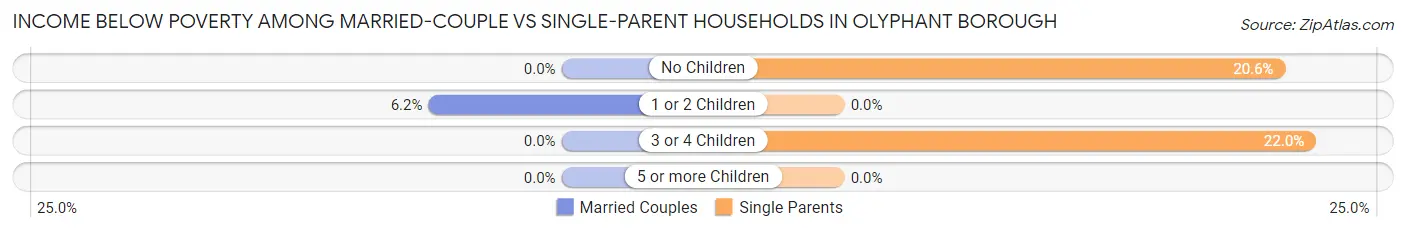
| Children | Married-Couple Families | Single-Parent Households |
| No Children | 0 (0.0%) | 29 (20.6%) |
| 1 or 2 Children | 17 (6.2%) | 0 (0.0%) |
| 3 or 4 Children | 0 (0.0%) | 22 (22.0%) |
| 5 or more Children | 0 (0.0%) | 0 (0.0%) |
| Total | 17 (2.1%) | 51 (9.5%) |
Race in Olyphant borough
The most populous races in Olyphant borough are White / Caucasian (4,678 | 87.1%), Hispanic or Latino (727 | 13.5%), and Some other Race (390 | 7.3%).
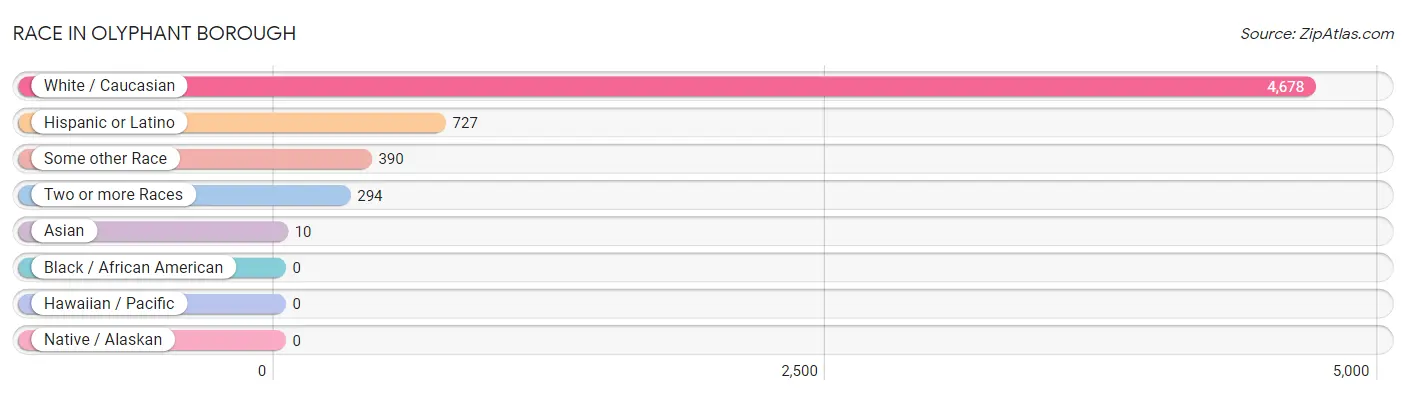
| Race | # Population | % Population |
| Asian | 10 | 0.2% |
| Black / African American | 0 | 0.0% |
| Hawaiian / Pacific | 0 | 0.0% |
| Hispanic or Latino | 727 | 13.5% |
| Native / Alaskan | 0 | 0.0% |
| White / Caucasian | 4,678 | 87.1% |
| Two or more Races | 294 | 5.5% |
| Some other Race | 390 | 7.3% |
| Total | 5,372 | 100.0% |
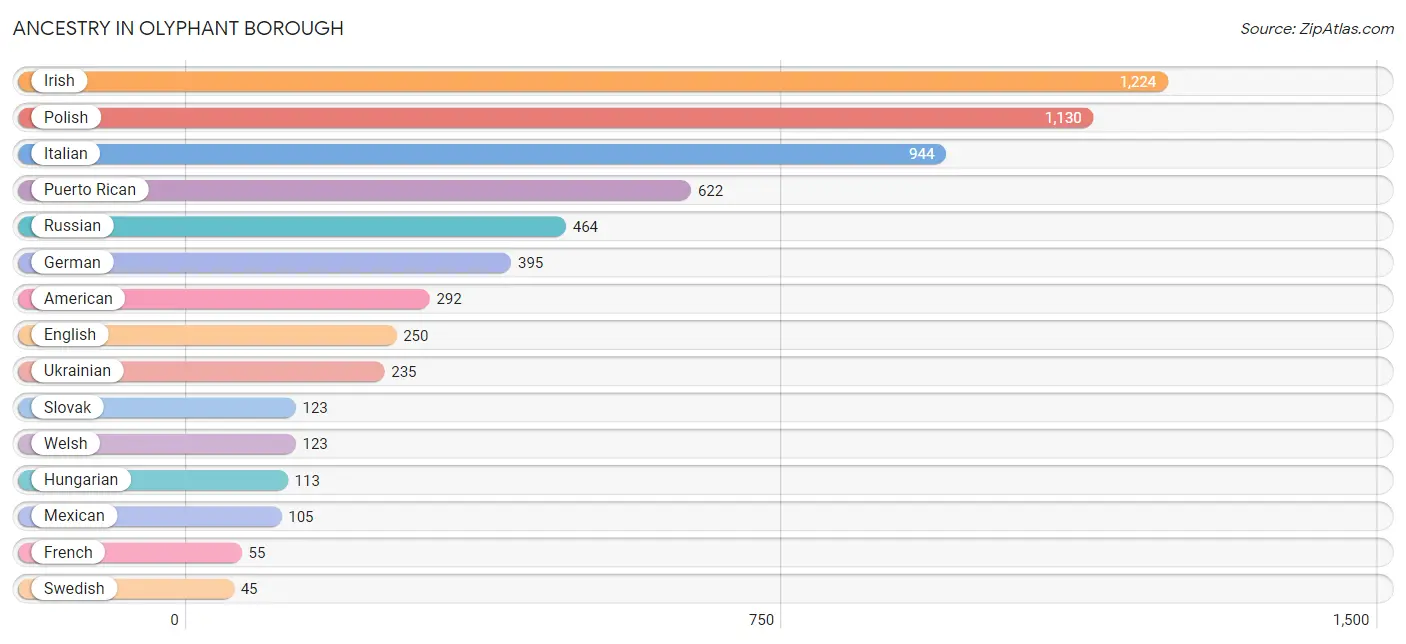
Ancestry in Olyphant borough
The most populous ancestries reported in Olyphant borough are Irish (1,224 | 22.8%), Polish (1,130 | 21.0%), Italian (944 | 17.6%), Puerto Rican (622 | 11.6%), and Russian (464 | 8.6%), together accounting for 81.6% of all Olyphant borough residents.
| Ancestry | # Population | % Population |
| American | 292 | 5.4% |
| Austrian | 16 | 0.3% |
| Bermudan | 15 | 0.3% |
| Dutch | 38 | 0.7% |
| English | 250 | 4.6% |
| European | 18 | 0.3% |
| French | 55 | 1.0% |
| German | 395 | 7.3% |
| Greek | 22 | 0.4% |
| Hungarian | 113 | 2.1% |
| Indian (Asian) | 10 | 0.2% |
| Irish | 1,224 | 22.8% |
| Italian | 944 | 17.6% |
| Lithuanian | 44 | 0.8% |
| Mexican | 105 | 1.9% |
| Mexican American Indian | 44 | 0.8% |
| Norwegian | 14 | 0.3% |
| Pennsylvania German | 15 | 0.3% |
| Polish | 1,130 | 21.0% |
| Puerto Rican | 622 | 11.6% |
| Romanian | 24 | 0.4% |
| Russian | 464 | 8.6% |
| Scotch-Irish | 16 | 0.3% |
| Scottish | 41 | 0.8% |
| Slovak | 123 | 2.3% |
| Swedish | 45 | 0.8% |
| Ukrainian | 235 | 4.4% |
| Welsh | 123 | 2.3% | View All 28 Rows |
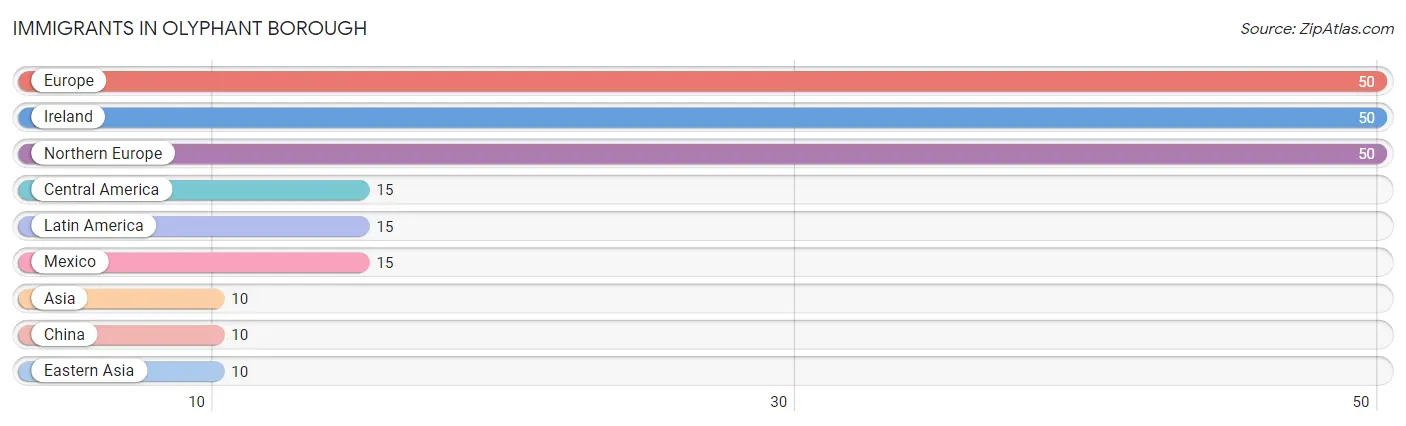
Immigrants in Olyphant borough
The most numerous immigrant groups reported in Olyphant borough came from Europe (50 | 0.9%), Ireland (50 | 0.9%), Northern Europe (50 | 0.9%), Central America (15 | 0.3%), and Latin America (15 | 0.3%), together accounting for 3.3% of all Olyphant borough residents.
| Immigration Origin | # Population | % Population |
| Asia | 10 | 0.2% |
| Central America | 15 | 0.3% |
| China | 10 | 0.2% |
| Eastern Asia | 10 | 0.2% |
| Europe | 50 | 0.9% |
| Ireland | 50 | 0.9% |
| Latin America | 15 | 0.3% |
| Mexico | 15 | 0.3% |
| Northern Europe | 50 | 0.9% | View All 9 Rows |
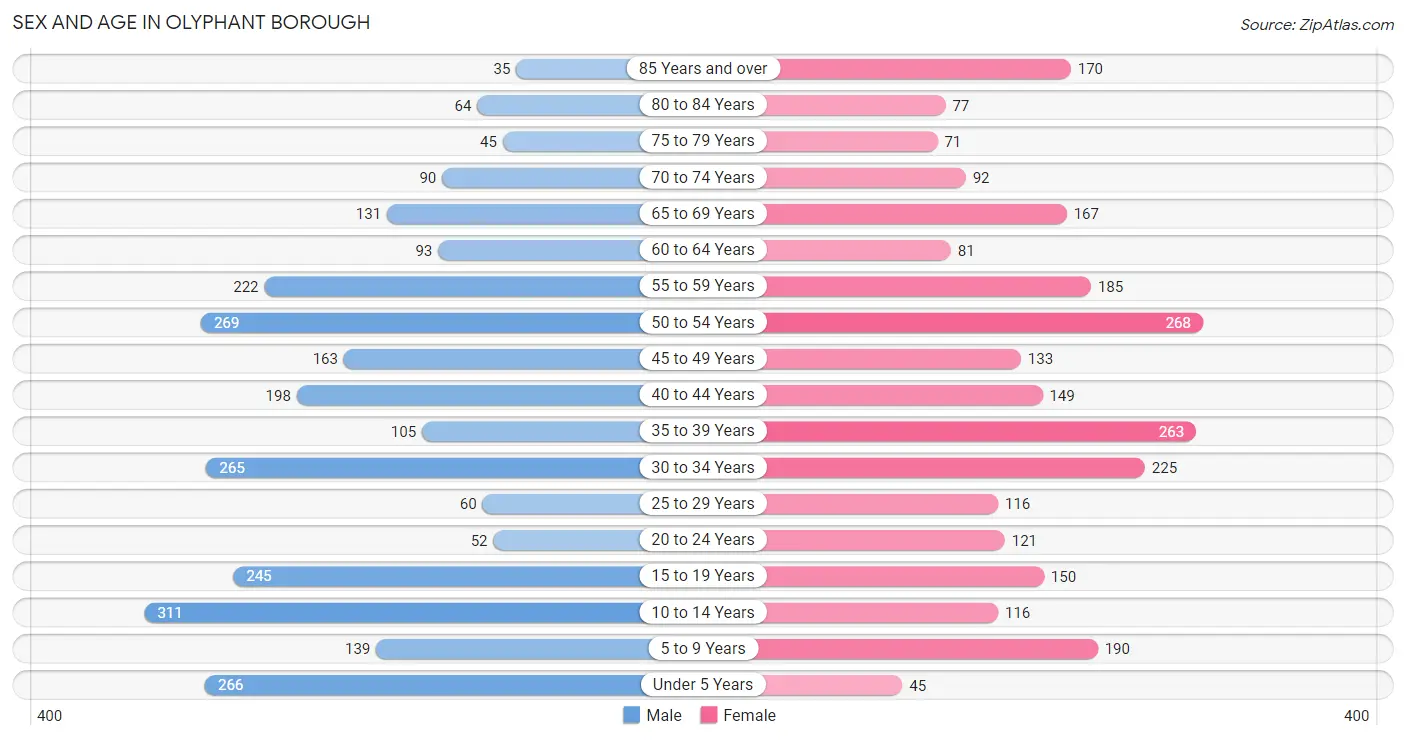
Sex and Age in Olyphant borough
Sex and Age in Olyphant borough
The most populous age groups in Olyphant borough are 10 to 14 Years (311 | 11.3%) for men and 50 to 54 Years (268 | 10.2%) for women.
| Age Bracket | Male | Female |
| Under 5 Years | 266 (9.7%) | 45 (1.7%) |
| 5 to 9 Years | 139 (5.1%) | 190 (7.2%) |
| 10 to 14 Years | 311 (11.3%) | 116 (4.4%) |
| 15 to 19 Years | 245 (8.9%) | 150 (5.7%) |
| 20 to 24 Years | 52 (1.9%) | 121 (4.6%) |
| 25 to 29 Years | 60 (2.2%) | 116 (4.4%) |
| 30 to 34 Years | 265 (9.6%) | 225 (8.6%) |
| 35 to 39 Years | 105 (3.8%) | 263 (10.0%) |
| 40 to 44 Years | 198 (7.2%) | 149 (5.7%) |
| 45 to 49 Years | 163 (5.9%) | 133 (5.1%) |
| 50 to 54 Years | 269 (9.8%) | 268 (10.2%) |
| 55 to 59 Years | 222 (8.1%) | 185 (7.1%) |
| 60 to 64 Years | 93 (3.4%) | 81 (3.1%) |
| 65 to 69 Years | 131 (4.8%) | 167 (6.4%) |
| 70 to 74 Years | 90 (3.3%) | 92 (3.5%) |
| 75 to 79 Years | 45 (1.6%) | 71 (2.7%) |
| 80 to 84 Years | 64 (2.3%) | 77 (2.9%) |
| 85 Years and over | 35 (1.3%) | 170 (6.5%) |
| Total | 2,753 (100.0%) | 2,619 (100.0%) |
Families and Households in Olyphant borough
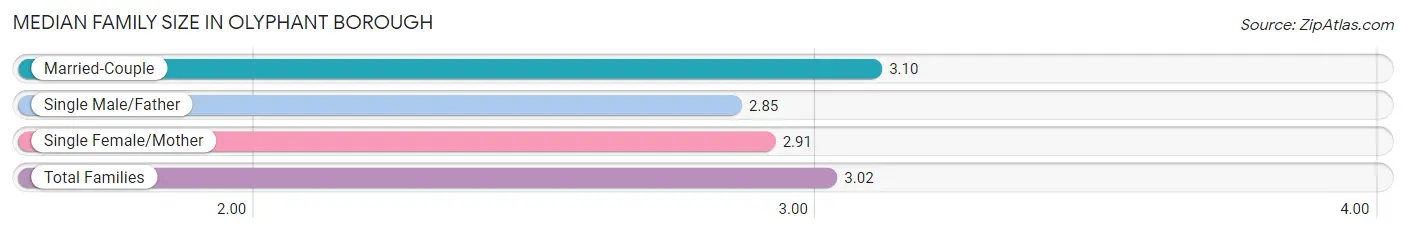
Median Family Size in Olyphant borough
The median family size in Olyphant borough is 3.02 persons per family, with married-couple families (812 | 60.2%) accounting for the largest median family size of 3.1 persons per family. On the other hand, single male/father families (189 | 14.0%) represent the smallest median family size with 2.85 persons per family.
| Family Type | # Families | Family Size |
| Married-Couple | 812 (60.2%) | 3.10 |
| Single Male/Father | 189 (14.0%) | 2.85 |
| Single Female/Mother | 349 (25.9%) | 2.91 |
| Total Families | 1,350 (100.0%) | 3.02 |
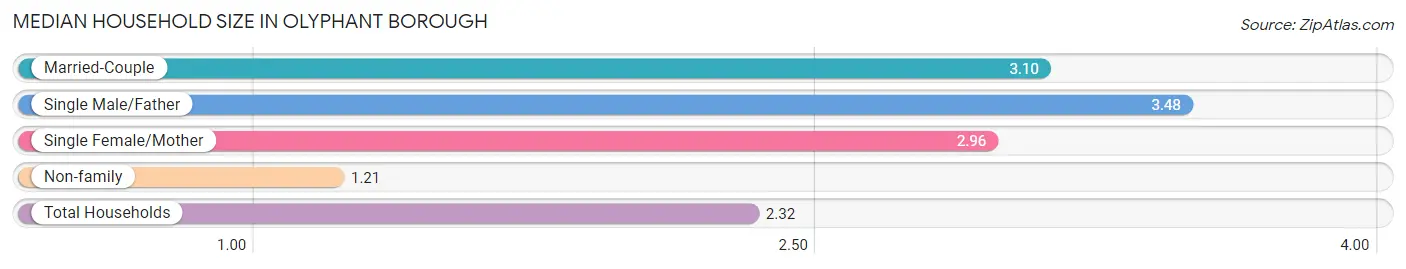
Median Household Size in Olyphant borough
The median household size in Olyphant borough is 2.32 persons per household, with single male/father households (189 | 8.2%) accounting for the largest median household size of 3.48 persons per household. non-family households (959 | 41.5%) represent the smallest median household size with 1.21 persons per household.
| Household Type | # Households | Household Size |
| Married-Couple | 812 (35.2%) | 3.10 |
| Single Male/Father | 189 (8.2%) | 3.48 |
| Single Female/Mother | 349 (15.1%) | 2.96 |
| Non-family | 959 (41.5%) | 1.21 |
| Total Households | 2,309 (100.0%) | 2.32 |
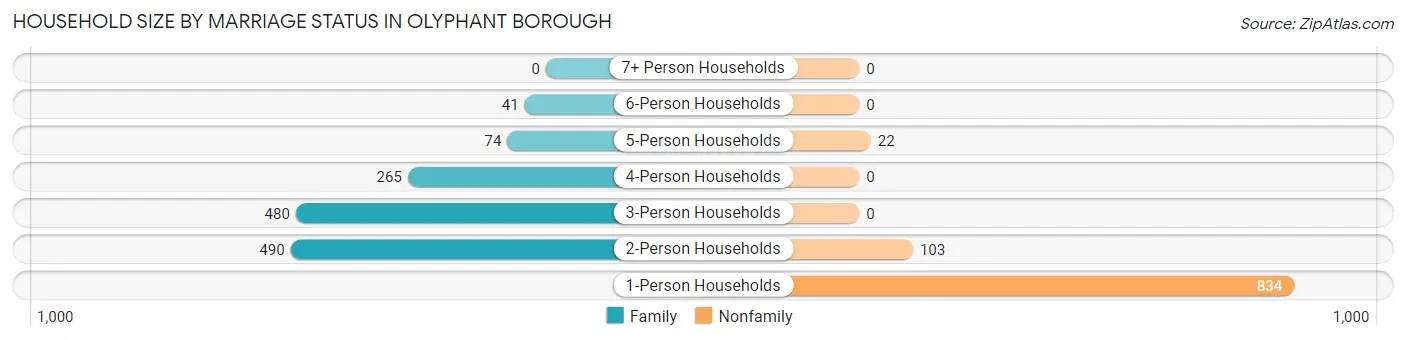
Household Size by Marriage Status in Olyphant borough
Out of a total of 2,309 households in Olyphant borough, 1,350 (58.5%) are family households, while 959 (41.5%) are nonfamily households. The most numerous type of family households are 2-person households, comprising 490, and the most common type of nonfamily households are 1-person households, comprising 834.
| Household Size | Family Households | Nonfamily Households |
| 1-Person Households | - | 834 (36.1%) |
| 2-Person Households | 490 (21.2%) | 103 (4.5%) |
| 3-Person Households | 480 (20.8%) | 0 (0.0%) |
| 4-Person Households | 265 (11.5%) | 0 (0.0%) |
| 5-Person Households | 74 (3.2%) | 22 (0.9%) |
| 6-Person Households | 41 (1.8%) | 0 (0.0%) |
| 7+ Person Households | 0 (0.0%) | 0 (0.0%) |
| Total | 1,350 (58.5%) | 959 (41.5%) |
Female Fertility in Olyphant borough
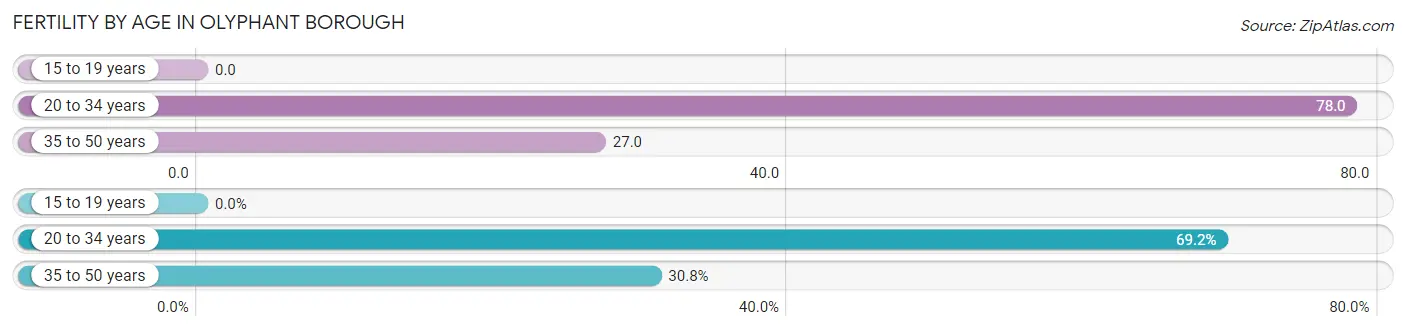
Fertility by Age in Olyphant borough
Average fertility rate in Olyphant borough is 43.0 births per 1,000 women. Women in the age bracket of 20 to 34 years have the highest fertility rate with 78.0 births per 1,000 women. Women in the age bracket of 20 to 34 years acount for 69.2% of all women with births.
| Age Bracket | Women with Births | Births / 1,000 Women |
| 15 to 19 years | 0 (0.0%) | 0.0 |
| 20 to 34 years | 36 (69.2%) | 78.0 |
| 35 to 50 years | 16 (30.8%) | 27.0 |
| Total | 52 (100.0%) | 43.0 |
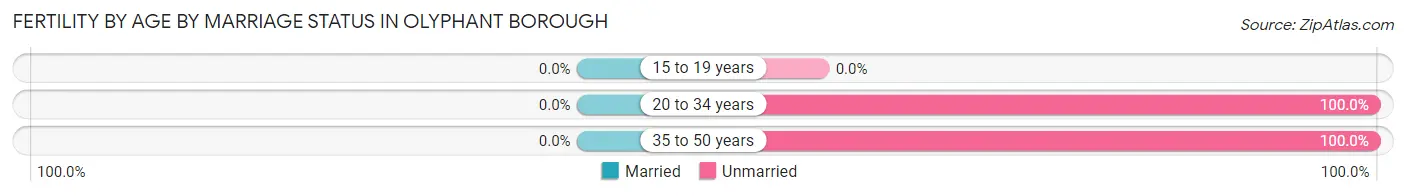
Fertility by Age by Marriage Status in Olyphant borough
| Age Bracket | Married | Unmarried |
| 15 to 19 years | 0 (0.0%) | 0 (0.0%) |
| 20 to 34 years | 0 (0.0%) | 36 (100.0%) |
| 35 to 50 years | 0 (0.0%) | 16 (100.0%) |
| Total | 0 (0.0%) | 52 (100.0%) |
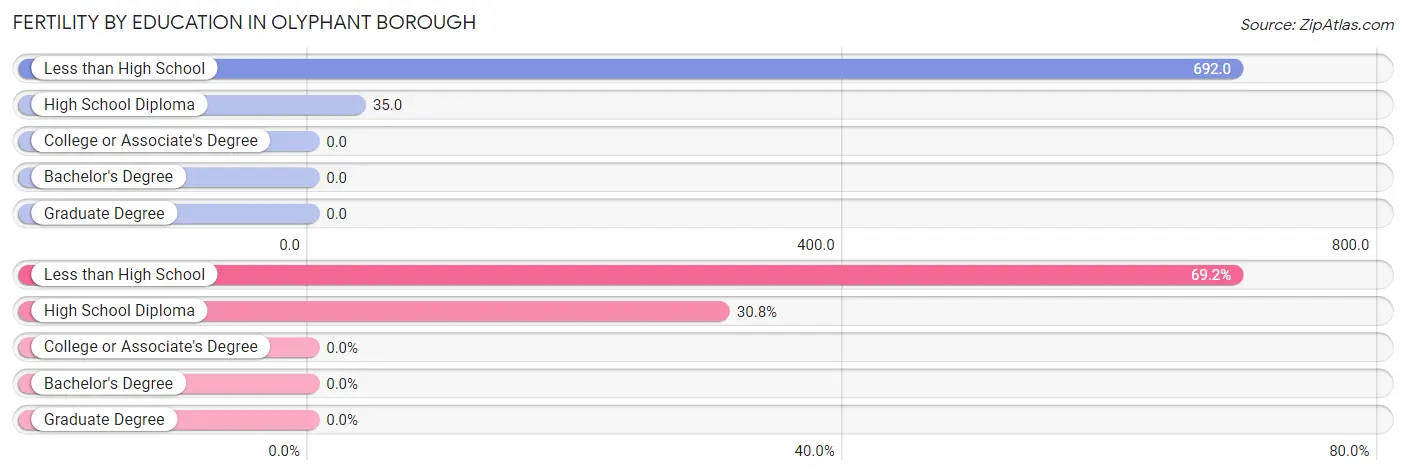
Fertility by Education in Olyphant borough
| Educational Attainment | Women with Births | Births / 1,000 Women |
| Less than High School | 36 (69.2%) | 692.0 |
| High School Diploma | 16 (30.8%) | 35.0 |
| College or Associate's Degree | 0 (0.0%) | 0.0 |
| Bachelor's Degree | 0 (0.0%) | 0.0 |
| Graduate Degree | 0 (0.0%) | 0.0 |
| Total | 52 (100.0%) | 43.0 |
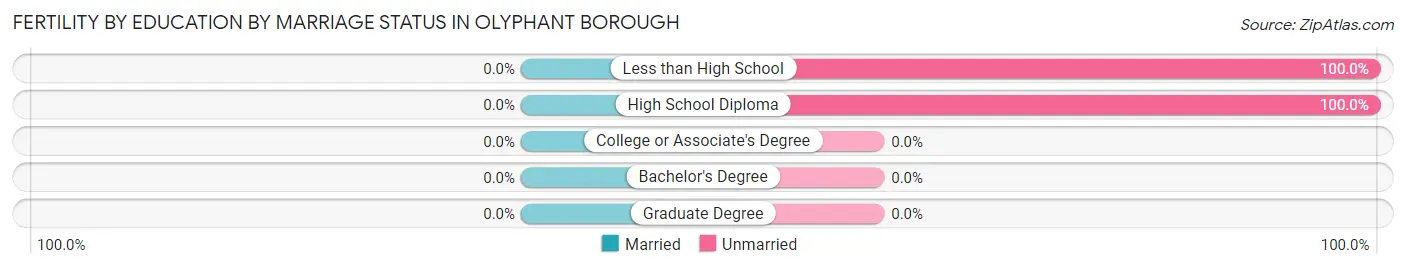
Fertility by Education by Marriage Status in Olyphant borough
| Educational Attainment | Married | Unmarried |
| Less than High School | 0 (0.0%) | 36 (100.0%) |
| High School Diploma | 0 (0.0%) | 16 (100.0%) |
| College or Associate's Degree | 0 (0.0%) | 0 (0.0%) |
| Bachelor's Degree | 0 (0.0%) | 0 (0.0%) |
| Graduate Degree | 0 (0.0%) | 0 (0.0%) |
| Total | 0 (0.0%) | 52 (100.0%) |
Employment Characteristics in Olyphant borough
Employment by Class of Employer in Olyphant borough
Among the 2,596 employed individuals in Olyphant borough, private company employees (1,774 | 68.3%), local government employees (282 | 10.9%), and not-for-profit organizations (181 | 7.0%) make up the most common classes of employment.
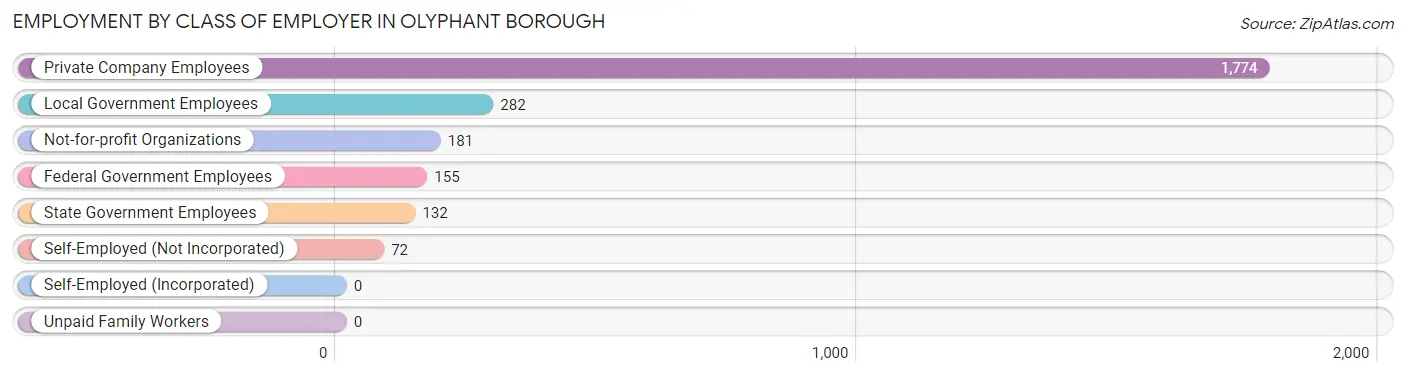
| Employer Class | # Employees | % Employees |
| Private Company Employees | 1,774 | 68.3% |
| Self-Employed (Incorporated) | 0 | 0.0% |
| Self-Employed (Not Incorporated) | 72 | 2.8% |
| Not-for-profit Organizations | 181 | 7.0% |
| Local Government Employees | 282 | 10.9% |
| State Government Employees | 132 | 5.1% |
| Federal Government Employees | 155 | 6.0% |
| Unpaid Family Workers | 0 | 0.0% |
| Total | 2,596 | 100.0% |
Employment Status by Age in Olyphant borough
According to the labor force statistics for Olyphant borough, out of the total population over 16 years of age (4,305), 63.7% or 2,742 individuals are in the labor force, with 3.9% or 107 of them unemployed. The age group with the highest labor force participation rate is 20 to 24 years, with 100.0% or 173 individuals in the labor force. Within the labor force, the 30 to 34 years age range has the highest percentage of unemployed individuals, with 8.6% or 41 of them being unemployed.
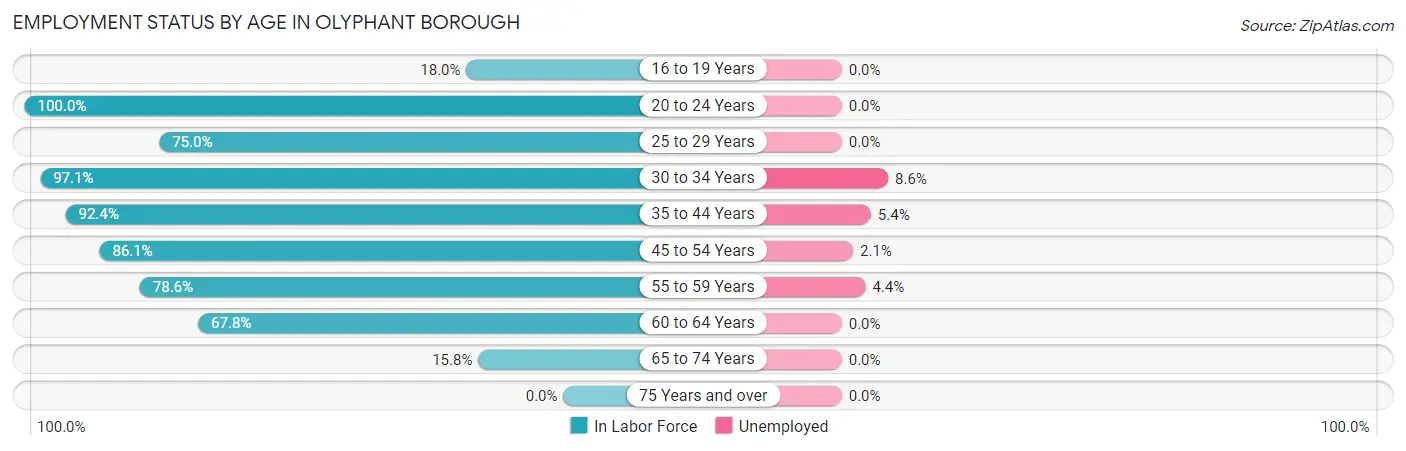
| Age Bracket | In Labor Force | Unemployed |
| 16 to 19 Years | 71 (18.0%) | 0 (0.0%) |
| 20 to 24 Years | 173 (100.0%) | 0 (0.0%) |
| 25 to 29 Years | 132 (75.0%) | 0 (0.0%) |
| 30 to 34 Years | 476 (97.1%) | 41 (8.6%) |
| 35 to 44 Years | 661 (92.4%) | 36 (5.4%) |
| 45 to 54 Years | 717 (86.1%) | 15 (2.1%) |
| 55 to 59 Years | 320 (78.6%) | 14 (4.4%) |
| 60 to 64 Years | 118 (67.8%) | 0 (0.0%) |
| 65 to 74 Years | 76 (15.8%) | 0 (0.0%) |
| 75 Years and over | 0 (0.0%) | 0 (0.0%) |
| Total | 2,742 (63.7%) | 107 (3.9%) |
Employment Status by Educational Attainment in Olyphant borough
According to labor force statistics for Olyphant borough, 86.7% of individuals (2,423) out of the total population between 25 and 64 years of age (2,795) are in the labor force, with 4.4% or 107 of them being unemployed. The group with the highest labor force participation rate are those with the educational attainment of bachelor's degree or higher, with 96.4% or 618 individuals in the labor force. Within the labor force, individuals with high school diploma education have the highest percentage of unemployment, with 8.3% or 87 of them being unemployed.
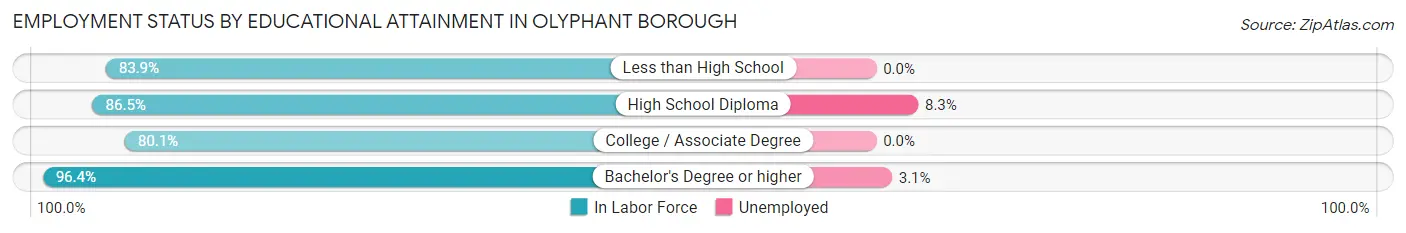
| Educational Attainment | In Labor Force | Unemployed |
| Less than High School | 73 (83.9%) | 0 (0.0%) |
| High School Diploma | 1,046 (86.5%) | 100 (8.3%) |
| College / Associate Degree | 687 (80.1%) | 0 (0.0%) |
| Bachelor's Degree or higher | 618 (96.4%) | 20 (3.1%) |
| Total | 2,423 (86.7%) | 123 (4.4%) |
Employment Occupations by Sex in Olyphant borough
Management, Business, Science and Arts Occupations
The most common Management, Business, Science and Arts occupations in Olyphant borough are Community & Social Service (292 | 11.1%), Education Instruction & Library (231 | 8.8%), Management (164 | 6.2%), Health Diagnosing & Treating (125 | 4.7%), and Business & Financial (86 | 3.3%).
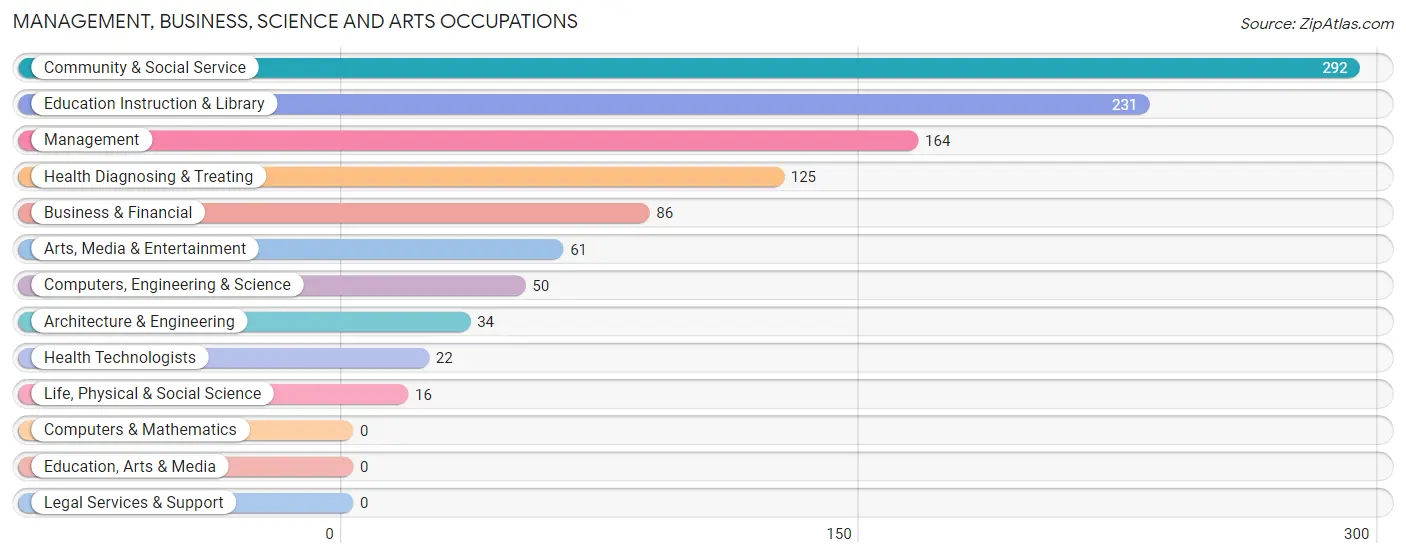
Management, Business, Science and Arts Occupations by Sex
Within the Management, Business, Science and Arts occupations in Olyphant borough, the most male-oriented occupations are Health Technologists (59.1%), Architecture & Engineering (50.0%), and Management (42.7%), while the most female-oriented occupations are Life, Physical & Social Science (100.0%), Education Instruction & Library (93.5%), and Community & Social Service (87.3%).
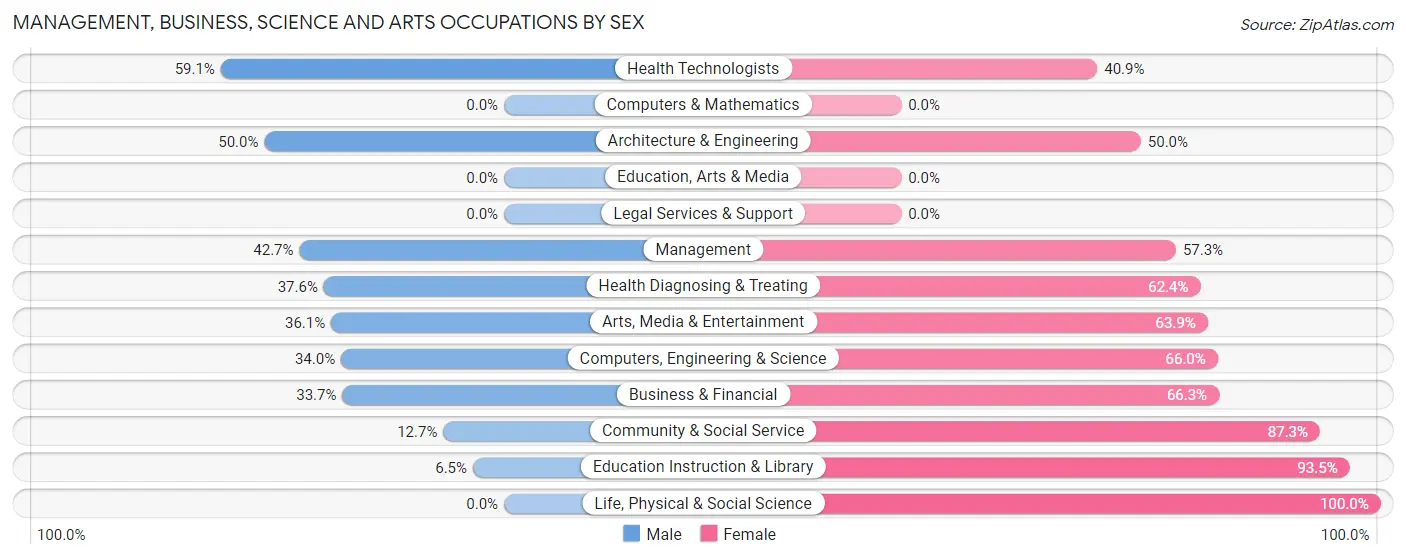
| Occupation | Male | Female |
| Management | 70 (42.7%) | 94 (57.3%) |
| Business & Financial | 29 (33.7%) | 57 (66.3%) |
| Computers, Engineering & Science | 17 (34.0%) | 33 (66.0%) |
| Computers & Mathematics | 0 (0.0%) | 0 (0.0%) |
| Architecture & Engineering | 17 (50.0%) | 17 (50.0%) |
| Life, Physical & Social Science | 0 (0.0%) | 16 (100.0%) |
| Community & Social Service | 37 (12.7%) | 255 (87.3%) |
| Education, Arts & Media | 0 (0.0%) | 0 (0.0%) |
| Legal Services & Support | 0 (0.0%) | 0 (0.0%) |
| Education Instruction & Library | 15 (6.5%) | 216 (93.5%) |
| Arts, Media & Entertainment | 22 (36.1%) | 39 (63.9%) |
| Health Diagnosing & Treating | 47 (37.6%) | 78 (62.4%) |
| Health Technologists | 13 (59.1%) | 9 (40.9%) |
| Total (Category) | 200 (27.9%) | 517 (72.1%) |
| Total (Overall) | 1,284 (48.7%) | 1,354 (51.3%) |
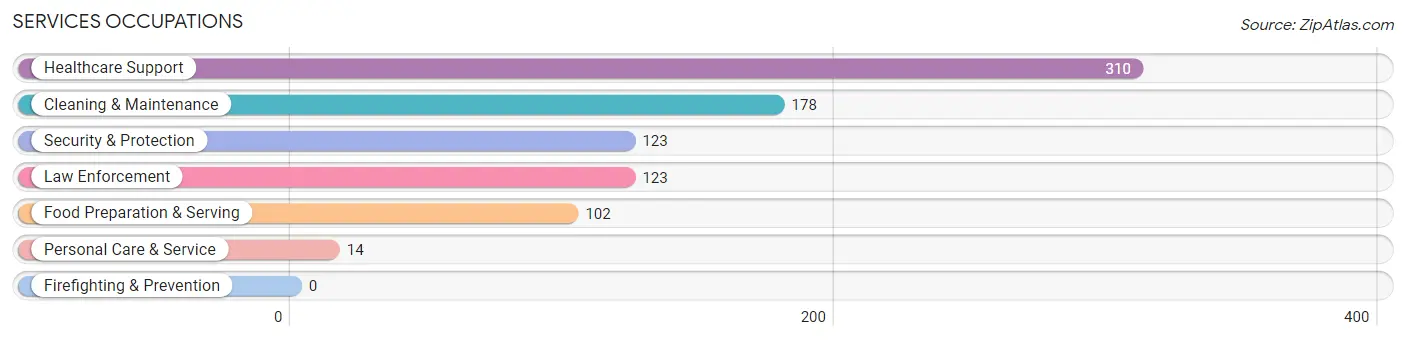
Services Occupations
The most common Services occupations in Olyphant borough are Healthcare Support (310 | 11.7%), Cleaning & Maintenance (178 | 6.8%), Security & Protection (123 | 4.7%), Law Enforcement (123 | 4.7%), and Food Preparation & Serving (102 | 3.9%).
Services Occupations by Sex
Within the Services occupations in Olyphant borough, the most male-oriented occupations are Security & Protection (100.0%), Law Enforcement (100.0%), and Cleaning & Maintenance (36.0%), while the most female-oriented occupations are Personal Care & Service (100.0%), Food Preparation & Serving (80.4%), and Healthcare Support (65.8%).
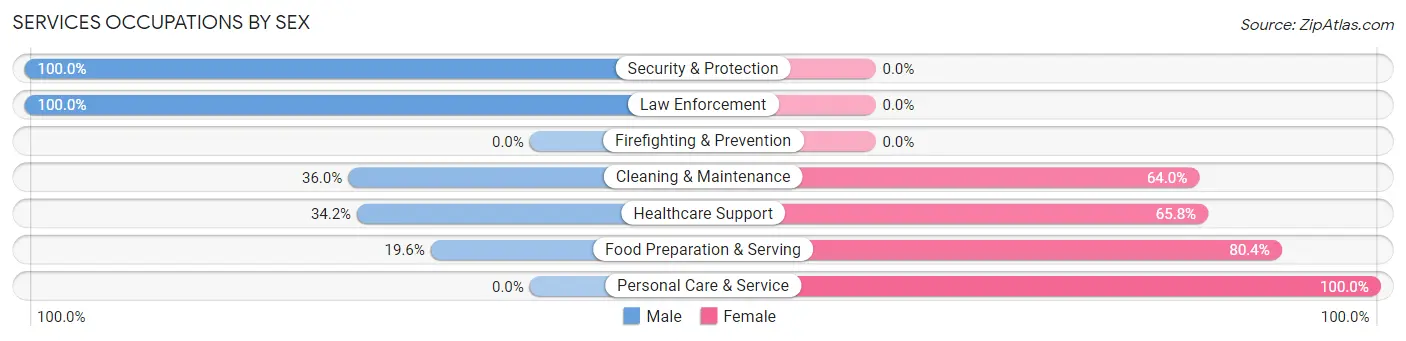
| Occupation | Male | Female |
| Healthcare Support | 106 (34.2%) | 204 (65.8%) |
| Security & Protection | 123 (100.0%) | 0 (0.0%) |
| Firefighting & Prevention | 0 (0.0%) | 0 (0.0%) |
| Law Enforcement | 123 (100.0%) | 0 (0.0%) |
| Food Preparation & Serving | 20 (19.6%) | 82 (80.4%) |
| Cleaning & Maintenance | 64 (36.0%) | 114 (64.0%) |
| Personal Care & Service | 0 (0.0%) | 14 (100.0%) |
| Total (Category) | 313 (43.0%) | 414 (57.0%) |
| Total (Overall) | 1,284 (48.7%) | 1,354 (51.3%) |
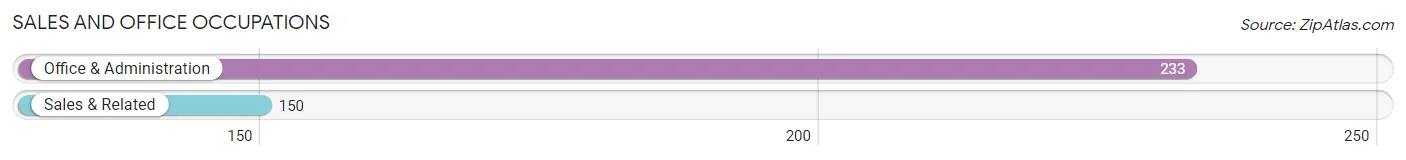
Sales and Office Occupations
The most common Sales and Office occupations in Olyphant borough are Office & Administration (233 | 8.8%), and Sales & Related (150 | 5.7%).
Sales and Office Occupations by Sex
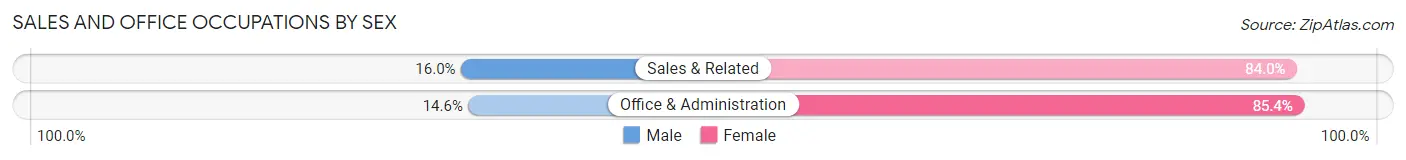
| Occupation | Male | Female |
| Sales & Related | 24 (16.0%) | 126 (84.0%) |
| Office & Administration | 34 (14.6%) | 199 (85.4%) |
| Total (Category) | 58 (15.1%) | 325 (84.9%) |
| Total (Overall) | 1,284 (48.7%) | 1,354 (51.3%) |
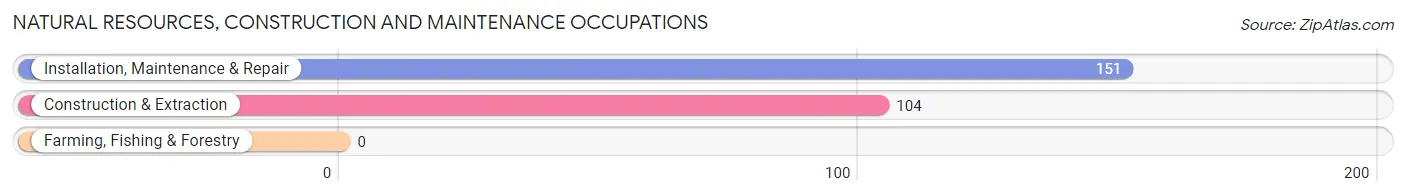
Natural Resources, Construction and Maintenance Occupations
The most common Natural Resources, Construction and Maintenance occupations in Olyphant borough are Installation, Maintenance & Repair (151 | 5.7%), and Construction & Extraction (104 | 3.9%).
Natural Resources, Construction and Maintenance Occupations by Sex
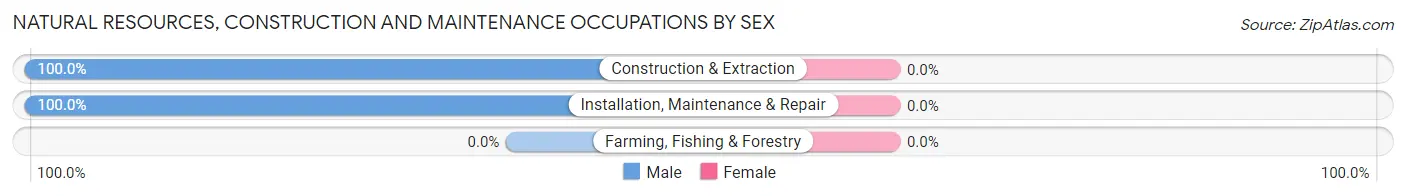
| Occupation | Male | Female |
| Farming, Fishing & Forestry | 0 (0.0%) | 0 (0.0%) |
| Construction & Extraction | 104 (100.0%) | 0 (0.0%) |
| Installation, Maintenance & Repair | 151 (100.0%) | 0 (0.0%) |
| Total (Category) | 255 (100.0%) | 0 (0.0%) |
| Total (Overall) | 1,284 (48.7%) | 1,354 (51.3%) |
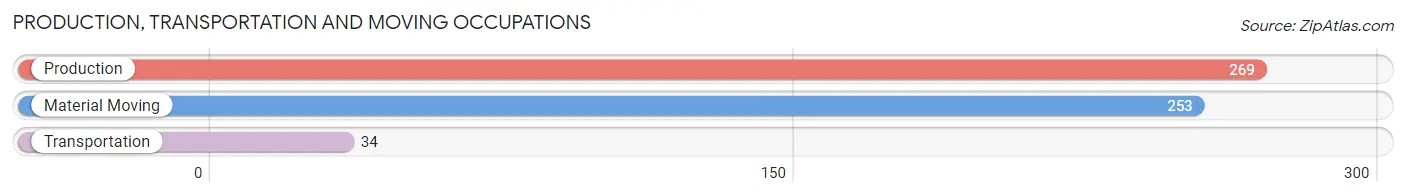
Production, Transportation and Moving Occupations
The most common Production, Transportation and Moving occupations in Olyphant borough are Production (269 | 10.2%), Material Moving (253 | 9.6%), and Transportation (34 | 1.3%).
Production, Transportation and Moving Occupations by Sex
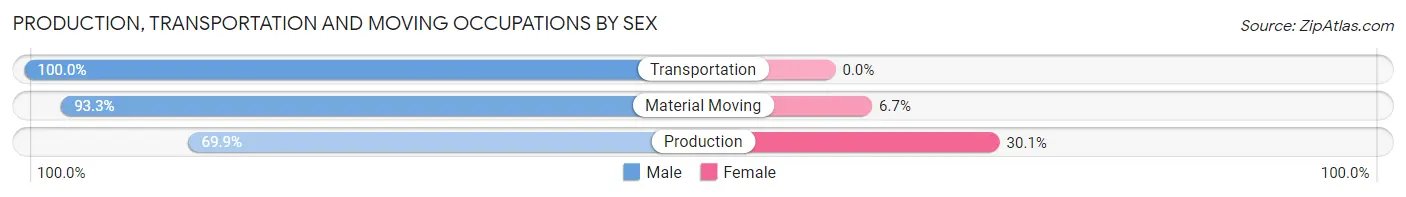
| Occupation | Male | Female |
| Production | 188 (69.9%) | 81 (30.1%) |
| Transportation | 34 (100.0%) | 0 (0.0%) |
| Material Moving | 236 (93.3%) | 17 (6.7%) |
| Total (Category) | 458 (82.4%) | 98 (17.6%) |
| Total (Overall) | 1,284 (48.7%) | 1,354 (51.3%) |
Employment Industries by Sex in Olyphant borough
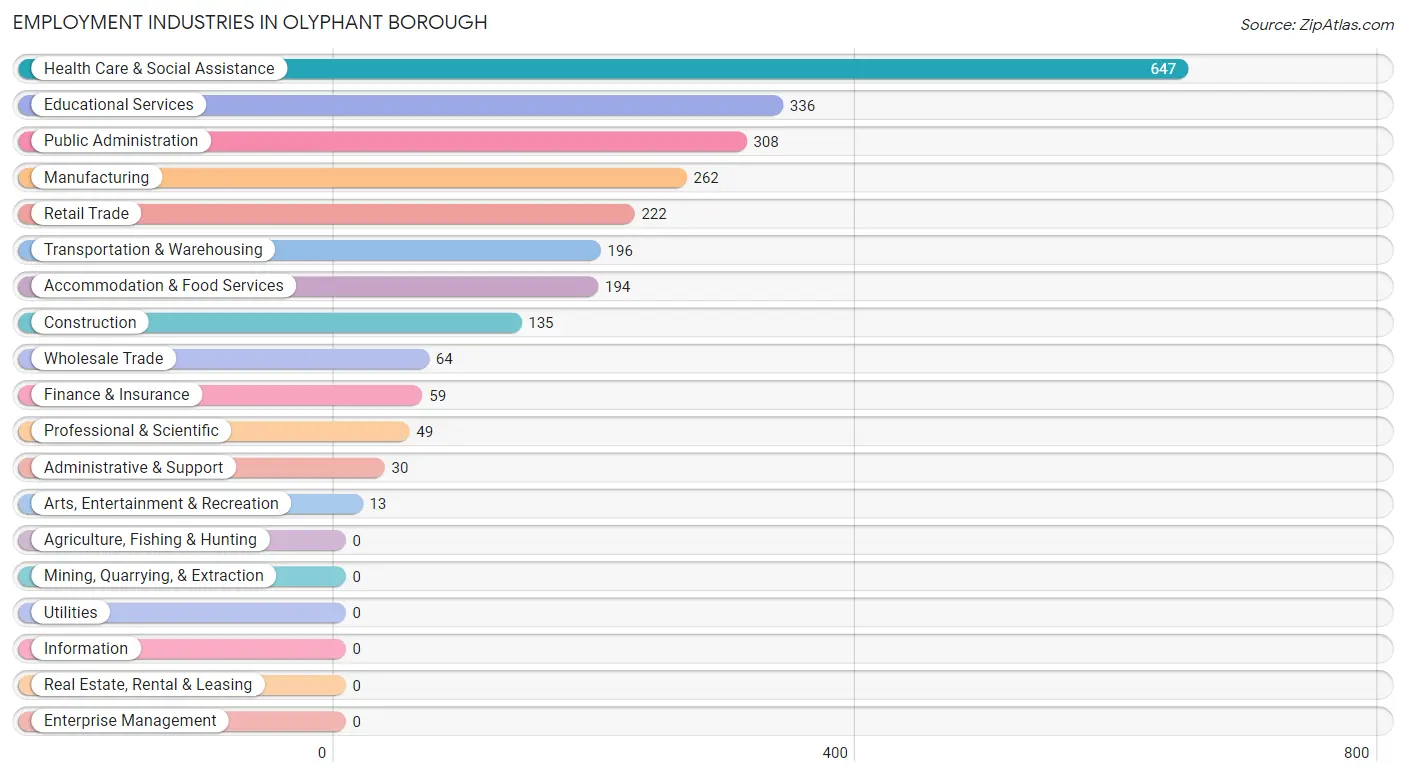
Employment Industries in Olyphant borough
The major employment industries in Olyphant borough include Health Care & Social Assistance (647 | 24.5%), Educational Services (336 | 12.7%), Public Administration (308 | 11.7%), Manufacturing (262 | 9.9%), and Retail Trade (222 | 8.4%).
Employment Industries by Sex in Olyphant borough
The Olyphant borough industries that see more men than women are Manufacturing (94.7%), Public Administration (94.5%), and Construction (85.9%), whereas the industries that tend to have a higher number of women are Finance & Insurance (100.0%), Arts, Entertainment & Recreation (100.0%), and Educational Services (89.3%).
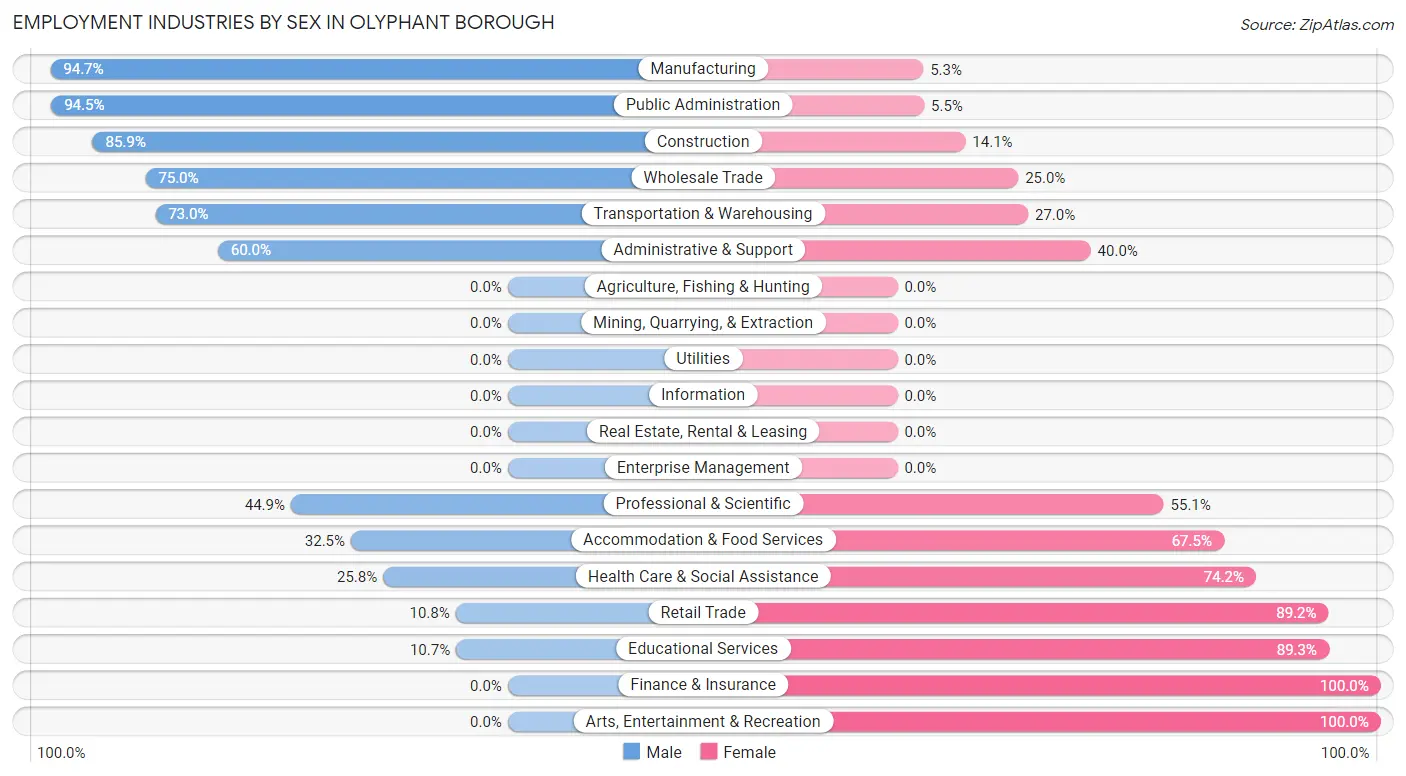
| Industry | Male | Female |
| Agriculture, Fishing & Hunting | 0 (0.0%) | 0 (0.0%) |
| Mining, Quarrying, & Extraction | 0 (0.0%) | 0 (0.0%) |
| Construction | 116 (85.9%) | 19 (14.1%) |
| Manufacturing | 248 (94.7%) | 14 (5.3%) |
| Wholesale Trade | 48 (75.0%) | 16 (25.0%) |
| Retail Trade | 24 (10.8%) | 198 (89.2%) |
| Transportation & Warehousing | 143 (73.0%) | 53 (27.0%) |
| Utilities | 0 (0.0%) | 0 (0.0%) |
| Information | 0 (0.0%) | 0 (0.0%) |
| Finance & Insurance | 0 (0.0%) | 59 (100.0%) |
| Real Estate, Rental & Leasing | 0 (0.0%) | 0 (0.0%) |
| Professional & Scientific | 22 (44.9%) | 27 (55.1%) |
| Enterprise Management | 0 (0.0%) | 0 (0.0%) |
| Administrative & Support | 18 (60.0%) | 12 (40.0%) |
| Educational Services | 36 (10.7%) | 300 (89.3%) |
| Health Care & Social Assistance | 167 (25.8%) | 480 (74.2%) |
| Arts, Entertainment & Recreation | 0 (0.0%) | 13 (100.0%) |
| Accommodation & Food Services | 63 (32.5%) | 131 (67.5%) |
| Public Administration | 291 (94.5%) | 17 (5.5%) |
| Total | 1,284 (48.7%) | 1,354 (51.3%) |
Education in Olyphant borough
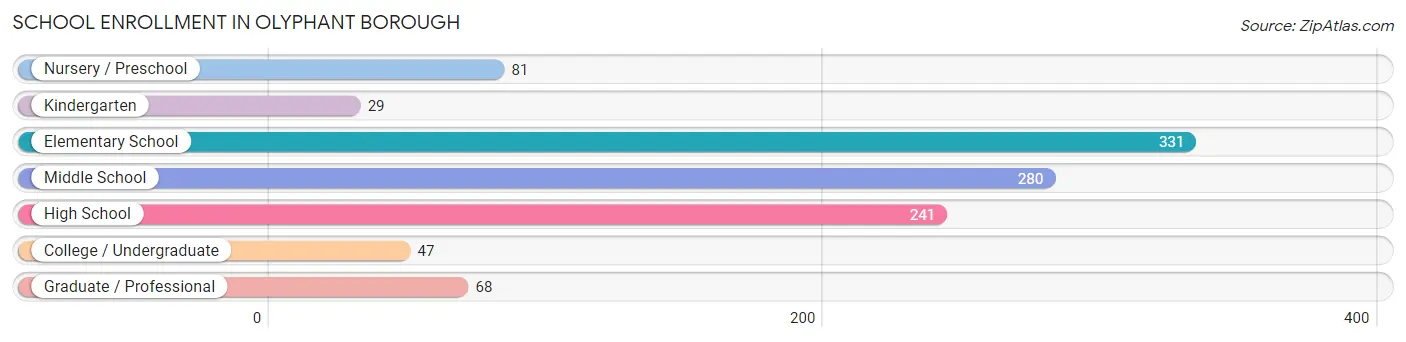
School Enrollment in Olyphant borough
The most common levels of schooling among the 1,077 students in Olyphant borough are elementary school (331 | 30.7%), middle school (280 | 26.0%), and high school (241 | 22.4%).
| School Level | # Students | % Students |
| Nursery / Preschool | 81 | 7.5% |
| Kindergarten | 29 | 2.7% |
| Elementary School | 331 | 30.7% |
| Middle School | 280 | 26.0% |
| High School | 241 | 22.4% |
| College / Undergraduate | 47 | 4.4% |
| Graduate / Professional | 68 | 6.3% |
| Total | 1,077 | 100.0% |
School Enrollment by Age by Funding Source in Olyphant borough
Out of a total of 1,077 students who are enrolled in schools in Olyphant borough, 48 (4.5%) attend a private institution, while the remaining 1,029 (95.5%) are enrolled in public schools. The age group of 35 years and over has the highest likelihood of being enrolled in private schools, with 27 (100.0% in the age bracket) enrolled. Conversely, the age group of 3 to 4 year olds has the lowest likelihood of being enrolled in a private school, with 57 (100.0% in the age bracket) attending a public institution.
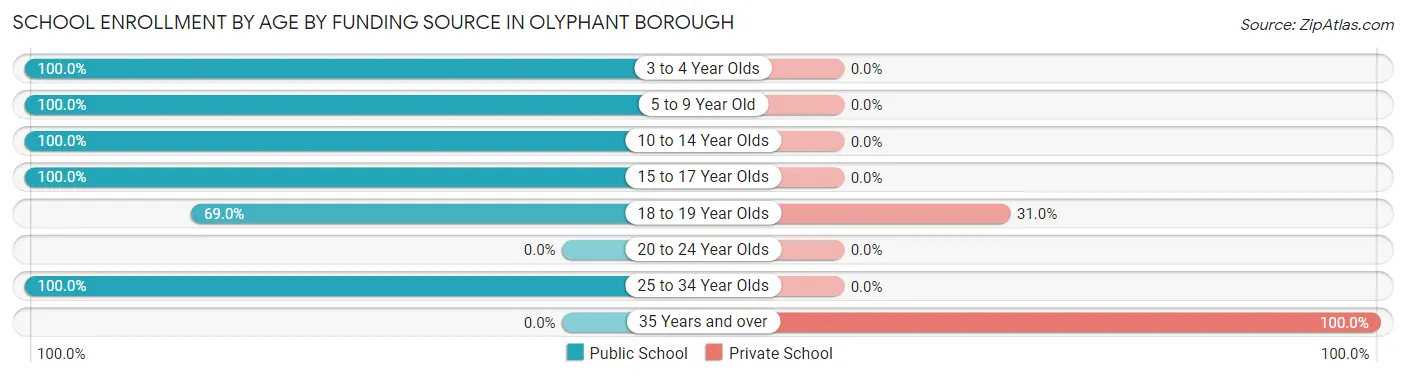
| Age Bracket | Public School | Private School |
| 3 to 4 Year Olds | 57 (100.0%) | 0 (0.0%) |
| 5 to 9 Year Old | 252 (100.0%) | 0 (0.0%) |
| 10 to 14 Year Olds | 427 (100.0%) | 0 (0.0%) |
| 15 to 17 Year Olds | 190 (100.0%) | 0 (0.0%) |
| 18 to 19 Year Olds | 49 (69.0%) | 22 (31.0%) |
| 20 to 24 Year Olds | 0 (0.0%) | 0 (0.0%) |
| 25 to 34 Year Olds | 53 (100.0%) | 0 (0.0%) |
| 35 Years and over | 0 (0.0%) | 27 (100.0%) |
| Total | 1,029 (95.5%) | 48 (4.5%) |
Educational Attainment by Field of Study in Olyphant borough
Education (160 | 17.7%), science & technology (141 | 15.6%), business (133 | 14.7%), arts & humanities (117 | 12.9%), and engineering (60 | 6.6%) are the most common fields of study among 904 individuals in Olyphant borough who have obtained a bachelor's degree or higher.
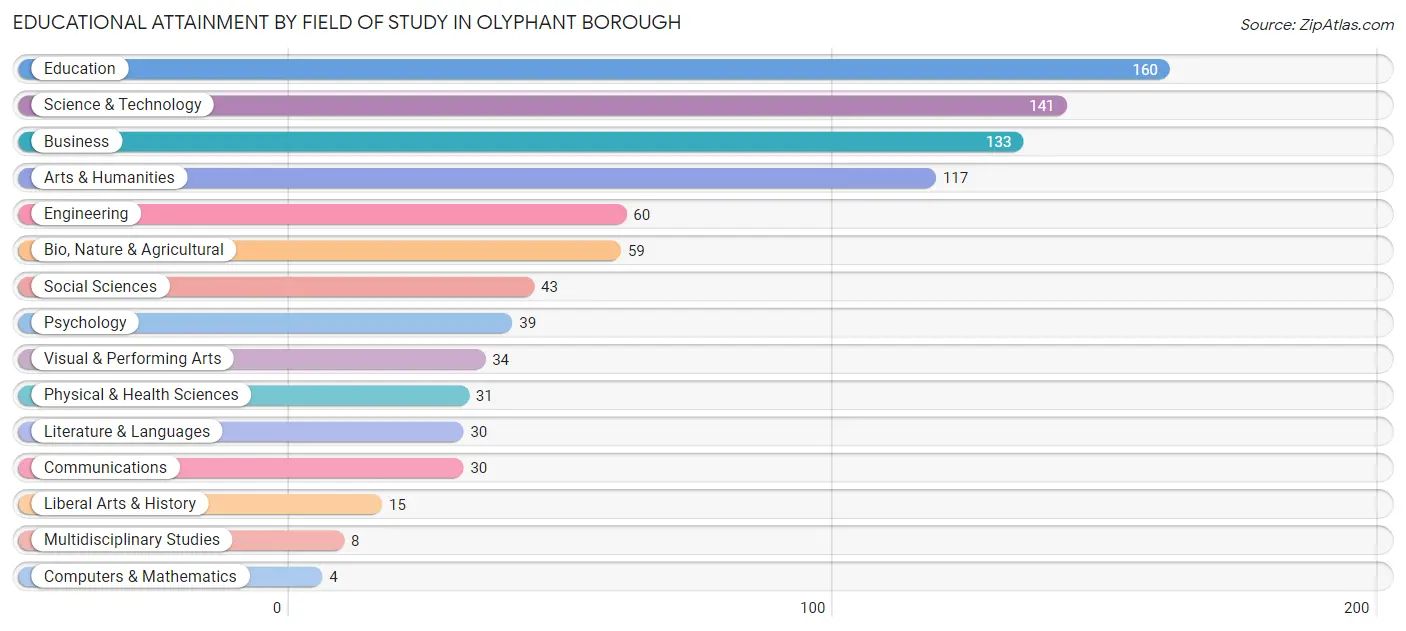
| Field of Study | # Graduates | % Graduates |
| Computers & Mathematics | 4 | 0.4% |
| Bio, Nature & Agricultural | 59 | 6.5% |
| Physical & Health Sciences | 31 | 3.4% |
| Psychology | 39 | 4.3% |
| Social Sciences | 43 | 4.8% |
| Engineering | 60 | 6.6% |
| Multidisciplinary Studies | 8 | 0.9% |
| Science & Technology | 141 | 15.6% |
| Business | 133 | 14.7% |
| Education | 160 | 17.7% |
| Literature & Languages | 30 | 3.3% |
| Liberal Arts & History | 15 | 1.7% |
| Visual & Performing Arts | 34 | 3.8% |
| Communications | 30 | 3.3% |
| Arts & Humanities | 117 | 12.9% |
| Total | 904 | 100.0% |
Transportation & Commute in Olyphant borough
Vehicle Availability by Sex in Olyphant borough
The most prevalent vehicle ownership categories in Olyphant borough are males with 2 vehicles (447, accounting for 34.8%) and females with 2 vehicles (332, making up 34.1%).
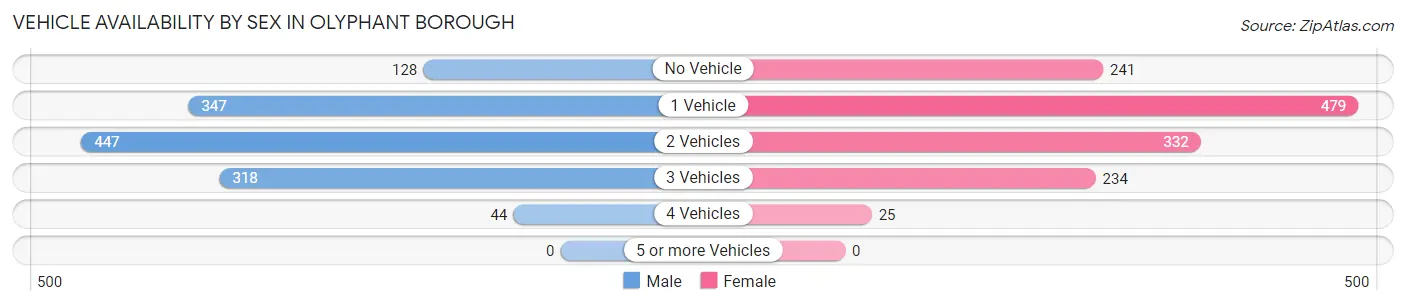
| Vehicles Available | Male | Female |
| No Vehicle | 128 (10.0%) | 241 (18.4%) |
| 1 Vehicle | 347 (27.0%) | 479 (36.5%) |
| 2 Vehicles | 447 (34.8%) | 332 (25.3%) |
| 3 Vehicles | 318 (24.8%) | 234 (17.8%) |
| 4 Vehicles | 44 (3.4%) | 25 (1.9%) |
| 5 or more Vehicles | 0 (0.0%) | 0 (0.0%) |
| Total | 1,284 (100.0%) | 1,311 (100.0%) |
Commute Time in Olyphant borough
The most frequently occuring commute durations in Olyphant borough are 15 to 19 minutes (655 commuters, 28.5%), 20 to 24 minutes (326 commuters, 14.2%), and 25 to 29 minutes (255 commuters, 11.1%).
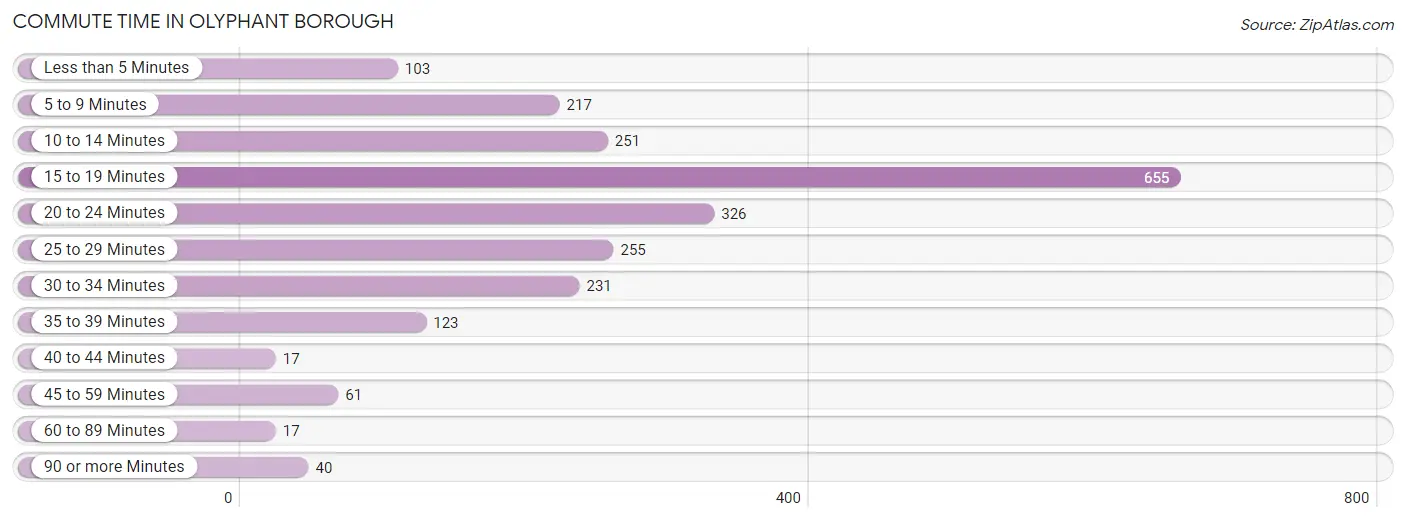
| Commute Time | # Commuters | % Commuters |
| Less than 5 Minutes | 103 | 4.5% |
| 5 to 9 Minutes | 217 | 9.5% |
| 10 to 14 Minutes | 251 | 10.9% |
| 15 to 19 Minutes | 655 | 28.5% |
| 20 to 24 Minutes | 326 | 14.2% |
| 25 to 29 Minutes | 255 | 11.1% |
| 30 to 34 Minutes | 231 | 10.1% |
| 35 to 39 Minutes | 123 | 5.4% |
| 40 to 44 Minutes | 17 | 0.7% |
| 45 to 59 Minutes | 61 | 2.7% |
| 60 to 89 Minutes | 17 | 0.7% |
| 90 or more Minutes | 40 | 1.7% |
Commute Time by Sex in Olyphant borough
The most common commute times in Olyphant borough are 15 to 19 minutes (336 commuters, 26.2%) for males and 15 to 19 minutes (319 commuters, 31.5%) for females.
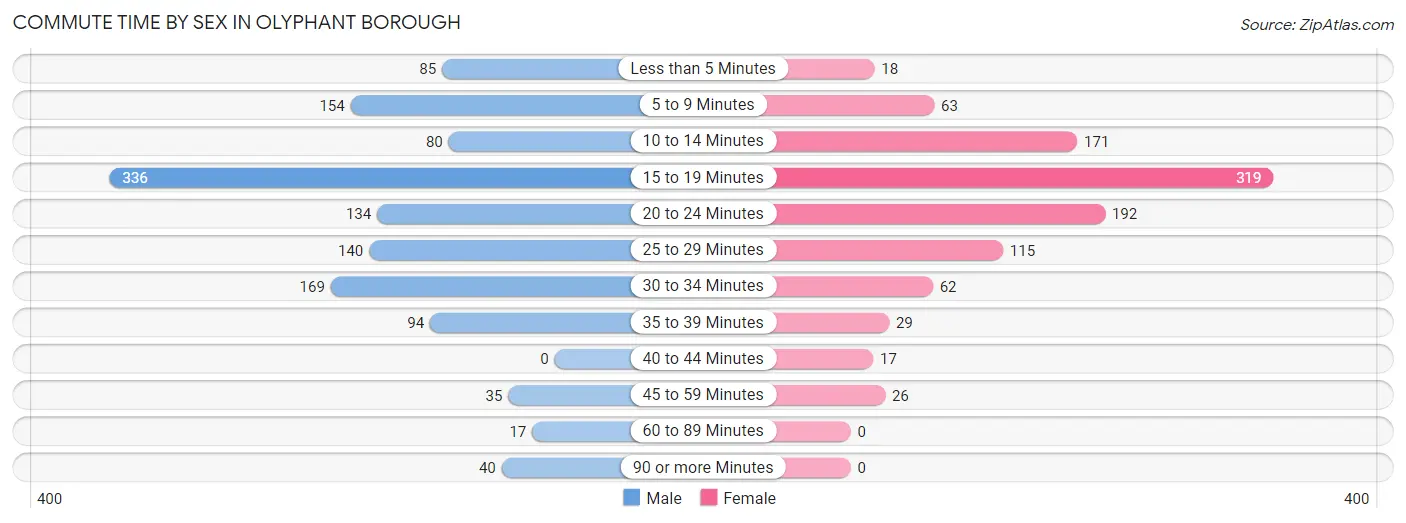
| Commute Time | Male | Female |
| Less than 5 Minutes | 85 (6.6%) | 18 (1.8%) |
| 5 to 9 Minutes | 154 (12.0%) | 63 (6.2%) |
| 10 to 14 Minutes | 80 (6.2%) | 171 (16.9%) |
| 15 to 19 Minutes | 336 (26.2%) | 319 (31.5%) |
| 20 to 24 Minutes | 134 (10.4%) | 192 (19.0%) |
| 25 to 29 Minutes | 140 (10.9%) | 115 (11.4%) |
| 30 to 34 Minutes | 169 (13.2%) | 62 (6.1%) |
| 35 to 39 Minutes | 94 (7.3%) | 29 (2.9%) |
| 40 to 44 Minutes | 0 (0.0%) | 17 (1.7%) |
| 45 to 59 Minutes | 35 (2.7%) | 26 (2.6%) |
| 60 to 89 Minutes | 17 (1.3%) | 0 (0.0%) |
| 90 or more Minutes | 40 (3.1%) | 0 (0.0%) |
Time of Departure to Work by Sex in Olyphant borough
The most frequent times of departure to work in Olyphant borough are 7:00 AM to 7:29 AM (252, 19.6%) for males and 7:30 AM to 7:59 AM (244, 24.1%) for females.
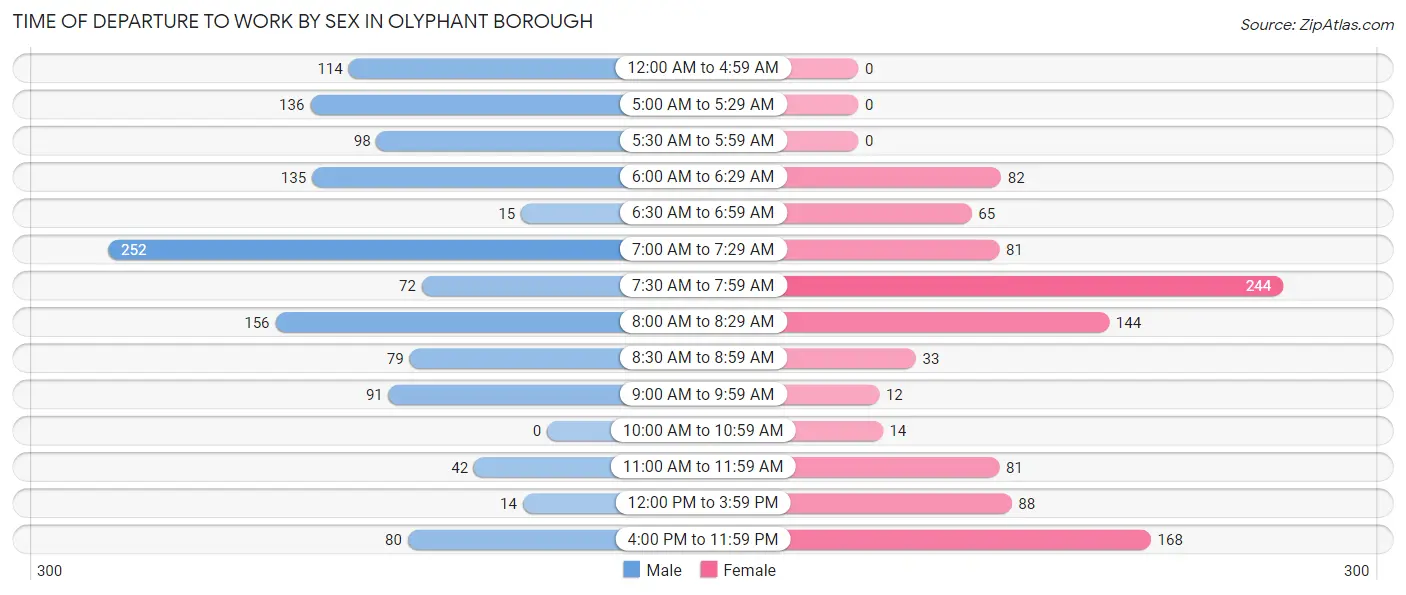
| Time of Departure | Male | Female |
| 12:00 AM to 4:59 AM | 114 (8.9%) | 0 (0.0%) |
| 5:00 AM to 5:29 AM | 136 (10.6%) | 0 (0.0%) |
| 5:30 AM to 5:59 AM | 98 (7.6%) | 0 (0.0%) |
| 6:00 AM to 6:29 AM | 135 (10.5%) | 82 (8.1%) |
| 6:30 AM to 6:59 AM | 15 (1.2%) | 65 (6.4%) |
| 7:00 AM to 7:29 AM | 252 (19.6%) | 81 (8.0%) |
| 7:30 AM to 7:59 AM | 72 (5.6%) | 244 (24.1%) |
| 8:00 AM to 8:29 AM | 156 (12.1%) | 144 (14.2%) |
| 8:30 AM to 8:59 AM | 79 (6.1%) | 33 (3.3%) |
| 9:00 AM to 9:59 AM | 91 (7.1%) | 12 (1.2%) |
| 10:00 AM to 10:59 AM | 0 (0.0%) | 14 (1.4%) |
| 11:00 AM to 11:59 AM | 42 (3.3%) | 81 (8.0%) |
| 12:00 PM to 3:59 PM | 14 (1.1%) | 88 (8.7%) |
| 4:00 PM to 11:59 PM | 80 (6.2%) | 168 (16.6%) |
| Total | 1,284 (100.0%) | 1,012 (100.0%) |
Housing Occupancy in Olyphant borough
Occupancy by Ownership in Olyphant borough
Of the total 2,309 dwellings in Olyphant borough, owner-occupied units account for 1,606 (69.6%), while renter-occupied units make up 703 (30.4%).
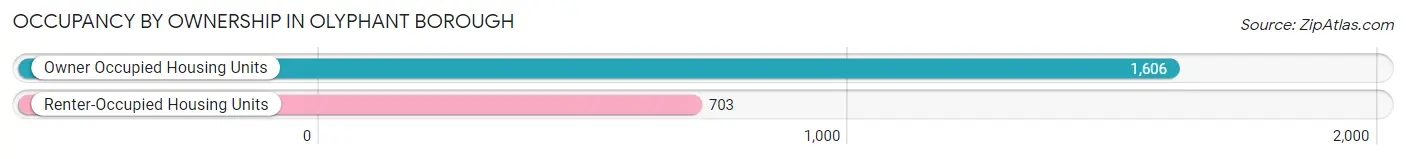
| Occupancy | # Housing Units | % Housing Units |
| Owner Occupied Housing Units | 1,606 | 69.6% |
| Renter-Occupied Housing Units | 703 | 30.4% |
| Total Occupied Housing Units | 2,309 | 100.0% |
Occupancy by Household Size in Olyphant borough
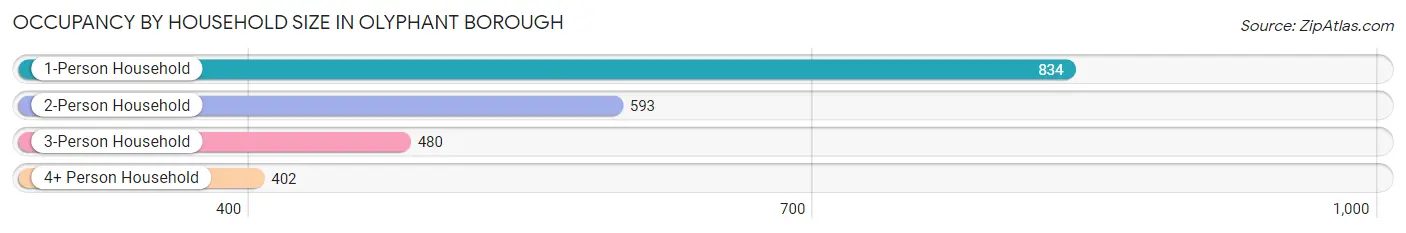
| Household Size | # Housing Units | % Housing Units |
| 1-Person Household | 834 | 36.1% |
| 2-Person Household | 593 | 25.7% |
| 3-Person Household | 480 | 20.8% |
| 4+ Person Household | 402 | 17.4% |
| Total Housing Units | 2,309 | 100.0% |
Occupancy by Ownership by Household Size in Olyphant borough
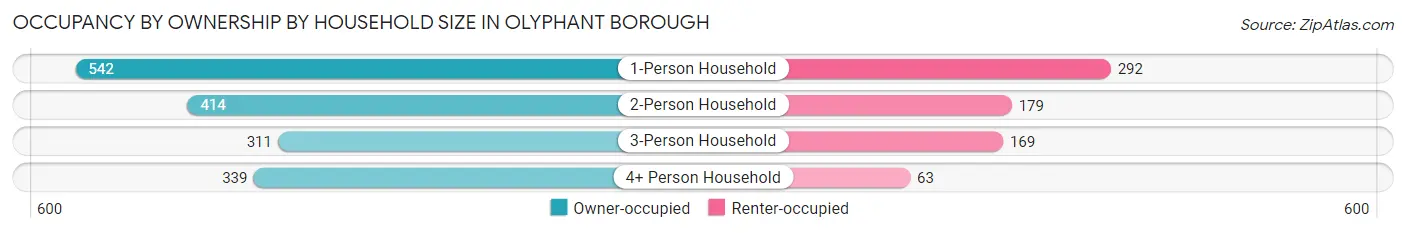
| Household Size | Owner-occupied | Renter-occupied |
| 1-Person Household | 542 (65.0%) | 292 (35.0%) |
| 2-Person Household | 414 (69.8%) | 179 (30.2%) |
| 3-Person Household | 311 (64.8%) | 169 (35.2%) |
| 4+ Person Household | 339 (84.3%) | 63 (15.7%) |
| Total Housing Units | 1,606 (69.6%) | 703 (30.4%) |
Occupancy by Educational Attainment in Olyphant borough
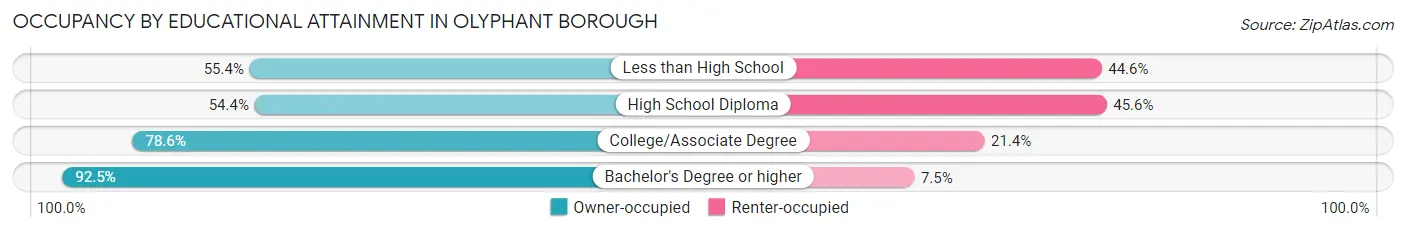
| Household Size | Owner-occupied | Renter-occupied |
| Less than High School | 31 (55.4%) | 25 (44.6%) |
| High School Diploma | 610 (54.4%) | 512 (45.6%) |
| College/Associate Degree | 459 (78.6%) | 125 (21.4%) |
| Bachelor's Degree or higher | 506 (92.5%) | 41 (7.5%) |
Occupancy by Age of Householder in Olyphant borough
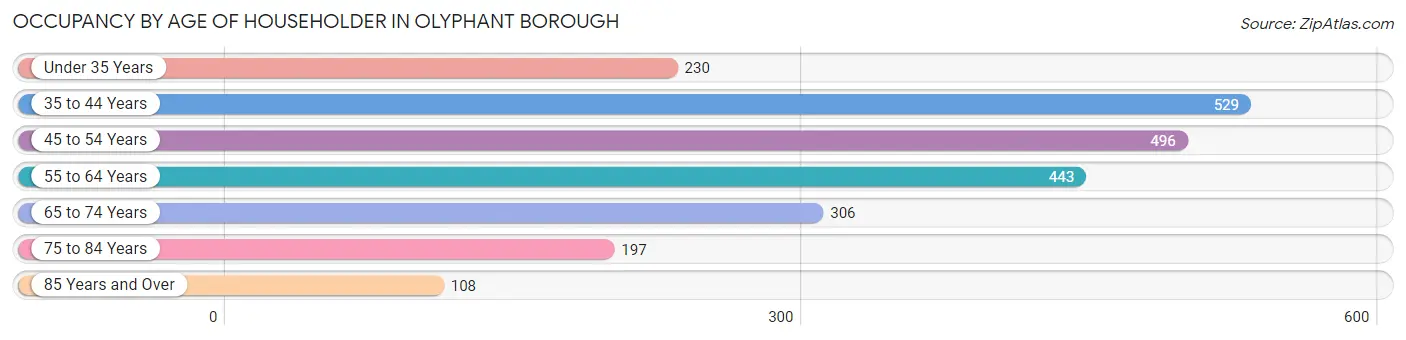
| Age Bracket | # Households | % Households |
| Under 35 Years | 230 | 10.0% |
| 35 to 44 Years | 529 | 22.9% |
| 45 to 54 Years | 496 | 21.5% |
| 55 to 64 Years | 443 | 19.2% |
| 65 to 74 Years | 306 | 13.3% |
| 75 to 84 Years | 197 | 8.5% |
| 85 Years and Over | 108 | 4.7% |
| Total | 2,309 | 100.0% |
Housing Finances in Olyphant borough
Median Income by Occupancy in Olyphant borough
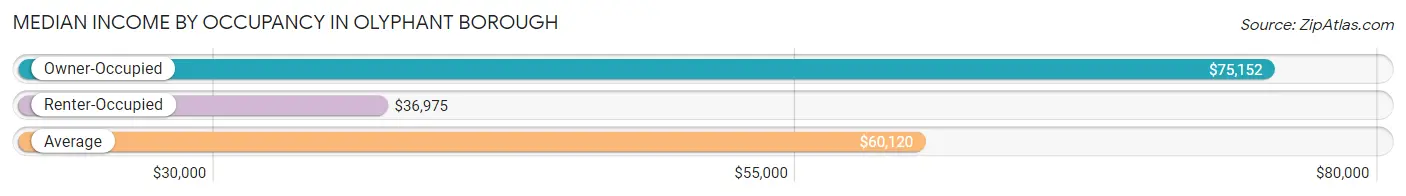
| Occupancy Type | # Households | Median Income |
| Owner-Occupied | 1,606 (69.6%) | $75,152 |
| Renter-Occupied | 703 (30.4%) | $36,975 |
| Average | 2,309 (100.0%) | $60,120 |
Occupancy by Householder Income Bracket in Olyphant borough
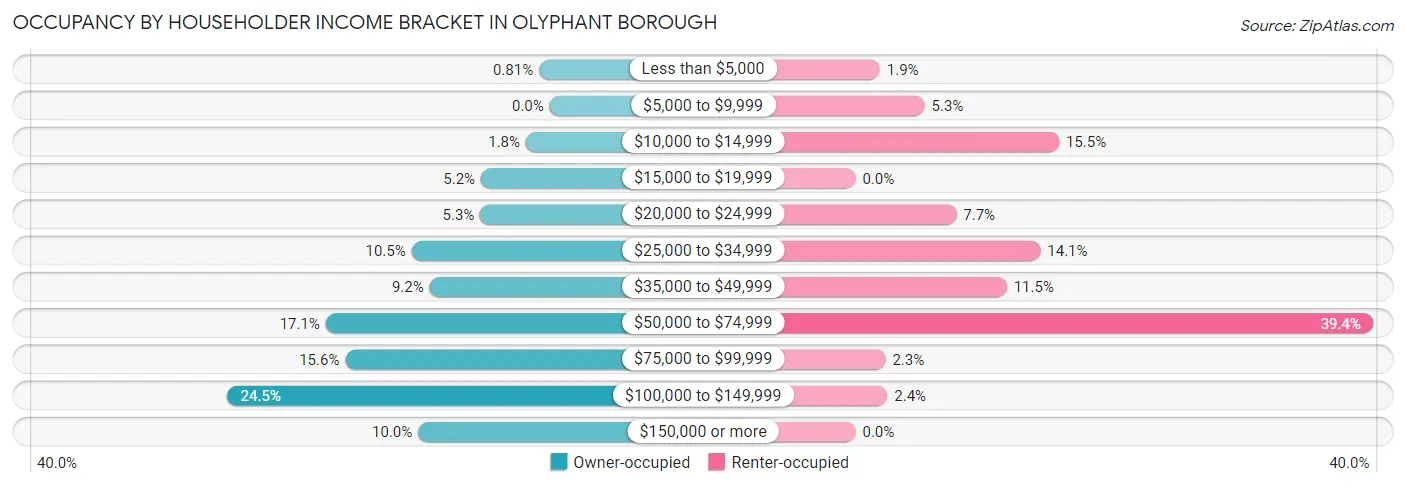
| Income Bracket | Owner-occupied | Renter-occupied |
| Less than $5,000 | 13 (0.8%) | 13 (1.8%) |
| $5,000 to $9,999 | 0 (0.0%) | 37 (5.3%) |
| $10,000 to $14,999 | 29 (1.8%) | 109 (15.5%) |
| $15,000 to $19,999 | 84 (5.2%) | 0 (0.0%) |
| $20,000 to $24,999 | 85 (5.3%) | 54 (7.7%) |
| $25,000 to $34,999 | 169 (10.5%) | 99 (14.1%) |
| $35,000 to $49,999 | 147 (9.1%) | 81 (11.5%) |
| $50,000 to $74,999 | 274 (17.1%) | 277 (39.4%) |
| $75,000 to $99,999 | 250 (15.6%) | 16 (2.3%) |
| $100,000 to $149,999 | 394 (24.5%) | 17 (2.4%) |
| $150,000 or more | 161 (10.0%) | 0 (0.0%) |
| Total | 1,606 (100.0%) | 703 (100.0%) |
Monthly Housing Cost Tiers in Olyphant borough
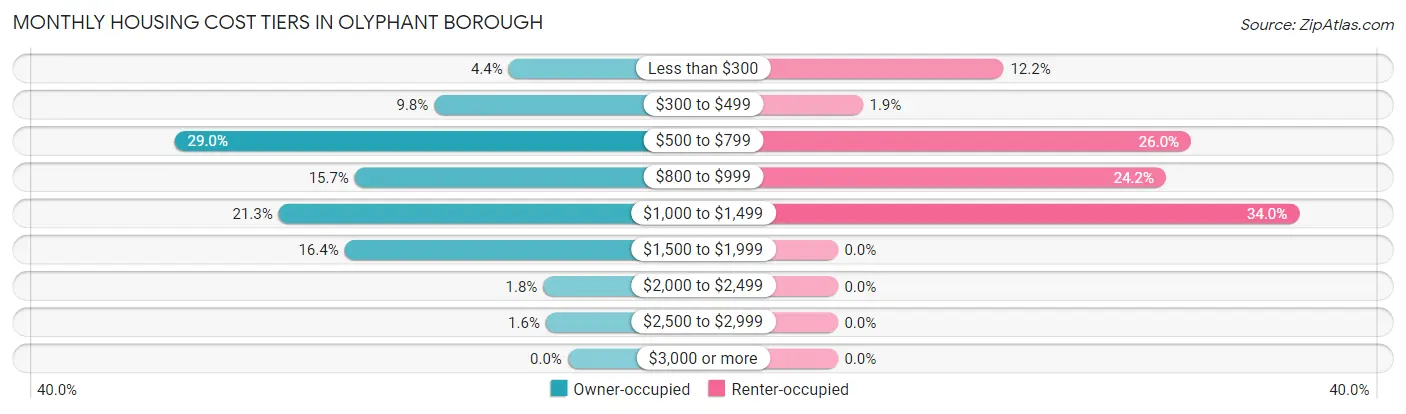
| Monthly Cost | Owner-occupied | Renter-occupied |
| Less than $300 | 70 (4.4%) | 86 (12.2%) |
| $300 to $499 | 158 (9.8%) | 13 (1.8%) |
| $500 to $799 | 465 (28.9%) | 183 (26.0%) |
| $800 to $999 | 252 (15.7%) | 170 (24.2%) |
| $1,000 to $1,499 | 342 (21.3%) | 239 (34.0%) |
| $1,500 to $1,999 | 264 (16.4%) | 0 (0.0%) |
| $2,000 to $2,499 | 29 (1.8%) | 0 (0.0%) |
| $2,500 to $2,999 | 26 (1.6%) | 0 (0.0%) |
| $3,000 or more | 0 (0.0%) | 0 (0.0%) |
| Total | 1,606 (100.0%) | 703 (100.0%) |
Physical Housing Characteristics in Olyphant borough
Housing Structures in Olyphant borough
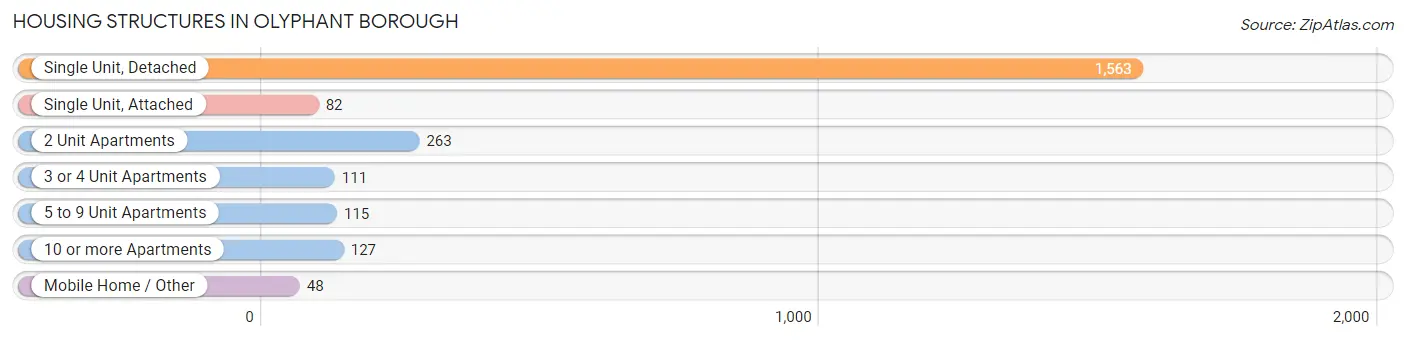
| Structure Type | # Housing Units | % Housing Units |
| Single Unit, Detached | 1,563 | 67.7% |
| Single Unit, Attached | 82 | 3.5% |
| 2 Unit Apartments | 263 | 11.4% |
| 3 or 4 Unit Apartments | 111 | 4.8% |
| 5 to 9 Unit Apartments | 115 | 5.0% |
| 10 or more Apartments | 127 | 5.5% |
| Mobile Home / Other | 48 | 2.1% |
| Total | 2,309 | 100.0% |
Housing Structures by Occupancy in Olyphant borough
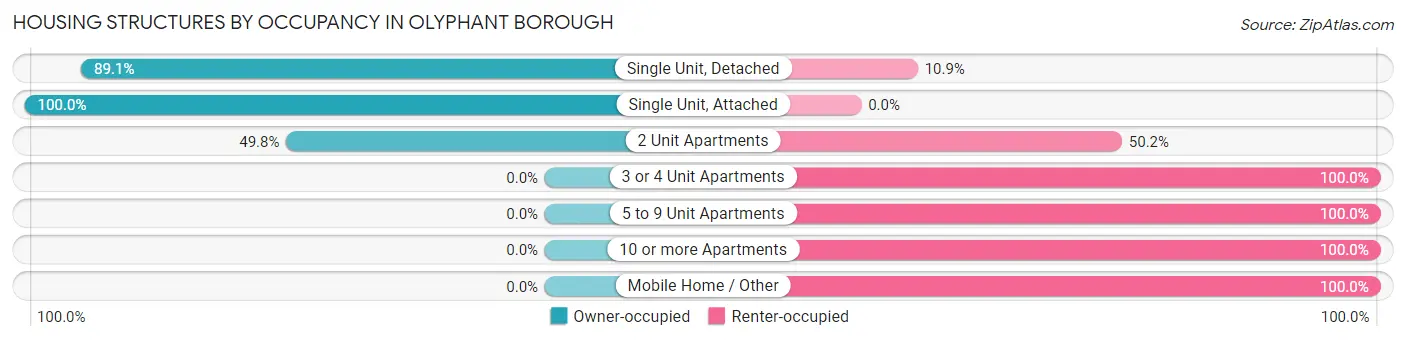
| Structure Type | Owner-occupied | Renter-occupied |
| Single Unit, Detached | 1,393 (89.1%) | 170 (10.9%) |
| Single Unit, Attached | 82 (100.0%) | 0 (0.0%) |
| 2 Unit Apartments | 131 (49.8%) | 132 (50.2%) |
| 3 or 4 Unit Apartments | 0 (0.0%) | 111 (100.0%) |
| 5 to 9 Unit Apartments | 0 (0.0%) | 115 (100.0%) |
| 10 or more Apartments | 0 (0.0%) | 127 (100.0%) |
| Mobile Home / Other | 0 (0.0%) | 48 (100.0%) |
| Total | 1,606 (69.6%) | 703 (30.4%) |
Housing Structures by Number of Rooms in Olyphant borough
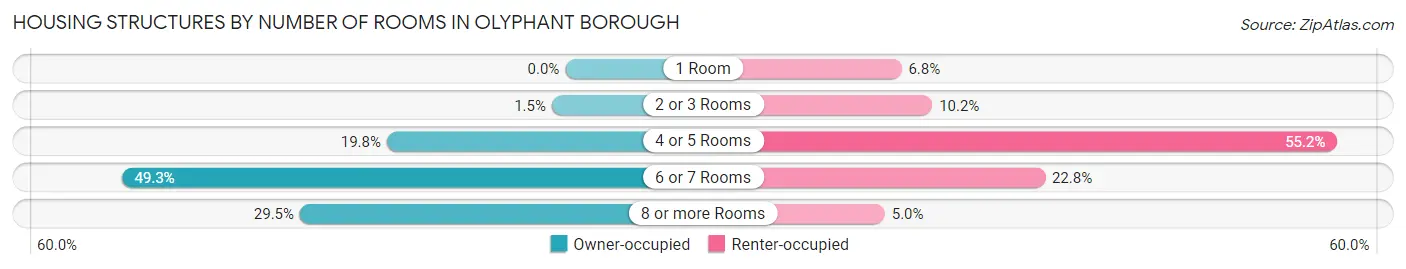
| Number of Rooms | Owner-occupied | Renter-occupied |
| 1 Room | 0 (0.0%) | 48 (6.8%) |
| 2 or 3 Rooms | 24 (1.5%) | 72 (10.2%) |
| 4 or 5 Rooms | 318 (19.8%) | 388 (55.2%) |
| 6 or 7 Rooms | 791 (49.2%) | 160 (22.8%) |
| 8 or more Rooms | 473 (29.4%) | 35 (5.0%) |
| Total | 1,606 (100.0%) | 703 (100.0%) |
Housing Structure by Heating Type in Olyphant borough
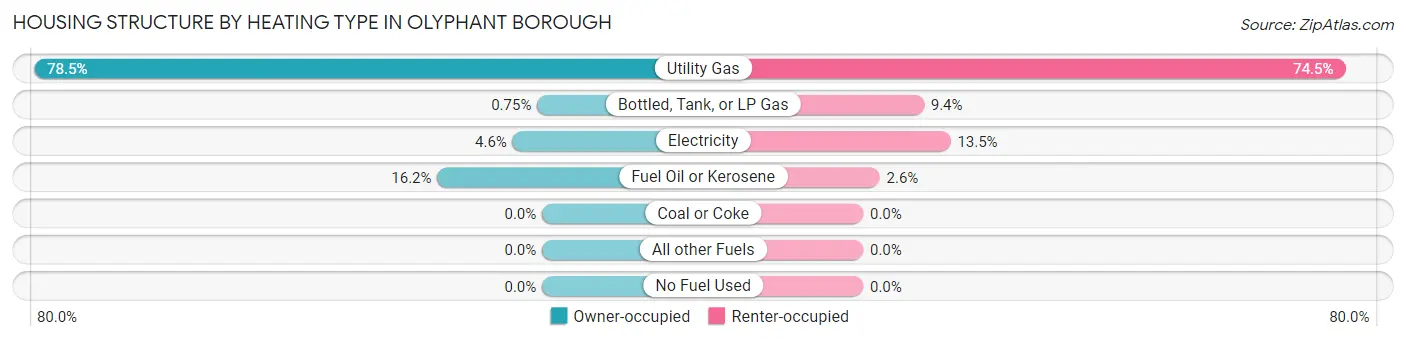
| Heating Type | Owner-occupied | Renter-occupied |
| Utility Gas | 1,261 (78.5%) | 524 (74.5%) |
| Bottled, Tank, or LP Gas | 12 (0.7%) | 66 (9.4%) |
| Electricity | 73 (4.5%) | 95 (13.5%) |
| Fuel Oil or Kerosene | 260 (16.2%) | 18 (2.6%) |
| Coal or Coke | 0 (0.0%) | 0 (0.0%) |
| All other Fuels | 0 (0.0%) | 0 (0.0%) |
| No Fuel Used | 0 (0.0%) | 0 (0.0%) |
| Total | 1,606 (100.0%) | 703 (100.0%) |
Household Vehicle Usage in Olyphant borough
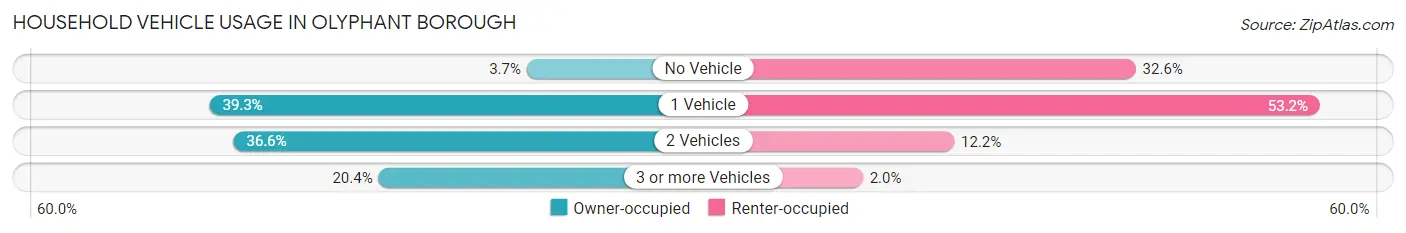
| Vehicles per Household | Owner-occupied | Renter-occupied |
| No Vehicle | 60 (3.7%) | 229 (32.6%) |
| 1 Vehicle | 631 (39.3%) | 374 (53.2%) |
| 2 Vehicles | 588 (36.6%) | 86 (12.2%) |
| 3 or more Vehicles | 327 (20.4%) | 14 (2.0%) |
| Total | 1,606 (100.0%) | 703 (100.0%) |
Real Estate & Mortgages in Olyphant borough
Real Estate and Mortgage Overview in Olyphant borough
| Characteristic | Without Mortgage | With Mortgage |
| Housing Units | 751 | 855 |
| Median Property Value | $135,200 | $130,400 |
| Median Household Income | $59,221 | $76 |
| Monthly Housing Costs | $581 | $0 |
| Real Estate Taxes | $1,979 | $0 |
Property Value by Mortgage Status in Olyphant borough
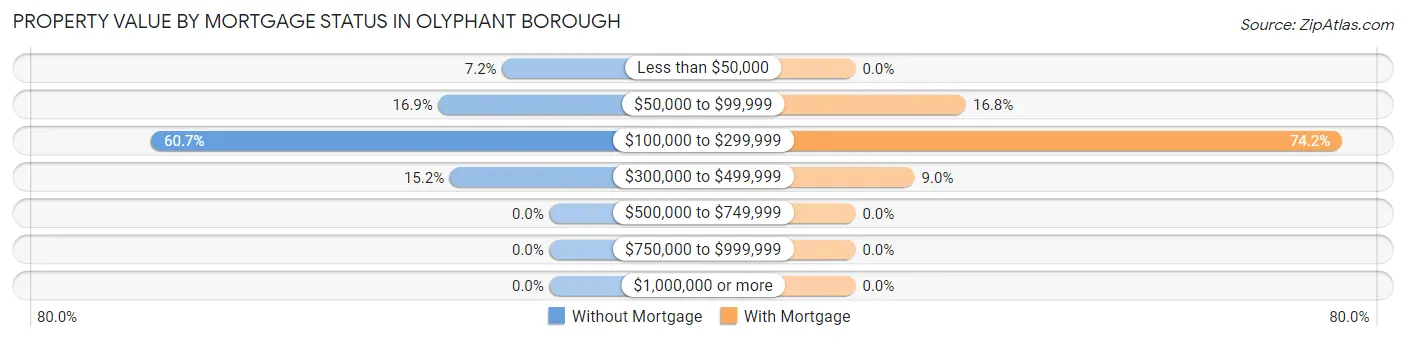
| Property Value | Without Mortgage | With Mortgage |
| Less than $50,000 | 54 (7.2%) | 0 (0.0%) |
| $50,000 to $99,999 | 127 (16.9%) | 144 (16.8%) |
| $100,000 to $299,999 | 456 (60.7%) | 634 (74.2%) |
| $300,000 to $499,999 | 114 (15.2%) | 77 (9.0%) |
| $500,000 to $749,999 | 0 (0.0%) | 0 (0.0%) |
| $750,000 to $999,999 | 0 (0.0%) | 0 (0.0%) |
| $1,000,000 or more | 0 (0.0%) | 0 (0.0%) |
| Total | 751 (100.0%) | 855 (100.0%) |
Household Income by Mortgage Status in Olyphant borough
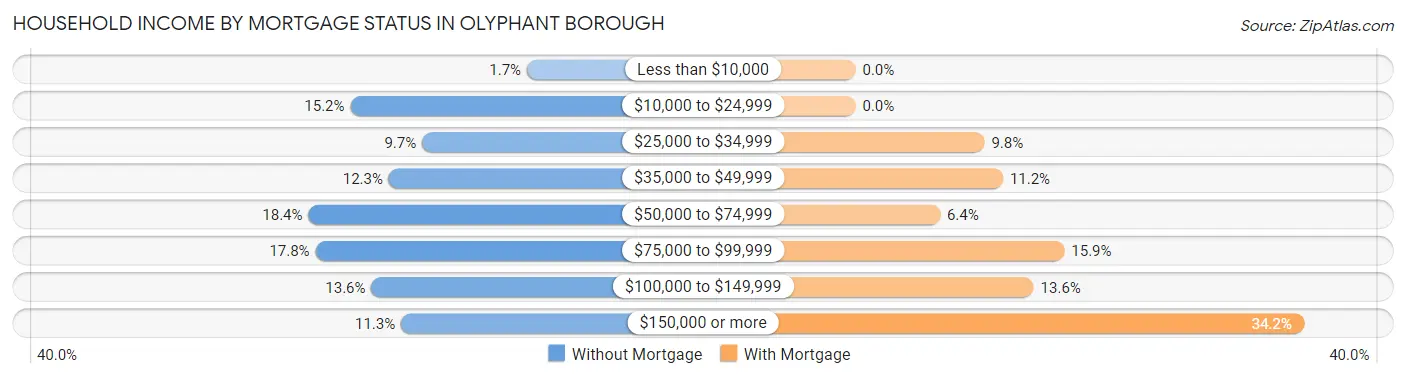
| Household Income | Without Mortgage | With Mortgage |
| Less than $10,000 | 13 (1.7%) | 0 (0.0%) |
| $10,000 to $24,999 | 114 (15.2%) | 0 (0.0%) |
| $25,000 to $34,999 | 73 (9.7%) | 84 (9.8%) |
| $35,000 to $49,999 | 92 (12.2%) | 96 (11.2%) |
| $50,000 to $74,999 | 138 (18.4%) | 55 (6.4%) |
| $75,000 to $99,999 | 134 (17.8%) | 136 (15.9%) |
| $100,000 to $149,999 | 102 (13.6%) | 116 (13.6%) |
| $150,000 or more | 85 (11.3%) | 292 (34.2%) |
| Total | 751 (100.0%) | 855 (100.0%) |
Property Value to Household Income Ratio in Olyphant borough
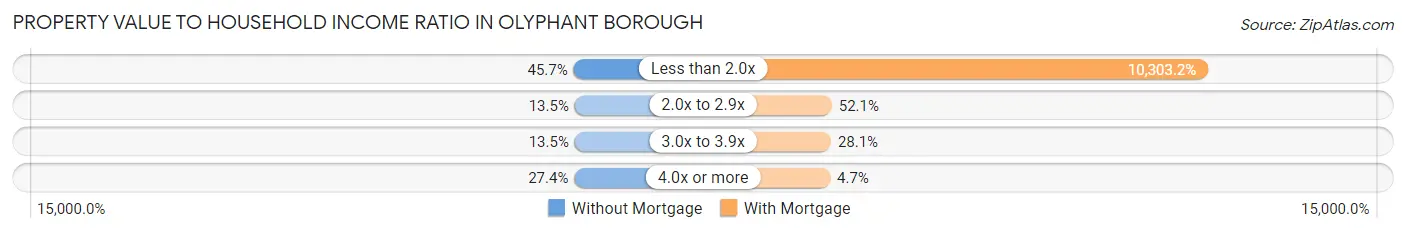
| Value-to-Income Ratio | Without Mortgage | With Mortgage |
| Less than 2.0x | 343 (45.7%) | 88,092 (10,303.2%) |
| 2.0x to 2.9x | 101 (13.5%) | 445 (52.0%) |
| 3.0x to 3.9x | 101 (13.5%) | 240 (28.1%) |
| 4.0x or more | 206 (27.4%) | 40 (4.7%) |
| Total | 751 (100.0%) | 855 (100.0%) |
Real Estate Taxes by Mortgage Status in Olyphant borough
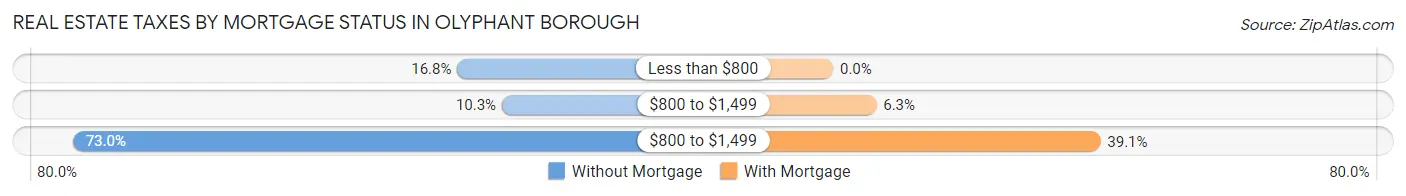
| Property Taxes | Without Mortgage | With Mortgage |
| Less than $800 | 126 (16.8%) | 0 (0.0%) |
| $800 to $1,499 | 77 (10.2%) | 54 (6.3%) |
| $800 to $1,499 | 548 (73.0%) | 334 (39.1%) |
| Total | 751 (100.0%) | 855 (100.0%) |
Health & Disability in Olyphant borough
Health Insurance Coverage by Age in Olyphant borough
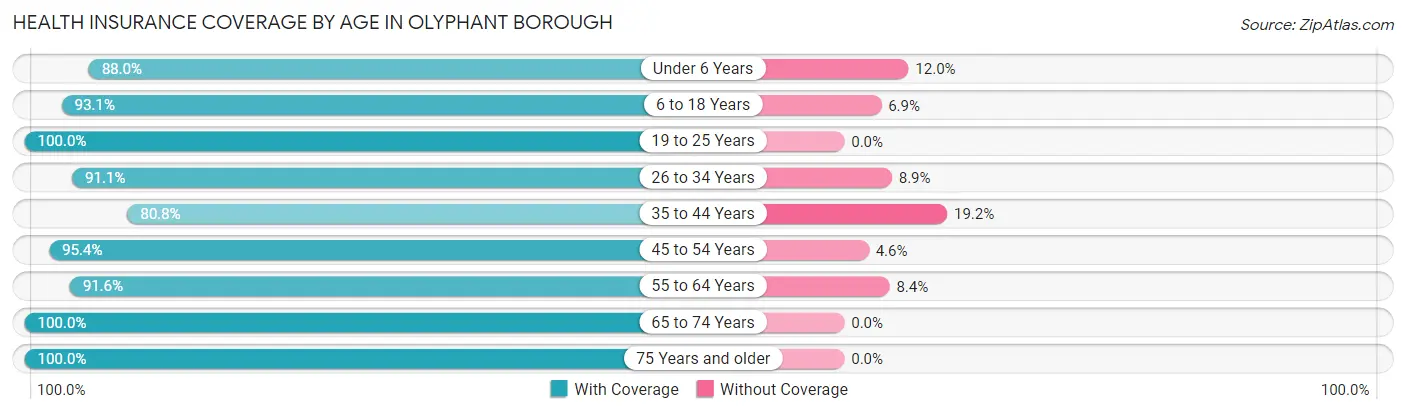
| Age Bracket | With Coverage | Without Coverage |
| Under 6 Years | 346 (88.0%) | 47 (12.0%) |
| 6 to 18 Years | 838 (93.1%) | 62 (6.9%) |
| 19 to 25 Years | 342 (100.0%) | 0 (0.0%) |
| 26 to 34 Years | 607 (91.1%) | 59 (8.9%) |
| 35 to 44 Years | 578 (80.8%) | 137 (19.2%) |
| 45 to 54 Years | 795 (95.4%) | 38 (4.6%) |
| 55 to 64 Years | 532 (91.6%) | 49 (8.4%) |
| 65 to 74 Years | 480 (100.0%) | 0 (0.0%) |
| 75 Years and older | 462 (100.0%) | 0 (0.0%) |
| Total | 4,980 (92.7%) | 392 (7.3%) |
Health Insurance Coverage by Citizenship Status in Olyphant borough
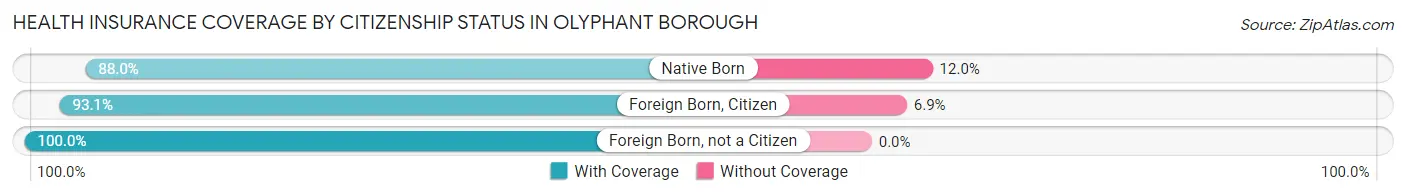
| Citizenship Status | With Coverage | Without Coverage |
| Native Born | 346 (88.0%) | 47 (12.0%) |
| Foreign Born, Citizen | 838 (93.1%) | 62 (6.9%) |
| Foreign Born, not a Citizen | 342 (100.0%) | 0 (0.0%) |
Health Insurance Coverage by Household Income in Olyphant borough
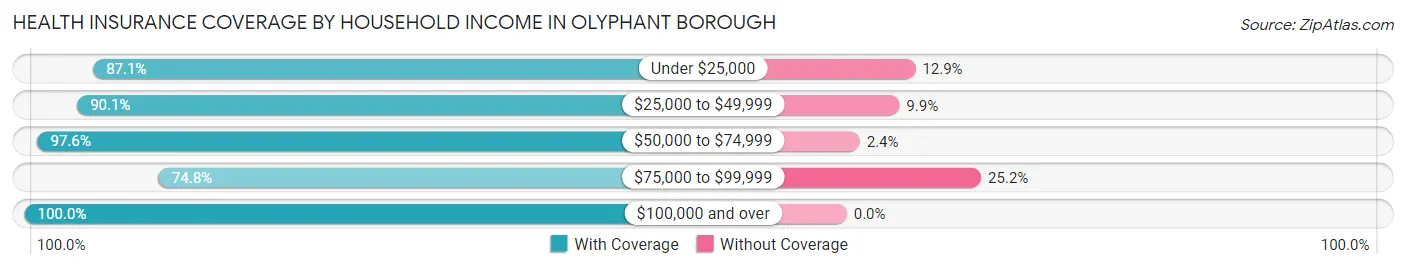
| Household Income | With Coverage | Without Coverage |
| Under $25,000 | 481 (87.1%) | 71 (12.9%) |
| $25,000 to $49,999 | 905 (90.1%) | 99 (9.9%) |
| $50,000 to $74,999 | 1,443 (97.6%) | 36 (2.4%) |
| $75,000 to $99,999 | 553 (74.8%) | 186 (25.2%) |
| $100,000 and over | 1,590 (100.0%) | 0 (0.0%) |
Public vs Private Health Insurance Coverage by Age in Olyphant borough
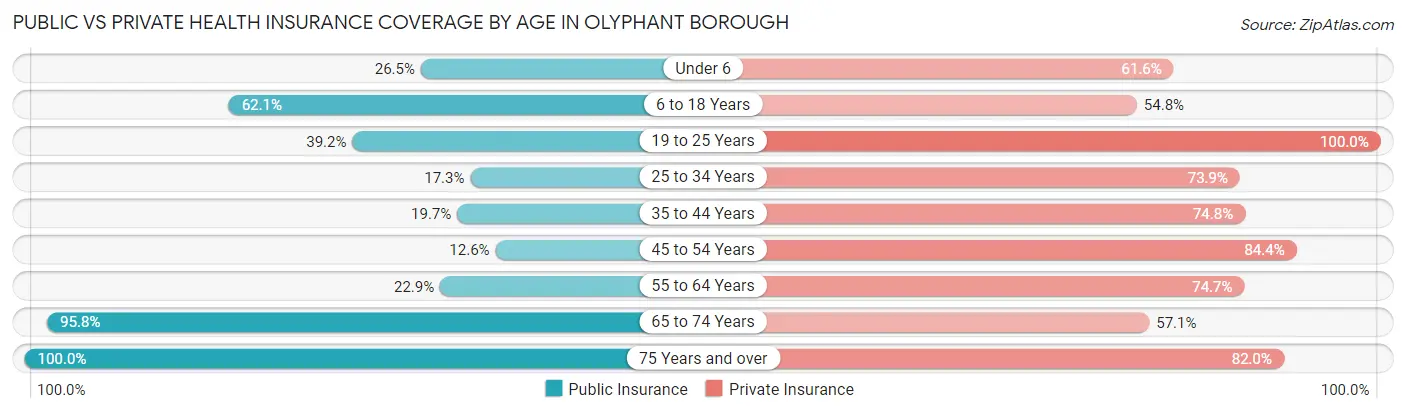
| Age Bracket | Public Insurance | Private Insurance |
| Under 6 | 104 (26.5%) | 242 (61.6%) |
| 6 to 18 Years | 559 (62.1%) | 493 (54.8%) |
| 19 to 25 Years | 134 (39.2%) | 342 (100.0%) |
| 25 to 34 Years | 115 (17.3%) | 492 (73.9%) |
| 35 to 44 Years | 141 (19.7%) | 535 (74.8%) |
| 45 to 54 Years | 105 (12.6%) | 703 (84.4%) |
| 55 to 64 Years | 133 (22.9%) | 434 (74.7%) |
| 65 to 74 Years | 460 (95.8%) | 274 (57.1%) |
| 75 Years and over | 462 (100.0%) | 379 (82.0%) |
| Total | 2,213 (41.2%) | 3,894 (72.5%) |
Disability Status by Sex by Age in Olyphant borough
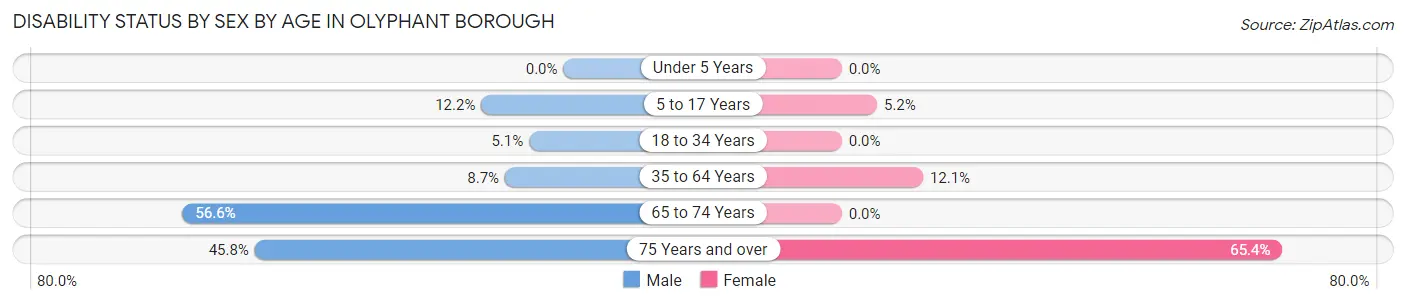
| Age Bracket | Male | Female |
| Under 5 Years | 0 (0.0%) | 0 (0.0%) |
| 5 to 17 Years | 78 (12.2%) | 16 (5.2%) |
| 18 to 34 Years | 22 (5.1%) | 0 (0.0%) |
| 35 to 64 Years | 91 (8.7%) | 130 (12.0%) |
| 65 to 74 Years | 125 (56.6%) | 0 (0.0%) |
| 75 Years and over | 66 (45.8%) | 208 (65.4%) |
Disability Class by Sex by Age in Olyphant borough
Disability Class: Hearing Difficulty
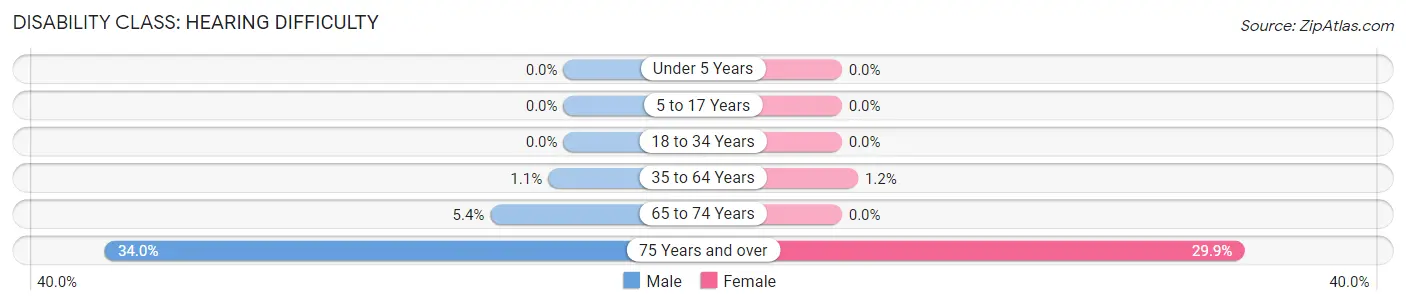
| Age Bracket | Male | Female |
| Under 5 Years | 0 (0.0%) | 0 (0.0%) |
| 5 to 17 Years | 0 (0.0%) | 0 (0.0%) |
| 18 to 34 Years | 0 (0.0%) | 0 (0.0%) |
| 35 to 64 Years | 12 (1.1%) | 13 (1.2%) |
| 65 to 74 Years | 12 (5.4%) | 0 (0.0%) |
| 75 Years and over | 49 (34.0%) | 95 (29.9%) |
Disability Class: Vision Difficulty
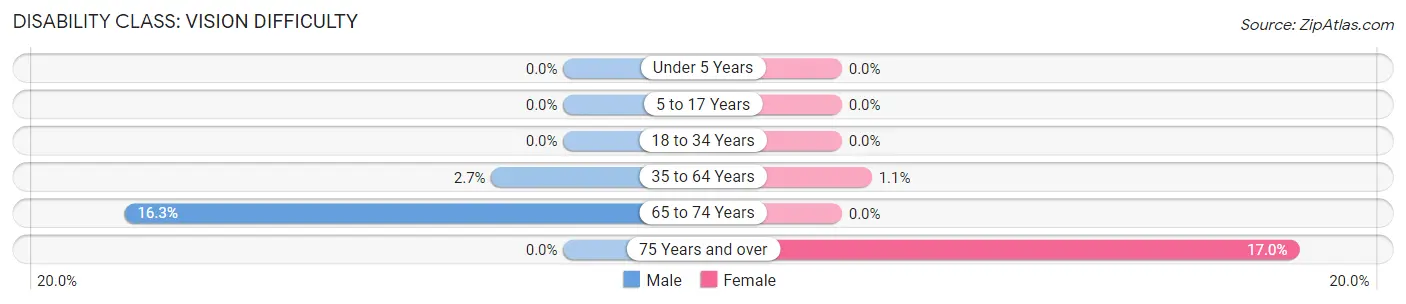
| Age Bracket | Male | Female |
| Under 5 Years | 0 (0.0%) | 0 (0.0%) |
| 5 to 17 Years | 0 (0.0%) | 0 (0.0%) |
| 18 to 34 Years | 0 (0.0%) | 0 (0.0%) |
| 35 to 64 Years | 28 (2.7%) | 12 (1.1%) |
| 65 to 74 Years | 36 (16.3%) | 0 (0.0%) |
| 75 Years and over | 0 (0.0%) | 54 (17.0%) |
Disability Class: Cognitive Difficulty
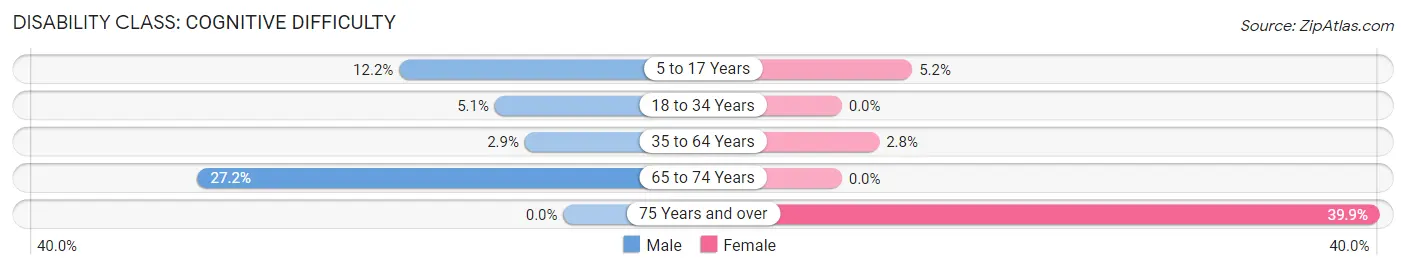
| Age Bracket | Male | Female |
| 5 to 17 Years | 78 (12.2%) | 16 (5.2%) |
| 18 to 34 Years | 22 (5.1%) | 0 (0.0%) |
| 35 to 64 Years | 30 (2.9%) | 30 (2.8%) |
| 65 to 74 Years | 60 (27.2%) | 0 (0.0%) |
| 75 Years and over | 0 (0.0%) | 127 (39.9%) |
Disability Class: Ambulatory Difficulty
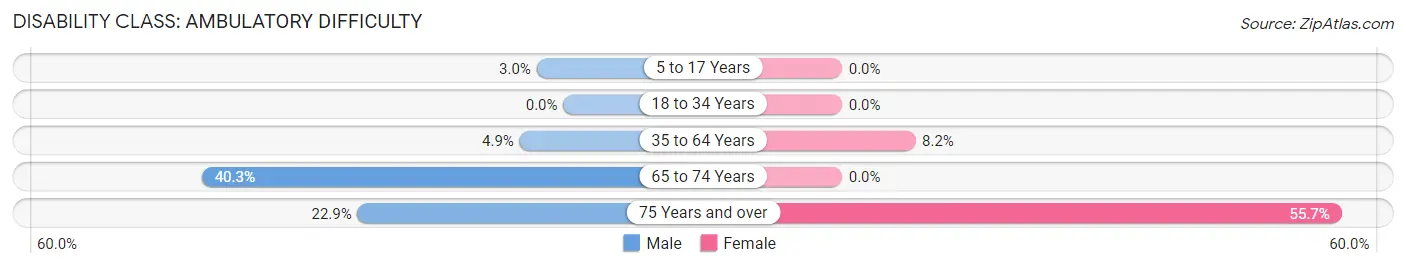
| Age Bracket | Male | Female |
| 5 to 17 Years | 19 (3.0%) | 0 (0.0%) |
| 18 to 34 Years | 0 (0.0%) | 0 (0.0%) |
| 35 to 64 Years | 51 (4.9%) | 88 (8.2%) |
| 65 to 74 Years | 89 (40.3%) | 0 (0.0%) |
| 75 Years and over | 33 (22.9%) | 177 (55.7%) |
Disability Class: Self-Care Difficulty
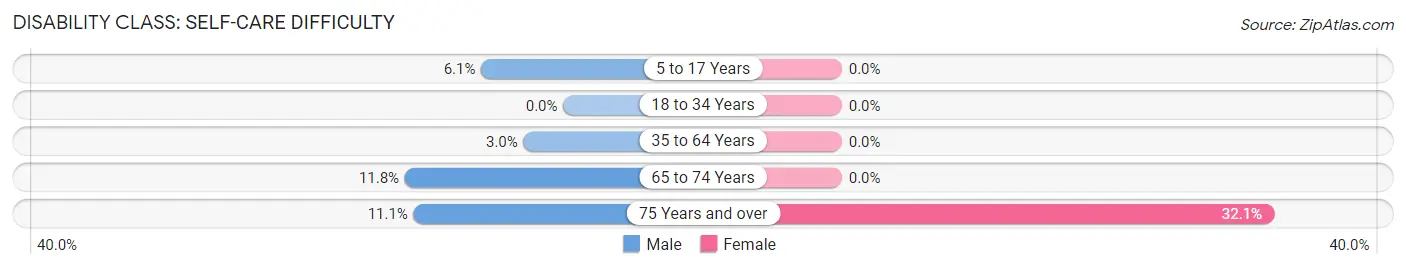
| Age Bracket | Male | Female |
| 5 to 17 Years | 39 (6.1%) | 0 (0.0%) |
| 18 to 34 Years | 0 (0.0%) | 0 (0.0%) |
| 35 to 64 Years | 31 (2.9%) | 0 (0.0%) |
| 65 to 74 Years | 26 (11.8%) | 0 (0.0%) |
| 75 Years and over | 16 (11.1%) | 102 (32.1%) |
Technology Access in Olyphant borough
Computing Device Access in Olyphant borough
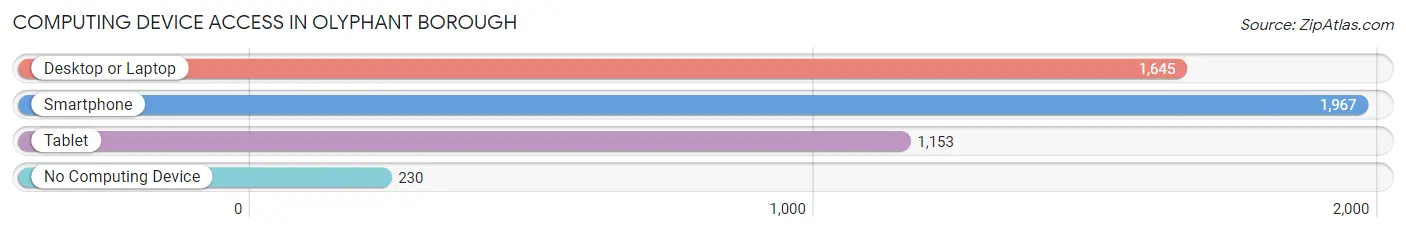
| Device Type | # Households | % Households |
| Desktop or Laptop | 1,645 | 71.2% |
| Smartphone | 1,967 | 85.2% |
| Tablet | 1,153 | 49.9% |
| No Computing Device | 230 | 10.0% |
| Total | 2,309 | 100.0% |
Internet Access in Olyphant borough
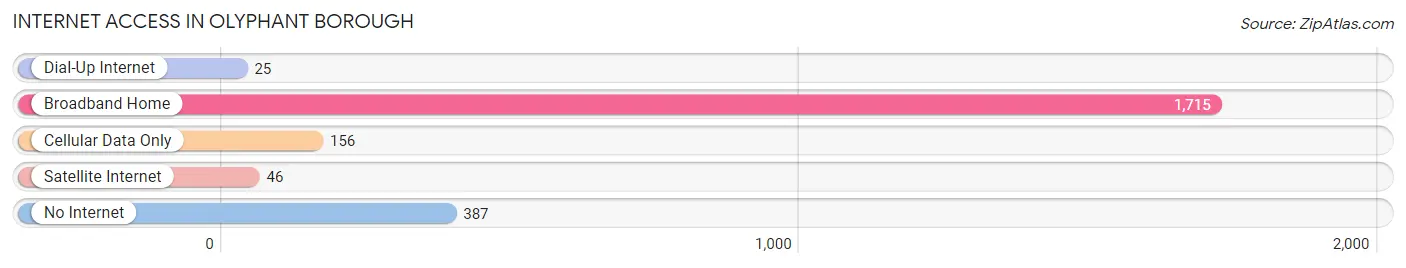
| Internet Type | # Households | % Households |
| Dial-Up Internet | 25 | 1.1% |
| Broadband Home | 1,715 | 74.3% |
| Cellular Data Only | 156 | 6.8% |
| Satellite Internet | 46 | 2.0% |
| No Internet | 387 | 16.8% |
| Total | 2,309 | 100.0% |
Olyphant borough Summary
Olyphant Borough is a small borough located in Lackawanna County, Pennsylvania. It is situated in the heart of the Pocono Mountains and is home to a population of approximately 4,000 people. The borough is bordered by the cities of Scranton and Carbondale, as well as the townships of Blakely, Dickson City, and Throop.
History
Olyphant Borough was founded in 1851 by a group of settlers from Connecticut. The settlers named the borough after the Greek god Apollo, who was known as Olyphant in the local Native American language. The borough was officially incorporated in 1872.
In the late 19th century, Olyphant Borough was a major coal mining center. The coal industry was the primary source of employment for the borough’s residents. The coal industry declined in the early 20th century, and the borough’s economy shifted to manufacturing. The borough’s population peaked in the 1950s, but has since declined due to the decline of the manufacturing industry.
Geography
Olyphant Borough is located in the Pocono Mountains region of northeastern Pennsylvania. The borough is situated in the Lackawanna Valley, which is surrounded by the Pocono Mountains. The borough is located approximately 10 miles north of Scranton and 20 miles south of Carbondale.
The borough is situated at an elevation of 1,400 feet above sea level. The borough is located in the Susquehanna River watershed and is bordered by the Lackawanna River to the east. The borough is located in a temperate climate zone and experiences four distinct seasons.
Economy
The economy of Olyphant Borough is largely based on manufacturing and retail. The borough is home to several manufacturing companies, including a paper mill, a plastics factory, and a metal fabrication plant. The borough is also home to several retail stores, including a grocery store, a hardware store, and a pharmacy.
The borough is also home to several small businesses, including restaurants, bars, and other service-oriented businesses. The borough is also home to a number of professional services, such as lawyers, accountants, and doctors.
Demographics
As of the 2010 census, the population of Olyphant Borough was 4,000. The population is predominantly white (94.2%), with small percentages of African American (2.2%), Asian (1.2%), and Hispanic (1.4%) residents. The median household income in the borough is $41,000, and the median age is 43.
The borough is home to a number of churches, including Catholic, Protestant, and non-denominational congregations. The borough is also home to a number of public schools, including elementary, middle, and high schools.
Conclusion
Olyphant Borough is a small borough located in Lackawanna County, Pennsylvania. It is situated in the heart of the Pocono Mountains and is home to a population of approximately 4,000 people. The borough’s economy is largely based on manufacturing and retail, and the population is predominantly white. The borough is home to a number of churches and public schools, and is a popular destination for outdoor recreation.
Common Questions
What is Per Capita Income in Olyphant borough?
Per Capita income in Olyphant borough is $30,528.
What is the Median Family Income in Olyphant borough?
Median Family Income in Olyphant borough is $62,111.
What is the Median Household income in Olyphant borough?
Median Household Income in Olyphant borough is $60,120.
What is Income or Wage Gap in Olyphant borough?
Income or Wage Gap in Olyphant borough is 29.6%.
Women in Olyphant borough earn 70.4 cents for every dollar earned by a man.
What is Inequality or Gini Index in Olyphant borough?
Inequality or Gini Index in Olyphant borough is 0.38.
What is the Total Population of Olyphant borough?
Total Population of Olyphant borough is 5,372.
What is the Total Male Population of Olyphant borough?
Total Male Population of Olyphant borough is 2,753.
What is the Total Female Population of Olyphant borough?
Total Female Population of Olyphant borough is 2,619.
What is the Ratio of Males per 100 Females in Olyphant borough?
There are 105.12 Males per 100 Females in Olyphant borough.
What is the Ratio of Females per 100 Males in Olyphant borough?
There are 95.13 Females per 100 Males in Olyphant borough.
What is the Median Population Age in Olyphant borough?
Median Population Age in Olyphant borough is 40.2 Years.
What is the Average Family Size in Olyphant borough
Average Family Size in Olyphant borough is 3.0 People.
What is the Average Household Size in Olyphant borough
Average Household Size in Olyphant borough is 2.3 People.
How Large is the Labor Force in Olyphant borough?
There are 2,742 People in the Labor Forcein in Olyphant borough.
What is the Percentage of People in the Labor Force in Olyphant borough?
63.7% of People are in the Labor Force in Olyphant borough.
What is the Unemployment Rate in Olyphant borough?
Unemployment Rate in Olyphant borough is 3.9%.