Plymouth borough, PA Map & Demographics
Plymouth borough Overview
$25,228
PER CAPITA INCOME
$59,000
AVG FAMILY INCOME
$46,858
AVG HOUSEHOLD INCOME
24.3%
WAGE / INCOME GAP [ % ]
75.7¢/ $1
WAGE / INCOME GAP [ $ ]
$14,379
FAMILY INCOME DEFICIT
0.41
INEQUALITY / GINI INDEX
5,771
TOTAL POPULATION
2,980
MALE POPULATION
2,791
FEMALE POPULATION
106.77
MALES / 100 FEMALES
93.66
FEMALES / 100 MALES
40.4
MEDIAN AGE
3.3
AVG FAMILY SIZE
2.4
AVG HOUSEHOLD SIZE
2,852
LABOR FORCE [ PEOPLE ]
63.9%
PERCENT IN LABOR FORCE
4.3%
UNEMPLOYMENT RATE
Income in Plymouth borough
Income Overview in Plymouth borough
Per Capita Income in Plymouth borough is $25,228, while median incomes of families and households are $59,000 and $46,858 respectively.
| Characteristic | Number | Measure |
| Per Capita Income | 5,771 | $25,228 |
| Median Family Income | 1,284 | $59,000 |
| Mean Family Income | 1,284 | $71,797 |
| Median Household Income | 2,405 | $46,858 |
| Mean Household Income | 2,405 | $59,819 |
| Income Deficit | 1,284 | $14,379 |
| Wage / Income Gap (%) | 5,771 | 24.34% |
| Wage / Income Gap ($) | 5,771 | 75.66¢ per $1 |
| Gini / Inequality Index | 5,771 | 0.41 |
Earnings by Sex in Plymouth borough
Average Earnings in Plymouth borough are $30,185, $35,569 for men and $26,910 for women, a difference of 24.3%.
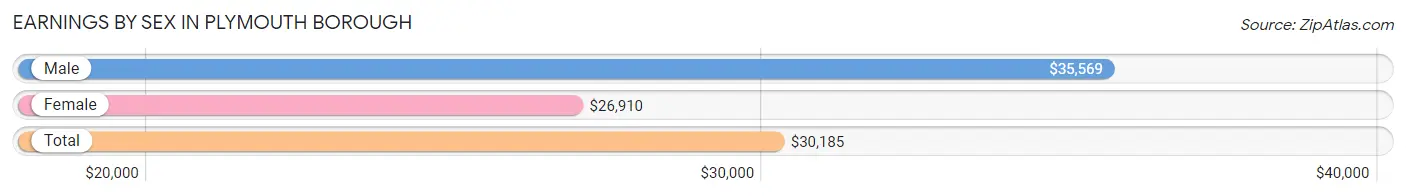
| Sex | Number | Average Earnings |
| Male | 1,607 (52.6%) | $35,569 |
| Female | 1,445 (47.3%) | $26,910 |
| Total | 3,052 (100.0%) | $30,185 |
Earnings by Sex by Income Bracket in Plymouth borough
The most common earnings brackets in Plymouth borough are $35,000 to $39,999 for men (203 | 12.6%) and $35,000 to $39,999 for women (166 | 11.5%).
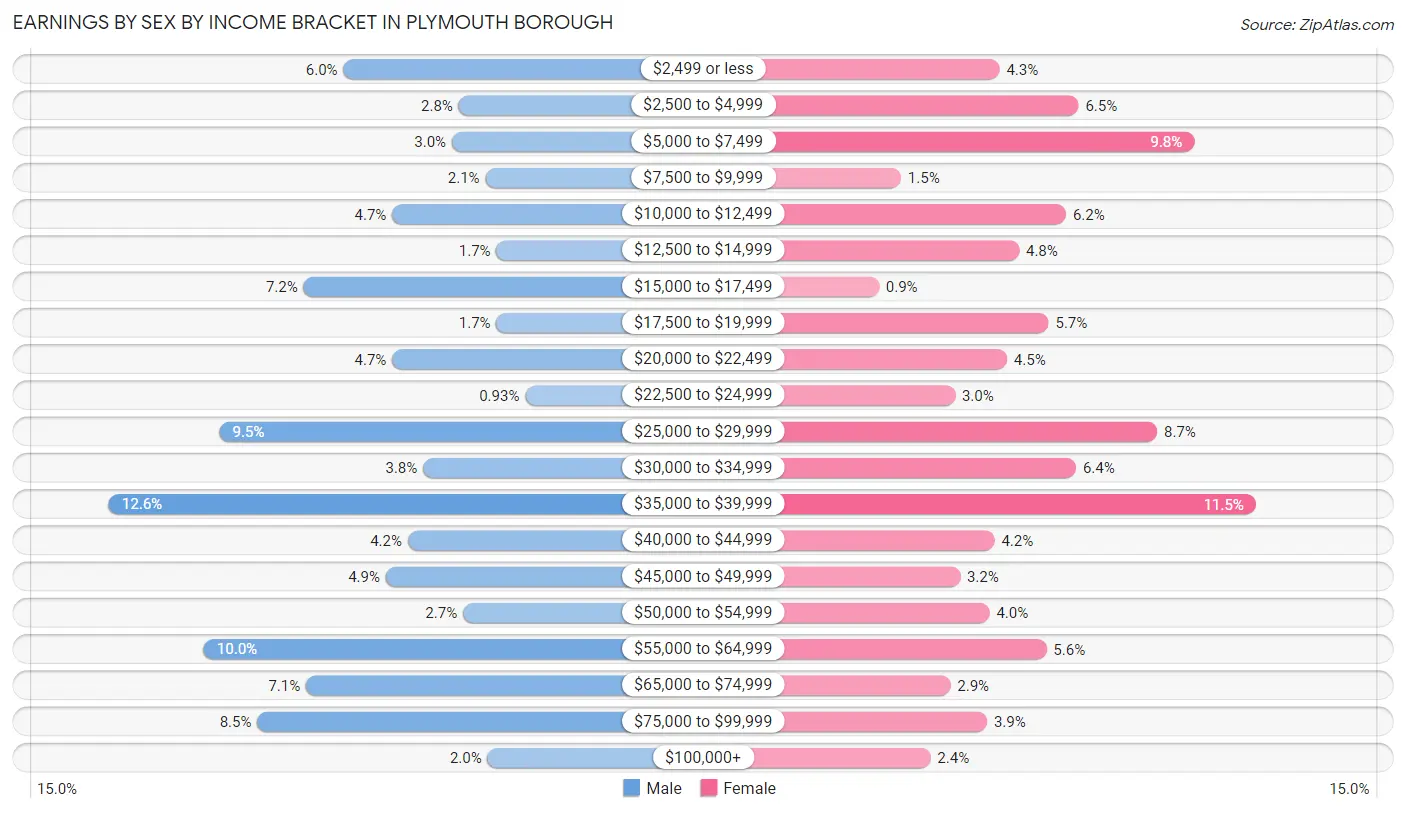
| Income | Male | Female |
| $2,499 or less | 97 (6.0%) | 62 (4.3%) |
| $2,500 to $4,999 | 45 (2.8%) | 94 (6.5%) |
| $5,000 to $7,499 | 48 (3.0%) | 141 (9.8%) |
| $7,500 to $9,999 | 33 (2.1%) | 22 (1.5%) |
| $10,000 to $12,499 | 75 (4.7%) | 89 (6.2%) |
| $12,500 to $14,999 | 28 (1.7%) | 70 (4.8%) |
| $15,000 to $17,499 | 115 (7.2%) | 13 (0.9%) |
| $17,500 to $19,999 | 28 (1.7%) | 82 (5.7%) |
| $20,000 to $22,499 | 75 (4.7%) | 65 (4.5%) |
| $22,500 to $24,999 | 15 (0.9%) | 44 (3.0%) |
| $25,000 to $29,999 | 153 (9.5%) | 126 (8.7%) |
| $30,000 to $34,999 | 61 (3.8%) | 93 (6.4%) |
| $35,000 to $39,999 | 203 (12.6%) | 166 (11.5%) |
| $40,000 to $44,999 | 68 (4.2%) | 60 (4.2%) |
| $45,000 to $49,999 | 78 (4.9%) | 46 (3.2%) |
| $50,000 to $54,999 | 43 (2.7%) | 58 (4.0%) |
| $55,000 to $64,999 | 160 (10.0%) | 81 (5.6%) |
| $65,000 to $74,999 | 114 (7.1%) | 42 (2.9%) |
| $75,000 to $99,999 | 136 (8.5%) | 57 (3.9%) |
| $100,000+ | 32 (2.0%) | 34 (2.4%) |
| Total | 1,607 (100.0%) | 1,445 (100.0%) |
Earnings by Sex by Educational Attainment in Plymouth borough
Average earnings in Plymouth borough are $37,043 for men and $31,836 for women, a difference of 14.1%. Men with an educational attainment of bachelor's degree enjoy the highest average annual earnings of $64,732, while those with college or associate's degree education earn the least with $35,417. Women with an educational attainment of graduate degree earn the most with the average annual earnings of $82,083, while those with less than high school education have the smallest earnings of $18,750.
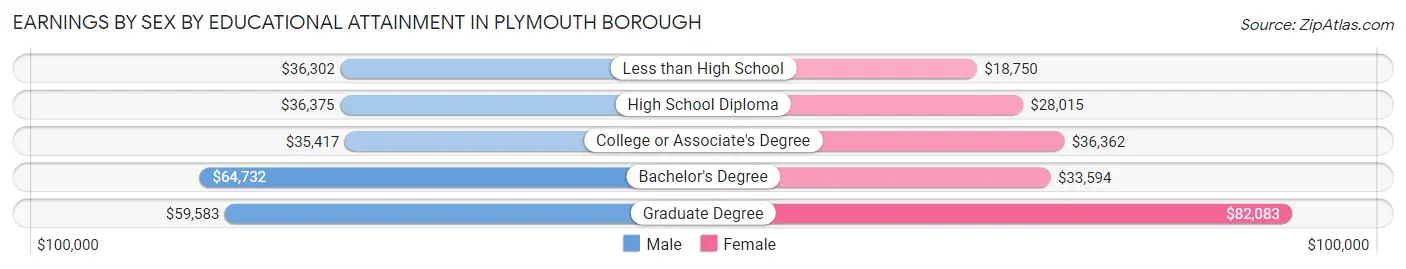
| Educational Attainment | Male Income | Female Income |
| Less than High School | $36,302 | $18,750 |
| High School Diploma | $36,375 | $28,015 |
| College or Associate's Degree | $35,417 | $36,362 |
| Bachelor's Degree | $64,732 | $33,594 |
| Graduate Degree | $59,583 | $82,083 |
| Total | $37,043 | $31,836 |
Family Income in Plymouth borough
Family Income Brackets in Plymouth borough
According to the Plymouth borough family income data, there are 282 families falling into the $50,000 to $74,999 income range, which is the most common income bracket and makes up 22.0% of all families. Conversely, the $200,000+ income bracket is the least frequent group with only 17 families (1.3%) belonging to this category.
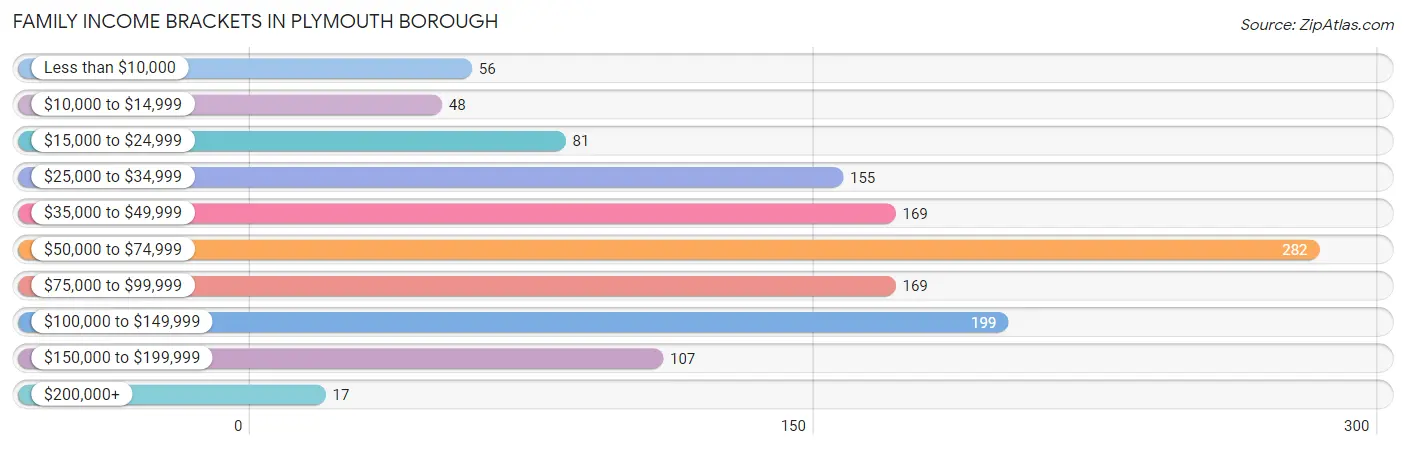
| Income Bracket | # Families | % Families |
| Less than $10,000 | 56 | 4.4% |
| $10,000 to $14,999 | 48 | 3.7% |
| $15,000 to $24,999 | 81 | 6.3% |
| $25,000 to $34,999 | 155 | 12.1% |
| $35,000 to $49,999 | 169 | 13.2% |
| $50,000 to $74,999 | 282 | 22.0% |
| $75,000 to $99,999 | 169 | 13.2% |
| $100,000 to $149,999 | 199 | 15.5% |
| $150,000 to $199,999 | 107 | 8.3% |
| $200,000+ | 17 | 1.3% |
Family Income by Famaliy Size in Plymouth borough
4-person families (200 | 15.6%) account for the highest median family income in Plymouth borough with $88,839 per family, while 2-person families (524 | 40.8%) have the highest median income of $32,566 per family member.
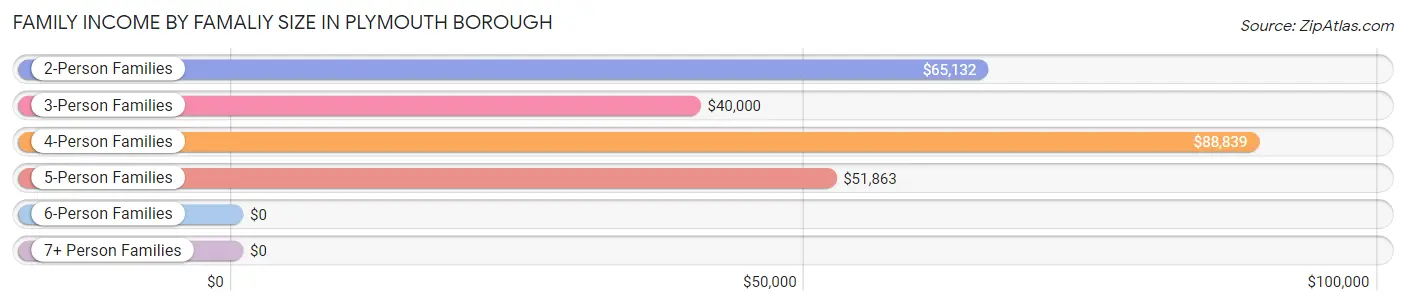
| Income Bracket | # Families | Median Income |
| 2-Person Families | 524 (40.8%) | $65,132 |
| 3-Person Families | 324 (25.2%) | $40,000 |
| 4-Person Families | 200 (15.6%) | $88,839 |
| 5-Person Families | 206 (16.0%) | $51,863 |
| 6-Person Families | 25 (1.9%) | $0 |
| 7+ Person Families | 5 (0.4%) | $0 |
| Total | 1,284 (100.0%) | $59,000 |
Family Income by Number of Earners in Plymouth borough
The median family income in Plymouth borough is $59,000, with families comprising 3+ earners (223) having the highest median family income of $105,313, while families with no earners (120) have the lowest median family income of $28,942, accounting for 17.4% and 9.3% of families, respectively.
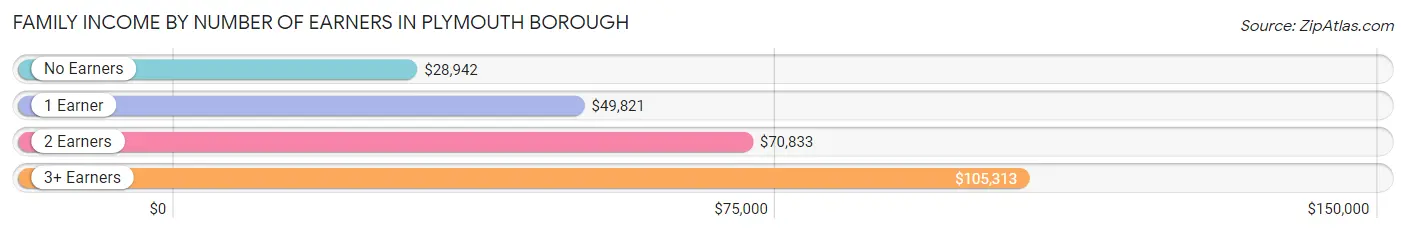
| Number of Earners | # Families | Median Income |
| No Earners | 120 (9.3%) | $28,942 |
| 1 Earner | 511 (39.8%) | $49,821 |
| 2 Earners | 430 (33.5%) | $70,833 |
| 3+ Earners | 223 (17.4%) | $105,313 |
| Total | 1,284 (100.0%) | $59,000 |
Household Income in Plymouth borough
Household Income Brackets in Plymouth borough
With 476 households falling in the category, the $50,000 to $74,999 income range is the most frequent in Plymouth borough, accounting for 19.8% of all households. In contrast, only 17 households (0.7%) fall into the $200,000+ income bracket, making it the least populous group.
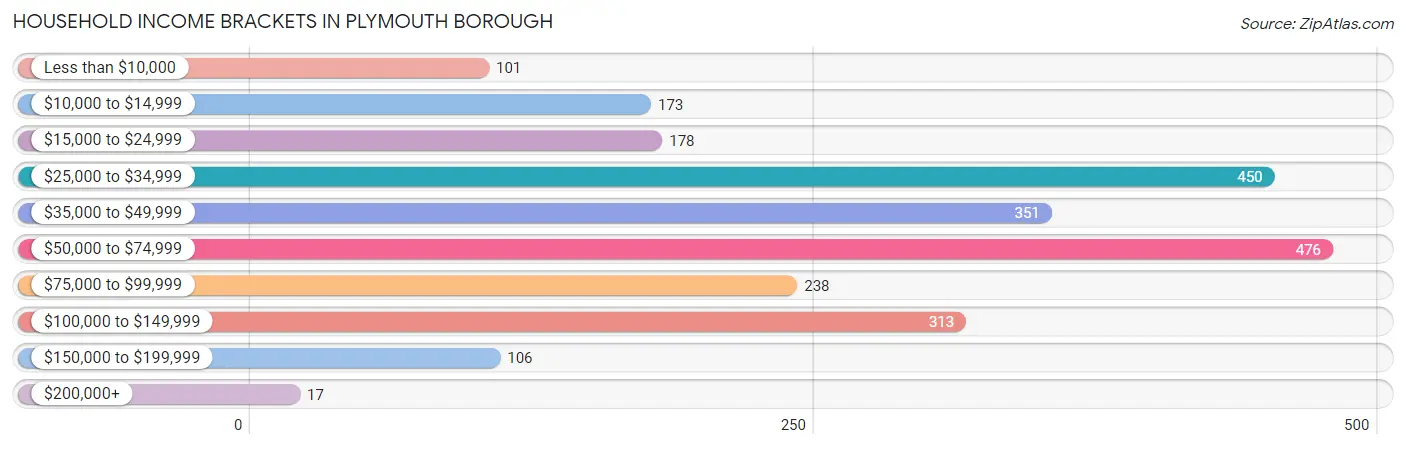
| Income Bracket | # Households | % Households |
| Less than $10,000 | 101 | 4.2% |
| $10,000 to $14,999 | 173 | 7.2% |
| $15,000 to $24,999 | 178 | 7.4% |
| $25,000 to $34,999 | 450 | 18.7% |
| $35,000 to $49,999 | 351 | 14.6% |
| $50,000 to $74,999 | 476 | 19.8% |
| $75,000 to $99,999 | 238 | 9.9% |
| $100,000 to $149,999 | 313 | 13.0% |
| $150,000 to $199,999 | 106 | 4.4% |
| $200,000+ | 17 | 0.7% |
Household Income by Householder Age in Plymouth borough
The median household income in Plymouth borough is $46,858, with the highest median household income of $59,113 found in the 45 to 64 years age bracket for the primary householder. A total of 977 households (40.6%) fall into this category. Meanwhile, the 15 to 24 years age bracket for the primary householder has the lowest median household income of $26,507, with 61 households (2.5%) in this group.
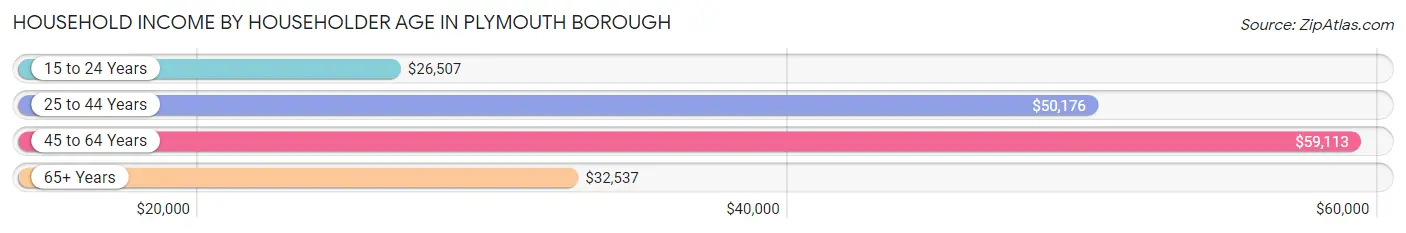
| Income Bracket | # Households | Median Income |
| 15 to 24 Years | 61 (2.5%) | $26,507 |
| 25 to 44 Years | 736 (30.6%) | $50,176 |
| 45 to 64 Years | 977 (40.6%) | $59,113 |
| 65+ Years | 631 (26.2%) | $32,537 |
| Total | 2,405 (100.0%) | $46,858 |
Poverty in Plymouth borough
Income Below Poverty by Sex and Age in Plymouth borough
With 12.8% poverty level for males and 17.9% for females among the residents of Plymouth borough, 25 to 34 year old males and under 5 year old females are the most vulnerable to poverty, with 70 males (25.7%) and 71 females (45.2%) in their respective age groups living below the poverty level.
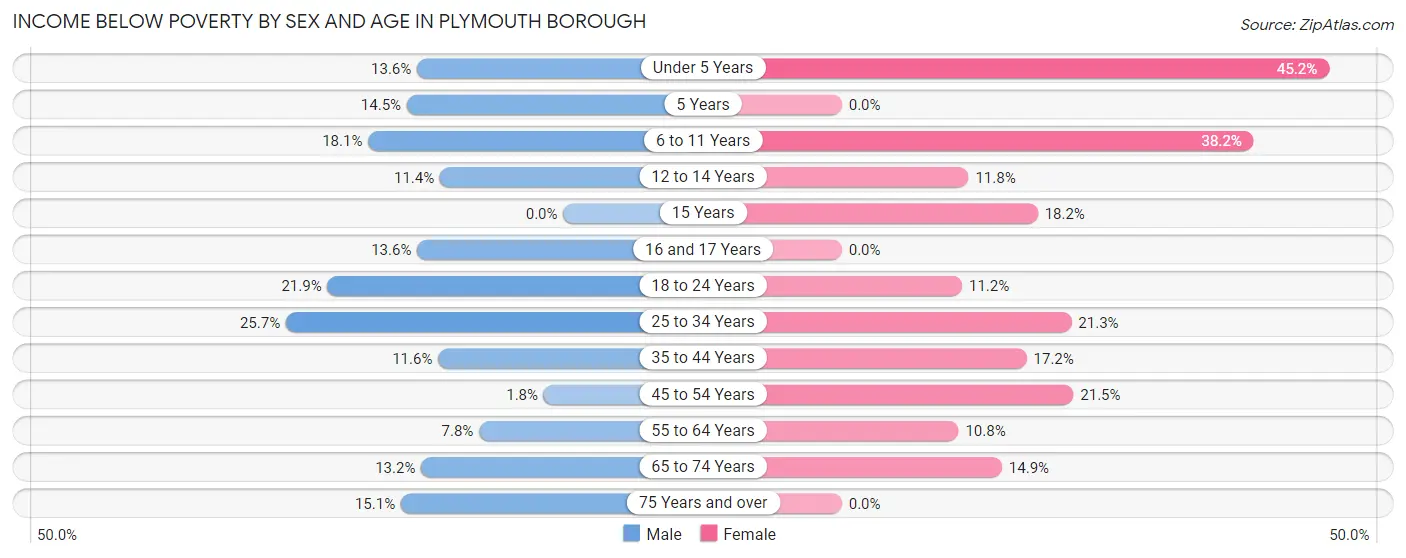
| Age Bracket | Male | Female |
| Under 5 Years | 27 (13.6%) | 71 (45.2%) |
| 5 Years | 18 (14.5%) | 0 (0.0%) |
| 6 to 11 Years | 48 (18.1%) | 73 (38.2%) |
| 12 to 14 Years | 23 (11.4%) | 10 (11.8%) |
| 15 Years | 0 (0.0%) | 8 (18.2%) |
| 16 and 17 Years | 16 (13.6%) | 0 (0.0%) |
| 18 to 24 Years | 37 (21.9%) | 27 (11.2%) |
| 25 to 34 Years | 70 (25.7%) | 75 (21.3%) |
| 35 to 44 Years | 39 (11.6%) | 59 (17.2%) |
| 45 to 54 Years | 7 (1.8%) | 104 (21.5%) |
| 55 to 64 Years | 35 (7.8%) | 39 (10.8%) |
| 65 to 74 Years | 48 (13.2%) | 33 (14.9%) |
| 75 Years and over | 11 (15.1%) | 0 (0.0%) |
| Total | 379 (12.8%) | 499 (17.9%) |
Income Above Poverty by Sex and Age in Plymouth borough
According to the poverty statistics in Plymouth borough, males aged 15 years and females aged 5 years are the age groups that are most secure financially, with 100.0% of males and 100.0% of females in these age groups living above the poverty line.
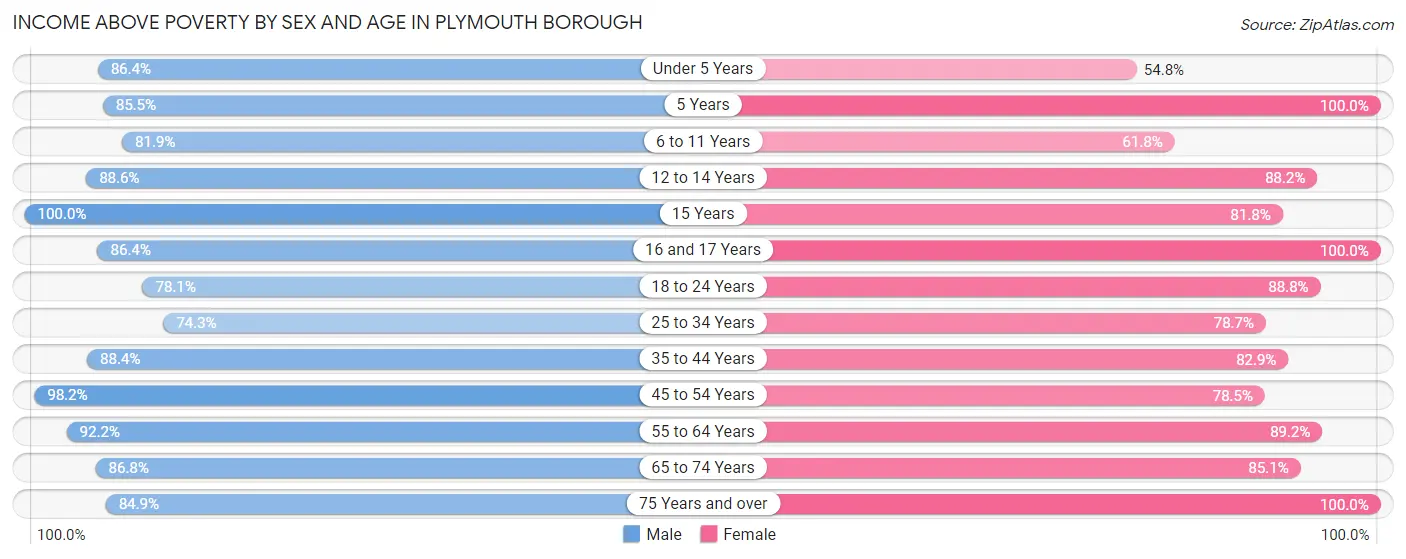
| Age Bracket | Male | Female |
| Under 5 Years | 172 (86.4%) | 86 (54.8%) |
| 5 Years | 106 (85.5%) | 6 (100.0%) |
| 6 to 11 Years | 217 (81.9%) | 118 (61.8%) |
| 12 to 14 Years | 178 (88.6%) | 75 (88.2%) |
| 15 Years | 18 (100.0%) | 36 (81.8%) |
| 16 and 17 Years | 102 (86.4%) | 52 (100.0%) |
| 18 to 24 Years | 132 (78.1%) | 215 (88.8%) |
| 25 to 34 Years | 202 (74.3%) | 277 (78.7%) |
| 35 to 44 Years | 297 (88.4%) | 285 (82.9%) |
| 45 to 54 Years | 379 (98.2%) | 380 (78.5%) |
| 55 to 64 Years | 413 (92.2%) | 321 (89.2%) |
| 65 to 74 Years | 316 (86.8%) | 189 (85.1%) |
| 75 Years and over | 62 (84.9%) | 242 (100.0%) |
| Total | 2,594 (87.3%) | 2,282 (82.1%) |
Income Below Poverty Among Married-Couple Families in Plymouth borough
The poverty statistics for married-couple families in Plymouth borough show that 5.1% or 35 of the total 691 families live below the poverty line. Families with 1 or 2 children have the highest poverty rate of 16.1%, comprising of 30 families. On the other hand, families with no children have the lowest poverty rate of 0.0%, which includes 0 families.
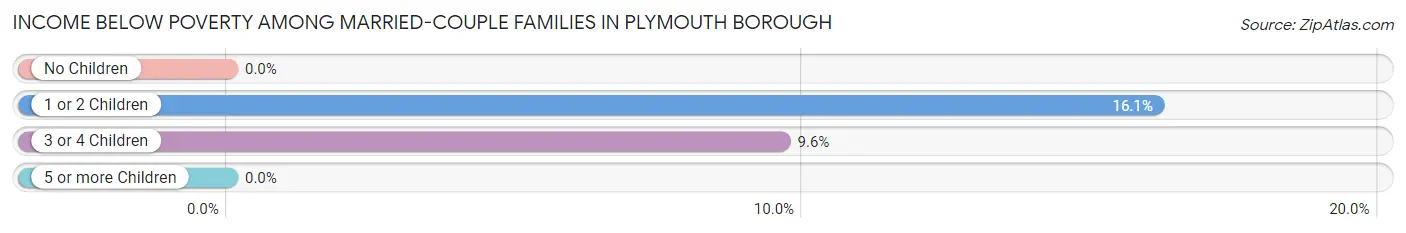
| Children | Above Poverty | Below Poverty |
| No Children | 453 (100.0%) | 0 (0.0%) |
| 1 or 2 Children | 156 (83.9%) | 30 (16.1%) |
| 3 or 4 Children | 47 (90.4%) | 5 (9.6%) |
| 5 or more Children | 0 (0.0%) | 0 (0.0%) |
| Total | 656 (94.9%) | 35 (5.1%) |
Income Below Poverty Among Single-Parent Households in Plymouth borough
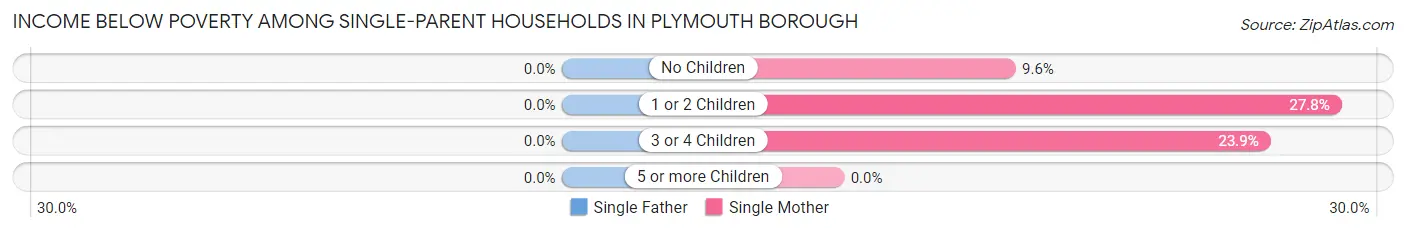
| Children | Single Father | Single Mother |
| No Children | 0 (0.0%) | 16 (9.6%) |
| 1 or 2 Children | 0 (0.0%) | 69 (27.8%) |
| 3 or 4 Children | 0 (0.0%) | 26 (23.8%) |
| 5 or more Children | 0 (0.0%) | 0 (0.0%) |
| Total | 0 (0.0%) | 111 (21.0%) |
Income Below Poverty Among Married-Couple vs Single-Parent Households in Plymouth borough
The poverty data for Plymouth borough shows that 35 of the married-couple family households (5.1%) and 111 of the single-parent households (18.7%) are living below the poverty level. Within the married-couple family households, those with 1 or 2 children have the highest poverty rate, with 30 households (16.1%) falling below the poverty line. Among the single-parent households, those with 3 or 4 children have the highest poverty rate, with 26 household (23.2%) living below poverty.
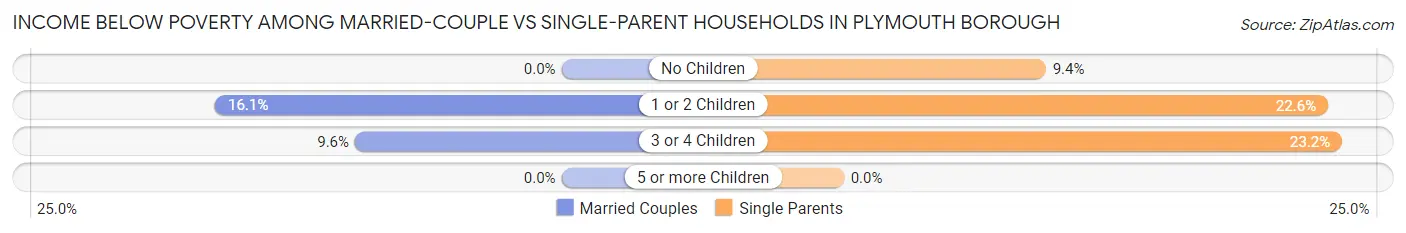
| Children | Married-Couple Families | Single-Parent Households |
| No Children | 0 (0.0%) | 16 (9.4%) |
| 1 or 2 Children | 30 (16.1%) | 69 (22.6%) |
| 3 or 4 Children | 5 (9.6%) | 26 (23.2%) |
| 5 or more Children | 0 (0.0%) | 0 (0.0%) |
| Total | 35 (5.1%) | 111 (18.7%) |
Race in Plymouth borough
The most populous races in Plymouth borough are White / Caucasian (4,484 | 77.7%), Hispanic or Latino (706 | 12.2%), and Black / African American (531 | 9.2%).
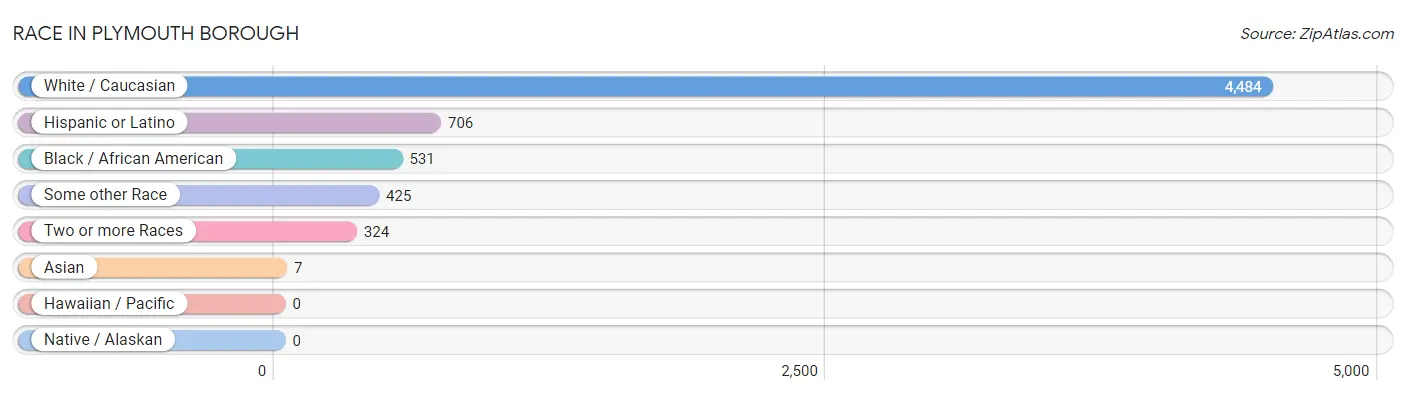
| Race | # Population | % Population |
| Asian | 7 | 0.1% |
| Black / African American | 531 | 9.2% |
| Hawaiian / Pacific | 0 | 0.0% |
| Hispanic or Latino | 706 | 12.2% |
| Native / Alaskan | 0 | 0.0% |
| White / Caucasian | 4,484 | 77.7% |
| Two or more Races | 324 | 5.6% |
| Some other Race | 425 | 7.4% |
| Total | 5,771 | 100.0% |
Ancestry in Plymouth borough
The most populous ancestries reported in Plymouth borough are Polish (1,341 | 23.2%), German (1,016 | 17.6%), Irish (775 | 13.4%), Italian (395 | 6.8%), and Welsh (313 | 5.4%), together accounting for 66.5% of all Plymouth borough residents.
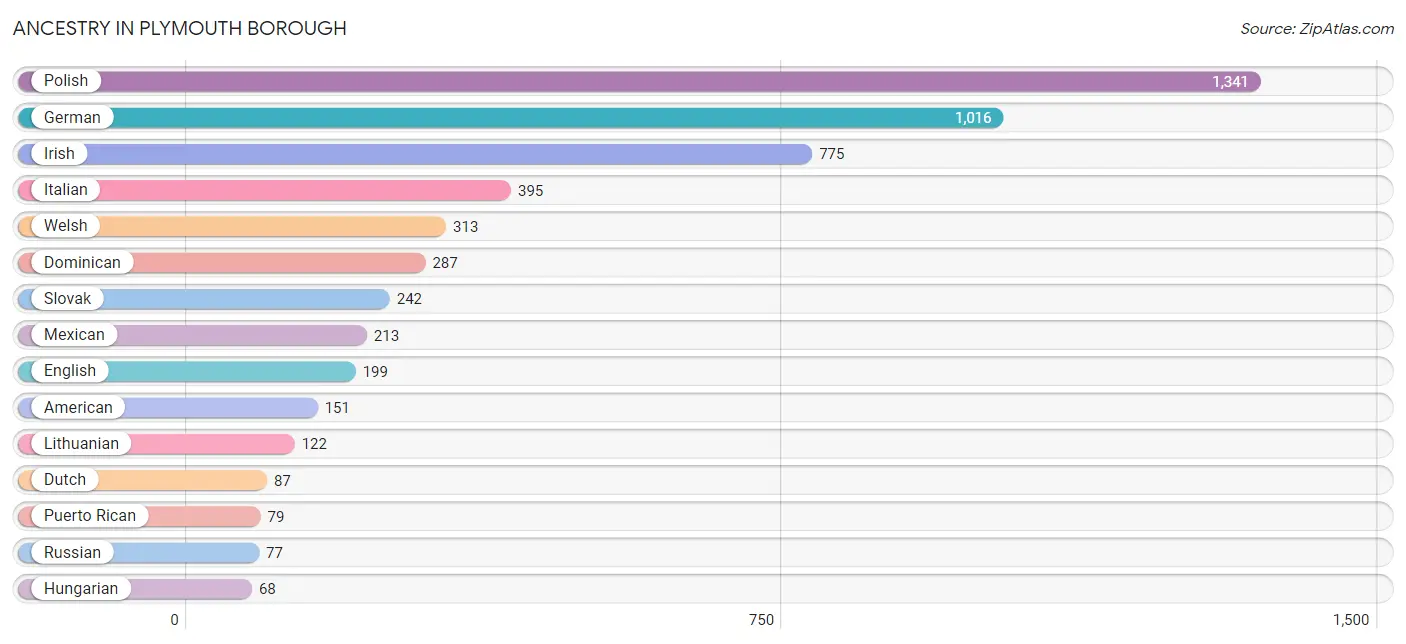
| Ancestry | # Population | % Population |
| African | 22 | 0.4% |
| American | 151 | 2.6% |
| Armenian | 34 | 0.6% |
| Bhutanese | 7 | 0.1% |
| British | 47 | 0.8% |
| Central American | 10 | 0.2% |
| Dominican | 287 | 5.0% |
| Dutch | 87 | 1.5% |
| Eastern European | 8 | 0.1% |
| Ecuadorian | 37 | 0.6% |
| English | 199 | 3.5% |
| European | 43 | 0.7% |
| French | 5 | 0.1% |
| German | 1,016 | 17.6% |
| Greek | 11 | 0.2% |
| Honduran | 10 | 0.2% |
| Hungarian | 68 | 1.2% |
| Irish | 775 | 13.4% |
| Italian | 395 | 6.8% |
| Lithuanian | 122 | 2.1% |
| Mexican | 213 | 3.7% |
| Norwegian | 3 | 0.1% |
| Pennsylvania German | 32 | 0.5% |
| Peruvian | 24 | 0.4% |
| Polish | 1,341 | 23.2% |
| Portuguese | 4 | 0.1% |
| Puerto Rican | 79 | 1.4% |
| Russian | 77 | 1.3% |
| Scottish | 52 | 0.9% |
| Slovak | 242 | 4.2% |
| South American | 61 | 1.1% |
| Spanish | 9 | 0.2% |
| Subsaharan African | 22 | 0.4% |
| Swedish | 3 | 0.1% |
| Thai | 9 | 0.2% |
| Ukrainian | 59 | 1.0% |
| Welsh | 313 | 5.4% |
| West Indian | 50 | 0.9% |
| Yugoslavian | 18 | 0.3% | View All 39 Rows |
Immigrants in Plymouth borough
The most numerous immigrant groups reported in Plymouth borough came from Latin America (193 | 3.3%), Caribbean (120 | 2.1%), Dominican Republic (116 | 2.0%), Central America (54 | 0.9%), and Mexico (49 | 0.9%), together accounting for 9.2% of all Plymouth borough residents.
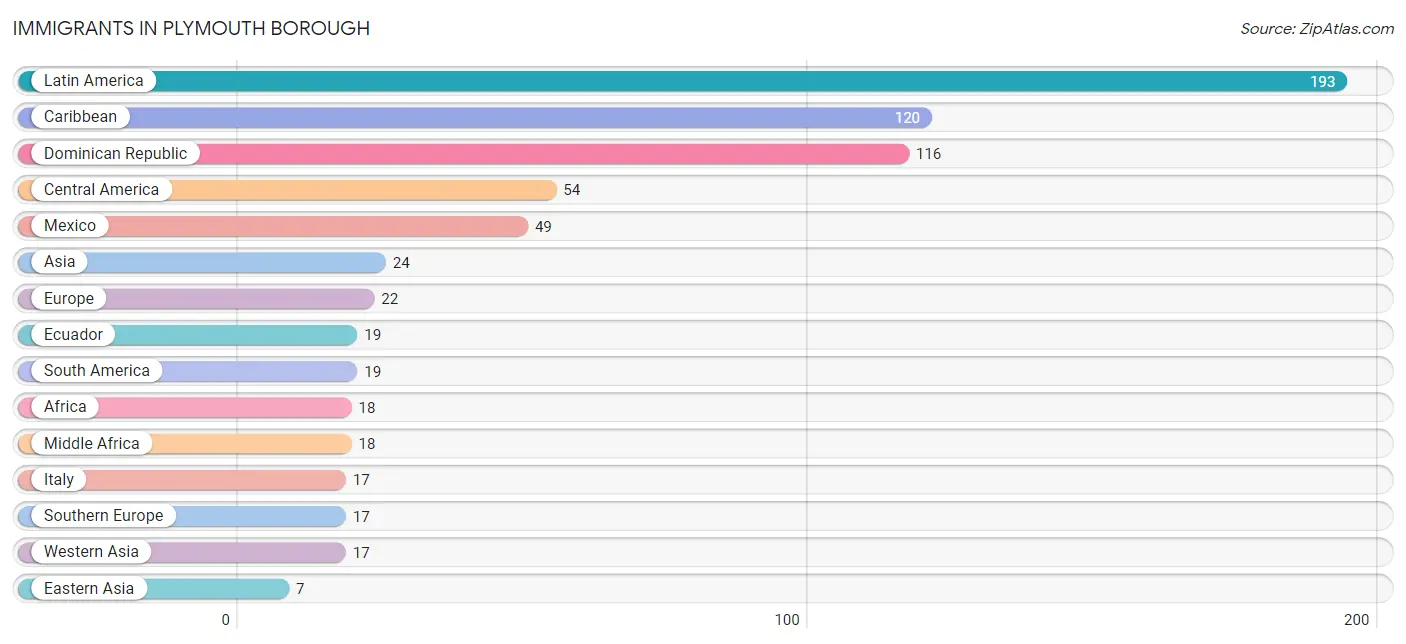
| Immigration Origin | # Population | % Population |
| Africa | 18 | 0.3% |
| Asia | 24 | 0.4% |
| Caribbean | 120 | 2.1% |
| Central America | 54 | 0.9% |
| Dominican Republic | 116 | 2.0% |
| Eastern Asia | 7 | 0.1% |
| Ecuador | 19 | 0.3% |
| Europe | 22 | 0.4% |
| Germany | 5 | 0.1% |
| Haiti | 4 | 0.1% |
| Honduras | 5 | 0.1% |
| Italy | 17 | 0.3% |
| Japan | 7 | 0.1% |
| Latin America | 193 | 3.3% |
| Mexico | 49 | 0.9% |
| Middle Africa | 18 | 0.3% |
| South America | 19 | 0.3% |
| Southern Europe | 17 | 0.3% |
| Western Asia | 17 | 0.3% |
| Western Europe | 5 | 0.1% | View All 20 Rows |
Sex and Age in Plymouth borough
Sex and Age in Plymouth borough
The most populous age groups in Plymouth borough are 5 to 9 Years (308 | 10.3%) for men and 45 to 49 Years (246 | 8.8%) for women.
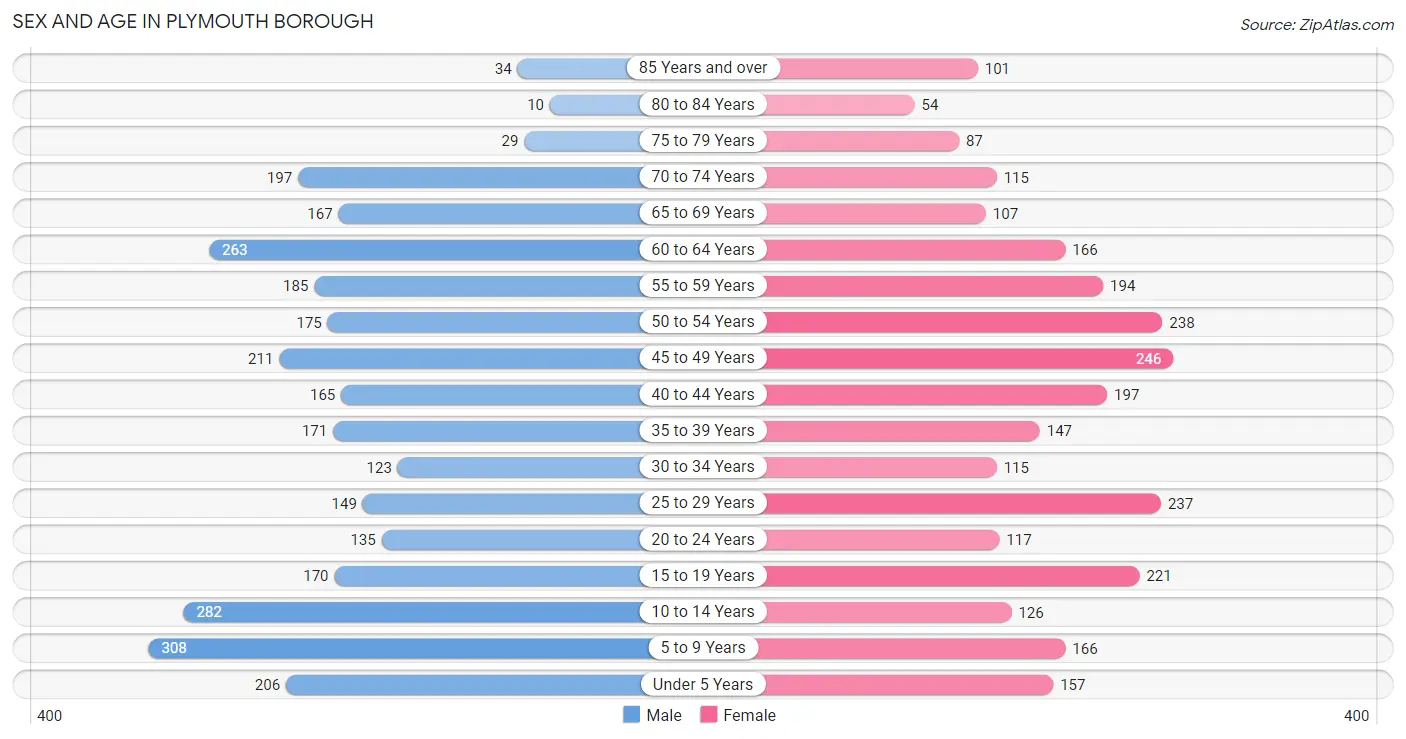
| Age Bracket | Male | Female |
| Under 5 Years | 206 (6.9%) | 157 (5.6%) |
| 5 to 9 Years | 308 (10.3%) | 166 (5.9%) |
| 10 to 14 Years | 282 (9.5%) | 126 (4.5%) |
| 15 to 19 Years | 170 (5.7%) | 221 (7.9%) |
| 20 to 24 Years | 135 (4.5%) | 117 (4.2%) |
| 25 to 29 Years | 149 (5.0%) | 237 (8.5%) |
| 30 to 34 Years | 123 (4.1%) | 115 (4.1%) |
| 35 to 39 Years | 171 (5.7%) | 147 (5.3%) |
| 40 to 44 Years | 165 (5.5%) | 197 (7.1%) |
| 45 to 49 Years | 211 (7.1%) | 246 (8.8%) |
| 50 to 54 Years | 175 (5.9%) | 238 (8.5%) |
| 55 to 59 Years | 185 (6.2%) | 194 (7.0%) |
| 60 to 64 Years | 263 (8.8%) | 166 (5.9%) |
| 65 to 69 Years | 167 (5.6%) | 107 (3.8%) |
| 70 to 74 Years | 197 (6.6%) | 115 (4.1%) |
| 75 to 79 Years | 29 (1.0%) | 87 (3.1%) |
| 80 to 84 Years | 10 (0.3%) | 54 (1.9%) |
| 85 Years and over | 34 (1.1%) | 101 (3.6%) |
| Total | 2,980 (100.0%) | 2,791 (100.0%) |
Families and Households in Plymouth borough
Median Family Size in Plymouth borough
The median family size in Plymouth borough is 3.28 persons per family, with single female/mother families (529 | 41.2%) accounting for the largest median family size of 3.48 persons per family. On the other hand, single male/father families (64 | 5.0%) represent the smallest median family size with 2.66 persons per family.
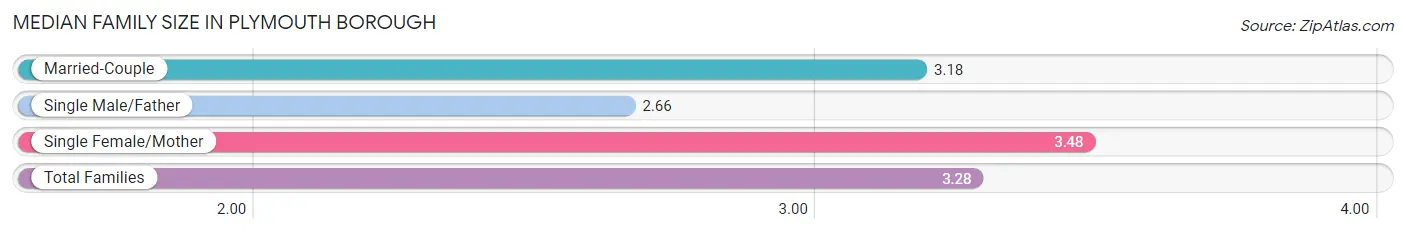
| Family Type | # Families | Family Size |
| Married-Couple | 691 (53.8%) | 3.18 |
| Single Male/Father | 64 (5.0%) | 2.66 |
| Single Female/Mother | 529 (41.2%) | 3.48 |
| Total Families | 1,284 (100.0%) | 3.28 |
Median Household Size in Plymouth borough
The median household size in Plymouth borough is 2.40 persons per household, with single female/mother households (529 | 22.0%) accounting for the largest median household size of 3.71 persons per household. non-family households (1,121 | 46.6%) represent the smallest median household size with 1.26 persons per household.
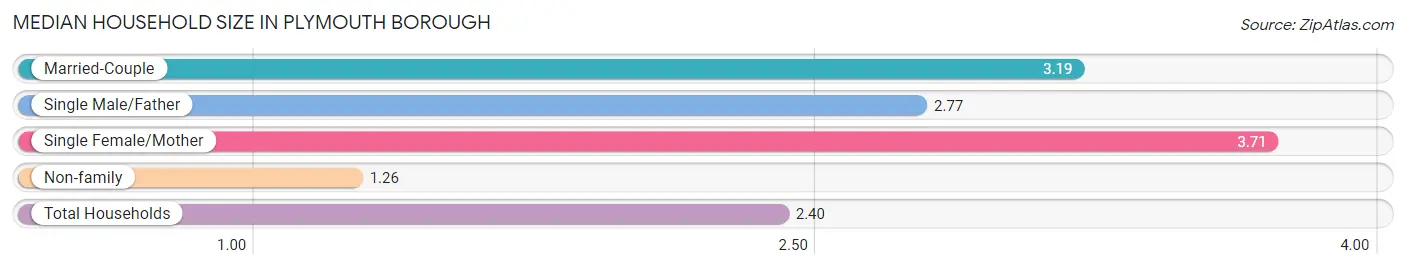
| Household Type | # Households | Household Size |
| Married-Couple | 691 (28.7%) | 3.19 |
| Single Male/Father | 64 (2.7%) | 2.77 |
| Single Female/Mother | 529 (22.0%) | 3.71 |
| Non-family | 1,121 (46.6%) | 1.26 |
| Total Households | 2,405 (100.0%) | 2.40 |
Household Size by Marriage Status in Plymouth borough
Out of a total of 2,405 households in Plymouth borough, 1,284 (53.4%) are family households, while 1,121 (46.6%) are nonfamily households. The most numerous type of family households are 2-person households, comprising 479, and the most common type of nonfamily households are 1-person households, comprising 884.
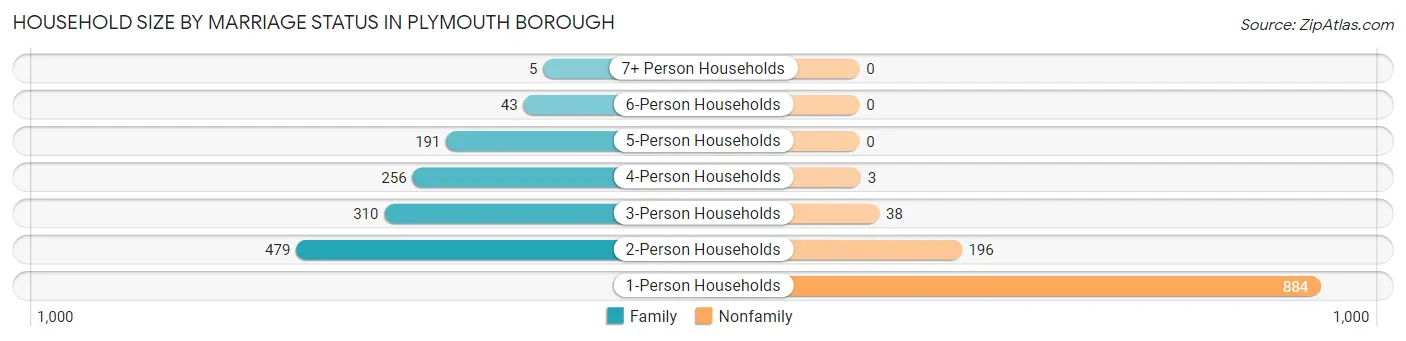
| Household Size | Family Households | Nonfamily Households |
| 1-Person Households | - | 884 (36.8%) |
| 2-Person Households | 479 (19.9%) | 196 (8.2%) |
| 3-Person Households | 310 (12.9%) | 38 (1.6%) |
| 4-Person Households | 256 (10.6%) | 3 (0.1%) |
| 5-Person Households | 191 (7.9%) | 0 (0.0%) |
| 6-Person Households | 43 (1.8%) | 0 (0.0%) |
| 7+ Person Households | 5 (0.2%) | 0 (0.0%) |
| Total | 1,284 (53.4%) | 1,121 (46.6%) |
Female Fertility in Plymouth borough
Fertility by Age in Plymouth borough
Average fertility rate in Plymouth borough is 71.0 births per 1,000 women. Women in the age bracket of 20 to 34 years have the highest fertility rate with 166.0 births per 1,000 women. Women in the age bracket of 20 to 34 years acount for 85.7% of all women with births.
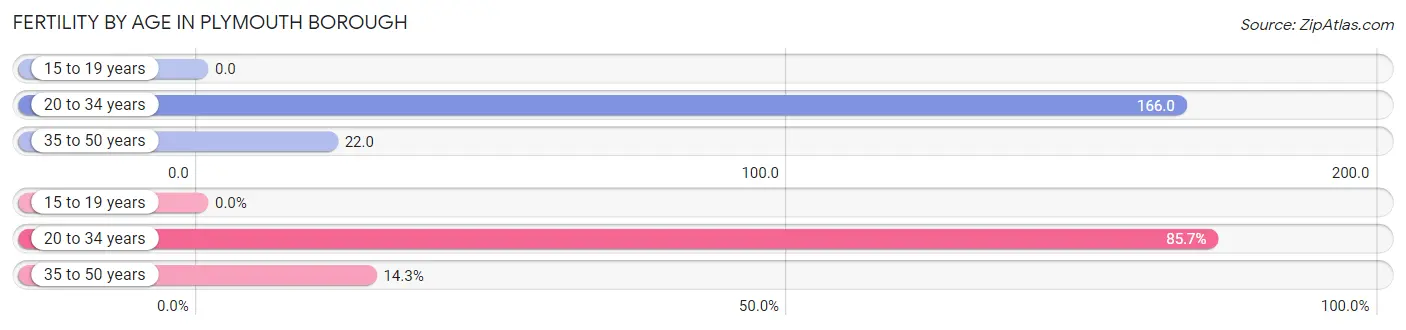
| Age Bracket | Women with Births | Births / 1,000 Women |
| 15 to 19 years | 0 (0.0%) | 0.0 |
| 20 to 34 years | 78 (85.7%) | 166.0 |
| 35 to 50 years | 13 (14.3%) | 22.0 |
| Total | 91 (100.0%) | 71.0 |
Fertility by Age by Marriage Status in Plymouth borough
30.8% of women with births (91) in Plymouth borough are married. The highest percentage of unmarried women with births falls into 35 to 50 years age bracket with 100.0% of them unmarried at the time of birth, while the lowest percentage of unmarried women with births belong to 20 to 34 years age bracket with 64.1% of them unmarried.
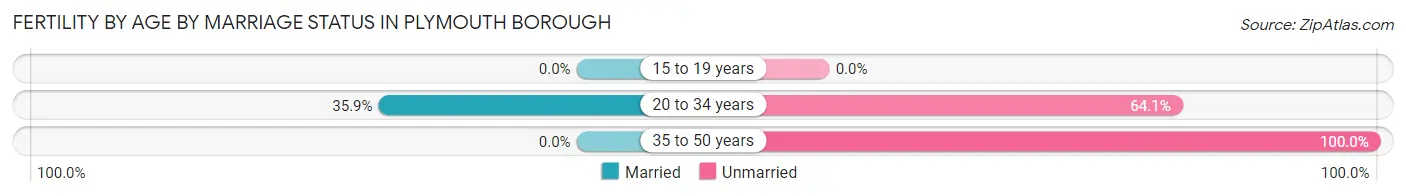
| Age Bracket | Married | Unmarried |
| 15 to 19 years | 0 (0.0%) | 0 (0.0%) |
| 20 to 34 years | 28 (35.9%) | 50 (64.1%) |
| 35 to 50 years | 0 (0.0%) | 13 (100.0%) |
| Total | 28 (30.8%) | 63 (69.2%) |
Fertility by Education in Plymouth borough
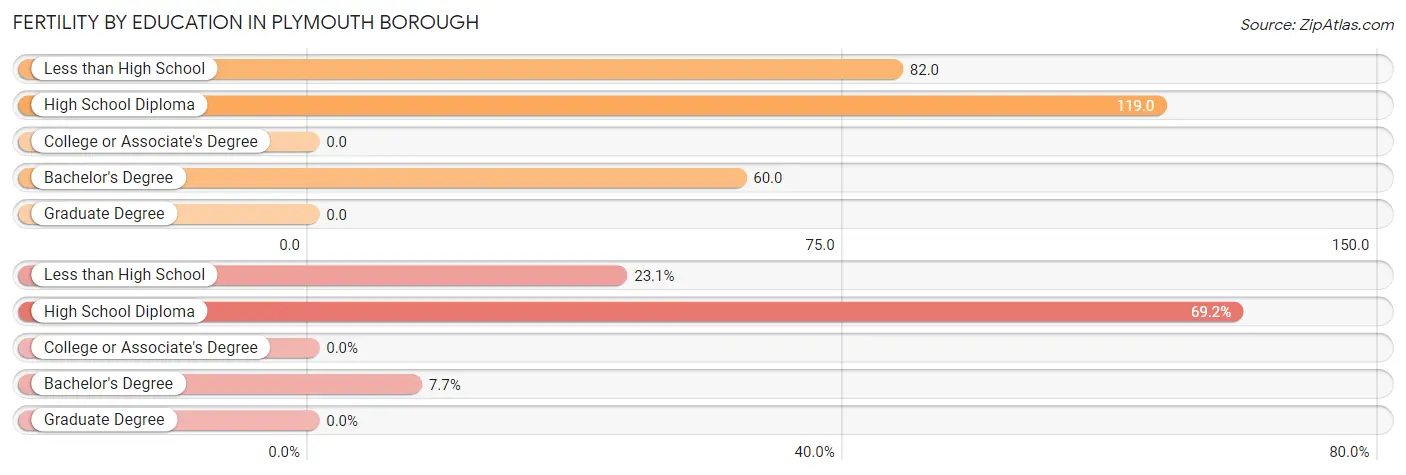
| Educational Attainment | Women with Births | Births / 1,000 Women |
| Less than High School | 21 (23.1%) | 82.0 |
| High School Diploma | 63 (69.2%) | 119.0 |
| College or Associate's Degree | 0 (0.0%) | 0.0 |
| Bachelor's Degree | 7 (7.7%) | 60.0 |
| Graduate Degree | 0 (0.0%) | 0.0 |
| Total | 91 (100.0%) | 71.0 |
Fertility by Education by Marriage Status in Plymouth borough
69.2% of women with births in Plymouth borough are unmarried. Women with the educational attainment of less than high school are most likely to be married with 100.0% of them married at childbirth, while women with the educational attainment of high school diploma are least likely to be married with 100.0% of them unmarried at childbirth.
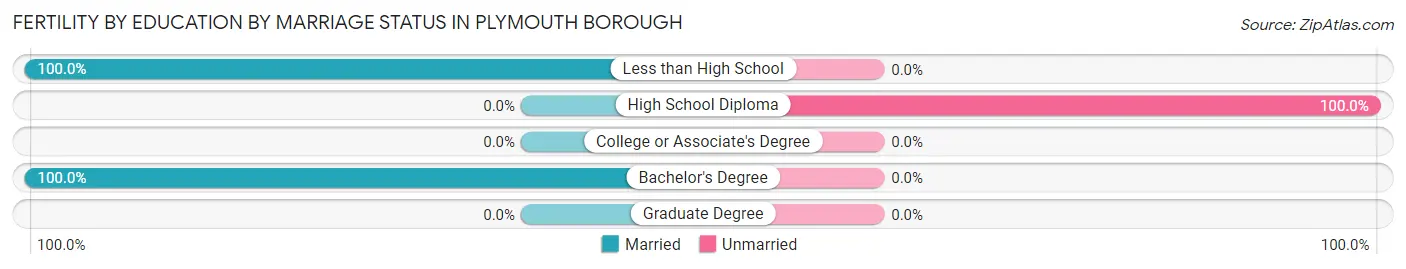
| Educational Attainment | Married | Unmarried |
| Less than High School | 21 (100.0%) | 0 (0.0%) |
| High School Diploma | 0 (0.0%) | 63 (100.0%) |
| College or Associate's Degree | 0 (0.0%) | 0 (0.0%) |
| Bachelor's Degree | 7 (100.0%) | 0 (0.0%) |
| Graduate Degree | 0 (0.0%) | 0 (0.0%) |
| Total | 28 (30.8%) | 63 (69.2%) |
Employment Characteristics in Plymouth borough
Employment by Class of Employer in Plymouth borough
Among the 2,700 employed individuals in Plymouth borough, private company employees (2,057 | 76.2%), local government employees (231 | 8.6%), and federal government employees (148 | 5.5%) make up the most common classes of employment.
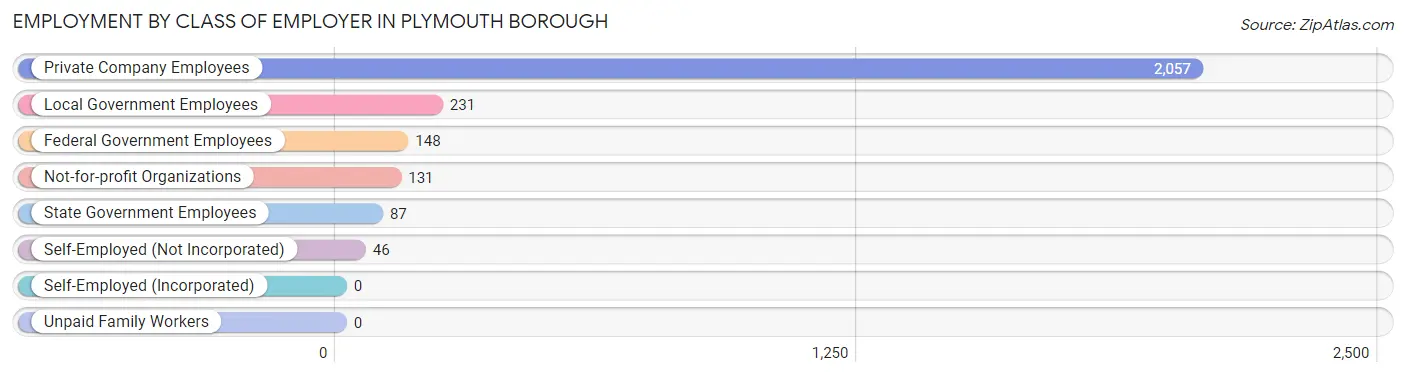
| Employer Class | # Employees | % Employees |
| Private Company Employees | 2,057 | 76.2% |
| Self-Employed (Incorporated) | 0 | 0.0% |
| Self-Employed (Not Incorporated) | 46 | 1.7% |
| Not-for-profit Organizations | 131 | 4.9% |
| Local Government Employees | 231 | 8.6% |
| State Government Employees | 87 | 3.2% |
| Federal Government Employees | 148 | 5.5% |
| Unpaid Family Workers | 0 | 0.0% |
| Total | 2,700 | 100.0% |
Employment Status by Age in Plymouth borough
According to the labor force statistics for Plymouth borough, out of the total population over 16 years of age (4,464), 63.9% or 2,852 individuals are in the labor force, with 4.3% or 123 of them unemployed. The age group with the highest labor force participation rate is 35 to 44 years, with 87.5% or 595 individuals in the labor force. Within the labor force, the 16 to 19 years age range has the highest percentage of unemployed individuals, with 38.9% or 63 of them being unemployed.
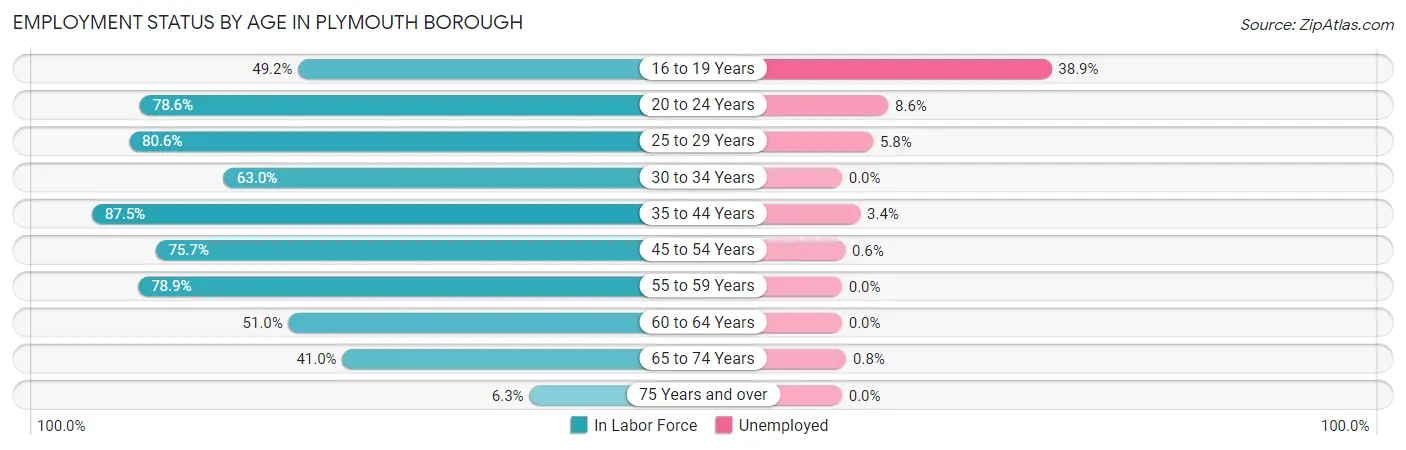
| Age Bracket | In Labor Force | Unemployed |
| 16 to 19 Years | 162 (49.2%) | 63 (38.9%) |
| 20 to 24 Years | 198 (78.6%) | 17 (8.6%) |
| 25 to 29 Years | 311 (80.6%) | 18 (5.8%) |
| 30 to 34 Years | 150 (63.0%) | 0 (0.0%) |
| 35 to 44 Years | 595 (87.5%) | 20 (3.4%) |
| 45 to 54 Years | 659 (75.7%) | 4 (0.6%) |
| 55 to 59 Years | 299 (78.9%) | 0 (0.0%) |
| 60 to 64 Years | 219 (51.0%) | 0 (0.0%) |
| 65 to 74 Years | 240 (41.0%) | 2 (0.8%) |
| 75 Years and over | 20 (6.3%) | 0 (0.0%) |
| Total | 2,852 (63.9%) | 123 (4.3%) |
Employment Status by Educational Attainment in Plymouth borough
According to labor force statistics for Plymouth borough, 74.9% of individuals (2,234) out of the total population between 25 and 64 years of age (2,982) are in the labor force, with 1.9% or 42 of them being unemployed. The group with the highest labor force participation rate are those with the educational attainment of bachelor's degree or higher, with 84.4% or 293 individuals in the labor force. Within the labor force, individuals with college / associate degree education have the highest percentage of unemployment, with 5.4% or 35 of them being unemployed.
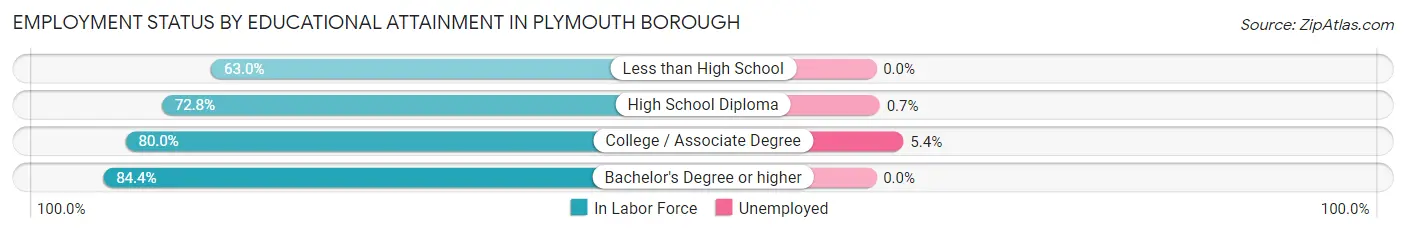
| Educational Attainment | In Labor Force | Unemployed |
| Less than High School | 232 (63.0%) | 0 (0.0%) |
| High School Diploma | 1,059 (72.8%) | 10 (0.7%) |
| College / Associate Degree | 650 (80.0%) | 44 (5.4%) |
| Bachelor's Degree or higher | 293 (84.4%) | 0 (0.0%) |
| Total | 2,234 (74.9%) | 57 (1.9%) |
Employment Occupations by Sex in Plymouth borough
Management, Business, Science and Arts Occupations
The most common Management, Business, Science and Arts occupations in Plymouth borough are Community & Social Service (282 | 10.3%), Management (219 | 8.0%), Education Instruction & Library (182 | 6.7%), Health Diagnosing & Treating (151 | 5.5%), and Education, Arts & Media (63 | 2.3%).
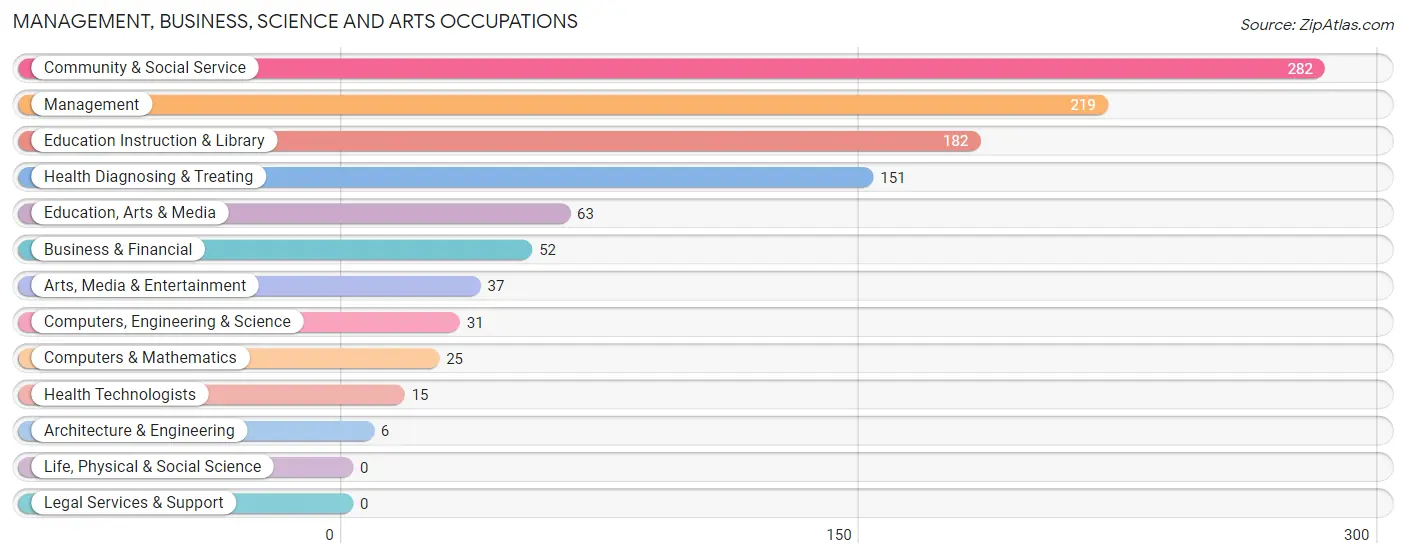
Management, Business, Science and Arts Occupations by Sex
Within the Management, Business, Science and Arts occupations in Plymouth borough, the most male-oriented occupations are Computers, Engineering & Science (100.0%), Computers & Mathematics (100.0%), and Architecture & Engineering (100.0%), while the most female-oriented occupations are Health Technologists (100.0%), Education Instruction & Library (77.5%), and Community & Social Service (73.4%).
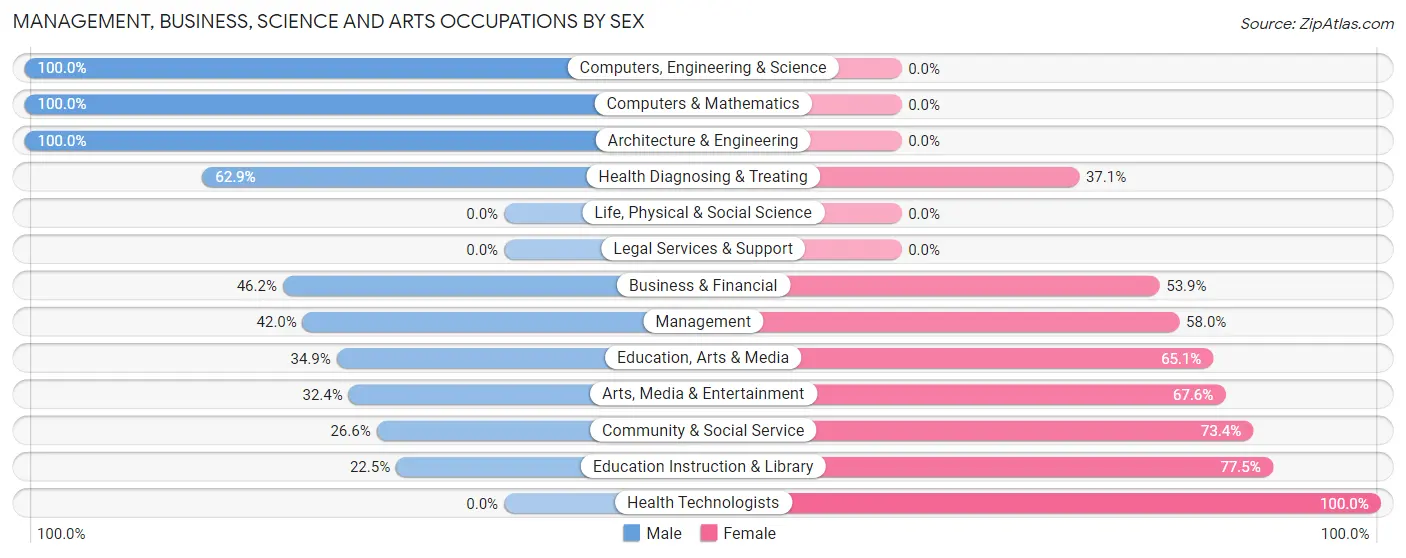
| Occupation | Male | Female |
| Management | 92 (42.0%) | 127 (58.0%) |
| Business & Financial | 24 (46.2%) | 28 (53.8%) |
| Computers, Engineering & Science | 31 (100.0%) | 0 (0.0%) |
| Computers & Mathematics | 25 (100.0%) | 0 (0.0%) |
| Architecture & Engineering | 6 (100.0%) | 0 (0.0%) |
| Life, Physical & Social Science | 0 (0.0%) | 0 (0.0%) |
| Community & Social Service | 75 (26.6%) | 207 (73.4%) |
| Education, Arts & Media | 22 (34.9%) | 41 (65.1%) |
| Legal Services & Support | 0 (0.0%) | 0 (0.0%) |
| Education Instruction & Library | 41 (22.5%) | 141 (77.5%) |
| Arts, Media & Entertainment | 12 (32.4%) | 25 (67.6%) |
| Health Diagnosing & Treating | 95 (62.9%) | 56 (37.1%) |
| Health Technologists | 0 (0.0%) | 15 (100.0%) |
| Total (Category) | 317 (43.1%) | 418 (56.9%) |
| Total (Overall) | 1,455 (53.3%) | 1,274 (46.7%) |
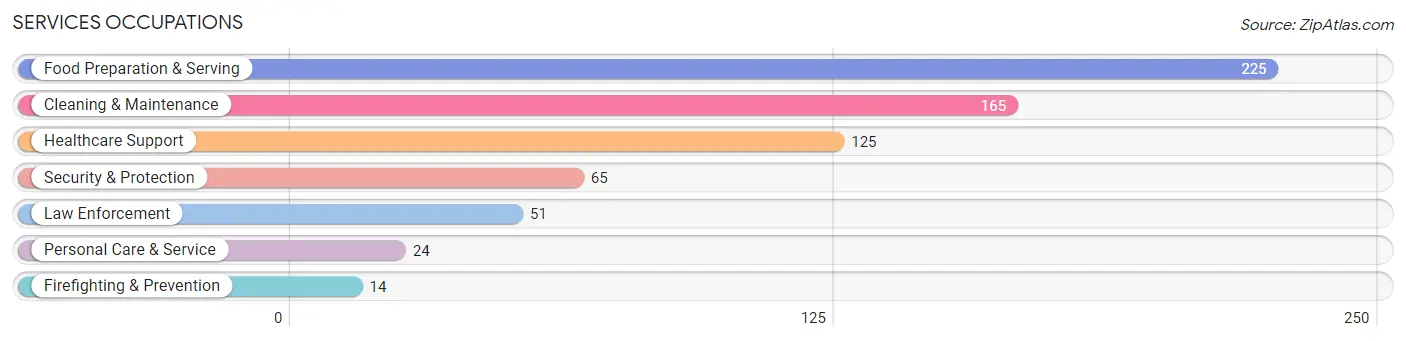
Services Occupations
The most common Services occupations in Plymouth borough are Food Preparation & Serving (225 | 8.2%), Cleaning & Maintenance (165 | 6.0%), Healthcare Support (125 | 4.6%), Security & Protection (65 | 2.4%), and Law Enforcement (51 | 1.9%).
Services Occupations by Sex
Within the Services occupations in Plymouth borough, the most male-oriented occupations are Law Enforcement (92.2%), Security & Protection (83.1%), and Cleaning & Maintenance (80.6%), while the most female-oriented occupations are Personal Care & Service (100.0%), Healthcare Support (96.8%), and Food Preparation & Serving (50.2%).
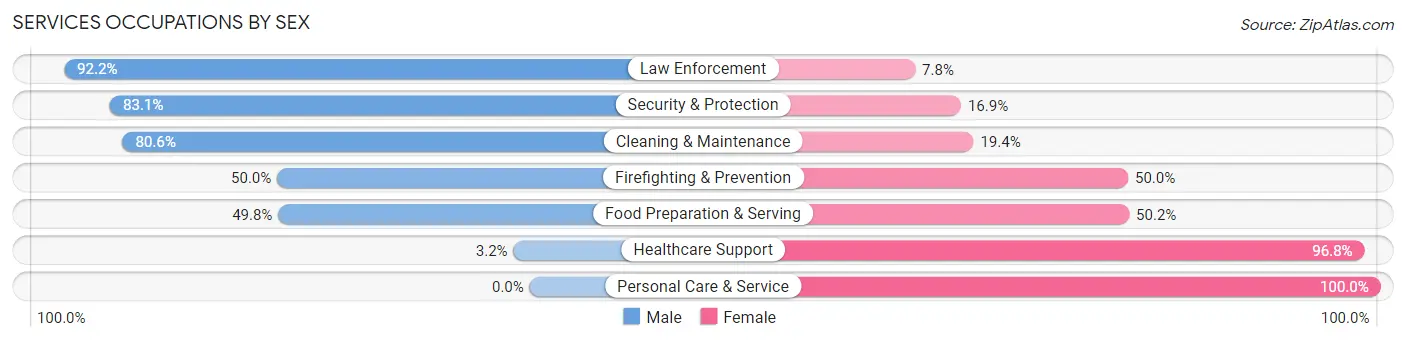
| Occupation | Male | Female |
| Healthcare Support | 4 (3.2%) | 121 (96.8%) |
| Security & Protection | 54 (83.1%) | 11 (16.9%) |
| Firefighting & Prevention | 7 (50.0%) | 7 (50.0%) |
| Law Enforcement | 47 (92.2%) | 4 (7.8%) |
| Food Preparation & Serving | 112 (49.8%) | 113 (50.2%) |
| Cleaning & Maintenance | 133 (80.6%) | 32 (19.4%) |
| Personal Care & Service | 0 (0.0%) | 24 (100.0%) |
| Total (Category) | 303 (50.2%) | 301 (49.8%) |
| Total (Overall) | 1,455 (53.3%) | 1,274 (46.7%) |
Sales and Office Occupations
The most common Sales and Office occupations in Plymouth borough are Office & Administration (343 | 12.6%), and Sales & Related (252 | 9.2%).
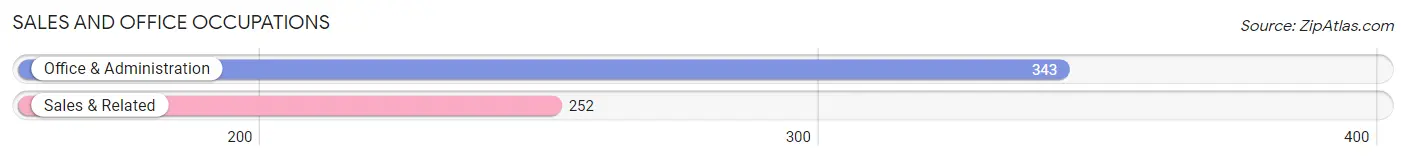
Sales and Office Occupations by Sex
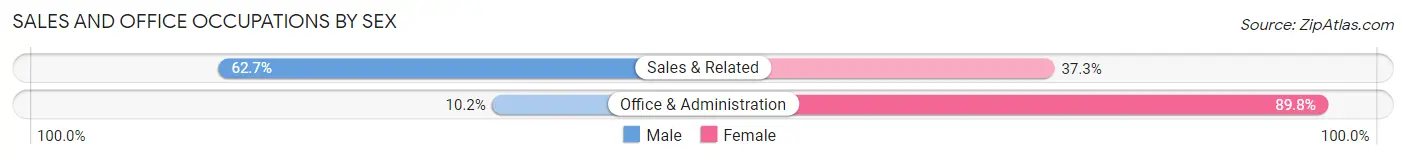
| Occupation | Male | Female |
| Sales & Related | 158 (62.7%) | 94 (37.3%) |
| Office & Administration | 35 (10.2%) | 308 (89.8%) |
| Total (Category) | 193 (32.4%) | 402 (67.6%) |
| Total (Overall) | 1,455 (53.3%) | 1,274 (46.7%) |
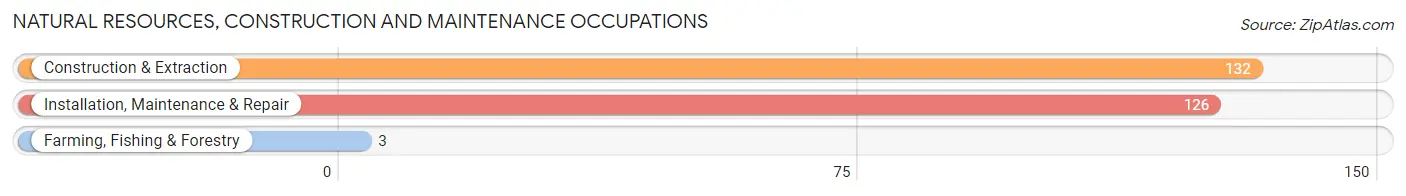
Natural Resources, Construction and Maintenance Occupations
The most common Natural Resources, Construction and Maintenance occupations in Plymouth borough are Construction & Extraction (132 | 4.8%), Installation, Maintenance & Repair (126 | 4.6%), and Farming, Fishing & Forestry (3 | 0.1%).
Natural Resources, Construction and Maintenance Occupations by Sex
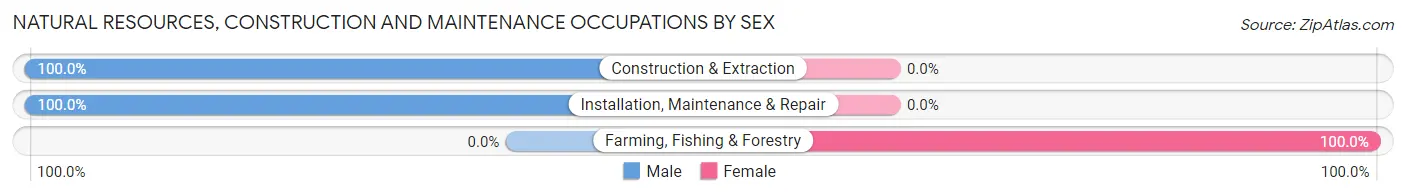
| Occupation | Male | Female |
| Farming, Fishing & Forestry | 0 (0.0%) | 3 (100.0%) |
| Construction & Extraction | 132 (100.0%) | 0 (0.0%) |
| Installation, Maintenance & Repair | 126 (100.0%) | 0 (0.0%) |
| Total (Category) | 258 (98.9%) | 3 (1.1%) |
| Total (Overall) | 1,455 (53.3%) | 1,274 (46.7%) |
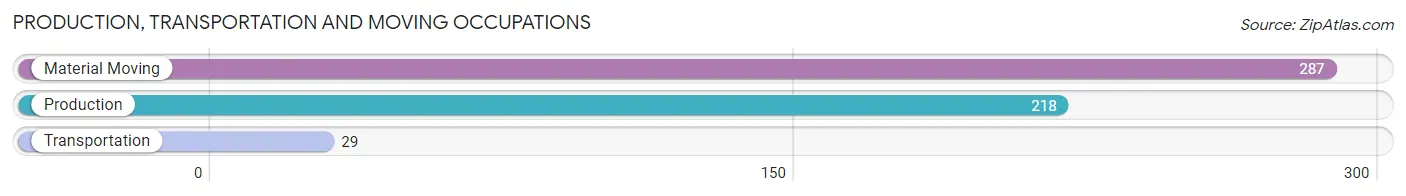
Production, Transportation and Moving Occupations
The most common Production, Transportation and Moving occupations in Plymouth borough are Material Moving (287 | 10.5%), Production (218 | 8.0%), and Transportation (29 | 1.1%).
Production, Transportation and Moving Occupations by Sex
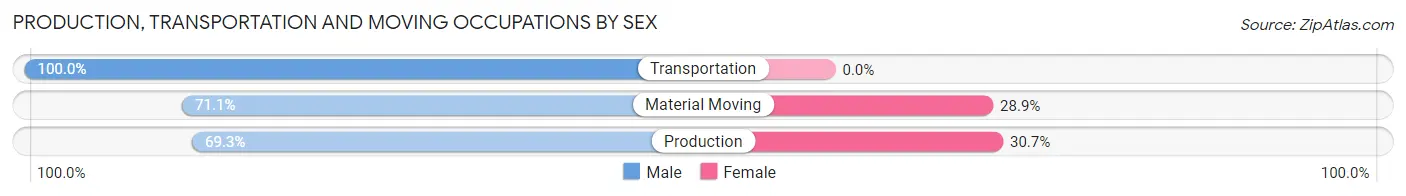
| Occupation | Male | Female |
| Production | 151 (69.3%) | 67 (30.7%) |
| Transportation | 29 (100.0%) | 0 (0.0%) |
| Material Moving | 204 (71.1%) | 83 (28.9%) |
| Total (Category) | 384 (71.9%) | 150 (28.1%) |
| Total (Overall) | 1,455 (53.3%) | 1,274 (46.7%) |
Employment Industries by Sex in Plymouth borough
Employment Industries in Plymouth borough
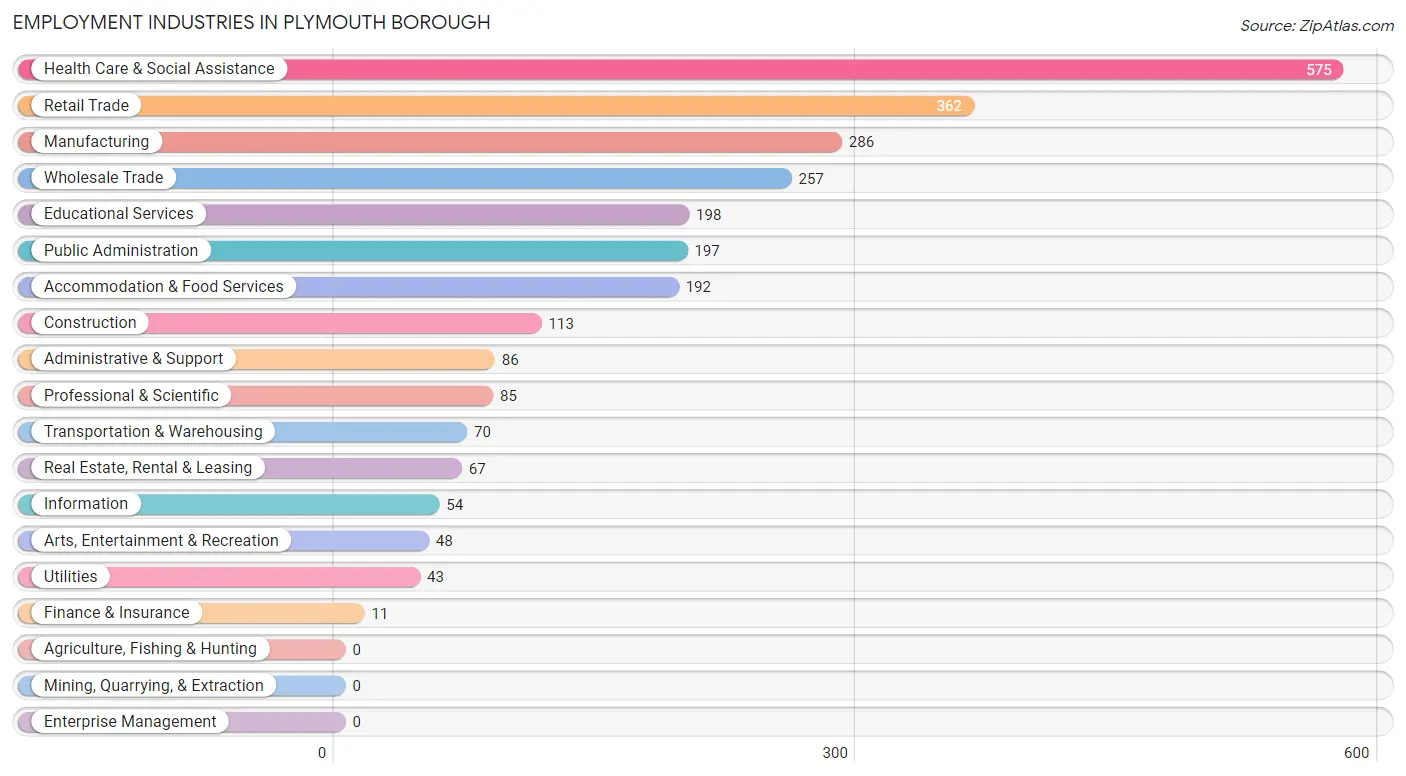
The major employment industries in Plymouth borough include Health Care & Social Assistance (575 | 21.1%), Retail Trade (362 | 13.3%), Manufacturing (286 | 10.5%), Wholesale Trade (257 | 9.4%), and Educational Services (198 | 7.3%).
Employment Industries by Sex in Plymouth borough
The Plymouth borough industries that see more men than women are Construction (100.0%), Transportation & Warehousing (82.9%), and Administrative & Support (79.1%), whereas the industries that tend to have a higher number of women are Finance & Insurance (100.0%), Real Estate, Rental & Leasing (94.0%), and Health Care & Social Assistance (71.0%).
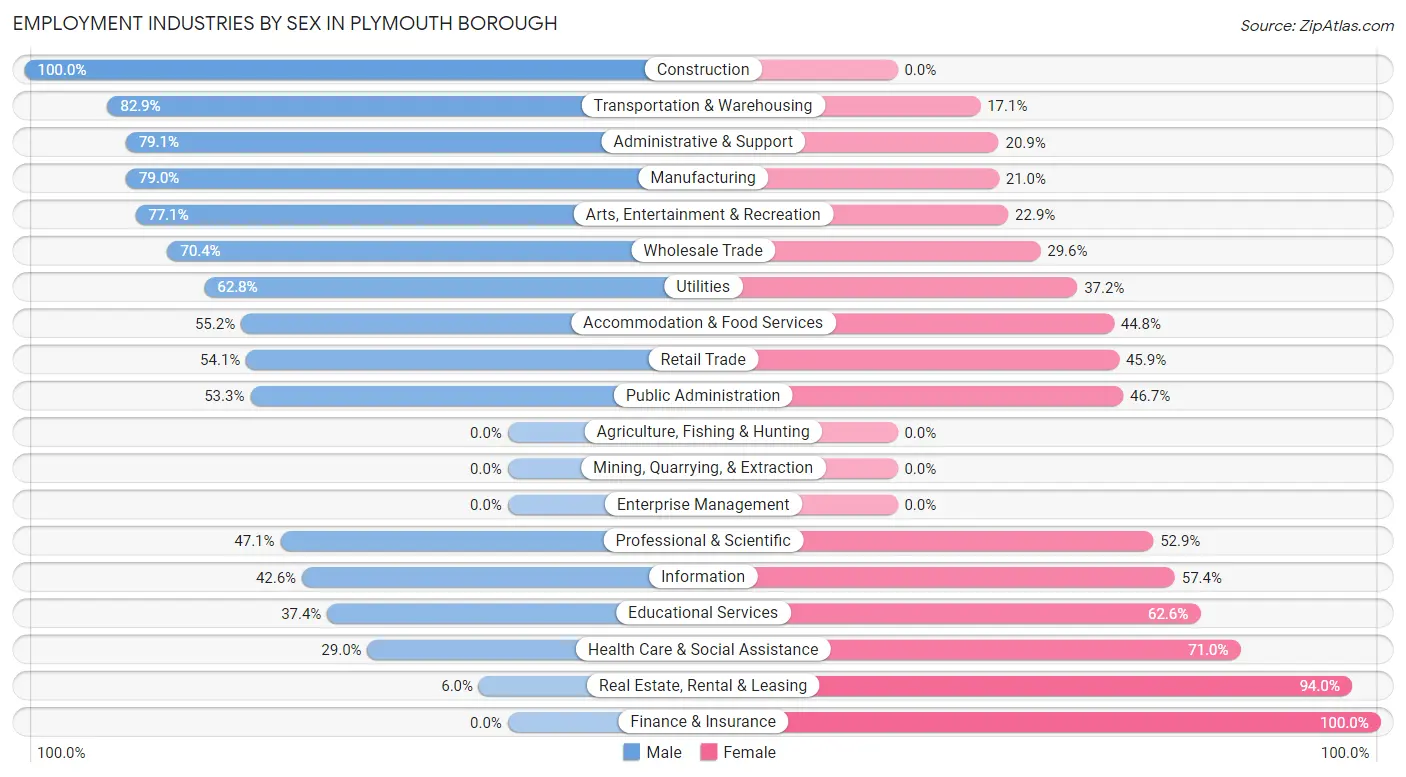
| Industry | Male | Female |
| Agriculture, Fishing & Hunting | 0 (0.0%) | 0 (0.0%) |
| Mining, Quarrying, & Extraction | 0 (0.0%) | 0 (0.0%) |
| Construction | 113 (100.0%) | 0 (0.0%) |
| Manufacturing | 226 (79.0%) | 60 (21.0%) |
| Wholesale Trade | 181 (70.4%) | 76 (29.6%) |
| Retail Trade | 196 (54.1%) | 166 (45.9%) |
| Transportation & Warehousing | 58 (82.9%) | 12 (17.1%) |
| Utilities | 27 (62.8%) | 16 (37.2%) |
| Information | 23 (42.6%) | 31 (57.4%) |
| Finance & Insurance | 0 (0.0%) | 11 (100.0%) |
| Real Estate, Rental & Leasing | 4 (6.0%) | 63 (94.0%) |
| Professional & Scientific | 40 (47.1%) | 45 (52.9%) |
| Enterprise Management | 0 (0.0%) | 0 (0.0%) |
| Administrative & Support | 68 (79.1%) | 18 (20.9%) |
| Educational Services | 74 (37.4%) | 124 (62.6%) |
| Health Care & Social Assistance | 167 (29.0%) | 408 (71.0%) |
| Arts, Entertainment & Recreation | 37 (77.1%) | 11 (22.9%) |
| Accommodation & Food Services | 106 (55.2%) | 86 (44.8%) |
| Public Administration | 105 (53.3%) | 92 (46.7%) |
| Total | 1,455 (53.3%) | 1,274 (46.7%) |
Education in Plymouth borough
School Enrollment in Plymouth borough
The most common levels of schooling among the 1,428 students in Plymouth borough are high school (456 | 31.9%), elementary school (275 | 19.3%), and middle school (258 | 18.1%).
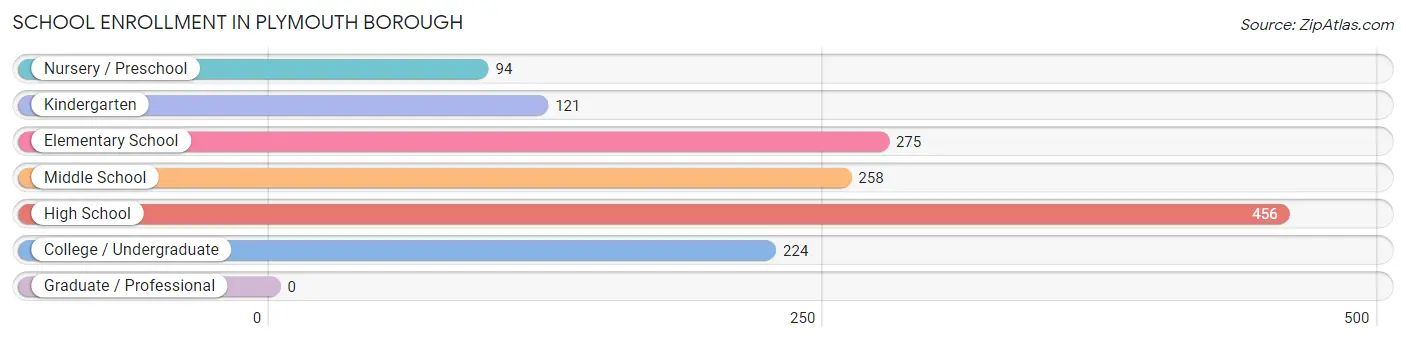
| School Level | # Students | % Students |
| Nursery / Preschool | 94 | 6.6% |
| Kindergarten | 121 | 8.5% |
| Elementary School | 275 | 19.3% |
| Middle School | 258 | 18.1% |
| High School | 456 | 31.9% |
| College / Undergraduate | 224 | 15.7% |
| Graduate / Professional | 0 | 0.0% |
| Total | 1,428 | 100.0% |
School Enrollment by Age by Funding Source in Plymouth borough
Out of a total of 1,428 students who are enrolled in schools in Plymouth borough, 178 (12.5%) attend a private institution, while the remaining 1,250 (87.5%) are enrolled in public schools. The age group of 20 to 24 year olds has the highest likelihood of being enrolled in private schools, with 64 (66.0% in the age bracket) enrolled. Conversely, the age group of 35 years and over has the lowest likelihood of being enrolled in a private school, with 40 (100.0% in the age bracket) attending a public institution.
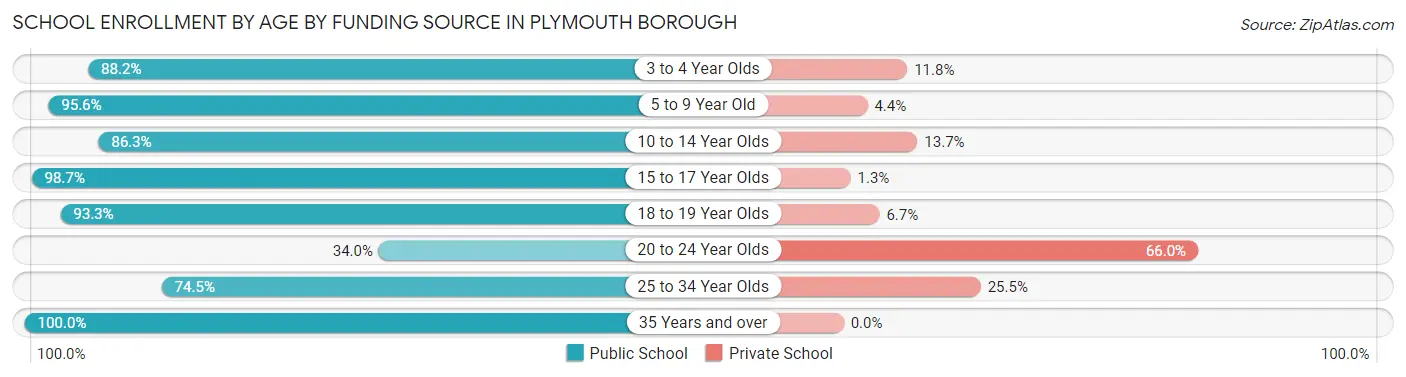
| Age Bracket | Public School | Private School |
| 3 to 4 Year Olds | 67 (88.2%) | 9 (11.8%) |
| 5 to 9 Year Old | 388 (95.6%) | 18 (4.4%) |
| 10 to 14 Year Olds | 352 (86.3%) | 56 (13.7%) |
| 15 to 17 Year Olds | 229 (98.7%) | 3 (1.3%) |
| 18 to 19 Year Olds | 70 (93.3%) | 5 (6.7%) |
| 20 to 24 Year Olds | 33 (34.0%) | 64 (66.0%) |
| 25 to 34 Year Olds | 70 (74.5%) | 24 (25.5%) |
| 35 Years and over | 40 (100.0%) | 0 (0.0%) |
| Total | 1,250 (87.5%) | 178 (12.5%) |
Educational Attainment by Field of Study in Plymouth borough
Education (150 | 30.9%), business (87 | 17.9%), social sciences (56 | 11.6%), engineering (33 | 6.8%), and communications (33 | 6.8%) are the most common fields of study among 485 individuals in Plymouth borough who have obtained a bachelor's degree or higher.
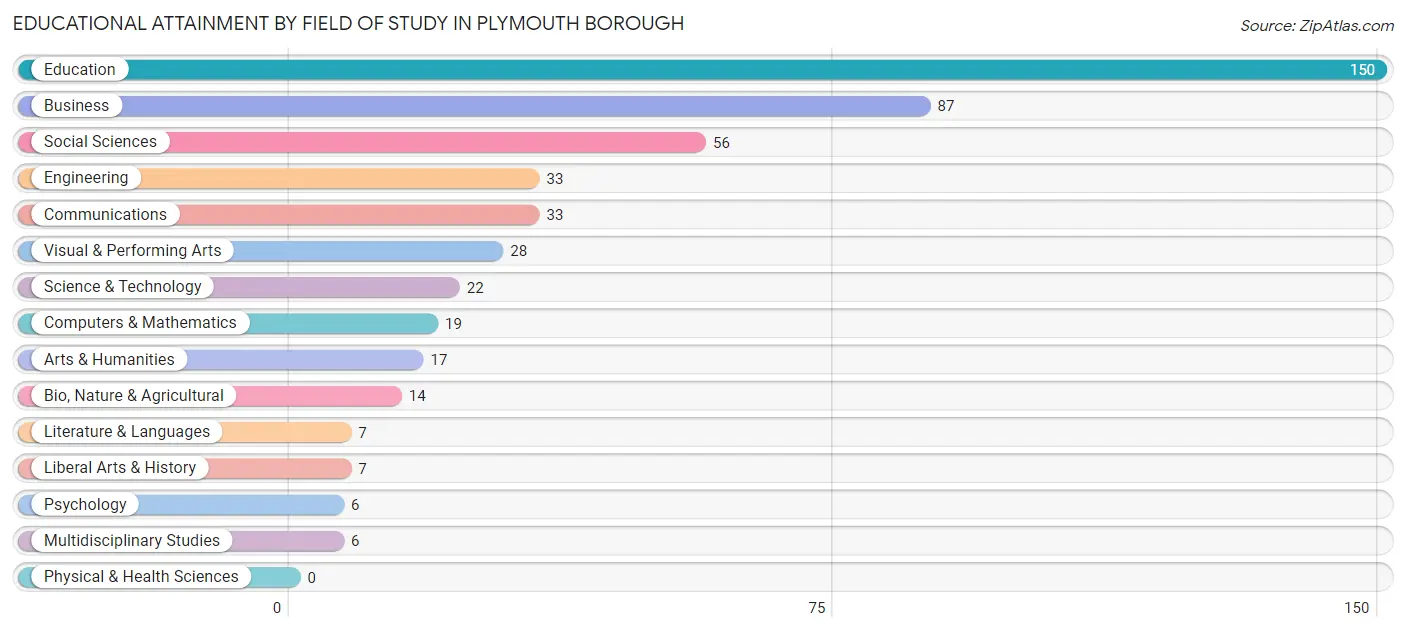
| Field of Study | # Graduates | % Graduates |
| Computers & Mathematics | 19 | 3.9% |
| Bio, Nature & Agricultural | 14 | 2.9% |
| Physical & Health Sciences | 0 | 0.0% |
| Psychology | 6 | 1.2% |
| Social Sciences | 56 | 11.6% |
| Engineering | 33 | 6.8% |
| Multidisciplinary Studies | 6 | 1.2% |
| Science & Technology | 22 | 4.5% |
| Business | 87 | 17.9% |
| Education | 150 | 30.9% |
| Literature & Languages | 7 | 1.4% |
| Liberal Arts & History | 7 | 1.4% |
| Visual & Performing Arts | 28 | 5.8% |
| Communications | 33 | 6.8% |
| Arts & Humanities | 17 | 3.5% |
| Total | 485 | 100.0% |
Transportation & Commute in Plymouth borough
Vehicle Availability by Sex in Plymouth borough
The most prevalent vehicle ownership categories in Plymouth borough are males with 2 vehicles (515, accounting for 35.7%) and females with 2 vehicles (495, making up 40.9%).
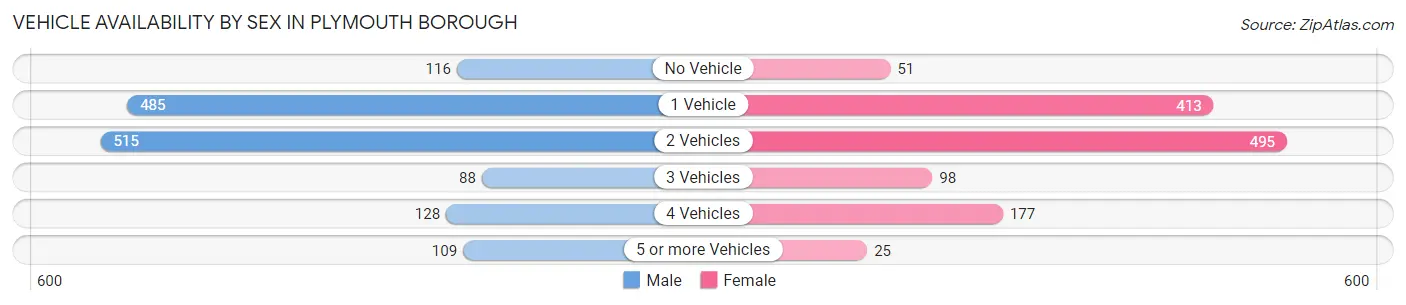
| Vehicles Available | Male | Female |
| No Vehicle | 116 (8.1%) | 51 (4.1%) |
| 1 Vehicle | 485 (33.7%) | 413 (32.8%) |
| 2 Vehicles | 515 (35.7%) | 495 (39.3%) |
| 3 Vehicles | 88 (6.1%) | 98 (7.8%) |
| 4 Vehicles | 128 (8.9%) | 177 (14.1%) |
| 5 or more Vehicles | 109 (7.6%) | 25 (2.0%) |
| Total | 1,441 (100.0%) | 1,259 (100.0%) |
Commute Time in Plymouth borough
The most frequently occuring commute durations in Plymouth borough are 15 to 19 minutes (639 commuters, 24.1%), 10 to 14 minutes (443 commuters, 16.7%), and 5 to 9 minutes (321 commuters, 12.1%).
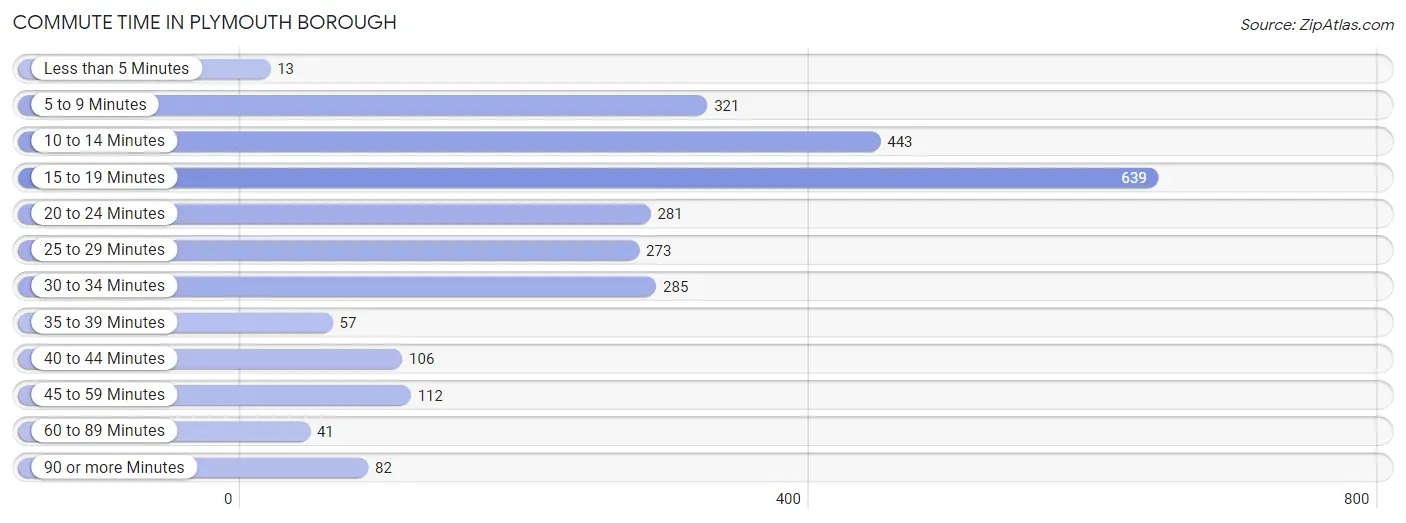
| Commute Time | # Commuters | % Commuters |
| Less than 5 Minutes | 13 | 0.5% |
| 5 to 9 Minutes | 321 | 12.1% |
| 10 to 14 Minutes | 443 | 16.7% |
| 15 to 19 Minutes | 639 | 24.1% |
| 20 to 24 Minutes | 281 | 10.6% |
| 25 to 29 Minutes | 273 | 10.3% |
| 30 to 34 Minutes | 285 | 10.7% |
| 35 to 39 Minutes | 57 | 2.1% |
| 40 to 44 Minutes | 106 | 4.0% |
| 45 to 59 Minutes | 112 | 4.2% |
| 60 to 89 Minutes | 41 | 1.5% |
| 90 or more Minutes | 82 | 3.1% |
Commute Time by Sex in Plymouth borough
The most common commute times in Plymouth borough are 15 to 19 minutes (338 commuters, 23.5%) for males and 15 to 19 minutes (301 commuters, 24.8%) for females.
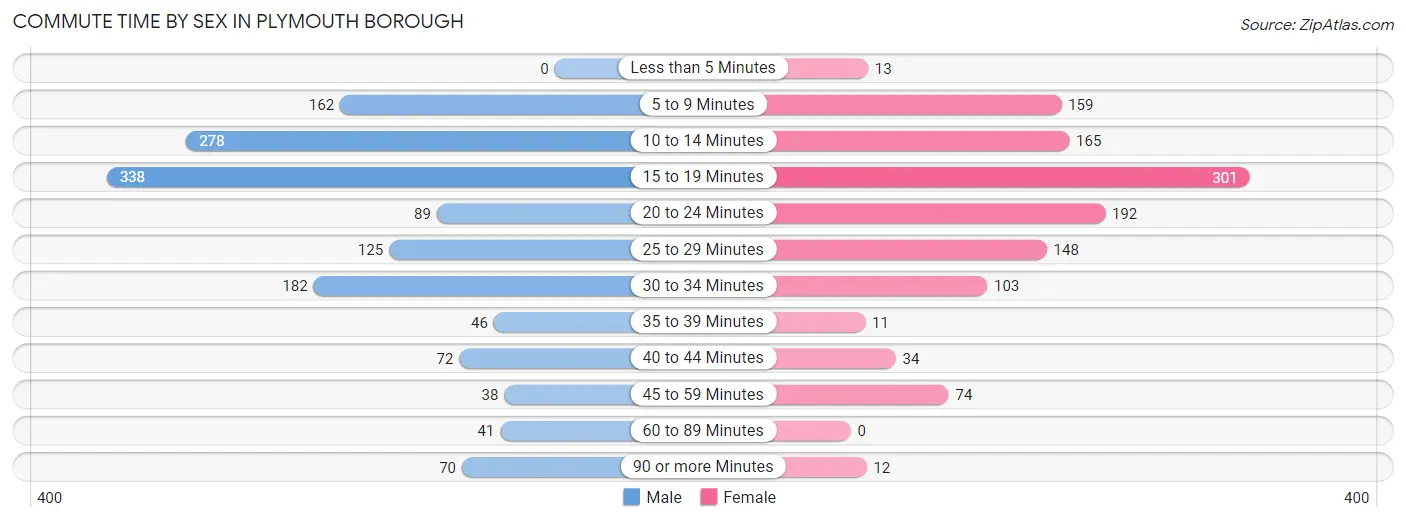
| Commute Time | Male | Female |
| Less than 5 Minutes | 0 (0.0%) | 13 (1.1%) |
| 5 to 9 Minutes | 162 (11.2%) | 159 (13.1%) |
| 10 to 14 Minutes | 278 (19.3%) | 165 (13.6%) |
| 15 to 19 Minutes | 338 (23.5%) | 301 (24.8%) |
| 20 to 24 Minutes | 89 (6.2%) | 192 (15.8%) |
| 25 to 29 Minutes | 125 (8.7%) | 148 (12.2%) |
| 30 to 34 Minutes | 182 (12.6%) | 103 (8.5%) |
| 35 to 39 Minutes | 46 (3.2%) | 11 (0.9%) |
| 40 to 44 Minutes | 72 (5.0%) | 34 (2.8%) |
| 45 to 59 Minutes | 38 (2.6%) | 74 (6.1%) |
| 60 to 89 Minutes | 41 (2.9%) | 0 (0.0%) |
| 90 or more Minutes | 70 (4.9%) | 12 (1.0%) |
Time of Departure to Work by Sex in Plymouth borough
The most frequent times of departure to work in Plymouth borough are 7:00 AM to 7:29 AM (213, 14.8%) for males and 7:30 AM to 7:59 AM (274, 22.6%) for females.
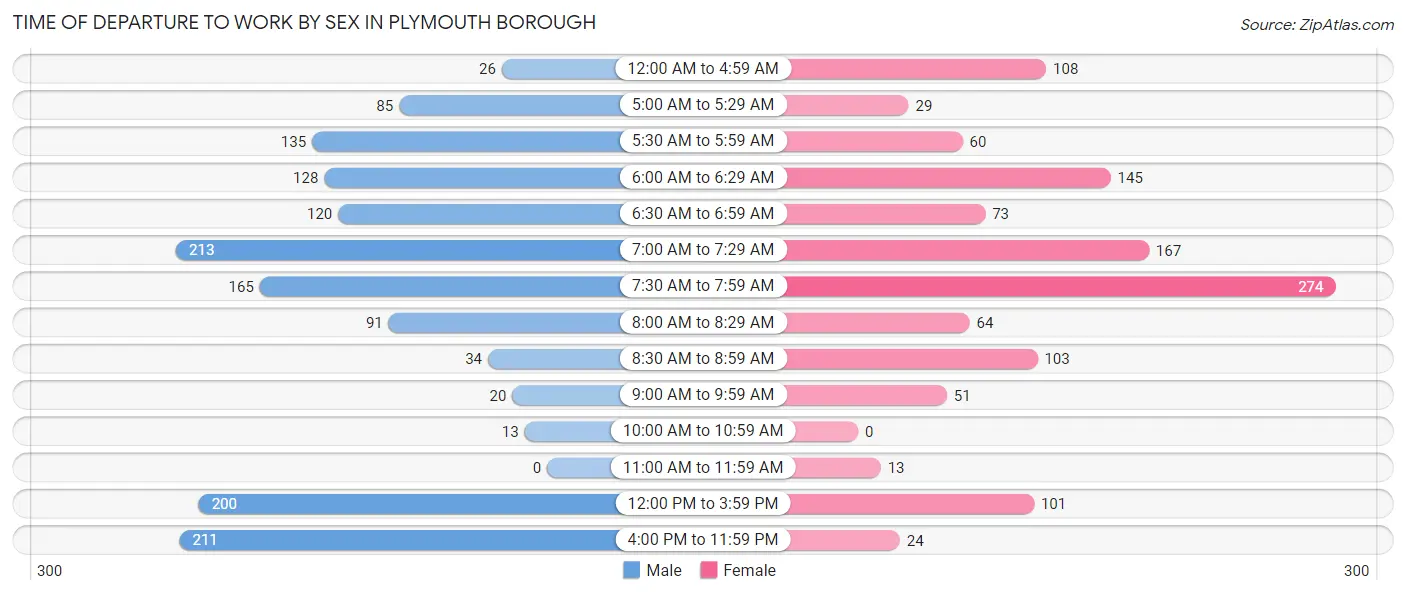
| Time of Departure | Male | Female |
| 12:00 AM to 4:59 AM | 26 (1.8%) | 108 (8.9%) |
| 5:00 AM to 5:29 AM | 85 (5.9%) | 29 (2.4%) |
| 5:30 AM to 5:59 AM | 135 (9.4%) | 60 (5.0%) |
| 6:00 AM to 6:29 AM | 128 (8.9%) | 145 (12.0%) |
| 6:30 AM to 6:59 AM | 120 (8.3%) | 73 (6.0%) |
| 7:00 AM to 7:29 AM | 213 (14.8%) | 167 (13.8%) |
| 7:30 AM to 7:59 AM | 165 (11.5%) | 274 (22.6%) |
| 8:00 AM to 8:29 AM | 91 (6.3%) | 64 (5.3%) |
| 8:30 AM to 8:59 AM | 34 (2.4%) | 103 (8.5%) |
| 9:00 AM to 9:59 AM | 20 (1.4%) | 51 (4.2%) |
| 10:00 AM to 10:59 AM | 13 (0.9%) | 0 (0.0%) |
| 11:00 AM to 11:59 AM | 0 (0.0%) | 13 (1.1%) |
| 12:00 PM to 3:59 PM | 200 (13.9%) | 101 (8.3%) |
| 4:00 PM to 11:59 PM | 211 (14.6%) | 24 (2.0%) |
| Total | 1,441 (100.0%) | 1,212 (100.0%) |
Housing Occupancy in Plymouth borough
Occupancy by Ownership in Plymouth borough
Of the total 2,405 dwellings in Plymouth borough, owner-occupied units account for 1,123 (46.7%), while renter-occupied units make up 1,282 (53.3%).
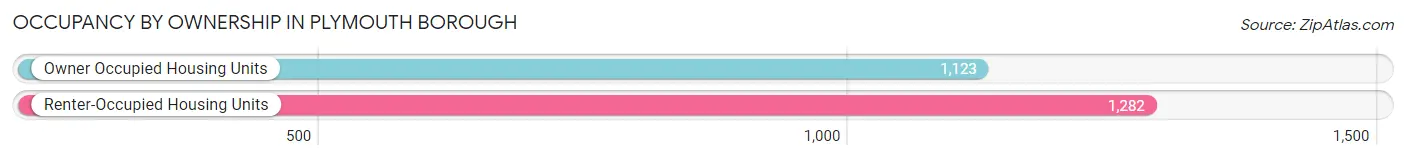
| Occupancy | # Housing Units | % Housing Units |
| Owner Occupied Housing Units | 1,123 | 46.7% |
| Renter-Occupied Housing Units | 1,282 | 53.3% |
| Total Occupied Housing Units | 2,405 | 100.0% |
Occupancy by Household Size in Plymouth borough
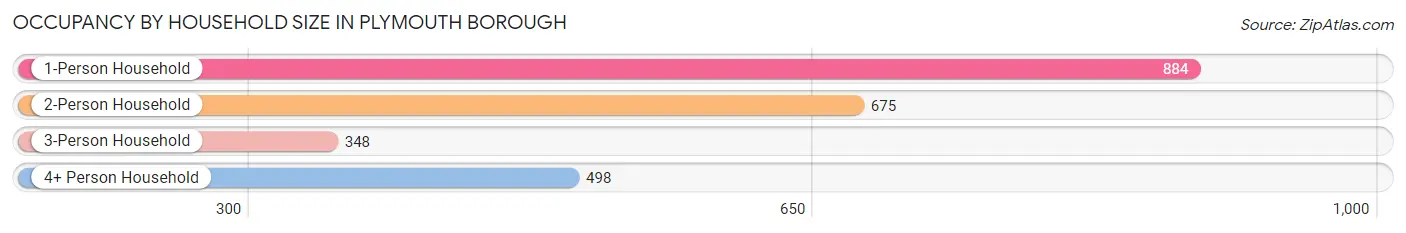
| Household Size | # Housing Units | % Housing Units |
| 1-Person Household | 884 | 36.8% |
| 2-Person Household | 675 | 28.1% |
| 3-Person Household | 348 | 14.5% |
| 4+ Person Household | 498 | 20.7% |
| Total Housing Units | 2,405 | 100.0% |
Occupancy by Ownership by Household Size in Plymouth borough
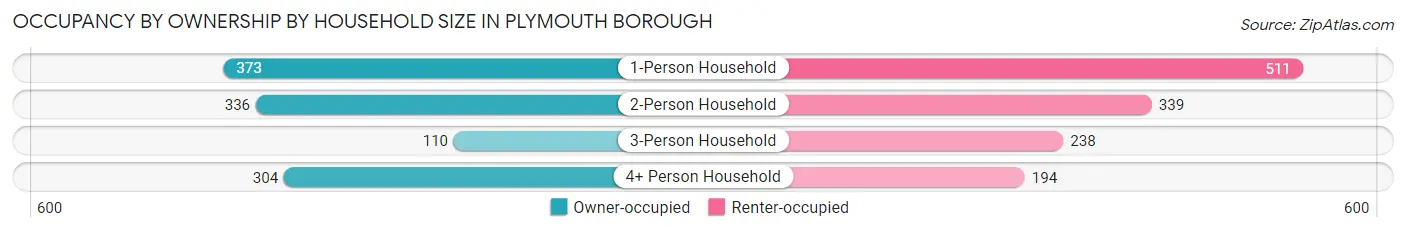
| Household Size | Owner-occupied | Renter-occupied |
| 1-Person Household | 373 (42.2%) | 511 (57.8%) |
| 2-Person Household | 336 (49.8%) | 339 (50.2%) |
| 3-Person Household | 110 (31.6%) | 238 (68.4%) |
| 4+ Person Household | 304 (61.0%) | 194 (39.0%) |
| Total Housing Units | 1,123 (46.7%) | 1,282 (53.3%) |
Occupancy by Educational Attainment in Plymouth borough
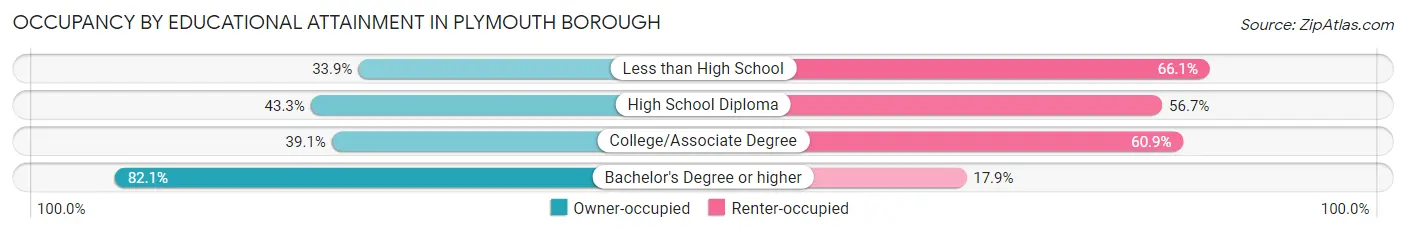
| Household Size | Owner-occupied | Renter-occupied |
| Less than High School | 85 (33.9%) | 166 (66.1%) |
| High School Diploma | 478 (43.3%) | 626 (56.7%) |
| College/Associate Degree | 275 (39.1%) | 428 (60.9%) |
| Bachelor's Degree or higher | 285 (82.1%) | 62 (17.9%) |
Occupancy by Age of Householder in Plymouth borough
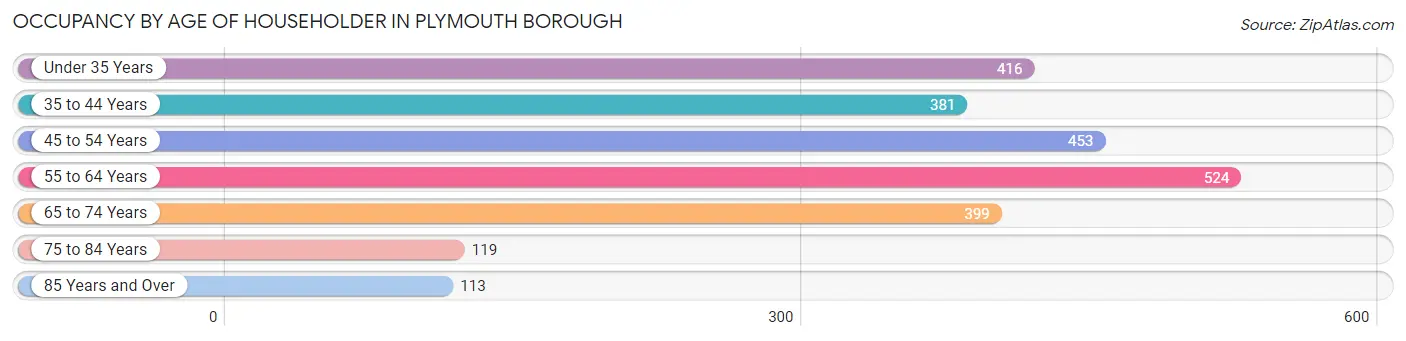
| Age Bracket | # Households | % Households |
| Under 35 Years | 416 | 17.3% |
| 35 to 44 Years | 381 | 15.8% |
| 45 to 54 Years | 453 | 18.8% |
| 55 to 64 Years | 524 | 21.8% |
| 65 to 74 Years | 399 | 16.6% |
| 75 to 84 Years | 119 | 5.0% |
| 85 Years and Over | 113 | 4.7% |
| Total | 2,405 | 100.0% |
Housing Finances in Plymouth borough
Median Income by Occupancy in Plymouth borough
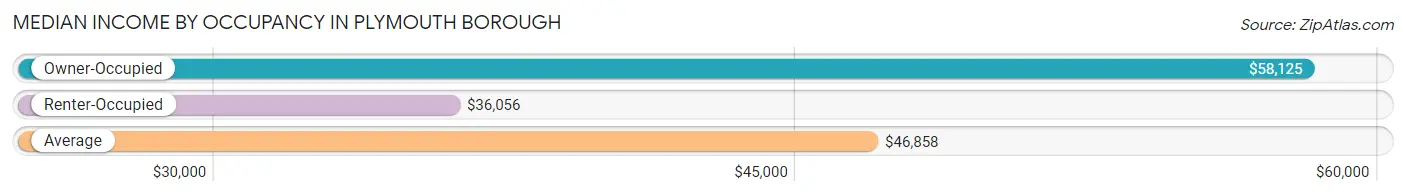
| Occupancy Type | # Households | Median Income |
| Owner-Occupied | 1,123 (46.7%) | $58,125 |
| Renter-Occupied | 1,282 (53.3%) | $36,056 |
| Average | 2,405 (100.0%) | $46,858 |
Occupancy by Householder Income Bracket in Plymouth borough
| Income Bracket | Owner-occupied | Renter-occupied |
| Less than $5,000 | 53 (4.7%) | 38 (3.0%) |
| $5,000 to $9,999 | 4 (0.4%) | 5 (0.4%) |
| $10,000 to $14,999 | 38 (3.4%) | 136 (10.6%) |
| $15,000 to $19,999 | 71 (6.3%) | 57 (4.4%) |
| $20,000 to $24,999 | 44 (3.9%) | 7 (0.5%) |
| $25,000 to $34,999 | 101 (9.0%) | 349 (27.2%) |
| $35,000 to $49,999 | 153 (13.6%) | 199 (15.5%) |
| $50,000 to $74,999 | 200 (17.8%) | 277 (21.6%) |
| $75,000 to $99,999 | 137 (12.2%) | 101 (7.9%) |
| $100,000 to $149,999 | 231 (20.6%) | 81 (6.3%) |
| $150,000 or more | 91 (8.1%) | 32 (2.5%) |
| Total | 1,123 (100.0%) | 1,282 (100.0%) |
Monthly Housing Cost Tiers in Plymouth borough
| Monthly Cost | Owner-occupied | Renter-occupied |
| Less than $300 | 55 (4.9%) | 108 (8.4%) |
| $300 to $499 | 234 (20.8%) | 81 (6.3%) |
| $500 to $799 | 447 (39.8%) | 300 (23.4%) |
| $800 to $999 | 154 (13.7%) | 312 (24.3%) |
| $1,000 to $1,499 | 174 (15.5%) | 314 (24.5%) |
| $1,500 to $1,999 | 42 (3.7%) | 56 (4.4%) |
| $2,000 to $2,499 | 0 (0.0%) | 12 (0.9%) |
| $2,500 to $2,999 | 0 (0.0%) | 0 (0.0%) |
| $3,000 or more | 17 (1.5%) | 0 (0.0%) |
| Total | 1,123 (100.0%) | 1,282 (100.0%) |
Physical Housing Characteristics in Plymouth borough
Housing Structures in Plymouth borough
| Structure Type | # Housing Units | % Housing Units |
| Single Unit, Detached | 1,136 | 47.2% |
| Single Unit, Attached | 662 | 27.5% |
| 2 Unit Apartments | 208 | 8.6% |
| 3 or 4 Unit Apartments | 120 | 5.0% |
| 5 to 9 Unit Apartments | 72 | 3.0% |
| 10 or more Apartments | 206 | 8.6% |
| Mobile Home / Other | 1 | 0.0% |
| Total | 2,405 | 100.0% |
Housing Structures by Occupancy in Plymouth borough
| Structure Type | Owner-occupied | Renter-occupied |
| Single Unit, Detached | 857 (75.4%) | 279 (24.6%) |
| Single Unit, Attached | 237 (35.8%) | 425 (64.2%) |
| 2 Unit Apartments | 16 (7.7%) | 192 (92.3%) |
| 3 or 4 Unit Apartments | 6 (5.0%) | 114 (95.0%) |
| 5 to 9 Unit Apartments | 6 (8.3%) | 66 (91.7%) |
| 10 or more Apartments | 0 (0.0%) | 206 (100.0%) |
| Mobile Home / Other | 1 (100.0%) | 0 (0.0%) |
| Total | 1,123 (46.7%) | 1,282 (53.3%) |
Housing Structures by Number of Rooms in Plymouth borough
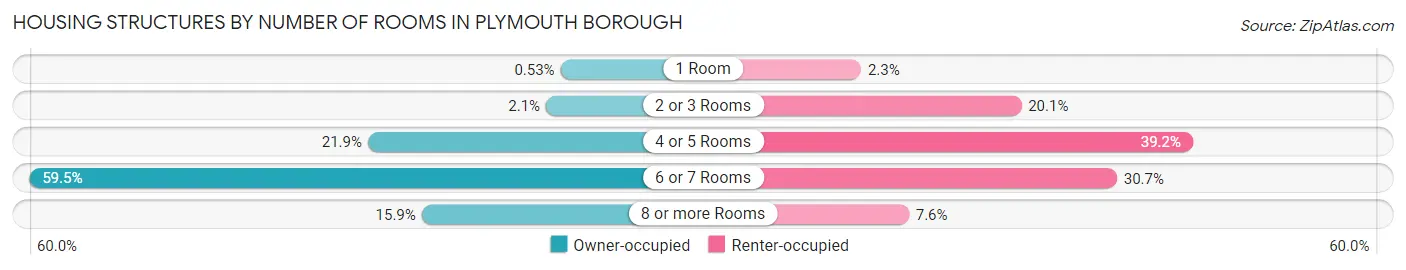
| Number of Rooms | Owner-occupied | Renter-occupied |
| 1 Room | 6 (0.5%) | 30 (2.3%) |
| 2 or 3 Rooms | 24 (2.1%) | 258 (20.1%) |
| 4 or 5 Rooms | 246 (21.9%) | 502 (39.2%) |
| 6 or 7 Rooms | 668 (59.5%) | 394 (30.7%) |
| 8 or more Rooms | 179 (15.9%) | 98 (7.6%) |
| Total | 1,123 (100.0%) | 1,282 (100.0%) |
Housing Structure by Heating Type in Plymouth borough
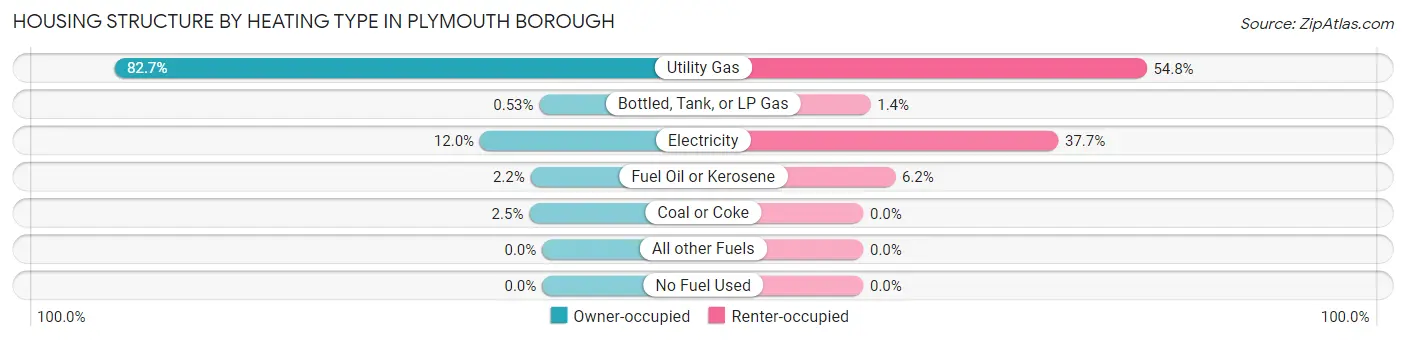
| Heating Type | Owner-occupied | Renter-occupied |
| Utility Gas | 929 (82.7%) | 702 (54.8%) |
| Bottled, Tank, or LP Gas | 6 (0.5%) | 18 (1.4%) |
| Electricity | 135 (12.0%) | 483 (37.7%) |
| Fuel Oil or Kerosene | 25 (2.2%) | 79 (6.2%) |
| Coal or Coke | 28 (2.5%) | 0 (0.0%) |
| All other Fuels | 0 (0.0%) | 0 (0.0%) |
| No Fuel Used | 0 (0.0%) | 0 (0.0%) |
| Total | 1,123 (100.0%) | 1,282 (100.0%) |
Household Vehicle Usage in Plymouth borough
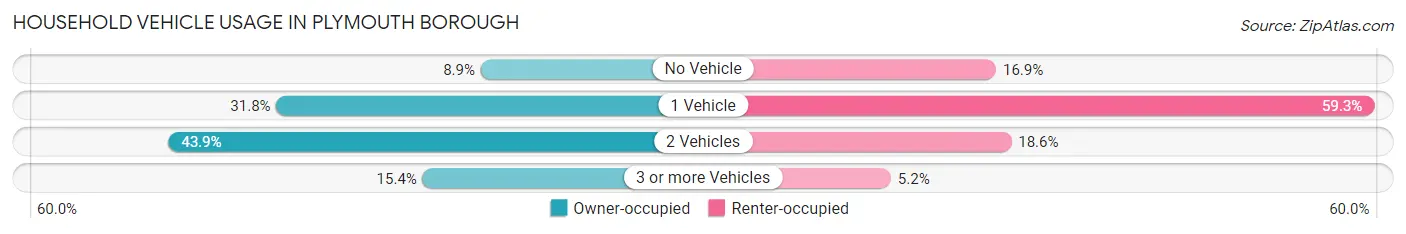
| Vehicles per Household | Owner-occupied | Renter-occupied |
| No Vehicle | 100 (8.9%) | 217 (16.9%) |
| 1 Vehicle | 357 (31.8%) | 760 (59.3%) |
| 2 Vehicles | 493 (43.9%) | 239 (18.6%) |
| 3 or more Vehicles | 173 (15.4%) | 66 (5.1%) |
| Total | 1,123 (100.0%) | 1,282 (100.0%) |
Real Estate & Mortgages in Plymouth borough
Real Estate and Mortgage Overview in Plymouth borough
| Characteristic | Without Mortgage | With Mortgage |
| Housing Units | 591 | 532 |
| Median Property Value | $86,200 | $79,300 |
| Median Household Income | $47,109 | $85 |
| Monthly Housing Costs | $509 | $17 |
| Real Estate Taxes | $1,745 | $0 |
Property Value by Mortgage Status in Plymouth borough
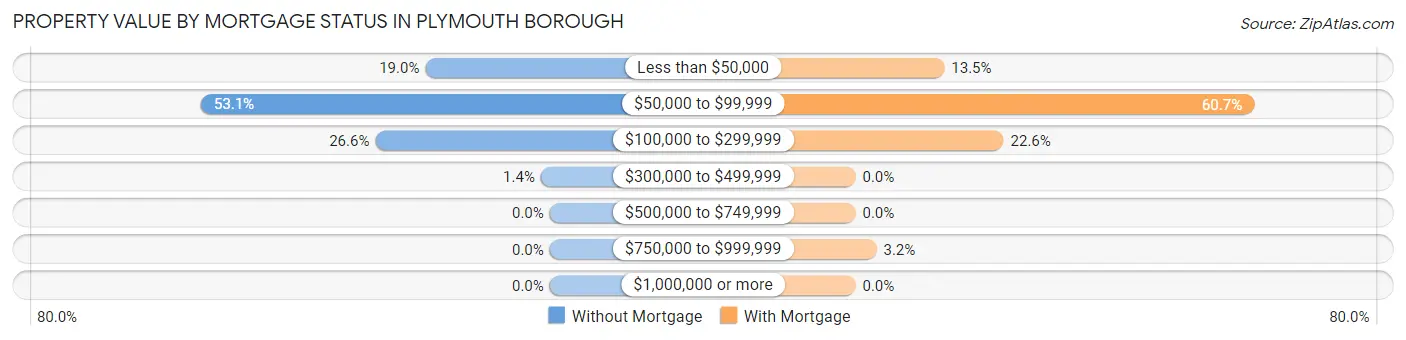
| Property Value | Without Mortgage | With Mortgage |
| Less than $50,000 | 112 (19.0%) | 72 (13.5%) |
| $50,000 to $99,999 | 314 (53.1%) | 323 (60.7%) |
| $100,000 to $299,999 | 157 (26.6%) | 120 (22.6%) |
| $300,000 to $499,999 | 8 (1.3%) | 0 (0.0%) |
| $500,000 to $749,999 | 0 (0.0%) | 0 (0.0%) |
| $750,000 to $999,999 | 0 (0.0%) | 17 (3.2%) |
| $1,000,000 or more | 0 (0.0%) | 0 (0.0%) |
| Total | 591 (100.0%) | 532 (100.0%) |
Household Income by Mortgage Status in Plymouth borough
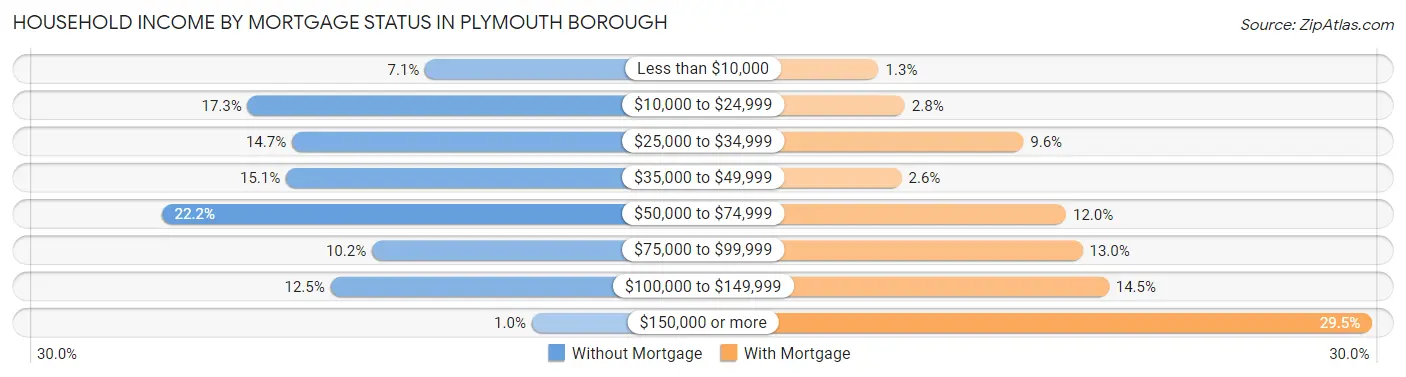
| Household Income | Without Mortgage | With Mortgage |
| Less than $10,000 | 42 (7.1%) | 7 (1.3%) |
| $10,000 to $24,999 | 102 (17.3%) | 15 (2.8%) |
| $25,000 to $34,999 | 87 (14.7%) | 51 (9.6%) |
| $35,000 to $49,999 | 89 (15.1%) | 14 (2.6%) |
| $50,000 to $74,999 | 131 (22.2%) | 64 (12.0%) |
| $75,000 to $99,999 | 60 (10.2%) | 69 (13.0%) |
| $100,000 to $149,999 | 74 (12.5%) | 77 (14.5%) |
| $150,000 or more | 6 (1.0%) | 157 (29.5%) |
| Total | 591 (100.0%) | 532 (100.0%) |
Property Value to Household Income Ratio in Plymouth borough
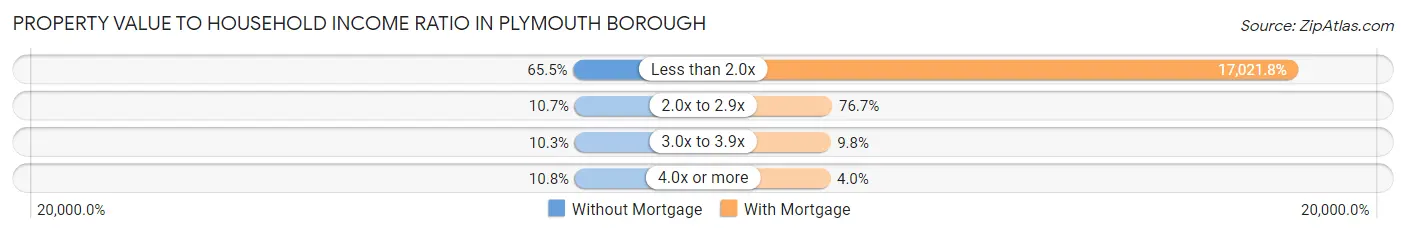
| Value-to-Income Ratio | Without Mortgage | With Mortgage |
| Less than 2.0x | 387 (65.5%) | 90,556 (17,021.8%) |
| 2.0x to 2.9x | 63 (10.7%) | 408 (76.7%) |
| 3.0x to 3.9x | 61 (10.3%) | 52 (9.8%) |
| 4.0x or more | 64 (10.8%) | 21 (4.0%) |
| Total | 591 (100.0%) | 532 (100.0%) |
Real Estate Taxes by Mortgage Status in Plymouth borough
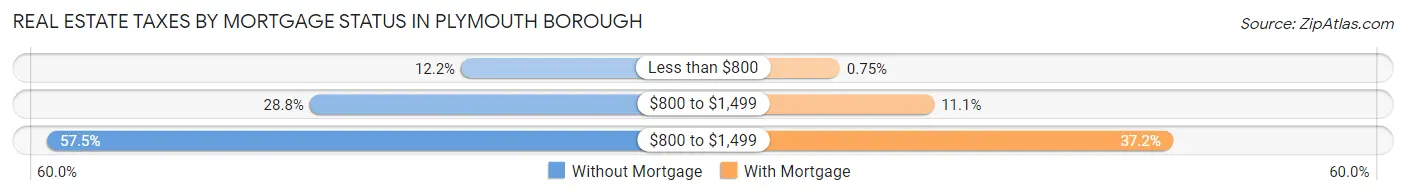
| Property Taxes | Without Mortgage | With Mortgage |
| Less than $800 | 72 (12.2%) | 4 (0.7%) |
| $800 to $1,499 | 170 (28.8%) | 59 (11.1%) |
| $800 to $1,499 | 340 (57.5%) | 198 (37.2%) |
| Total | 591 (100.0%) | 532 (100.0%) |
Health & Disability in Plymouth borough
Health Insurance Coverage by Age in Plymouth borough
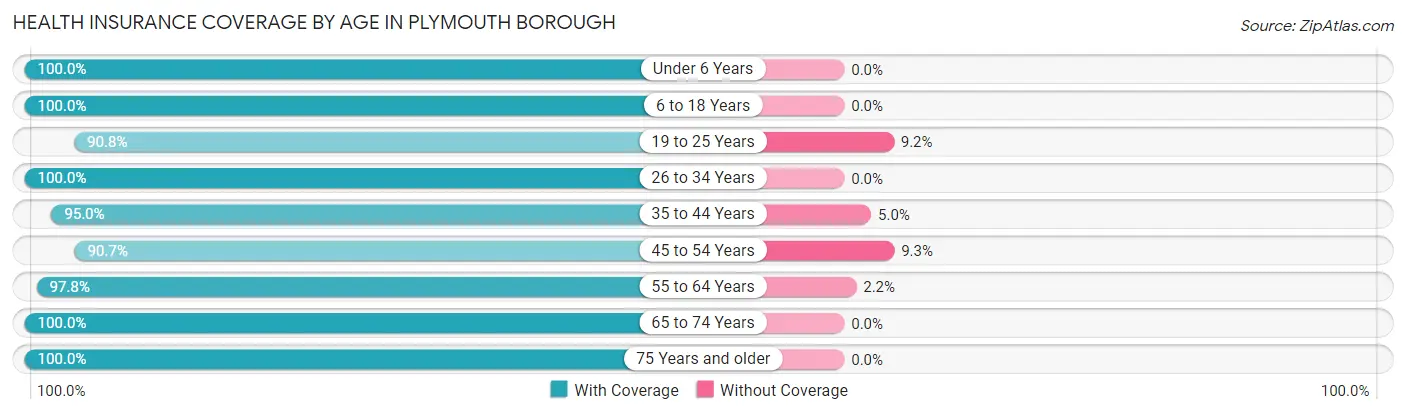
| Age Bracket | With Coverage | Without Coverage |
| Under 6 Years | 493 (100.0%) | 0 (0.0%) |
| 6 to 18 Years | 1,027 (100.0%) | 0 (0.0%) |
| 19 to 25 Years | 403 (90.8%) | 41 (9.2%) |
| 26 to 34 Years | 548 (100.0%) | 0 (0.0%) |
| 35 to 44 Years | 646 (95.0%) | 34 (5.0%) |
| 45 to 54 Years | 789 (90.7%) | 81 (9.3%) |
| 55 to 64 Years | 790 (97.8%) | 18 (2.2%) |
| 65 to 74 Years | 586 (100.0%) | 0 (0.0%) |
| 75 Years and older | 315 (100.0%) | 0 (0.0%) |
| Total | 5,597 (97.0%) | 174 (3.0%) |
Health Insurance Coverage by Citizenship Status in Plymouth borough
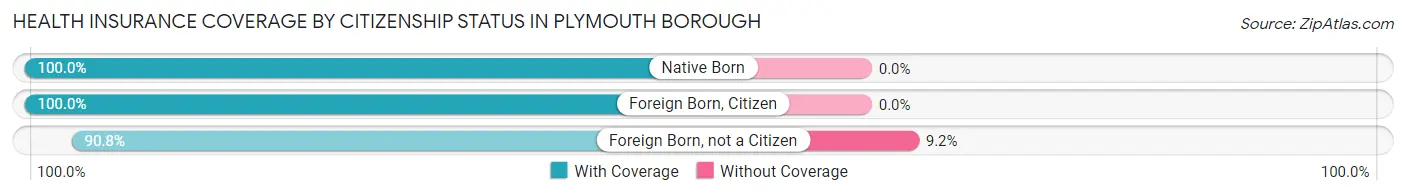
| Citizenship Status | With Coverage | Without Coverage |
| Native Born | 493 (100.0%) | 0 (0.0%) |
| Foreign Born, Citizen | 1,027 (100.0%) | 0 (0.0%) |
| Foreign Born, not a Citizen | 403 (90.8%) | 41 (9.2%) |
Health Insurance Coverage by Household Income in Plymouth borough
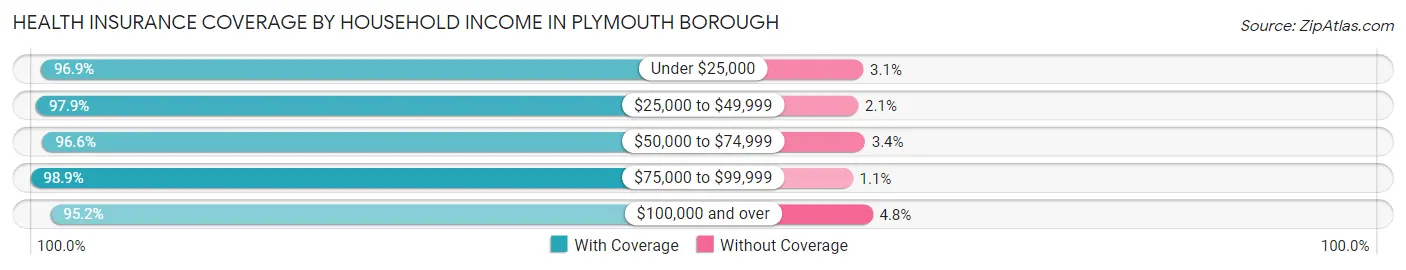
| Household Income | With Coverage | Without Coverage |
| Under $25,000 | 664 (96.9%) | 21 (3.1%) |
| $25,000 to $49,999 | 1,655 (97.9%) | 36 (2.1%) |
| $50,000 to $74,999 | 1,233 (96.6%) | 43 (3.4%) |
| $75,000 to $99,999 | 733 (98.9%) | 8 (1.1%) |
| $100,000 and over | 1,302 (95.2%) | 66 (4.8%) |
Public vs Private Health Insurance Coverage by Age in Plymouth borough
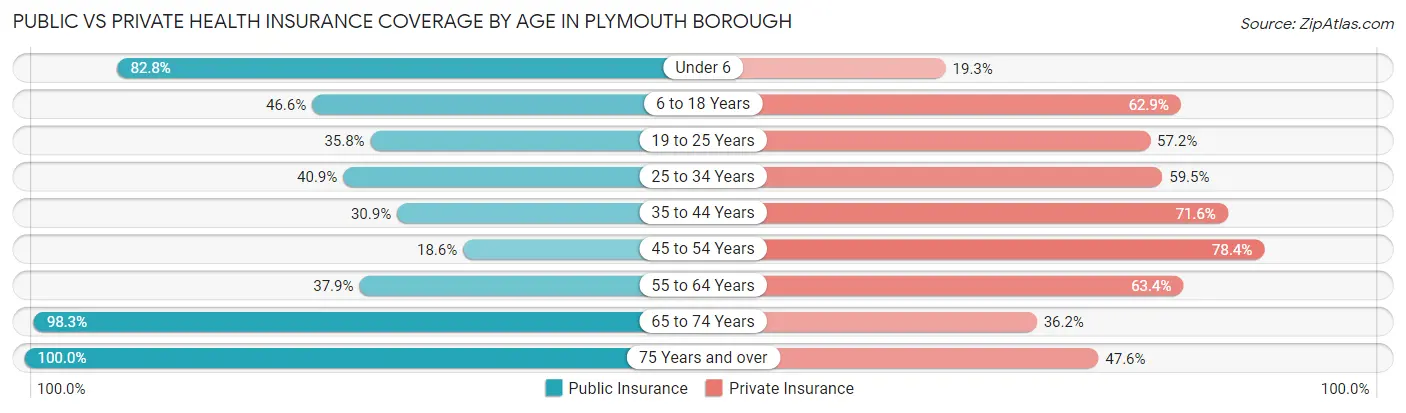
| Age Bracket | Public Insurance | Private Insurance |
| Under 6 | 408 (82.8%) | 95 (19.3%) |
| 6 to 18 Years | 479 (46.6%) | 646 (62.9%) |
| 19 to 25 Years | 159 (35.8%) | 254 (57.2%) |
| 25 to 34 Years | 224 (40.9%) | 326 (59.5%) |
| 35 to 44 Years | 210 (30.9%) | 487 (71.6%) |
| 45 to 54 Years | 162 (18.6%) | 682 (78.4%) |
| 55 to 64 Years | 306 (37.9%) | 512 (63.4%) |
| 65 to 74 Years | 576 (98.3%) | 212 (36.2%) |
| 75 Years and over | 315 (100.0%) | 150 (47.6%) |
| Total | 2,839 (49.2%) | 3,364 (58.3%) |
Disability Status by Sex by Age in Plymouth borough
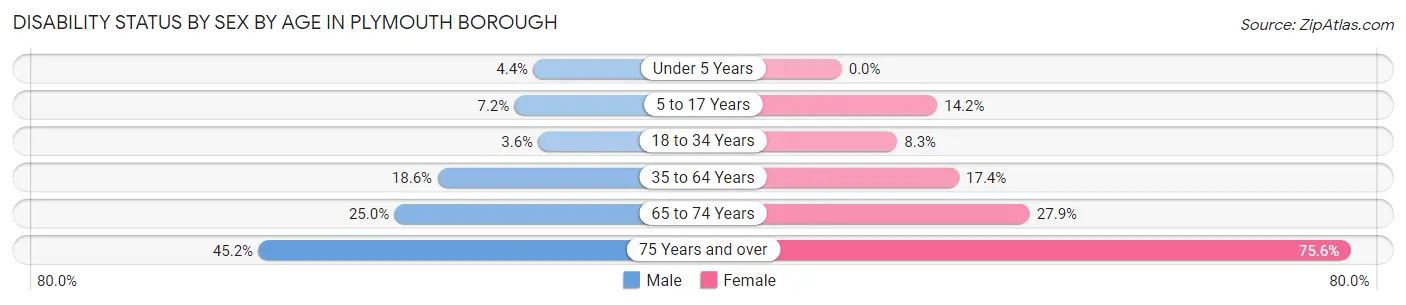
| Age Bracket | Male | Female |
| Under 5 Years | 9 (4.4%) | 0 (0.0%) |
| 5 to 17 Years | 52 (7.2%) | 55 (14.2%) |
| 18 to 34 Years | 16 (3.6%) | 49 (8.3%) |
| 35 to 64 Years | 218 (18.6%) | 207 (17.4%) |
| 65 to 74 Years | 91 (25.0%) | 62 (27.9%) |
| 75 Years and over | 33 (45.2%) | 183 (75.6%) |
Disability Class by Sex by Age in Plymouth borough
Disability Class: Hearing Difficulty
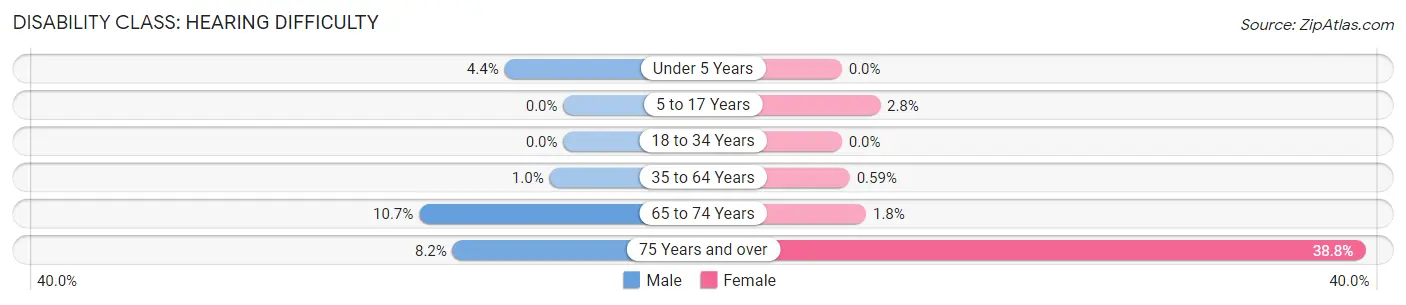
| Age Bracket | Male | Female |
| Under 5 Years | 9 (4.4%) | 0 (0.0%) |
| 5 to 17 Years | 0 (0.0%) | 11 (2.8%) |
| 18 to 34 Years | 0 (0.0%) | 0 (0.0%) |
| 35 to 64 Years | 12 (1.0%) | 7 (0.6%) |
| 65 to 74 Years | 39 (10.7%) | 4 (1.8%) |
| 75 Years and over | 6 (8.2%) | 94 (38.8%) |
Disability Class: Vision Difficulty
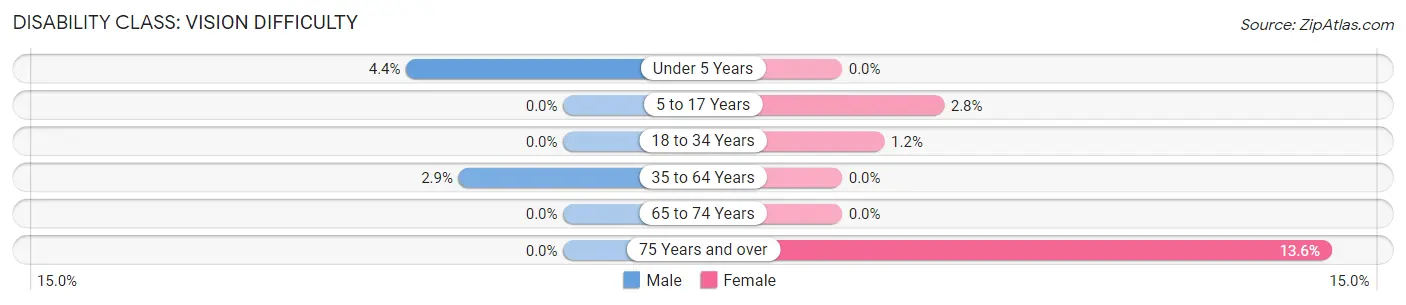
| Age Bracket | Male | Female |
| Under 5 Years | 9 (4.4%) | 0 (0.0%) |
| 5 to 17 Years | 0 (0.0%) | 11 (2.8%) |
| 18 to 34 Years | 0 (0.0%) | 7 (1.2%) |
| 35 to 64 Years | 34 (2.9%) | 0 (0.0%) |
| 65 to 74 Years | 0 (0.0%) | 0 (0.0%) |
| 75 Years and over | 0 (0.0%) | 33 (13.6%) |
Disability Class: Cognitive Difficulty
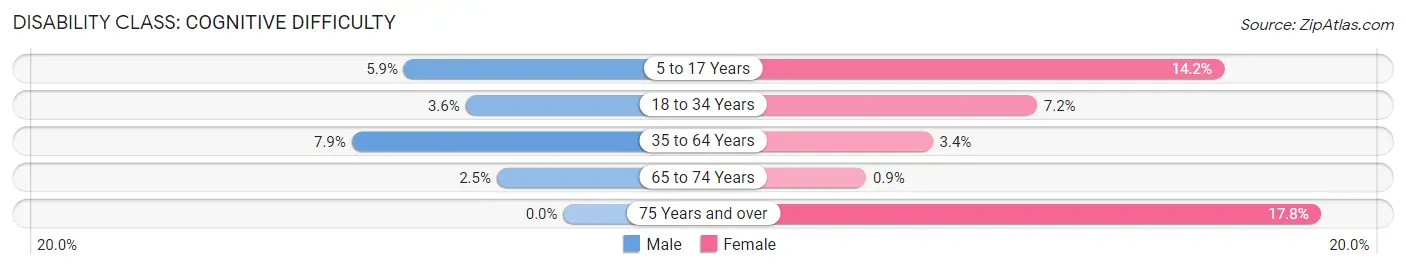
| Age Bracket | Male | Female |
| 5 to 17 Years | 43 (5.9%) | 55 (14.2%) |
| 18 to 34 Years | 16 (3.6%) | 43 (7.2%) |
| 35 to 64 Years | 92 (7.9%) | 40 (3.4%) |
| 65 to 74 Years | 9 (2.5%) | 2 (0.9%) |
| 75 Years and over | 0 (0.0%) | 43 (17.8%) |
Disability Class: Ambulatory Difficulty
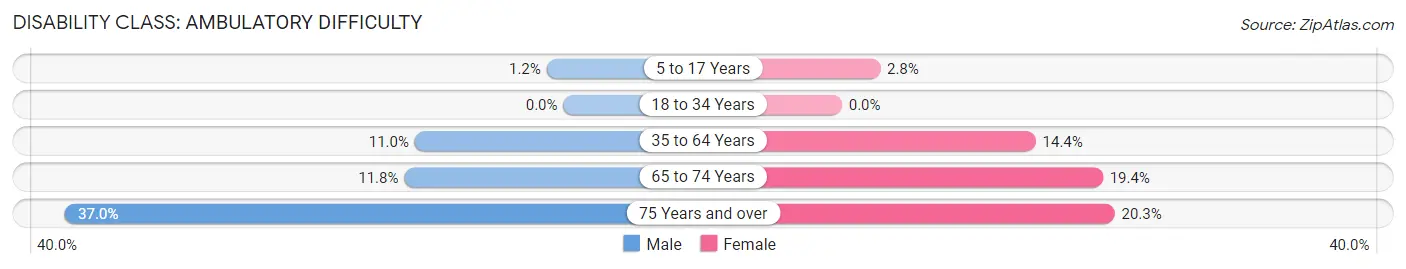
| Age Bracket | Male | Female |
| 5 to 17 Years | 9 (1.2%) | 11 (2.8%) |
| 18 to 34 Years | 0 (0.0%) | 0 (0.0%) |
| 35 to 64 Years | 129 (11.0%) | 171 (14.4%) |
| 65 to 74 Years | 43 (11.8%) | 43 (19.4%) |
| 75 Years and over | 27 (37.0%) | 49 (20.3%) |
Disability Class: Self-Care Difficulty
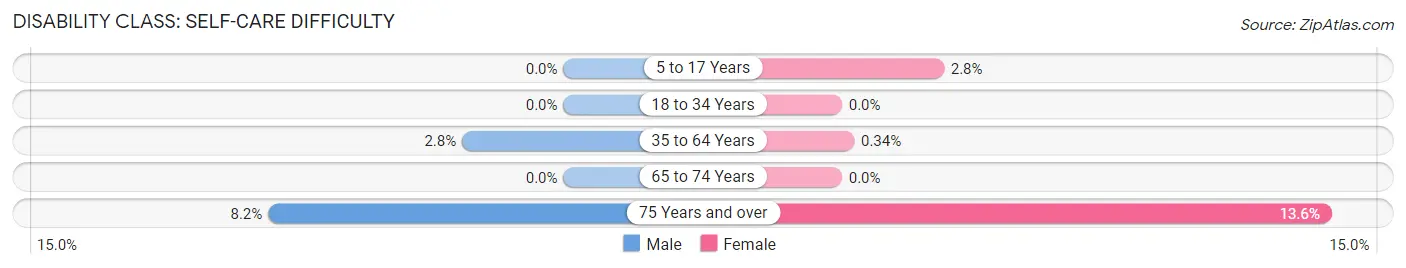
| Age Bracket | Male | Female |
| 5 to 17 Years | 0 (0.0%) | 11 (2.8%) |
| 18 to 34 Years | 0 (0.0%) | 0 (0.0%) |
| 35 to 64 Years | 33 (2.8%) | 4 (0.3%) |
| 65 to 74 Years | 0 (0.0%) | 0 (0.0%) |
| 75 Years and over | 6 (8.2%) | 33 (13.6%) |
Technology Access in Plymouth borough
Computing Device Access in Plymouth borough
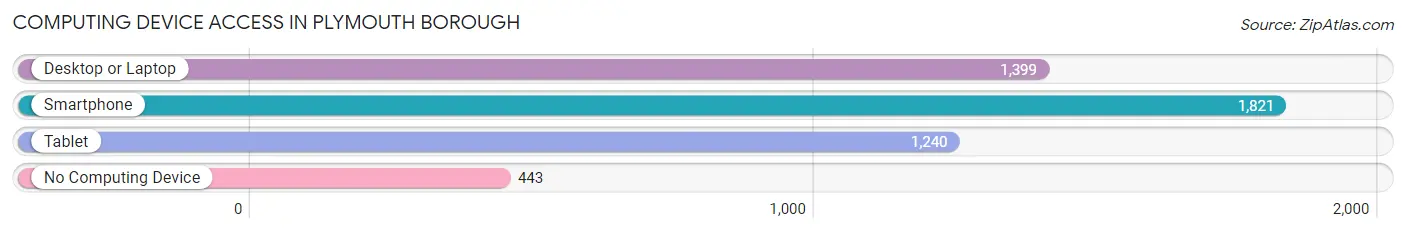
| Device Type | # Households | % Households |
| Desktop or Laptop | 1,399 | 58.2% |
| Smartphone | 1,821 | 75.7% |
| Tablet | 1,240 | 51.6% |
| No Computing Device | 443 | 18.4% |
| Total | 2,405 | 100.0% |
Internet Access in Plymouth borough
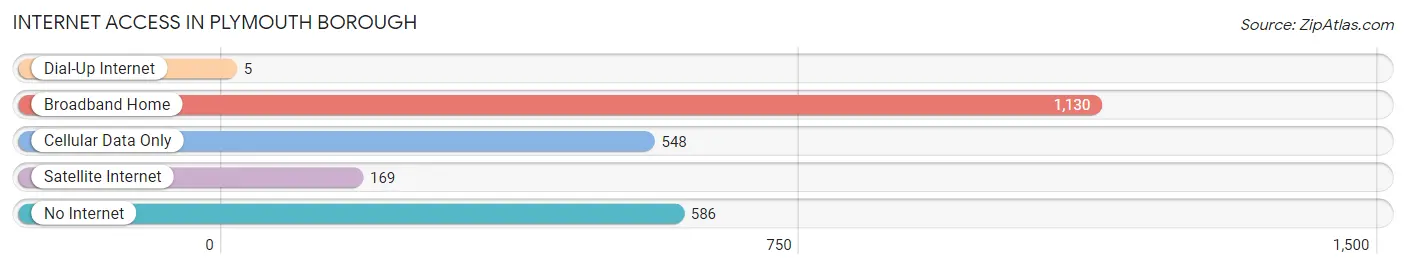
| Internet Type | # Households | % Households |
| Dial-Up Internet | 5 | 0.2% |
| Broadband Home | 1,130 | 47.0% |
| Cellular Data Only | 548 | 22.8% |
| Satellite Internet | 169 | 7.0% |
| No Internet | 586 | 24.4% |
| Total | 2,405 | 100.0% |
Plymouth borough Summary
Plymouth Borough is a small borough located in Luzerne County, Pennsylvania. It is situated in the Wyoming Valley, a region of the Northeastern United States. The borough is located approximately 20 miles north of Wilkes-Barre, the county seat. The population of Plymouth Borough was 5,919 at the 2010 census.
History
Plymouth Borough was founded in 1845 by a group of settlers from Plymouth, Massachusetts. The settlers were attracted to the area by the abundance of natural resources, including coal, timber, and iron ore. The borough was incorporated in 1851 and was named after the settlers’ hometown.
The borough was an important center of industry in the 19th century. The Lehigh Valley Railroad was built through the borough in 1855, connecting it to the rest of the country. The railroad brought with it a boom in industry, including coal mining, iron production, and lumbering. The borough also became a center of commerce, with several stores and businesses opening up in the area.
In the early 20th century, the borough experienced a decline in industry as the coal and iron industries began to decline. The borough’s economy shifted to focus on tourism and recreation, with several resorts and attractions opening up in the area.
Geography
Plymouth Borough is located in the Wyoming Valley of Northeastern Pennsylvania. The borough is situated on the Susquehanna River, which forms the western boundary of the borough. The borough is bordered by the townships of Plymouth, Kingston, and Exeter. The borough is located approximately 20 miles north of Wilkes-Barre, the county seat.
The borough has a total area of 1.2 square miles, all of which is land. The borough is located in the Appalachian Mountains and is surrounded by rolling hills and forests. The borough is located in a humid continental climate zone, with cold winters and hot, humid summers.
Economy
The economy of Plymouth Borough is largely based on tourism and recreation. The borough is home to several resorts and attractions, including the Plymouth Water Park, the Plymouth Rock Golf Course, and the Plymouth Rock Raceway. The borough also has several restaurants, bars, and shops.
The borough is also home to several manufacturing companies, including a plastics manufacturer and a metal fabrication company. The borough is also home to several small businesses, including a printing company, a bakery, and a furniture store.
Demographics
As of the 2010 census, the population of Plymouth Borough was 5,919. The racial makeup of the borough was 95.3% White, 1.2% African American, 0.3% Native American, 0.7% Asian, 0.1% Pacific Islander, 0.7% from other races, and 1.9% from two or more races. Hispanic or Latino of any race were 2.7% of the population.
The median household income in the borough was $41,944, and the median family income was $50,917. The per capita income in the borough was $20,945. About 11.2% of the population was below the poverty line.
Common Questions
What is Per Capita Income in Plymouth borough?
Per Capita income in Plymouth borough is $25,228.
What is the Median Family Income in Plymouth borough?
Median Family Income in Plymouth borough is $59,000.
What is the Median Household income in Plymouth borough?
Median Household Income in Plymouth borough is $46,858.
What is Income or Wage Gap in Plymouth borough?
Income or Wage Gap in Plymouth borough is 24.3%.
Women in Plymouth borough earn 75.7 cents for every dollar earned by a man.
What is Family Income Deficit in Plymouth borough?
Family Income Deficit in Plymouth borough is $14,379.
Families that are below poverty line in Plymouth borough earn $14,379 less on average than the poverty threshold level.
What is Inequality or Gini Index in Plymouth borough?
Inequality or Gini Index in Plymouth borough is 0.41.
What is the Total Population of Plymouth borough?
Total Population of Plymouth borough is 5,771.
What is the Total Male Population of Plymouth borough?
Total Male Population of Plymouth borough is 2,980.
What is the Total Female Population of Plymouth borough?
Total Female Population of Plymouth borough is 2,791.
What is the Ratio of Males per 100 Females in Plymouth borough?
There are 106.77 Males per 100 Females in Plymouth borough.
What is the Ratio of Females per 100 Males in Plymouth borough?
There are 93.66 Females per 100 Males in Plymouth borough.
What is the Median Population Age in Plymouth borough?
Median Population Age in Plymouth borough is 40.4 Years.
What is the Average Family Size in Plymouth borough
Average Family Size in Plymouth borough is 3.3 People.
What is the Average Household Size in Plymouth borough
Average Household Size in Plymouth borough is 2.4 People.
How Large is the Labor Force in Plymouth borough?
There are 2,852 People in the Labor Forcein in Plymouth borough.
What is the Percentage of People in the Labor Force in Plymouth borough?
63.9% of People are in the Labor Force in Plymouth borough.
What is the Unemployment Rate in Plymouth borough?
Unemployment Rate in Plymouth borough is 4.3%.