Clearfield borough, PA Map & Demographics
Clearfield borough Overview
$25,778
PER CAPITA INCOME
$57,656
AVG FAMILY INCOME
$50,485
AVG HOUSEHOLD INCOME
38.6%
WAGE / INCOME GAP [ % ]
61.4¢/ $1
WAGE / INCOME GAP [ $ ]
0.39
INEQUALITY / GINI INDEX
5,937
TOTAL POPULATION
2,694
MALE POPULATION
3,243
FEMALE POPULATION
83.07
MALES / 100 FEMALES
120.38
FEMALES / 100 MALES
38.4
MEDIAN AGE
3.1
AVG FAMILY SIZE
2.2
AVG HOUSEHOLD SIZE
3,036
LABOR FORCE [ PEOPLE ]
64.6%
PERCENT IN LABOR FORCE
8.2%
UNEMPLOYMENT RATE
Income in Clearfield borough
Income Overview in Clearfield borough
Per Capita Income in Clearfield borough is $25,778, while median incomes of families and households are $57,656 and $50,485 respectively.
| Characteristic | Number | Measure |
| Per Capita Income | 5,937 | $25,778 |
| Median Family Income | 1,283 | $57,656 |
| Mean Family Income | 1,283 | $71,529 |
| Median Household Income | 2,638 | $50,485 |
| Mean Household Income | 2,638 | $57,395 |
| Income Deficit | 1,283 | $0 |
| Wage / Income Gap (%) | 5,937 | 38.61% |
| Wage / Income Gap ($) | 5,937 | 61.39¢ per $1 |
| Gini / Inequality Index | 5,937 | 0.39 |
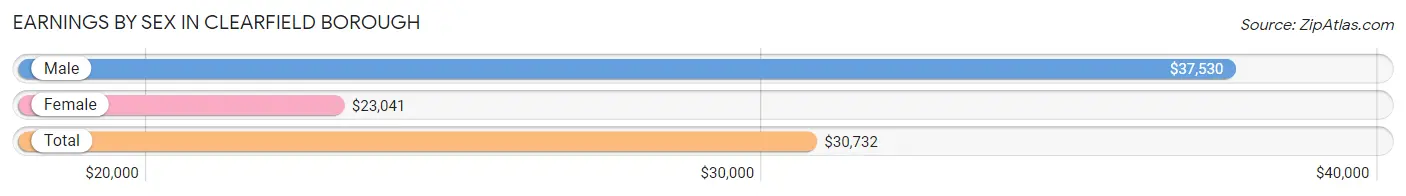
Earnings by Sex in Clearfield borough
Average Earnings in Clearfield borough are $30,732, $37,530 for men and $23,041 for women, a difference of 38.6%.
| Sex | Number | Average Earnings |
| Male | 1,509 (47.8%) | $37,530 |
| Female | 1,648 (52.2%) | $23,041 |
| Total | 3,157 (100.0%) | $30,732 |
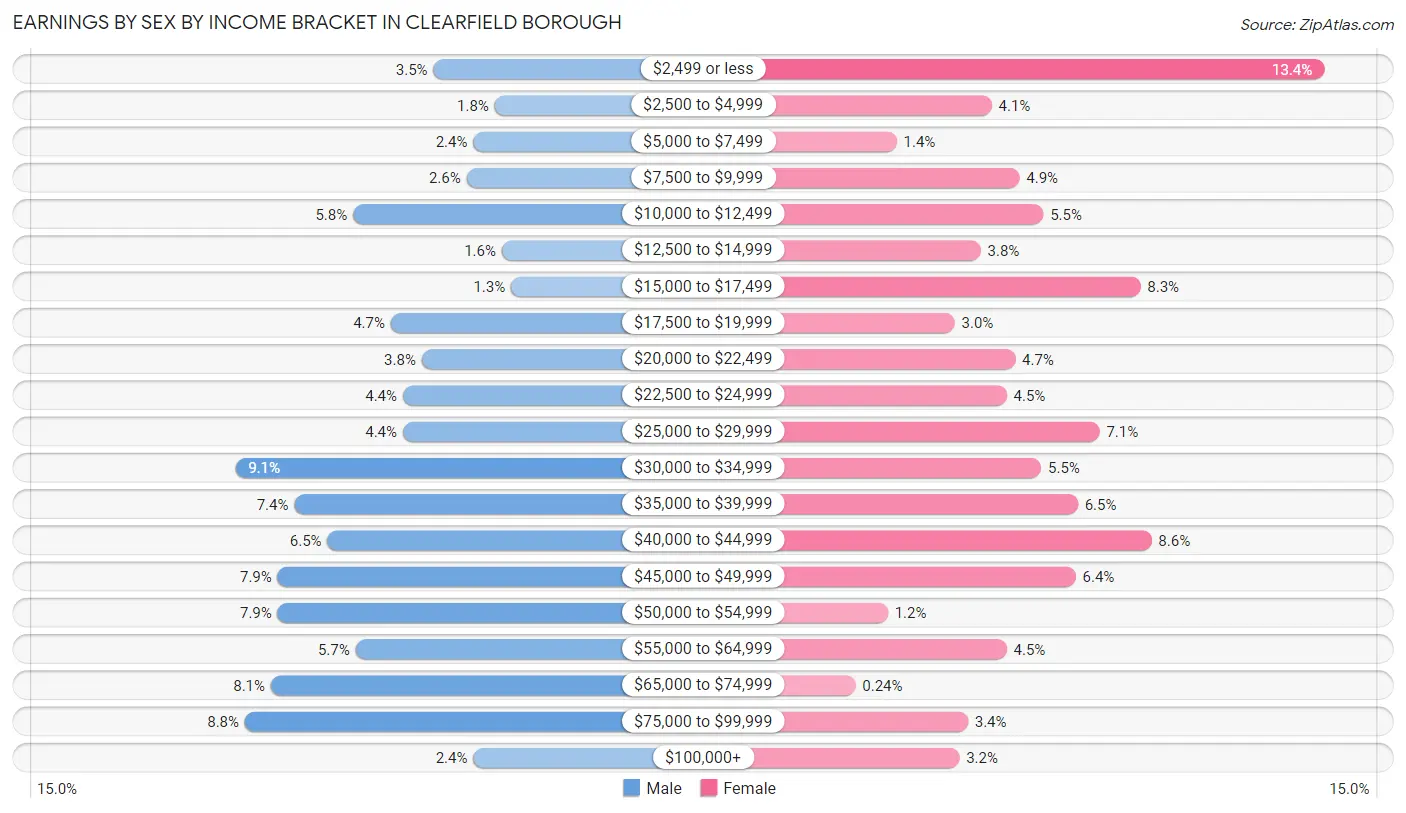
Earnings by Sex by Income Bracket in Clearfield borough
The most common earnings brackets in Clearfield borough are $30,000 to $34,999 for men (137 | 9.1%) and $2,499 or less for women (221 | 13.4%).
| Income | Male | Female |
| $2,499 or less | 53 (3.5%) | 221 (13.4%) |
| $2,500 to $4,999 | 27 (1.8%) | 67 (4.1%) |
| $5,000 to $7,499 | 36 (2.4%) | 23 (1.4%) |
| $7,500 to $9,999 | 39 (2.6%) | 80 (4.9%) |
| $10,000 to $12,499 | 87 (5.8%) | 91 (5.5%) |
| $12,500 to $14,999 | 24 (1.6%) | 62 (3.8%) |
| $15,000 to $17,499 | 20 (1.3%) | 136 (8.3%) |
| $17,500 to $19,999 | 71 (4.7%) | 50 (3.0%) |
| $20,000 to $22,499 | 58 (3.8%) | 78 (4.7%) |
| $22,500 to $24,999 | 66 (4.4%) | 74 (4.5%) |
| $25,000 to $29,999 | 66 (4.4%) | 117 (7.1%) |
| $30,000 to $34,999 | 137 (9.1%) | 90 (5.5%) |
| $35,000 to $39,999 | 112 (7.4%) | 107 (6.5%) |
| $40,000 to $44,999 | 98 (6.5%) | 141 (8.6%) |
| $45,000 to $49,999 | 119 (7.9%) | 106 (6.4%) |
| $50,000 to $54,999 | 119 (7.9%) | 19 (1.1%) |
| $55,000 to $64,999 | 86 (5.7%) | 74 (4.5%) |
| $65,000 to $74,999 | 122 (8.1%) | 4 (0.2%) |
| $75,000 to $99,999 | 133 (8.8%) | 56 (3.4%) |
| $100,000+ | 36 (2.4%) | 52 (3.2%) |
| Total | 1,509 (100.0%) | 1,648 (100.0%) |
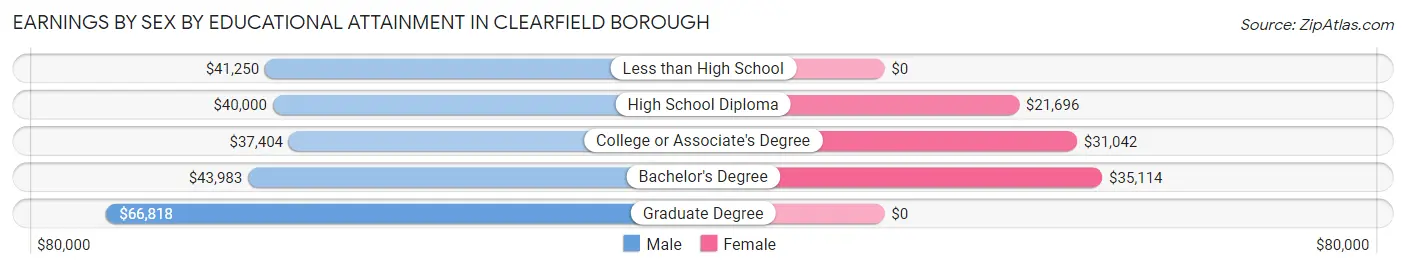
Earnings by Sex by Educational Attainment in Clearfield borough
Average earnings in Clearfield borough are $43,816 for men and $29,190 for women, a difference of 33.4%. Men with an educational attainment of graduate degree enjoy the highest average annual earnings of $66,818, while those with college or associate's degree education earn the least with $37,404. Women with an educational attainment of bachelor's degree earn the most with the average annual earnings of $35,114, while those with high school diploma education have the smallest earnings of $21,696.
| Educational Attainment | Male Income | Female Income |
| Less than High School | $41,250 | $0 |
| High School Diploma | $40,000 | $21,696 |
| College or Associate's Degree | $37,404 | $31,042 |
| Bachelor's Degree | $43,983 | $35,114 |
| Graduate Degree | $66,818 | $0 |
| Total | $43,816 | $29,190 |
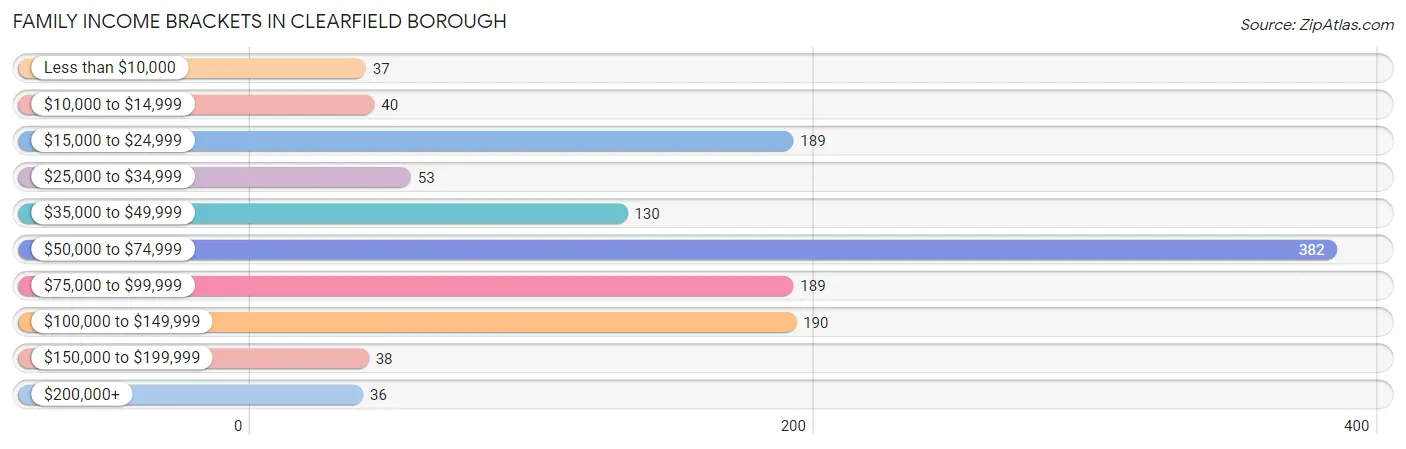
Family Income in Clearfield borough
Family Income Brackets in Clearfield borough
According to the Clearfield borough family income data, there are 382 families falling into the $50,000 to $74,999 income range, which is the most common income bracket and makes up 29.8% of all families. Conversely, the $200,000+ income bracket is the least frequent group with only 36 families (2.8%) belonging to this category.
| Income Bracket | # Families | % Families |
| Less than $10,000 | 37 | 2.9% |
| $10,000 to $14,999 | 40 | 3.1% |
| $15,000 to $24,999 | 189 | 14.7% |
| $25,000 to $34,999 | 53 | 4.1% |
| $35,000 to $49,999 | 130 | 10.1% |
| $50,000 to $74,999 | 382 | 29.8% |
| $75,000 to $99,999 | 189 | 14.7% |
| $100,000 to $149,999 | 190 | 14.8% |
| $150,000 to $199,999 | 38 | 3.0% |
| $200,000+ | 36 | 2.8% |
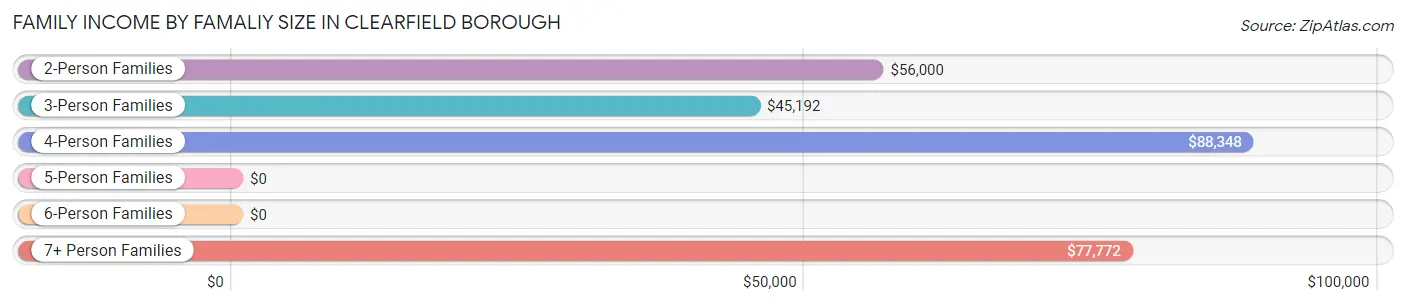
Family Income by Famaliy Size in Clearfield borough
4-person families (259 | 20.2%) account for the highest median family income in Clearfield borough with $88,348 per family, while 2-person families (636 | 49.6%) have the highest median income of $28,000 per family member.
| Income Bracket | # Families | Median Income |
| 2-Person Families | 636 (49.6%) | $56,000 |
| 3-Person Families | 230 (17.9%) | $45,192 |
| 4-Person Families | 259 (20.2%) | $88,348 |
| 5-Person Families | 117 (9.1%) | $0 |
| 6-Person Families | 0 (0.0%) | $0 |
| 7+ Person Families | 41 (3.2%) | $77,772 |
| Total | 1,283 (100.0%) | $57,656 |
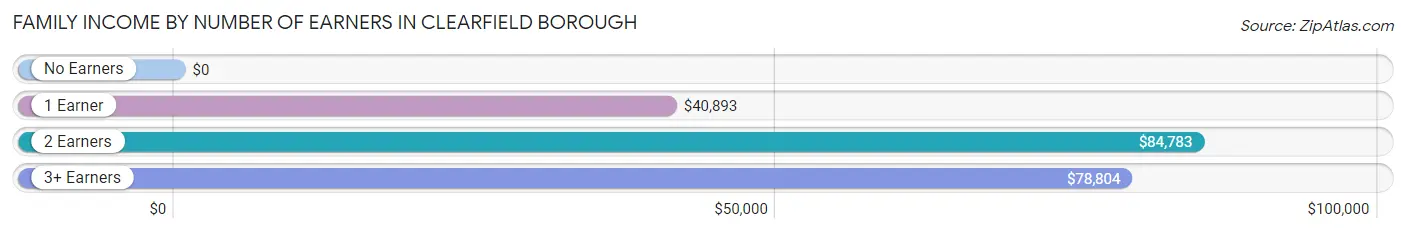
Family Income by Number of Earners in Clearfield borough
| Number of Earners | # Families | Median Income |
| No Earners | 190 (14.8%) | $0 |
| 1 Earner | 407 (31.7%) | $40,893 |
| 2 Earners | 426 (33.2%) | $84,783 |
| 3+ Earners | 260 (20.3%) | $78,804 |
| Total | 1,283 (100.0%) | $57,656 |
Household Income in Clearfield borough
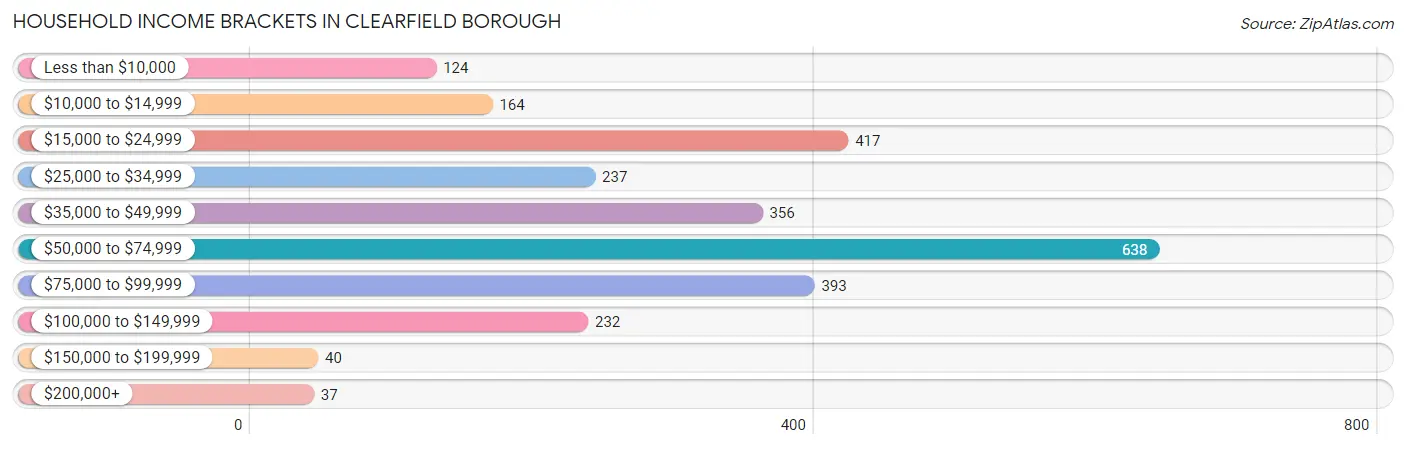
Household Income Brackets in Clearfield borough
With 638 households falling in the category, the $50,000 to $74,999 income range is the most frequent in Clearfield borough, accounting for 24.2% of all households. In contrast, only 37 households (1.4%) fall into the $200,000+ income bracket, making it the least populous group.
| Income Bracket | # Households | % Households |
| Less than $10,000 | 124 | 4.7% |
| $10,000 to $14,999 | 164 | 6.2% |
| $15,000 to $24,999 | 417 | 15.8% |
| $25,000 to $34,999 | 237 | 9.0% |
| $35,000 to $49,999 | 356 | 13.5% |
| $50,000 to $74,999 | 638 | 24.2% |
| $75,000 to $99,999 | 393 | 14.9% |
| $100,000 to $149,999 | 232 | 8.8% |
| $150,000 to $199,999 | 40 | 1.5% |
| $200,000+ | 37 | 1.4% |
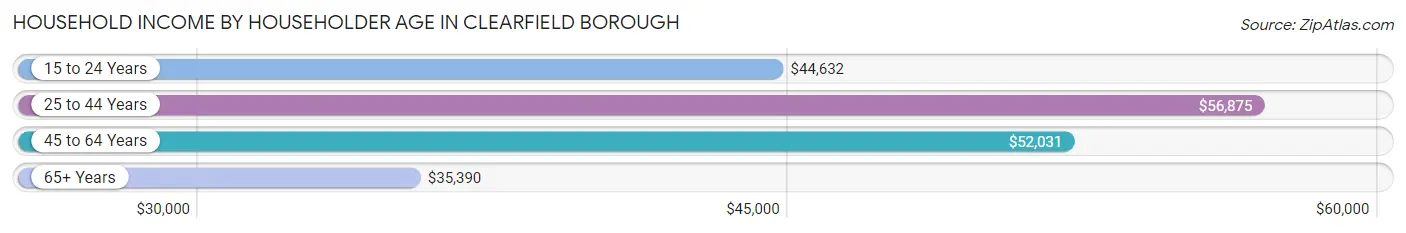
Household Income by Householder Age in Clearfield borough
The median household income in Clearfield borough is $50,485, with the highest median household income of $56,875 found in the 25 to 44 years age bracket for the primary householder. A total of 854 households (32.4%) fall into this category. Meanwhile, the 65+ years age bracket for the primary householder has the lowest median household income of $35,390, with 801 households (30.4%) in this group.
| Income Bracket | # Households | Median Income |
| 15 to 24 Years | 81 (3.1%) | $44,632 |
| 25 to 44 Years | 854 (32.4%) | $56,875 |
| 45 to 64 Years | 902 (34.2%) | $52,031 |
| 65+ Years | 801 (30.4%) | $35,390 |
| Total | 2,638 (100.0%) | $50,485 |
Poverty in Clearfield borough
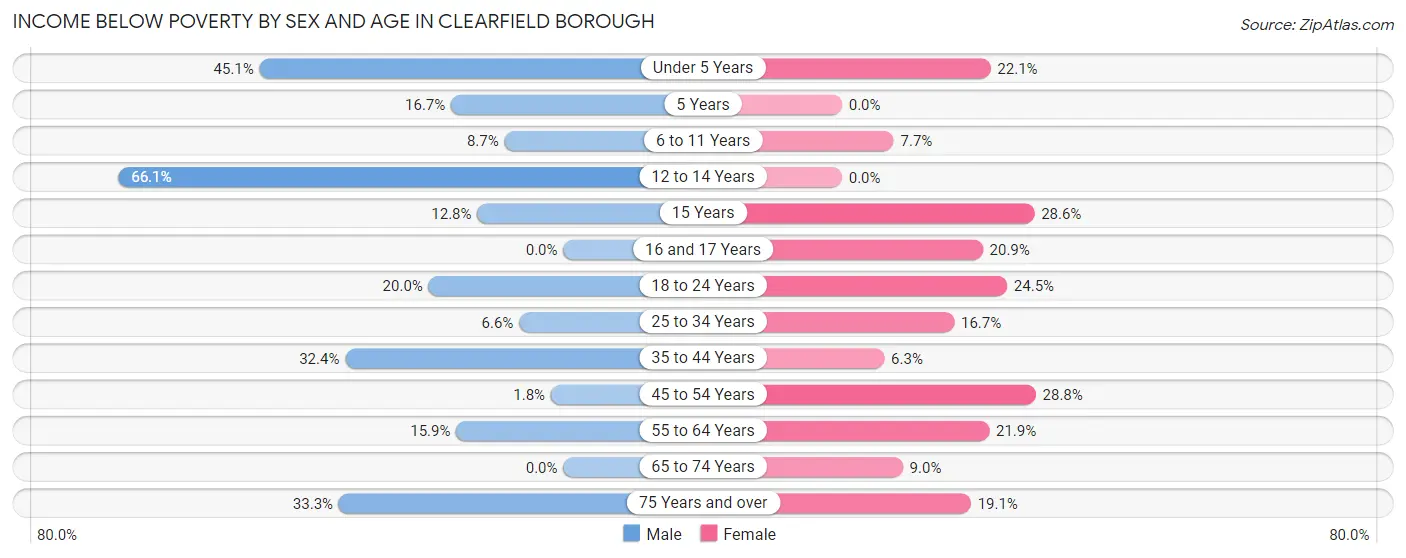
Income Below Poverty by Sex and Age in Clearfield borough
With 20.2% poverty level for males and 16.8% for females among the residents of Clearfield borough, 12 to 14 year old males and 45 to 54 year old females are the most vulnerable to poverty, with 113 males (66.1%) and 78 females (28.8%) in their respective age groups living below the poverty level.
| Age Bracket | Male | Female |
| Under 5 Years | 115 (45.1%) | 47 (22.1%) |
| 5 Years | 4 (16.7%) | 0 (0.0%) |
| 6 to 11 Years | 11 (8.7%) | 13 (7.7%) |
| 12 to 14 Years | 113 (66.1%) | 0 (0.0%) |
| 15 Years | 6 (12.8%) | 10 (28.6%) |
| 16 and 17 Years | 0 (0.0%) | 46 (20.9%) |
| 18 to 24 Years | 42 (20.0%) | 51 (24.5%) |
| 25 to 34 Years | 28 (6.6%) | 64 (16.7%) |
| 35 to 44 Years | 115 (32.4%) | 28 (6.3%) |
| 45 to 54 Years | 5 (1.8%) | 78 (28.8%) |
| 55 to 64 Years | 52 (15.9%) | 101 (21.9%) |
| 65 to 74 Years | 0 (0.0%) | 31 (9.0%) |
| 75 Years and over | 42 (33.3%) | 67 (19.1%) |
| Total | 533 (20.2%) | 536 (16.8%) |
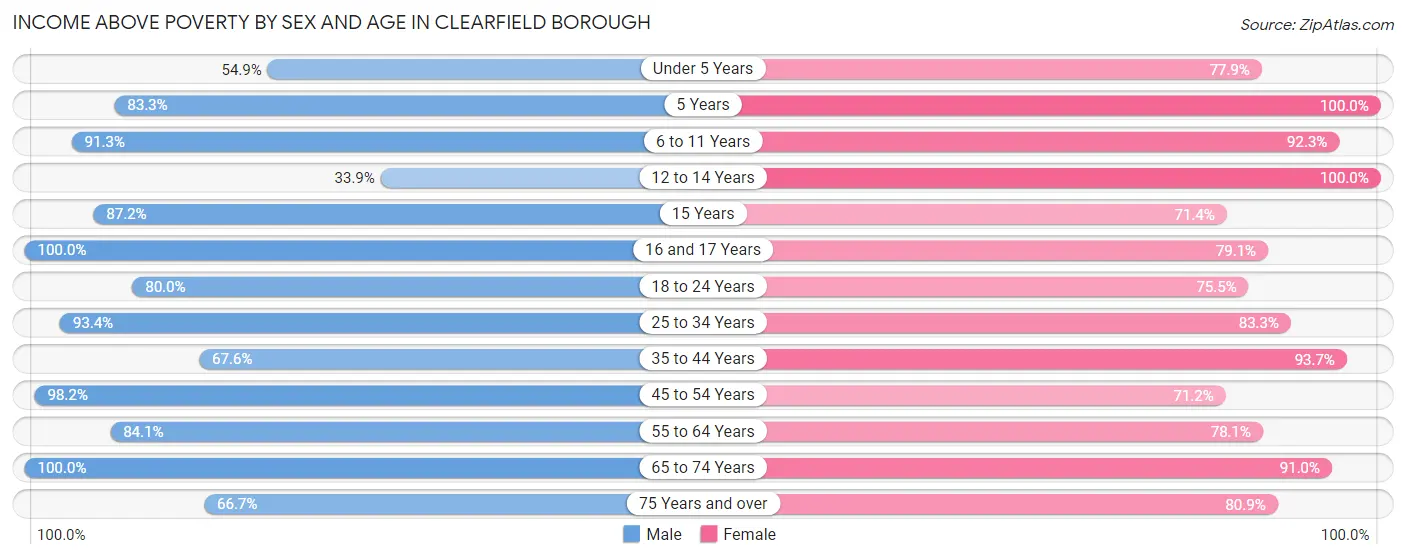
Income Above Poverty by Sex and Age in Clearfield borough
According to the poverty statistics in Clearfield borough, males aged 16 and 17 years and females aged 5 years are the age groups that are most secure financially, with 100.0% of males and 100.0% of females in these age groups living above the poverty line.
| Age Bracket | Male | Female |
| Under 5 Years | 140 (54.9%) | 166 (77.9%) |
| 5 Years | 20 (83.3%) | 62 (100.0%) |
| 6 to 11 Years | 115 (91.3%) | 156 (92.3%) |
| 12 to 14 Years | 58 (33.9%) | 28 (100.0%) |
| 15 Years | 41 (87.2%) | 25 (71.4%) |
| 16 and 17 Years | 62 (100.0%) | 174 (79.1%) |
| 18 to 24 Years | 168 (80.0%) | 157 (75.5%) |
| 25 to 34 Years | 399 (93.4%) | 320 (83.3%) |
| 35 to 44 Years | 240 (67.6%) | 417 (93.7%) |
| 45 to 54 Years | 267 (98.2%) | 193 (71.2%) |
| 55 to 64 Years | 275 (84.1%) | 361 (78.1%) |
| 65 to 74 Years | 238 (100.0%) | 312 (91.0%) |
| 75 Years and over | 84 (66.7%) | 283 (80.9%) |
| Total | 2,107 (79.8%) | 2,654 (83.2%) |
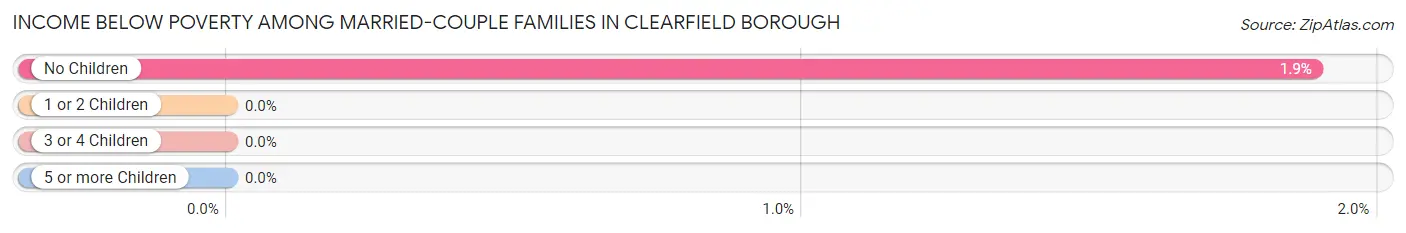
Income Below Poverty Among Married-Couple Families in Clearfield borough
The poverty statistics for married-couple families in Clearfield borough show that 1.1% or 9 of the total 791 families live below the poverty line. Families with no children have the highest poverty rate of 1.9%, comprising of 9 families. On the other hand, families with 1 or 2 children have the lowest poverty rate of 0.0%, which includes 0 families.
| Children | Above Poverty | Below Poverty |
| No Children | 468 (98.1%) | 9 (1.9%) |
| 1 or 2 Children | 231 (100.0%) | 0 (0.0%) |
| 3 or 4 Children | 70 (100.0%) | 0 (0.0%) |
| 5 or more Children | 13 (100.0%) | 0 (0.0%) |
| Total | 782 (98.9%) | 9 (1.1%) |
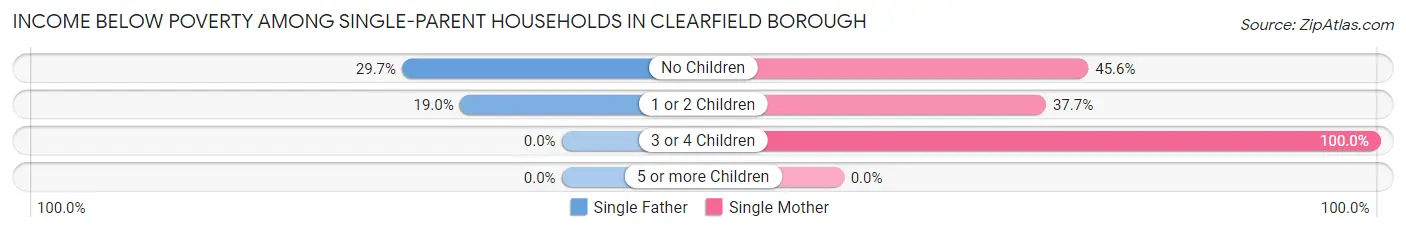
Income Below Poverty Among Single-Parent Households in Clearfield borough
According to the poverty data in Clearfield borough, 21.3% or 37 single-father households and 45.9% or 146 single-mother households are living below the poverty line. Among single-father households, those with no children have the highest poverty rate, with 11 households (29.7%) experiencing poverty. Likewise, among single-mother households, those with 3 or 4 children have the highest poverty rate, with 32 households (100.0%) falling below the poverty line.
| Children | Single Father | Single Mother |
| No Children | 11 (29.7%) | 36 (45.6%) |
| 1 or 2 Children | 26 (19.0%) | 78 (37.7%) |
| 3 or 4 Children | 0 (0.0%) | 32 (100.0%) |
| 5 or more Children | 0 (0.0%) | 0 (0.0%) |
| Total | 37 (21.3%) | 146 (45.9%) |
Income Below Poverty Among Married-Couple vs Single-Parent Households in Clearfield borough
The poverty data for Clearfield borough shows that 9 of the married-couple family households (1.1%) and 183 of the single-parent households (37.2%) are living below the poverty level. Within the married-couple family households, those with no children have the highest poverty rate, with 9 households (1.9%) falling below the poverty line. Among the single-parent households, those with 3 or 4 children have the highest poverty rate, with 32 household (100.0%) living below poverty.
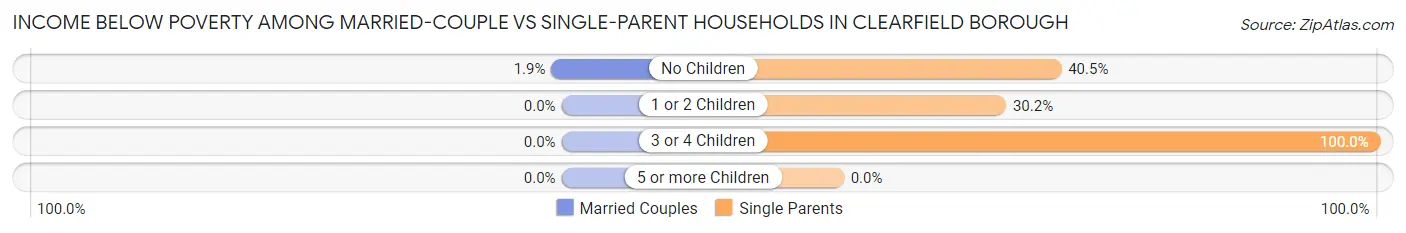
| Children | Married-Couple Families | Single-Parent Households |
| No Children | 9 (1.9%) | 47 (40.5%) |
| 1 or 2 Children | 0 (0.0%) | 104 (30.2%) |
| 3 or 4 Children | 0 (0.0%) | 32 (100.0%) |
| 5 or more Children | 0 (0.0%) | 0 (0.0%) |
| Total | 9 (1.1%) | 183 (37.2%) |
Race in Clearfield borough
The most populous races in Clearfield borough are White / Caucasian (5,592 | 94.2%), Two or more Races (175 | 2.9%), and Asian (74 | 1.3%).
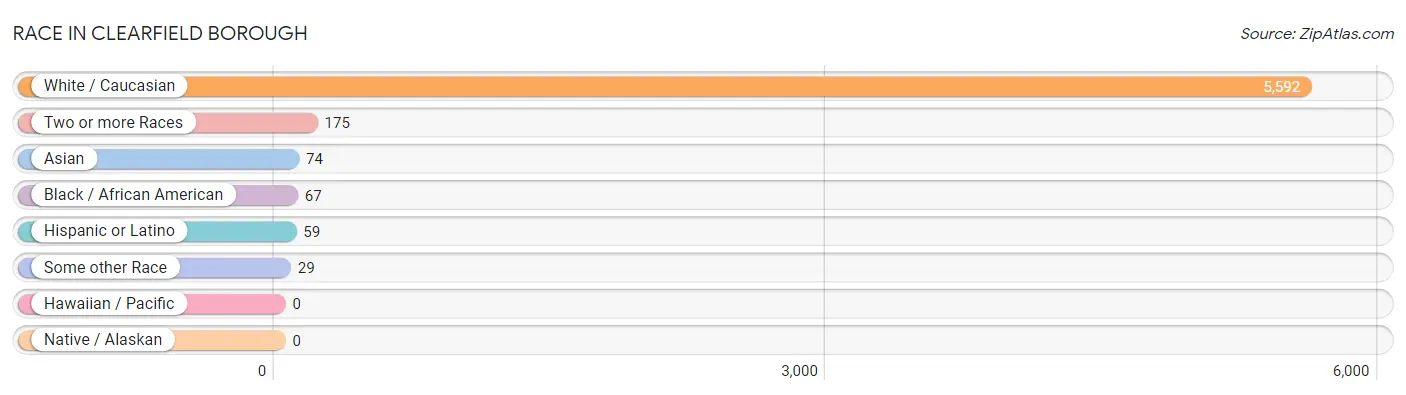
| Race | # Population | % Population |
| Asian | 74 | 1.3% |
| Black / African American | 67 | 1.1% |
| Hawaiian / Pacific | 0 | 0.0% |
| Hispanic or Latino | 59 | 1.0% |
| Native / Alaskan | 0 | 0.0% |
| White / Caucasian | 5,592 | 94.2% |
| Two or more Races | 175 | 2.9% |
| Some other Race | 29 | 0.5% |
| Total | 5,937 | 100.0% |
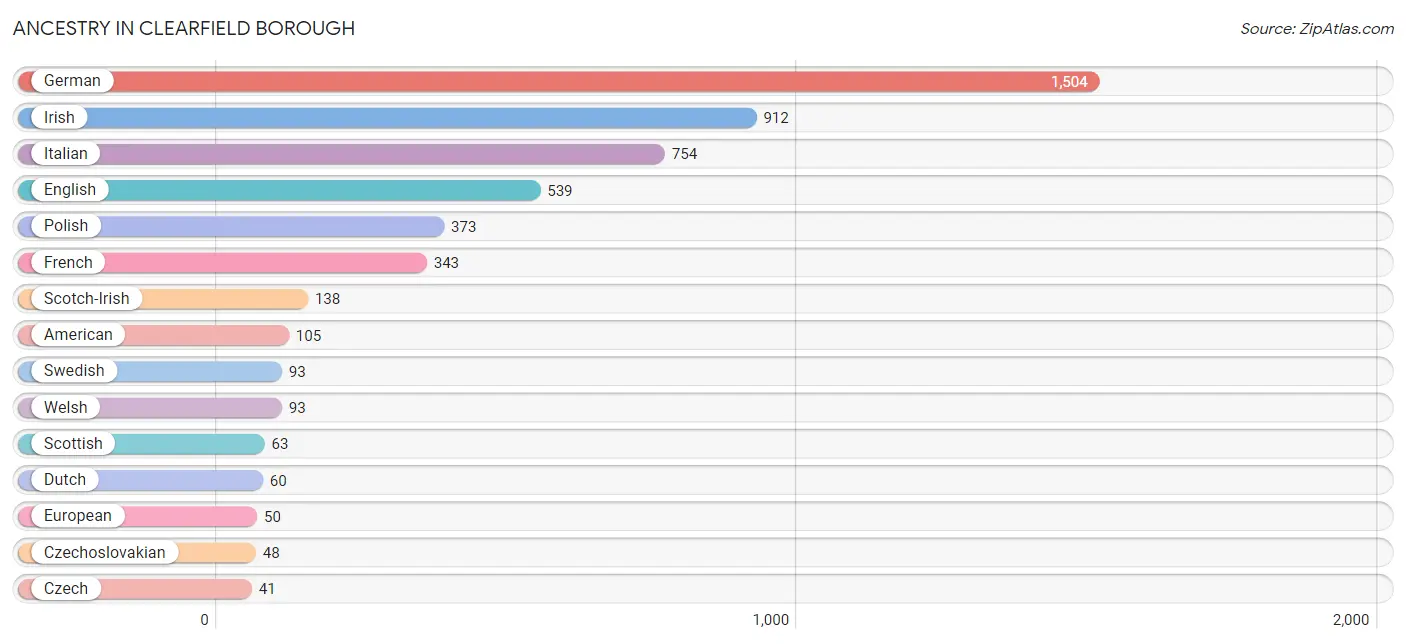
Ancestry in Clearfield borough
The most populous ancestries reported in Clearfield borough are German (1,504 | 25.3%), Irish (912 | 15.4%), Italian (754 | 12.7%), English (539 | 9.1%), and Polish (373 | 6.3%), together accounting for 68.8% of all Clearfield borough residents.
| Ancestry | # Population | % Population |
| African | 1 | 0.0% |
| American | 105 | 1.8% |
| Belgian | 7 | 0.1% |
| Bhutanese | 4 | 0.1% |
| British | 26 | 0.4% |
| Cherokee | 8 | 0.1% |
| Croatian | 16 | 0.3% |
| Cuban | 22 | 0.4% |
| Czech | 41 | 0.7% |
| Czechoslovakian | 48 | 0.8% |
| Delaware | 20 | 0.3% |
| Dutch | 60 | 1.0% |
| English | 539 | 9.1% |
| European | 50 | 0.8% |
| Finnish | 12 | 0.2% |
| French | 343 | 5.8% |
| German | 1,504 | 25.3% |
| Hungarian | 12 | 0.2% |
| Indian (Asian) | 25 | 0.4% |
| Irish | 912 | 15.4% |
| Iroquois | 37 | 0.6% |
| Italian | 754 | 12.7% |
| Korean | 22 | 0.4% |
| Norwegian | 18 | 0.3% |
| Pennsylvania German | 26 | 0.4% |
| Polish | 373 | 6.3% |
| Russian | 10 | 0.2% |
| Scotch-Irish | 138 | 2.3% |
| Scottish | 63 | 1.1% |
| Slavic | 20 | 0.3% |
| Slovak | 9 | 0.2% |
| Spaniard | 37 | 0.6% |
| Sri Lankan | 23 | 0.4% |
| Subsaharan African | 1 | 0.0% |
| Swedish | 93 | 1.6% |
| Ukrainian | 14 | 0.2% |
| Welsh | 93 | 1.6% | View All 37 Rows |
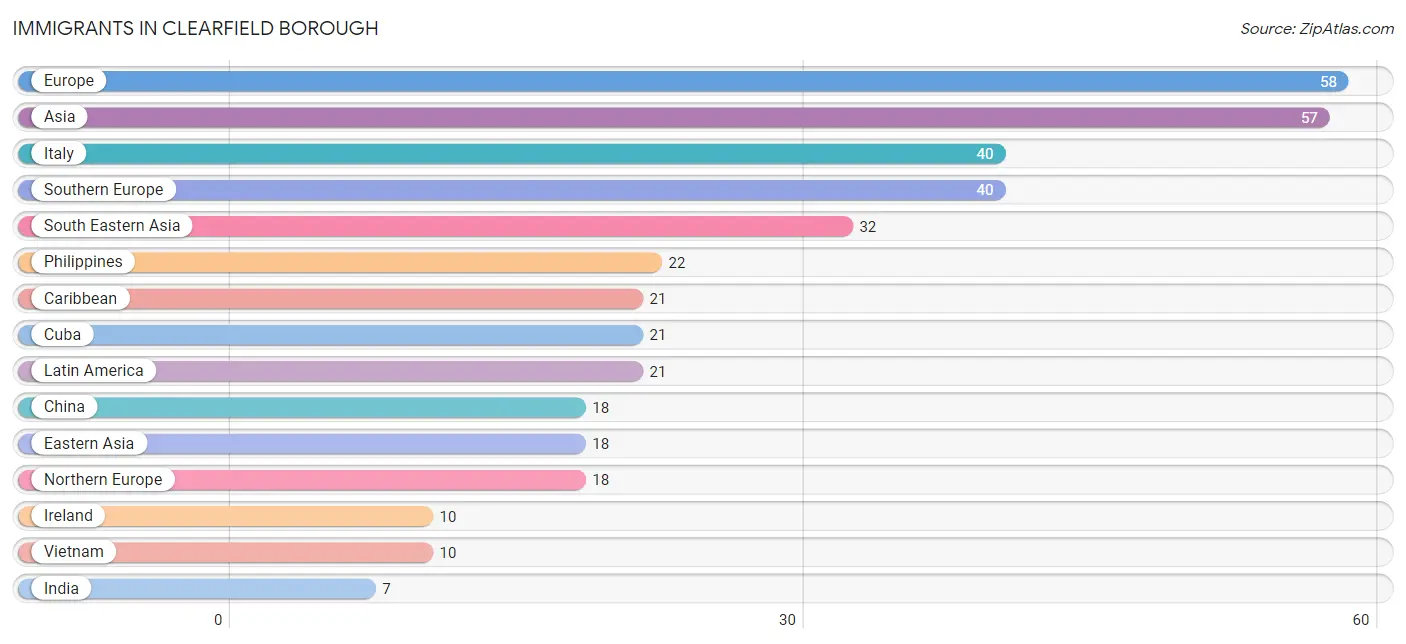
Immigrants in Clearfield borough
The most numerous immigrant groups reported in Clearfield borough came from Europe (58 | 1.0%), Asia (57 | 1.0%), Italy (40 | 0.7%), Southern Europe (40 | 0.7%), and South Eastern Asia (32 | 0.5%), together accounting for 3.8% of all Clearfield borough residents.
| Immigration Origin | # Population | % Population |
| Asia | 57 | 1.0% |
| Caribbean | 21 | 0.4% |
| China | 18 | 0.3% |
| Cuba | 21 | 0.4% |
| Eastern Asia | 18 | 0.3% |
| Europe | 58 | 1.0% |
| India | 7 | 0.1% |
| Ireland | 10 | 0.2% |
| Italy | 40 | 0.7% |
| Latin America | 21 | 0.4% |
| Northern Europe | 18 | 0.3% |
| Philippines | 22 | 0.4% |
| South Central Asia | 7 | 0.1% |
| South Eastern Asia | 32 | 0.5% |
| Southern Europe | 40 | 0.7% |
| Vietnam | 10 | 0.2% | View All 16 Rows |
Sex and Age in Clearfield borough
Sex and Age in Clearfield borough
The most populous age groups in Clearfield borough are 30 to 34 Years (282 | 10.5%) for men and 15 to 19 Years (292 | 9.0%) for women.
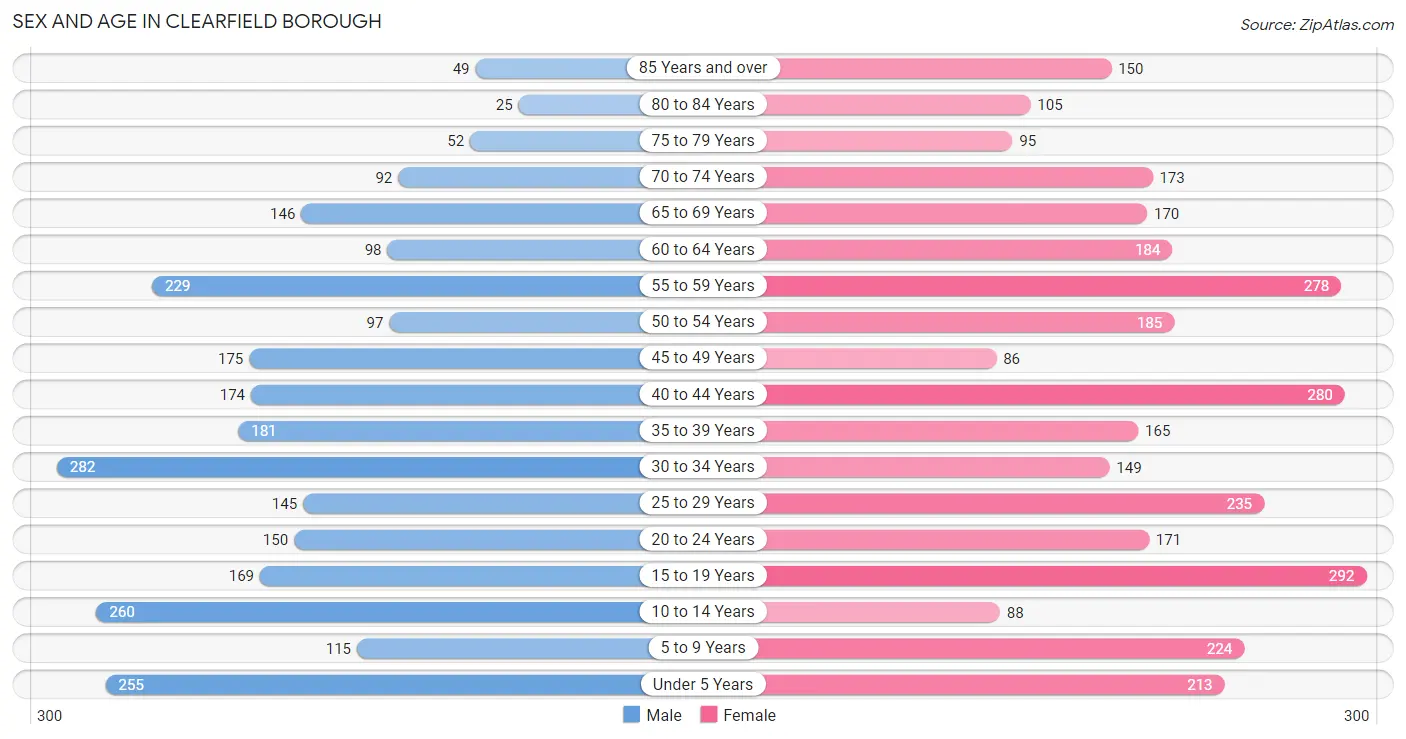
| Age Bracket | Male | Female |
| Under 5 Years | 255 (9.5%) | 213 (6.6%) |
| 5 to 9 Years | 115 (4.3%) | 224 (6.9%) |
| 10 to 14 Years | 260 (9.7%) | 88 (2.7%) |
| 15 to 19 Years | 169 (6.3%) | 292 (9.0%) |
| 20 to 24 Years | 150 (5.6%) | 171 (5.3%) |
| 25 to 29 Years | 145 (5.4%) | 235 (7.2%) |
| 30 to 34 Years | 282 (10.5%) | 149 (4.6%) |
| 35 to 39 Years | 181 (6.7%) | 165 (5.1%) |
| 40 to 44 Years | 174 (6.5%) | 280 (8.6%) |
| 45 to 49 Years | 175 (6.5%) | 86 (2.6%) |
| 50 to 54 Years | 97 (3.6%) | 185 (5.7%) |
| 55 to 59 Years | 229 (8.5%) | 278 (8.6%) |
| 60 to 64 Years | 98 (3.6%) | 184 (5.7%) |
| 65 to 69 Years | 146 (5.4%) | 170 (5.2%) |
| 70 to 74 Years | 92 (3.4%) | 173 (5.3%) |
| 75 to 79 Years | 52 (1.9%) | 95 (2.9%) |
| 80 to 84 Years | 25 (0.9%) | 105 (3.2%) |
| 85 Years and over | 49 (1.8%) | 150 (4.6%) |
| Total | 2,694 (100.0%) | 3,243 (100.0%) |
Families and Households in Clearfield borough
Median Family Size in Clearfield borough
The median family size in Clearfield borough is 3.13 persons per family, with single female/mother families (318 | 24.8%) accounting for the largest median family size of 3.25 persons per family. On the other hand, single male/father families (174 | 13.6%) represent the smallest median family size with 2.53 persons per family.
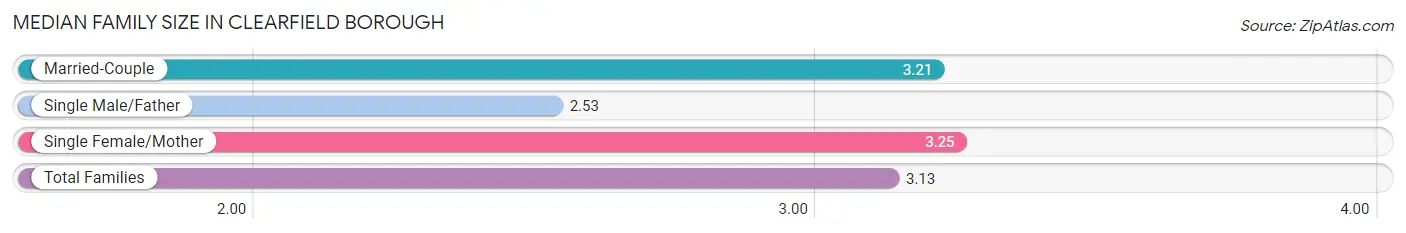
| Family Type | # Families | Family Size |
| Married-Couple | 791 (61.7%) | 3.21 |
| Single Male/Father | 174 (13.6%) | 2.53 |
| Single Female/Mother | 318 (24.8%) | 3.25 |
| Total Families | 1,283 (100.0%) | 3.13 |
Median Household Size in Clearfield borough
The median household size in Clearfield borough is 2.25 persons per household, with single female/mother households (318 | 12.0%) accounting for the largest median household size of 3.59 persons per household. non-family households (1,355 | 51.4%) represent the smallest median household size with 1.23 persons per household.
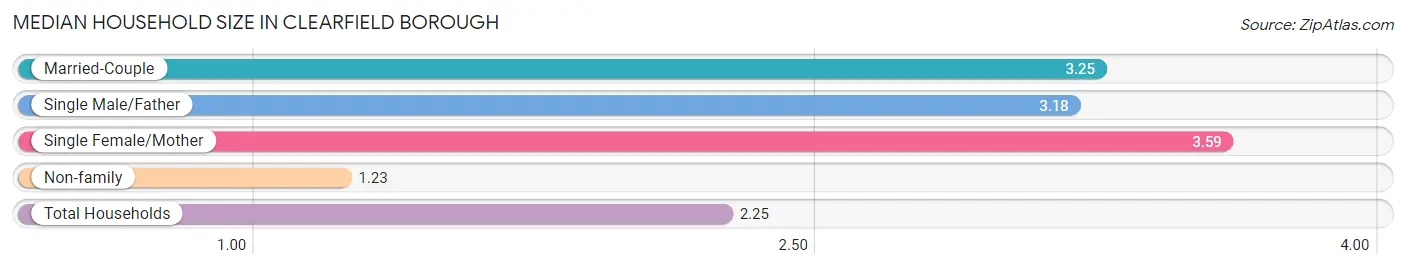
| Household Type | # Households | Household Size |
| Married-Couple | 791 (30.0%) | 3.25 |
| Single Male/Father | 174 (6.6%) | 3.18 |
| Single Female/Mother | 318 (12.0%) | 3.59 |
| Non-family | 1,355 (51.4%) | 1.23 |
| Total Households | 2,638 (100.0%) | 2.25 |
Household Size by Marriage Status in Clearfield borough
Out of a total of 2,638 households in Clearfield borough, 1,283 (48.6%) are family households, while 1,355 (51.4%) are nonfamily households. The most numerous type of family households are 2-person households, comprising 556, and the most common type of nonfamily households are 1-person households, comprising 1,133.
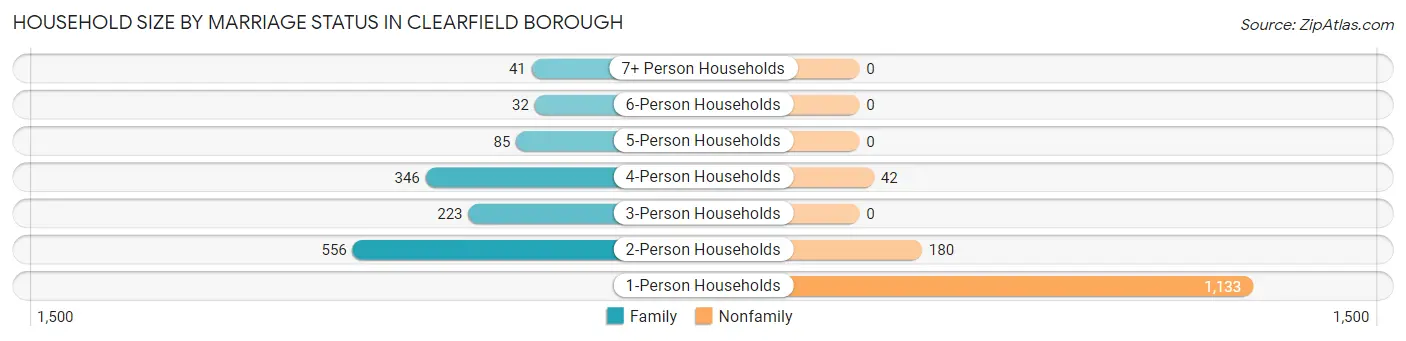
| Household Size | Family Households | Nonfamily Households |
| 1-Person Households | - | 1,133 (42.9%) |
| 2-Person Households | 556 (21.1%) | 180 (6.8%) |
| 3-Person Households | 223 (8.5%) | 0 (0.0%) |
| 4-Person Households | 346 (13.1%) | 42 (1.6%) |
| 5-Person Households | 85 (3.2%) | 0 (0.0%) |
| 6-Person Households | 32 (1.2%) | 0 (0.0%) |
| 7+ Person Households | 41 (1.5%) | 0 (0.0%) |
| Total | 1,283 (48.6%) | 1,355 (51.4%) |
Female Fertility in Clearfield borough
Fertility by Age in Clearfield borough
Average fertility rate in Clearfield borough is 84.0 births per 1,000 women. Women in the age bracket of 20 to 34 years have the highest fertility rate with 196.0 births per 1,000 women. Women in the age bracket of 20 to 34 years acount for 89.3% of all women with births.
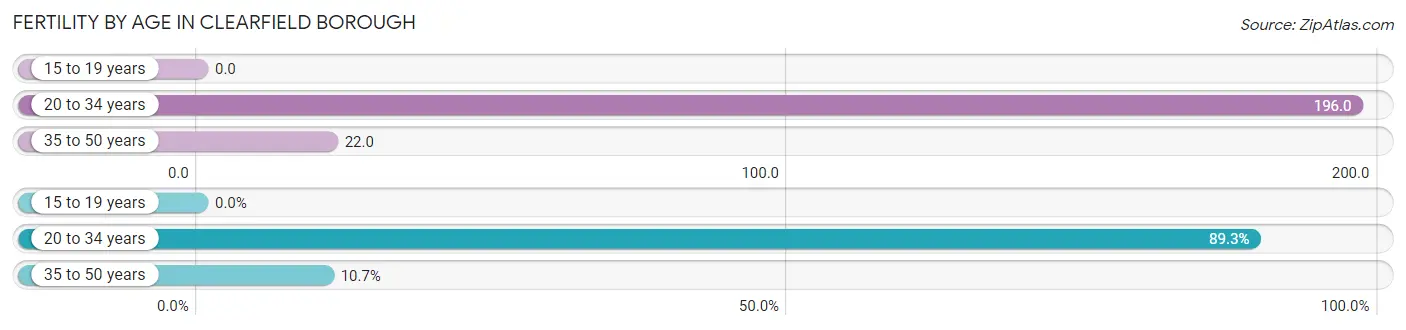
| Age Bracket | Women with Births | Births / 1,000 Women |
| 15 to 19 years | 0 (0.0%) | 0.0 |
| 20 to 34 years | 109 (89.3%) | 196.0 |
| 35 to 50 years | 13 (10.7%) | 22.0 |
| Total | 122 (100.0%) | 84.0 |
Fertility by Age by Marriage Status in Clearfield borough
38.5% of women with births (122) in Clearfield borough are married. The highest percentage of unmarried women with births falls into 20 to 34 years age bracket with 67.9% of them unmarried at the time of birth, while the lowest percentage of unmarried women with births belong to 35 to 50 years age bracket with 7.7% of them unmarried.
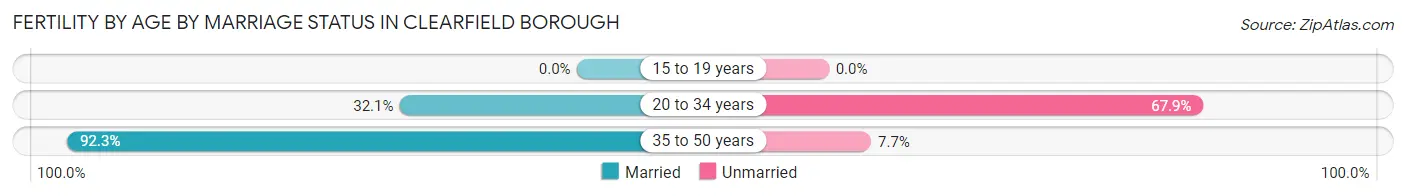
| Age Bracket | Married | Unmarried |
| 15 to 19 years | 0 (0.0%) | 0 (0.0%) |
| 20 to 34 years | 35 (32.1%) | 74 (67.9%) |
| 35 to 50 years | 12 (92.3%) | 1 (7.7%) |
| Total | 47 (38.5%) | 75 (61.5%) |
Fertility by Education in Clearfield borough
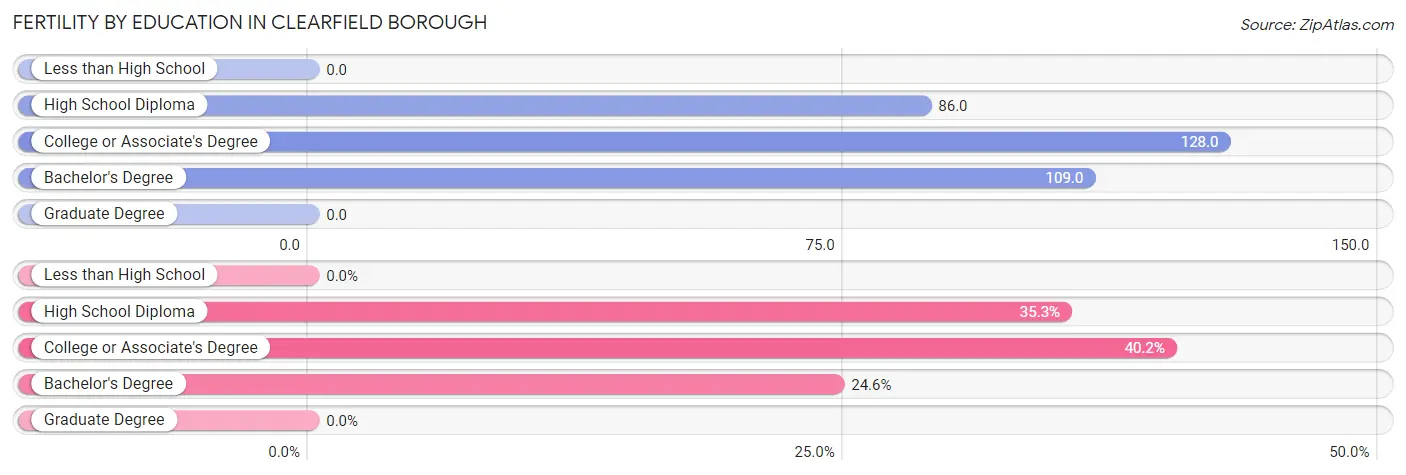
| Educational Attainment | Women with Births | Births / 1,000 Women |
| Less than High School | 0 (0.0%) | 0.0 |
| High School Diploma | 43 (35.2%) | 86.0 |
| College or Associate's Degree | 49 (40.2%) | 128.0 |
| Bachelor's Degree | 30 (24.6%) | 109.0 |
| Graduate Degree | 0 (0.0%) | 0.0 |
| Total | 122 (100.0%) | 84.0 |
Fertility by Education by Marriage Status in Clearfield borough
61.5% of women with births in Clearfield borough are unmarried. Women with the educational attainment of bachelor's degree are most likely to be married with 100.0% of them married at childbirth, while women with the educational attainment of high school diploma are least likely to be married with 100.0% of them unmarried at childbirth.
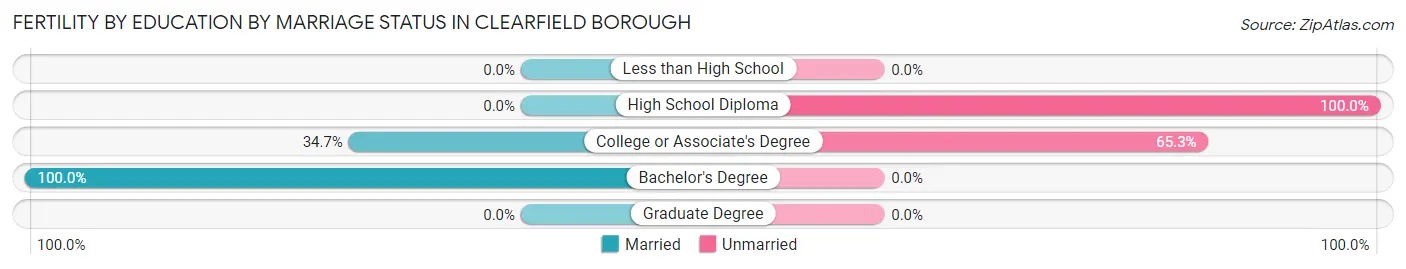
| Educational Attainment | Married | Unmarried |
| Less than High School | 0 (0.0%) | 0 (0.0%) |
| High School Diploma | 0 (0.0%) | 43 (100.0%) |
| College or Associate's Degree | 17 (34.7%) | 32 (65.3%) |
| Bachelor's Degree | 30 (100.0%) | 0 (0.0%) |
| Graduate Degree | 0 (0.0%) | 0 (0.0%) |
| Total | 47 (38.5%) | 75 (61.5%) |
Employment Characteristics in Clearfield borough
Employment by Class of Employer in Clearfield borough
Among the 2,748 employed individuals in Clearfield borough, private company employees (1,729 | 62.9%), not-for-profit organizations (376 | 13.7%), and local government employees (261 | 9.5%) make up the most common classes of employment.
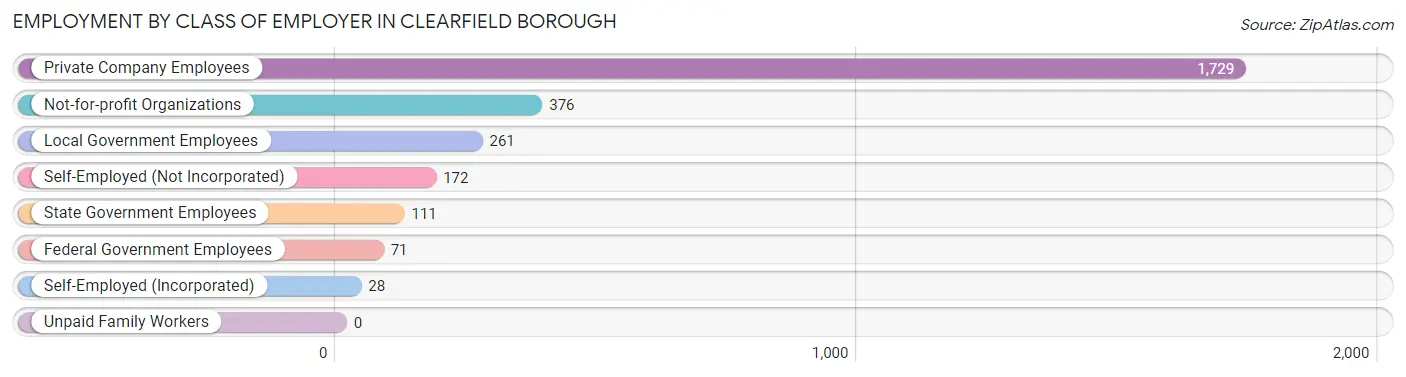
| Employer Class | # Employees | % Employees |
| Private Company Employees | 1,729 | 62.9% |
| Self-Employed (Incorporated) | 28 | 1.0% |
| Self-Employed (Not Incorporated) | 172 | 6.3% |
| Not-for-profit Organizations | 376 | 13.7% |
| Local Government Employees | 261 | 9.5% |
| State Government Employees | 111 | 4.0% |
| Federal Government Employees | 71 | 2.6% |
| Unpaid Family Workers | 0 | 0.0% |
| Total | 2,748 | 100.0% |
Employment Status by Age in Clearfield borough
According to the labor force statistics for Clearfield borough, out of the total population over 16 years of age (4,700), 64.6% or 3,036 individuals are in the labor force, with 8.2% or 249 of them unemployed. The age group with the highest labor force participation rate is 25 to 29 years, with 95.5% or 363 individuals in the labor force. Within the labor force, the 35 to 44 years age range has the highest percentage of unemployed individuals, with 16.4% or 116 of them being unemployed.
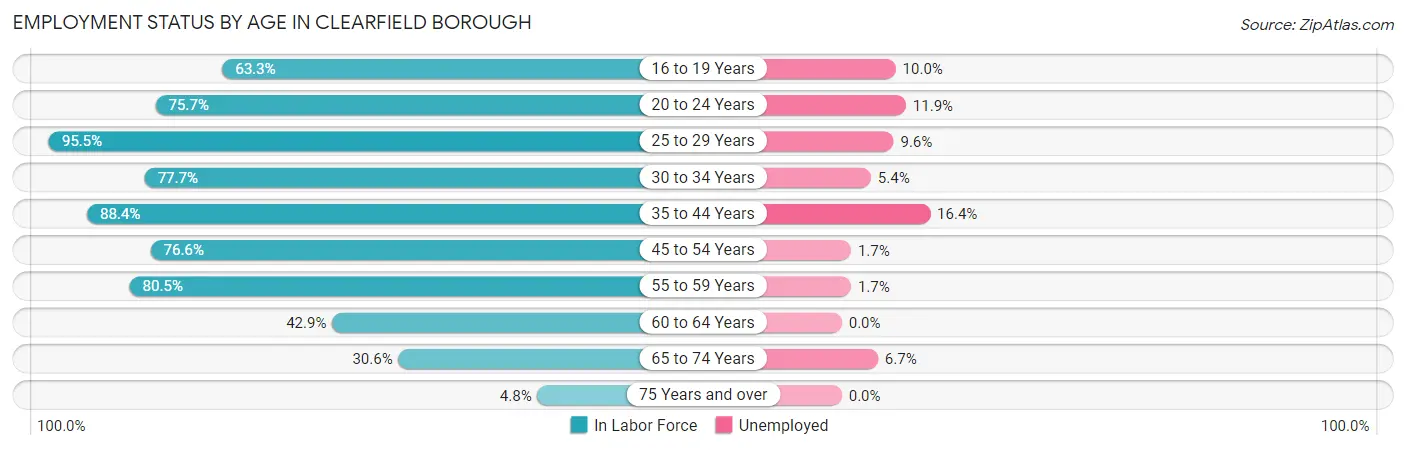
| Age Bracket | In Labor Force | Unemployed |
| 16 to 19 Years | 240 (63.3%) | 24 (10.0%) |
| 20 to 24 Years | 243 (75.7%) | 29 (11.9%) |
| 25 to 29 Years | 363 (95.5%) | 35 (9.6%) |
| 30 to 34 Years | 335 (77.7%) | 18 (5.4%) |
| 35 to 44 Years | 707 (88.4%) | 116 (16.4%) |
| 45 to 54 Years | 416 (76.6%) | 7 (1.7%) |
| 55 to 59 Years | 408 (80.5%) | 7 (1.7%) |
| 60 to 64 Years | 121 (42.9%) | 0 (0.0%) |
| 65 to 74 Years | 178 (30.6%) | 12 (6.7%) |
| 75 Years and over | 23 (4.8%) | 0 (0.0%) |
| Total | 3,036 (64.6%) | 249 (8.2%) |
Employment Status by Educational Attainment in Clearfield borough
According to labor force statistics for Clearfield borough, 79.9% of individuals (2,351) out of the total population between 25 and 64 years of age (2,943) are in the labor force, with 7.8% or 183 of them being unemployed. The group with the highest labor force participation rate are those with the educational attainment of bachelor's degree or higher, with 89.6% or 588 individuals in the labor force. Within the labor force, individuals with high school diploma education have the highest percentage of unemployment, with 11.6% or 120 of them being unemployed.
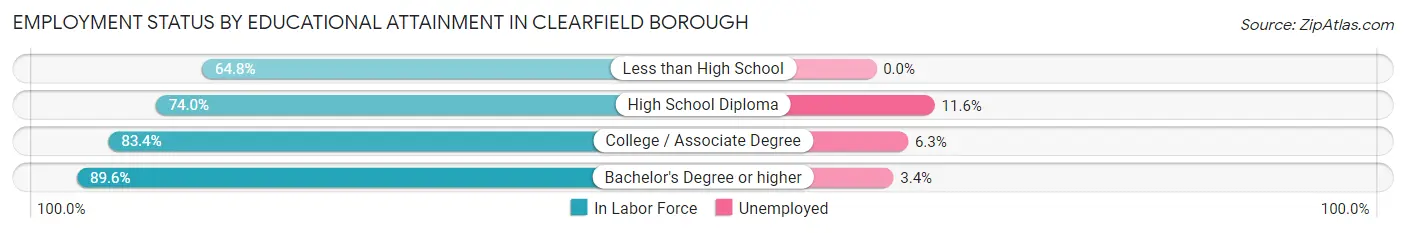
| Educational Attainment | In Labor Force | Unemployed |
| Less than High School | 46 (64.8%) | 0 (0.0%) |
| High School Diploma | 1,035 (74.0%) | 162 (11.6%) |
| College / Associate Degree | 681 (83.4%) | 51 (6.3%) |
| Bachelor's Degree or higher | 588 (89.6%) | 22 (3.4%) |
| Total | 2,351 (79.9%) | 230 (7.8%) |
Employment Occupations by Sex in Clearfield borough
Management, Business, Science and Arts Occupations
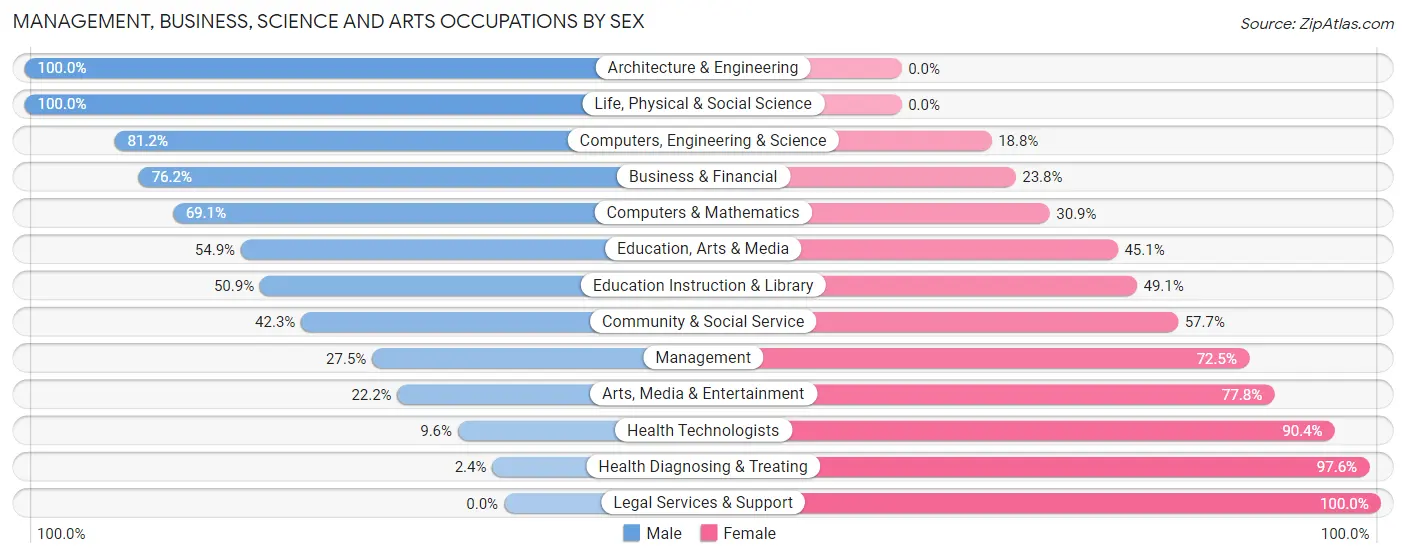
The most common Management, Business, Science and Arts occupations in Clearfield borough are Community & Social Service (364 | 13.1%), Health Diagnosing & Treating (205 | 7.4%), Computers, Engineering & Science (181 | 6.5%), Education Instruction & Library (167 | 6.0%), and Management (120 | 4.3%).
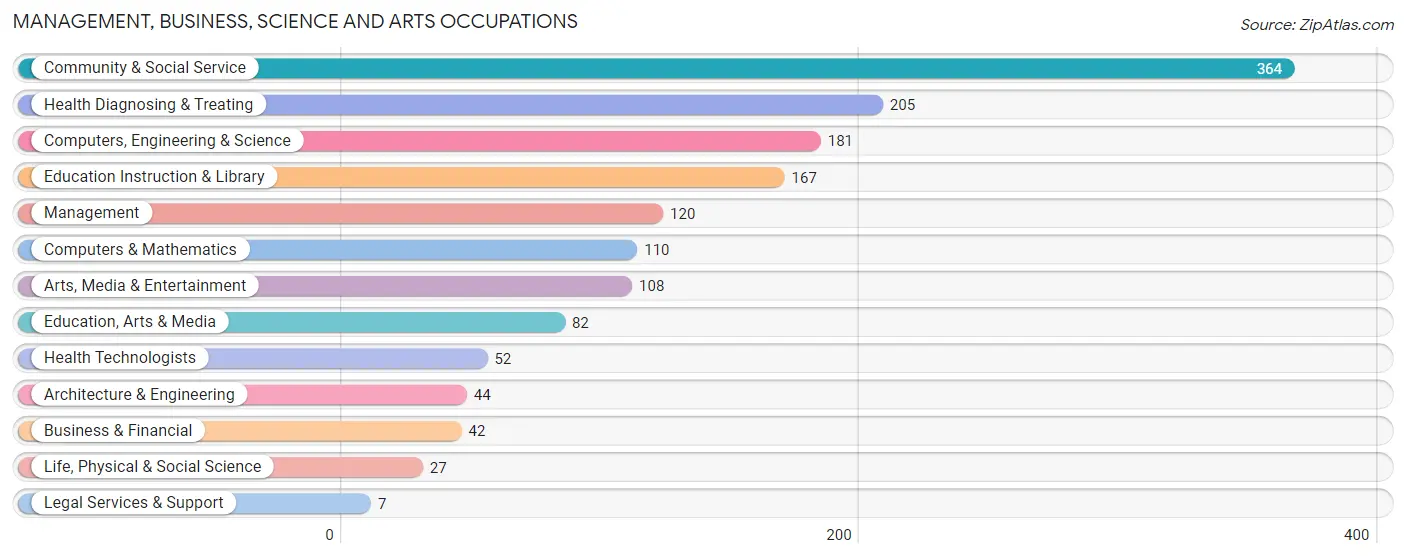
Management, Business, Science and Arts Occupations by Sex
Within the Management, Business, Science and Arts occupations in Clearfield borough, the most male-oriented occupations are Architecture & Engineering (100.0%), Life, Physical & Social Science (100.0%), and Computers, Engineering & Science (81.2%), while the most female-oriented occupations are Legal Services & Support (100.0%), Health Diagnosing & Treating (97.6%), and Health Technologists (90.4%).
| Occupation | Male | Female |
| Management | 33 (27.5%) | 87 (72.5%) |
| Business & Financial | 32 (76.2%) | 10 (23.8%) |
| Computers, Engineering & Science | 147 (81.2%) | 34 (18.8%) |
| Computers & Mathematics | 76 (69.1%) | 34 (30.9%) |
| Architecture & Engineering | 44 (100.0%) | 0 (0.0%) |
| Life, Physical & Social Science | 27 (100.0%) | 0 (0.0%) |
| Community & Social Service | 154 (42.3%) | 210 (57.7%) |
| Education, Arts & Media | 45 (54.9%) | 37 (45.1%) |
| Legal Services & Support | 0 (0.0%) | 7 (100.0%) |
| Education Instruction & Library | 85 (50.9%) | 82 (49.1%) |
| Arts, Media & Entertainment | 24 (22.2%) | 84 (77.8%) |
| Health Diagnosing & Treating | 5 (2.4%) | 200 (97.6%) |
| Health Technologists | 5 (9.6%) | 47 (90.4%) |
| Total (Category) | 371 (40.7%) | 541 (59.3%) |
| Total (Overall) | 1,382 (49.6%) | 1,404 (50.4%) |
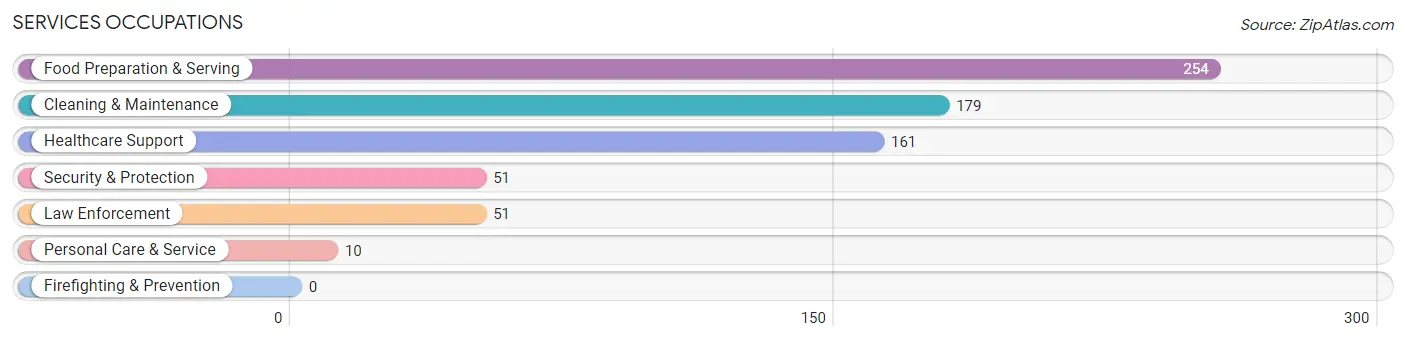
Services Occupations
The most common Services occupations in Clearfield borough are Food Preparation & Serving (254 | 9.1%), Cleaning & Maintenance (179 | 6.4%), Healthcare Support (161 | 5.8%), Security & Protection (51 | 1.8%), and Law Enforcement (51 | 1.8%).
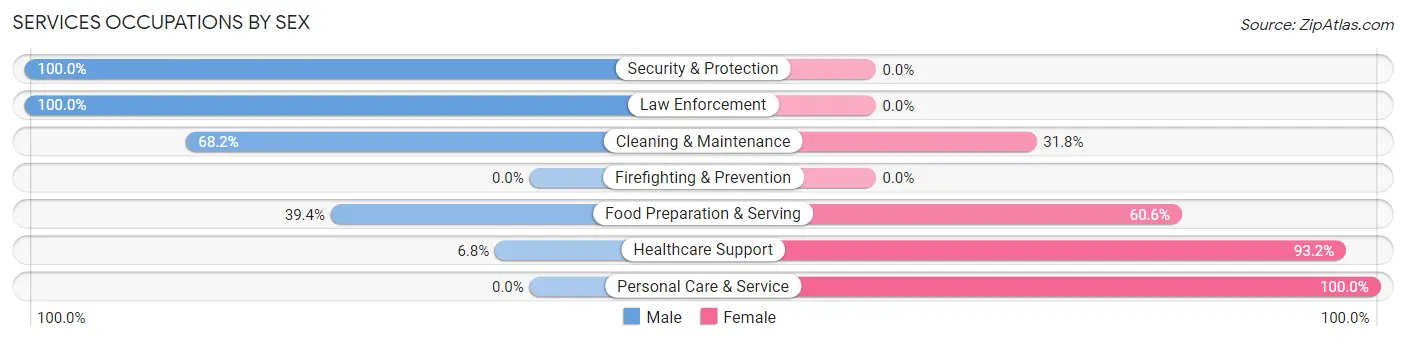
Services Occupations by Sex
Within the Services occupations in Clearfield borough, the most male-oriented occupations are Security & Protection (100.0%), Law Enforcement (100.0%), and Cleaning & Maintenance (68.2%), while the most female-oriented occupations are Personal Care & Service (100.0%), Healthcare Support (93.2%), and Food Preparation & Serving (60.6%).
| Occupation | Male | Female |
| Healthcare Support | 11 (6.8%) | 150 (93.2%) |
| Security & Protection | 51 (100.0%) | 0 (0.0%) |
| Firefighting & Prevention | 0 (0.0%) | 0 (0.0%) |
| Law Enforcement | 51 (100.0%) | 0 (0.0%) |
| Food Preparation & Serving | 100 (39.4%) | 154 (60.6%) |
| Cleaning & Maintenance | 122 (68.2%) | 57 (31.8%) |
| Personal Care & Service | 0 (0.0%) | 10 (100.0%) |
| Total (Category) | 284 (43.4%) | 371 (56.6%) |
| Total (Overall) | 1,382 (49.6%) | 1,404 (50.4%) |
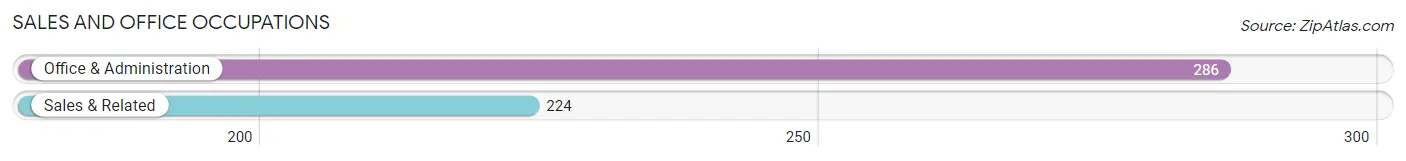
Sales and Office Occupations
The most common Sales and Office occupations in Clearfield borough are Office & Administration (286 | 10.3%), and Sales & Related (224 | 8.0%).
Sales and Office Occupations by Sex
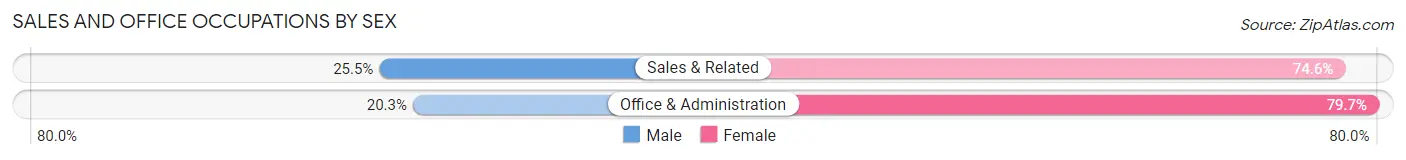
| Occupation | Male | Female |
| Sales & Related | 57 (25.5%) | 167 (74.6%) |
| Office & Administration | 58 (20.3%) | 228 (79.7%) |
| Total (Category) | 115 (22.6%) | 395 (77.4%) |
| Total (Overall) | 1,382 (49.6%) | 1,404 (50.4%) |
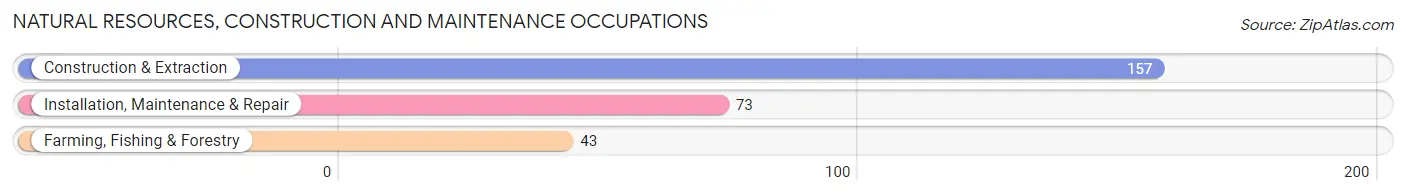
Natural Resources, Construction and Maintenance Occupations
The most common Natural Resources, Construction and Maintenance occupations in Clearfield borough are Construction & Extraction (157 | 5.6%), Installation, Maintenance & Repair (73 | 2.6%), and Farming, Fishing & Forestry (43 | 1.5%).
Natural Resources, Construction and Maintenance Occupations by Sex
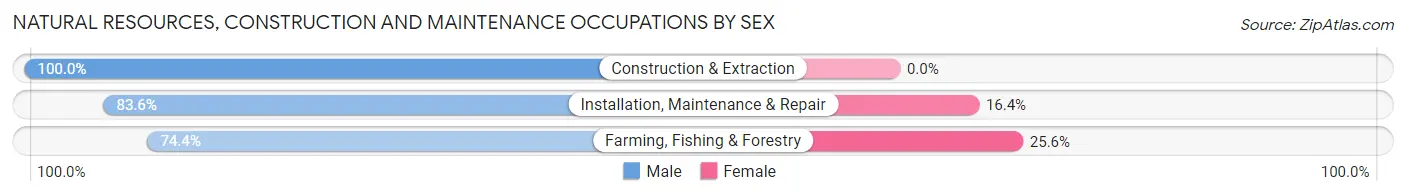
| Occupation | Male | Female |
| Farming, Fishing & Forestry | 32 (74.4%) | 11 (25.6%) |
| Construction & Extraction | 157 (100.0%) | 0 (0.0%) |
| Installation, Maintenance & Repair | 61 (83.6%) | 12 (16.4%) |
| Total (Category) | 250 (91.6%) | 23 (8.4%) |
| Total (Overall) | 1,382 (49.6%) | 1,404 (50.4%) |
Production, Transportation and Moving Occupations
The most common Production, Transportation and Moving occupations in Clearfield borough are Production (181 | 6.5%), Material Moving (178 | 6.4%), and Transportation (77 | 2.8%).
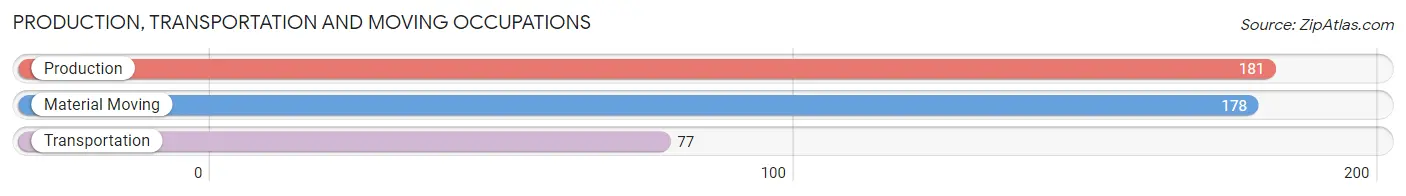
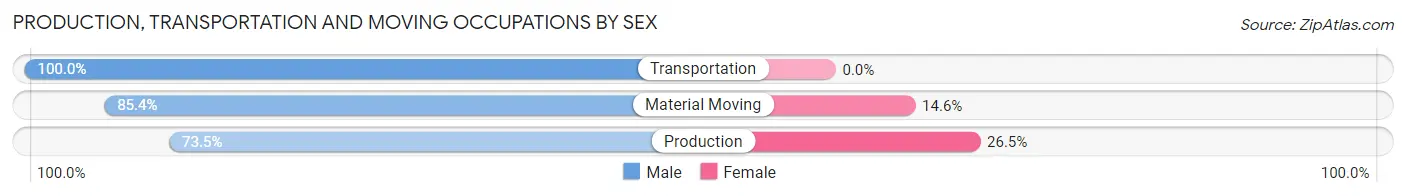
Production, Transportation and Moving Occupations by Sex
| Occupation | Male | Female |
| Production | 133 (73.5%) | 48 (26.5%) |
| Transportation | 77 (100.0%) | 0 (0.0%) |
| Material Moving | 152 (85.4%) | 26 (14.6%) |
| Total (Category) | 362 (83.0%) | 74 (17.0%) |
| Total (Overall) | 1,382 (49.6%) | 1,404 (50.4%) |
Employment Industries by Sex in Clearfield borough
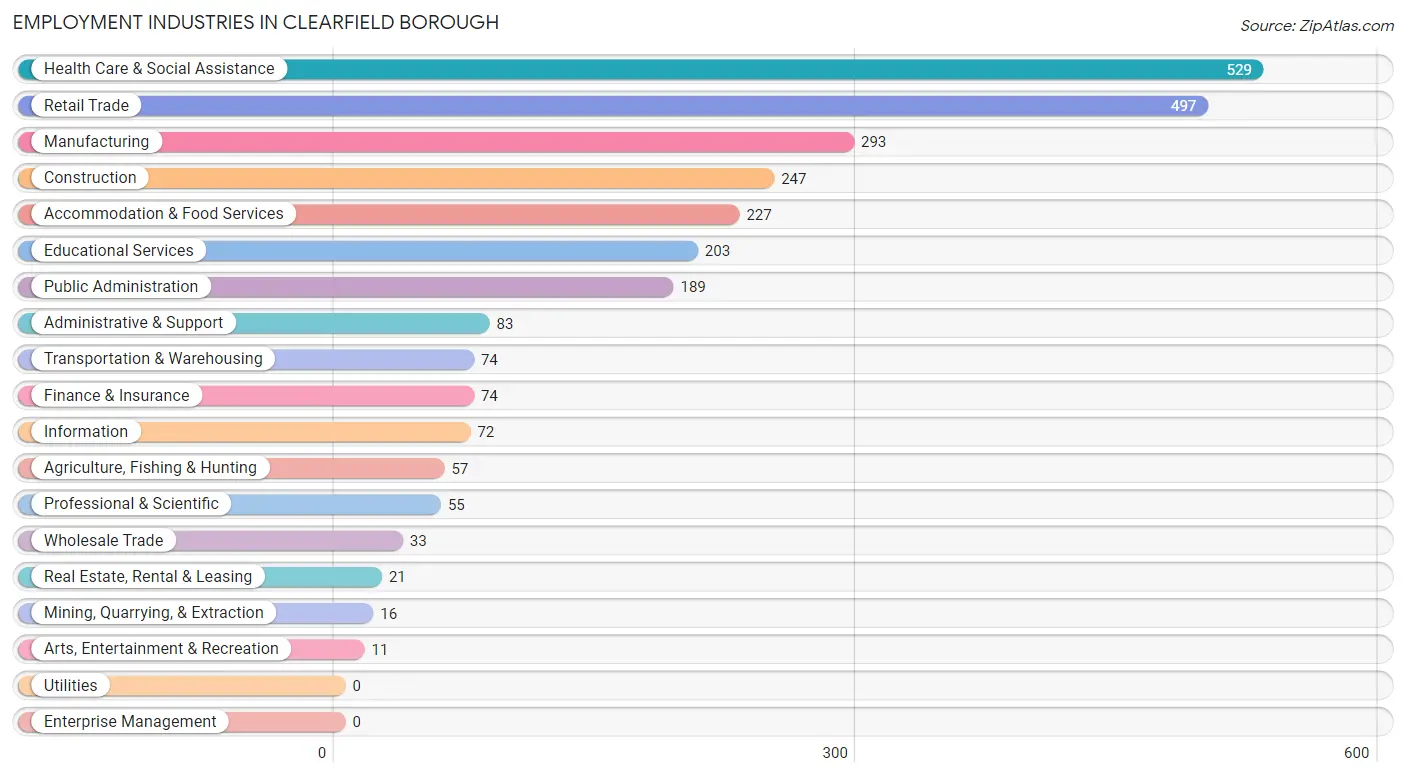
Employment Industries in Clearfield borough
The major employment industries in Clearfield borough include Health Care & Social Assistance (529 | 19.0%), Retail Trade (497 | 17.8%), Manufacturing (293 | 10.5%), Construction (247 | 8.9%), and Accommodation & Food Services (227 | 8.2%).
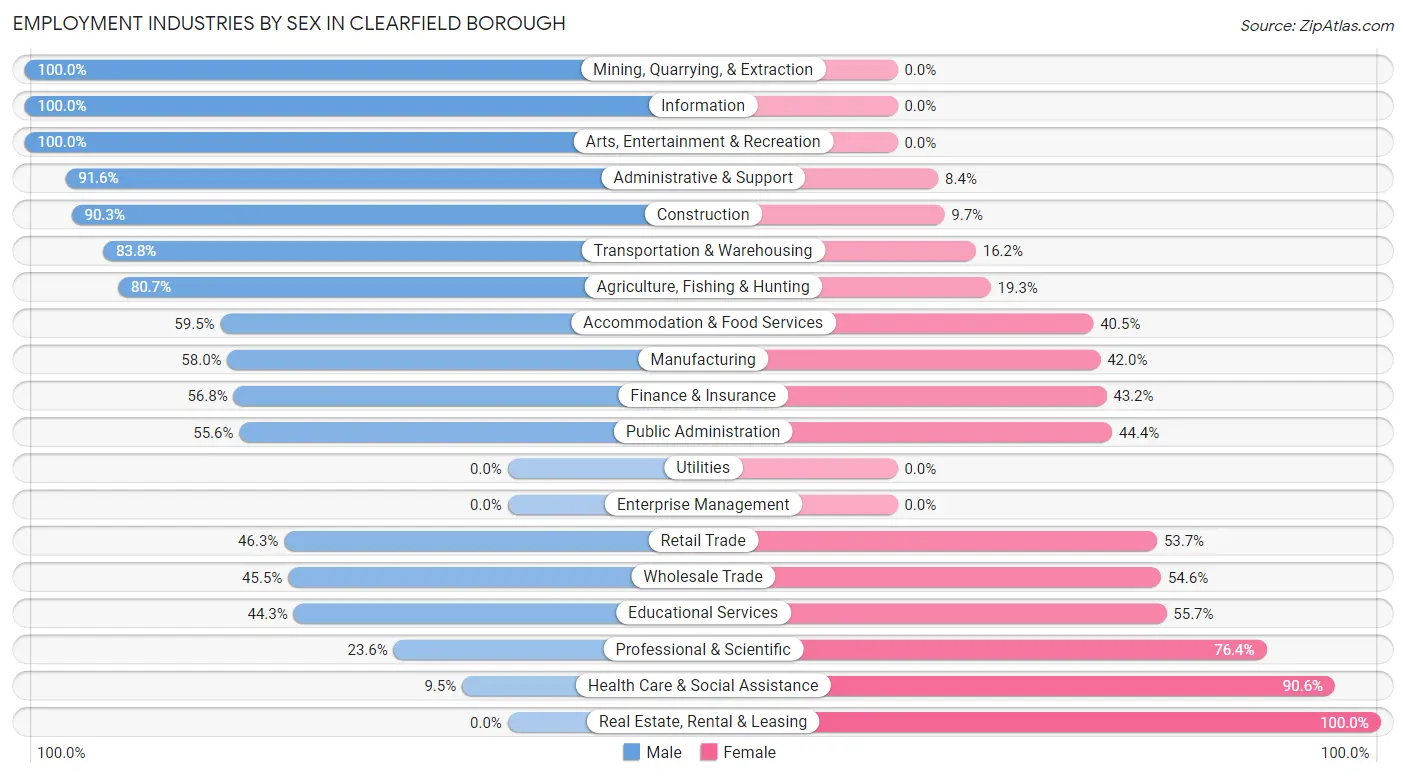
Employment Industries by Sex in Clearfield borough
The Clearfield borough industries that see more men than women are Mining, Quarrying, & Extraction (100.0%), Information (100.0%), and Arts, Entertainment & Recreation (100.0%), whereas the industries that tend to have a higher number of women are Real Estate, Rental & Leasing (100.0%), Health Care & Social Assistance (90.5%), and Professional & Scientific (76.4%).
| Industry | Male | Female |
| Agriculture, Fishing & Hunting | 46 (80.7%) | 11 (19.3%) |
| Mining, Quarrying, & Extraction | 16 (100.0%) | 0 (0.0%) |
| Construction | 223 (90.3%) | 24 (9.7%) |
| Manufacturing | 170 (58.0%) | 123 (42.0%) |
| Wholesale Trade | 15 (45.5%) | 18 (54.5%) |
| Retail Trade | 230 (46.3%) | 267 (53.7%) |
| Transportation & Warehousing | 62 (83.8%) | 12 (16.2%) |
| Utilities | 0 (0.0%) | 0 (0.0%) |
| Information | 72 (100.0%) | 0 (0.0%) |
| Finance & Insurance | 42 (56.8%) | 32 (43.2%) |
| Real Estate, Rental & Leasing | 0 (0.0%) | 21 (100.0%) |
| Professional & Scientific | 13 (23.6%) | 42 (76.4%) |
| Enterprise Management | 0 (0.0%) | 0 (0.0%) |
| Administrative & Support | 76 (91.6%) | 7 (8.4%) |
| Educational Services | 90 (44.3%) | 113 (55.7%) |
| Health Care & Social Assistance | 50 (9.5%) | 479 (90.5%) |
| Arts, Entertainment & Recreation | 11 (100.0%) | 0 (0.0%) |
| Accommodation & Food Services | 135 (59.5%) | 92 (40.5%) |
| Public Administration | 105 (55.6%) | 84 (44.4%) |
| Total | 1,382 (49.6%) | 1,404 (50.4%) |
Education in Clearfield borough
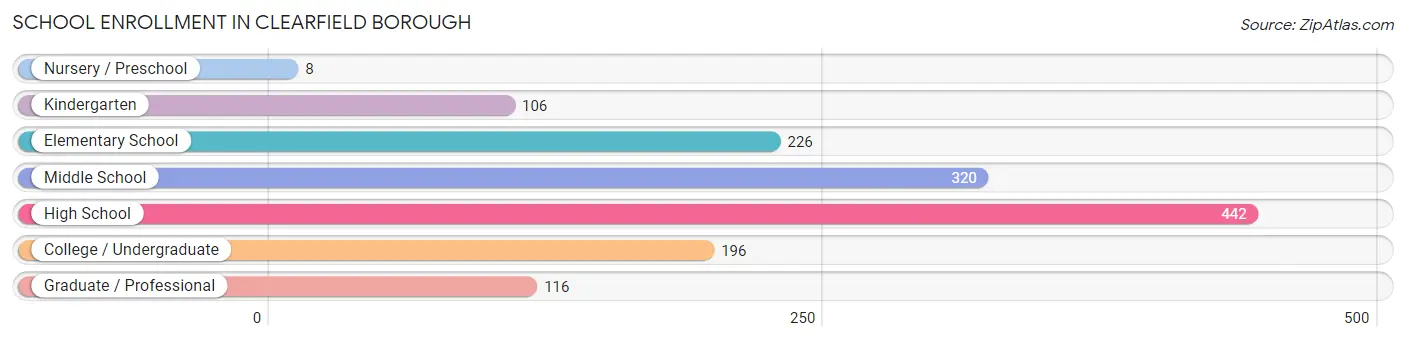
School Enrollment in Clearfield borough
The most common levels of schooling among the 1,414 students in Clearfield borough are high school (442 | 31.3%), middle school (320 | 22.6%), and elementary school (226 | 16.0%).
| School Level | # Students | % Students |
| Nursery / Preschool | 8 | 0.6% |
| Kindergarten | 106 | 7.5% |
| Elementary School | 226 | 16.0% |
| Middle School | 320 | 22.6% |
| High School | 442 | 31.3% |
| College / Undergraduate | 196 | 13.9% |
| Graduate / Professional | 116 | 8.2% |
| Total | 1,414 | 100.0% |
School Enrollment by Age by Funding Source in Clearfield borough
Out of a total of 1,414 students who are enrolled in schools in Clearfield borough, 65 (4.6%) attend a private institution, while the remaining 1,349 (95.4%) are enrolled in public schools. The age group of 35 years and over has the highest likelihood of being enrolled in private schools, with 20 (13.4% in the age bracket) enrolled. Conversely, the age group of 3 to 4 year olds has the lowest likelihood of being enrolled in a private school, with 12 (100.0% in the age bracket) attending a public institution.
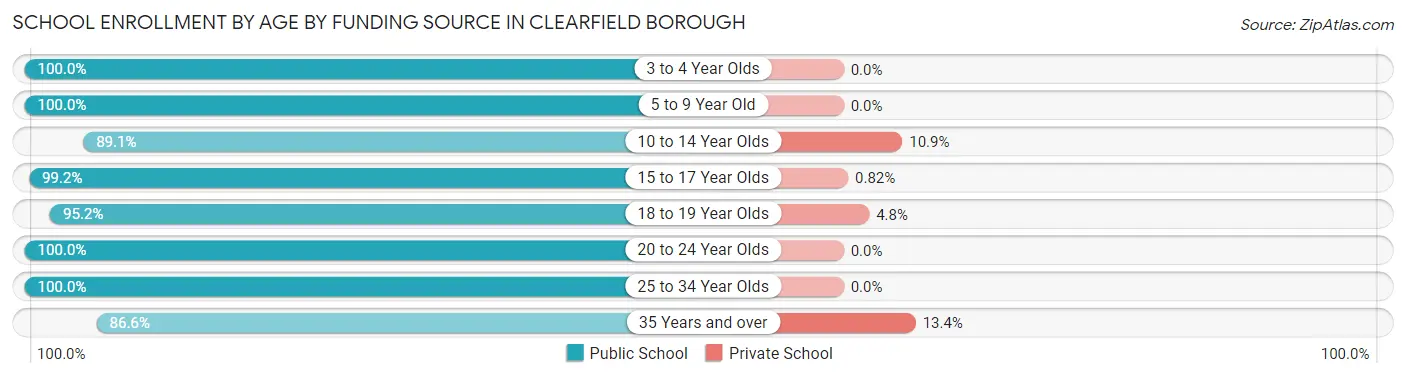
| Age Bracket | Public School | Private School |
| 3 to 4 Year Olds | 12 (100.0%) | 0 (0.0%) |
| 5 to 9 Year Old | 300 (100.0%) | 0 (0.0%) |
| 10 to 14 Year Olds | 310 (89.1%) | 38 (10.9%) |
| 15 to 17 Year Olds | 361 (99.2%) | 3 (0.8%) |
| 18 to 19 Year Olds | 80 (95.2%) | 4 (4.8%) |
| 20 to 24 Year Olds | 98 (100.0%) | 0 (0.0%) |
| 25 to 34 Year Olds | 59 (100.0%) | 0 (0.0%) |
| 35 Years and over | 129 (86.6%) | 20 (13.4%) |
| Total | 1,349 (95.4%) | 65 (4.6%) |
Educational Attainment by Field of Study in Clearfield borough
Education (249 | 26.8%), business (118 | 12.7%), arts & humanities (101 | 10.9%), science & technology (87 | 9.4%), and psychology (63 | 6.8%) are the most common fields of study among 928 individuals in Clearfield borough who have obtained a bachelor's degree or higher.
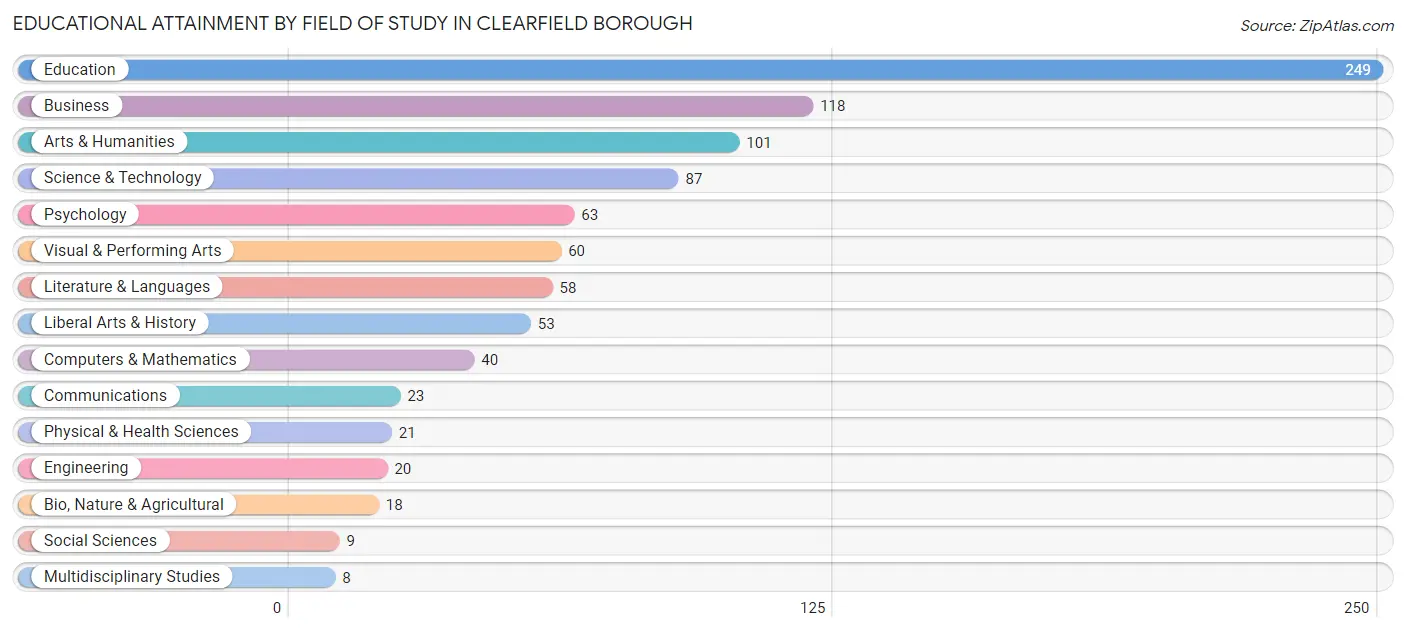
| Field of Study | # Graduates | % Graduates |
| Computers & Mathematics | 40 | 4.3% |
| Bio, Nature & Agricultural | 18 | 1.9% |
| Physical & Health Sciences | 21 | 2.3% |
| Psychology | 63 | 6.8% |
| Social Sciences | 9 | 1.0% |
| Engineering | 20 | 2.2% |
| Multidisciplinary Studies | 8 | 0.9% |
| Science & Technology | 87 | 9.4% |
| Business | 118 | 12.7% |
| Education | 249 | 26.8% |
| Literature & Languages | 58 | 6.2% |
| Liberal Arts & History | 53 | 5.7% |
| Visual & Performing Arts | 60 | 6.5% |
| Communications | 23 | 2.5% |
| Arts & Humanities | 101 | 10.9% |
| Total | 928 | 100.0% |
Transportation & Commute in Clearfield borough
Vehicle Availability by Sex in Clearfield borough
The most prevalent vehicle ownership categories in Clearfield borough are males with 2 vehicles (499, accounting for 36.5%) and females with 2 vehicles (521, making up 36.3%).
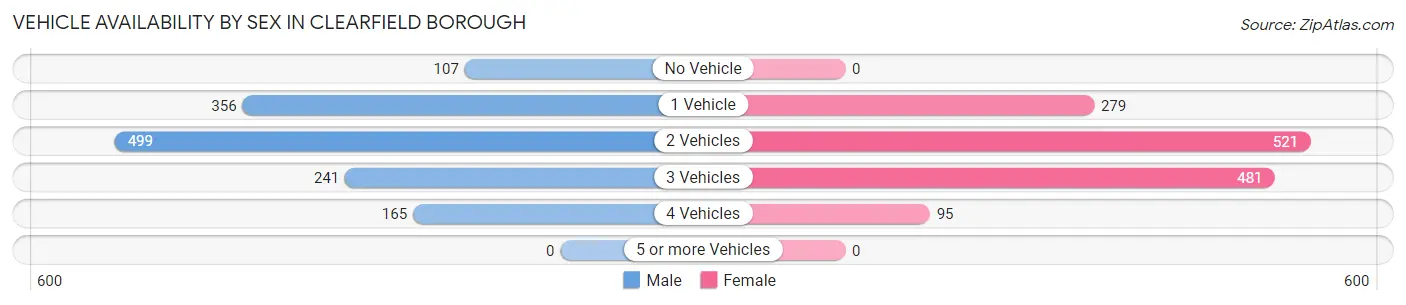
| Vehicles Available | Male | Female |
| No Vehicle | 107 (7.8%) | 0 (0.0%) |
| 1 Vehicle | 356 (26.0%) | 279 (20.3%) |
| 2 Vehicles | 499 (36.5%) | 521 (37.9%) |
| 3 Vehicles | 241 (17.6%) | 481 (35.0%) |
| 4 Vehicles | 165 (12.1%) | 95 (6.9%) |
| 5 or more Vehicles | 0 (0.0%) | 0 (0.0%) |
| Total | 1,368 (100.0%) | 1,376 (100.0%) |
Commute Time in Clearfield borough
The most frequently occuring commute durations in Clearfield borough are 5 to 9 minutes (696 commuters, 27.7%), 10 to 14 minutes (366 commuters, 14.6%), and less than 5 minutes (303 commuters, 12.0%).
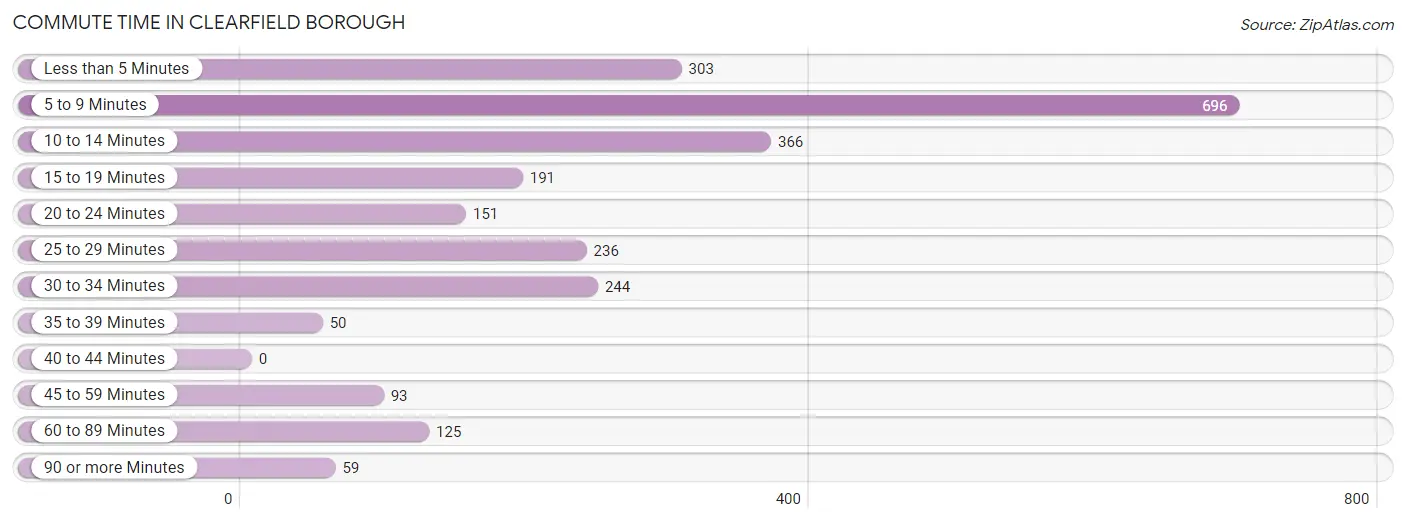
| Commute Time | # Commuters | % Commuters |
| Less than 5 Minutes | 303 | 12.0% |
| 5 to 9 Minutes | 696 | 27.7% |
| 10 to 14 Minutes | 366 | 14.6% |
| 15 to 19 Minutes | 191 | 7.6% |
| 20 to 24 Minutes | 151 | 6.0% |
| 25 to 29 Minutes | 236 | 9.4% |
| 30 to 34 Minutes | 244 | 9.7% |
| 35 to 39 Minutes | 50 | 2.0% |
| 40 to 44 Minutes | 0 | 0.0% |
| 45 to 59 Minutes | 93 | 3.7% |
| 60 to 89 Minutes | 125 | 5.0% |
| 90 or more Minutes | 59 | 2.4% |
Commute Time by Sex in Clearfield borough
The most common commute times in Clearfield borough are 5 to 9 minutes (365 commuters, 29.9%) for males and 5 to 9 minutes (331 commuters, 25.6%) for females.
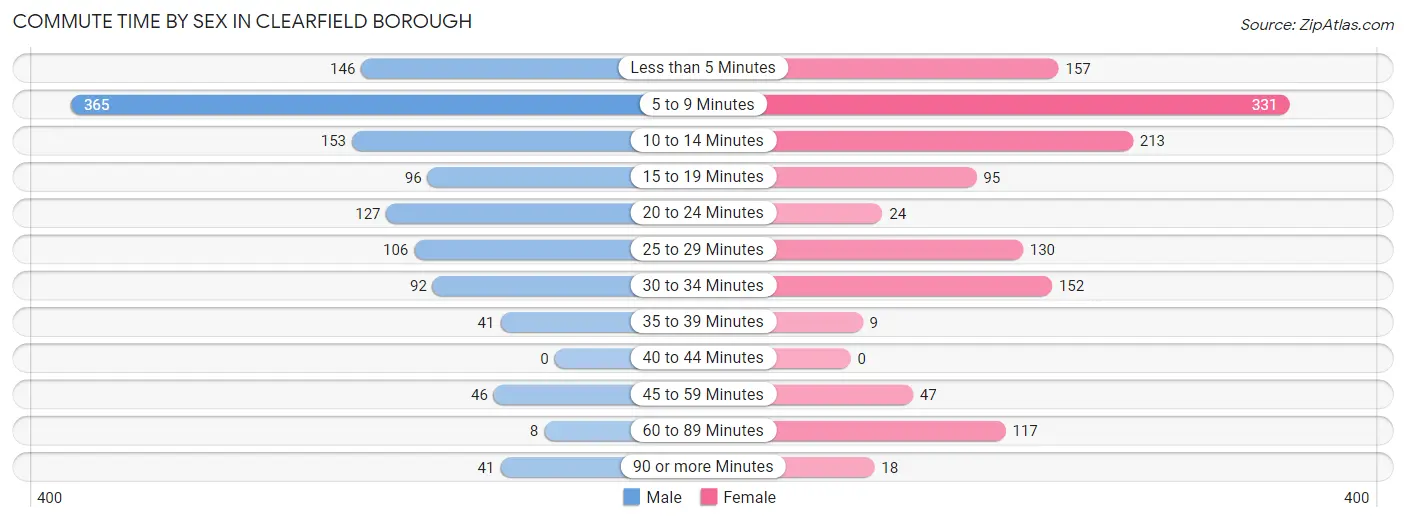
| Commute Time | Male | Female |
| Less than 5 Minutes | 146 (12.0%) | 157 (12.1%) |
| 5 to 9 Minutes | 365 (29.9%) | 331 (25.6%) |
| 10 to 14 Minutes | 153 (12.5%) | 213 (16.5%) |
| 15 to 19 Minutes | 96 (7.9%) | 95 (7.3%) |
| 20 to 24 Minutes | 127 (10.4%) | 24 (1.9%) |
| 25 to 29 Minutes | 106 (8.7%) | 130 (10.1%) |
| 30 to 34 Minutes | 92 (7.5%) | 152 (11.8%) |
| 35 to 39 Minutes | 41 (3.4%) | 9 (0.7%) |
| 40 to 44 Minutes | 0 (0.0%) | 0 (0.0%) |
| 45 to 59 Minutes | 46 (3.8%) | 47 (3.6%) |
| 60 to 89 Minutes | 8 (0.7%) | 117 (9.0%) |
| 90 or more Minutes | 41 (3.4%) | 18 (1.4%) |
Time of Departure to Work by Sex in Clearfield borough
The most frequent times of departure to work in Clearfield borough are 12:00 PM to 3:59 PM (191, 15.6%) for males and 7:30 AM to 7:59 AM (278, 21.5%) for females.
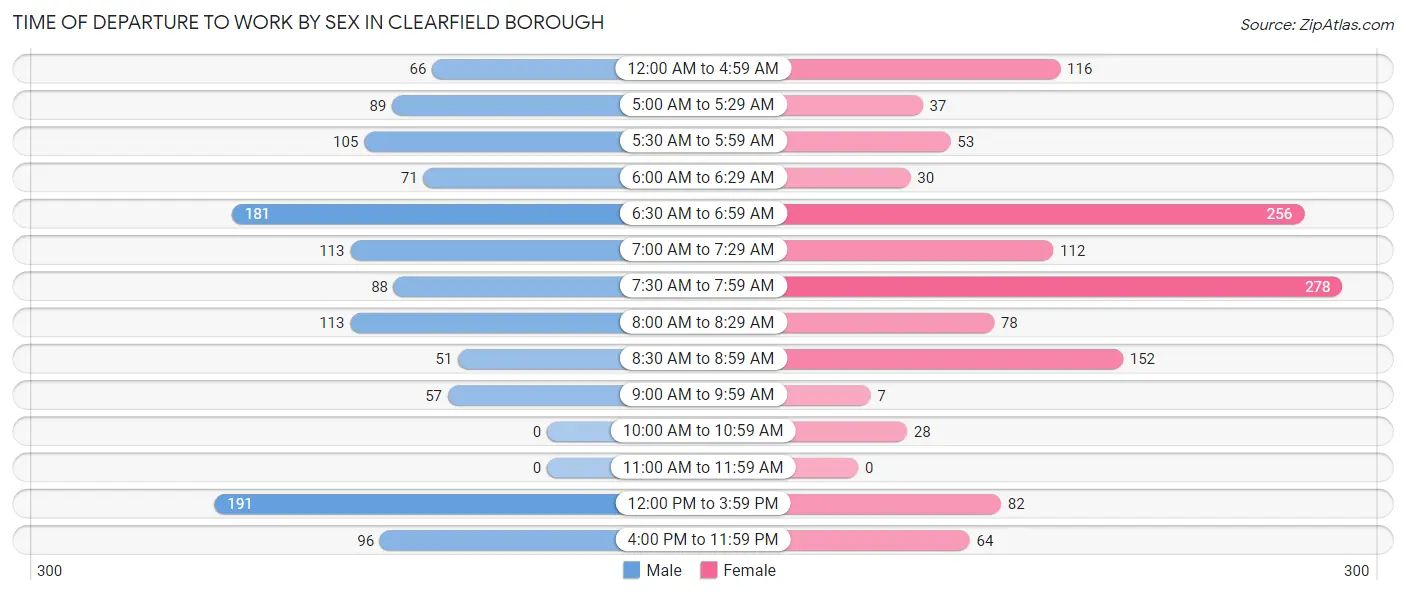
| Time of Departure | Male | Female |
| 12:00 AM to 4:59 AM | 66 (5.4%) | 116 (9.0%) |
| 5:00 AM to 5:29 AM | 89 (7.3%) | 37 (2.9%) |
| 5:30 AM to 5:59 AM | 105 (8.6%) | 53 (4.1%) |
| 6:00 AM to 6:29 AM | 71 (5.8%) | 30 (2.3%) |
| 6:30 AM to 6:59 AM | 181 (14.8%) | 256 (19.8%) |
| 7:00 AM to 7:29 AM | 113 (9.2%) | 112 (8.7%) |
| 7:30 AM to 7:59 AM | 88 (7.2%) | 278 (21.5%) |
| 8:00 AM to 8:29 AM | 113 (9.2%) | 78 (6.0%) |
| 8:30 AM to 8:59 AM | 51 (4.2%) | 152 (11.8%) |
| 9:00 AM to 9:59 AM | 57 (4.7%) | 7 (0.5%) |
| 10:00 AM to 10:59 AM | 0 (0.0%) | 28 (2.2%) |
| 11:00 AM to 11:59 AM | 0 (0.0%) | 0 (0.0%) |
| 12:00 PM to 3:59 PM | 191 (15.6%) | 82 (6.3%) |
| 4:00 PM to 11:59 PM | 96 (7.9%) | 64 (5.0%) |
| Total | 1,221 (100.0%) | 1,293 (100.0%) |
Housing Occupancy in Clearfield borough
Occupancy by Ownership in Clearfield borough
Of the total 2,638 dwellings in Clearfield borough, owner-occupied units account for 1,362 (51.6%), while renter-occupied units make up 1,276 (48.4%).
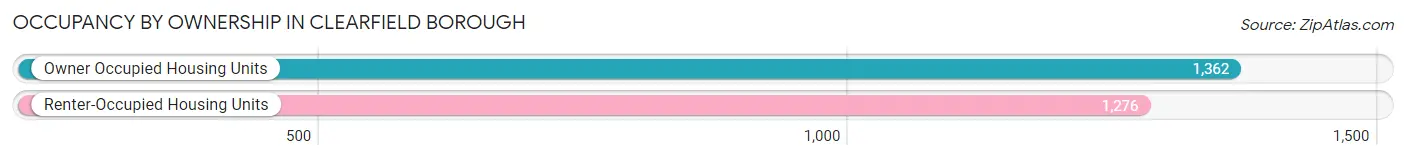
| Occupancy | # Housing Units | % Housing Units |
| Owner Occupied Housing Units | 1,362 | 51.6% |
| Renter-Occupied Housing Units | 1,276 | 48.4% |
| Total Occupied Housing Units | 2,638 | 100.0% |
Occupancy by Household Size in Clearfield borough
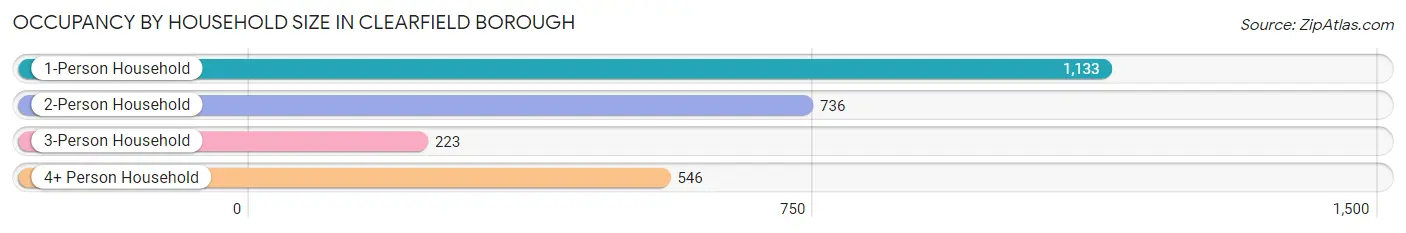
| Household Size | # Housing Units | % Housing Units |
| 1-Person Household | 1,133 | 42.9% |
| 2-Person Household | 736 | 27.9% |
| 3-Person Household | 223 | 8.5% |
| 4+ Person Household | 546 | 20.7% |
| Total Housing Units | 2,638 | 100.0% |
Occupancy by Ownership by Household Size in Clearfield borough
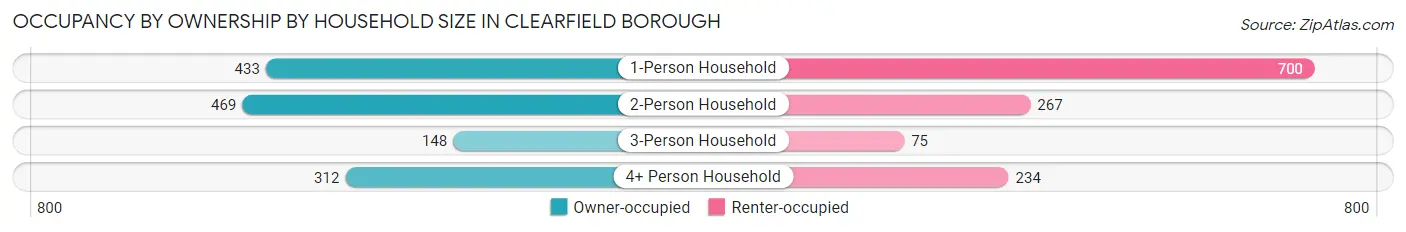
| Household Size | Owner-occupied | Renter-occupied |
| 1-Person Household | 433 (38.2%) | 700 (61.8%) |
| 2-Person Household | 469 (63.7%) | 267 (36.3%) |
| 3-Person Household | 148 (66.4%) | 75 (33.6%) |
| 4+ Person Household | 312 (57.1%) | 234 (42.9%) |
| Total Housing Units | 1,362 (51.6%) | 1,276 (48.4%) |
Occupancy by Educational Attainment in Clearfield borough
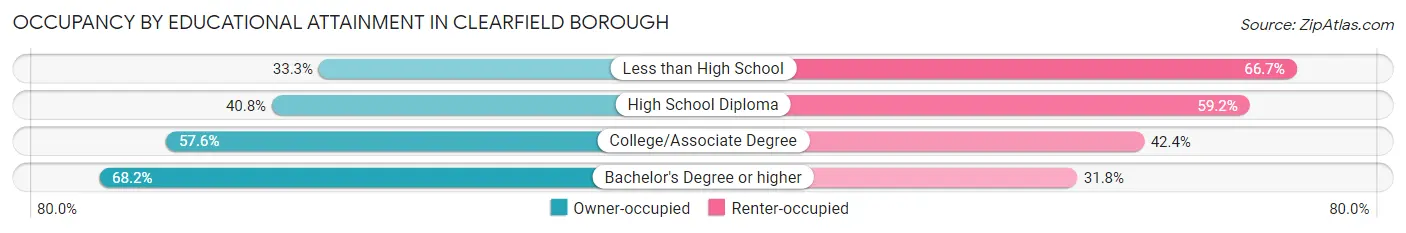
| Household Size | Owner-occupied | Renter-occupied |
| Less than High School | 31 (33.3%) | 62 (66.7%) |
| High School Diploma | 479 (40.8%) | 696 (59.2%) |
| College/Associate Degree | 445 (57.6%) | 328 (42.4%) |
| Bachelor's Degree or higher | 407 (68.2%) | 190 (31.8%) |
Occupancy by Age of Householder in Clearfield borough
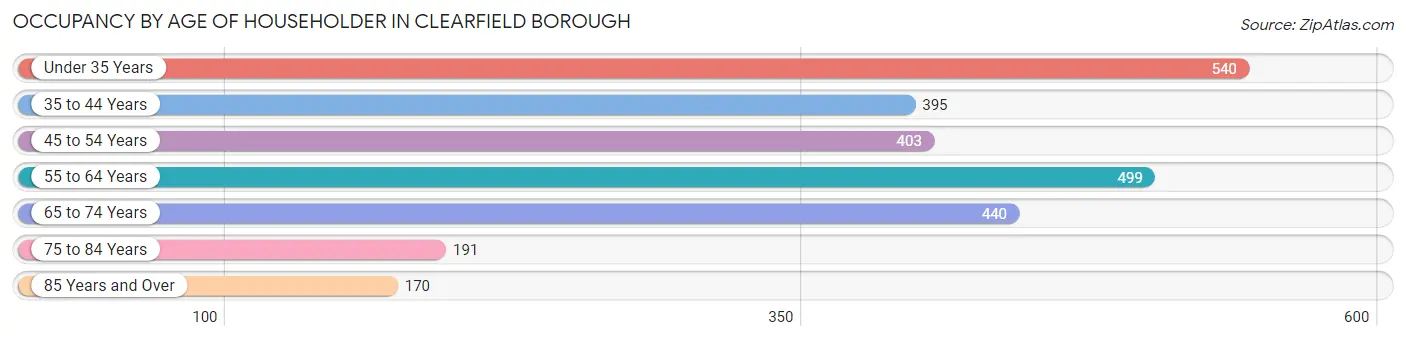
| Age Bracket | # Households | % Households |
| Under 35 Years | 540 | 20.5% |
| 35 to 44 Years | 395 | 15.0% |
| 45 to 54 Years | 403 | 15.3% |
| 55 to 64 Years | 499 | 18.9% |
| 65 to 74 Years | 440 | 16.7% |
| 75 to 84 Years | 191 | 7.2% |
| 85 Years and Over | 170 | 6.4% |
| Total | 2,638 | 100.0% |
Housing Finances in Clearfield borough
Median Income by Occupancy in Clearfield borough
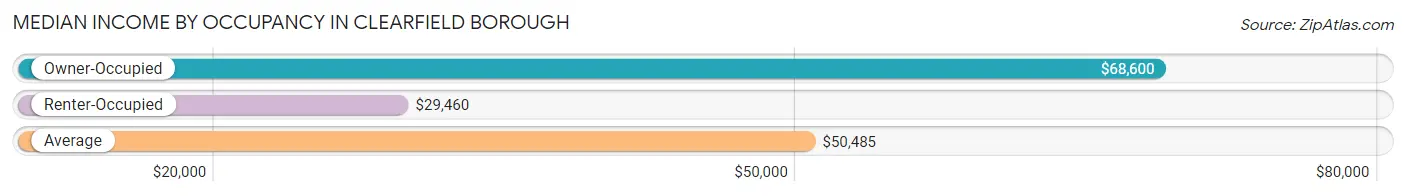
| Occupancy Type | # Households | Median Income |
| Owner-Occupied | 1,362 (51.6%) | $68,600 |
| Renter-Occupied | 1,276 (48.4%) | $29,460 |
| Average | 2,638 (100.0%) | $50,485 |
Occupancy by Householder Income Bracket in Clearfield borough
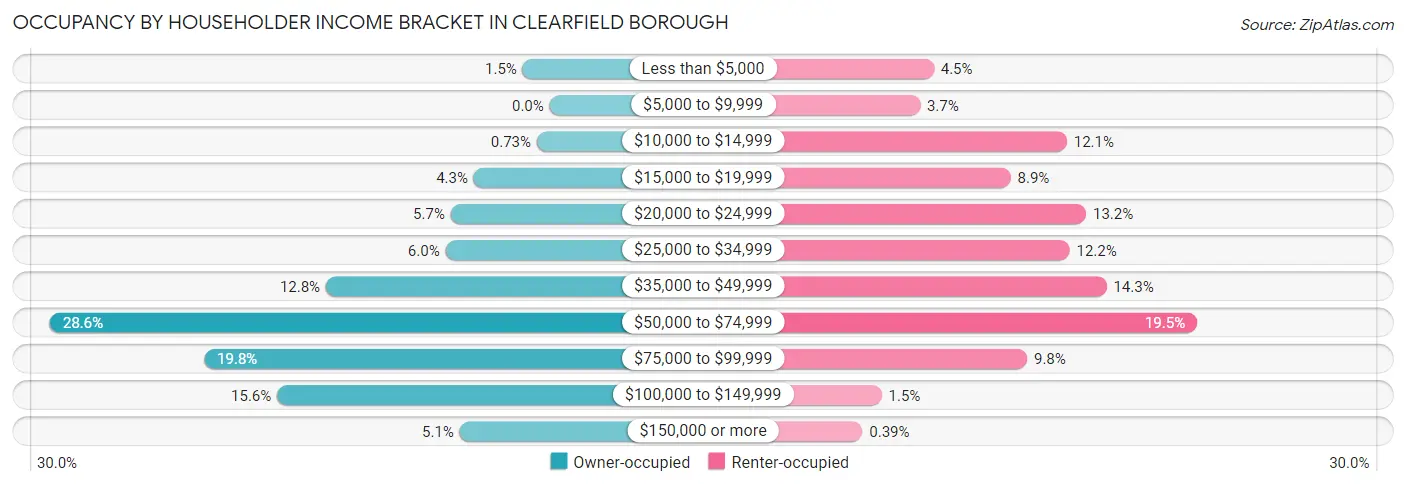
| Income Bracket | Owner-occupied | Renter-occupied |
| Less than $5,000 | 21 (1.5%) | 57 (4.5%) |
| $5,000 to $9,999 | 0 (0.0%) | 47 (3.7%) |
| $10,000 to $14,999 | 10 (0.7%) | 154 (12.1%) |
| $15,000 to $19,999 | 59 (4.3%) | 113 (8.9%) |
| $20,000 to $24,999 | 77 (5.7%) | 168 (13.2%) |
| $25,000 to $34,999 | 81 (5.9%) | 156 (12.2%) |
| $35,000 to $49,999 | 174 (12.8%) | 183 (14.3%) |
| $50,000 to $74,999 | 389 (28.6%) | 249 (19.5%) |
| $75,000 to $99,999 | 269 (19.8%) | 125 (9.8%) |
| $100,000 to $149,999 | 212 (15.6%) | 19 (1.5%) |
| $150,000 or more | 70 (5.1%) | 5 (0.4%) |
| Total | 1,362 (100.0%) | 1,276 (100.0%) |
Monthly Housing Cost Tiers in Clearfield borough
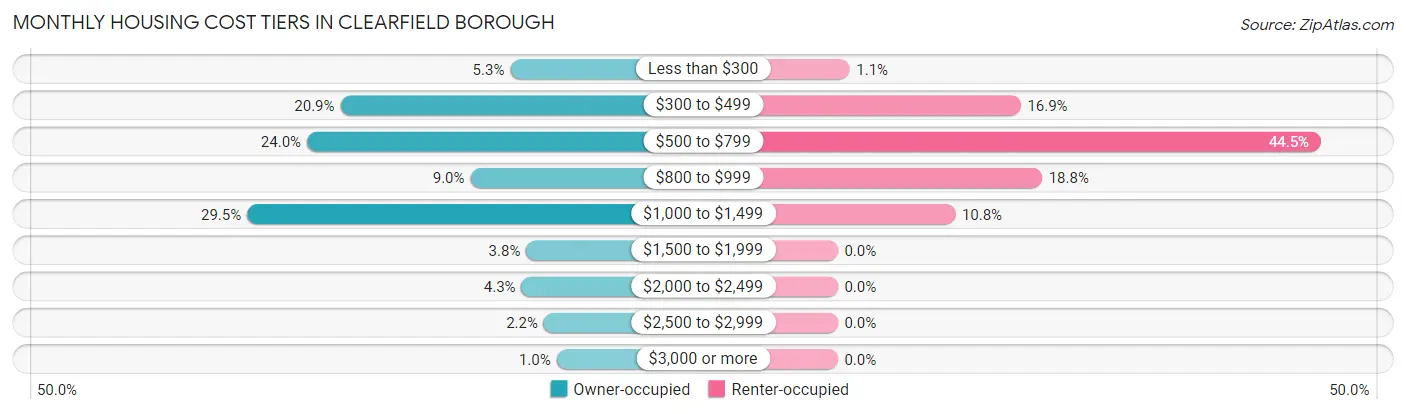
| Monthly Cost | Owner-occupied | Renter-occupied |
| Less than $300 | 72 (5.3%) | 14 (1.1%) |
| $300 to $499 | 285 (20.9%) | 215 (16.9%) |
| $500 to $799 | 327 (24.0%) | 568 (44.5%) |
| $800 to $999 | 122 (9.0%) | 240 (18.8%) |
| $1,000 to $1,499 | 402 (29.5%) | 138 (10.8%) |
| $1,500 to $1,999 | 52 (3.8%) | 0 (0.0%) |
| $2,000 to $2,499 | 58 (4.3%) | 0 (0.0%) |
| $2,500 to $2,999 | 30 (2.2%) | 0 (0.0%) |
| $3,000 or more | 14 (1.0%) | 0 (0.0%) |
| Total | 1,362 (100.0%) | 1,276 (100.0%) |
Physical Housing Characteristics in Clearfield borough
Housing Structures in Clearfield borough
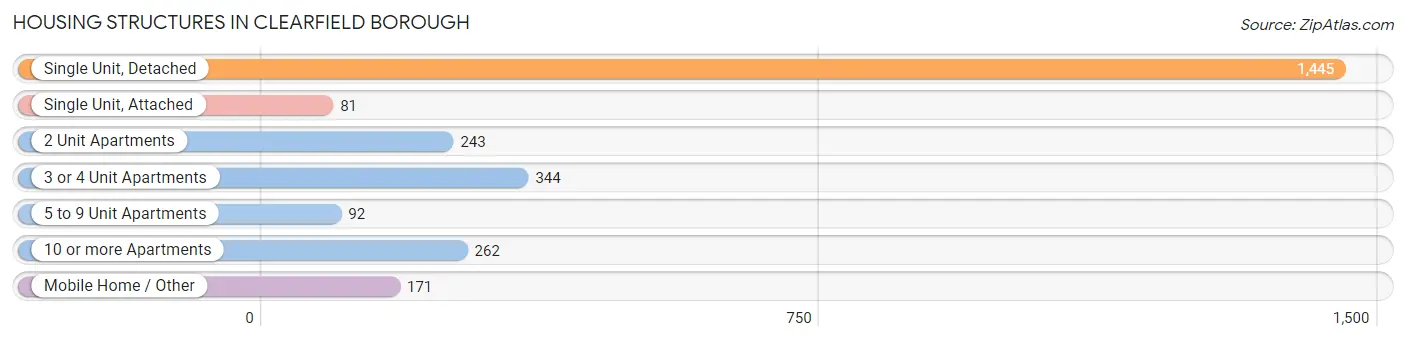
| Structure Type | # Housing Units | % Housing Units |
| Single Unit, Detached | 1,445 | 54.8% |
| Single Unit, Attached | 81 | 3.1% |
| 2 Unit Apartments | 243 | 9.2% |
| 3 or 4 Unit Apartments | 344 | 13.0% |
| 5 to 9 Unit Apartments | 92 | 3.5% |
| 10 or more Apartments | 262 | 9.9% |
| Mobile Home / Other | 171 | 6.5% |
| Total | 2,638 | 100.0% |
Housing Structures by Occupancy in Clearfield borough
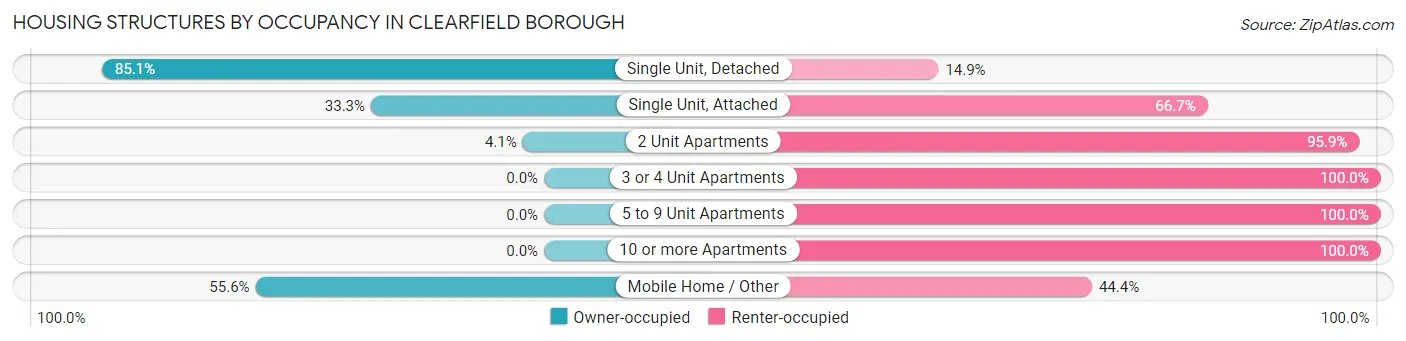
| Structure Type | Owner-occupied | Renter-occupied |
| Single Unit, Detached | 1,230 (85.1%) | 215 (14.9%) |
| Single Unit, Attached | 27 (33.3%) | 54 (66.7%) |
| 2 Unit Apartments | 10 (4.1%) | 233 (95.9%) |
| 3 or 4 Unit Apartments | 0 (0.0%) | 344 (100.0%) |
| 5 to 9 Unit Apartments | 0 (0.0%) | 92 (100.0%) |
| 10 or more Apartments | 0 (0.0%) | 262 (100.0%) |
| Mobile Home / Other | 95 (55.6%) | 76 (44.4%) |
| Total | 1,362 (51.6%) | 1,276 (48.4%) |
Housing Structures by Number of Rooms in Clearfield borough
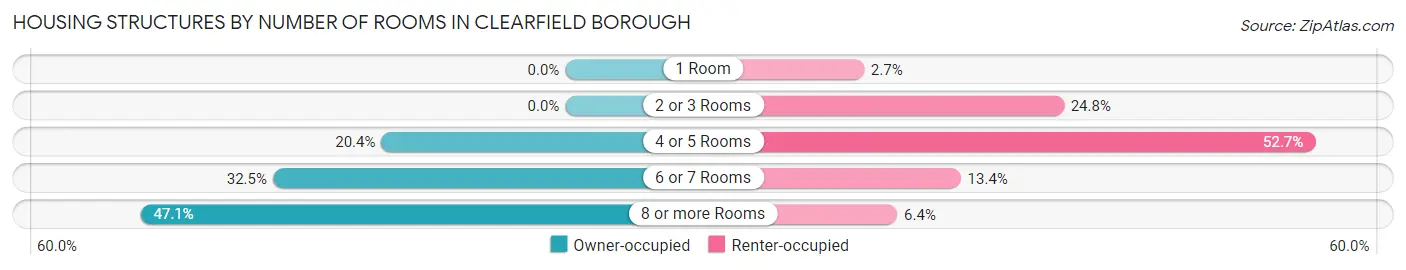
| Number of Rooms | Owner-occupied | Renter-occupied |
| 1 Room | 0 (0.0%) | 34 (2.7%) |
| 2 or 3 Rooms | 0 (0.0%) | 317 (24.8%) |
| 4 or 5 Rooms | 278 (20.4%) | 673 (52.7%) |
| 6 or 7 Rooms | 442 (32.5%) | 171 (13.4%) |
| 8 or more Rooms | 642 (47.1%) | 81 (6.4%) |
| Total | 1,362 (100.0%) | 1,276 (100.0%) |
Housing Structure by Heating Type in Clearfield borough
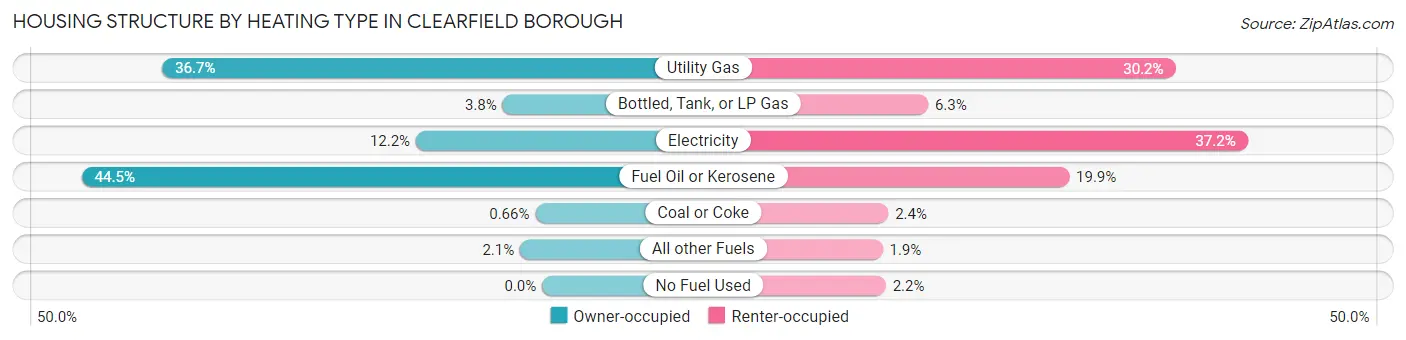
| Heating Type | Owner-occupied | Renter-occupied |
| Utility Gas | 500 (36.7%) | 385 (30.2%) |
| Bottled, Tank, or LP Gas | 52 (3.8%) | 80 (6.3%) |
| Electricity | 166 (12.2%) | 474 (37.1%) |
| Fuel Oil or Kerosene | 606 (44.5%) | 254 (19.9%) |
| Coal or Coke | 9 (0.7%) | 31 (2.4%) |
| All other Fuels | 29 (2.1%) | 24 (1.9%) |
| No Fuel Used | 0 (0.0%) | 28 (2.2%) |
| Total | 1,362 (100.0%) | 1,276 (100.0%) |
Household Vehicle Usage in Clearfield borough
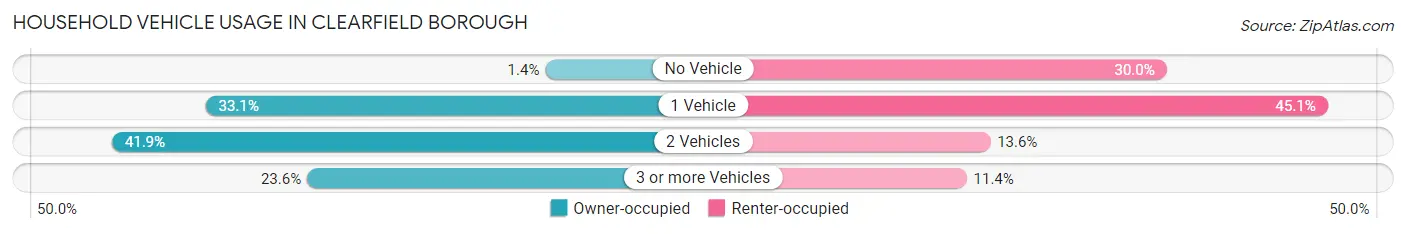
| Vehicles per Household | Owner-occupied | Renter-occupied |
| No Vehicle | 19 (1.4%) | 383 (30.0%) |
| 1 Vehicle | 451 (33.1%) | 575 (45.1%) |
| 2 Vehicles | 570 (41.8%) | 173 (13.6%) |
| 3 or more Vehicles | 322 (23.6%) | 145 (11.4%) |
| Total | 1,362 (100.0%) | 1,276 (100.0%) |
Real Estate & Mortgages in Clearfield borough
Real Estate and Mortgage Overview in Clearfield borough
| Characteristic | Without Mortgage | With Mortgage |
| Housing Units | 644 | 718 |
| Median Property Value | $93,200 | $103,300 |
| Median Household Income | $50,703 | $70 |
| Monthly Housing Costs | $481 | $14 |
| Real Estate Taxes | $1,418 | $2 |
Property Value by Mortgage Status in Clearfield borough
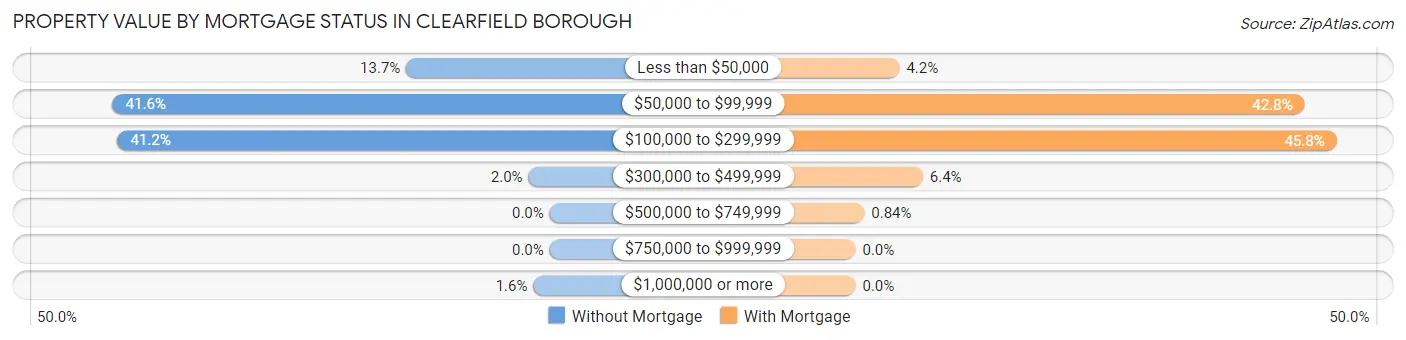
| Property Value | Without Mortgage | With Mortgage |
| Less than $50,000 | 88 (13.7%) | 30 (4.2%) |
| $50,000 to $99,999 | 268 (41.6%) | 307 (42.8%) |
| $100,000 to $299,999 | 265 (41.1%) | 329 (45.8%) |
| $300,000 to $499,999 | 13 (2.0%) | 46 (6.4%) |
| $500,000 to $749,999 | 0 (0.0%) | 6 (0.8%) |
| $750,000 to $999,999 | 0 (0.0%) | 0 (0.0%) |
| $1,000,000 or more | 10 (1.5%) | 0 (0.0%) |
| Total | 644 (100.0%) | 718 (100.0%) |
Household Income by Mortgage Status in Clearfield borough
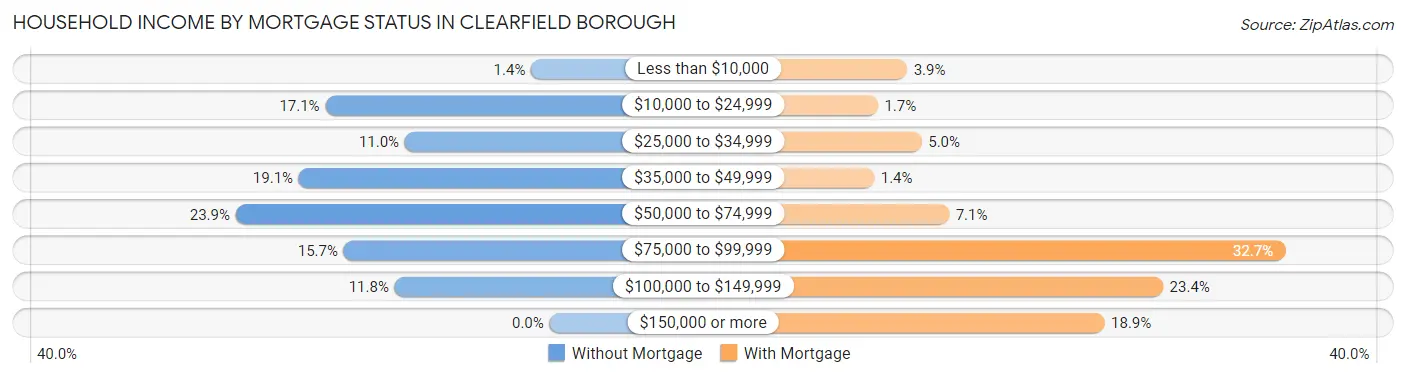
| Household Income | Without Mortgage | With Mortgage |
| Less than $10,000 | 9 (1.4%) | 28 (3.9%) |
| $10,000 to $24,999 | 110 (17.1%) | 12 (1.7%) |
| $25,000 to $34,999 | 71 (11.0%) | 36 (5.0%) |
| $35,000 to $49,999 | 123 (19.1%) | 10 (1.4%) |
| $50,000 to $74,999 | 154 (23.9%) | 51 (7.1%) |
| $75,000 to $99,999 | 101 (15.7%) | 235 (32.7%) |
| $100,000 to $149,999 | 76 (11.8%) | 168 (23.4%) |
| $150,000 or more | 0 (0.0%) | 136 (18.9%) |
| Total | 644 (100.0%) | 718 (100.0%) |
Property Value to Household Income Ratio in Clearfield borough
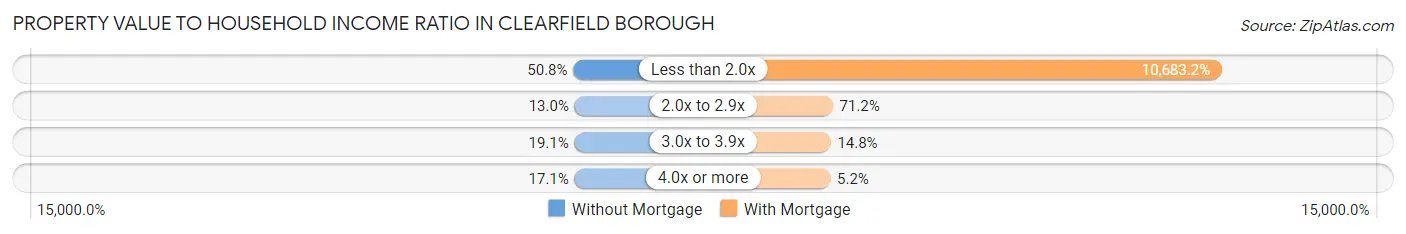
| Value-to-Income Ratio | Without Mortgage | With Mortgage |
| Less than 2.0x | 327 (50.8%) | 76,705 (10,683.2%) |
| 2.0x to 2.9x | 84 (13.0%) | 511 (71.2%) |
| 3.0x to 3.9x | 123 (19.1%) | 106 (14.8%) |
| 4.0x or more | 110 (17.1%) | 37 (5.1%) |
| Total | 644 (100.0%) | 718 (100.0%) |
Real Estate Taxes by Mortgage Status in Clearfield borough
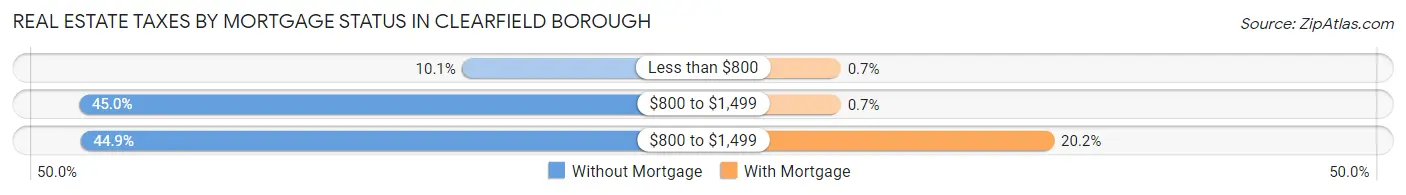
| Property Taxes | Without Mortgage | With Mortgage |
| Less than $800 | 65 (10.1%) | 5 (0.7%) |
| $800 to $1,499 | 290 (45.0%) | 5 (0.7%) |
| $800 to $1,499 | 289 (44.9%) | 145 (20.2%) |
| Total | 644 (100.0%) | 718 (100.0%) |
Health & Disability in Clearfield borough
Health Insurance Coverage by Age in Clearfield borough
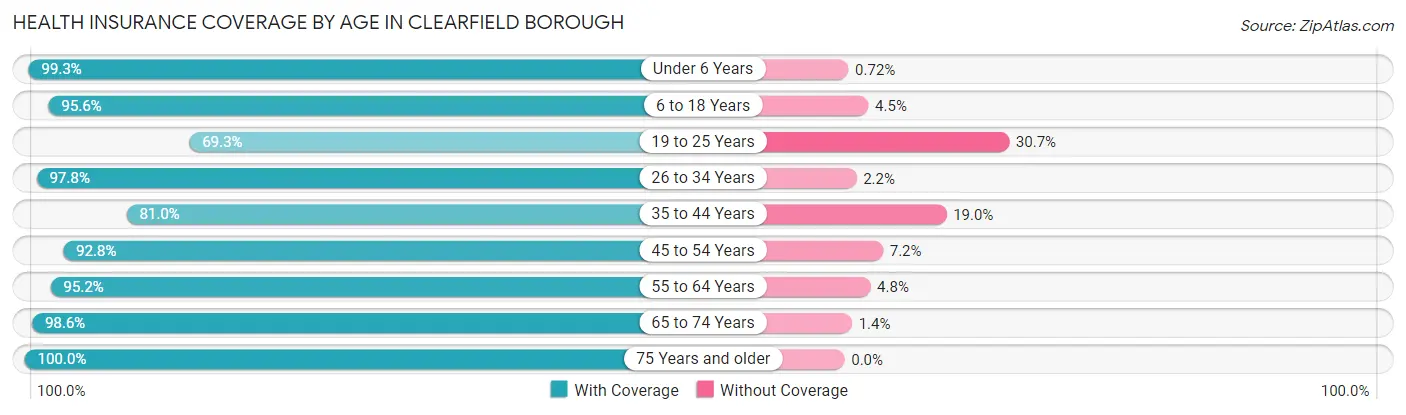
| Age Bracket | With Coverage | Without Coverage |
| Under 6 Years | 551 (99.3%) | 4 (0.7%) |
| 6 to 18 Years | 1,008 (95.6%) | 47 (4.4%) |
| 19 to 25 Years | 228 (69.3%) | 101 (30.7%) |
| 26 to 34 Years | 791 (97.8%) | 18 (2.2%) |
| 35 to 44 Years | 648 (81.0%) | 152 (19.0%) |
| 45 to 54 Years | 504 (92.8%) | 39 (7.2%) |
| 55 to 64 Years | 751 (95.2%) | 38 (4.8%) |
| 65 to 74 Years | 573 (98.6%) | 8 (1.4%) |
| 75 Years and older | 476 (100.0%) | 0 (0.0%) |
| Total | 5,530 (93.1%) | 407 (6.9%) |
Health Insurance Coverage by Citizenship Status in Clearfield borough
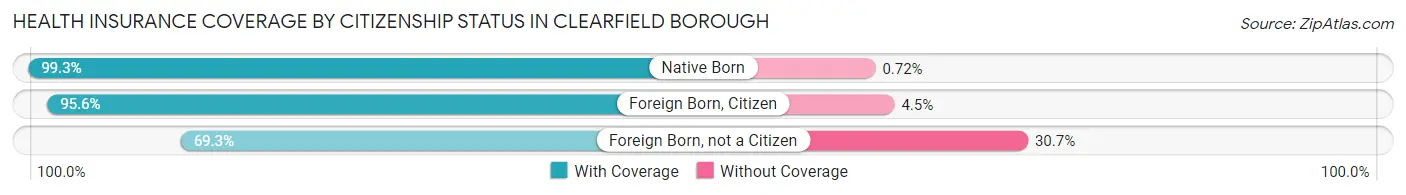
| Citizenship Status | With Coverage | Without Coverage |
| Native Born | 551 (99.3%) | 4 (0.7%) |
| Foreign Born, Citizen | 1,008 (95.6%) | 47 (4.4%) |
| Foreign Born, not a Citizen | 228 (69.3%) | 101 (30.7%) |
Health Insurance Coverage by Household Income in Clearfield borough
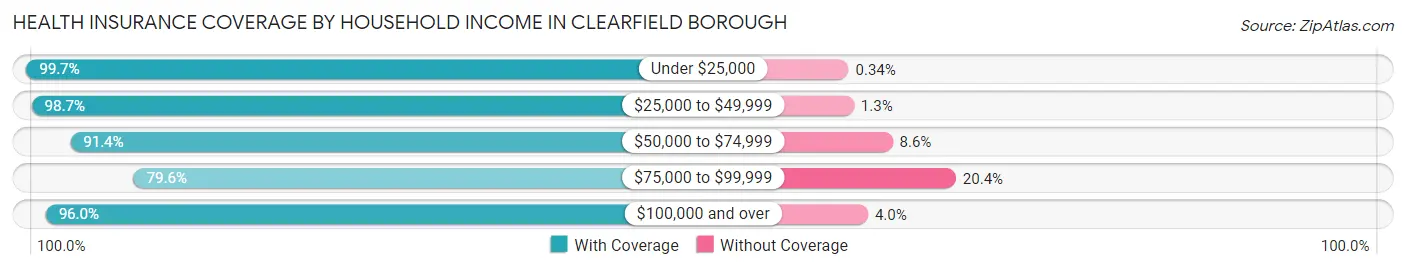
| Household Income | With Coverage | Without Coverage |
| Under $25,000 | 1,164 (99.7%) | 4 (0.3%) |
| $25,000 to $49,999 | 1,040 (98.7%) | 14 (1.3%) |
| $50,000 to $74,999 | 1,556 (91.4%) | 146 (8.6%) |
| $75,000 to $99,999 | 790 (79.6%) | 203 (20.4%) |
| $100,000 and over | 969 (96.0%) | 40 (4.0%) |
Public vs Private Health Insurance Coverage by Age in Clearfield borough
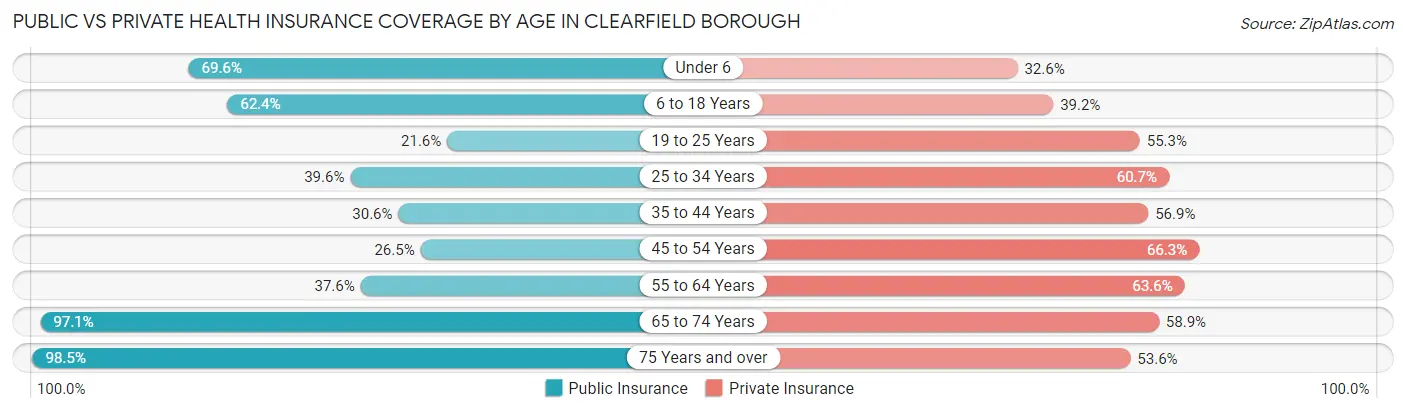
| Age Bracket | Public Insurance | Private Insurance |
| Under 6 | 386 (69.6%) | 181 (32.6%) |
| 6 to 18 Years | 658 (62.4%) | 414 (39.2%) |
| 19 to 25 Years | 71 (21.6%) | 182 (55.3%) |
| 25 to 34 Years | 320 (39.6%) | 491 (60.7%) |
| 35 to 44 Years | 245 (30.6%) | 455 (56.9%) |
| 45 to 54 Years | 144 (26.5%) | 360 (66.3%) |
| 55 to 64 Years | 297 (37.6%) | 502 (63.6%) |
| 65 to 74 Years | 564 (97.1%) | 342 (58.9%) |
| 75 Years and over | 469 (98.5%) | 255 (53.6%) |
| Total | 3,154 (53.1%) | 3,182 (53.6%) |
Disability Status by Sex by Age in Clearfield borough
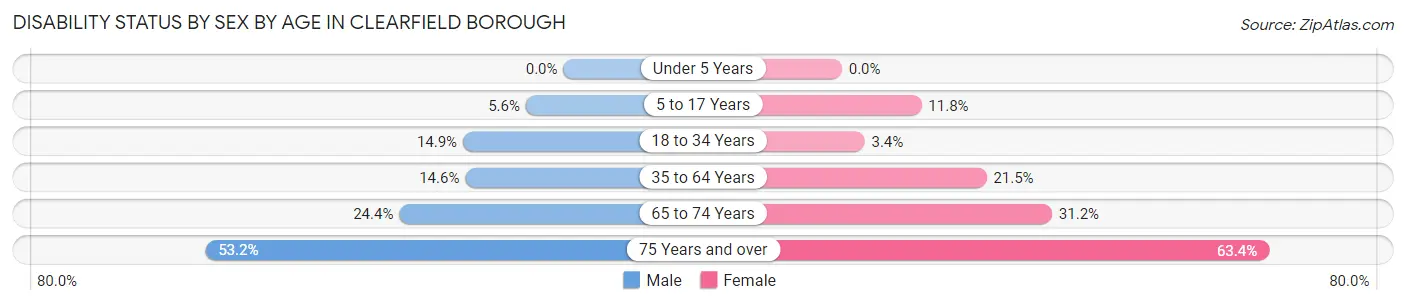
| Age Bracket | Male | Female |
| Under 5 Years | 0 (0.0%) | 0 (0.0%) |
| 5 to 17 Years | 27 (5.6%) | 67 (11.8%) |
| 18 to 34 Years | 95 (14.9%) | 20 (3.4%) |
| 35 to 64 Years | 139 (14.6%) | 253 (21.5%) |
| 65 to 74 Years | 58 (24.4%) | 107 (31.2%) |
| 75 Years and over | 67 (53.2%) | 222 (63.4%) |
Disability Class by Sex by Age in Clearfield borough
Disability Class: Hearing Difficulty
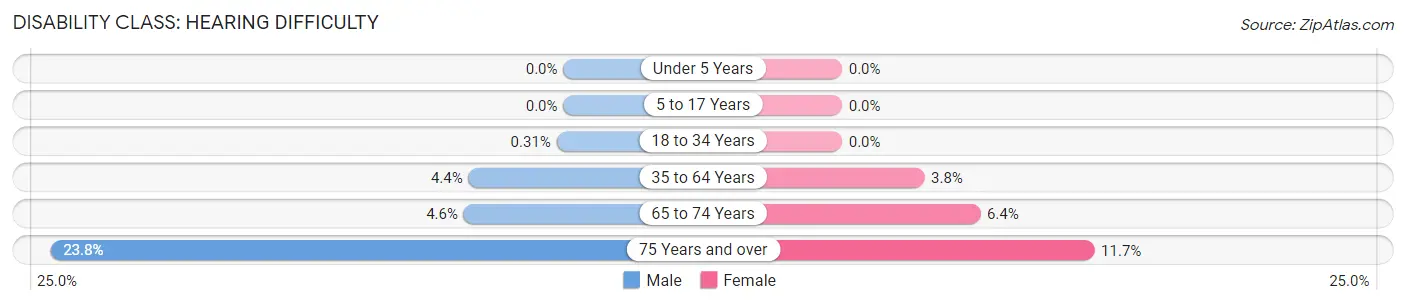
| Age Bracket | Male | Female |
| Under 5 Years | 0 (0.0%) | 0 (0.0%) |
| 5 to 17 Years | 0 (0.0%) | 0 (0.0%) |
| 18 to 34 Years | 2 (0.3%) | 0 (0.0%) |
| 35 to 64 Years | 42 (4.4%) | 45 (3.8%) |
| 65 to 74 Years | 11 (4.6%) | 22 (6.4%) |
| 75 Years and over | 30 (23.8%) | 41 (11.7%) |
Disability Class: Vision Difficulty
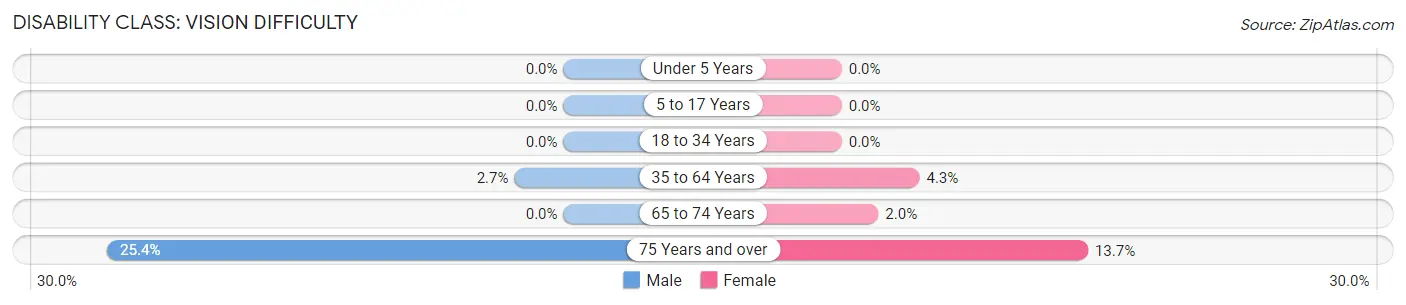
| Age Bracket | Male | Female |
| Under 5 Years | 0 (0.0%) | 0 (0.0%) |
| 5 to 17 Years | 0 (0.0%) | 0 (0.0%) |
| 18 to 34 Years | 0 (0.0%) | 0 (0.0%) |
| 35 to 64 Years | 26 (2.7%) | 51 (4.3%) |
| 65 to 74 Years | 0 (0.0%) | 7 (2.0%) |
| 75 Years and over | 32 (25.4%) | 48 (13.7%) |
Disability Class: Cognitive Difficulty
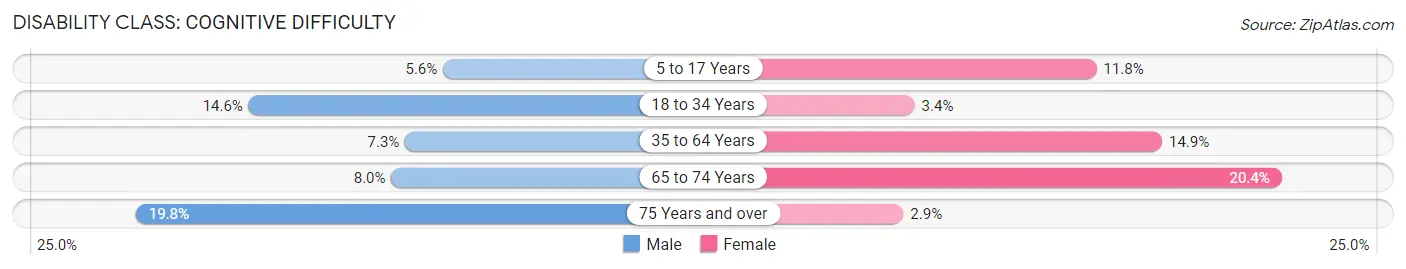
| Age Bracket | Male | Female |
| 5 to 17 Years | 27 (5.6%) | 67 (11.8%) |
| 18 to 34 Years | 93 (14.6%) | 20 (3.4%) |
| 35 to 64 Years | 70 (7.3%) | 175 (14.9%) |
| 65 to 74 Years | 19 (8.0%) | 70 (20.4%) |
| 75 Years and over | 25 (19.8%) | 10 (2.9%) |
Disability Class: Ambulatory Difficulty
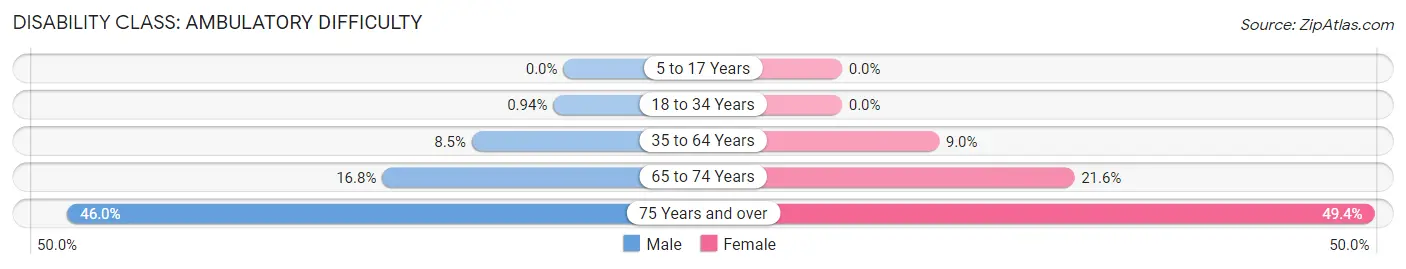
| Age Bracket | Male | Female |
| 5 to 17 Years | 0 (0.0%) | 0 (0.0%) |
| 18 to 34 Years | 6 (0.9%) | 0 (0.0%) |
| 35 to 64 Years | 81 (8.5%) | 106 (9.0%) |
| 65 to 74 Years | 40 (16.8%) | 74 (21.6%) |
| 75 Years and over | 58 (46.0%) | 173 (49.4%) |
Disability Class: Self-Care Difficulty
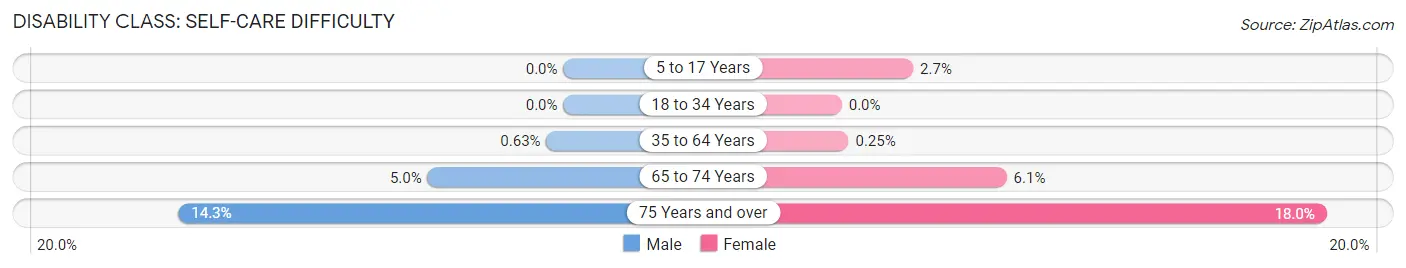
| Age Bracket | Male | Female |
| 5 to 17 Years | 0 (0.0%) | 15 (2.6%) |
| 18 to 34 Years | 0 (0.0%) | 0 (0.0%) |
| 35 to 64 Years | 6 (0.6%) | 3 (0.3%) |
| 65 to 74 Years | 12 (5.0%) | 21 (6.1%) |
| 75 Years and over | 18 (14.3%) | 63 (18.0%) |
Technology Access in Clearfield borough
Computing Device Access in Clearfield borough
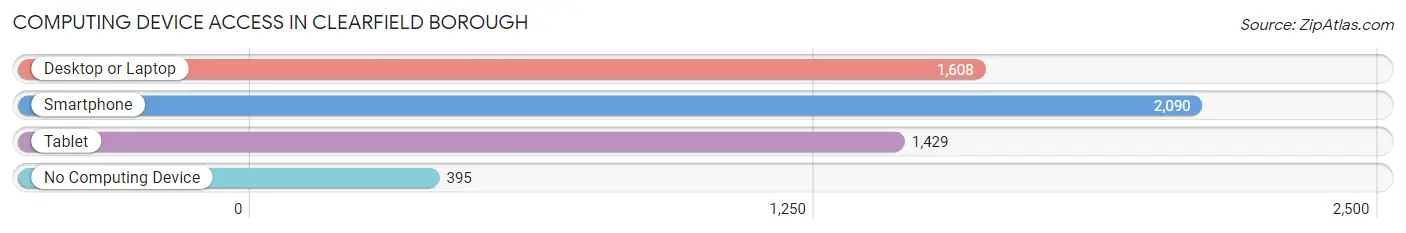
| Device Type | # Households | % Households |
| Desktop or Laptop | 1,608 | 61.0% |
| Smartphone | 2,090 | 79.2% |
| Tablet | 1,429 | 54.2% |
| No Computing Device | 395 | 15.0% |
| Total | 2,638 | 100.0% |
Internet Access in Clearfield borough
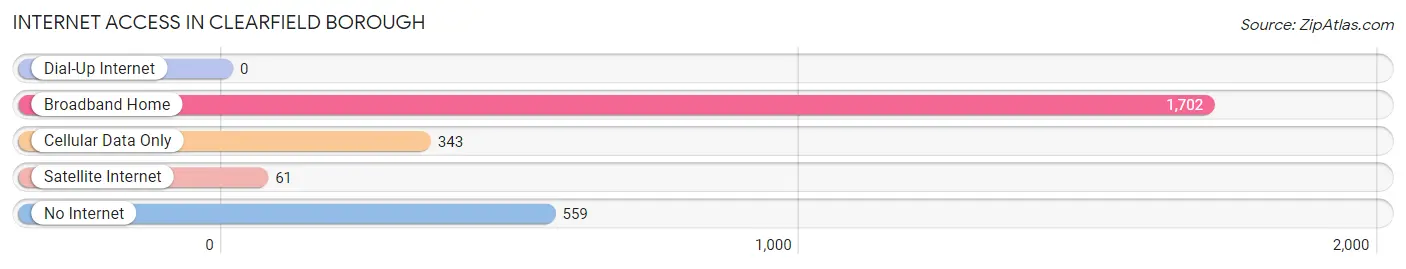
| Internet Type | # Households | % Households |
| Dial-Up Internet | 0 | 0.0% |
| Broadband Home | 1,702 | 64.5% |
| Cellular Data Only | 343 | 13.0% |
| Satellite Internet | 61 | 2.3% |
| No Internet | 559 | 21.2% |
| Total | 2,638 | 100.0% |
Clearfield borough Summary
Clearfield Borough is a borough located in Clearfield County, Pennsylvania. It is the county seat of Clearfield County and is located along the West Branch of the Susquehanna River. The population of Clearfield Borough was 6,215 at the 2010 census.
History
Clearfield Borough was founded in 1805 by John Anderson, a settler from Scotland. Anderson purchased the land from the Iroquois Indians and named the area Clearfield after the clearings in the forest. The town was incorporated in 1812 and became the county seat of Clearfield County in 1822.
The town grew rapidly in the 19th century due to its location along the West Branch of the Susquehanna River. The river provided transportation for goods and people, and the town became a hub for the lumber industry. The lumber industry was so important to the town that it was nicknamed “Lumber Capital of the World”.
The town was also an important stop on the Pennsylvania Railroad, which ran through the town from 1871 to 1971. The railroad provided transportation for people and goods, and it also helped to spur economic growth in the area.
Geography
Clearfield Borough is located in Clearfield County, Pennsylvania. It is situated along the West Branch of the Susquehanna River. The borough is bordered by the townships of Lawrence, Girard, and Pike to the north, Clearfield Township to the east, and Ferguson Township to the south.
The borough has a total area of 1.7 square miles, all of which is land. The elevation of the borough is 1,068 feet above sea level.
Economy
Clearfield Borough’s economy is largely based on the lumber industry. The town is home to several lumber mills, including the Clearfield Lumber Company, which is the largest employer in the borough. The lumber industry is also supported by several other businesses, such as sawmills, woodworking shops, and furniture stores.
The borough is also home to several other businesses, including manufacturing, retail, and service industries. The borough is home to several restaurants, hotels, and other businesses that cater to tourists.
Demographics
As of the 2010 census, the population of Clearfield Borough was 6,215. The racial makeup of the borough was 97.2% White, 0.7% African American, 0.2% Native American, 0.4% Asian, 0.1% Pacific Islander, 0.3% from other races, and 1.1% from two or more races. Hispanic or Latino of any race were 1.2% of the population.
The median income for a household in the borough was $35,938, and the median income for a family was $45,938. The per capita income for the borough was $19,938. About 11.2% of families and 14.2% of the population were below the poverty line, including 19.2% of those under age 18 and 8.2% of those age 65 or over.
Common Questions
What is Per Capita Income in Clearfield borough?
Per Capita income in Clearfield borough is $25,778.
What is the Median Family Income in Clearfield borough?
Median Family Income in Clearfield borough is $57,656.
What is the Median Household income in Clearfield borough?
Median Household Income in Clearfield borough is $50,485.
What is Income or Wage Gap in Clearfield borough?
Income or Wage Gap in Clearfield borough is 38.6%.
Women in Clearfield borough earn 61.4 cents for every dollar earned by a man.
What is Inequality or Gini Index in Clearfield borough?
Inequality or Gini Index in Clearfield borough is 0.39.
What is the Total Population of Clearfield borough?
Total Population of Clearfield borough is 5,937.
What is the Total Male Population of Clearfield borough?
Total Male Population of Clearfield borough is 2,694.
What is the Total Female Population of Clearfield borough?
Total Female Population of Clearfield borough is 3,243.
What is the Ratio of Males per 100 Females in Clearfield borough?
There are 83.07 Males per 100 Females in Clearfield borough.
What is the Ratio of Females per 100 Males in Clearfield borough?
There are 120.38 Females per 100 Males in Clearfield borough.
What is the Median Population Age in Clearfield borough?
Median Population Age in Clearfield borough is 38.4 Years.
What is the Average Family Size in Clearfield borough
Average Family Size in Clearfield borough is 3.1 People.
What is the Average Household Size in Clearfield borough
Average Household Size in Clearfield borough is 2.2 People.
How Large is the Labor Force in Clearfield borough?
There are 3,036 People in the Labor Forcein in Clearfield borough.
What is the Percentage of People in the Labor Force in Clearfield borough?
64.6% of People are in the Labor Force in Clearfield borough.
What is the Unemployment Rate in Clearfield borough?
Unemployment Rate in Clearfield borough is 8.2%.