Sharon, PA Map & Demographics
Sharon Map
Sharon Overview
$25,268
PER CAPITA INCOME
$61,057
AVG FAMILY INCOME
$40,089
AVG HOUSEHOLD INCOME
17.3%
WAGE / INCOME GAP [ % ]
82.7¢/ $1
WAGE / INCOME GAP [ $ ]
0.44
INEQUALITY / GINI INDEX
13,143
TOTAL POPULATION
6,261
MALE POPULATION
6,882
FEMALE POPULATION
90.98
MALES / 100 FEMALES
109.92
FEMALES / 100 MALES
43.8
MEDIAN AGE
2.9
AVG FAMILY SIZE
2.1
AVG HOUSEHOLD SIZE
6,101
LABOR FORCE [ PEOPLE ]
56.2%
PERCENT IN LABOR FORCE
7.4%
UNEMPLOYMENT RATE
Sharon Zip Codes
Income in Sharon
Income Overview in Sharon
Per Capita Income in Sharon is $25,268, while median incomes of families and households are $61,057 and $40,089 respectively.
| Characteristic | Number | Measure |
| Per Capita Income | 13,143 | $25,268 |
| Median Family Income | 3,378 | $61,057 |
| Mean Family Income | 3,378 | $68,411 |
| Median Household Income | 6,144 | $40,089 |
| Mean Household Income | 6,144 | $53,009 |
| Income Deficit | 3,378 | $0 |
| Wage / Income Gap (%) | 13,143 | 17.30% |
| Wage / Income Gap ($) | 13,143 | 82.70¢ per $1 |
| Gini / Inequality Index | 13,143 | 0.44 |
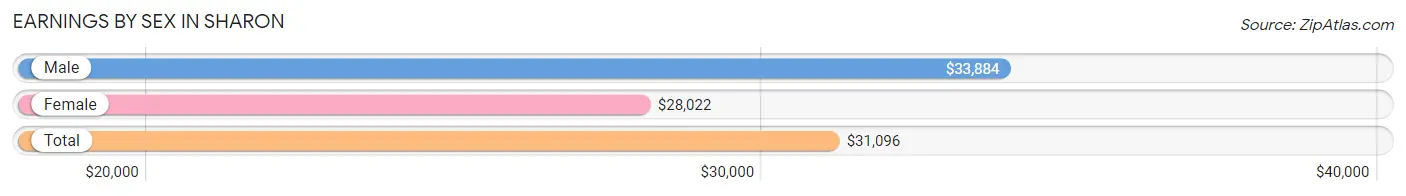
Earnings by Sex in Sharon
Average Earnings in Sharon are $31,096, $33,884 for men and $28,022 for women, a difference of 17.3%.
| Sex | Number | Average Earnings |
| Male | 3,106 (49.9%) | $33,884 |
| Female | 3,114 (50.1%) | $28,022 |
| Total | 6,220 (100.0%) | $31,096 |
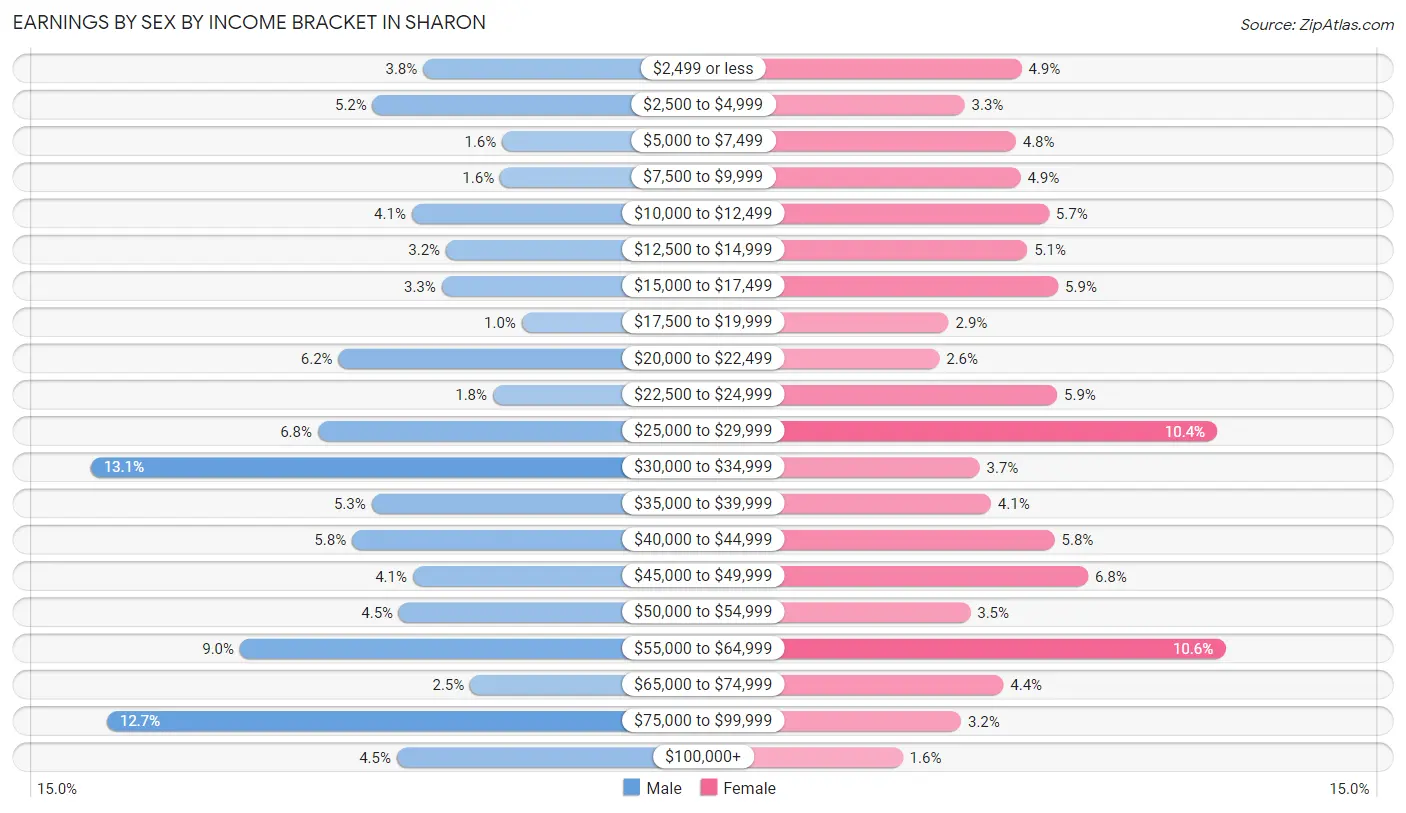
Earnings by Sex by Income Bracket in Sharon
The most common earnings brackets in Sharon are $30,000 to $34,999 for men (408 | 13.1%) and $55,000 to $64,999 for women (331 | 10.6%).
| Income | Male | Female |
| $2,499 or less | 118 (3.8%) | 153 (4.9%) |
| $2,500 to $4,999 | 162 (5.2%) | 103 (3.3%) |
| $5,000 to $7,499 | 49 (1.6%) | 148 (4.8%) |
| $7,500 to $9,999 | 51 (1.6%) | 152 (4.9%) |
| $10,000 to $12,499 | 128 (4.1%) | 177 (5.7%) |
| $12,500 to $14,999 | 98 (3.2%) | 158 (5.1%) |
| $15,000 to $17,499 | 102 (3.3%) | 185 (5.9%) |
| $17,500 to $19,999 | 32 (1.0%) | 89 (2.9%) |
| $20,000 to $22,499 | 192 (6.2%) | 81 (2.6%) |
| $22,500 to $24,999 | 57 (1.8%) | 184 (5.9%) |
| $25,000 to $29,999 | 210 (6.8%) | 324 (10.4%) |
| $30,000 to $34,999 | 408 (13.1%) | 116 (3.7%) |
| $35,000 to $39,999 | 163 (5.2%) | 126 (4.1%) |
| $40,000 to $44,999 | 180 (5.8%) | 182 (5.8%) |
| $45,000 to $49,999 | 127 (4.1%) | 211 (6.8%) |
| $50,000 to $54,999 | 139 (4.5%) | 108 (3.5%) |
| $55,000 to $64,999 | 278 (8.9%) | 331 (10.6%) |
| $65,000 to $74,999 | 77 (2.5%) | 137 (4.4%) |
| $75,000 to $99,999 | 394 (12.7%) | 100 (3.2%) |
| $100,000+ | 141 (4.5%) | 49 (1.6%) |
| Total | 3,106 (100.0%) | 3,114 (100.0%) |
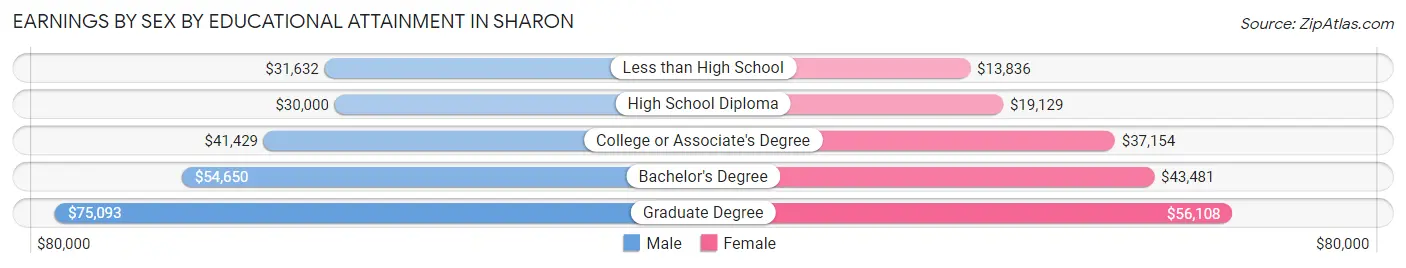
Earnings by Sex by Educational Attainment in Sharon
Average earnings in Sharon are $36,416 for men and $30,229 for women, a difference of 17.0%. Men with an educational attainment of graduate degree enjoy the highest average annual earnings of $75,093, while those with high school diploma education earn the least with $30,000. Women with an educational attainment of graduate degree earn the most with the average annual earnings of $56,108, while those with less than high school education have the smallest earnings of $13,836.
| Educational Attainment | Male Income | Female Income |
| Less than High School | $31,632 | $13,836 |
| High School Diploma | $30,000 | $19,129 |
| College or Associate's Degree | $41,429 | $37,154 |
| Bachelor's Degree | $54,650 | $43,481 |
| Graduate Degree | $75,093 | $56,108 |
| Total | $36,416 | $30,229 |
Family Income in Sharon
Family Income Brackets in Sharon
According to the Sharon family income data, there are 767 families falling into the $50,000 to $74,999 income range, which is the most common income bracket and makes up 22.7% of all families. Conversely, the $200,000+ income bracket is the least frequent group with only 78 families (2.3%) belonging to this category.
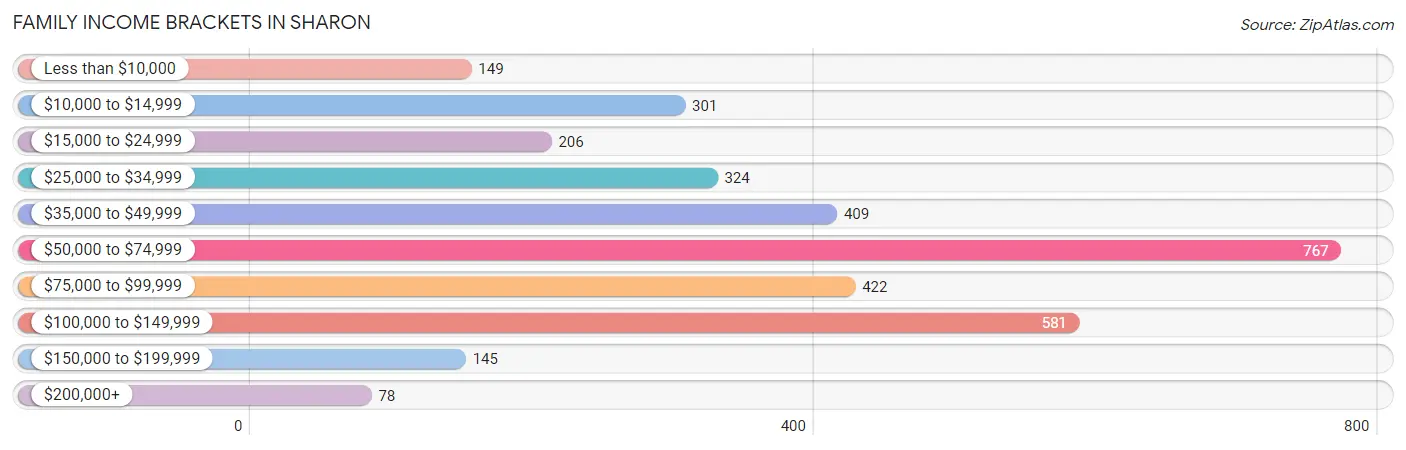
| Income Bracket | # Families | % Families |
| Less than $10,000 | 149 | 4.4% |
| $10,000 to $14,999 | 301 | 8.9% |
| $15,000 to $24,999 | 206 | 6.1% |
| $25,000 to $34,999 | 324 | 9.6% |
| $35,000 to $49,999 | 409 | 12.1% |
| $50,000 to $74,999 | 767 | 22.7% |
| $75,000 to $99,999 | 422 | 12.5% |
| $100,000 to $149,999 | 581 | 17.2% |
| $150,000 to $199,999 | 145 | 4.3% |
| $200,000+ | 78 | 2.3% |
Family Income by Famaliy Size in Sharon
6-person families (120 | 3.5%) account for the highest median family income in Sharon with $146,591 per family, while 6-person families (120 | 3.5%) have the highest median income of $24,432 per family member.
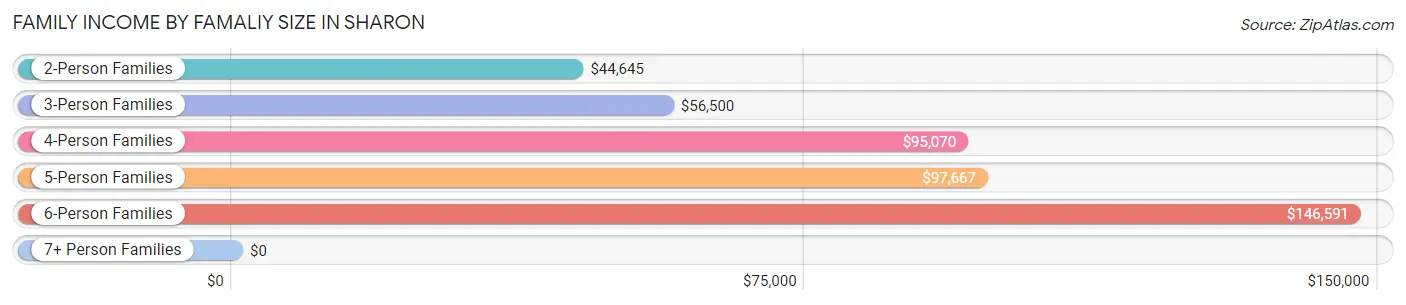
| Income Bracket | # Families | Median Income |
| 2-Person Families | 1,727 (51.1%) | $44,645 |
| 3-Person Families | 752 (22.3%) | $56,500 |
| 4-Person Families | 542 (16.0%) | $95,070 |
| 5-Person Families | 222 (6.6%) | $97,667 |
| 6-Person Families | 120 (3.5%) | $146,591 |
| 7+ Person Families | 15 (0.4%) | $0 |
| Total | 3,378 (100.0%) | $61,057 |
Family Income by Number of Earners in Sharon
The median family income in Sharon is $61,057, with families comprising 3+ earners (429) having the highest median family income of $104,656, while families with no earners (593) have the lowest median family income of $32,557, accounting for 12.7% and 17.5% of families, respectively.
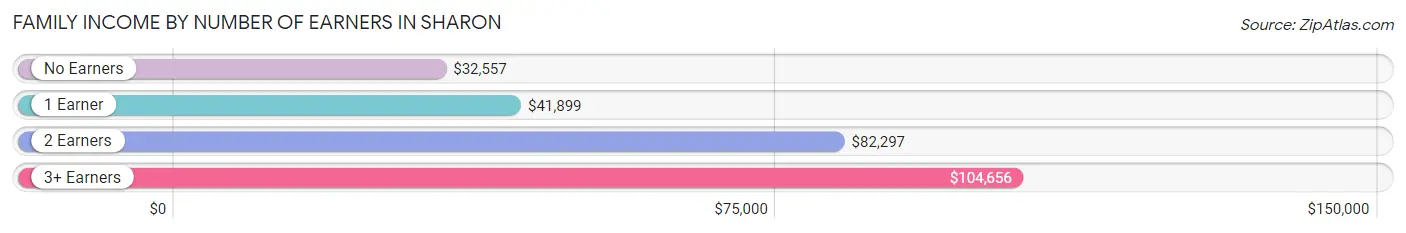
| Number of Earners | # Families | Median Income |
| No Earners | 593 (17.5%) | $32,557 |
| 1 Earner | 1,411 (41.8%) | $41,899 |
| 2 Earners | 945 (28.0%) | $82,297 |
| 3+ Earners | 429 (12.7%) | $104,656 |
| Total | 3,378 (100.0%) | $61,057 |
Household Income in Sharon
Household Income Brackets in Sharon
With 1,106 households falling in the category, the $50,000 to $74,999 income range is the most frequent in Sharon, accounting for 18.0% of all households. In contrast, only 98 households (1.6%) fall into the $200,000+ income bracket, making it the least populous group.
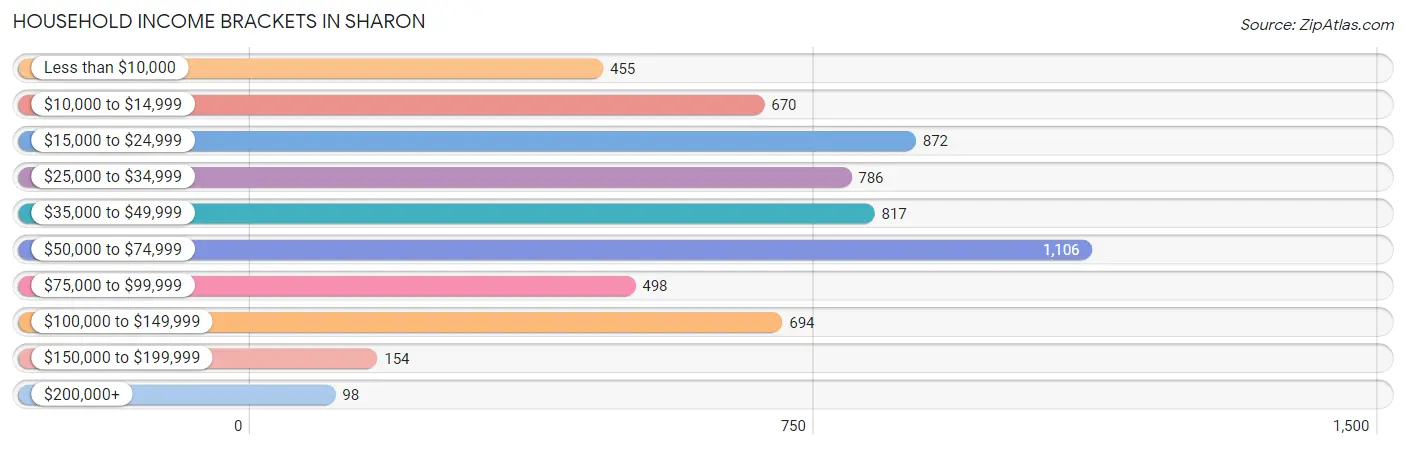
| Income Bracket | # Households | % Households |
| Less than $10,000 | 455 | 7.4% |
| $10,000 to $14,999 | 670 | 10.9% |
| $15,000 to $24,999 | 872 | 14.2% |
| $25,000 to $34,999 | 786 | 12.8% |
| $35,000 to $49,999 | 817 | 13.3% |
| $50,000 to $74,999 | 1,106 | 18.0% |
| $75,000 to $99,999 | 498 | 8.1% |
| $100,000 to $149,999 | 694 | 11.3% |
| $150,000 to $199,999 | 154 | 2.5% |
| $200,000+ | 98 | 1.6% |
Household Income by Householder Age in Sharon
The median household income in Sharon is $40,089, with the highest median household income of $52,842 found in the 25 to 44 years age bracket for the primary householder. A total of 1,728 households (28.1%) fall into this category. Meanwhile, the 15 to 24 years age bracket for the primary householder has the lowest median household income of $20,647, with 187 households (3.0%) in this group.
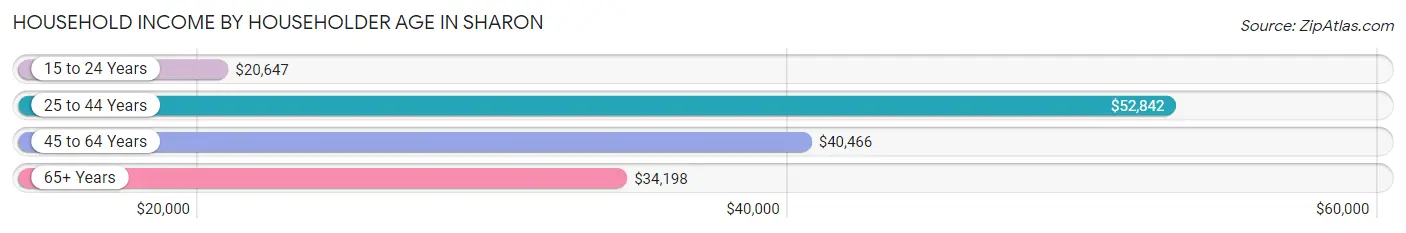
| Income Bracket | # Households | Median Income |
| 15 to 24 Years | 187 (3.0%) | $20,647 |
| 25 to 44 Years | 1,728 (28.1%) | $52,842 |
| 45 to 64 Years | 2,563 (41.7%) | $40,466 |
| 65+ Years | 1,666 (27.1%) | $34,198 |
| Total | 6,144 (100.0%) | $40,089 |
Poverty in Sharon
Income Below Poverty by Sex and Age in Sharon
With 18.8% poverty level for males and 21.6% for females among the residents of Sharon, under 5 year old males and under 5 year old females are the most vulnerable to poverty, with 194 males (44.5%) and 138 females (34.3%) in their respective age groups living below the poverty level.
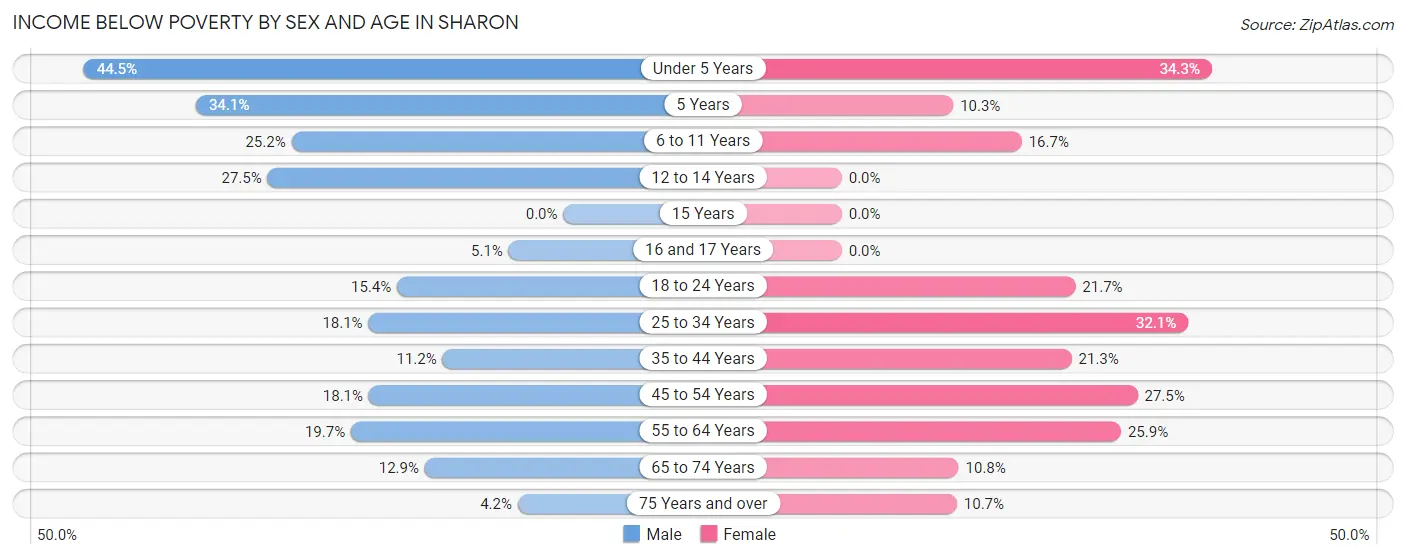
| Age Bracket | Male | Female |
| Under 5 Years | 194 (44.5%) | 138 (34.3%) |
| 5 Years | 60 (34.1%) | 6 (10.3%) |
| 6 to 11 Years | 84 (25.2%) | 74 (16.7%) |
| 12 to 14 Years | 70 (27.5%) | 0 (0.0%) |
| 15 Years | 0 (0.0%) | 0 (0.0%) |
| 16 and 17 Years | 7 (5.1%) | 0 (0.0%) |
| 18 to 24 Years | 85 (15.4%) | 116 (21.7%) |
| 25 to 34 Years | 157 (18.1%) | 278 (32.1%) |
| 35 to 44 Years | 78 (11.2%) | 141 (21.3%) |
| 45 to 54 Years | 163 (18.0%) | 274 (27.5%) |
| 55 to 64 Years | 163 (19.7%) | 291 (25.9%) |
| 65 to 74 Years | 98 (12.9%) | 107 (10.8%) |
| 75 Years and over | 11 (4.2%) | 49 (10.7%) |
| Total | 1,170 (18.8%) | 1,474 (21.6%) |
Income Above Poverty by Sex and Age in Sharon
According to the poverty statistics in Sharon, males aged 15 years and females aged 12 to 14 years are the age groups that are most secure financially, with 100.0% of males and 100.0% of females in these age groups living above the poverty line.
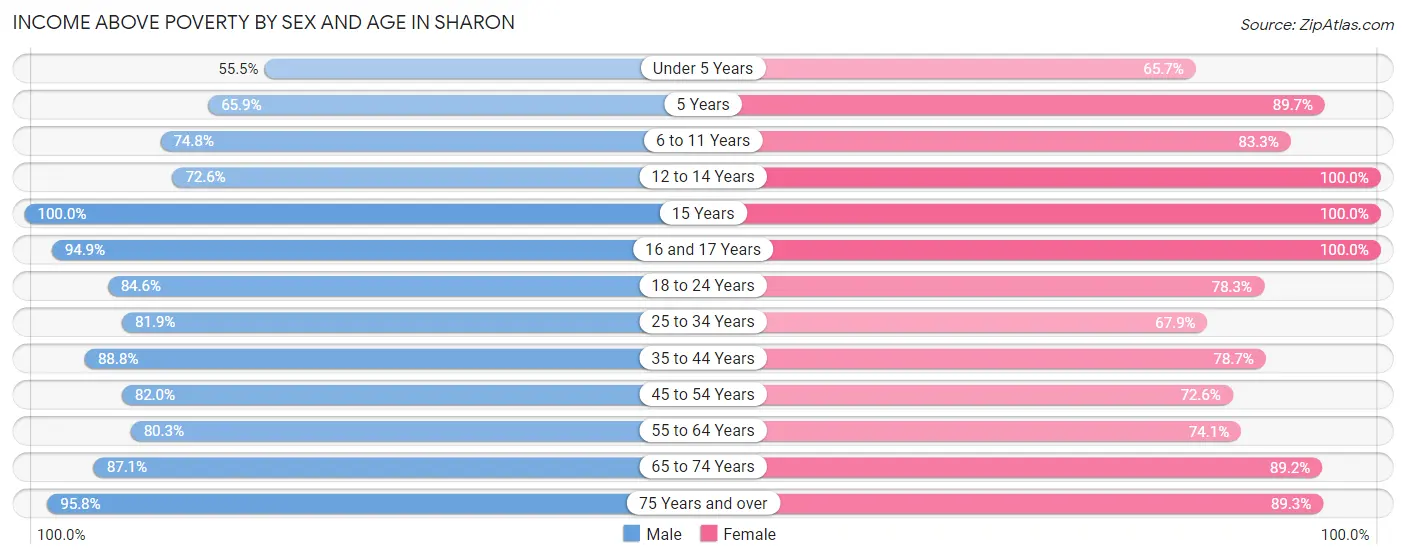
| Age Bracket | Male | Female |
| Under 5 Years | 242 (55.5%) | 264 (65.7%) |
| 5 Years | 116 (65.9%) | 52 (89.7%) |
| 6 to 11 Years | 249 (74.8%) | 369 (83.3%) |
| 12 to 14 Years | 185 (72.6%) | 100 (100.0%) |
| 15 Years | 13 (100.0%) | 66 (100.0%) |
| 16 and 17 Years | 131 (94.9%) | 112 (100.0%) |
| 18 to 24 Years | 466 (84.6%) | 419 (78.3%) |
| 25 to 34 Years | 711 (81.9%) | 587 (67.9%) |
| 35 to 44 Years | 618 (88.8%) | 520 (78.7%) |
| 45 to 54 Years | 740 (82.0%) | 724 (72.6%) |
| 55 to 64 Years | 664 (80.3%) | 832 (74.1%) |
| 65 to 74 Years | 664 (87.1%) | 880 (89.2%) |
| 75 Years and over | 249 (95.8%) | 410 (89.3%) |
| Total | 5,048 (81.2%) | 5,335 (78.3%) |
Income Below Poverty Among Married-Couple Families in Sharon
The poverty statistics for married-couple families in Sharon show that 5.9% or 118 of the total 2,005 families live below the poverty line. Families with 1 or 2 children have the highest poverty rate of 18.2%, comprising of 85 families. On the other hand, families with no children have the lowest poverty rate of 2.0%, which includes 26 families.
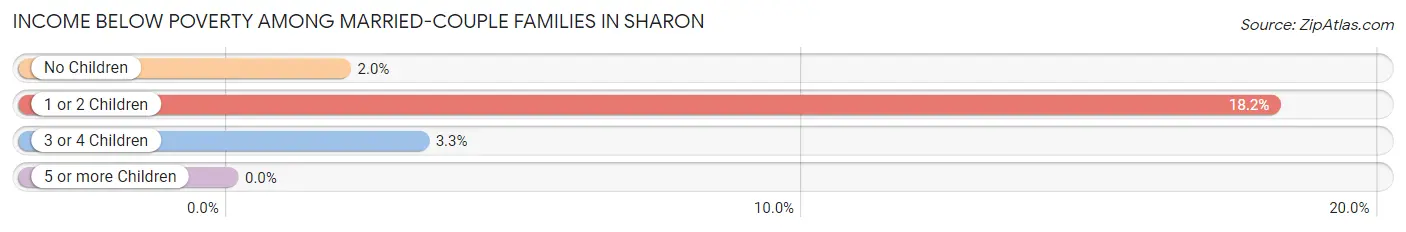
| Children | Above Poverty | Below Poverty |
| No Children | 1,300 (98.0%) | 26 (2.0%) |
| 1 or 2 Children | 383 (81.8%) | 85 (18.2%) |
| 3 or 4 Children | 204 (96.7%) | 7 (3.3%) |
| 5 or more Children | 0 (0.0%) | 0 (0.0%) |
| Total | 1,887 (94.1%) | 118 (5.9%) |
Income Below Poverty Among Single-Parent Households in Sharon
According to the poverty data in Sharon, 9.9% or 33 single-father households and 41.7% or 433 single-mother households are living below the poverty line. Among single-father households, those with 3 or 4 children have the highest poverty rate, with 13 households (24.5%) experiencing poverty. Likewise, among single-mother households, those with 3 or 4 children have the highest poverty rate, with 47 households (59.5%) falling below the poverty line.
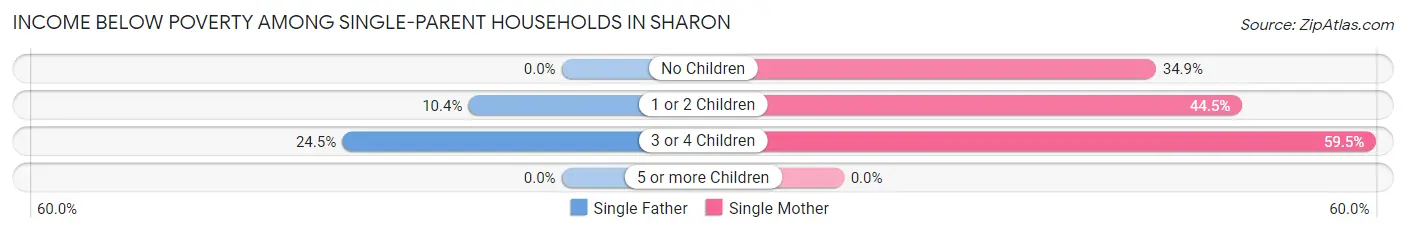
| Children | Single Father | Single Mother |
| No Children | 0 (0.0%) | 150 (34.9%) |
| 1 or 2 Children | 20 (10.4%) | 236 (44.5%) |
| 3 or 4 Children | 13 (24.5%) | 47 (59.5%) |
| 5 or more Children | 0 (0.0%) | 0 (0.0%) |
| Total | 33 (9.9%) | 433 (41.7%) |
Income Below Poverty Among Married-Couple vs Single-Parent Households in Sharon
The poverty data for Sharon shows that 118 of the married-couple family households (5.9%) and 466 of the single-parent households (33.9%) are living below the poverty level. Within the married-couple family households, those with 1 or 2 children have the highest poverty rate, with 85 households (18.2%) falling below the poverty line. Among the single-parent households, those with 3 or 4 children have the highest poverty rate, with 60 household (45.5%) living below poverty.
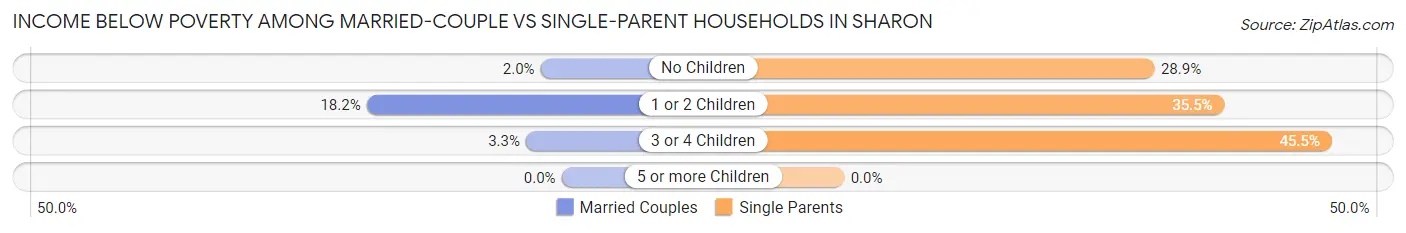
| Children | Married-Couple Families | Single-Parent Households |
| No Children | 26 (2.0%) | 150 (28.9%) |
| 1 or 2 Children | 85 (18.2%) | 256 (35.5%) |
| 3 or 4 Children | 7 (3.3%) | 60 (45.5%) |
| 5 or more Children | 0 (0.0%) | 0 (0.0%) |
| Total | 118 (5.9%) | 466 (33.9%) |
Race in Sharon
The most populous races in Sharon are White / Caucasian (10,459 | 79.6%), Black / African American (1,812 | 13.8%), and Two or more Races (763 | 5.8%).
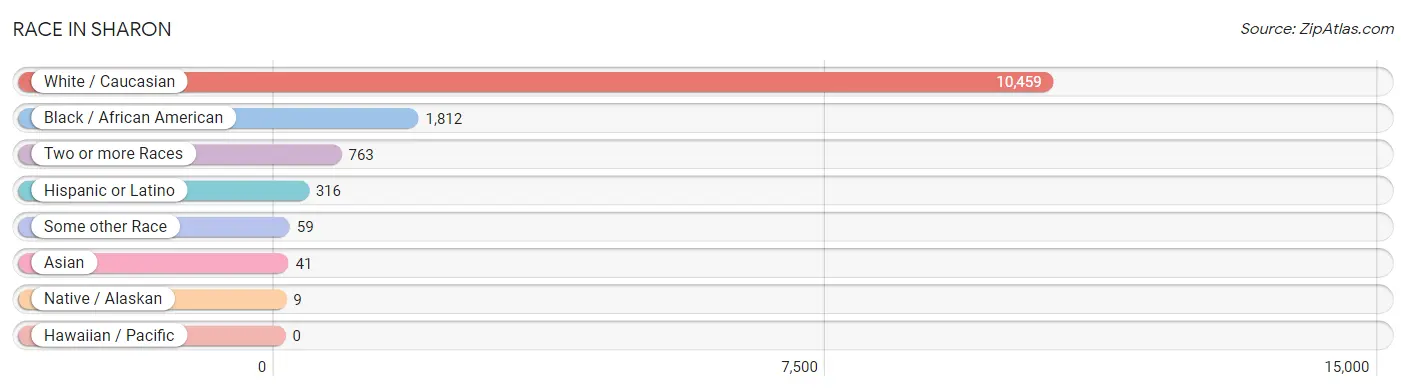
| Race | # Population | % Population |
| Asian | 41 | 0.3% |
| Black / African American | 1,812 | 13.8% |
| Hawaiian / Pacific | 0 | 0.0% |
| Hispanic or Latino | 316 | 2.4% |
| Native / Alaskan | 9 | 0.1% |
| White / Caucasian | 10,459 | 79.6% |
| Two or more Races | 763 | 5.8% |
| Some other Race | 59 | 0.4% |
| Total | 13,143 | 100.0% |
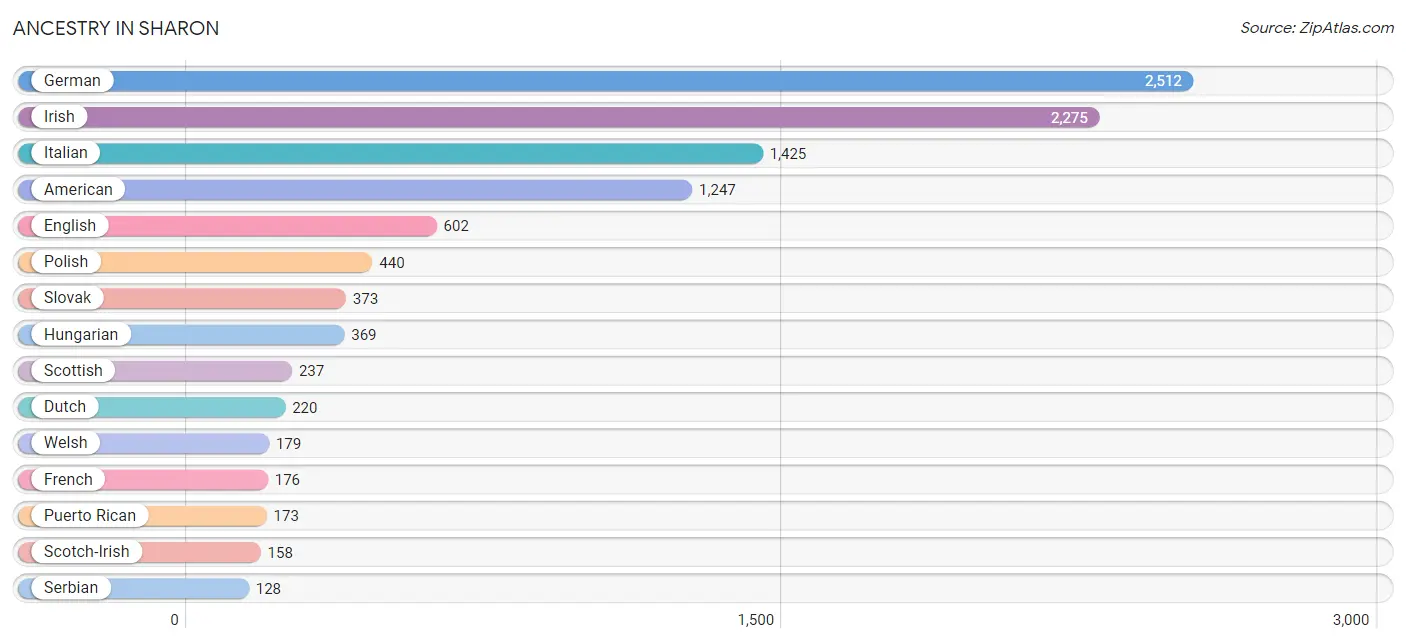
Ancestry in Sharon
The most populous ancestries reported in Sharon are German (2,512 | 19.1%), Irish (2,275 | 17.3%), Italian (1,425 | 10.8%), American (1,247 | 9.5%), and English (602 | 4.6%), together accounting for 61.3% of all Sharon residents.
| Ancestry | # Population | % Population |
| American | 1,247 | 9.5% |
| Arab | 57 | 0.4% |
| Austrian | 13 | 0.1% |
| Bangladeshi | 11 | 0.1% |
| Belgian | 13 | 0.1% |
| Blackfeet | 7 | 0.1% |
| British | 13 | 0.1% |
| Bulgarian | 59 | 0.4% |
| Burmese | 18 | 0.1% |
| Canadian | 40 | 0.3% |
| Cape Verdean | 101 | 0.8% |
| Cherokee | 2 | 0.0% |
| Croatian | 115 | 0.9% |
| Cuban | 14 | 0.1% |
| Czech | 50 | 0.4% |
| Czechoslovakian | 35 | 0.3% |
| Danish | 3 | 0.0% |
| Delaware | 3 | 0.0% |
| Dominican | 103 | 0.8% |
| Dutch | 220 | 1.7% |
| Eastern European | 71 | 0.5% |
| English | 602 | 4.6% |
| European | 65 | 0.5% |
| French | 176 | 1.3% |
| German | 2,512 | 19.1% |
| Greek | 7 | 0.1% |
| Hungarian | 369 | 2.8% |
| Irish | 2,275 | 17.3% |
| Iroquois | 13 | 0.1% |
| Italian | 1,425 | 10.8% |
| Korean | 40 | 0.3% |
| Lebanese | 20 | 0.2% |
| Lithuanian | 9 | 0.1% |
| Mexican | 13 | 0.1% |
| Mexican American Indian | 7 | 0.1% |
| Northern European | 16 | 0.1% |
| Norwegian | 40 | 0.3% |
| Ottawa | 10 | 0.1% |
| Pennsylvania German | 25 | 0.2% |
| Polish | 440 | 3.4% |
| Puerto Rican | 173 | 1.3% |
| Romanian | 21 | 0.2% |
| Russian | 20 | 0.2% |
| Scandinavian | 20 | 0.2% |
| Scotch-Irish | 158 | 1.2% |
| Scottish | 237 | 1.8% |
| Serbian | 128 | 1.0% |
| Sioux | 3 | 0.0% |
| Slavic | 6 | 0.1% |
| Slovak | 373 | 2.8% |
| Slovene | 38 | 0.3% |
| Subsaharan African | 101 | 0.8% |
| Swedish | 34 | 0.3% |
| Swiss | 11 | 0.1% |
| Syrian | 24 | 0.2% |
| Ukrainian | 45 | 0.3% |
| Welsh | 179 | 1.4% |
| West Indian | 18 | 0.1% |
| Yugoslavian | 16 | 0.1% | View All 59 Rows |
Immigrants in Sharon
The most numerous immigrant groups reported in Sharon came from Europe (200 | 1.5%), Eastern Europe (130 | 1.0%), Caribbean (94 | 0.7%), Latin America (94 | 0.7%), and Dominican Republic (62 | 0.5%), together accounting for 4.4% of all Sharon residents.
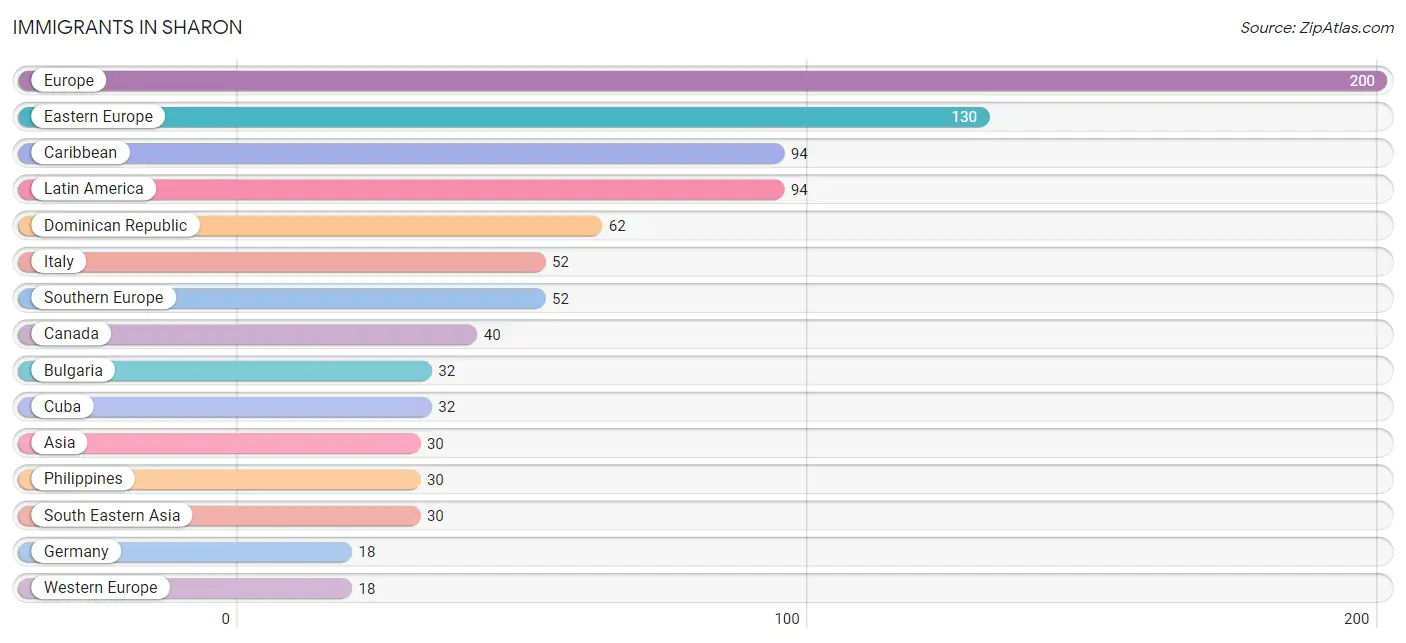
| Immigration Origin | # Population | % Population |
| Asia | 30 | 0.2% |
| Bulgaria | 32 | 0.2% |
| Canada | 40 | 0.3% |
| Caribbean | 94 | 0.7% |
| Cuba | 32 | 0.2% |
| Dominican Republic | 62 | 0.5% |
| Eastern Europe | 130 | 1.0% |
| Europe | 200 | 1.5% |
| Germany | 18 | 0.1% |
| Hungary | 7 | 0.1% |
| Italy | 52 | 0.4% |
| Latin America | 94 | 0.7% |
| Philippines | 30 | 0.2% |
| South Eastern Asia | 30 | 0.2% |
| Southern Europe | 52 | 0.4% |
| Western Europe | 18 | 0.1% | View All 16 Rows |
Sex and Age in Sharon
Sex and Age in Sharon
The most populous age groups in Sharon are 50 to 54 Years (485 | 7.7%) for men and 55 to 59 Years (656 | 9.5%) for women.
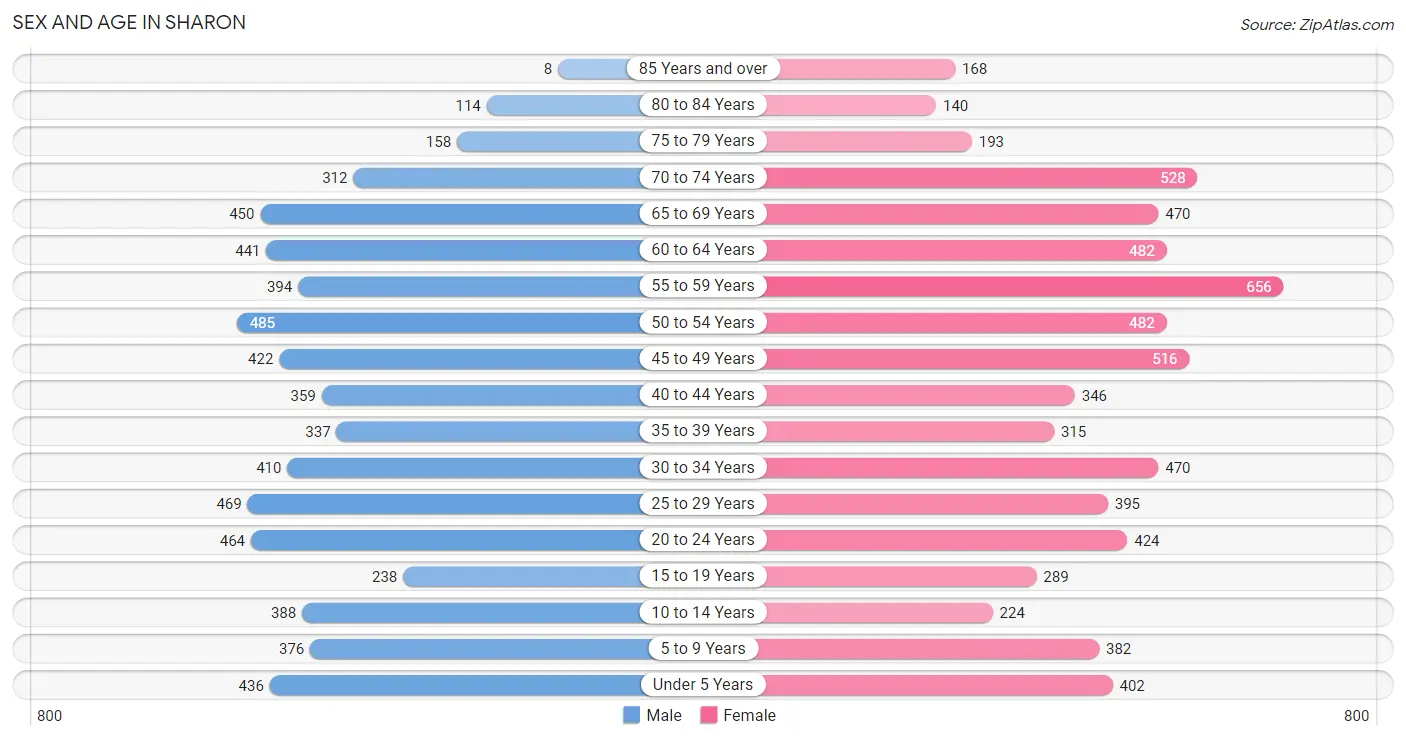
| Age Bracket | Male | Female |
| Under 5 Years | 436 (7.0%) | 402 (5.8%) |
| 5 to 9 Years | 376 (6.0%) | 382 (5.6%) |
| 10 to 14 Years | 388 (6.2%) | 224 (3.3%) |
| 15 to 19 Years | 238 (3.8%) | 289 (4.2%) |
| 20 to 24 Years | 464 (7.4%) | 424 (6.2%) |
| 25 to 29 Years | 469 (7.5%) | 395 (5.7%) |
| 30 to 34 Years | 410 (6.6%) | 470 (6.8%) |
| 35 to 39 Years | 337 (5.4%) | 315 (4.6%) |
| 40 to 44 Years | 359 (5.7%) | 346 (5.0%) |
| 45 to 49 Years | 422 (6.7%) | 516 (7.5%) |
| 50 to 54 Years | 485 (7.7%) | 482 (7.0%) |
| 55 to 59 Years | 394 (6.3%) | 656 (9.5%) |
| 60 to 64 Years | 441 (7.0%) | 482 (7.0%) |
| 65 to 69 Years | 450 (7.2%) | 470 (6.8%) |
| 70 to 74 Years | 312 (5.0%) | 528 (7.7%) |
| 75 to 79 Years | 158 (2.5%) | 193 (2.8%) |
| 80 to 84 Years | 114 (1.8%) | 140 (2.0%) |
| 85 Years and over | 8 (0.1%) | 168 (2.4%) |
| Total | 6,261 (100.0%) | 6,882 (100.0%) |
Families and Households in Sharon
Median Family Size in Sharon
The median family size in Sharon is 2.86 persons per family, with married-couple families (2,005 | 59.4%) accounting for the largest median family size of 3.04 persons per family. On the other hand, single male/father families (334 | 9.9%) represent the smallest median family size with 2.34 persons per family.
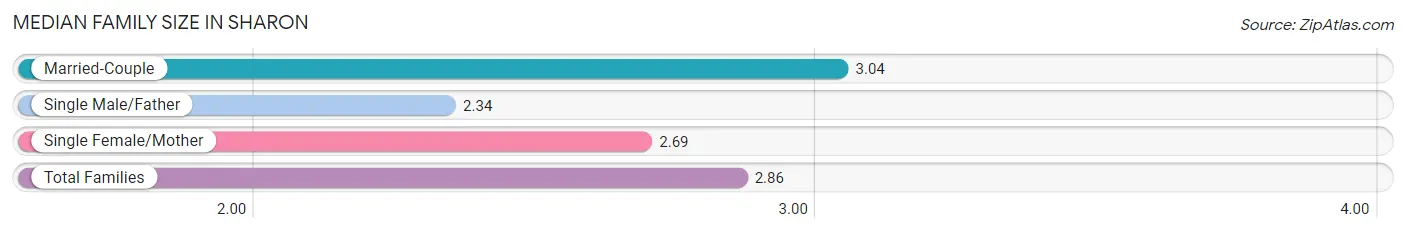
| Family Type | # Families | Family Size |
| Married-Couple | 2,005 (59.4%) | 3.04 |
| Single Male/Father | 334 (9.9%) | 2.34 |
| Single Female/Mother | 1,039 (30.8%) | 2.69 |
| Total Families | 3,378 (100.0%) | 2.86 |
Median Household Size in Sharon
The median household size in Sharon is 2.11 persons per household, with married-couple households (2,005 | 32.6%) accounting for the largest median household size of 3.06 persons per household. non-family households (2,766 | 45.0%) represent the smallest median household size with 1.09 persons per household.
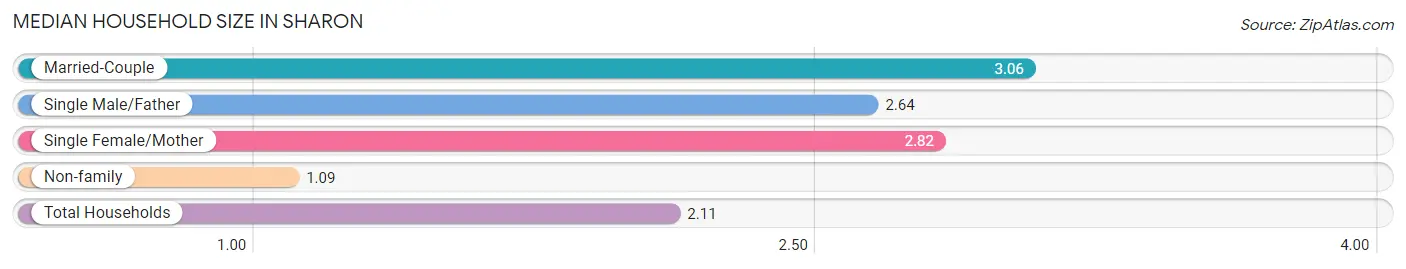
| Household Type | # Households | Household Size |
| Married-Couple | 2,005 (32.6%) | 3.06 |
| Single Male/Father | 334 (5.4%) | 2.64 |
| Single Female/Mother | 1,039 (16.9%) | 2.82 |
| Non-family | 2,766 (45.0%) | 1.09 |
| Total Households | 6,144 (100.0%) | 2.11 |
Household Size by Marriage Status in Sharon
Out of a total of 6,144 households in Sharon, 3,378 (55.0%) are family households, while 2,766 (45.0%) are nonfamily households. The most numerous type of family households are 2-person households, comprising 1,575, and the most common type of nonfamily households are 1-person households, comprising 2,568.
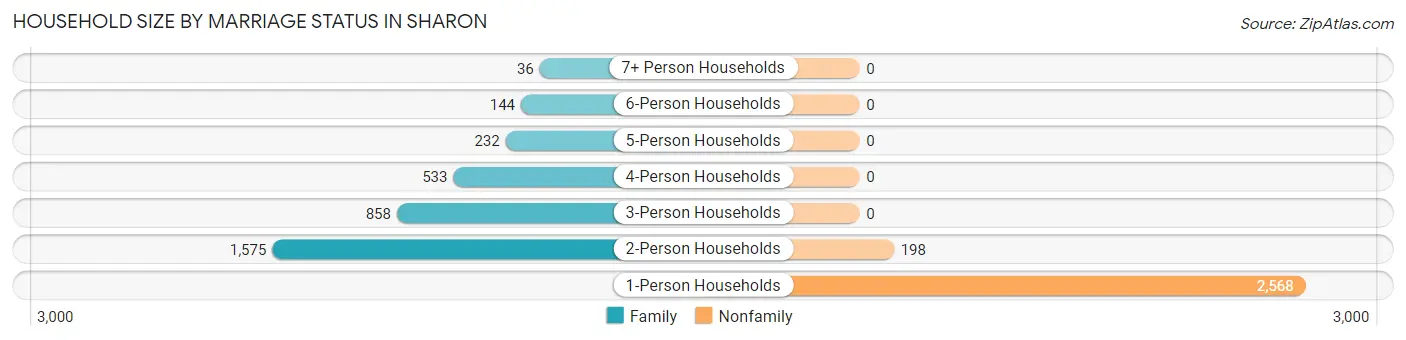
| Household Size | Family Households | Nonfamily Households |
| 1-Person Households | - | 2,568 (41.8%) |
| 2-Person Households | 1,575 (25.6%) | 198 (3.2%) |
| 3-Person Households | 858 (14.0%) | 0 (0.0%) |
| 4-Person Households | 533 (8.7%) | 0 (0.0%) |
| 5-Person Households | 232 (3.8%) | 0 (0.0%) |
| 6-Person Households | 144 (2.3%) | 0 (0.0%) |
| 7+ Person Households | 36 (0.6%) | 0 (0.0%) |
| Total | 3,378 (55.0%) | 2,766 (45.0%) |
Female Fertility in Sharon
Fertility by Age in Sharon
Average fertility rate in Sharon is 84.0 births per 1,000 women. Women in the age bracket of 20 to 34 years have the highest fertility rate with 119.0 births per 1,000 women. Women in the age bracket of 20 to 34 years acount for 63.5% of all women with births.
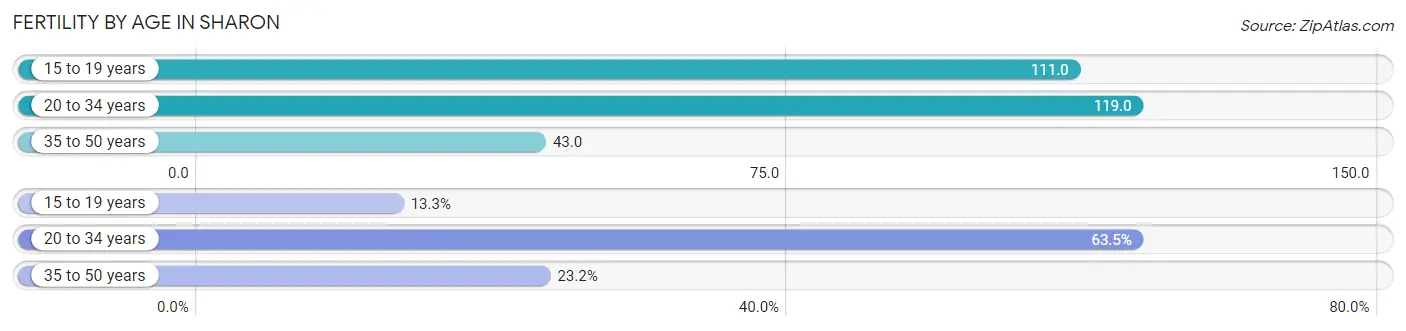
| Age Bracket | Women with Births | Births / 1,000 Women |
| 15 to 19 years | 32 (13.3%) | 111.0 |
| 20 to 34 years | 153 (63.5%) | 119.0 |
| 35 to 50 years | 56 (23.2%) | 43.0 |
| Total | 241 (100.0%) | 84.0 |
Fertility by Age by Marriage Status in Sharon
27.8% of women with births (241) in Sharon are married. The highest percentage of unmarried women with births falls into 15 to 19 years age bracket with 100.0% of them unmarried at the time of birth, while the lowest percentage of unmarried women with births belong to 35 to 50 years age bracket with 28.6% of them unmarried.
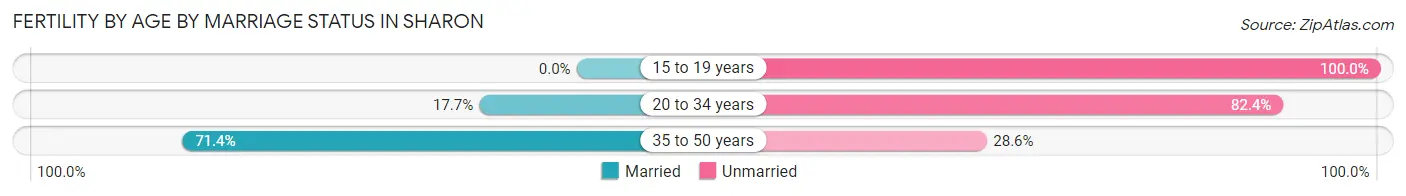
| Age Bracket | Married | Unmarried |
| 15 to 19 years | 0 (0.0%) | 32 (100.0%) |
| 20 to 34 years | 27 (17.6%) | 126 (82.4%) |
| 35 to 50 years | 40 (71.4%) | 16 (28.6%) |
| Total | 67 (27.8%) | 174 (72.2%) |
Fertility by Education in Sharon
Average fertility rate in Sharon is 84.0 births per 1,000 women. Women with the education attainment of high school diploma have the highest fertility rate of 145.0 births per 1,000 women, while women with the education attainment of bachelor's degree have the lowest fertility at 28.0 births per 1,000 women. Women with the education attainment of high school diploma represent 61.4% of all women with births.
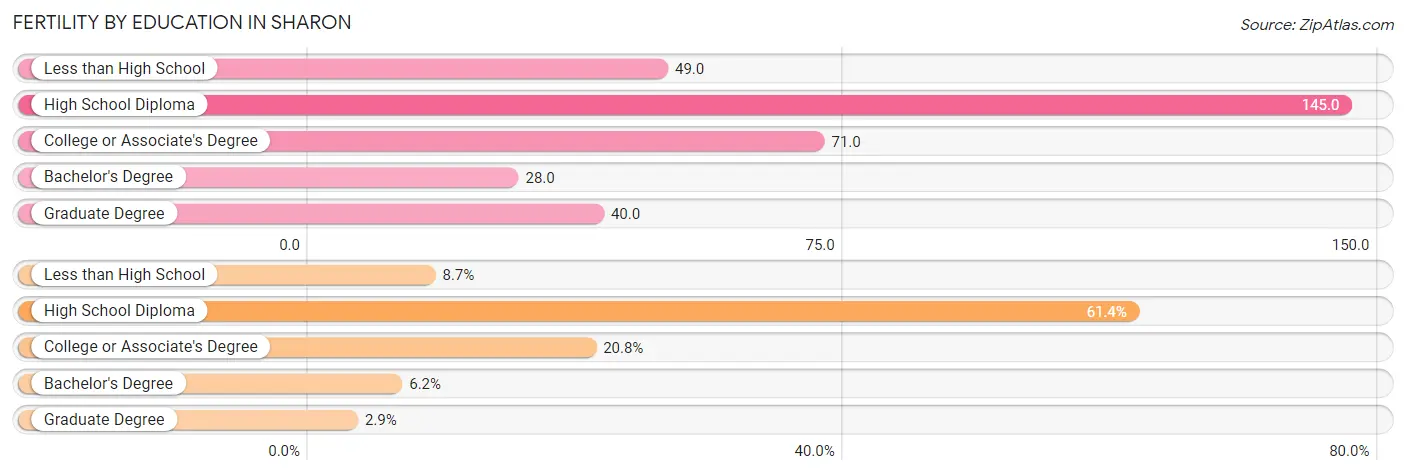
| Educational Attainment | Women with Births | Births / 1,000 Women |
| Less than High School | 21 (8.7%) | 49.0 |
| High School Diploma | 148 (61.4%) | 145.0 |
| College or Associate's Degree | 50 (20.7%) | 71.0 |
| Bachelor's Degree | 15 (6.2%) | 28.0 |
| Graduate Degree | 7 (2.9%) | 40.0 |
| Total | 241 (100.0%) | 84.0 |
Fertility by Education by Marriage Status in Sharon
72.2% of women with births in Sharon are unmarried. Women with the educational attainment of bachelor's degree are most likely to be married with 100.0% of them married at childbirth, while women with the educational attainment of less than high school are least likely to be married with 100.0% of them unmarried at childbirth.
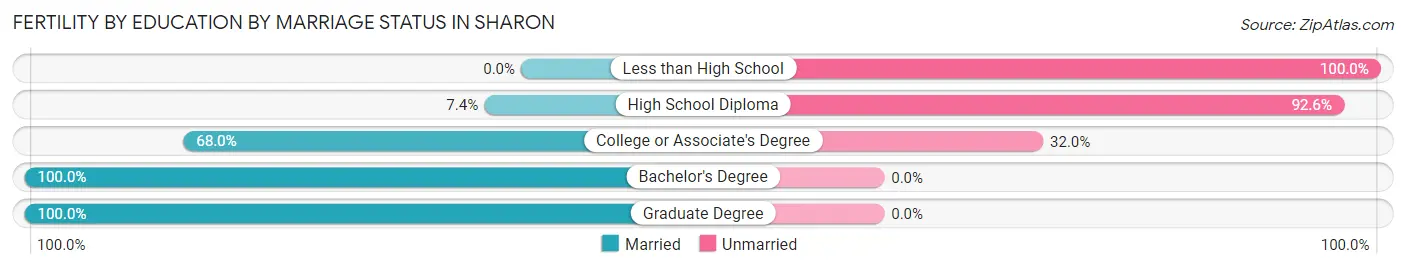
| Educational Attainment | Married | Unmarried |
| Less than High School | 0 (0.0%) | 21 (100.0%) |
| High School Diploma | 11 (7.4%) | 137 (92.6%) |
| College or Associate's Degree | 34 (68.0%) | 16 (32.0%) |
| Bachelor's Degree | 15 (100.0%) | 0 (0.0%) |
| Graduate Degree | 7 (100.0%) | 0 (0.0%) |
| Total | 67 (27.8%) | 174 (72.2%) |
Employment Characteristics in Sharon
Employment by Class of Employer in Sharon
Among the 5,565 employed individuals in Sharon, private company employees (4,146 | 74.5%), not-for-profit organizations (648 | 11.6%), and local government employees (243 | 4.4%) make up the most common classes of employment.
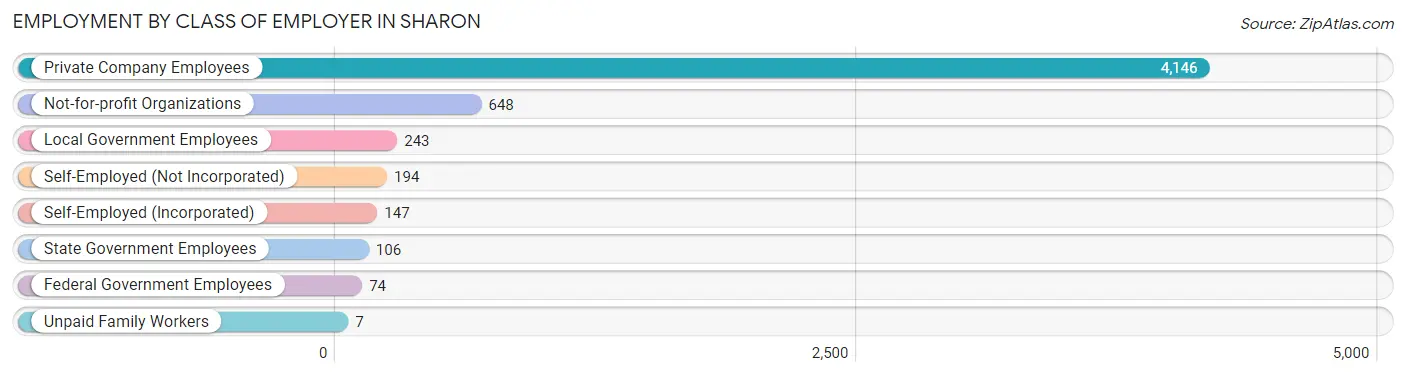
| Employer Class | # Employees | % Employees |
| Private Company Employees | 4,146 | 74.5% |
| Self-Employed (Incorporated) | 147 | 2.6% |
| Self-Employed (Not Incorporated) | 194 | 3.5% |
| Not-for-profit Organizations | 648 | 11.6% |
| Local Government Employees | 243 | 4.4% |
| State Government Employees | 106 | 1.9% |
| Federal Government Employees | 74 | 1.3% |
| Unpaid Family Workers | 7 | 0.1% |
| Total | 5,565 | 100.0% |
Employment Status by Age in Sharon
According to the labor force statistics for Sharon, out of the total population over 16 years of age (10,856), 56.2% or 6,101 individuals are in the labor force, with 7.4% or 451 of them unemployed. The age group with the highest labor force participation rate is 25 to 29 years, with 91.8% or 793 individuals in the labor force. Within the labor force, the 16 to 19 years age range has the highest percentage of unemployed individuals, with 29.4% or 72 of them being unemployed.
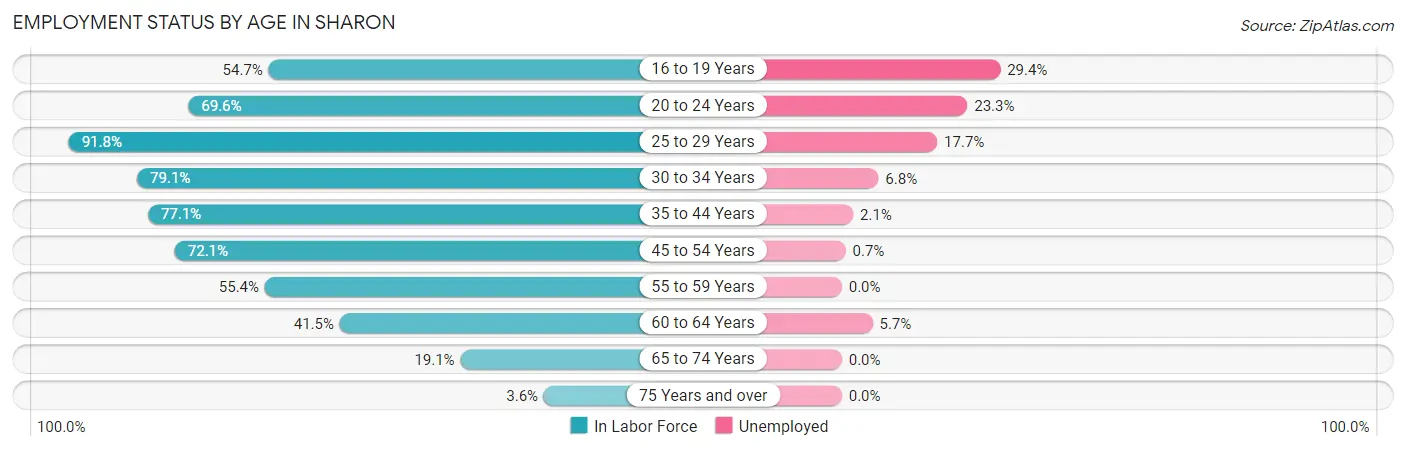
| Age Bracket | In Labor Force | Unemployed |
| 16 to 19 Years | 245 (54.7%) | 72 (29.4%) |
| 20 to 24 Years | 618 (69.6%) | 144 (23.3%) |
| 25 to 29 Years | 793 (91.8%) | 140 (17.7%) |
| 30 to 34 Years | 696 (79.1%) | 47 (6.8%) |
| 35 to 44 Years | 1,046 (77.1%) | 22 (2.1%) |
| 45 to 54 Years | 1,374 (72.1%) | 10 (0.7%) |
| 55 to 59 Years | 582 (55.4%) | 0 (0.0%) |
| 60 to 64 Years | 383 (41.5%) | 22 (5.7%) |
| 65 to 74 Years | 336 (19.1%) | 0 (0.0%) |
| 75 Years and over | 28 (3.6%) | 0 (0.0%) |
| Total | 6,101 (56.2%) | 451 (7.4%) |
Employment Status by Educational Attainment in Sharon
According to labor force statistics for Sharon, 69.8% of individuals (4,871) out of the total population between 25 and 64 years of age (6,979) are in the labor force, with 4.9% or 239 of them being unemployed. The group with the highest labor force participation rate are those with the educational attainment of bachelor's degree or higher, with 89.4% or 1,322 individuals in the labor force. Within the labor force, individuals with high school diploma education have the highest percentage of unemployment, with 7.6% or 122 of them being unemployed.
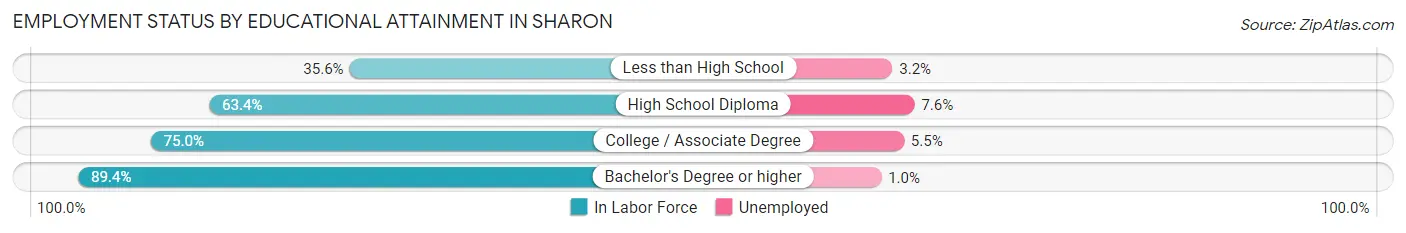
| Educational Attainment | In Labor Force | Unemployed |
| Less than High School | 251 (35.6%) | 23 (3.2%) |
| High School Diploma | 1,605 (63.4%) | 192 (7.6%) |
| College / Associate Degree | 1,698 (75.0%) | 125 (5.5%) |
| Bachelor's Degree or higher | 1,322 (89.4%) | 15 (1.0%) |
| Total | 4,871 (69.8%) | 342 (4.9%) |
Employment Occupations by Sex in Sharon
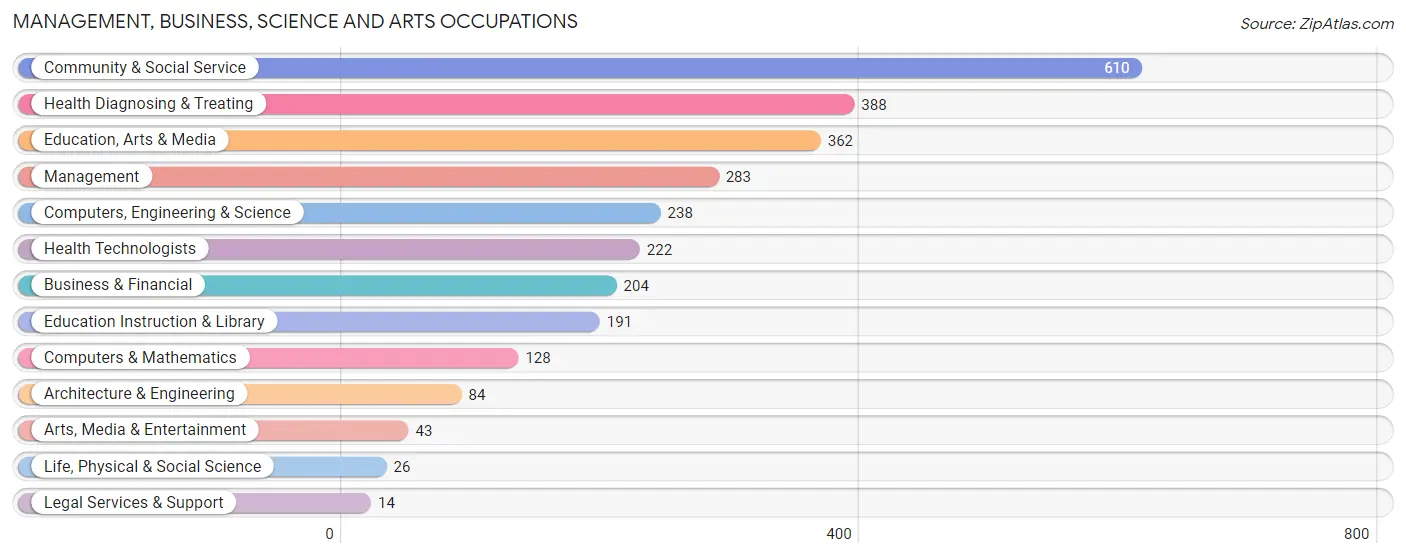
Management, Business, Science and Arts Occupations
The most common Management, Business, Science and Arts occupations in Sharon are Community & Social Service (610 | 10.8%), Health Diagnosing & Treating (388 | 6.9%), Education, Arts & Media (362 | 6.4%), Management (283 | 5.0%), and Computers, Engineering & Science (238 | 4.2%).
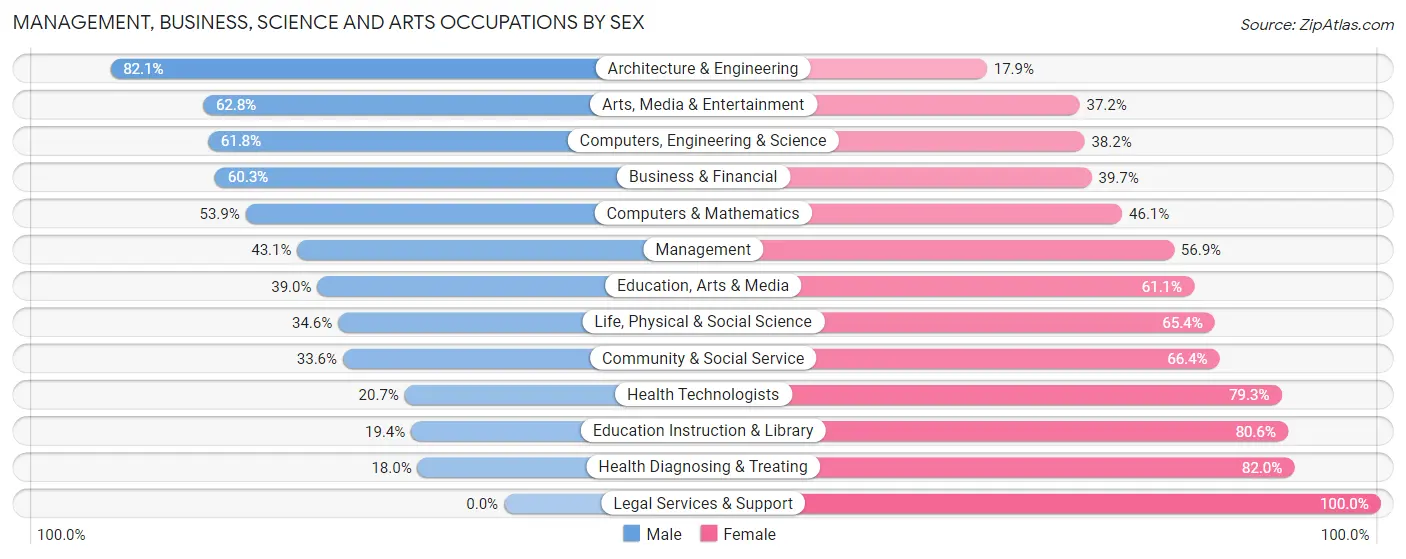
Management, Business, Science and Arts Occupations by Sex
Within the Management, Business, Science and Arts occupations in Sharon, the most male-oriented occupations are Architecture & Engineering (82.1%), Arts, Media & Entertainment (62.8%), and Computers, Engineering & Science (61.8%), while the most female-oriented occupations are Legal Services & Support (100.0%), Health Diagnosing & Treating (82.0%), and Education Instruction & Library (80.6%).
| Occupation | Male | Female |
| Management | 122 (43.1%) | 161 (56.9%) |
| Business & Financial | 123 (60.3%) | 81 (39.7%) |
| Computers, Engineering & Science | 147 (61.8%) | 91 (38.2%) |
| Computers & Mathematics | 69 (53.9%) | 59 (46.1%) |
| Architecture & Engineering | 69 (82.1%) | 15 (17.9%) |
| Life, Physical & Social Science | 9 (34.6%) | 17 (65.4%) |
| Community & Social Service | 205 (33.6%) | 405 (66.4%) |
| Education, Arts & Media | 141 (39.0%) | 221 (61.1%) |
| Legal Services & Support | 0 (0.0%) | 14 (100.0%) |
| Education Instruction & Library | 37 (19.4%) | 154 (80.6%) |
| Arts, Media & Entertainment | 27 (62.8%) | 16 (37.2%) |
| Health Diagnosing & Treating | 70 (18.0%) | 318 (82.0%) |
| Health Technologists | 46 (20.7%) | 176 (79.3%) |
| Total (Category) | 667 (38.7%) | 1,056 (61.3%) |
| Total (Overall) | 2,752 (49.0%) | 2,868 (51.0%) |
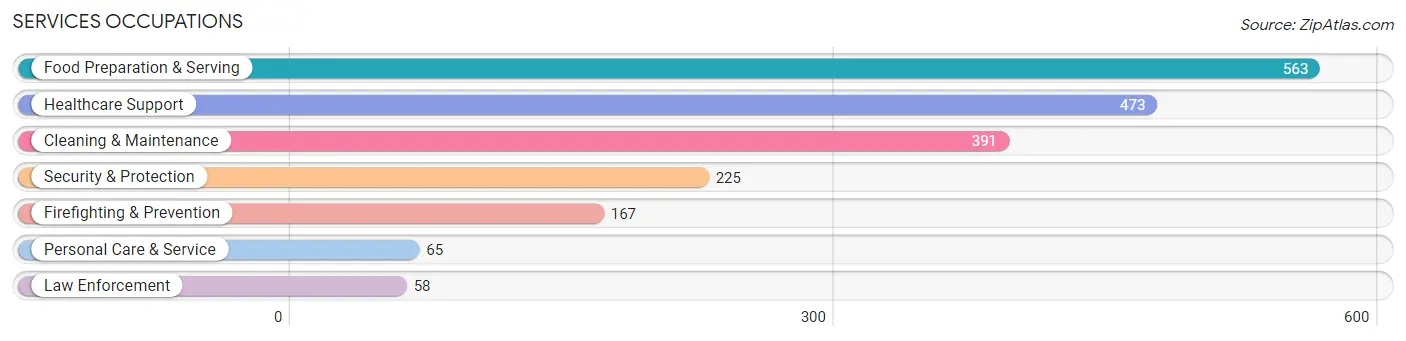
Services Occupations
The most common Services occupations in Sharon are Food Preparation & Serving (563 | 10.0%), Healthcare Support (473 | 8.4%), Cleaning & Maintenance (391 | 7.0%), Security & Protection (225 | 4.0%), and Firefighting & Prevention (167 | 3.0%).
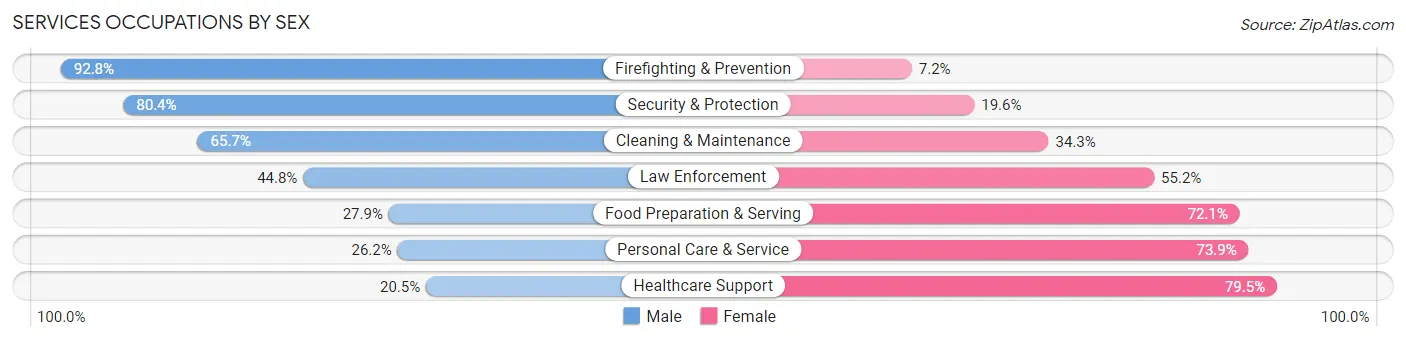
Services Occupations by Sex
Within the Services occupations in Sharon, the most male-oriented occupations are Firefighting & Prevention (92.8%), Security & Protection (80.4%), and Cleaning & Maintenance (65.7%), while the most female-oriented occupations are Healthcare Support (79.5%), Personal Care & Service (73.9%), and Food Preparation & Serving (72.1%).
| Occupation | Male | Female |
| Healthcare Support | 97 (20.5%) | 376 (79.5%) |
| Security & Protection | 181 (80.4%) | 44 (19.6%) |
| Firefighting & Prevention | 155 (92.8%) | 12 (7.2%) |
| Law Enforcement | 26 (44.8%) | 32 (55.2%) |
| Food Preparation & Serving | 157 (27.9%) | 406 (72.1%) |
| Cleaning & Maintenance | 257 (65.7%) | 134 (34.3%) |
| Personal Care & Service | 17 (26.2%) | 48 (73.9%) |
| Total (Category) | 709 (41.3%) | 1,008 (58.7%) |
| Total (Overall) | 2,752 (49.0%) | 2,868 (51.0%) |
Sales and Office Occupations
The most common Sales and Office occupations in Sharon are Sales & Related (531 | 9.5%), and Office & Administration (492 | 8.7%).
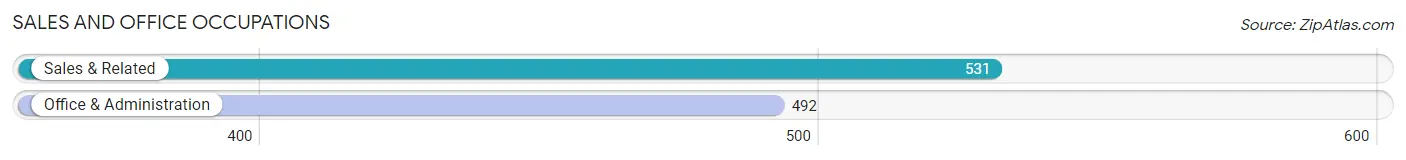
Sales and Office Occupations by Sex
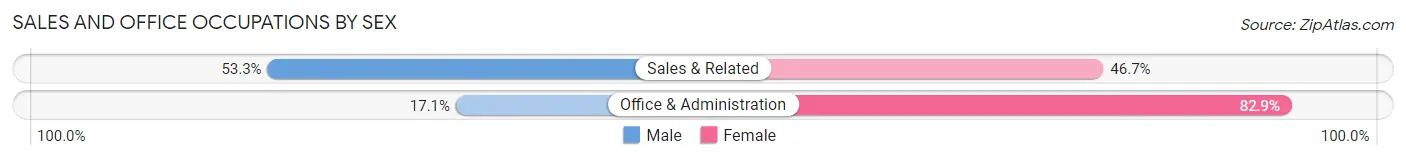
| Occupation | Male | Female |
| Sales & Related | 283 (53.3%) | 248 (46.7%) |
| Office & Administration | 84 (17.1%) | 408 (82.9%) |
| Total (Category) | 367 (35.9%) | 656 (64.1%) |
| Total (Overall) | 2,752 (49.0%) | 2,868 (51.0%) |
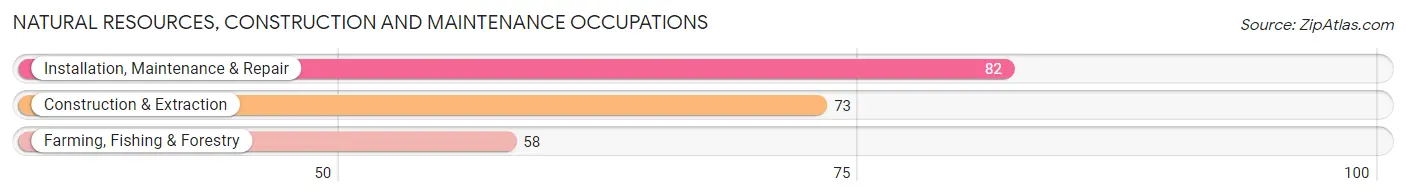
Natural Resources, Construction and Maintenance Occupations
The most common Natural Resources, Construction and Maintenance occupations in Sharon are Installation, Maintenance & Repair (82 | 1.5%), Construction & Extraction (73 | 1.3%), and Farming, Fishing & Forestry (58 | 1.0%).
Natural Resources, Construction and Maintenance Occupations by Sex
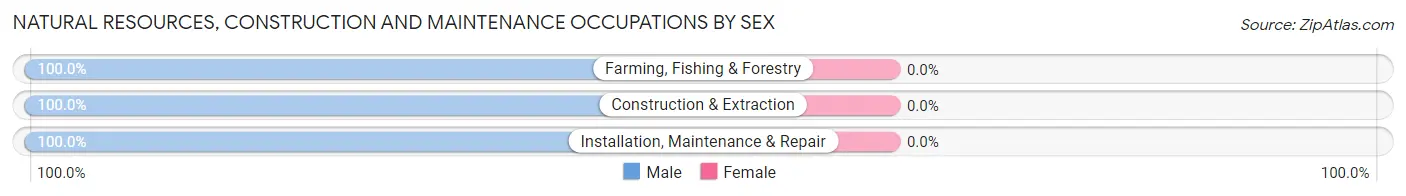
| Occupation | Male | Female |
| Farming, Fishing & Forestry | 58 (100.0%) | 0 (0.0%) |
| Construction & Extraction | 73 (100.0%) | 0 (0.0%) |
| Installation, Maintenance & Repair | 82 (100.0%) | 0 (0.0%) |
| Total (Category) | 213 (100.0%) | 0 (0.0%) |
| Total (Overall) | 2,752 (49.0%) | 2,868 (51.0%) |
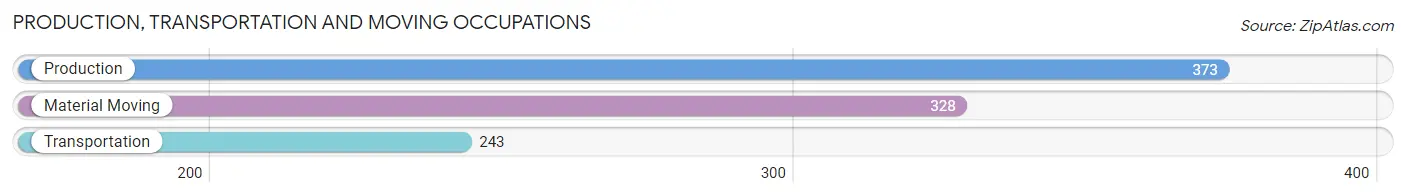
Production, Transportation and Moving Occupations
The most common Production, Transportation and Moving occupations in Sharon are Production (373 | 6.6%), Material Moving (328 | 5.8%), and Transportation (243 | 4.3%).
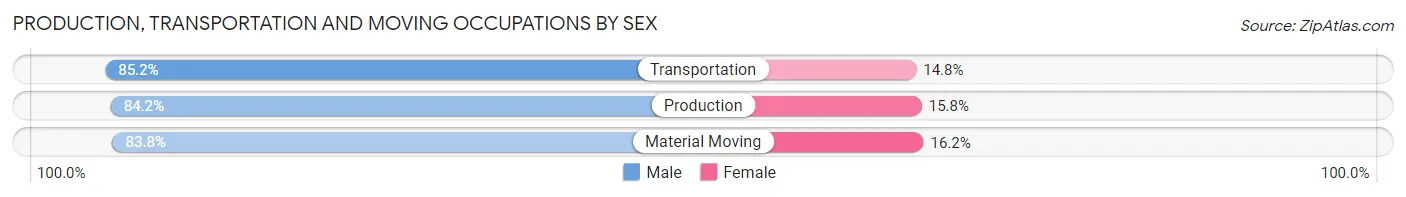
Production, Transportation and Moving Occupations by Sex
| Occupation | Male | Female |
| Production | 314 (84.2%) | 59 (15.8%) |
| Transportation | 207 (85.2%) | 36 (14.8%) |
| Material Moving | 275 (83.8%) | 53 (16.2%) |
| Total (Category) | 796 (84.3%) | 148 (15.7%) |
| Total (Overall) | 2,752 (49.0%) | 2,868 (51.0%) |
Employment Industries by Sex in Sharon
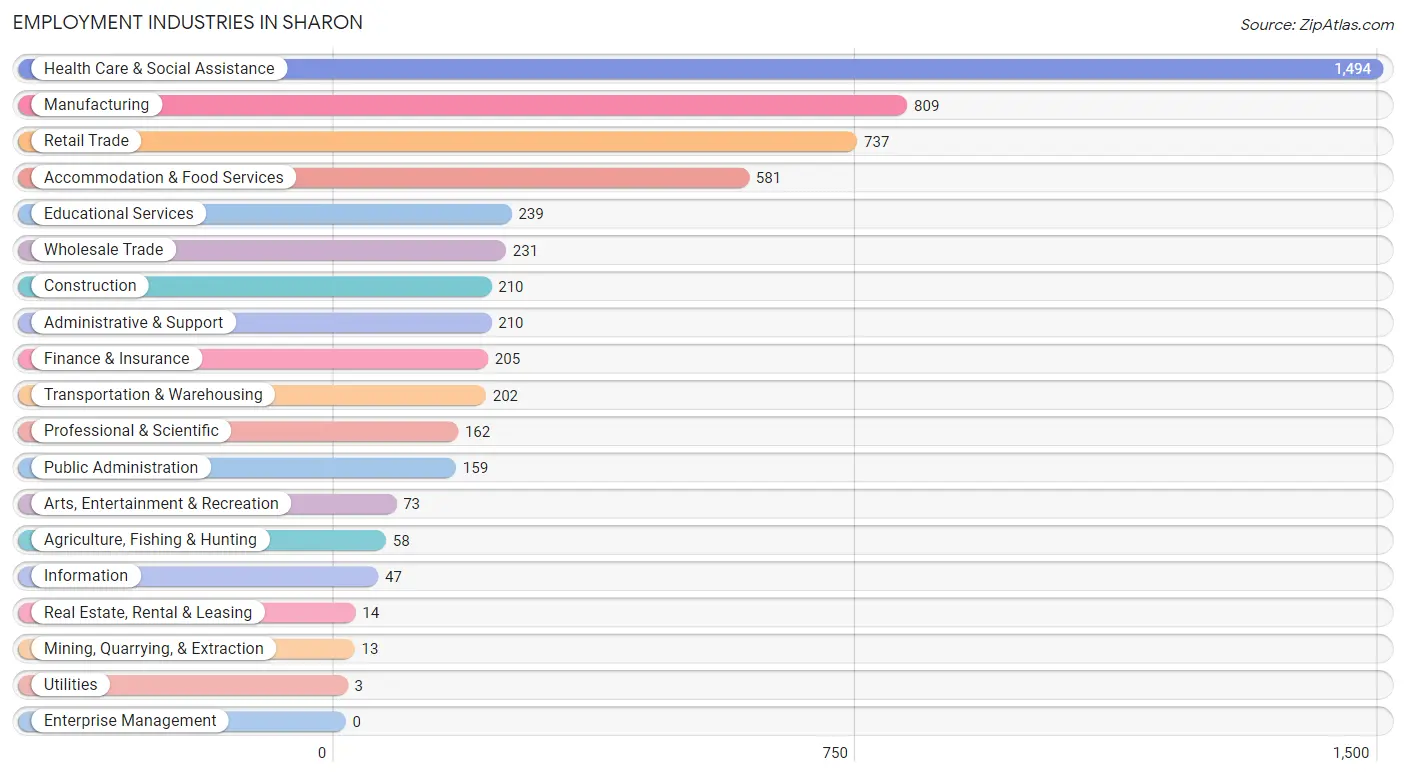
Employment Industries in Sharon
The major employment industries in Sharon include Health Care & Social Assistance (1,494 | 26.6%), Manufacturing (809 | 14.4%), Retail Trade (737 | 13.1%), Accommodation & Food Services (581 | 10.3%), and Educational Services (239 | 4.3%).
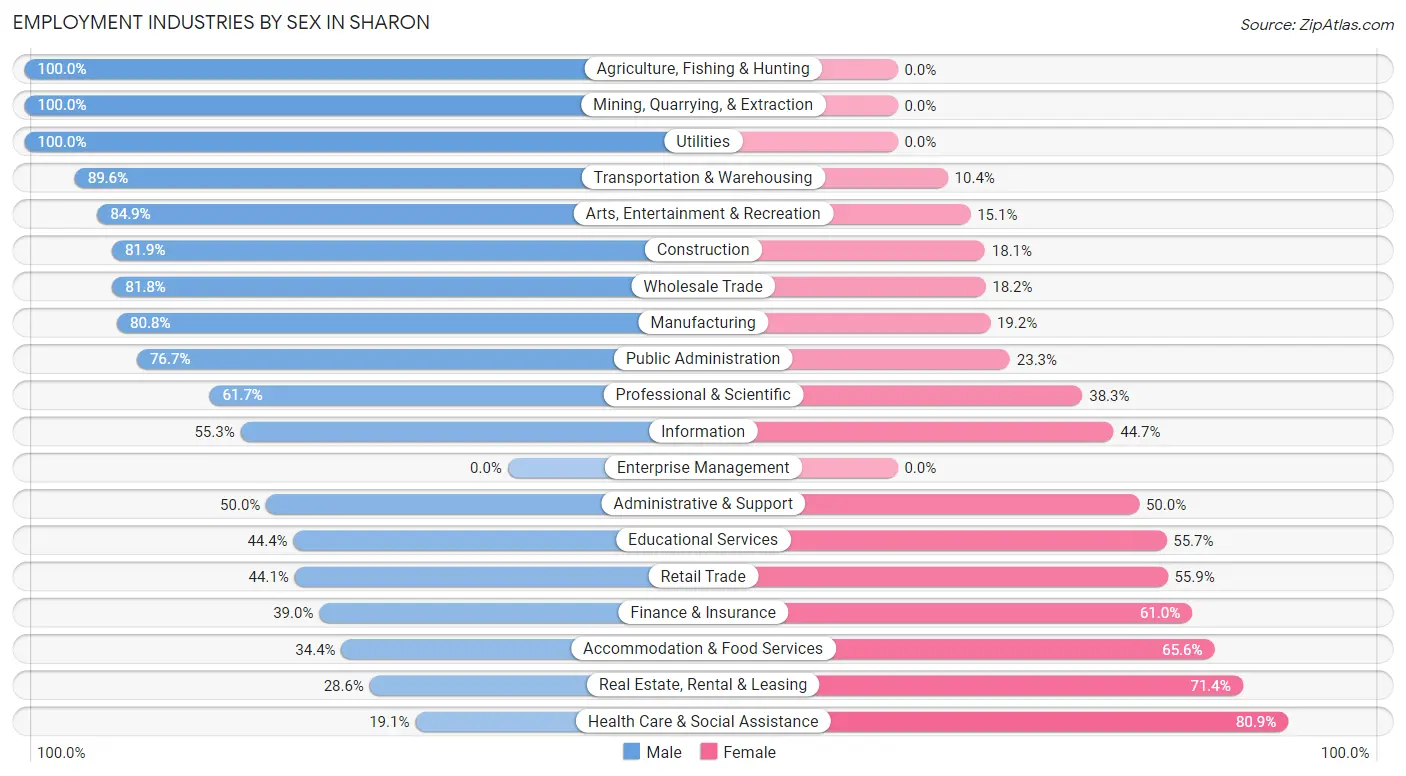
Employment Industries by Sex in Sharon
The Sharon industries that see more men than women are Agriculture, Fishing & Hunting (100.0%), Mining, Quarrying, & Extraction (100.0%), and Utilities (100.0%), whereas the industries that tend to have a higher number of women are Health Care & Social Assistance (80.9%), Real Estate, Rental & Leasing (71.4%), and Accommodation & Food Services (65.6%).
| Industry | Male | Female |
| Agriculture, Fishing & Hunting | 58 (100.0%) | 0 (0.0%) |
| Mining, Quarrying, & Extraction | 13 (100.0%) | 0 (0.0%) |
| Construction | 172 (81.9%) | 38 (18.1%) |
| Manufacturing | 654 (80.8%) | 155 (19.2%) |
| Wholesale Trade | 189 (81.8%) | 42 (18.2%) |
| Retail Trade | 325 (44.1%) | 412 (55.9%) |
| Transportation & Warehousing | 181 (89.6%) | 21 (10.4%) |
| Utilities | 3 (100.0%) | 0 (0.0%) |
| Information | 26 (55.3%) | 21 (44.7%) |
| Finance & Insurance | 80 (39.0%) | 125 (61.0%) |
| Real Estate, Rental & Leasing | 4 (28.6%) | 10 (71.4%) |
| Professional & Scientific | 100 (61.7%) | 62 (38.3%) |
| Enterprise Management | 0 (0.0%) | 0 (0.0%) |
| Administrative & Support | 105 (50.0%) | 105 (50.0%) |
| Educational Services | 106 (44.4%) | 133 (55.6%) |
| Health Care & Social Assistance | 286 (19.1%) | 1,208 (80.9%) |
| Arts, Entertainment & Recreation | 62 (84.9%) | 11 (15.1%) |
| Accommodation & Food Services | 200 (34.4%) | 381 (65.6%) |
| Public Administration | 122 (76.7%) | 37 (23.3%) |
| Total | 2,752 (49.0%) | 2,868 (51.0%) |
Education in Sharon
School Enrollment in Sharon
The most common levels of schooling among the 2,403 students in Sharon are college / undergraduate (517 | 21.5%), high school (506 | 21.1%), and elementary school (455 | 18.9%).
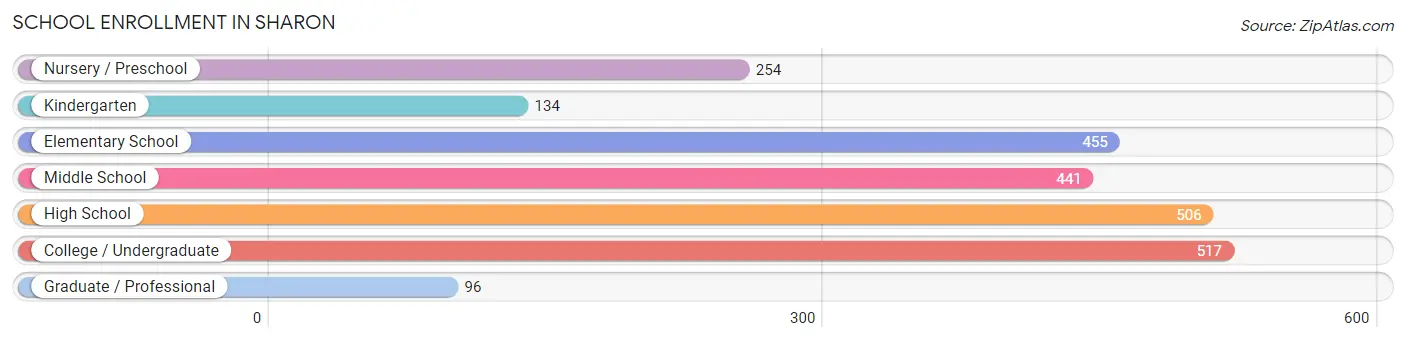
| School Level | # Students | % Students |
| Nursery / Preschool | 254 | 10.6% |
| Kindergarten | 134 | 5.6% |
| Elementary School | 455 | 18.9% |
| Middle School | 441 | 18.3% |
| High School | 506 | 21.1% |
| College / Undergraduate | 517 | 21.5% |
| Graduate / Professional | 96 | 4.0% |
| Total | 2,403 | 100.0% |
School Enrollment by Age by Funding Source in Sharon
Out of a total of 2,403 students who are enrolled in schools in Sharon, 317 (13.2%) attend a private institution, while the remaining 2,086 (86.8%) are enrolled in public schools. The age group of 3 to 4 year olds has the highest likelihood of being enrolled in private schools, with 24 (25.0% in the age bracket) enrolled. Conversely, the age group of 10 to 14 year olds has the lowest likelihood of being enrolled in a private school, with 576 (97.3% in the age bracket) attending a public institution.
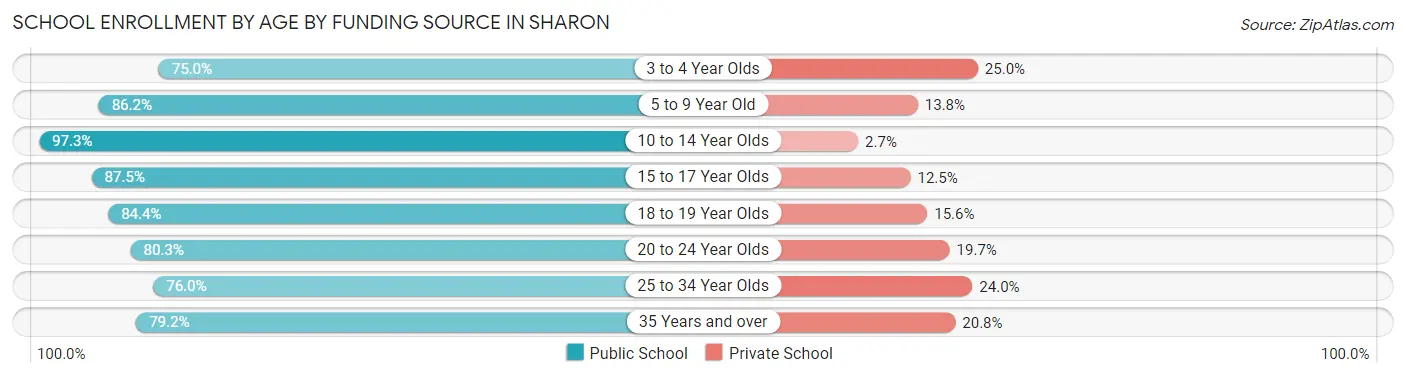
| Age Bracket | Public School | Private School |
| 3 to 4 Year Olds | 72 (75.0%) | 24 (25.0%) |
| 5 to 9 Year Old | 611 (86.2%) | 98 (13.8%) |
| 10 to 14 Year Olds | 576 (97.3%) | 16 (2.7%) |
| 15 to 17 Year Olds | 288 (87.5%) | 41 (12.5%) |
| 18 to 19 Year Olds | 65 (84.4%) | 12 (15.6%) |
| 20 to 24 Year Olds | 244 (80.3%) | 60 (19.7%) |
| 25 to 34 Year Olds | 130 (76.0%) | 41 (24.0%) |
| 35 Years and over | 99 (79.2%) | 26 (20.8%) |
| Total | 2,086 (86.8%) | 317 (13.2%) |
Educational Attainment by Field of Study in Sharon
Education (450 | 20.4%), business (303 | 13.8%), arts & humanities (290 | 13.2%), science & technology (204 | 9.3%), and psychology (164 | 7.4%) are the most common fields of study among 2,200 individuals in Sharon who have obtained a bachelor's degree or higher.
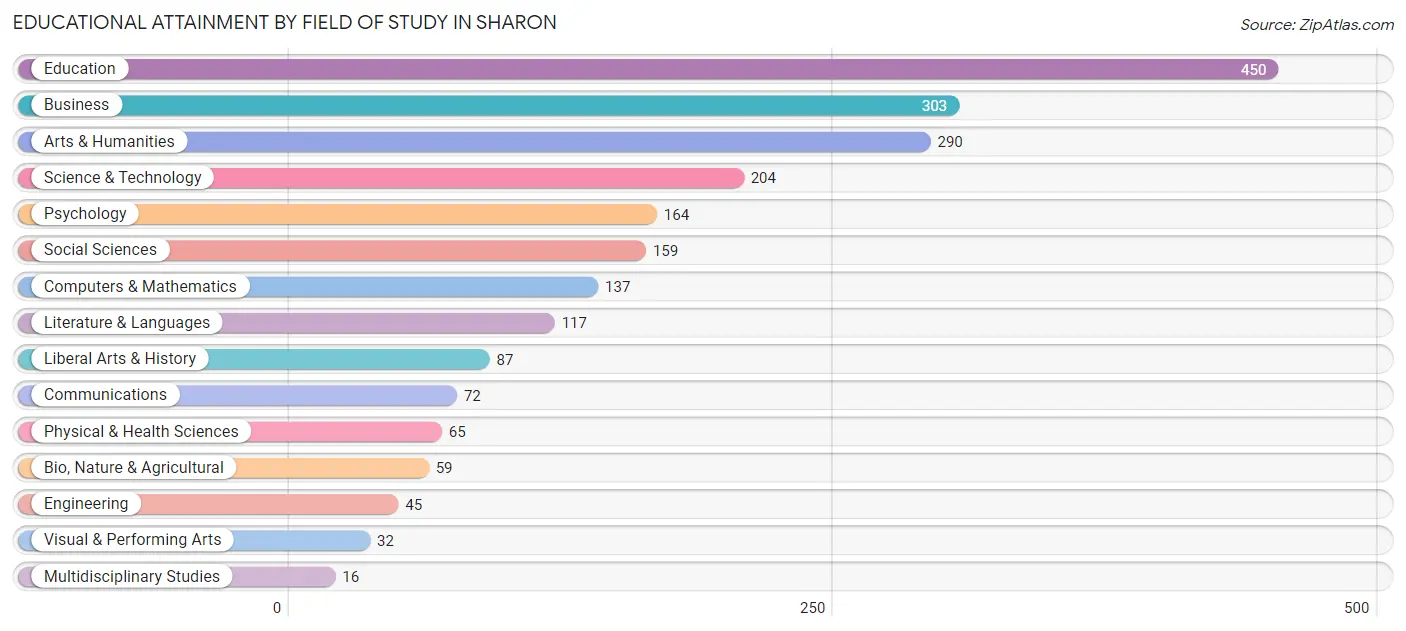
| Field of Study | # Graduates | % Graduates |
| Computers & Mathematics | 137 | 6.2% |
| Bio, Nature & Agricultural | 59 | 2.7% |
| Physical & Health Sciences | 65 | 2.9% |
| Psychology | 164 | 7.4% |
| Social Sciences | 159 | 7.2% |
| Engineering | 45 | 2.1% |
| Multidisciplinary Studies | 16 | 0.7% |
| Science & Technology | 204 | 9.3% |
| Business | 303 | 13.8% |
| Education | 450 | 20.4% |
| Literature & Languages | 117 | 5.3% |
| Liberal Arts & History | 87 | 4.0% |
| Visual & Performing Arts | 32 | 1.5% |
| Communications | 72 | 3.3% |
| Arts & Humanities | 290 | 13.2% |
| Total | 2,200 | 100.0% |
Transportation & Commute in Sharon
Vehicle Availability by Sex in Sharon
The most prevalent vehicle ownership categories in Sharon are males with 2 vehicles (1,091, accounting for 40.2%) and females with 2 vehicles (910, making up 38.7%).
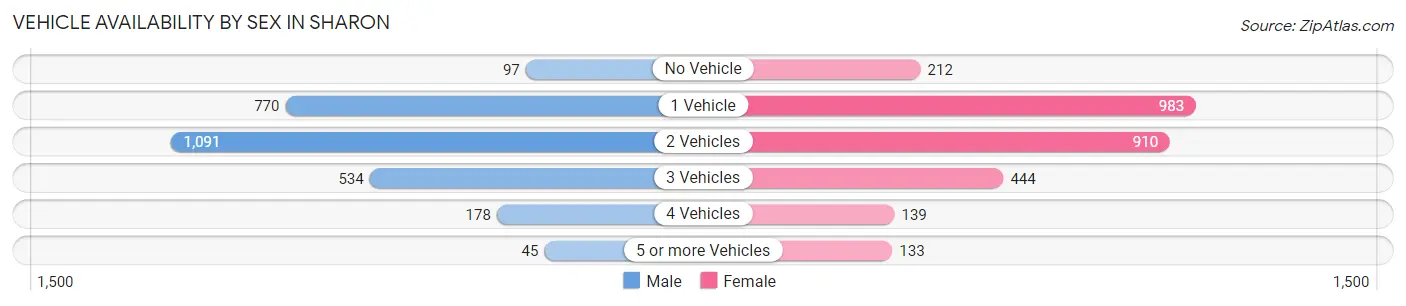
| Vehicles Available | Male | Female |
| No Vehicle | 97 (3.6%) | 212 (7.5%) |
| 1 Vehicle | 770 (28.4%) | 983 (34.8%) |
| 2 Vehicles | 1,091 (40.2%) | 910 (32.3%) |
| 3 Vehicles | 534 (19.7%) | 444 (15.7%) |
| 4 Vehicles | 178 (6.6%) | 139 (4.9%) |
| 5 or more Vehicles | 45 (1.7%) | 133 (4.7%) |
| Total | 2,715 (100.0%) | 2,821 (100.0%) |
Commute Time in Sharon
The most frequently occuring commute durations in Sharon are 5 to 9 minutes (1,406 commuters, 26.3%), 10 to 14 minutes (1,136 commuters, 21.2%), and 20 to 24 minutes (681 commuters, 12.7%).
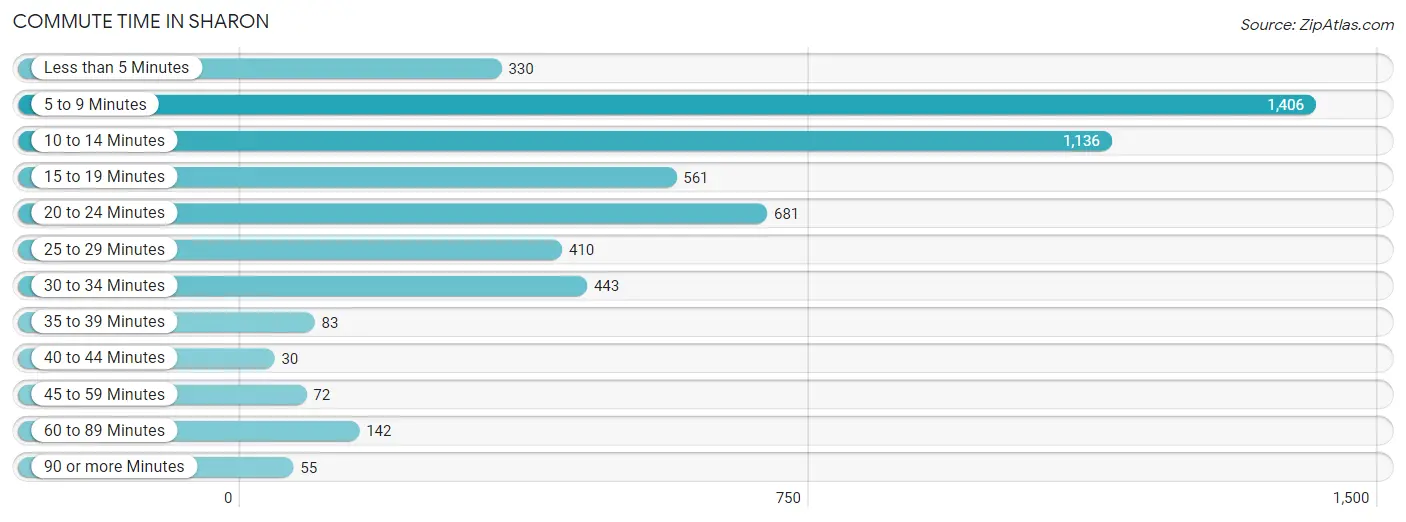
| Commute Time | # Commuters | % Commuters |
| Less than 5 Minutes | 330 | 6.2% |
| 5 to 9 Minutes | 1,406 | 26.3% |
| 10 to 14 Minutes | 1,136 | 21.2% |
| 15 to 19 Minutes | 561 | 10.5% |
| 20 to 24 Minutes | 681 | 12.7% |
| 25 to 29 Minutes | 410 | 7.7% |
| 30 to 34 Minutes | 443 | 8.3% |
| 35 to 39 Minutes | 83 | 1.5% |
| 40 to 44 Minutes | 30 | 0.6% |
| 45 to 59 Minutes | 72 | 1.3% |
| 60 to 89 Minutes | 142 | 2.6% |
| 90 or more Minutes | 55 | 1.0% |
Commute Time by Sex in Sharon
The most common commute times in Sharon are 5 to 9 minutes (649 commuters, 25.1%) for males and 5 to 9 minutes (757 commuters, 27.4%) for females.
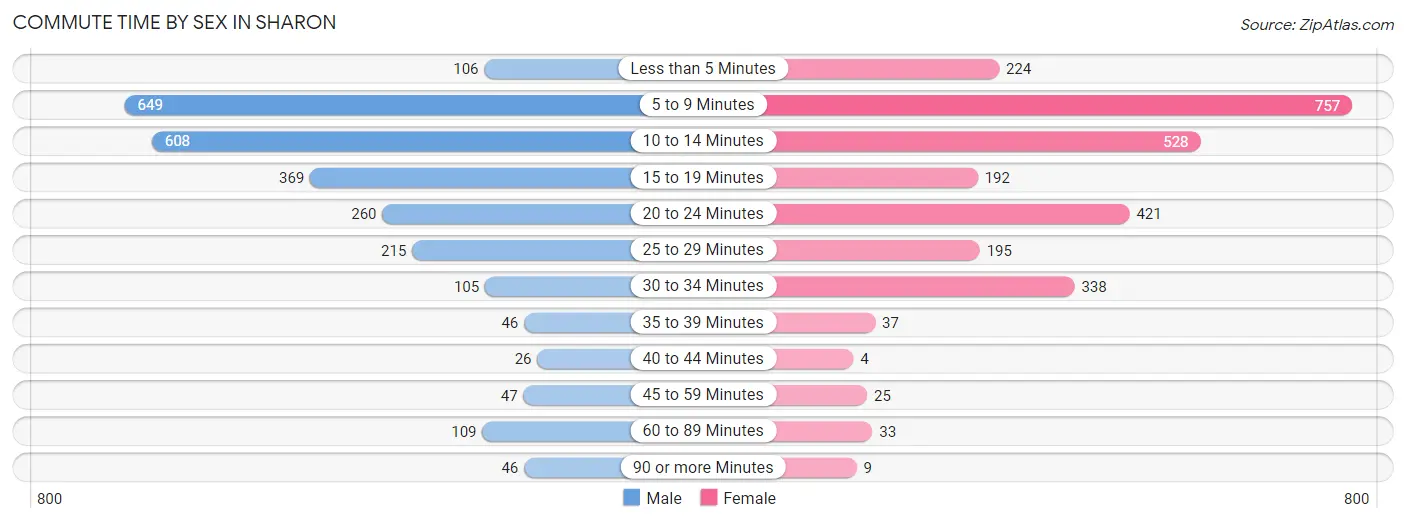
| Commute Time | Male | Female |
| Less than 5 Minutes | 106 (4.1%) | 224 (8.1%) |
| 5 to 9 Minutes | 649 (25.1%) | 757 (27.4%) |
| 10 to 14 Minutes | 608 (23.5%) | 528 (19.1%) |
| 15 to 19 Minutes | 369 (14.3%) | 192 (7.0%) |
| 20 to 24 Minutes | 260 (10.1%) | 421 (15.2%) |
| 25 to 29 Minutes | 215 (8.3%) | 195 (7.1%) |
| 30 to 34 Minutes | 105 (4.1%) | 338 (12.2%) |
| 35 to 39 Minutes | 46 (1.8%) | 37 (1.3%) |
| 40 to 44 Minutes | 26 (1.0%) | 4 (0.1%) |
| 45 to 59 Minutes | 47 (1.8%) | 25 (0.9%) |
| 60 to 89 Minutes | 109 (4.2%) | 33 (1.2%) |
| 90 or more Minutes | 46 (1.8%) | 9 (0.3%) |
Time of Departure to Work by Sex in Sharon
The most frequent times of departure to work in Sharon are 6:30 AM to 6:59 AM (544, 21.0%) for males and 7:00 AM to 7:29 AM (414, 15.0%) for females.
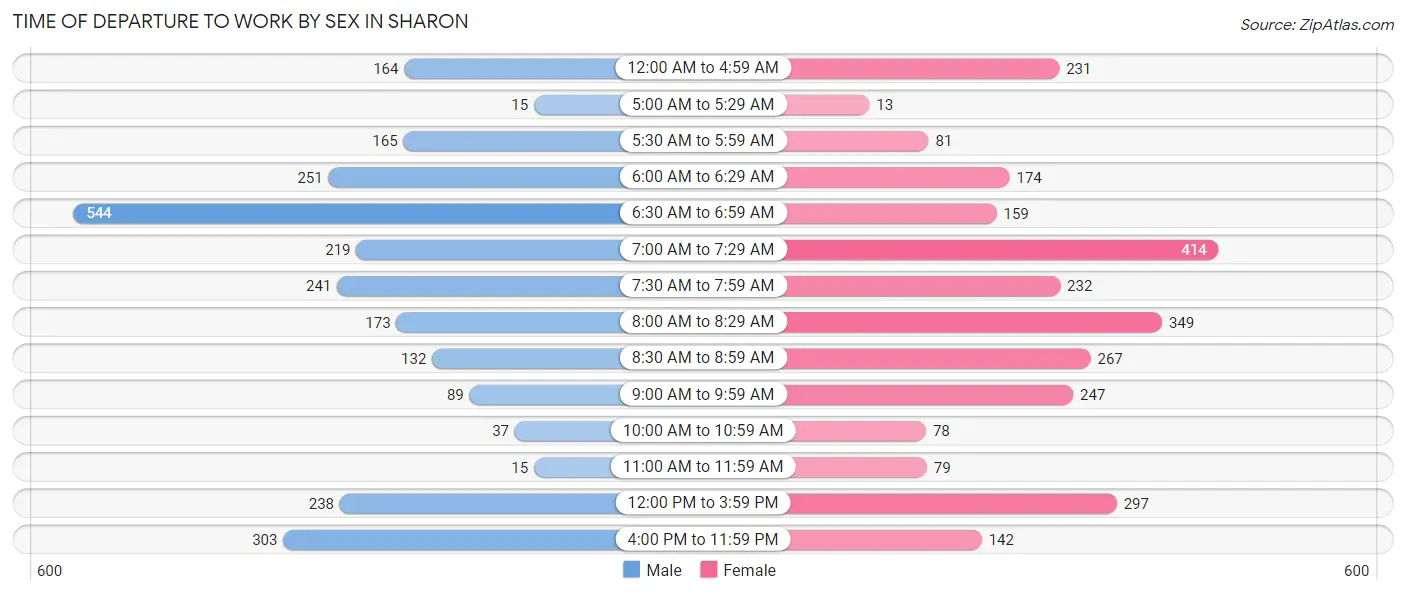
| Time of Departure | Male | Female |
| 12:00 AM to 4:59 AM | 164 (6.3%) | 231 (8.4%) |
| 5:00 AM to 5:29 AM | 15 (0.6%) | 13 (0.5%) |
| 5:30 AM to 5:59 AM | 165 (6.4%) | 81 (2.9%) |
| 6:00 AM to 6:29 AM | 251 (9.7%) | 174 (6.3%) |
| 6:30 AM to 6:59 AM | 544 (21.0%) | 159 (5.8%) |
| 7:00 AM to 7:29 AM | 219 (8.5%) | 414 (15.0%) |
| 7:30 AM to 7:59 AM | 241 (9.3%) | 232 (8.4%) |
| 8:00 AM to 8:29 AM | 173 (6.7%) | 349 (12.6%) |
| 8:30 AM to 8:59 AM | 132 (5.1%) | 267 (9.7%) |
| 9:00 AM to 9:59 AM | 89 (3.4%) | 247 (8.9%) |
| 10:00 AM to 10:59 AM | 37 (1.4%) | 78 (2.8%) |
| 11:00 AM to 11:59 AM | 15 (0.6%) | 79 (2.9%) |
| 12:00 PM to 3:59 PM | 238 (9.2%) | 297 (10.7%) |
| 4:00 PM to 11:59 PM | 303 (11.7%) | 142 (5.1%) |
| Total | 2,586 (100.0%) | 2,763 (100.0%) |
Housing Occupancy in Sharon
Occupancy by Ownership in Sharon
Of the total 6,144 dwellings in Sharon, owner-occupied units account for 3,333 (54.2%), while renter-occupied units make up 2,811 (45.8%).
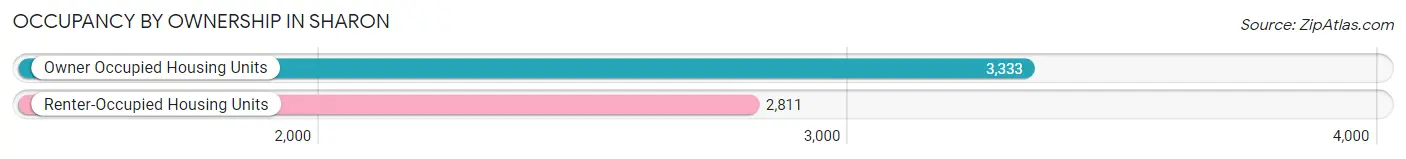
| Occupancy | # Housing Units | % Housing Units |
| Owner Occupied Housing Units | 3,333 | 54.2% |
| Renter-Occupied Housing Units | 2,811 | 45.8% |
| Total Occupied Housing Units | 6,144 | 100.0% |
Occupancy by Household Size in Sharon
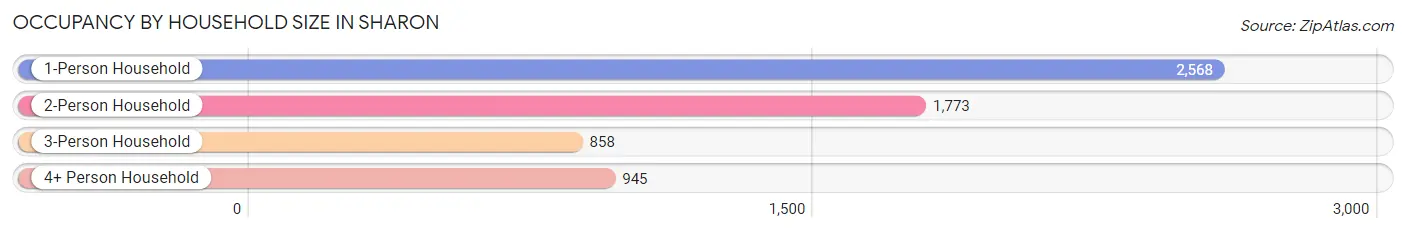
| Household Size | # Housing Units | % Housing Units |
| 1-Person Household | 2,568 | 41.8% |
| 2-Person Household | 1,773 | 28.9% |
| 3-Person Household | 858 | 14.0% |
| 4+ Person Household | 945 | 15.4% |
| Total Housing Units | 6,144 | 100.0% |
Occupancy by Ownership by Household Size in Sharon
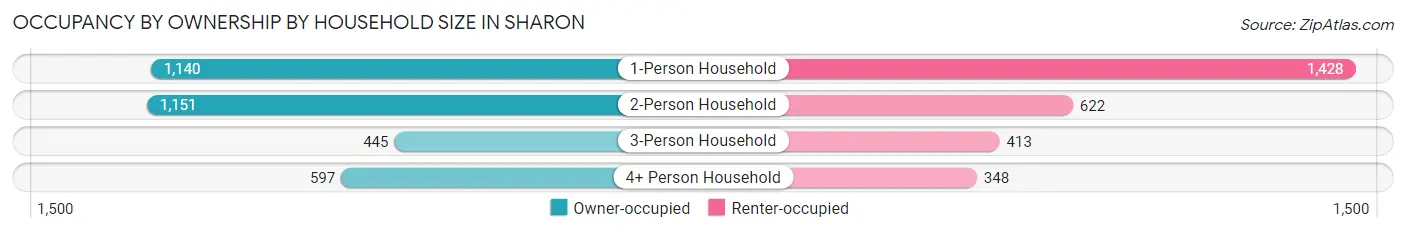
| Household Size | Owner-occupied | Renter-occupied |
| 1-Person Household | 1,140 (44.4%) | 1,428 (55.6%) |
| 2-Person Household | 1,151 (64.9%) | 622 (35.1%) |
| 3-Person Household | 445 (51.9%) | 413 (48.1%) |
| 4+ Person Household | 597 (63.2%) | 348 (36.8%) |
| Total Housing Units | 3,333 (54.2%) | 2,811 (45.8%) |
Occupancy by Educational Attainment in Sharon
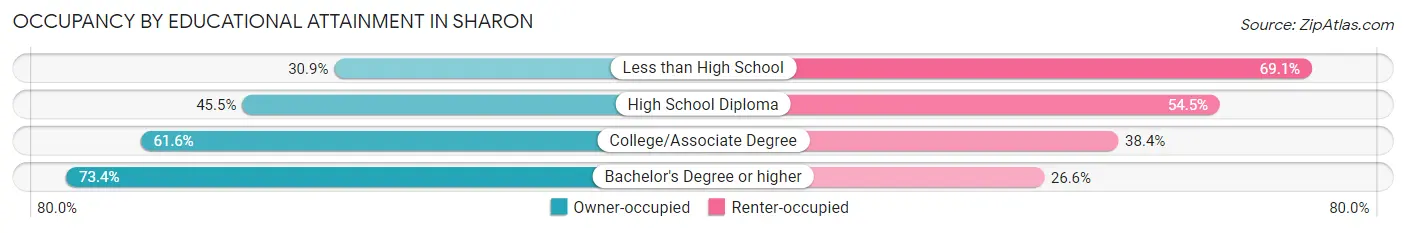
| Household Size | Owner-occupied | Renter-occupied |
| Less than High School | 198 (30.9%) | 443 (69.1%) |
| High School Diploma | 1,132 (45.5%) | 1,357 (54.5%) |
| College/Associate Degree | 1,095 (61.6%) | 682 (38.4%) |
| Bachelor's Degree or higher | 908 (73.4%) | 329 (26.6%) |
Occupancy by Age of Householder in Sharon
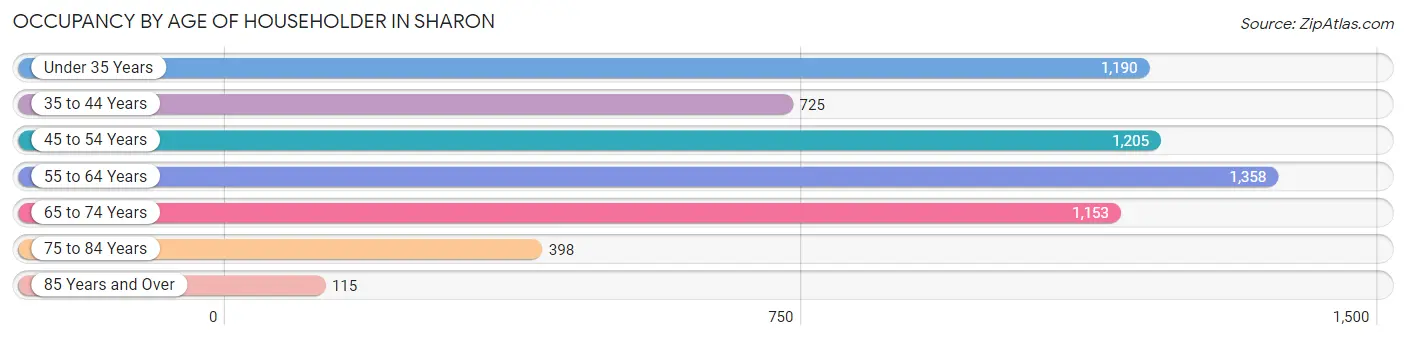
| Age Bracket | # Households | % Households |
| Under 35 Years | 1,190 | 19.4% |
| 35 to 44 Years | 725 | 11.8% |
| 45 to 54 Years | 1,205 | 19.6% |
| 55 to 64 Years | 1,358 | 22.1% |
| 65 to 74 Years | 1,153 | 18.8% |
| 75 to 84 Years | 398 | 6.5% |
| 85 Years and Over | 115 | 1.9% |
| Total | 6,144 | 100.0% |
Housing Finances in Sharon
Median Income by Occupancy in Sharon
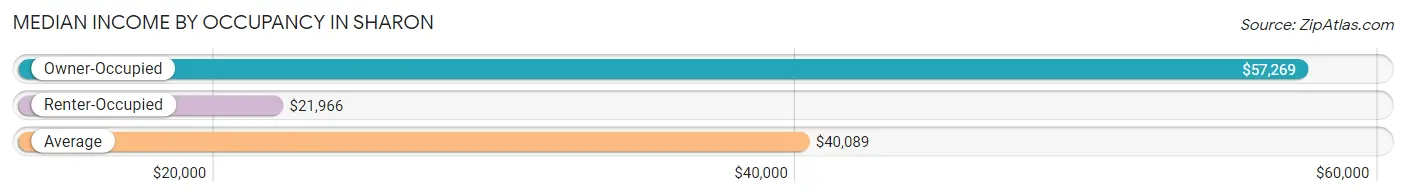
| Occupancy Type | # Households | Median Income |
| Owner-Occupied | 3,333 (54.2%) | $57,269 |
| Renter-Occupied | 2,811 (45.8%) | $21,966 |
| Average | 6,144 (100.0%) | $40,089 |
Occupancy by Householder Income Bracket in Sharon
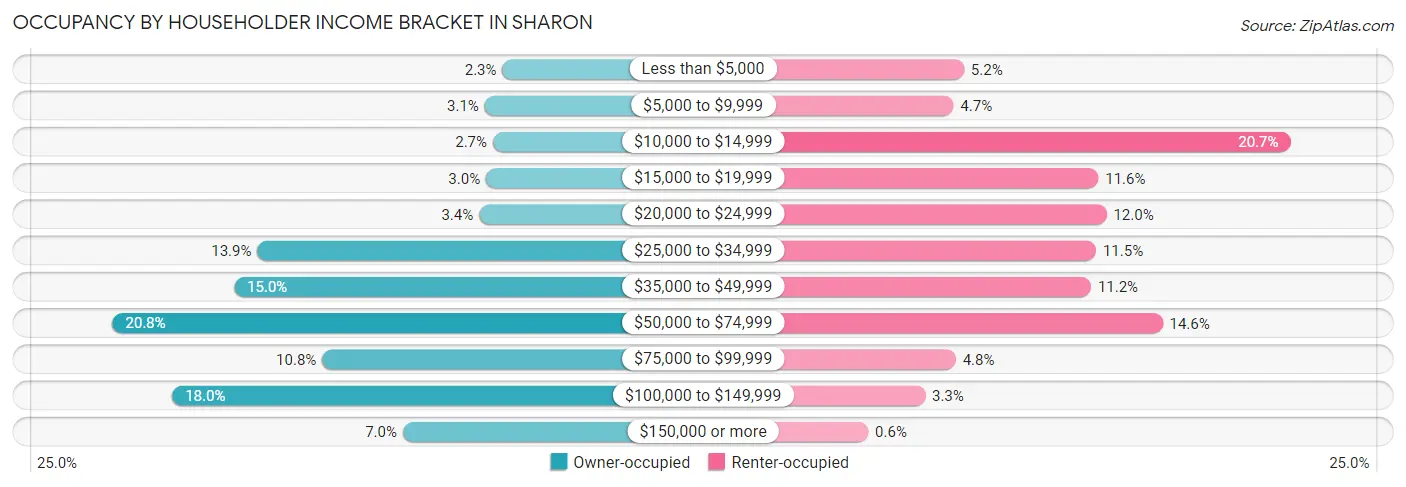
| Income Bracket | Owner-occupied | Renter-occupied |
| Less than $5,000 | 75 (2.2%) | 145 (5.2%) |
| $5,000 to $9,999 | 103 (3.1%) | 131 (4.7%) |
| $10,000 to $14,999 | 90 (2.7%) | 582 (20.7%) |
| $15,000 to $19,999 | 101 (3.0%) | 325 (11.6%) |
| $20,000 to $24,999 | 112 (3.4%) | 336 (11.9%) |
| $25,000 to $34,999 | 464 (13.9%) | 322 (11.5%) |
| $35,000 to $49,999 | 501 (15.0%) | 315 (11.2%) |
| $50,000 to $74,999 | 694 (20.8%) | 411 (14.6%) |
| $75,000 to $99,999 | 361 (10.8%) | 134 (4.8%) |
| $100,000 to $149,999 | 599 (18.0%) | 93 (3.3%) |
| $150,000 or more | 233 (7.0%) | 17 (0.6%) |
| Total | 3,333 (100.0%) | 2,811 (100.0%) |
Monthly Housing Cost Tiers in Sharon
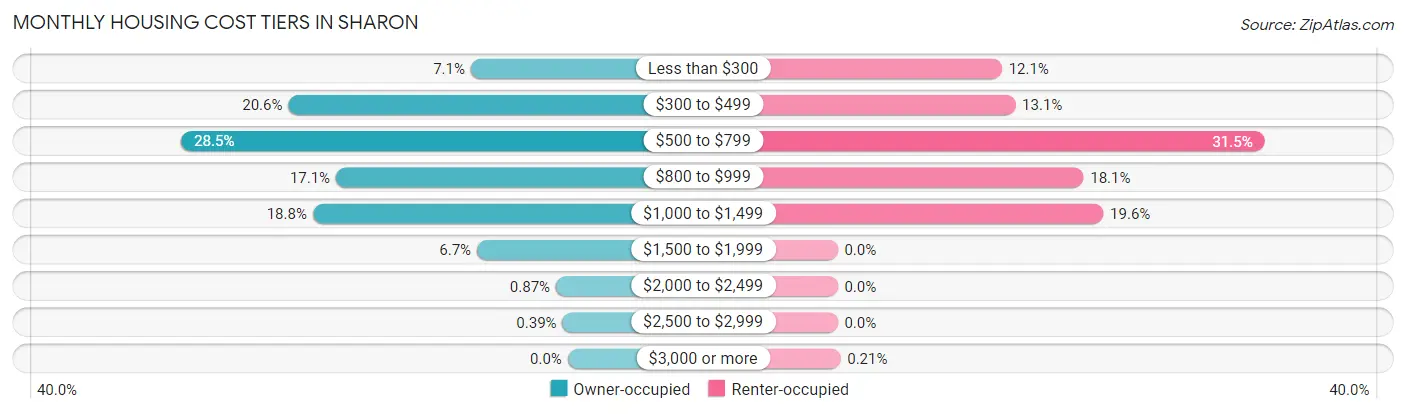
| Monthly Cost | Owner-occupied | Renter-occupied |
| Less than $300 | 238 (7.1%) | 340 (12.1%) |
| $300 to $499 | 686 (20.6%) | 368 (13.1%) |
| $500 to $799 | 949 (28.5%) | 884 (31.5%) |
| $800 to $999 | 569 (17.1%) | 509 (18.1%) |
| $1,000 to $1,499 | 626 (18.8%) | 550 (19.6%) |
| $1,500 to $1,999 | 223 (6.7%) | 0 (0.0%) |
| $2,000 to $2,499 | 29 (0.9%) | 0 (0.0%) |
| $2,500 to $2,999 | 13 (0.4%) | 0 (0.0%) |
| $3,000 or more | 0 (0.0%) | 6 (0.2%) |
| Total | 3,333 (100.0%) | 2,811 (100.0%) |
Physical Housing Characteristics in Sharon
Housing Structures in Sharon
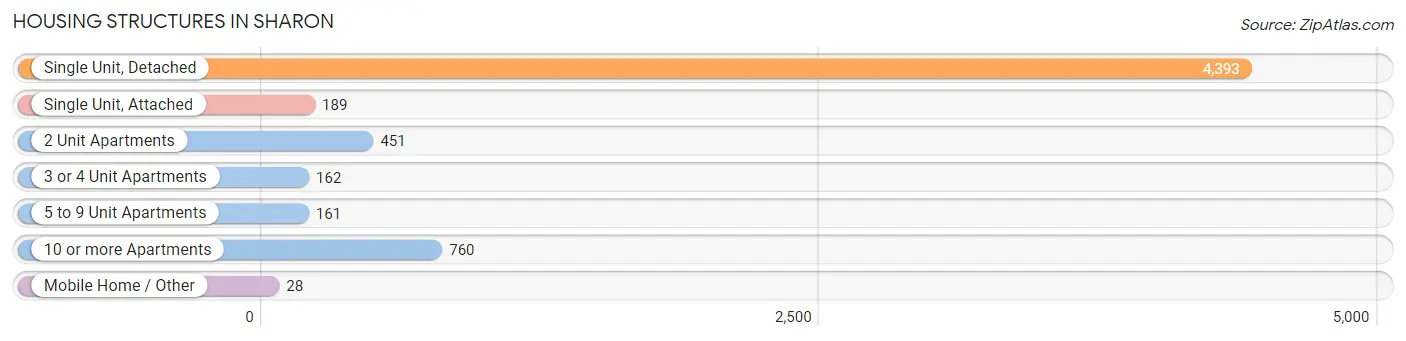
| Structure Type | # Housing Units | % Housing Units |
| Single Unit, Detached | 4,393 | 71.5% |
| Single Unit, Attached | 189 | 3.1% |
| 2 Unit Apartments | 451 | 7.3% |
| 3 or 4 Unit Apartments | 162 | 2.6% |
| 5 to 9 Unit Apartments | 161 | 2.6% |
| 10 or more Apartments | 760 | 12.4% |
| Mobile Home / Other | 28 | 0.5% |
| Total | 6,144 | 100.0% |
Housing Structures by Occupancy in Sharon
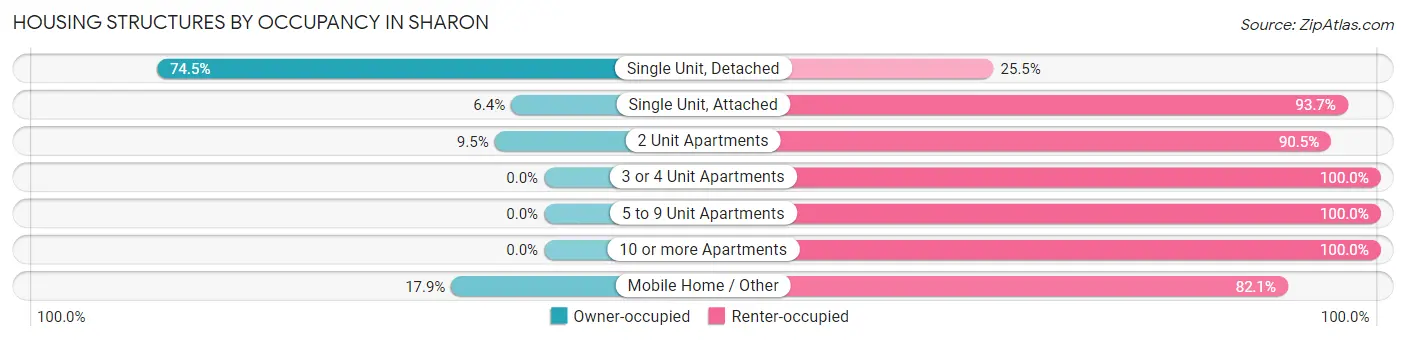
| Structure Type | Owner-occupied | Renter-occupied |
| Single Unit, Detached | 3,273 (74.5%) | 1,120 (25.5%) |
| Single Unit, Attached | 12 (6.4%) | 177 (93.6%) |
| 2 Unit Apartments | 43 (9.5%) | 408 (90.5%) |
| 3 or 4 Unit Apartments | 0 (0.0%) | 162 (100.0%) |
| 5 to 9 Unit Apartments | 0 (0.0%) | 161 (100.0%) |
| 10 or more Apartments | 0 (0.0%) | 760 (100.0%) |
| Mobile Home / Other | 5 (17.9%) | 23 (82.1%) |
| Total | 3,333 (54.2%) | 2,811 (45.8%) |
Housing Structures by Number of Rooms in Sharon
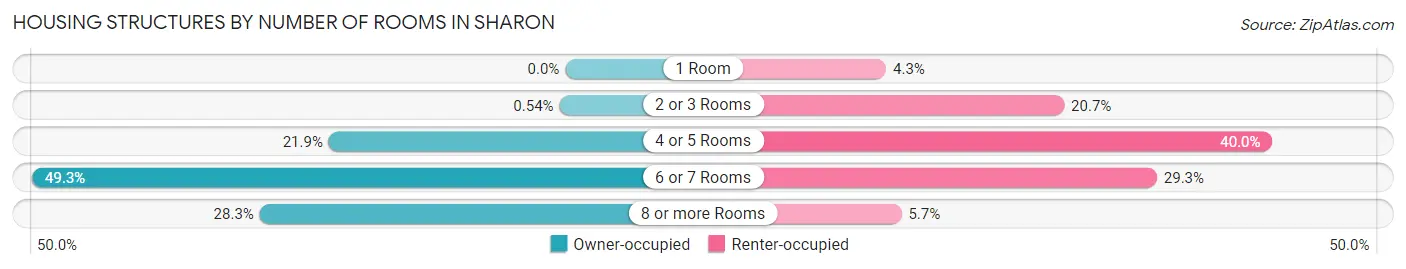
| Number of Rooms | Owner-occupied | Renter-occupied |
| 1 Room | 0 (0.0%) | 120 (4.3%) |
| 2 or 3 Rooms | 18 (0.5%) | 583 (20.7%) |
| 4 or 5 Rooms | 729 (21.9%) | 1,124 (40.0%) |
| 6 or 7 Rooms | 1,644 (49.3%) | 824 (29.3%) |
| 8 or more Rooms | 942 (28.3%) | 160 (5.7%) |
| Total | 3,333 (100.0%) | 2,811 (100.0%) |
Housing Structure by Heating Type in Sharon
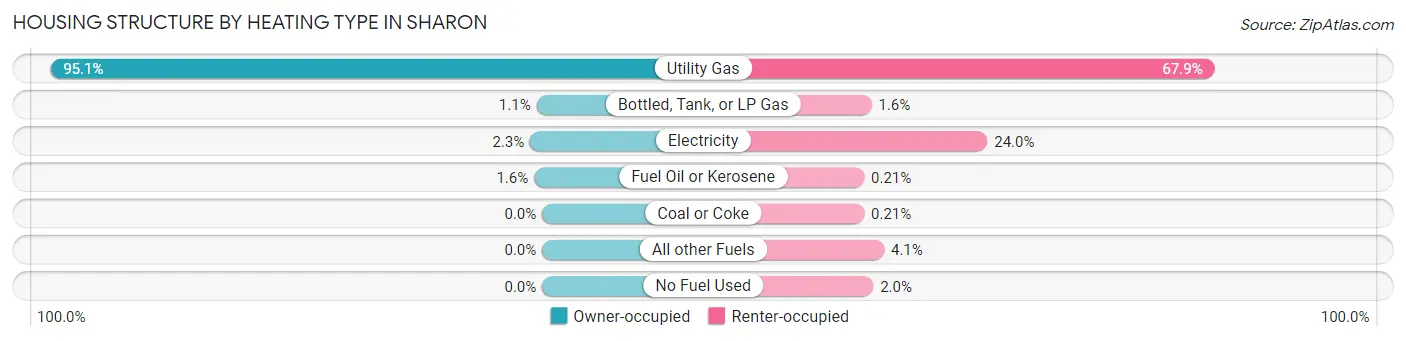
| Heating Type | Owner-occupied | Renter-occupied |
| Utility Gas | 3,168 (95.1%) | 1,909 (67.9%) |
| Bottled, Tank, or LP Gas | 36 (1.1%) | 46 (1.6%) |
| Electricity | 77 (2.3%) | 675 (24.0%) |
| Fuel Oil or Kerosene | 52 (1.6%) | 6 (0.2%) |
| Coal or Coke | 0 (0.0%) | 6 (0.2%) |
| All other Fuels | 0 (0.0%) | 114 (4.1%) |
| No Fuel Used | 0 (0.0%) | 55 (2.0%) |
| Total | 3,333 (100.0%) | 2,811 (100.0%) |
Household Vehicle Usage in Sharon
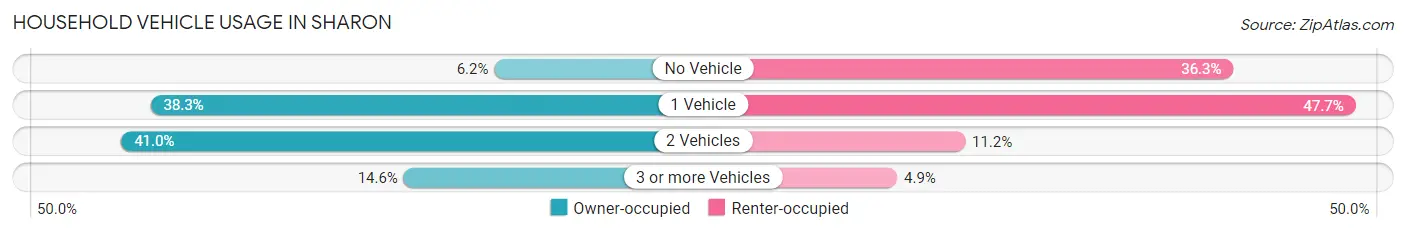
| Vehicles per Household | Owner-occupied | Renter-occupied |
| No Vehicle | 205 (6.1%) | 1,019 (36.2%) |
| 1 Vehicle | 1,275 (38.3%) | 1,340 (47.7%) |
| 2 Vehicles | 1,366 (41.0%) | 315 (11.2%) |
| 3 or more Vehicles | 487 (14.6%) | 137 (4.9%) |
| Total | 3,333 (100.0%) | 2,811 (100.0%) |
Real Estate & Mortgages in Sharon
Real Estate and Mortgage Overview in Sharon
| Characteristic | Without Mortgage | With Mortgage |
| Housing Units | 1,584 | 1,749 |
| Median Property Value | $57,900 | $77,800 |
| Median Household Income | $40,368 | $184 |
| Monthly Housing Costs | $466 | $0 |
| Real Estate Taxes | $1,475 | $13 |
Property Value by Mortgage Status in Sharon
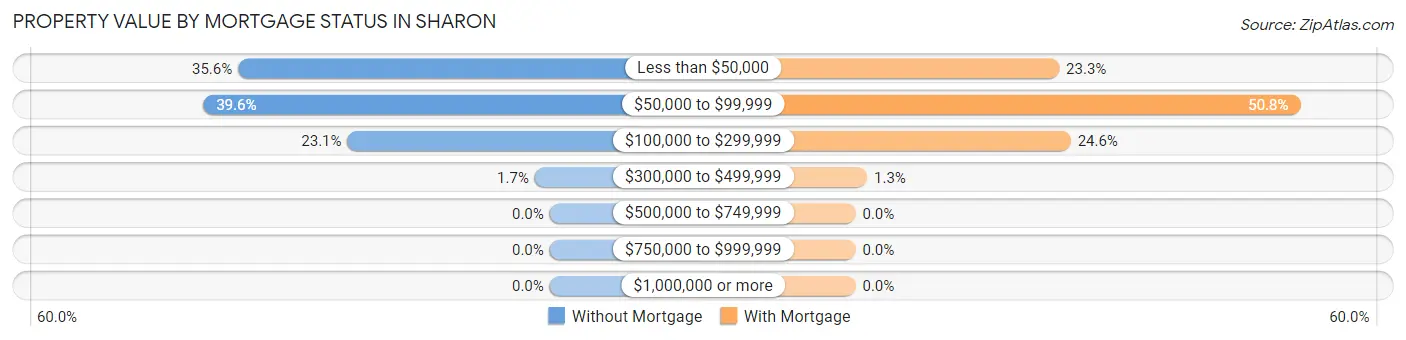
| Property Value | Without Mortgage | With Mortgage |
| Less than $50,000 | 564 (35.6%) | 407 (23.3%) |
| $50,000 to $99,999 | 627 (39.6%) | 889 (50.8%) |
| $100,000 to $299,999 | 366 (23.1%) | 430 (24.6%) |
| $300,000 to $499,999 | 27 (1.7%) | 23 (1.3%) |
| $500,000 to $749,999 | 0 (0.0%) | 0 (0.0%) |
| $750,000 to $999,999 | 0 (0.0%) | 0 (0.0%) |
| $1,000,000 or more | 0 (0.0%) | 0 (0.0%) |
| Total | 1,584 (100.0%) | 1,749 (100.0%) |
Household Income by Mortgage Status in Sharon
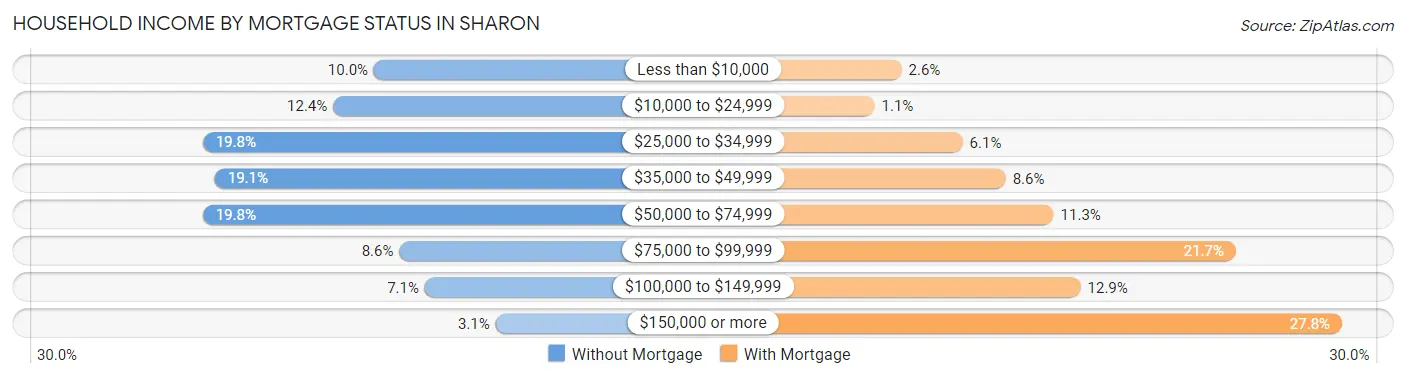
| Household Income | Without Mortgage | With Mortgage |
| Less than $10,000 | 159 (10.0%) | 46 (2.6%) |
| $10,000 to $24,999 | 196 (12.4%) | 19 (1.1%) |
| $25,000 to $34,999 | 314 (19.8%) | 107 (6.1%) |
| $35,000 to $49,999 | 303 (19.1%) | 150 (8.6%) |
| $50,000 to $74,999 | 314 (19.8%) | 198 (11.3%) |
| $75,000 to $99,999 | 136 (8.6%) | 380 (21.7%) |
| $100,000 to $149,999 | 113 (7.1%) | 225 (12.9%) |
| $150,000 or more | 49 (3.1%) | 486 (27.8%) |
| Total | 1,584 (100.0%) | 1,749 (100.0%) |
Property Value to Household Income Ratio in Sharon
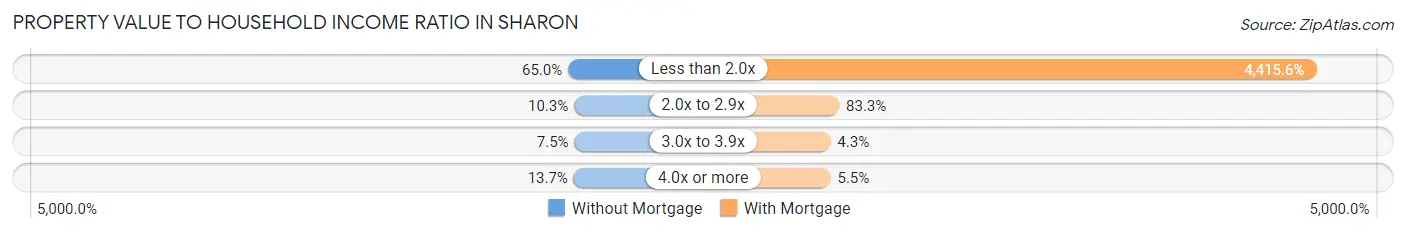
| Value-to-Income Ratio | Without Mortgage | With Mortgage |
| Less than 2.0x | 1,029 (65.0%) | 77,228 (4,415.6%) |
| 2.0x to 2.9x | 163 (10.3%) | 1,457 (83.3%) |
| 3.0x to 3.9x | 118 (7.4%) | 75 (4.3%) |
| 4.0x or more | 217 (13.7%) | 96 (5.5%) |
| Total | 1,584 (100.0%) | 1,749 (100.0%) |
Real Estate Taxes by Mortgage Status in Sharon
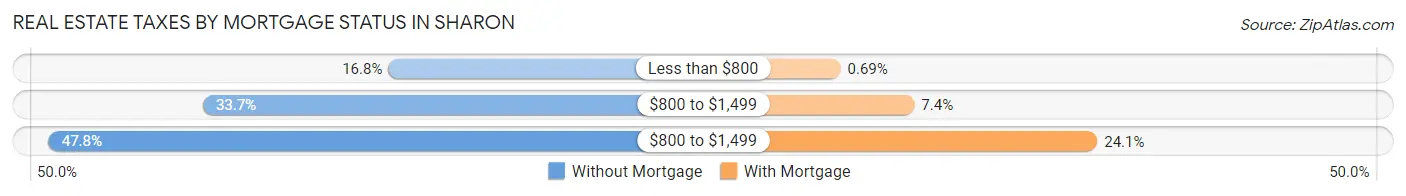
| Property Taxes | Without Mortgage | With Mortgage |
| Less than $800 | 266 (16.8%) | 12 (0.7%) |
| $800 to $1,499 | 534 (33.7%) | 130 (7.4%) |
| $800 to $1,499 | 757 (47.8%) | 422 (24.1%) |
| Total | 1,584 (100.0%) | 1,749 (100.0%) |
Health & Disability in Sharon
Health Insurance Coverage by Age in Sharon
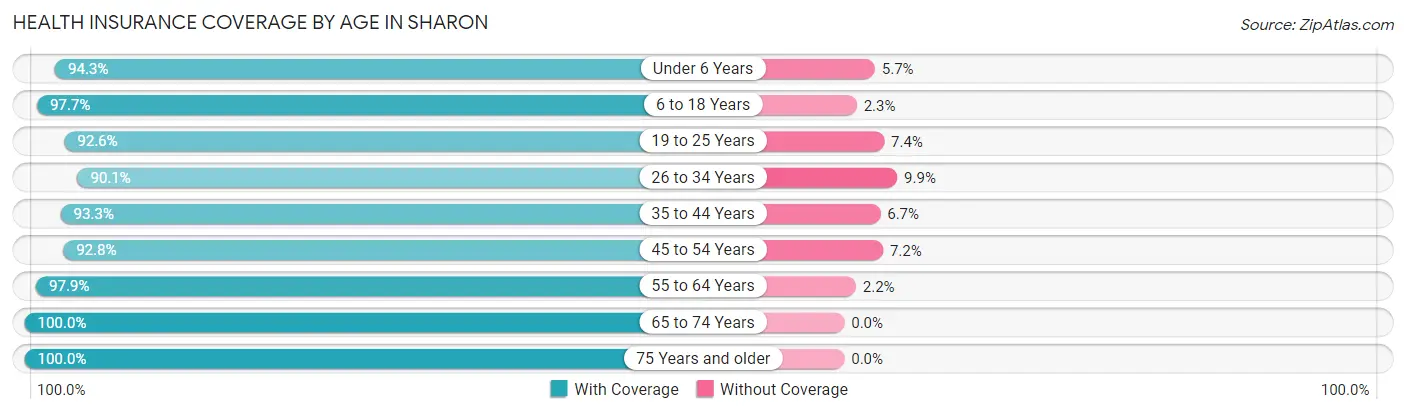
| Age Bracket | With Coverage | Without Coverage |
| Under 6 Years | 1,011 (94.3%) | 61 (5.7%) |
| 6 to 18 Years | 1,514 (97.7%) | 36 (2.3%) |
| 19 to 25 Years | 1,161 (92.6%) | 93 (7.4%) |
| 26 to 34 Years | 1,307 (90.1%) | 143 (9.9%) |
| 35 to 44 Years | 1,266 (93.3%) | 91 (6.7%) |
| 45 to 54 Years | 1,764 (92.8%) | 137 (7.2%) |
| 55 to 64 Years | 1,908 (97.9%) | 42 (2.1%) |
| 65 to 74 Years | 1,749 (100.0%) | 0 (0.0%) |
| 75 Years and older | 719 (100.0%) | 0 (0.0%) |
| Total | 12,399 (95.4%) | 603 (4.6%) |
Health Insurance Coverage by Citizenship Status in Sharon
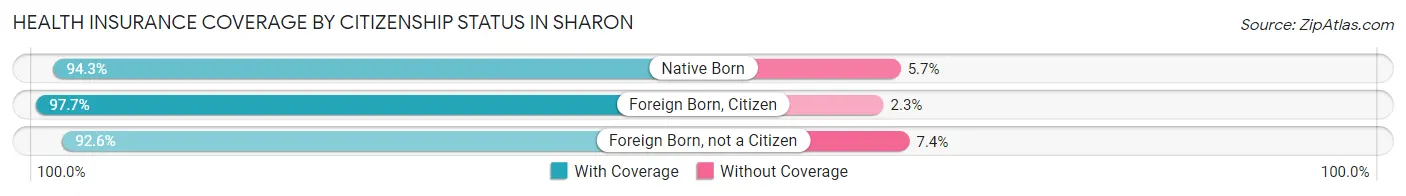
| Citizenship Status | With Coverage | Without Coverage |
| Native Born | 1,011 (94.3%) | 61 (5.7%) |
| Foreign Born, Citizen | 1,514 (97.7%) | 36 (2.3%) |
| Foreign Born, not a Citizen | 1,161 (92.6%) | 93 (7.4%) |
Health Insurance Coverage by Household Income in Sharon
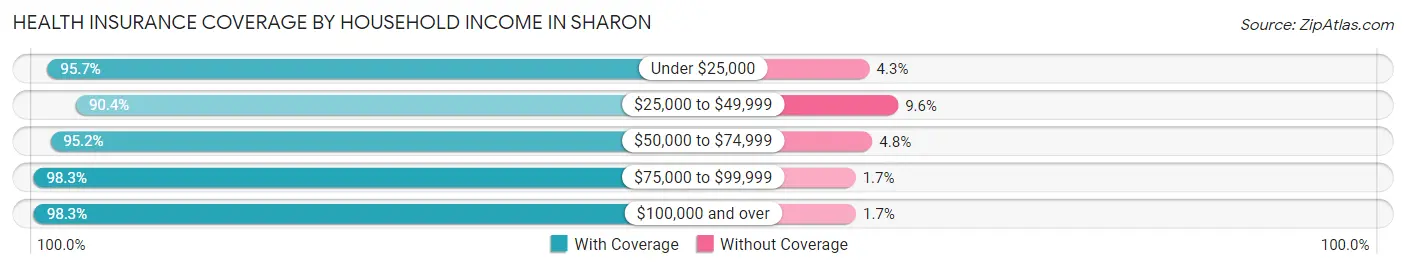
| Household Income | With Coverage | Without Coverage |
| Under $25,000 | 2,843 (95.7%) | 127 (4.3%) |
| $25,000 to $49,999 | 2,525 (90.4%) | 269 (9.6%) |
| $50,000 to $74,999 | 2,600 (95.2%) | 131 (4.8%) |
| $75,000 to $99,999 | 1,356 (98.3%) | 23 (1.7%) |
| $100,000 and over | 3,000 (98.3%) | 53 (1.7%) |
Public vs Private Health Insurance Coverage by Age in Sharon
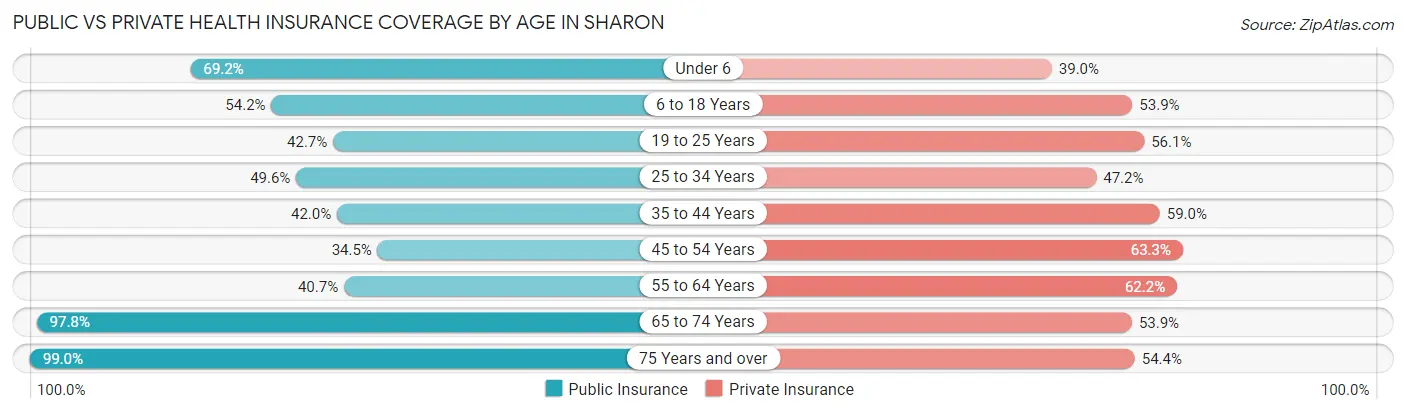
| Age Bracket | Public Insurance | Private Insurance |
| Under 6 | 742 (69.2%) | 418 (39.0%) |
| 6 to 18 Years | 840 (54.2%) | 836 (53.9%) |
| 19 to 25 Years | 536 (42.7%) | 704 (56.1%) |
| 25 to 34 Years | 719 (49.6%) | 685 (47.2%) |
| 35 to 44 Years | 570 (42.0%) | 801 (59.0%) |
| 45 to 54 Years | 655 (34.5%) | 1,203 (63.3%) |
| 55 to 64 Years | 794 (40.7%) | 1,213 (62.2%) |
| 65 to 74 Years | 1,710 (97.8%) | 942 (53.9%) |
| 75 Years and over | 712 (99.0%) | 391 (54.4%) |
| Total | 7,278 (56.0%) | 7,193 (55.3%) |
Disability Status by Sex by Age in Sharon
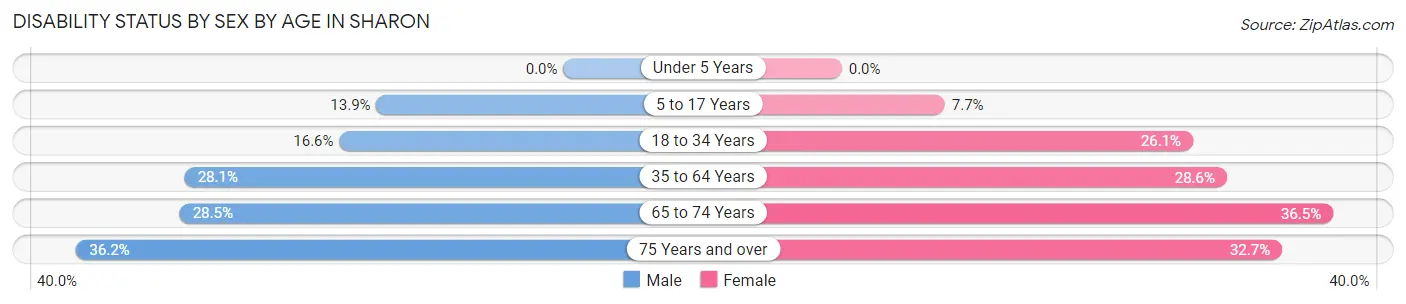
| Age Bracket | Male | Female |
| Under 5 Years | 0 (0.0%) | 0 (0.0%) |
| 5 to 17 Years | 127 (13.9%) | 60 (7.6%) |
| 18 to 34 Years | 231 (16.6%) | 365 (26.1%) |
| 35 to 64 Years | 682 (28.1%) | 795 (28.6%) |
| 65 to 74 Years | 217 (28.5%) | 360 (36.5%) |
| 75 Years and over | 94 (36.1%) | 150 (32.7%) |
Disability Class by Sex by Age in Sharon
Disability Class: Hearing Difficulty
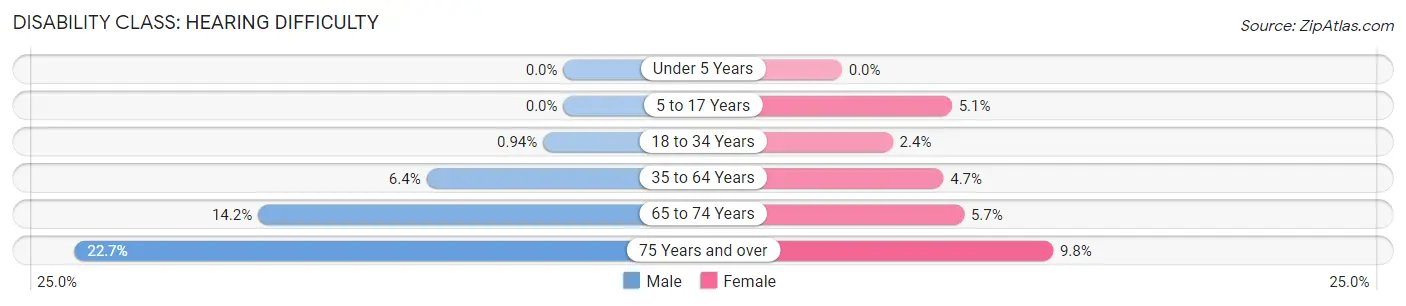
| Age Bracket | Male | Female |
| Under 5 Years | 0 (0.0%) | 0 (0.0%) |
| 5 to 17 Years | 0 (0.0%) | 40 (5.1%) |
| 18 to 34 Years | 13 (0.9%) | 33 (2.4%) |
| 35 to 64 Years | 154 (6.4%) | 131 (4.7%) |
| 65 to 74 Years | 108 (14.2%) | 56 (5.7%) |
| 75 Years and over | 59 (22.7%) | 45 (9.8%) |
Disability Class: Vision Difficulty
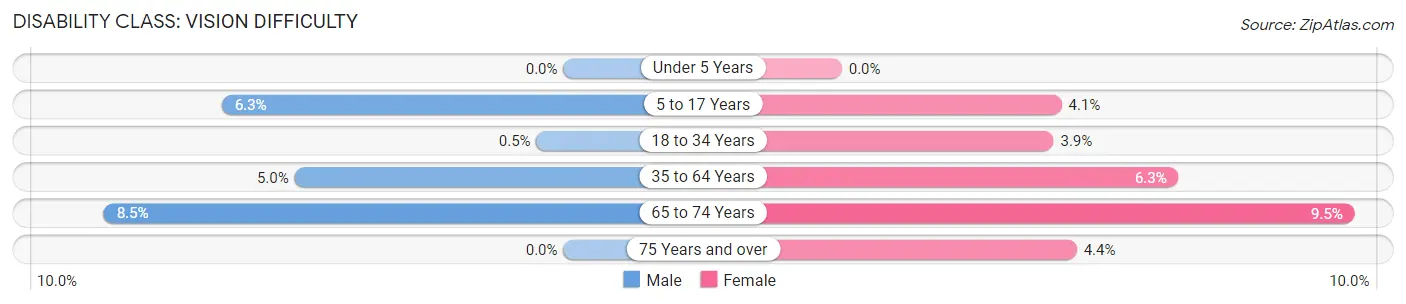
| Age Bracket | Male | Female |
| Under 5 Years | 0 (0.0%) | 0 (0.0%) |
| 5 to 17 Years | 58 (6.3%) | 32 (4.1%) |
| 18 to 34 Years | 7 (0.5%) | 55 (3.9%) |
| 35 to 64 Years | 121 (5.0%) | 174 (6.2%) |
| 65 to 74 Years | 65 (8.5%) | 94 (9.5%) |
| 75 Years and over | 0 (0.0%) | 20 (4.4%) |
Disability Class: Cognitive Difficulty
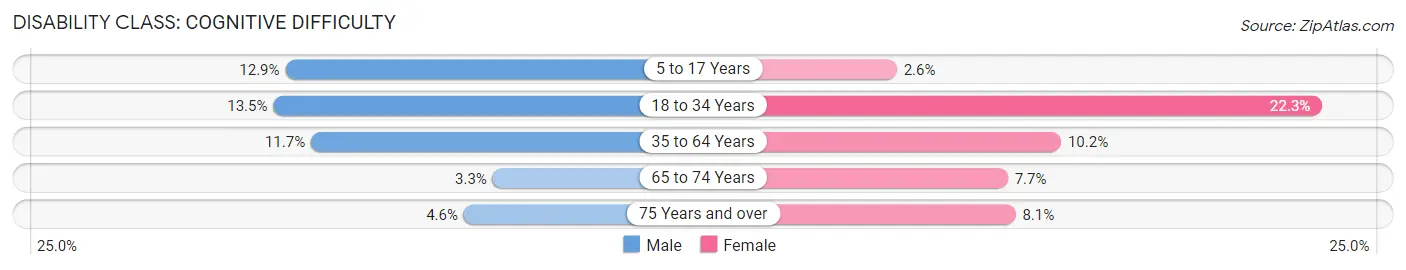
| Age Bracket | Male | Female |
| 5 to 17 Years | 118 (12.9%) | 20 (2.5%) |
| 18 to 34 Years | 187 (13.5%) | 312 (22.3%) |
| 35 to 64 Years | 284 (11.7%) | 283 (10.2%) |
| 65 to 74 Years | 25 (3.3%) | 76 (7.7%) |
| 75 Years and over | 12 (4.6%) | 37 (8.1%) |
Disability Class: Ambulatory Difficulty
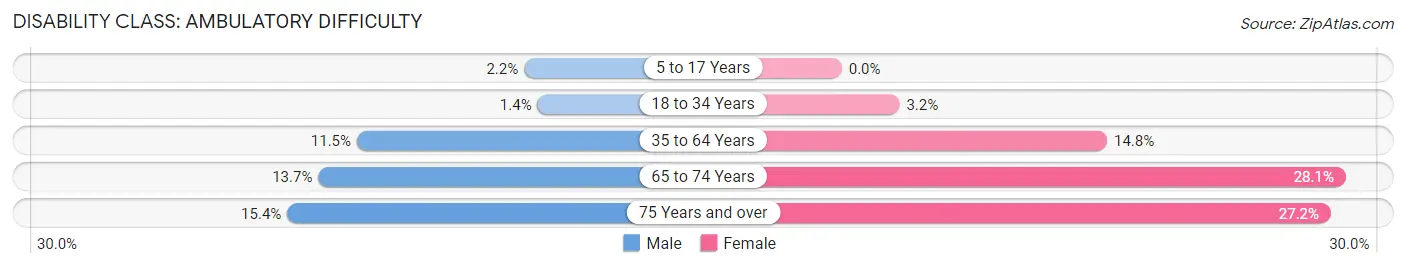
| Age Bracket | Male | Female |
| 5 to 17 Years | 20 (2.2%) | 0 (0.0%) |
| 18 to 34 Years | 20 (1.4%) | 45 (3.2%) |
| 35 to 64 Years | 279 (11.5%) | 411 (14.8%) |
| 65 to 74 Years | 104 (13.7%) | 277 (28.1%) |
| 75 Years and over | 40 (15.4%) | 125 (27.2%) |
Disability Class: Self-Care Difficulty
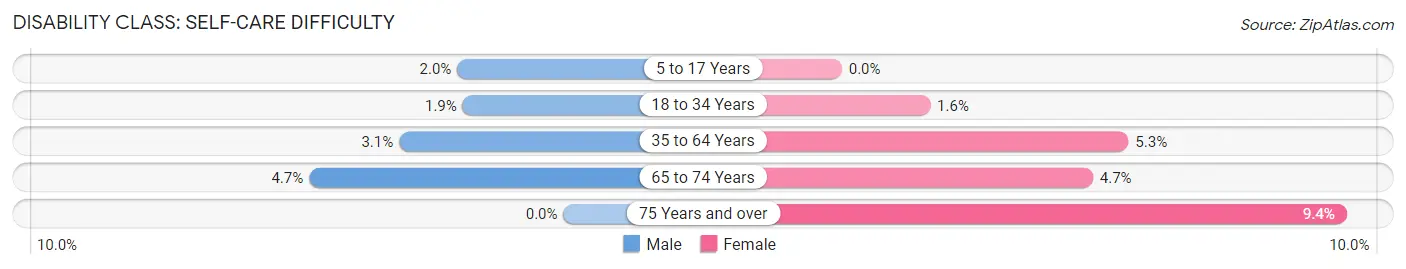
| Age Bracket | Male | Female |
| 5 to 17 Years | 18 (2.0%) | 0 (0.0%) |
| 18 to 34 Years | 26 (1.9%) | 23 (1.6%) |
| 35 to 64 Years | 74 (3.0%) | 148 (5.3%) |
| 65 to 74 Years | 36 (4.7%) | 46 (4.7%) |
| 75 Years and over | 0 (0.0%) | 43 (9.4%) |
Technology Access in Sharon
Computing Device Access in Sharon
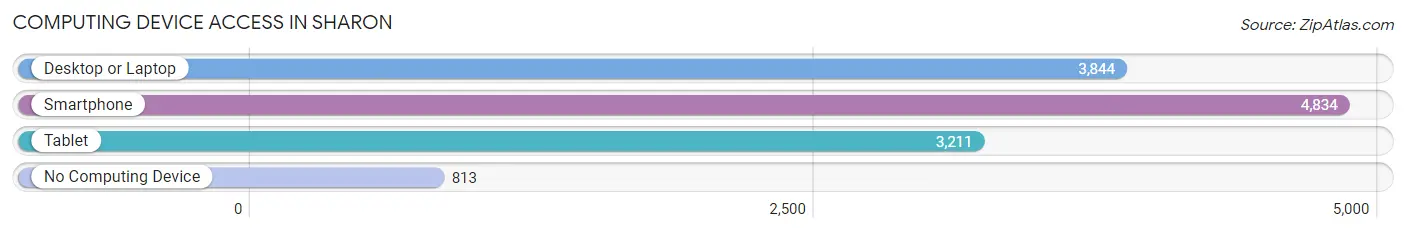
| Device Type | # Households | % Households |
| Desktop or Laptop | 3,844 | 62.6% |
| Smartphone | 4,834 | 78.7% |
| Tablet | 3,211 | 52.3% |
| No Computing Device | 813 | 13.2% |
| Total | 6,144 | 100.0% |
Internet Access in Sharon
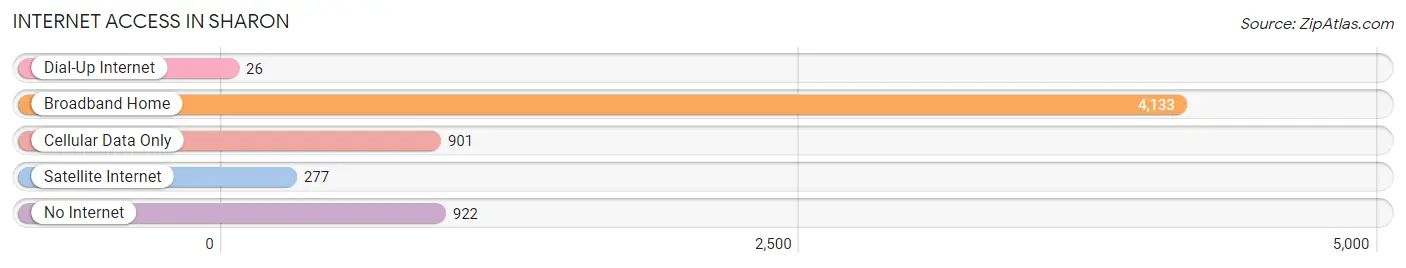
| Internet Type | # Households | % Households |
| Dial-Up Internet | 26 | 0.4% |
| Broadband Home | 4,133 | 67.3% |
| Cellular Data Only | 901 | 14.7% |
| Satellite Internet | 277 | 4.5% |
| No Internet | 922 | 15.0% |
| Total | 6,144 | 100.0% |
Sharon Summary
Sharon, Pennsylvania is a city located in Mercer County, Pennsylvania, United States. It is situated along the Shenango River, approximately 60 miles northwest of Pittsburgh. The city has a population of 14,541, according to the 2010 census.
History
The area that is now Sharon was first settled in 1795 by a group of settlers from Connecticut. The town was originally known as Sharonville, and was incorporated as a borough in 1841. The name was changed to Sharon in 1845.
The city was an important center of the iron and steel industry in the late 19th and early 20th centuries. The Sharon Iron Works, founded in 1845, was the first iron mill in the area. The city was also home to the Sharon Steel Corporation, which was founded in 1901 and was one of the largest steel producers in the United States.
Geography
Sharon is located at 41°12'N 80°33'W (41.20, -80.55). According to the United States Census Bureau, the city has a total area of 4.2 square miles (10.8 km2), all of it land.
The city is situated along the Shenango River, which flows through the city from north to south. The city is located in the foothills of the Appalachian Mountains, and is surrounded by rolling hills and forests.
Economy
Sharon is a major industrial center, with a variety of manufacturing and service industries. The city is home to several large manufacturing plants, including the Sharon Steel Corporation, which produces steel products, and the Sharon Iron Works, which produces iron products.
The city is also home to several large retail stores, including Walmart, Kmart, and Target. The city is also home to several restaurants, including Applebee's, Olive Garden, and Red Lobster.
Demographics
As of the 2010 census, there were 14,541 people, 6,093 households, and 3,717 families residing in the city. The population density was 3,478.3 people per square mile (1,345.2/km2). There were 6,717 housing units at an average density of 1,611.3 per square mile (621.7/km2). The racial makeup of the city was 87.2% White, 8.7% African American, 0.2% Native American, 0.7% Asian, 0.1% Pacific Islander, 0.7% from other races, and 2.4% from two or more races. Hispanic or Latino of any race were 2.2% of the population.
There were 6,093 households, out of which 28.2% had children under the age of 18 living with them, 39.2% were married couples living together, 16.2% had a female householder with no husband present, and 39.7% were non-families. 33.3% of all households were made up of individuals, and 15.2% had someone living alone who was 65 years of age or older. The average household size was 2.35 and the average family size was 2.97.
In the city, the population was spread out, with 24.2% under the age of 18, 8.2% from 18 to 24, 27.2% from 25 to 44, 22.2% from 45 to 64, and 18.2% who were 65 years of age or older. The median age was 38 years. For every 100 females, there were 87.2 males. For every 100 females age 18 and over, there were 82.3 males.
The median income for a household in the city was $27,917, and the median income for a family was $35,938. Males had a median income of $30,917 versus $21,917 for females. The per capita income for the city was $15,938. About 14.2% of families and 17.7% of the population were below the poverty line, including 25.2% of those under age 18 and 11.2% of those age 65 or over.
Common Questions
What is Per Capita Income in Sharon?
Per Capita income in Sharon is $25,268.
What is the Median Family Income in Sharon?
Median Family Income in Sharon is $61,057.
What is the Median Household income in Sharon?
Median Household Income in Sharon is $40,089.
What is Income or Wage Gap in Sharon?
Income or Wage Gap in Sharon is 17.3%.
Women in Sharon earn 82.7 cents for every dollar earned by a man.
What is Inequality or Gini Index in Sharon?
Inequality or Gini Index in Sharon is 0.44.
What is the Total Population of Sharon?
Total Population of Sharon is 13,143.
What is the Total Male Population of Sharon?
Total Male Population of Sharon is 6,261.
What is the Total Female Population of Sharon?
Total Female Population of Sharon is 6,882.
What is the Ratio of Males per 100 Females in Sharon?
There are 90.98 Males per 100 Females in Sharon.
What is the Ratio of Females per 100 Males in Sharon?
There are 109.92 Females per 100 Males in Sharon.
What is the Median Population Age in Sharon?
Median Population Age in Sharon is 43.8 Years.
What is the Average Family Size in Sharon
Average Family Size in Sharon is 2.9 People.
What is the Average Household Size in Sharon
Average Household Size in Sharon is 2.1 People.
How Large is the Labor Force in Sharon?
There are 6,101 People in the Labor Forcein in Sharon.
What is the Percentage of People in the Labor Force in Sharon?
56.2% of People are in the Labor Force in Sharon.
What is the Unemployment Rate in Sharon?
Unemployment Rate in Sharon is 7.4%.