Pittsburgh, PA Map & Demographics
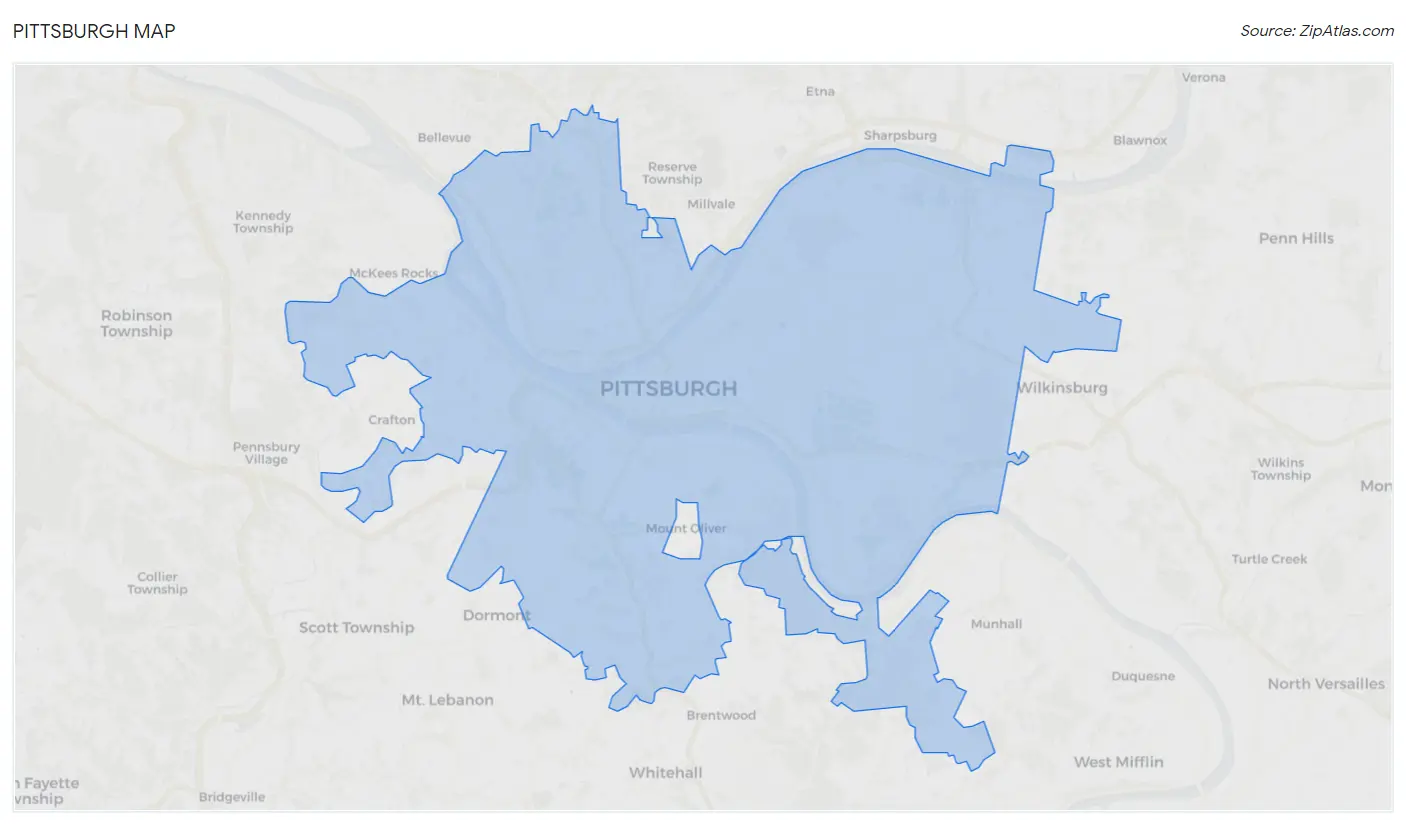
Pittsburgh Map
Pittsburgh Overview
$41,146
PER CAPITA INCOME
$85,816
AVG FAMILY INCOME
$60,187
AVG HOUSEHOLD INCOME
28.4%
WAGE / INCOME GAP [ % ]
71.6¢/ $1
WAGE / INCOME GAP [ $ ]
$11,665
FAMILY INCOME DEFICIT
0.51
INEQUALITY / GINI INDEX
303,843
TOTAL POPULATION
148,973
MALE POPULATION
154,870
FEMALE POPULATION
96.19
MALES / 100 FEMALES
103.96
FEMALES / 100 MALES
33.5
MEDIAN AGE
2.9
AVG FAMILY SIZE
2.0
AVG HOUSEHOLD SIZE
169,898
LABOR FORCE [ PEOPLE ]
64.3%
PERCENT IN LABOR FORCE
5.7%
UNEMPLOYMENT RATE
Pittsburgh Zip Codes
Income in Pittsburgh
Income Overview in Pittsburgh
Per Capita Income in Pittsburgh is $41,146, while median incomes of families and households are $85,816 and $60,187 respectively.
| Characteristic | Number | Measure |
| Per Capita Income | 303,843 | $41,146 |
| Median Family Income | 57,487 | $85,816 |
| Mean Family Income | 57,487 | $118,614 |
| Median Household Income | 137,226 | $60,187 |
| Mean Household Income | 137,226 | $87,811 |
| Income Deficit | 57,487 | $11,665 |
| Wage / Income Gap (%) | 303,843 | 28.36% |
| Wage / Income Gap ($) | 303,843 | 71.64¢ per $1 |
| Gini / Inequality Index | 303,843 | 0.51 |
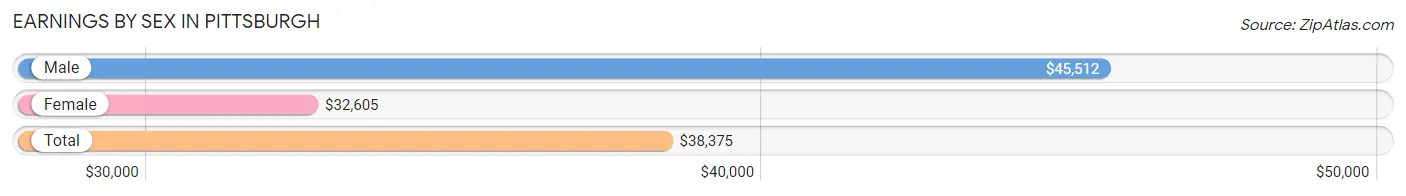
Earnings by Sex in Pittsburgh
Average Earnings in Pittsburgh are $38,375, $45,512 for men and $32,605 for women, a difference of 28.4%.
| Sex | Number | Average Earnings |
| Male | 93,699 (50.5%) | $45,512 |
| Female | 91,764 (49.5%) | $32,605 |
| Total | 185,463 (100.0%) | $38,375 |
Earnings by Sex by Income Bracket in Pittsburgh
The most common earnings brackets in Pittsburgh are $100,000+ for men (16,248 | 17.3%) and $2,499 or less for women (8,043 | 8.8%).
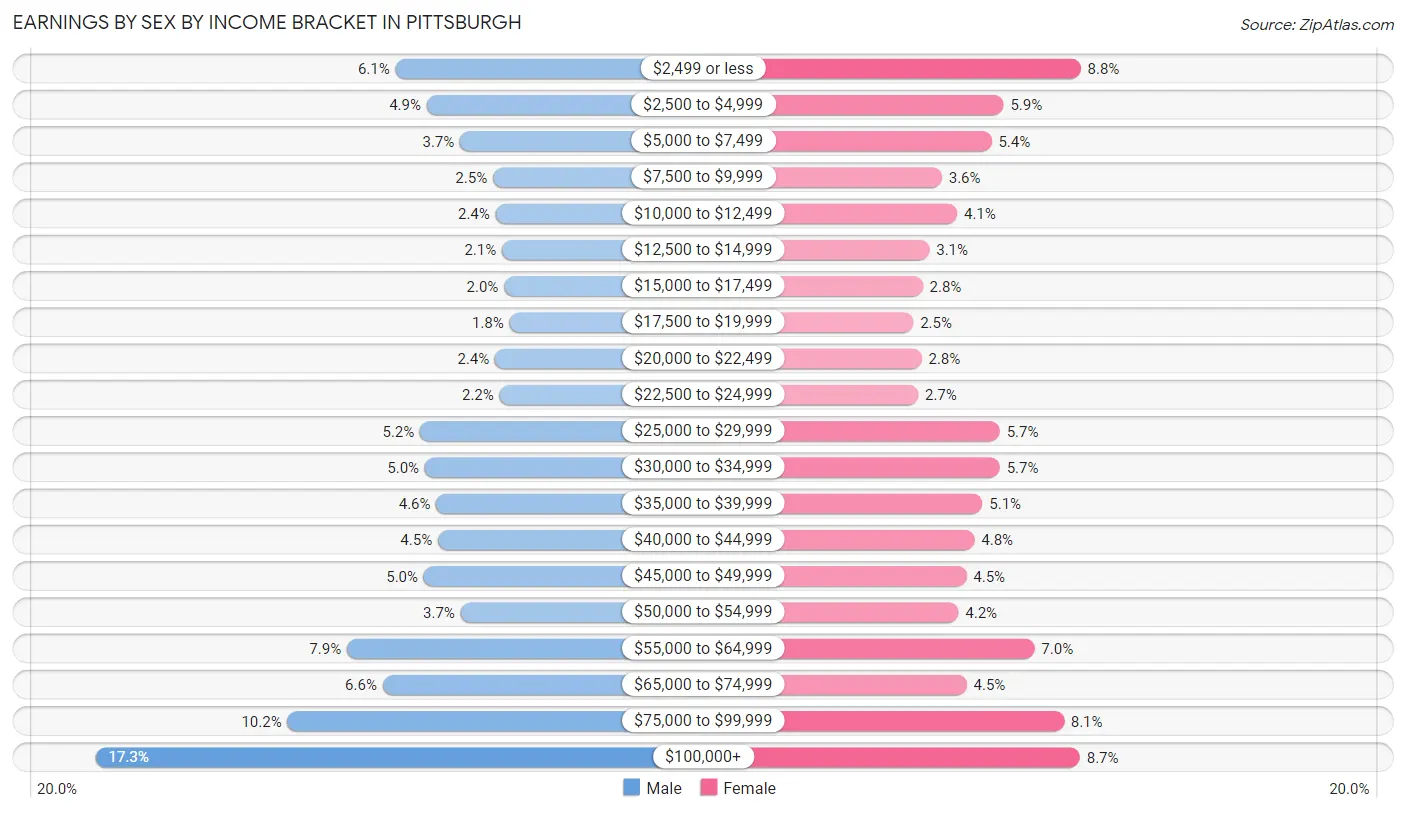
| Income | Male | Female |
| $2,499 or less | 5,713 (6.1%) | 8,043 (8.8%) |
| $2,500 to $4,999 | 4,622 (4.9%) | 5,389 (5.9%) |
| $5,000 to $7,499 | 3,450 (3.7%) | 4,978 (5.4%) |
| $7,500 to $9,999 | 2,300 (2.5%) | 3,267 (3.6%) |
| $10,000 to $12,499 | 2,203 (2.4%) | 3,788 (4.1%) |
| $12,500 to $14,999 | 1,980 (2.1%) | 2,835 (3.1%) |
| $15,000 to $17,499 | 1,898 (2.0%) | 2,608 (2.8%) |
| $17,500 to $19,999 | 1,711 (1.8%) | 2,281 (2.5%) |
| $20,000 to $22,499 | 2,218 (2.4%) | 2,573 (2.8%) |
| $22,500 to $24,999 | 2,064 (2.2%) | 2,449 (2.7%) |
| $25,000 to $29,999 | 4,849 (5.2%) | 5,255 (5.7%) |
| $30,000 to $34,999 | 4,689 (5.0%) | 5,257 (5.7%) |
| $35,000 to $39,999 | 4,280 (4.6%) | 4,658 (5.1%) |
| $40,000 to $44,999 | 4,229 (4.5%) | 4,389 (4.8%) |
| $45,000 to $49,999 | 4,718 (5.0%) | 4,113 (4.5%) |
| $50,000 to $54,999 | 3,434 (3.7%) | 3,836 (4.2%) |
| $55,000 to $64,999 | 7,419 (7.9%) | 6,451 (7.0%) |
| $65,000 to $74,999 | 6,161 (6.6%) | 4,117 (4.5%) |
| $75,000 to $99,999 | 9,513 (10.2%) | 7,463 (8.1%) |
| $100,000+ | 16,248 (17.3%) | 8,014 (8.7%) |
| Total | 93,699 (100.0%) | 91,764 (100.0%) |
Earnings by Sex by Educational Attainment in Pittsburgh
Average earnings in Pittsburgh are $55,566 for men and $42,463 for women, a difference of 23.6%. Men with an educational attainment of graduate degree enjoy the highest average annual earnings of $82,697, while those with less than high school education earn the least with $28,842. Women with an educational attainment of graduate degree earn the most with the average annual earnings of $65,512, while those with less than high school education have the smallest earnings of $24,302.
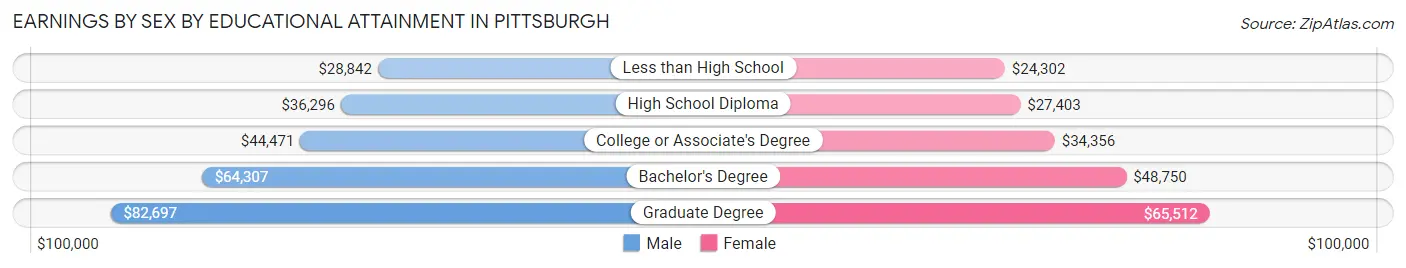
| Educational Attainment | Male Income | Female Income |
| Less than High School | $28,842 | $24,302 |
| High School Diploma | $36,296 | $27,403 |
| College or Associate's Degree | $44,471 | $34,356 |
| Bachelor's Degree | $64,307 | $48,750 |
| Graduate Degree | $82,697 | $65,512 |
| Total | $55,566 | $42,463 |
Family Income in Pittsburgh
Family Income Brackets in Pittsburgh
According to the Pittsburgh family income data, there are 10,750 families falling into the $100,000 to $149,999 income range, which is the most common income bracket and makes up 18.7% of all families. Conversely, the $10,000 to $14,999 income bracket is the least frequent group with only 1,610 families (2.8%) belonging to this category.
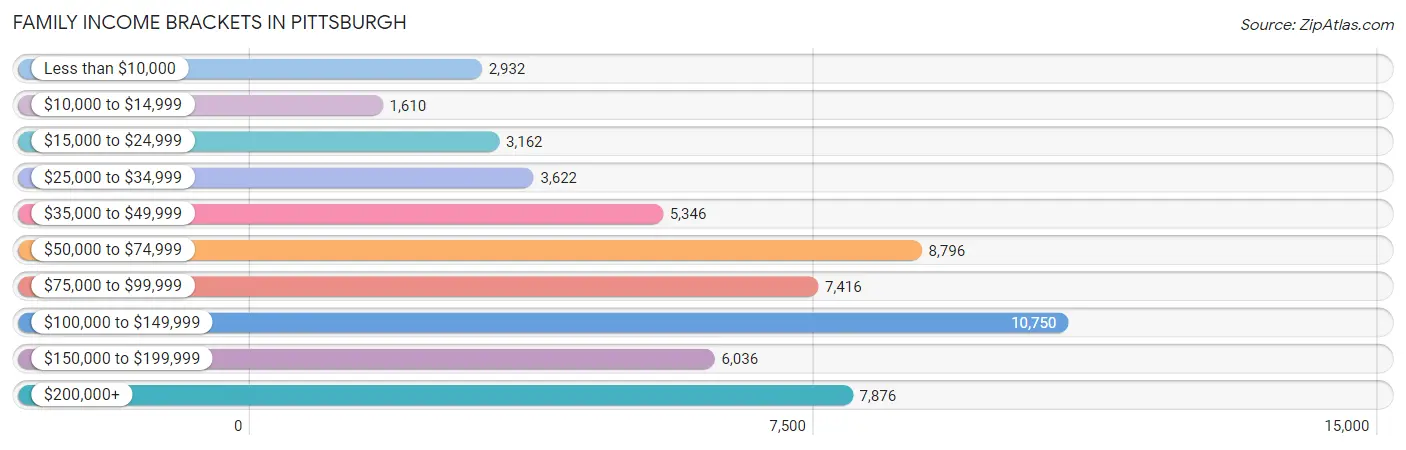
| Income Bracket | # Families | % Families |
| Less than $10,000 | 2,932 | 5.1% |
| $10,000 to $14,999 | 1,610 | 2.8% |
| $15,000 to $24,999 | 3,162 | 5.5% |
| $25,000 to $34,999 | 3,622 | 6.3% |
| $35,000 to $49,999 | 5,346 | 9.3% |
| $50,000 to $74,999 | 8,796 | 15.3% |
| $75,000 to $99,999 | 7,416 | 12.9% |
| $100,000 to $149,999 | 10,750 | 18.7% |
| $150,000 to $199,999 | 6,036 | 10.5% |
| $200,000+ | 7,876 | 13.7% |
Family Income by Famaliy Size in Pittsburgh
6-person families (894 | 1.6%) account for the highest median family income in Pittsburgh with $112,803 per family, while 2-person families (31,837 | 55.4%) have the highest median income of $40,120 per family member.
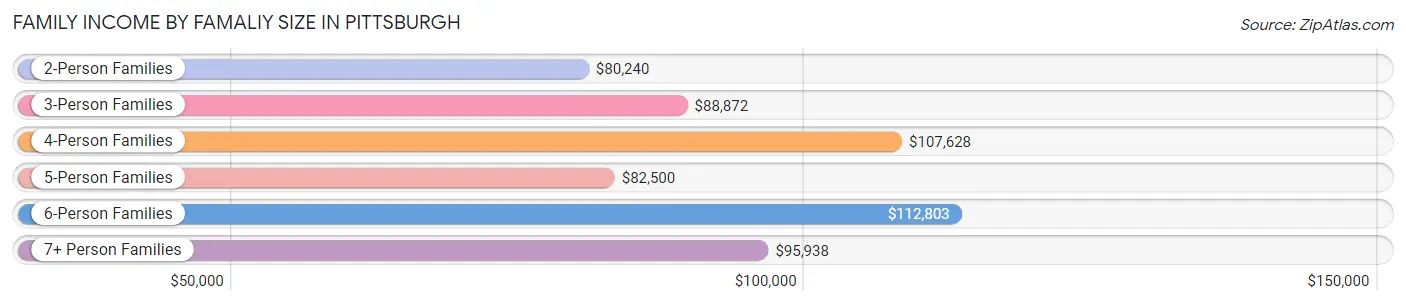
| Income Bracket | # Families | Median Income |
| 2-Person Families | 31,837 (55.4%) | $80,240 |
| 3-Person Families | 13,057 (22.7%) | $88,872 |
| 4-Person Families | 8,107 (14.1%) | $107,628 |
| 5-Person Families | 2,936 (5.1%) | $82,500 |
| 6-Person Families | 894 (1.6%) | $112,803 |
| 7+ Person Families | 656 (1.1%) | $95,938 |
| Total | 57,487 (100.0%) | $85,816 |
Family Income by Number of Earners in Pittsburgh
The median family income in Pittsburgh is $85,816, with families comprising 3+ earners (4,924) having the highest median family income of $140,795, while families with no earners (8,552) have the lowest median family income of $37,000, accounting for 8.6% and 14.9% of families, respectively.
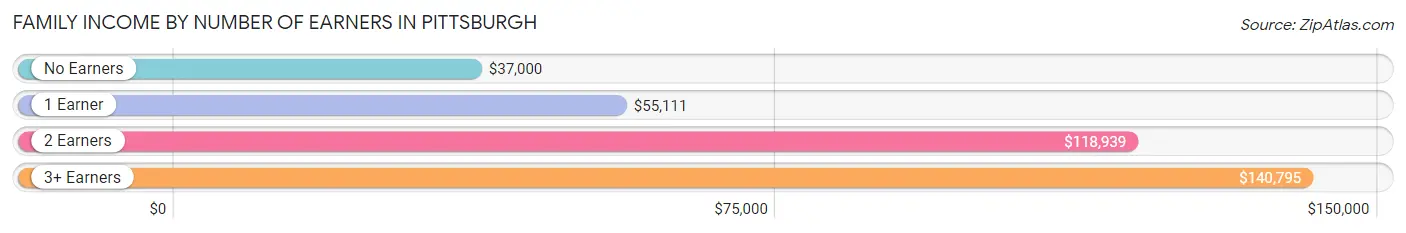
| Number of Earners | # Families | Median Income |
| No Earners | 8,552 (14.9%) | $37,000 |
| 1 Earner | 19,120 (33.3%) | $55,111 |
| 2 Earners | 24,891 (43.3%) | $118,939 |
| 3+ Earners | 4,924 (8.6%) | $140,795 |
| Total | 57,487 (100.0%) | $85,816 |
Household Income in Pittsburgh
Household Income Brackets in Pittsburgh
With 21,956 households falling in the category, the $50,000 to $74,999 income range is the most frequent in Pittsburgh, accounting for 16.0% of all households. In contrast, only 8,508 households (6.2%) fall into the $10,000 to $14,999 income bracket, making it the least populous group.
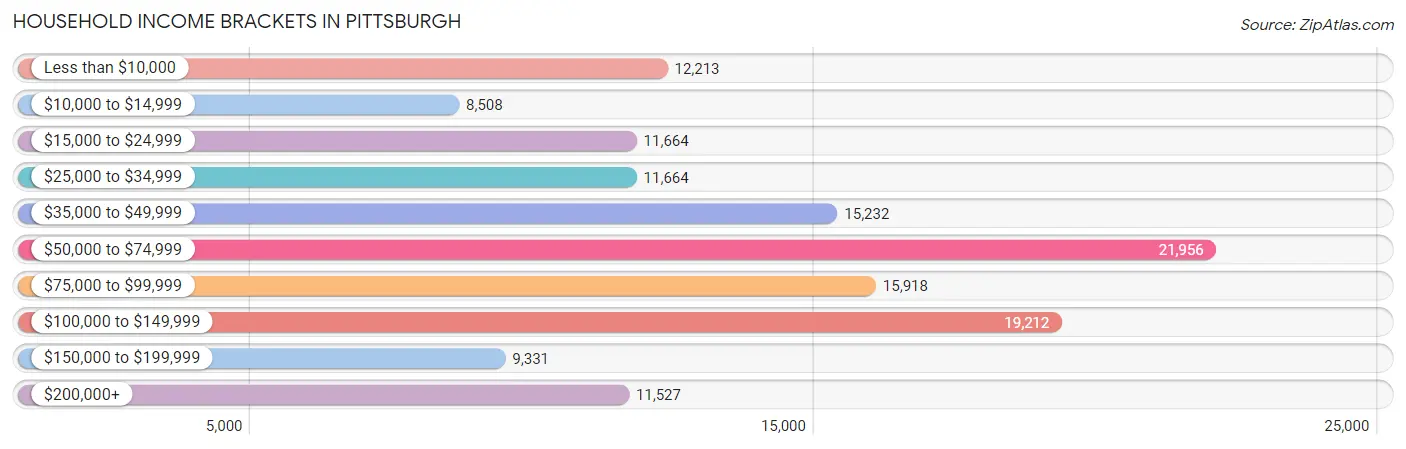
| Income Bracket | # Households | % Households |
| Less than $10,000 | 12,213 | 8.9% |
| $10,000 to $14,999 | 8,508 | 6.2% |
| $15,000 to $24,999 | 11,664 | 8.5% |
| $25,000 to $34,999 | 11,664 | 8.5% |
| $35,000 to $49,999 | 15,232 | 11.1% |
| $50,000 to $74,999 | 21,956 | 16.0% |
| $75,000 to $99,999 | 15,918 | 11.6% |
| $100,000 to $149,999 | 19,212 | 14.0% |
| $150,000 to $199,999 | 9,331 | 6.8% |
| $200,000+ | 11,527 | 8.4% |
Household Income by Householder Age in Pittsburgh
The median household income in Pittsburgh is $60,187, with the highest median household income of $73,212 found in the 25 to 44 years age bracket for the primary householder. A total of 55,840 households (40.7%) fall into this category. Meanwhile, the 15 to 24 years age bracket for the primary householder has the lowest median household income of $25,118, with 11,130 households (8.1%) in this group.
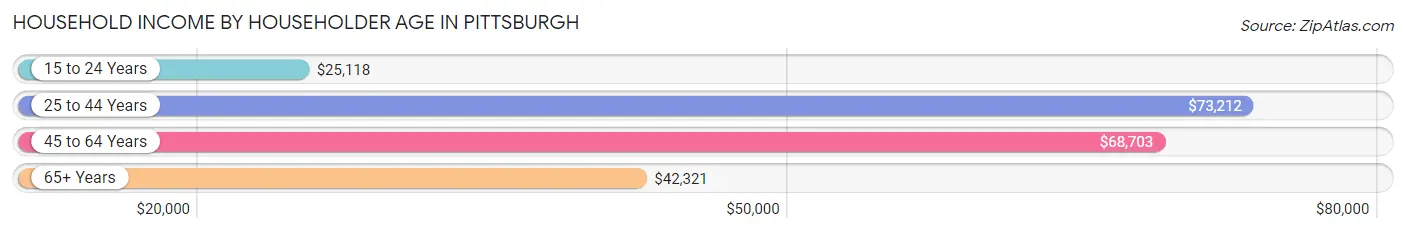
| Income Bracket | # Households | Median Income |
| 15 to 24 Years | 11,130 (8.1%) | $25,118 |
| 25 to 44 Years | 55,840 (40.7%) | $73,212 |
| 45 to 64 Years | 38,870 (28.3%) | $68,703 |
| 65+ Years | 31,386 (22.9%) | $42,321 |
| Total | 137,226 (100.0%) | $60,187 |
Poverty in Pittsburgh
Income Below Poverty by Sex and Age in Pittsburgh
With 17.5% poverty level for males and 21.3% for females among the residents of Pittsburgh, 5 year old males and 18 to 24 year old females are the most vulnerable to poverty, with 581 males (38.5%) and 8,398 females (48.6%) in their respective age groups living below the poverty level.
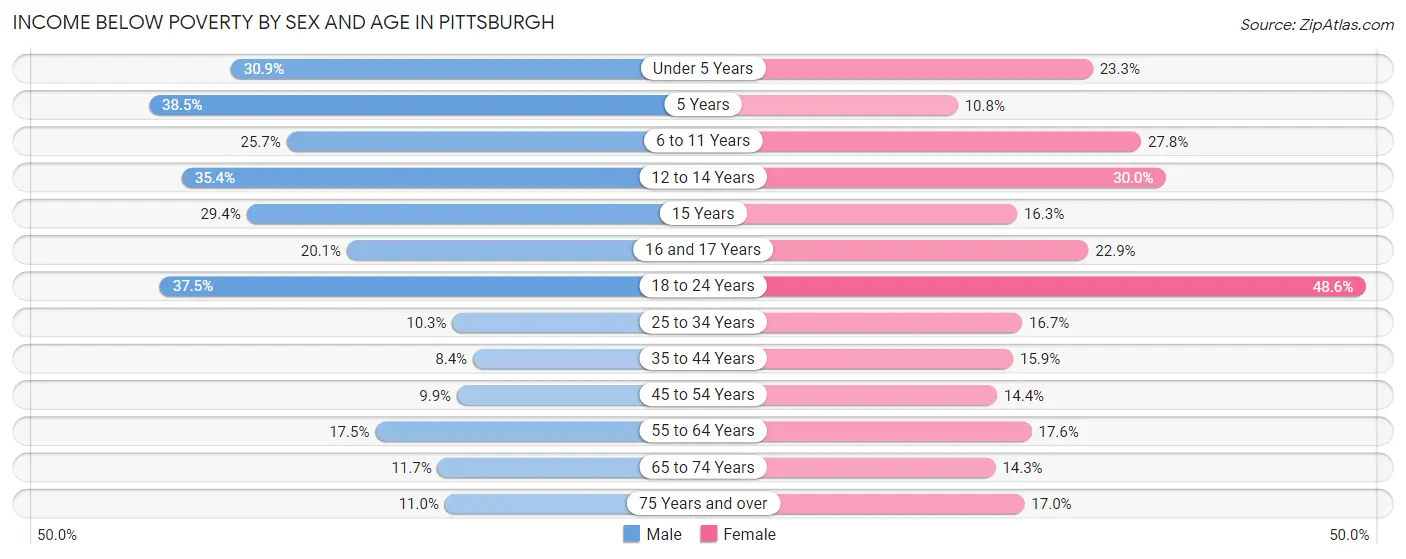
| Age Bracket | Male | Female |
| Under 5 Years | 2,186 (30.9%) | 1,485 (23.3%) |
| 5 Years | 581 (38.5%) | 89 (10.8%) |
| 6 to 11 Years | 1,712 (25.7%) | 1,950 (27.8%) |
| 12 to 14 Years | 1,413 (35.4%) | 978 (30.0%) |
| 15 Years | 417 (29.4%) | 147 (16.3%) |
| 16 and 17 Years | 456 (20.1%) | 518 (22.9%) |
| 18 to 24 Years | 6,282 (37.4%) | 8,398 (48.6%) |
| 25 to 34 Years | 3,286 (10.3%) | 5,154 (16.7%) |
| 35 to 44 Years | 1,558 (8.4%) | 2,776 (15.9%) |
| 45 to 54 Years | 1,362 (9.9%) | 1,982 (14.4%) |
| 55 to 64 Years | 2,841 (17.5%) | 3,067 (17.6%) |
| 65 to 74 Years | 1,362 (11.7%) | 2,052 (14.3%) |
| 75 Years and over | 709 (11.0%) | 1,930 (17.0%) |
| Total | 24,165 (17.5%) | 30,526 (21.3%) |
Income Above Poverty by Sex and Age in Pittsburgh
According to the poverty statistics in Pittsburgh, males aged 35 to 44 years and females aged 5 years are the age groups that are most secure financially, with 91.6% of males and 89.2% of females in these age groups living above the poverty line.
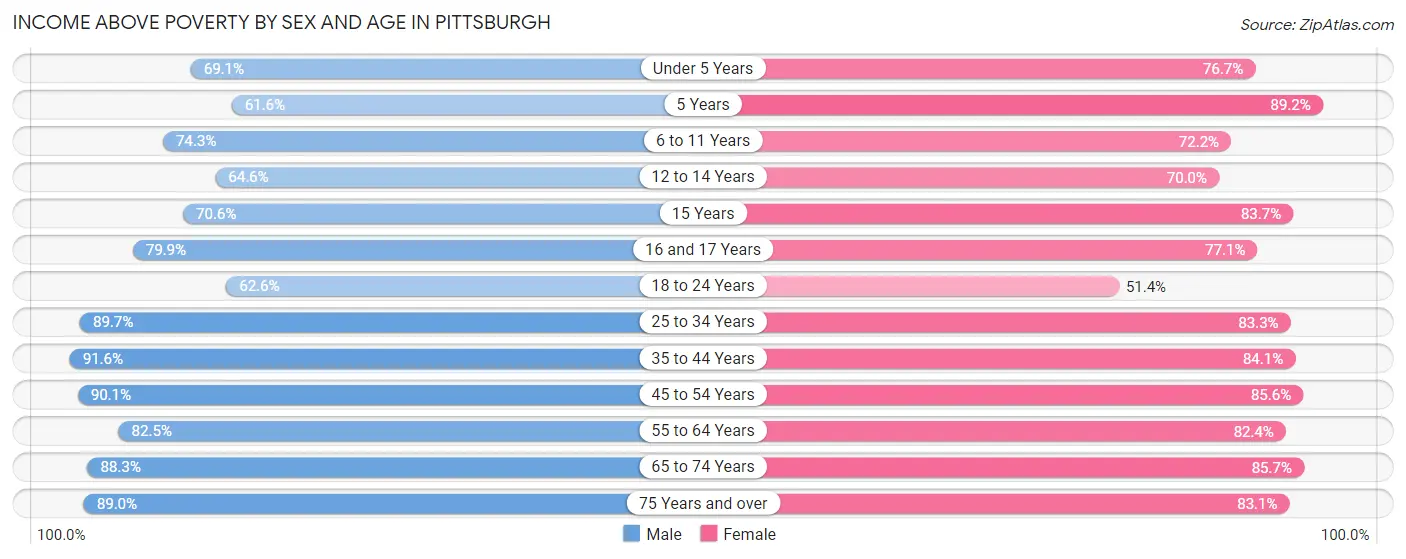
| Age Bracket | Male | Female |
| Under 5 Years | 4,898 (69.1%) | 4,891 (76.7%) |
| 5 Years | 930 (61.6%) | 738 (89.2%) |
| 6 to 11 Years | 4,952 (74.3%) | 5,069 (72.2%) |
| 12 to 14 Years | 2,577 (64.6%) | 2,280 (70.0%) |
| 15 Years | 1,001 (70.6%) | 757 (83.7%) |
| 16 and 17 Years | 1,814 (79.9%) | 1,745 (77.1%) |
| 18 to 24 Years | 10,494 (62.5%) | 8,896 (51.4%) |
| 25 to 34 Years | 28,632 (89.7%) | 25,656 (83.3%) |
| 35 to 44 Years | 17,003 (91.6%) | 14,691 (84.1%) |
| 45 to 54 Years | 12,430 (90.1%) | 11,779 (85.6%) |
| 55 to 64 Years | 13,433 (82.5%) | 14,350 (82.4%) |
| 65 to 74 Years | 10,303 (88.3%) | 12,342 (85.7%) |
| 75 Years and over | 5,729 (89.0%) | 9,459 (83.1%) |
| Total | 114,196 (82.5%) | 112,653 (78.7%) |
Income Below Poverty Among Married-Couple Families in Pittsburgh
The poverty statistics for married-couple families in Pittsburgh show that 3.5% or 1,288 of the total 37,058 families live below the poverty line. Families with 5 or more children have the highest poverty rate of 40.8%, comprising of 78 families. On the other hand, families with no children have the lowest poverty rate of 2.9%, which includes 712 families.
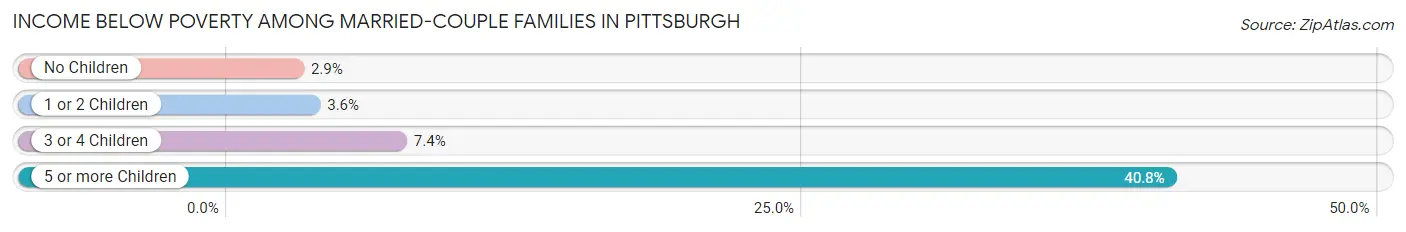
| Children | Above Poverty | Below Poverty |
| No Children | 24,059 (97.1%) | 712 (2.9%) |
| 1 or 2 Children | 9,996 (96.4%) | 371 (3.6%) |
| 3 or 4 Children | 1,602 (92.6%) | 127 (7.3%) |
| 5 or more Children | 113 (59.2%) | 78 (40.8%) |
| Total | 35,770 (96.5%) | 1,288 (3.5%) |
Income Below Poverty Among Single-Parent Households in Pittsburgh
According to the poverty data in Pittsburgh, 12.0% or 547 single-father households and 31.1% or 4,933 single-mother households are living below the poverty line. Among single-father households, those with 3 or 4 children have the highest poverty rate, with 108 households (52.2%) experiencing poverty. Likewise, among single-mother households, those with 5 or more children have the highest poverty rate, with 145 households (91.8%) falling below the poverty line.
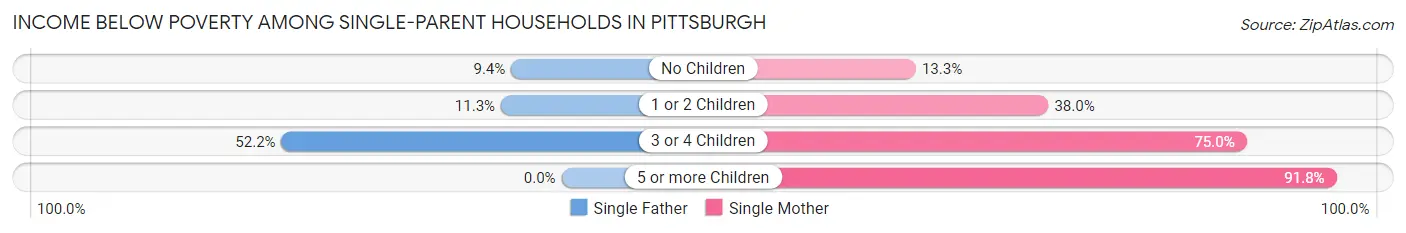
| Children | Single Father | Single Mother |
| No Children | 219 (9.4%) | 898 (13.3%) |
| 1 or 2 Children | 220 (11.3%) | 2,893 (38.0%) |
| 3 or 4 Children | 108 (52.2%) | 997 (75.0%) |
| 5 or more Children | 0 (0.0%) | 145 (91.8%) |
| Total | 547 (12.0%) | 4,933 (31.1%) |
Income Below Poverty Among Married-Couple vs Single-Parent Households in Pittsburgh
The poverty data for Pittsburgh shows that 1,288 of the married-couple family households (3.5%) and 5,480 of the single-parent households (26.8%) are living below the poverty level. Within the married-couple family households, those with 5 or more children have the highest poverty rate, with 78 households (40.8%) falling below the poverty line. Among the single-parent households, those with 3 or 4 children have the highest poverty rate, with 1,105 household (71.9%) living below poverty.
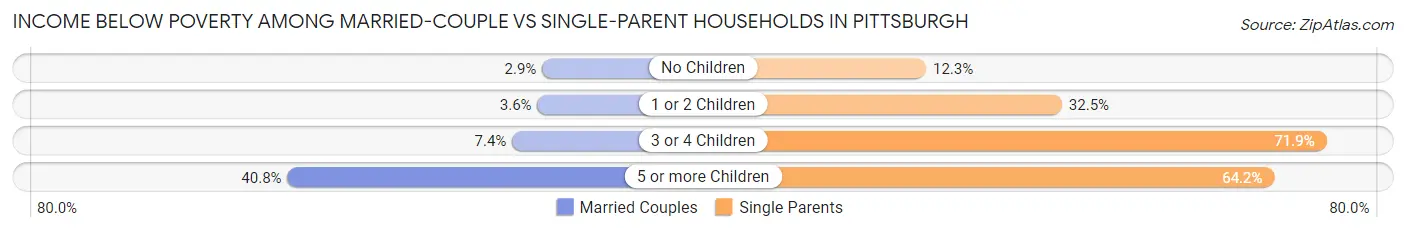
| Children | Married-Couple Families | Single-Parent Households |
| No Children | 712 (2.9%) | 1,117 (12.3%) |
| 1 or 2 Children | 371 (3.6%) | 3,113 (32.5%) |
| 3 or 4 Children | 127 (7.3%) | 1,105 (71.9%) |
| 5 or more Children | 78 (40.8%) | 145 (64.2%) |
| Total | 1,288 (3.5%) | 5,480 (26.8%) |
Race in Pittsburgh
The most populous races in Pittsburgh are White / Caucasian (195,864 | 64.5%), Black / African American (70,584 | 23.2%), and Asian (17,037 | 5.6%).
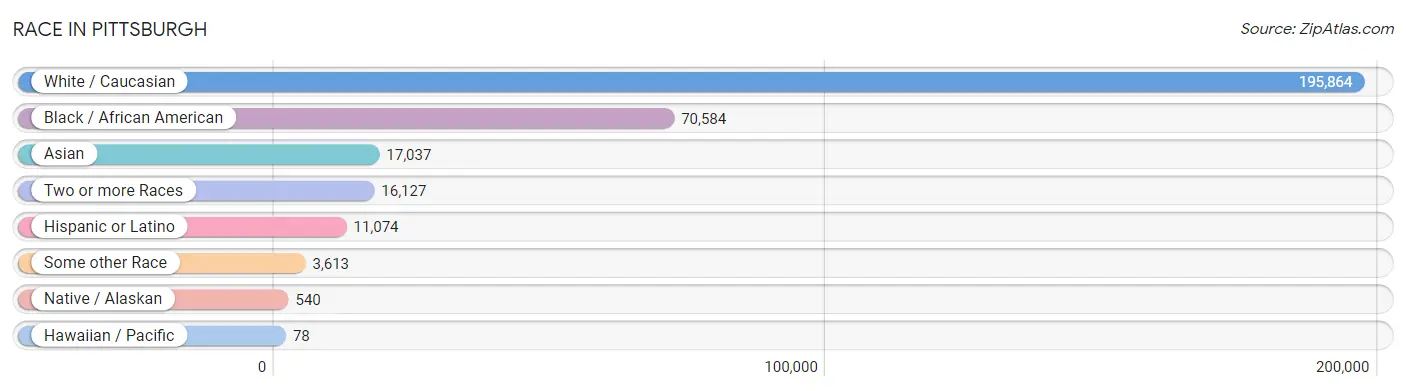
| Race | # Population | % Population |
| Asian | 17,037 | 5.6% |
| Black / African American | 70,584 | 23.2% |
| Hawaiian / Pacific | 78 | 0.0% |
| Hispanic or Latino | 11,074 | 3.6% |
| Native / Alaskan | 540 | 0.2% |
| White / Caucasian | 195,864 | 64.5% |
| Two or more Races | 16,127 | 5.3% |
| Some other Race | 3,613 | 1.2% |
| Total | 303,843 | 100.0% |
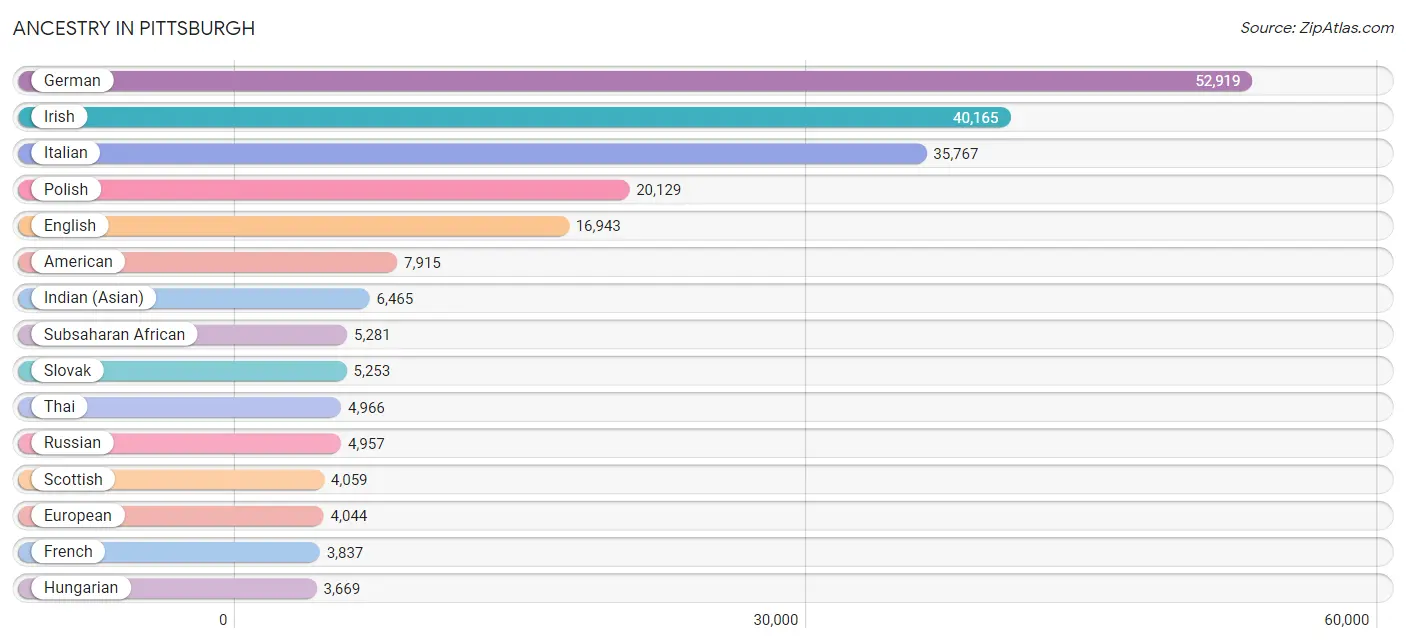
Ancestry in Pittsburgh
The most populous ancestries reported in Pittsburgh are German (52,919 | 17.4%), Irish (40,165 | 13.2%), Italian (35,767 | 11.8%), Polish (20,129 | 6.6%), and English (16,943 | 5.6%), together accounting for 54.6% of all Pittsburgh residents.
| Ancestry | # Population | % Population |
| Afghan | 66 | 0.0% |
| African | 2,961 | 1.0% |
| Alaska Native | 22 | 0.0% |
| Albanian | 84 | 0.0% |
| Alsatian | 12 | 0.0% |
| American | 7,915 | 2.6% |
| Apache | 51 | 0.0% |
| Arab | 3,261 | 1.1% |
| Argentinean | 352 | 0.1% |
| Armenian | 133 | 0.0% |
| Assyrian / Chaldean / Syriac | 5 | 0.0% |
| Australian | 191 | 0.1% |
| Austrian | 1,138 | 0.4% |
| Bahamian | 201 | 0.1% |
| Barbadian | 98 | 0.0% |
| Basque | 27 | 0.0% |
| Belgian | 162 | 0.1% |
| Bhutanese | 951 | 0.3% |
| Blackfeet | 246 | 0.1% |
| Bolivian | 20 | 0.0% |
| Brazilian | 279 | 0.1% |
| British | 1,580 | 0.5% |
| British West Indian | 3 | 0.0% |
| Bulgarian | 102 | 0.0% |
| Burmese | 2,052 | 0.7% |
| Cajun | 10 | 0.0% |
| Cambodian | 36 | 0.0% |
| Canadian | 535 | 0.2% |
| Cape Verdean | 54 | 0.0% |
| Carpatho Rusyn | 83 | 0.0% |
| Celtic | 31 | 0.0% |
| Central American | 1,042 | 0.3% |
| Central American Indian | 152 | 0.1% |
| Cherokee | 704 | 0.2% |
| Chickasaw | 28 | 0.0% |
| Chilean | 76 | 0.0% |
| Chippewa | 23 | 0.0% |
| Choctaw | 40 | 0.0% |
| Colombian | 807 | 0.3% |
| Comanche | 55 | 0.0% |
| Costa Rican | 93 | 0.0% |
| Creek | 67 | 0.0% |
| Croatian | 2,107 | 0.7% |
| Cuban | 282 | 0.1% |
| Cypriot | 14 | 0.0% |
| Czech | 1,383 | 0.5% |
| Czechoslovakian | 628 | 0.2% |
| Danish | 434 | 0.1% |
| Delaware | 15 | 0.0% |
| Dominican | 376 | 0.1% |
| Dutch | 1,795 | 0.6% |
| Eastern European | 2,929 | 1.0% |
| Ecuadorian | 161 | 0.1% |
| Egyptian | 260 | 0.1% |
| English | 16,943 | 5.6% |
| Estonian | 7 | 0.0% |
| Ethiopian | 153 | 0.1% |
| European | 4,044 | 1.3% |
| Filipino | 392 | 0.1% |
| Finnish | 167 | 0.1% |
| French | 3,837 | 1.3% |
| French American Indian | 17 | 0.0% |
| French Canadian | 799 | 0.3% |
| German | 52,919 | 17.4% |
| Ghanaian | 156 | 0.1% |
| Greek | 1,485 | 0.5% |
| Guamanian / Chamorro | 22 | 0.0% |
| Guatemalan | 443 | 0.2% |
| Guyanese | 55 | 0.0% |
| Haitian | 769 | 0.3% |
| Honduran | 178 | 0.1% |
| Hopi | 11 | 0.0% |
| Houma | 8 | 0.0% |
| Hungarian | 3,669 | 1.2% |
| Indian (Asian) | 6,465 | 2.1% |
| Indonesian | 204 | 0.1% |
| Iranian | 466 | 0.2% |
| Iraqi | 70 | 0.0% |
| Irish | 40,165 | 13.2% |
| Iroquois | 106 | 0.0% |
| Israeli | 499 | 0.2% |
| Italian | 35,767 | 11.8% |
| Jamaican | 484 | 0.2% |
| Japanese | 71 | 0.0% |
| Jordanian | 183 | 0.1% |
| Kenyan | 146 | 0.1% |
| Kiowa | 2 | 0.0% |
| Korean | 1,388 | 0.5% |
| Laotian | 305 | 0.1% |
| Latvian | 53 | 0.0% |
| Lebanese | 761 | 0.3% |
| Lithuanian | 1,726 | 0.6% |
| Lumbee | 10 | 0.0% |
| Luxembourger | 31 | 0.0% |
| Macedonian | 92 | 0.0% |
| Malaysian | 35 | 0.0% |
| Maltese | 17 | 0.0% |
| Mexican | 3,586 | 1.2% |
| Mexican American Indian | 80 | 0.0% |
| Mongolian | 61 | 0.0% |
| Moroccan | 91 | 0.0% |
| Native Hawaiian | 44 | 0.0% |
| Navajo | 38 | 0.0% |
| Nicaraguan | 39 | 0.0% |
| Nigerian | 973 | 0.3% |
| Northern European | 459 | 0.2% |
| Norwegian | 1,051 | 0.4% |
| Okinawan | 7 | 0.0% |
| Pakistani | 284 | 0.1% |
| Palestinian | 49 | 0.0% |
| Panamanian | 77 | 0.0% |
| Paraguayan | 189 | 0.1% |
| Pennsylvania German | 190 | 0.1% |
| Peruvian | 307 | 0.1% |
| Polish | 20,129 | 6.6% |
| Portuguese | 278 | 0.1% |
| Potawatomi | 3 | 0.0% |
| Puerto Rican | 2,121 | 0.7% |
| Romanian | 614 | 0.2% |
| Russian | 4,957 | 1.6% |
| Salvadoran | 191 | 0.1% |
| Samoan | 82 | 0.0% |
| Scandinavian | 383 | 0.1% |
| Scotch-Irish | 2,837 | 0.9% |
| Scottish | 4,059 | 1.3% |
| Seminole | 90 | 0.0% |
| Senegalese | 45 | 0.0% |
| Serbian | 927 | 0.3% |
| Shoshone | 25 | 0.0% |
| Sierra Leonean | 13 | 0.0% |
| Sioux | 37 | 0.0% |
| Slavic | 277 | 0.1% |
| Slovak | 5,253 | 1.7% |
| Slovene | 791 | 0.3% |
| Somali | 225 | 0.1% |
| South African | 53 | 0.0% |
| South American | 2,266 | 0.7% |
| South American Indian | 56 | 0.0% |
| Soviet Union | 29 | 0.0% |
| Spaniard | 306 | 0.1% |
| Spanish | 555 | 0.2% |
| Sri Lankan | 919 | 0.3% |
| Subsaharan African | 5,281 | 1.7% |
| Sudanese | 67 | 0.0% |
| Swedish | 2,146 | 0.7% |
| Swiss | 840 | 0.3% |
| Syrian | 532 | 0.2% |
| Taiwanese | 5 | 0.0% |
| Thai | 4,966 | 1.6% |
| Tlingit-Haida | 4 | 0.0% |
| Trinidadian and Tobagonian | 77 | 0.0% |
| Turkish | 248 | 0.1% |
| U.S. Virgin Islander | 23 | 0.0% |
| Ugandan | 1 | 0.0% |
| Ukrainian | 2,187 | 0.7% |
| Uruguayan | 11 | 0.0% |
| Venezuelan | 343 | 0.1% |
| Vietnamese | 194 | 0.1% |
| Welsh | 2,219 | 0.7% |
| West Indian | 168 | 0.1% |
| Yakama | 4 | 0.0% |
| Yaqui | 8 | 0.0% |
| Yugoslavian | 114 | 0.0% |
| Zimbabwean | 19 | 0.0% | View All 164 Rows |
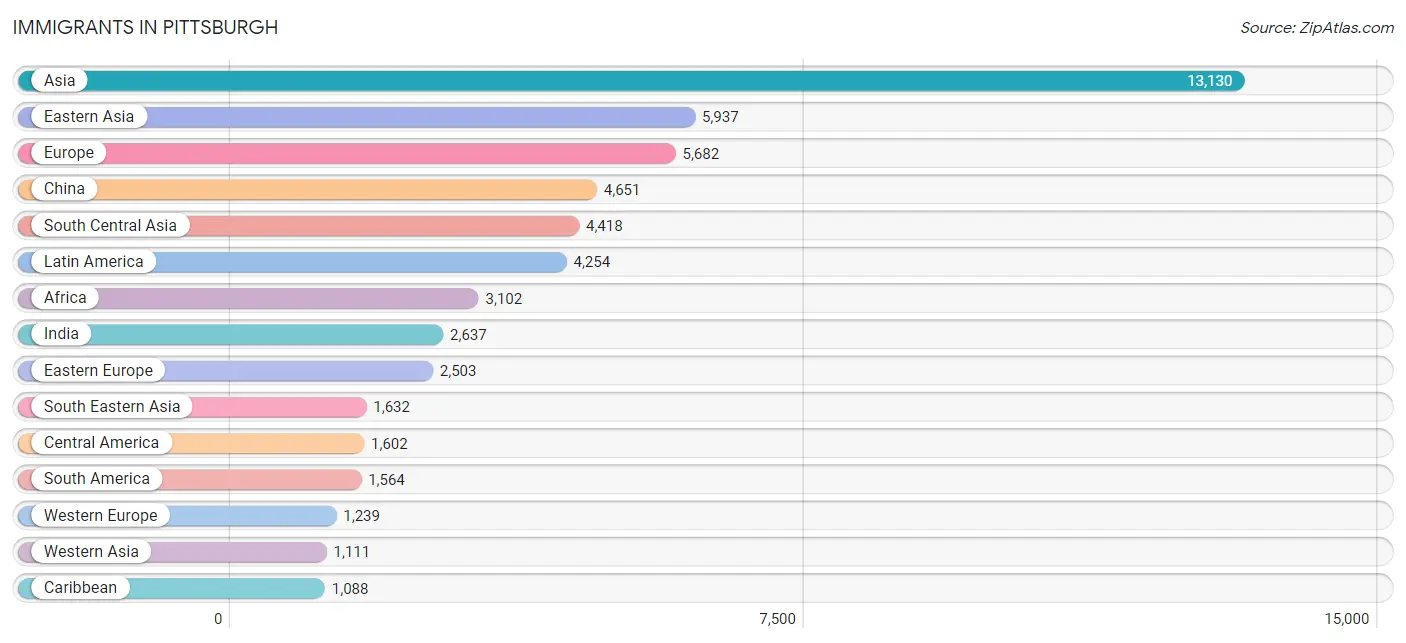
Immigrants in Pittsburgh
The most numerous immigrant groups reported in Pittsburgh came from Asia (13,130 | 4.3%), Eastern Asia (5,937 | 1.9%), Europe (5,682 | 1.9%), China (4,651 | 1.5%), and South Central Asia (4,418 | 1.5%), together accounting for 11.1% of all Pittsburgh residents.
| Immigration Origin | # Population | % Population |
| Afghanistan | 19 | 0.0% |
| Africa | 3,102 | 1.0% |
| Argentina | 126 | 0.0% |
| Asia | 13,130 | 4.3% |
| Australia | 227 | 0.1% |
| Austria | 5 | 0.0% |
| Bahamas | 170 | 0.1% |
| Bangladesh | 131 | 0.0% |
| Belarus | 79 | 0.0% |
| Belgium | 32 | 0.0% |
| Bolivia | 66 | 0.0% |
| Bosnia and Herzegovina | 51 | 0.0% |
| Brazil | 389 | 0.1% |
| Bulgaria | 71 | 0.0% |
| Cambodia | 45 | 0.0% |
| Cameroon | 115 | 0.0% |
| Canada | 909 | 0.3% |
| Caribbean | 1,088 | 0.4% |
| Central America | 1,602 | 0.5% |
| Chile | 59 | 0.0% |
| China | 4,651 | 1.5% |
| Colombia | 348 | 0.1% |
| Congo | 46 | 0.0% |
| Costa Rica | 58 | 0.0% |
| Croatia | 47 | 0.0% |
| Cuba | 61 | 0.0% |
| Czechoslovakia | 97 | 0.0% |
| Denmark | 10 | 0.0% |
| Dominican Republic | 311 | 0.1% |
| Eastern Africa | 1,048 | 0.3% |
| Eastern Asia | 5,937 | 1.9% |
| Eastern Europe | 2,503 | 0.8% |
| Ecuador | 70 | 0.0% |
| Egypt | 178 | 0.1% |
| El Salvador | 94 | 0.0% |
| England | 153 | 0.1% |
| Eritrea | 103 | 0.0% |
| Ethiopia | 134 | 0.0% |
| Europe | 5,682 | 1.9% |
| France | 208 | 0.1% |
| Germany | 889 | 0.3% |
| Ghana | 106 | 0.0% |
| Greece | 131 | 0.0% |
| Guatemala | 180 | 0.1% |
| Guyana | 29 | 0.0% |
| Haiti | 211 | 0.1% |
| Honduras | 123 | 0.0% |
| Hong Kong | 115 | 0.0% |
| Hungary | 131 | 0.0% |
| India | 2,637 | 0.9% |
| Indonesia | 231 | 0.1% |
| Iran | 278 | 0.1% |
| Iraq | 116 | 0.0% |
| Ireland | 112 | 0.0% |
| Israel | 251 | 0.1% |
| Italy | 686 | 0.2% |
| Jamaica | 252 | 0.1% |
| Japan | 463 | 0.2% |
| Jordan | 181 | 0.1% |
| Kazakhstan | 66 | 0.0% |
| Kenya | 419 | 0.1% |
| Korea | 802 | 0.3% |
| Kuwait | 48 | 0.0% |
| Latin America | 4,254 | 1.4% |
| Latvia | 15 | 0.0% |
| Lebanon | 95 | 0.0% |
| Liberia | 9 | 0.0% |
| Lithuania | 79 | 0.0% |
| Malaysia | 48 | 0.0% |
| Mexico | 1,029 | 0.3% |
| Middle Africa | 366 | 0.1% |
| Moldova | 13 | 0.0% |
| Morocco | 120 | 0.0% |
| Nepal | 298 | 0.1% |
| Netherlands | 83 | 0.0% |
| Nicaragua | 14 | 0.0% |
| Nigeria | 614 | 0.2% |
| Northern Africa | 746 | 0.3% |
| Northern Europe | 900 | 0.3% |
| Oceania | 242 | 0.1% |
| Pakistan | 118 | 0.0% |
| Panama | 104 | 0.0% |
| Peru | 90 | 0.0% |
| Philippines | 444 | 0.2% |
| Poland | 320 | 0.1% |
| Portugal | 66 | 0.0% |
| Romania | 163 | 0.1% |
| Russia | 828 | 0.3% |
| Saudi Arabia | 71 | 0.0% |
| Scotland | 18 | 0.0% |
| Senegal | 21 | 0.0% |
| Serbia | 75 | 0.0% |
| Singapore | 68 | 0.0% |
| Somalia | 265 | 0.1% |
| South Africa | 40 | 0.0% |
| South America | 1,564 | 0.5% |
| South Central Asia | 4,418 | 1.5% |
| South Eastern Asia | 1,632 | 0.5% |
| Southern Europe | 1,040 | 0.3% |
| Spain | 151 | 0.1% |
| Sri Lanka | 25 | 0.0% |
| Sudan | 42 | 0.0% |
| Sweden | 59 | 0.0% |
| Switzerland | 22 | 0.0% |
| Syria | 74 | 0.0% |
| Taiwan | 322 | 0.1% |
| Thailand | 224 | 0.1% |
| Trinidad and Tobago | 83 | 0.0% |
| Turkey | 224 | 0.1% |
| Uganda | 37 | 0.0% |
| Ukraine | 389 | 0.1% |
| Uzbekistan | 261 | 0.1% |
| Venezuela | 270 | 0.1% |
| Vietnam | 467 | 0.2% |
| Western Africa | 864 | 0.3% |
| Western Asia | 1,111 | 0.4% |
| Western Europe | 1,239 | 0.4% |
| Zaire | 178 | 0.1% |
| Zimbabwe | 19 | 0.0% | View All 119 Rows |
Sex and Age in Pittsburgh
Sex and Age in Pittsburgh
The most populous age groups in Pittsburgh are 25 to 29 Years (16,814 | 11.3%) for men and 20 to 24 Years (17,964 | 11.6%) for women.
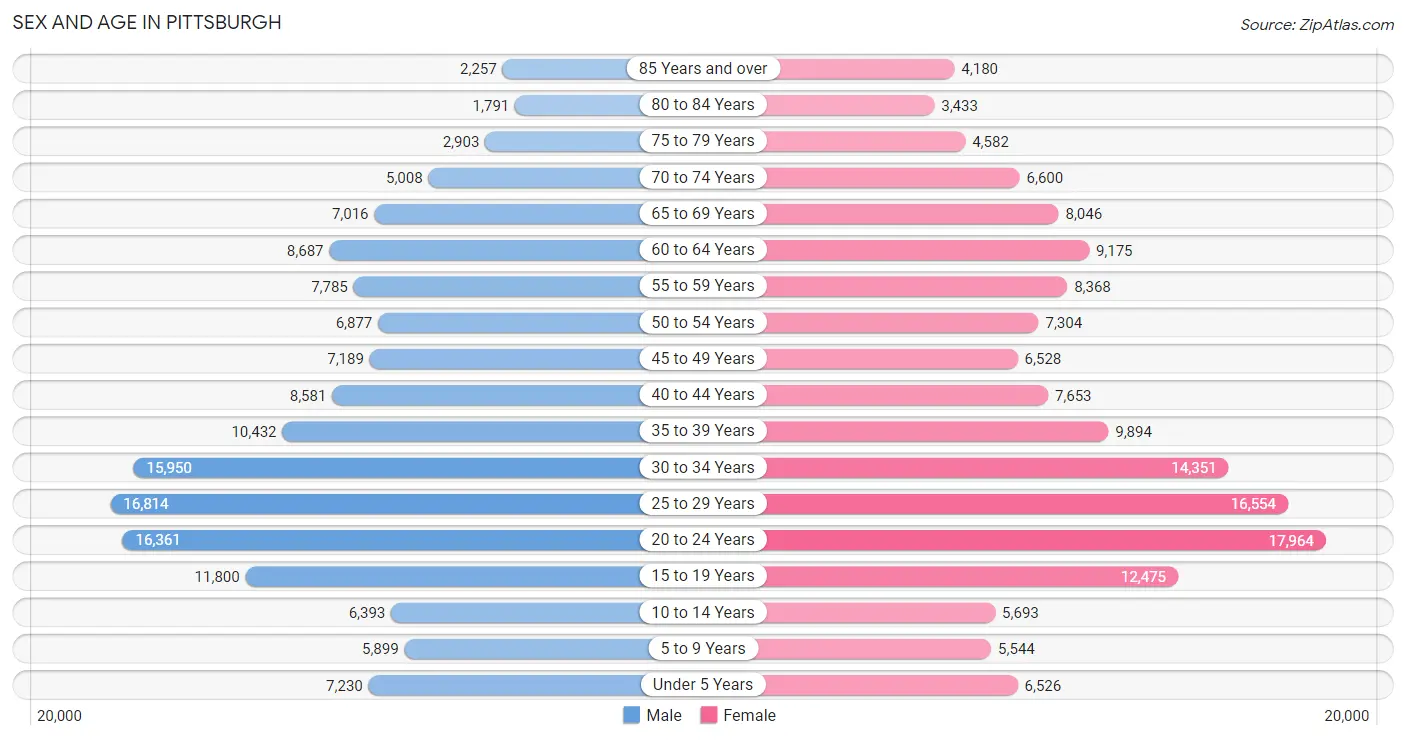
| Age Bracket | Male | Female |
| Under 5 Years | 7,230 (4.9%) | 6,526 (4.2%) |
| 5 to 9 Years | 5,899 (4.0%) | 5,544 (3.6%) |
| 10 to 14 Years | 6,393 (4.3%) | 5,693 (3.7%) |
| 15 to 19 Years | 11,800 (7.9%) | 12,475 (8.1%) |
| 20 to 24 Years | 16,361 (11.0%) | 17,964 (11.6%) |
| 25 to 29 Years | 16,814 (11.3%) | 16,554 (10.7%) |
| 30 to 34 Years | 15,950 (10.7%) | 14,351 (9.3%) |
| 35 to 39 Years | 10,432 (7.0%) | 9,894 (6.4%) |
| 40 to 44 Years | 8,581 (5.8%) | 7,653 (4.9%) |
| 45 to 49 Years | 7,189 (4.8%) | 6,528 (4.2%) |
| 50 to 54 Years | 6,877 (4.6%) | 7,304 (4.7%) |
| 55 to 59 Years | 7,785 (5.2%) | 8,368 (5.4%) |
| 60 to 64 Years | 8,687 (5.8%) | 9,175 (5.9%) |
| 65 to 69 Years | 7,016 (4.7%) | 8,046 (5.2%) |
| 70 to 74 Years | 5,008 (3.4%) | 6,600 (4.3%) |
| 75 to 79 Years | 2,903 (1.9%) | 4,582 (3.0%) |
| 80 to 84 Years | 1,791 (1.2%) | 3,433 (2.2%) |
| 85 Years and over | 2,257 (1.5%) | 4,180 (2.7%) |
| Total | 148,973 (100.0%) | 154,870 (100.0%) |
Families and Households in Pittsburgh
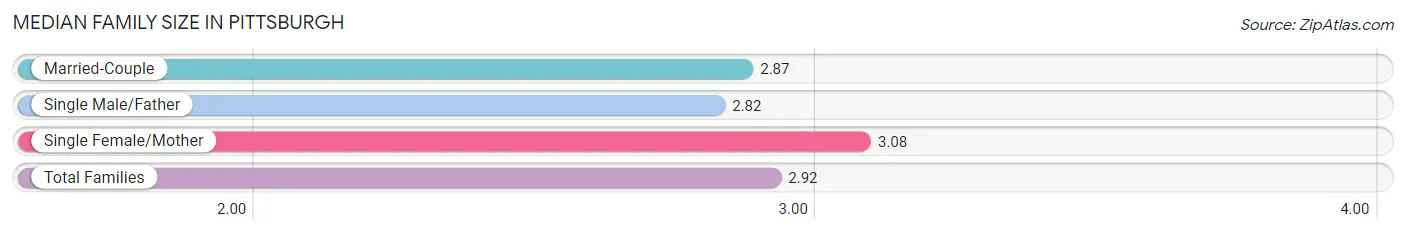
Median Family Size in Pittsburgh
The median family size in Pittsburgh is 2.92 persons per family, with single female/mother families (15,868 | 27.6%) accounting for the largest median family size of 3.08 persons per family. On the other hand, single male/father families (4,561 | 7.9%) represent the smallest median family size with 2.82 persons per family.
| Family Type | # Families | Family Size |
| Married-Couple | 37,058 (64.5%) | 2.87 |
| Single Male/Father | 4,561 (7.9%) | 2.82 |
| Single Female/Mother | 15,868 (27.6%) | 3.08 |
| Total Families | 57,487 (100.0%) | 2.92 |
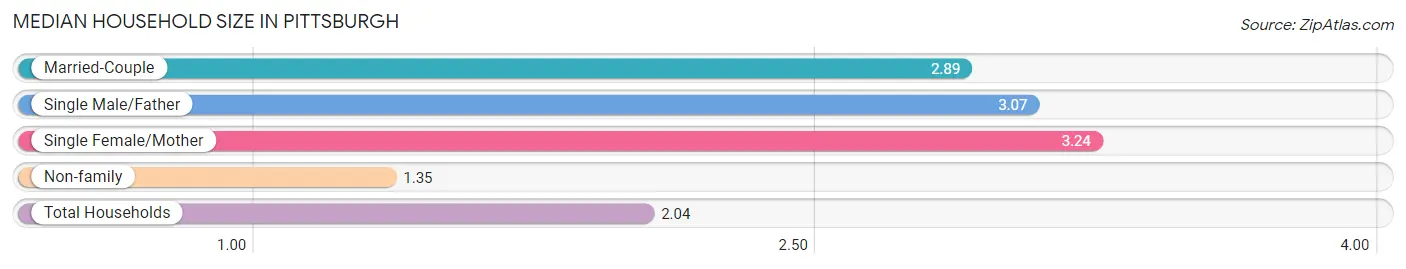
Median Household Size in Pittsburgh
The median household size in Pittsburgh is 2.04 persons per household, with single female/mother households (15,868 | 11.6%) accounting for the largest median household size of 3.24 persons per household. non-family households (79,739 | 58.1%) represent the smallest median household size with 1.35 persons per household.
| Household Type | # Households | Household Size |
| Married-Couple | 37,058 (27.0%) | 2.89 |
| Single Male/Father | 4,561 (3.3%) | 3.07 |
| Single Female/Mother | 15,868 (11.6%) | 3.24 |
| Non-family | 79,739 (58.1%) | 1.35 |
| Total Households | 137,226 (100.0%) | 2.04 |
Household Size by Marriage Status in Pittsburgh
Out of a total of 137,226 households in Pittsburgh, 57,487 (41.9%) are family households, while 79,739 (58.1%) are nonfamily households. The most numerous type of family households are 2-person households, comprising 29,697, and the most common type of nonfamily households are 1-person households, comprising 61,012.
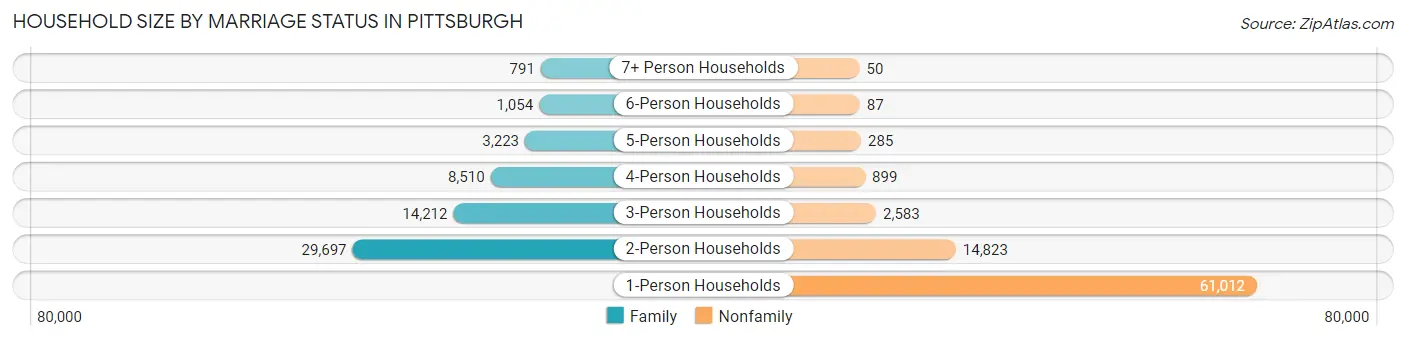
| Household Size | Family Households | Nonfamily Households |
| 1-Person Households | - | 61,012 (44.5%) |
| 2-Person Households | 29,697 (21.6%) | 14,823 (10.8%) |
| 3-Person Households | 14,212 (10.4%) | 2,583 (1.9%) |
| 4-Person Households | 8,510 (6.2%) | 899 (0.7%) |
| 5-Person Households | 3,223 (2.4%) | 285 (0.2%) |
| 6-Person Households | 1,054 (0.8%) | 87 (0.1%) |
| 7+ Person Households | 791 (0.6%) | 50 (0.0%) |
| Total | 57,487 (41.9%) | 79,739 (58.1%) |
Female Fertility in Pittsburgh
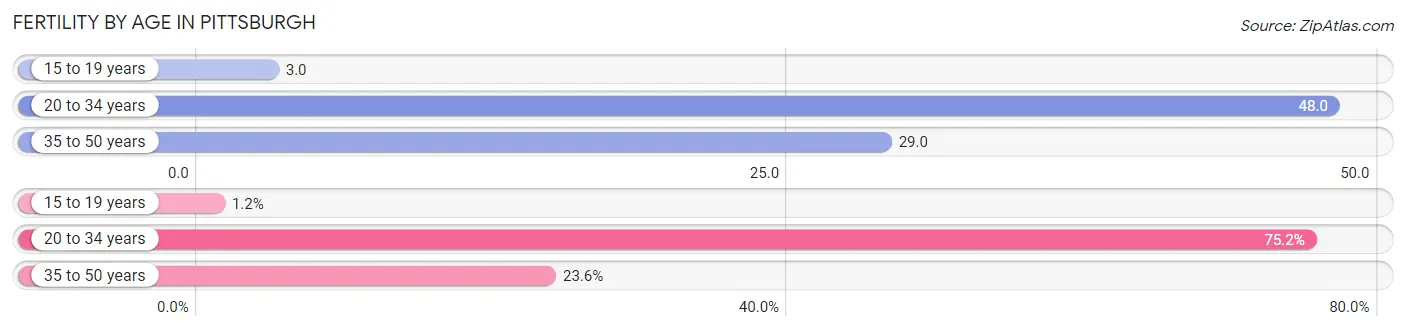
Fertility by Age in Pittsburgh
Average fertility rate in Pittsburgh is 36.0 births per 1,000 women. Women in the age bracket of 20 to 34 years have the highest fertility rate with 48.0 births per 1,000 women. Women in the age bracket of 20 to 34 years acount for 75.2% of all women with births.
| Age Bracket | Women with Births | Births / 1,000 Women |
| 15 to 19 years | 36 (1.1%) | 3.0 |
| 20 to 34 years | 2,354 (75.2%) | 48.0 |
| 35 to 50 years | 739 (23.6%) | 29.0 |
| Total | 3,129 (100.0%) | 36.0 |
Fertility by Age by Marriage Status in Pittsburgh
56.7% of women with births (3,129) in Pittsburgh are married. The highest percentage of unmarried women with births falls into 15 to 19 years age bracket with 100.0% of them unmarried at the time of birth, while the lowest percentage of unmarried women with births belong to 35 to 50 years age bracket with 31.0% of them unmarried.
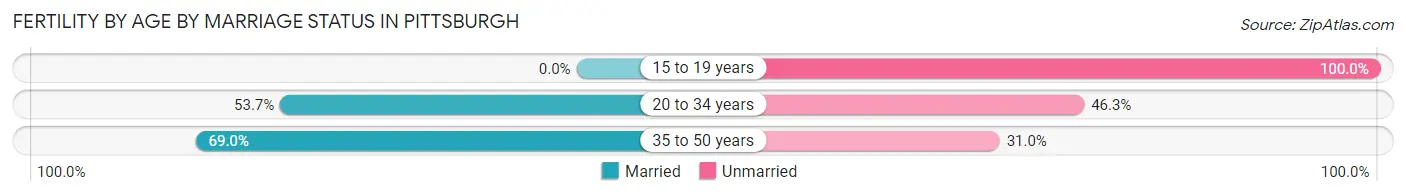
| Age Bracket | Married | Unmarried |
| 15 to 19 years | 0 (0.0%) | 36 (100.0%) |
| 20 to 34 years | 1,264 (53.7%) | 1,090 (46.3%) |
| 35 to 50 years | 510 (69.0%) | 229 (31.0%) |
| Total | 1,774 (56.7%) | 1,355 (43.3%) |
Fertility by Education in Pittsburgh
Average fertility rate in Pittsburgh is 36.0 births per 1,000 women. Women with the education attainment of high school diploma have the highest fertility rate of 44.0 births per 1,000 women, while women with the education attainment of college or associate's degree have the lowest fertility at 29.0 births per 1,000 women. Women with the education attainment of bachelor's degree represent 24.9% of all women with births.
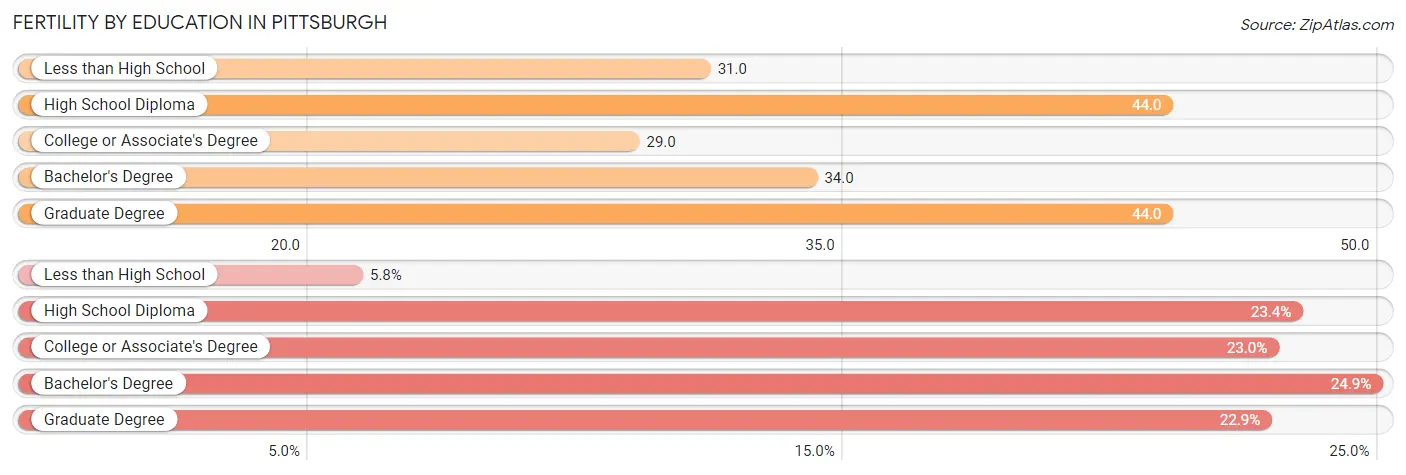
| Educational Attainment | Women with Births | Births / 1,000 Women |
| Less than High School | 182 (5.8%) | 31.0 |
| High School Diploma | 733 (23.4%) | 44.0 |
| College or Associate's Degree | 719 (23.0%) | 29.0 |
| Bachelor's Degree | 780 (24.9%) | 34.0 |
| Graduate Degree | 715 (22.9%) | 44.0 |
| Total | 3,129 (100.0%) | 36.0 |
Fertility by Education by Marriage Status in Pittsburgh
43.3% of women with births in Pittsburgh are unmarried. Women with the educational attainment of bachelor's degree are most likely to be married with 88.6% of them married at childbirth, while women with the educational attainment of high school diploma are least likely to be married with 76.3% of them unmarried at childbirth.
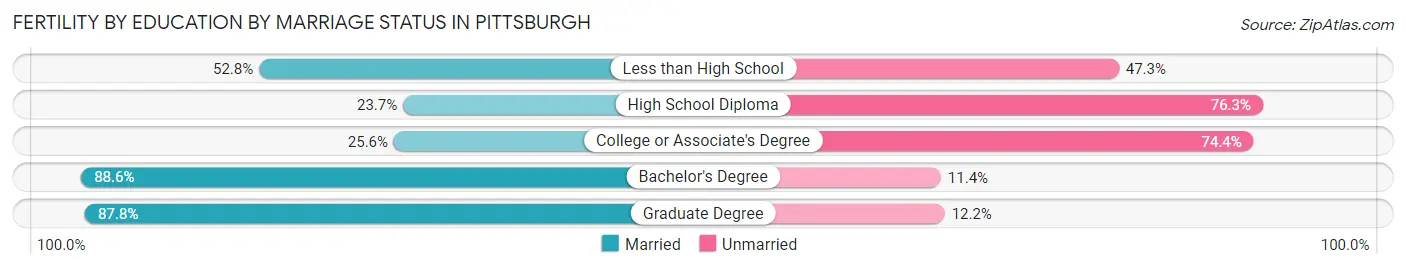
| Educational Attainment | Married | Unmarried |
| Less than High School | 96 (52.7%) | 86 (47.2%) |
| High School Diploma | 174 (23.7%) | 559 (76.3%) |
| College or Associate's Degree | 184 (25.6%) | 535 (74.4%) |
| Bachelor's Degree | 691 (88.6%) | 89 (11.4%) |
| Graduate Degree | 628 (87.8%) | 87 (12.2%) |
| Total | 1,774 (56.7%) | 1,355 (43.3%) |
Employment Characteristics in Pittsburgh
Employment by Class of Employer in Pittsburgh
Among the 155,863 employed individuals in Pittsburgh, private company employees (96,627 | 62.0%), not-for-profit organizations (33,625 | 21.6%), and local government employees (7,955 | 5.1%) make up the most common classes of employment.
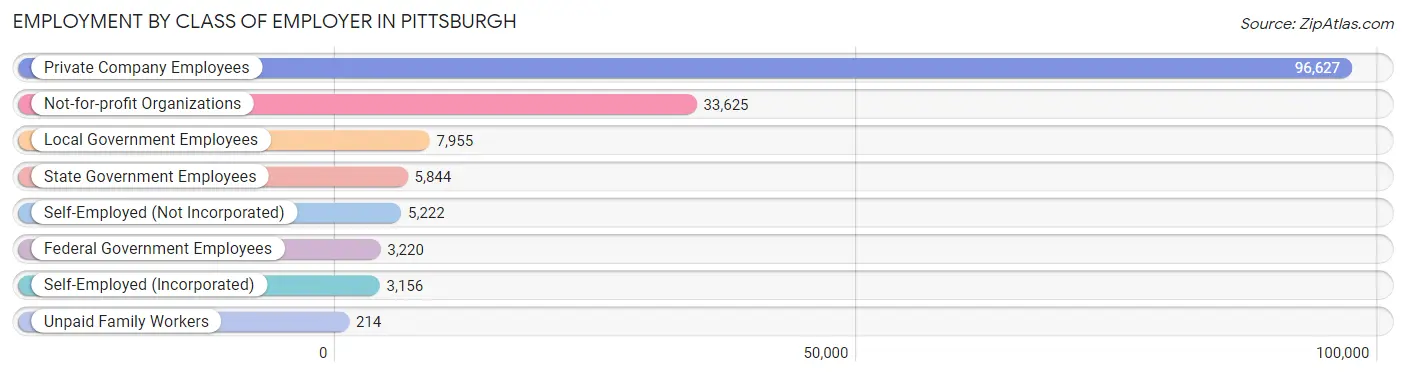
| Employer Class | # Employees | % Employees |
| Private Company Employees | 96,627 | 62.0% |
| Self-Employed (Incorporated) | 3,156 | 2.0% |
| Self-Employed (Not Incorporated) | 5,222 | 3.4% |
| Not-for-profit Organizations | 33,625 | 21.6% |
| Local Government Employees | 7,955 | 5.1% |
| State Government Employees | 5,844 | 3.7% |
| Federal Government Employees | 3,220 | 2.1% |
| Unpaid Family Workers | 214 | 0.1% |
| Total | 155,863 | 100.0% |
Employment Status by Age in Pittsburgh
According to the labor force statistics for Pittsburgh, out of the total population over 16 years of age (264,227), 64.3% or 169,898 individuals are in the labor force, with 5.7% or 9,684 of them unemployed. The age group with the highest labor force participation rate is 30 to 34 years, with 88.6% or 26,847 individuals in the labor force. Within the labor force, the 16 to 19 years age range has the highest percentage of unemployed individuals, with 15.5% or 1,214 of them being unemployed.
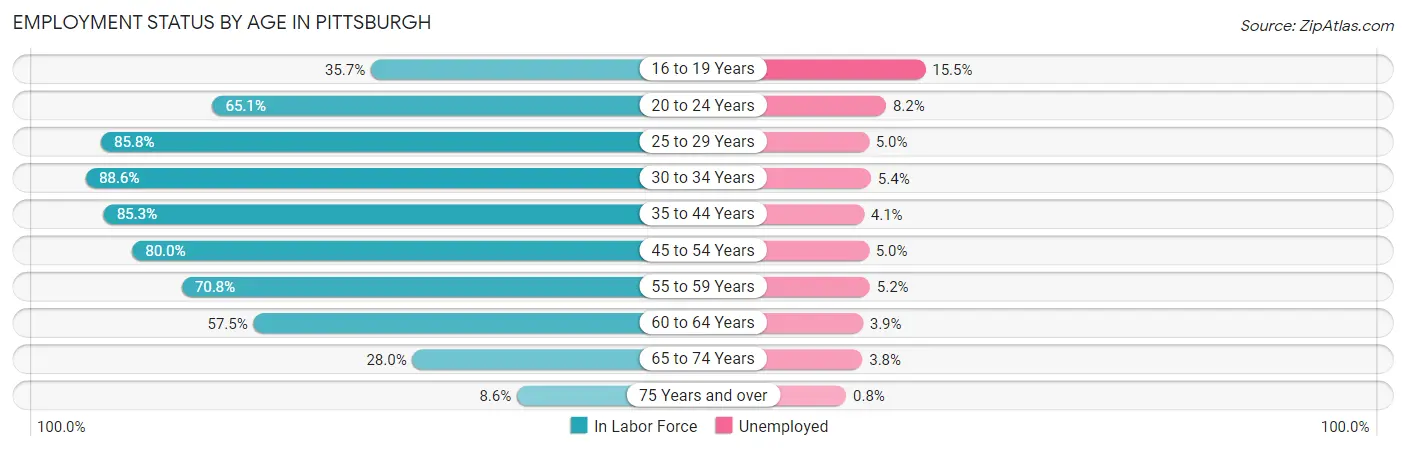
| Age Bracket | In Labor Force | Unemployed |
| 16 to 19 Years | 7,834 (35.7%) | 1,214 (15.5%) |
| 20 to 24 Years | 22,346 (65.1%) | 1,832 (8.2%) |
| 25 to 29 Years | 28,630 (85.8%) | 1,432 (5.0%) |
| 30 to 34 Years | 26,847 (88.6%) | 1,450 (5.4%) |
| 35 to 44 Years | 31,186 (85.3%) | 1,279 (4.1%) |
| 45 to 54 Years | 22,318 (80.0%) | 1,116 (5.0%) |
| 55 to 59 Years | 11,436 (70.8%) | 595 (5.2%) |
| 60 to 64 Years | 10,271 (57.5%) | 401 (3.9%) |
| 65 to 74 Years | 7,468 (28.0%) | 284 (3.8%) |
| 75 Years and over | 1,647 (8.6%) | 13 (0.8%) |
| Total | 169,898 (64.3%) | 9,684 (5.7%) |
Employment Status by Educational Attainment in Pittsburgh
According to labor force statistics for Pittsburgh, 80.6% of individuals (130,686) out of the total population between 25 and 64 years of age (162,142) are in the labor force, with 4.8% or 6,273 of them being unemployed. The group with the highest labor force participation rate are those with the educational attainment of bachelor's degree or higher, with 89.6% or 73,993 individuals in the labor force. Within the labor force, individuals with high school diploma education have the highest percentage of unemployment, with 10.2% or 2,354 of them being unemployed.
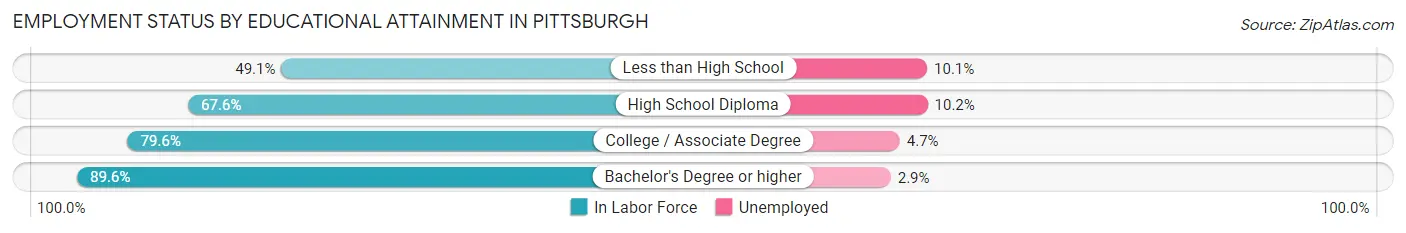
| Educational Attainment | In Labor Force | Unemployed |
| Less than High School | 4,095 (49.1%) | 842 (10.1%) |
| High School Diploma | 23,076 (67.6%) | 3,482 (10.2%) |
| College / Associate Degree | 29,519 (79.6%) | 1,743 (4.7%) |
| Bachelor's Degree or higher | 73,993 (89.6%) | 2,395 (2.9%) |
| Total | 130,686 (80.6%) | 7,783 (4.8%) |
Employment Occupations by Sex in Pittsburgh
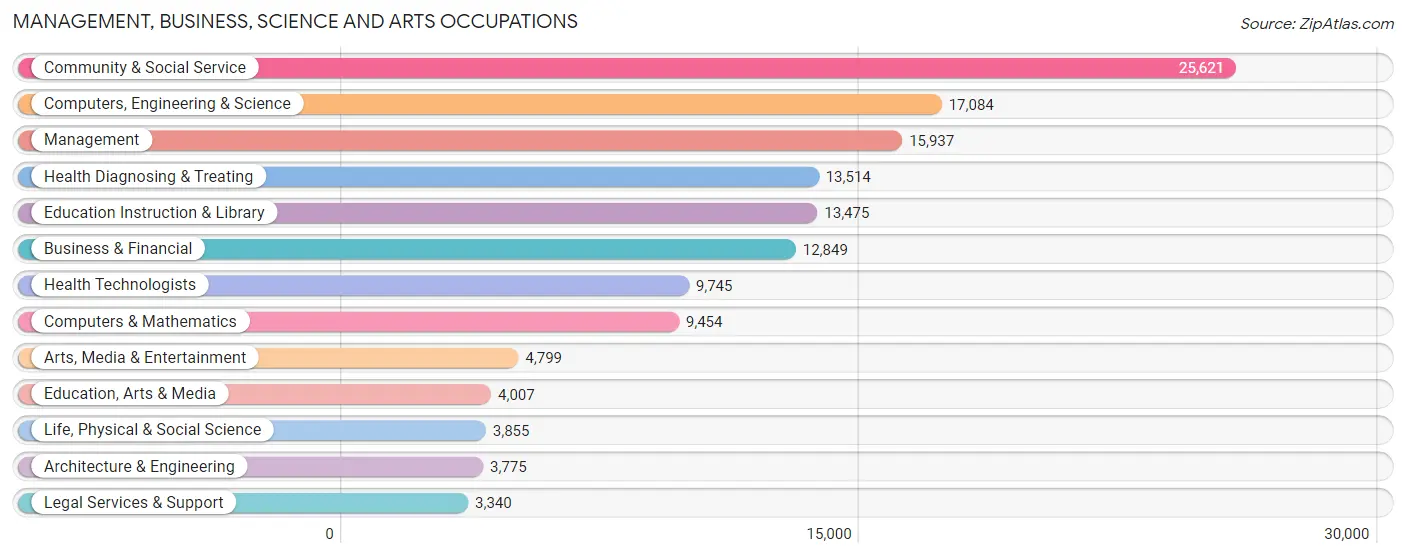
Management, Business, Science and Arts Occupations
The most common Management, Business, Science and Arts occupations in Pittsburgh are Community & Social Service (25,621 | 16.0%), Computers, Engineering & Science (17,084 | 10.7%), Management (15,937 | 10.0%), Health Diagnosing & Treating (13,514 | 8.4%), and Education Instruction & Library (13,475 | 8.4%).
Management, Business, Science and Arts Occupations by Sex
Within the Management, Business, Science and Arts occupations in Pittsburgh, the most male-oriented occupations are Computers & Mathematics (76.7%), Architecture & Engineering (73.9%), and Computers, Engineering & Science (71.5%), while the most female-oriented occupations are Education, Arts & Media (66.8%), Health Diagnosing & Treating (63.8%), and Health Technologists (62.5%).
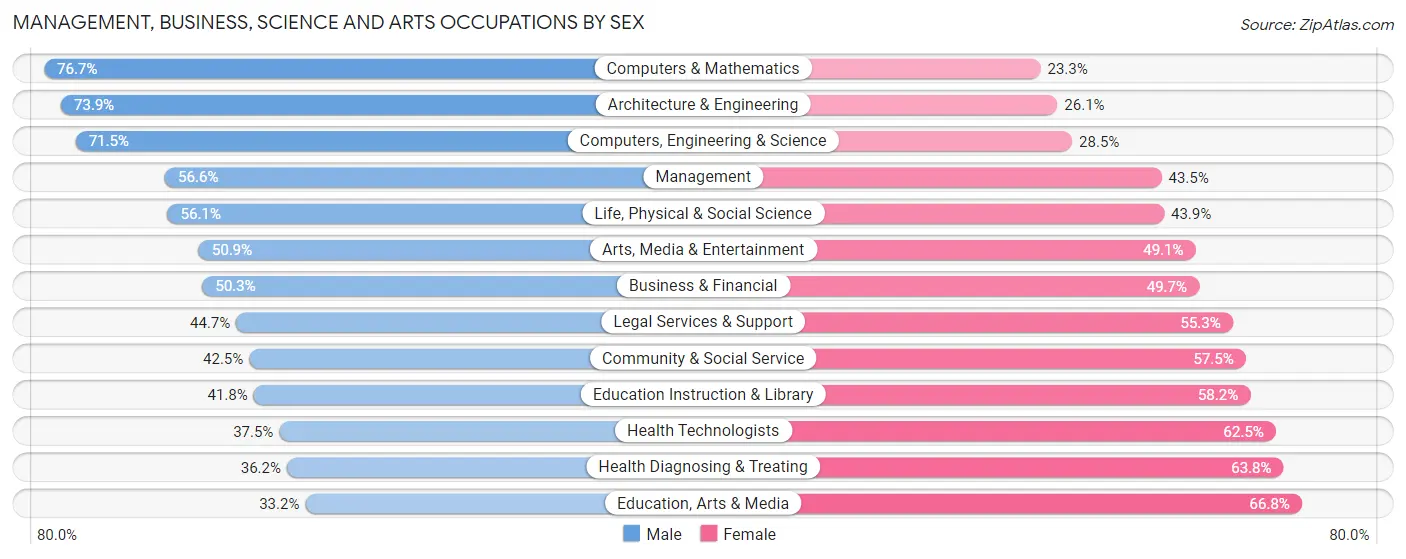
| Occupation | Male | Female |
| Management | 9,013 (56.6%) | 6,924 (43.4%) |
| Business & Financial | 6,468 (50.3%) | 6,381 (49.7%) |
| Computers, Engineering & Science | 12,210 (71.5%) | 4,874 (28.5%) |
| Computers & Mathematics | 7,255 (76.7%) | 2,199 (23.3%) |
| Architecture & Engineering | 2,791 (73.9%) | 984 (26.1%) |
| Life, Physical & Social Science | 2,164 (56.1%) | 1,691 (43.9%) |
| Community & Social Service | 10,896 (42.5%) | 14,725 (57.5%) |
| Education, Arts & Media | 1,329 (33.2%) | 2,678 (66.8%) |
| Legal Services & Support | 1,493 (44.7%) | 1,847 (55.3%) |
| Education Instruction & Library | 5,631 (41.8%) | 7,844 (58.2%) |
| Arts, Media & Entertainment | 2,443 (50.9%) | 2,356 (49.1%) |
| Health Diagnosing & Treating | 4,897 (36.2%) | 8,617 (63.8%) |
| Health Technologists | 3,655 (37.5%) | 6,090 (62.5%) |
| Total (Category) | 43,484 (51.1%) | 41,521 (48.8%) |
| Total (Overall) | 80,904 (50.5%) | 79,210 (49.5%) |
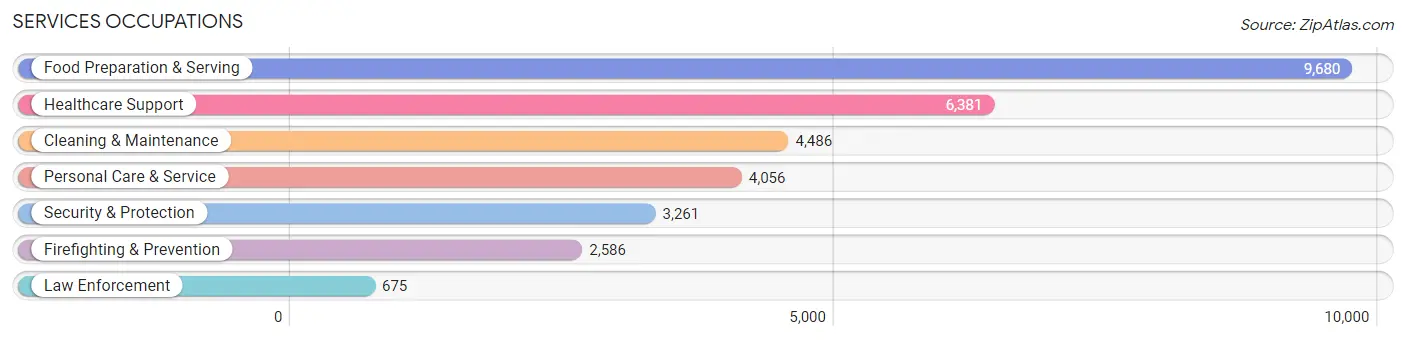
Services Occupations
The most common Services occupations in Pittsburgh are Food Preparation & Serving (9,680 | 6.0%), Healthcare Support (6,381 | 4.0%), Cleaning & Maintenance (4,486 | 2.8%), Personal Care & Service (4,056 | 2.5%), and Security & Protection (3,261 | 2.0%).
Services Occupations by Sex
Within the Services occupations in Pittsburgh, the most male-oriented occupations are Law Enforcement (74.5%), Security & Protection (63.8%), and Cleaning & Maintenance (63.0%), while the most female-oriented occupations are Healthcare Support (79.4%), Personal Care & Service (71.9%), and Food Preparation & Serving (52.9%).
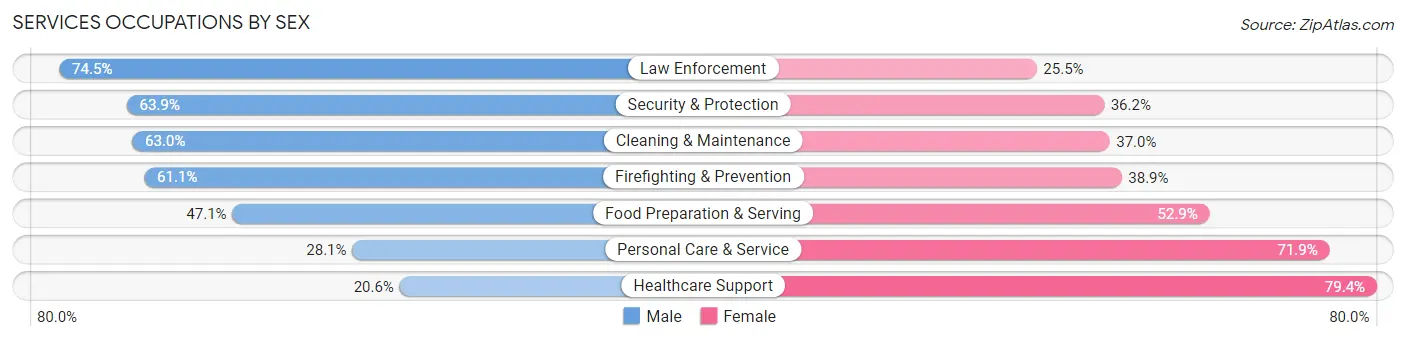
| Occupation | Male | Female |
| Healthcare Support | 1,313 (20.6%) | 5,068 (79.4%) |
| Security & Protection | 2,082 (63.8%) | 1,179 (36.1%) |
| Firefighting & Prevention | 1,579 (61.1%) | 1,007 (38.9%) |
| Law Enforcement | 503 (74.5%) | 172 (25.5%) |
| Food Preparation & Serving | 4,557 (47.1%) | 5,123 (52.9%) |
| Cleaning & Maintenance | 2,825 (63.0%) | 1,661 (37.0%) |
| Personal Care & Service | 1,139 (28.1%) | 2,917 (71.9%) |
| Total (Category) | 11,916 (42.8%) | 15,948 (57.2%) |
| Total (Overall) | 80,904 (50.5%) | 79,210 (49.5%) |
Sales and Office Occupations
The most common Sales and Office occupations in Pittsburgh are Office & Administration (16,174 | 10.1%), and Sales & Related (12,349 | 7.7%).

Sales and Office Occupations by Sex
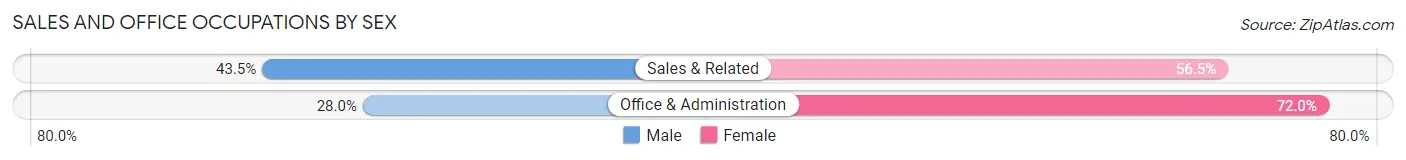
| Occupation | Male | Female |
| Sales & Related | 5,367 (43.5%) | 6,982 (56.5%) |
| Office & Administration | 4,526 (28.0%) | 11,648 (72.0%) |
| Total (Category) | 9,893 (34.7%) | 18,630 (65.3%) |
| Total (Overall) | 80,904 (50.5%) | 79,210 (49.5%) |
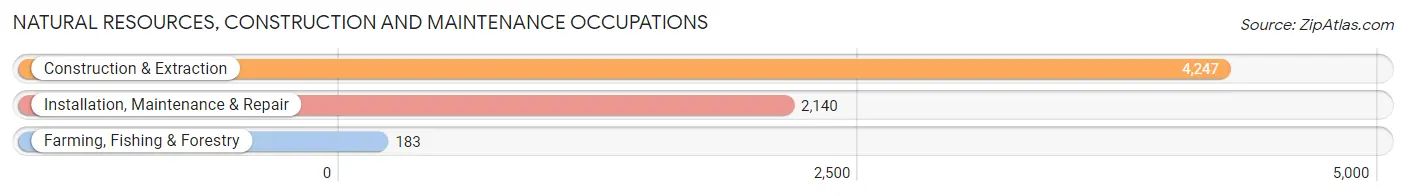
Natural Resources, Construction and Maintenance Occupations
The most common Natural Resources, Construction and Maintenance occupations in Pittsburgh are Construction & Extraction (4,247 | 2.6%), Installation, Maintenance & Repair (2,140 | 1.3%), and Farming, Fishing & Forestry (183 | 0.1%).
Natural Resources, Construction and Maintenance Occupations by Sex
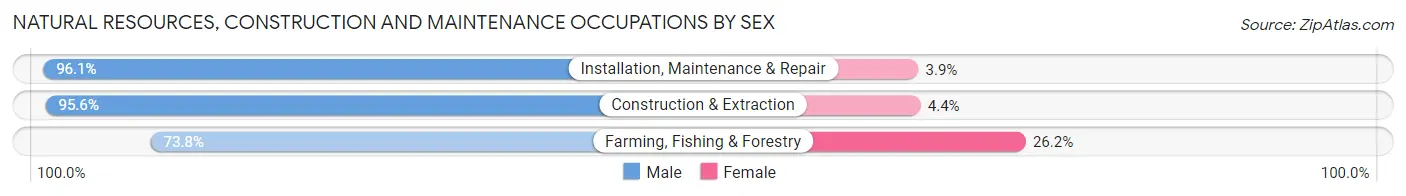
| Occupation | Male | Female |
| Farming, Fishing & Forestry | 135 (73.8%) | 48 (26.2%) |
| Construction & Extraction | 4,062 (95.6%) | 185 (4.4%) |
| Installation, Maintenance & Repair | 2,057 (96.1%) | 83 (3.9%) |
| Total (Category) | 6,254 (95.2%) | 316 (4.8%) |
| Total (Overall) | 80,904 (50.5%) | 79,210 (49.5%) |
Production, Transportation and Moving Occupations
The most common Production, Transportation and Moving occupations in Pittsburgh are Transportation (4,211 | 2.6%), Material Moving (4,185 | 2.6%), and Production (3,756 | 2.4%).
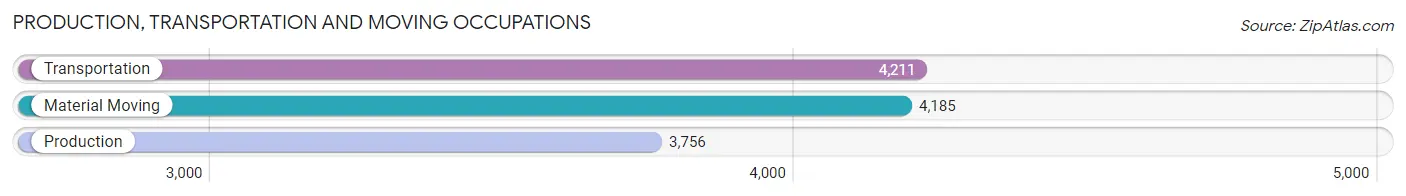
Production, Transportation and Moving Occupations by Sex
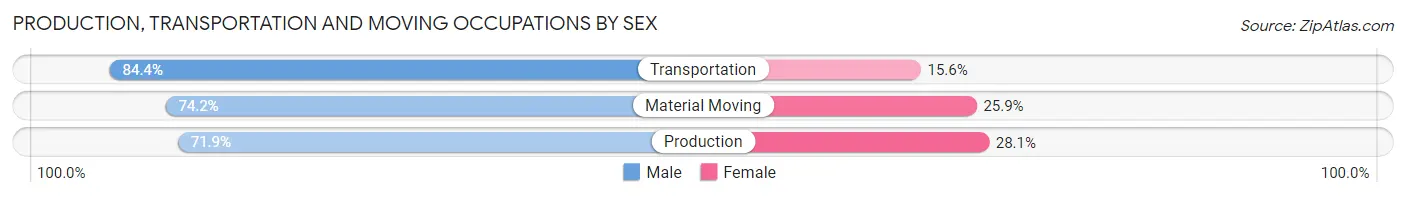
| Occupation | Male | Female |
| Production | 2,700 (71.9%) | 1,056 (28.1%) |
| Transportation | 3,554 (84.4%) | 657 (15.6%) |
| Material Moving | 3,103 (74.2%) | 1,082 (25.9%) |
| Total (Category) | 9,357 (77.0%) | 2,795 (23.0%) |
| Total (Overall) | 80,904 (50.5%) | 79,210 (49.5%) |
Employment Industries by Sex in Pittsburgh
Employment Industries in Pittsburgh
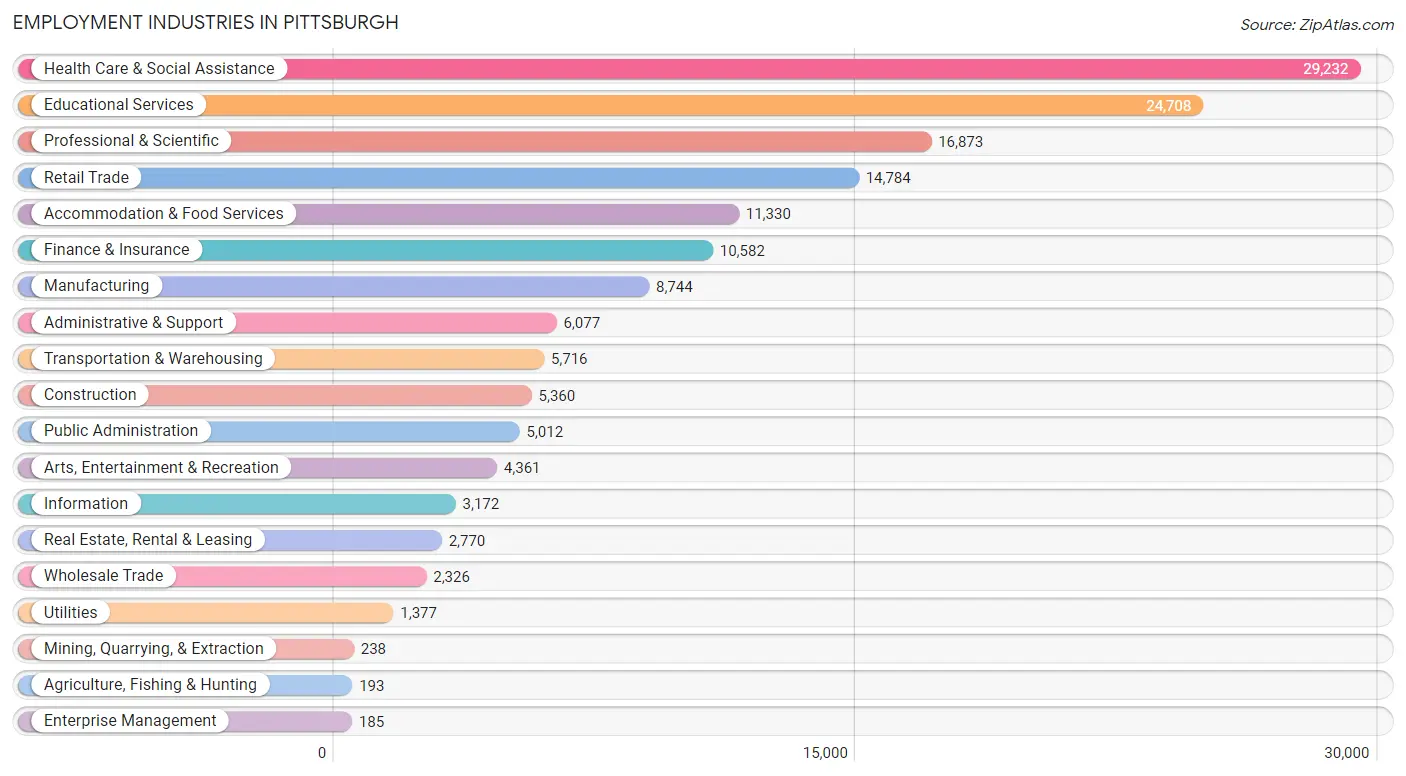
The major employment industries in Pittsburgh include Health Care & Social Assistance (29,232 | 18.3%), Educational Services (24,708 | 15.4%), Professional & Scientific (16,873 | 10.5%), Retail Trade (14,784 | 9.2%), and Accommodation & Food Services (11,330 | 7.1%).
Employment Industries by Sex in Pittsburgh
The Pittsburgh industries that see more men than women are Construction (91.1%), Mining, Quarrying, & Extraction (81.1%), and Agriculture, Fishing & Hunting (78.2%), whereas the industries that tend to have a higher number of women are Enterprise Management (78.4%), Health Care & Social Assistance (70.4%), and Educational Services (57.1%).
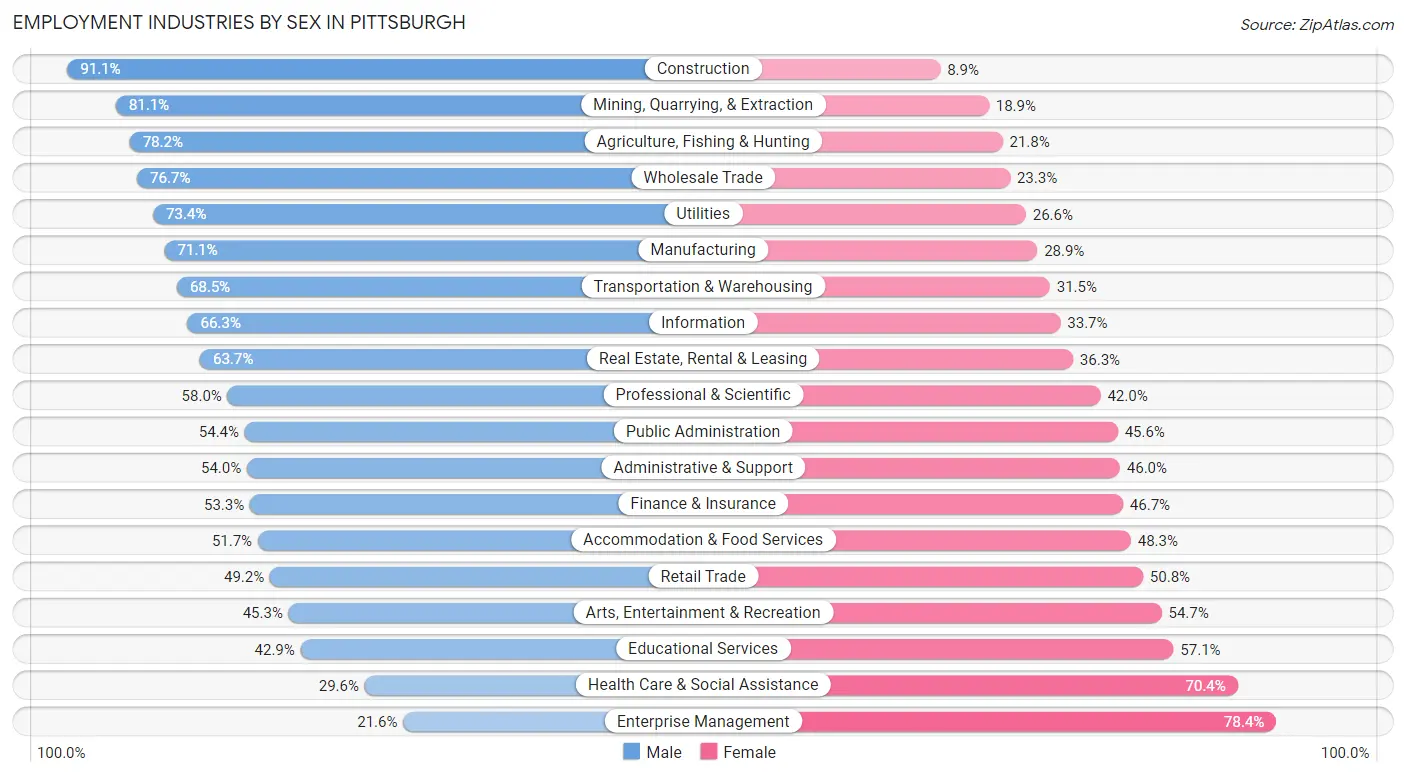
| Industry | Male | Female |
| Agriculture, Fishing & Hunting | 151 (78.2%) | 42 (21.8%) |
| Mining, Quarrying, & Extraction | 193 (81.1%) | 45 (18.9%) |
| Construction | 4,885 (91.1%) | 475 (8.9%) |
| Manufacturing | 6,214 (71.1%) | 2,530 (28.9%) |
| Wholesale Trade | 1,784 (76.7%) | 542 (23.3%) |
| Retail Trade | 7,272 (49.2%) | 7,512 (50.8%) |
| Transportation & Warehousing | 3,913 (68.5%) | 1,803 (31.5%) |
| Utilities | 1,011 (73.4%) | 366 (26.6%) |
| Information | 2,102 (66.3%) | 1,070 (33.7%) |
| Finance & Insurance | 5,643 (53.3%) | 4,939 (46.7%) |
| Real Estate, Rental & Leasing | 1,764 (63.7%) | 1,006 (36.3%) |
| Professional & Scientific | 9,781 (58.0%) | 7,092 (42.0%) |
| Enterprise Management | 40 (21.6%) | 145 (78.4%) |
| Administrative & Support | 3,279 (54.0%) | 2,798 (46.0%) |
| Educational Services | 10,592 (42.9%) | 14,116 (57.1%) |
| Health Care & Social Assistance | 8,651 (29.6%) | 20,581 (70.4%) |
| Arts, Entertainment & Recreation | 1,977 (45.3%) | 2,384 (54.7%) |
| Accommodation & Food Services | 5,858 (51.7%) | 5,472 (48.3%) |
| Public Administration | 2,727 (54.4%) | 2,285 (45.6%) |
| Total | 80,904 (50.5%) | 79,210 (49.5%) |
Education in Pittsburgh
School Enrollment in Pittsburgh
The most common levels of schooling among the 82,591 students in Pittsburgh are college / undergraduate (35,272 | 42.7%), graduate / professional (13,354 | 16.2%), and middle school (9,560 | 11.6%).
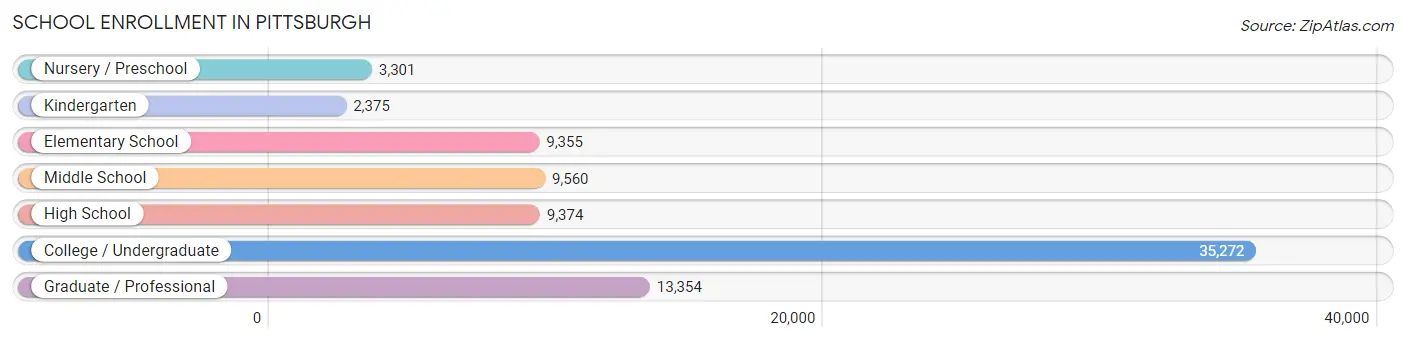
| School Level | # Students | % Students |
| Nursery / Preschool | 3,301 | 4.0% |
| Kindergarten | 2,375 | 2.9% |
| Elementary School | 9,355 | 11.3% |
| Middle School | 9,560 | 11.6% |
| High School | 9,374 | 11.4% |
| College / Undergraduate | 35,272 | 42.7% |
| Graduate / Professional | 13,354 | 16.2% |
| Total | 82,591 | 100.0% |
School Enrollment by Age by Funding Source in Pittsburgh
Out of a total of 82,591 students who are enrolled in schools in Pittsburgh, 30,146 (36.5%) attend a private institution, while the remaining 52,445 (63.5%) are enrolled in public schools. The age group of 20 to 24 year olds has the highest likelihood of being enrolled in private schools, with 10,345 (48.1% in the age bracket) enrolled. Conversely, the age group of 15 to 17 year olds has the lowest likelihood of being enrolled in a private school, with 5,332 (78.7% in the age bracket) attending a public institution.
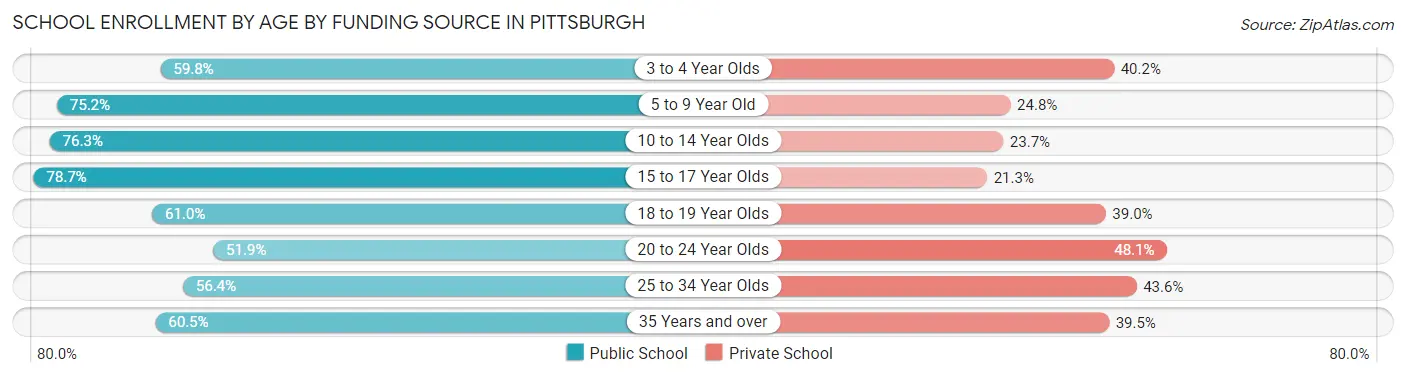
| Age Bracket | Public School | Private School |
| 3 to 4 Year Olds | 1,730 (59.8%) | 1,165 (40.2%) |
| 5 to 9 Year Old | 8,075 (75.2%) | 2,665 (24.8%) |
| 10 to 14 Year Olds | 9,084 (76.3%) | 2,826 (23.7%) |
| 15 to 17 Year Olds | 5,332 (78.7%) | 1,445 (21.3%) |
| 18 to 19 Year Olds | 9,608 (61.0%) | 6,143 (39.0%) |
| 20 to 24 Year Olds | 11,166 (51.9%) | 10,345 (48.1%) |
| 25 to 34 Year Olds | 5,296 (56.4%) | 4,092 (43.6%) |
| 35 Years and over | 2,190 (60.5%) | 1,429 (39.5%) |
| Total | 52,445 (63.5%) | 30,146 (36.5%) |
Educational Attainment by Field of Study in Pittsburgh
Business (15,380 | 14.1%), social sciences (10,464 | 9.6%), science & technology (8,780 | 8.1%), engineering (8,638 | 7.9%), and bio, nature & agricultural (8,429 | 7.7%) are the most common fields of study among 109,013 individuals in Pittsburgh who have obtained a bachelor's degree or higher.
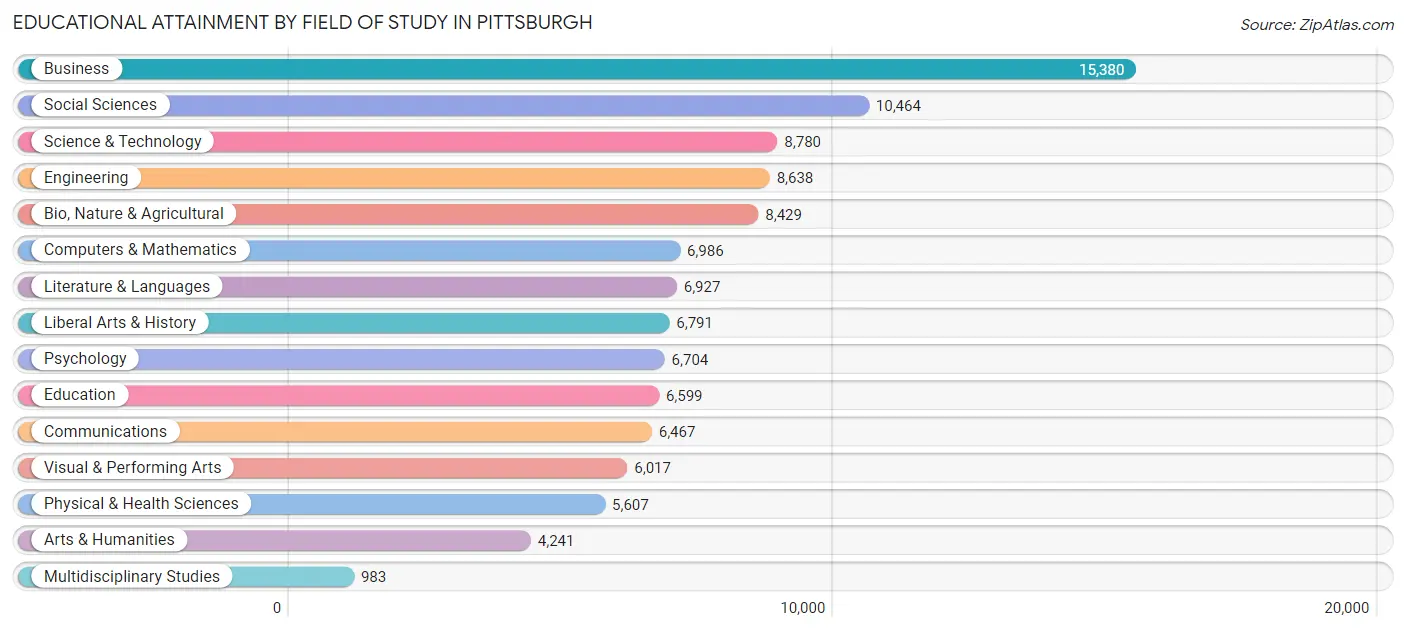
| Field of Study | # Graduates | % Graduates |
| Computers & Mathematics | 6,986 | 6.4% |
| Bio, Nature & Agricultural | 8,429 | 7.7% |
| Physical & Health Sciences | 5,607 | 5.1% |
| Psychology | 6,704 | 6.1% |
| Social Sciences | 10,464 | 9.6% |
| Engineering | 8,638 | 7.9% |
| Multidisciplinary Studies | 983 | 0.9% |
| Science & Technology | 8,780 | 8.1% |
| Business | 15,380 | 14.1% |
| Education | 6,599 | 6.0% |
| Literature & Languages | 6,927 | 6.4% |
| Liberal Arts & History | 6,791 | 6.2% |
| Visual & Performing Arts | 6,017 | 5.5% |
| Communications | 6,467 | 5.9% |
| Arts & Humanities | 4,241 | 3.9% |
| Total | 109,013 | 100.0% |
Transportation & Commute in Pittsburgh
Vehicle Availability by Sex in Pittsburgh
The most prevalent vehicle ownership categories in Pittsburgh are males with 2 vehicles (28,366, accounting for 37.0%) and females with 2 vehicles (25,665, making up 38.8%).
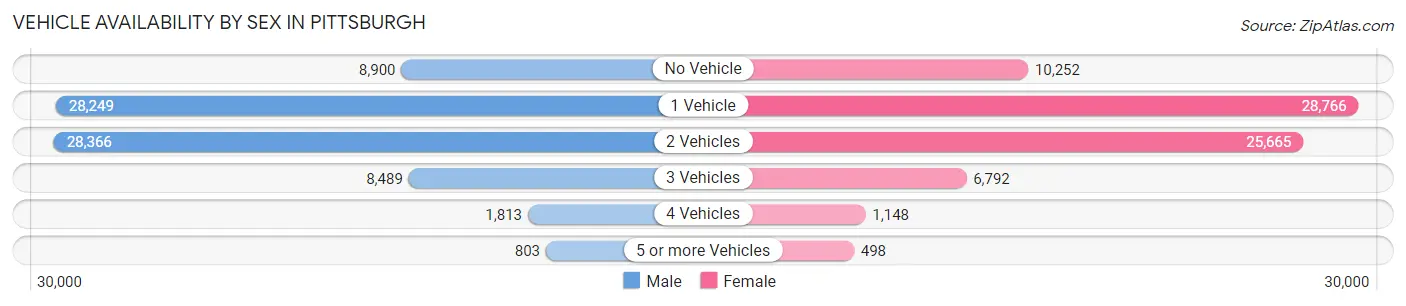
| Vehicles Available | Male | Female |
| No Vehicle | 8,900 (11.6%) | 10,252 (14.0%) |
| 1 Vehicle | 28,249 (36.9%) | 28,766 (39.3%) |
| 2 Vehicles | 28,366 (37.0%) | 25,665 (35.1%) |
| 3 Vehicles | 8,489 (11.1%) | 6,792 (9.3%) |
| 4 Vehicles | 1,813 (2.4%) | 1,148 (1.6%) |
| 5 or more Vehicles | 803 (1.1%) | 498 (0.7%) |
| Total | 76,620 (100.0%) | 73,121 (100.0%) |
Commute Time in Pittsburgh
The most frequently occuring commute durations in Pittsburgh are 15 to 19 minutes (25,379 commuters, 19.8%), 20 to 24 minutes (24,667 commuters, 19.2%), and 30 to 34 minutes (19,180 commuters, 14.9%).
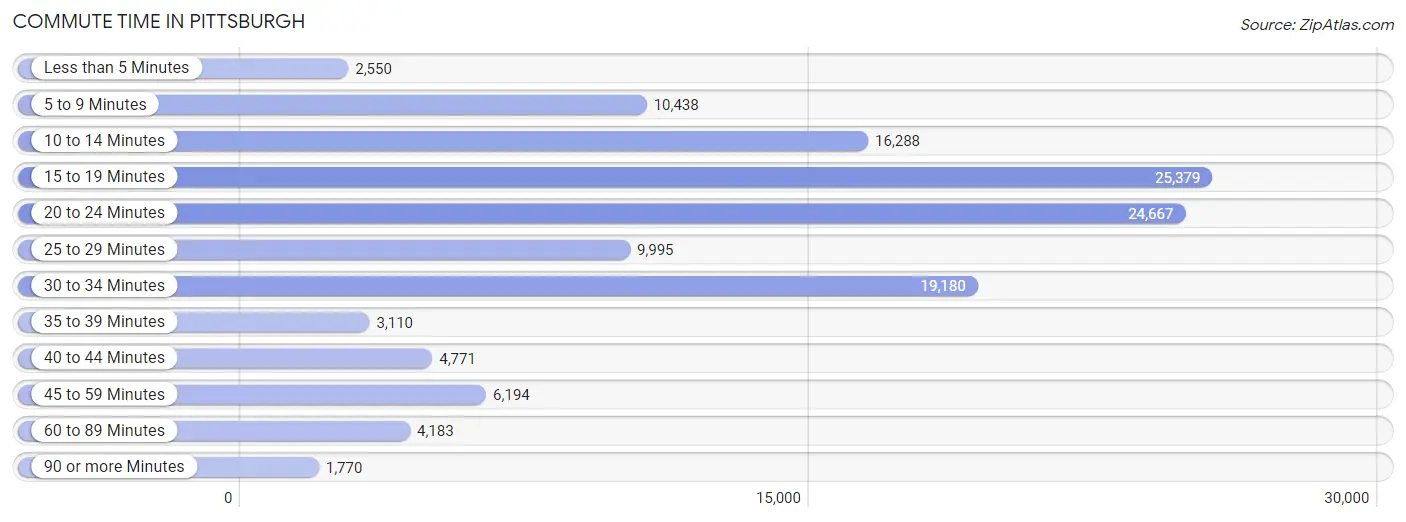
| Commute Time | # Commuters | % Commuters |
| Less than 5 Minutes | 2,550 | 2.0% |
| 5 to 9 Minutes | 10,438 | 8.1% |
| 10 to 14 Minutes | 16,288 | 12.7% |
| 15 to 19 Minutes | 25,379 | 19.8% |
| 20 to 24 Minutes | 24,667 | 19.2% |
| 25 to 29 Minutes | 9,995 | 7.8% |
| 30 to 34 Minutes | 19,180 | 14.9% |
| 35 to 39 Minutes | 3,110 | 2.4% |
| 40 to 44 Minutes | 4,771 | 3.7% |
| 45 to 59 Minutes | 6,194 | 4.8% |
| 60 to 89 Minutes | 4,183 | 3.3% |
| 90 or more Minutes | 1,770 | 1.4% |
Commute Time by Sex in Pittsburgh
The most common commute times in Pittsburgh are 20 to 24 minutes (13,431 commuters, 20.4%) for males and 15 to 19 minutes (13,043 commuters, 20.8%) for females.
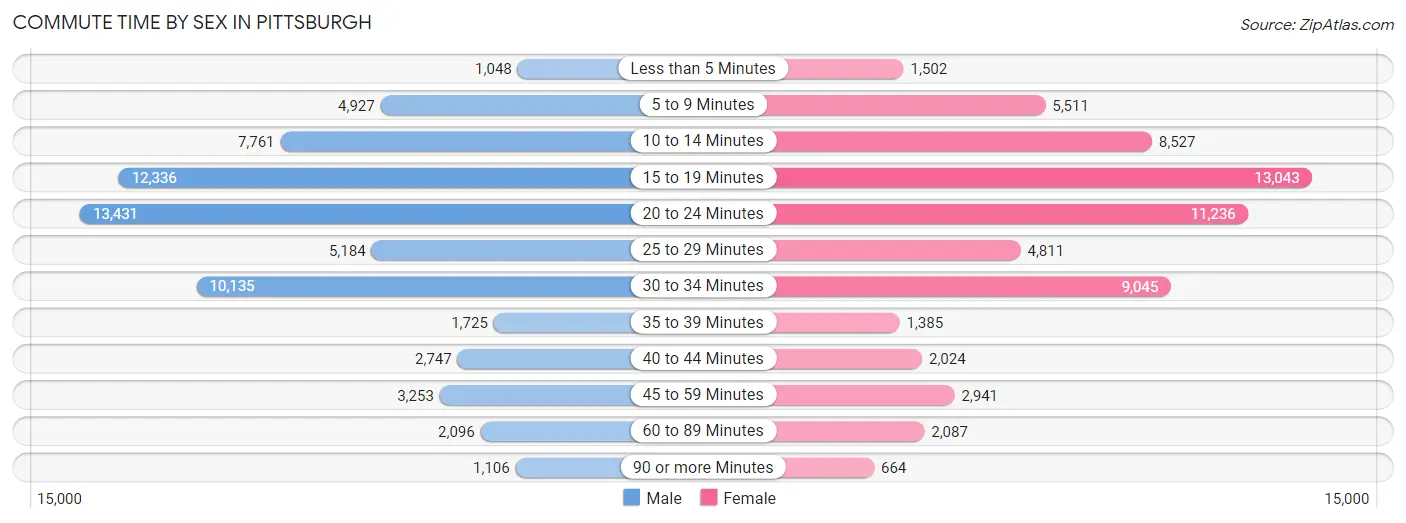
| Commute Time | Male | Female |
| Less than 5 Minutes | 1,048 (1.6%) | 1,502 (2.4%) |
| 5 to 9 Minutes | 4,927 (7.5%) | 5,511 (8.8%) |
| 10 to 14 Minutes | 7,761 (11.8%) | 8,527 (13.6%) |
| 15 to 19 Minutes | 12,336 (18.8%) | 13,043 (20.8%) |
| 20 to 24 Minutes | 13,431 (20.4%) | 11,236 (17.9%) |
| 25 to 29 Minutes | 5,184 (7.9%) | 4,811 (7.7%) |
| 30 to 34 Minutes | 10,135 (15.4%) | 9,045 (14.4%) |
| 35 to 39 Minutes | 1,725 (2.6%) | 1,385 (2.2%) |
| 40 to 44 Minutes | 2,747 (4.2%) | 2,024 (3.2%) |
| 45 to 59 Minutes | 3,253 (5.0%) | 2,941 (4.7%) |
| 60 to 89 Minutes | 2,096 (3.2%) | 2,087 (3.3%) |
| 90 or more Minutes | 1,106 (1.7%) | 664 (1.1%) |
Time of Departure to Work by Sex in Pittsburgh
The most frequent times of departure to work in Pittsburgh are 8:00 AM to 8:29 AM (8,422, 12.8%) for males and 8:00 AM to 8:29 AM (8,801, 14.0%) for females.
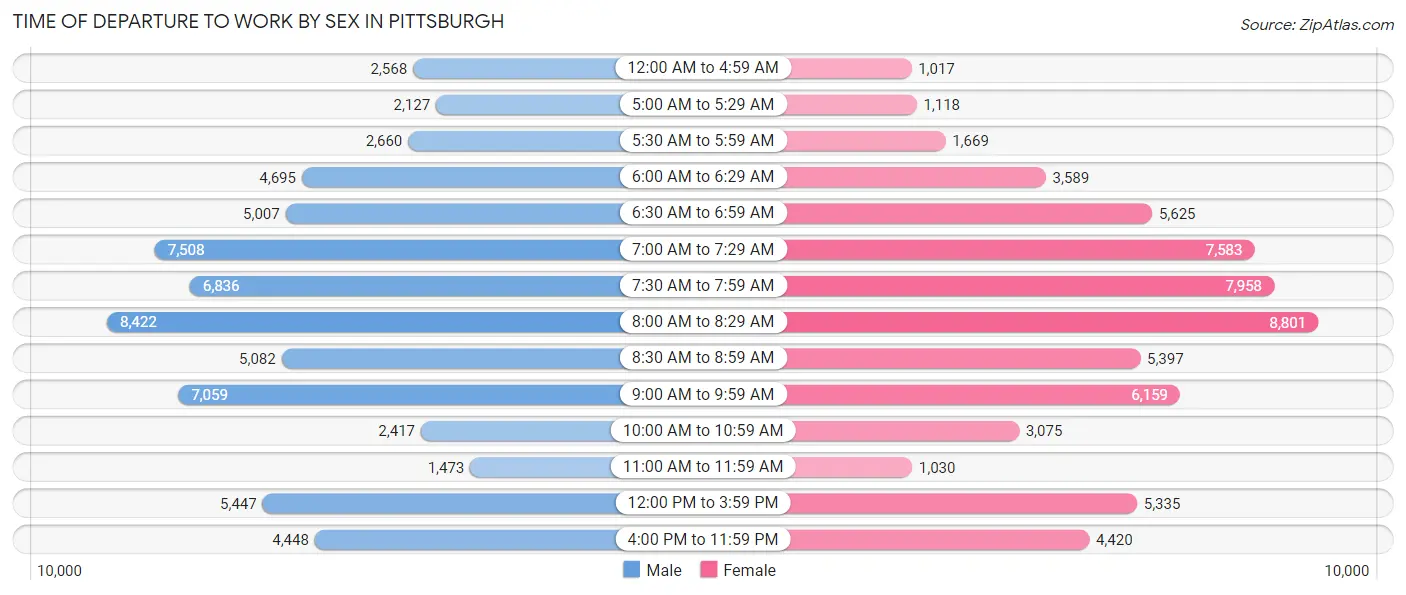
| Time of Departure | Male | Female |
| 12:00 AM to 4:59 AM | 2,568 (3.9%) | 1,017 (1.6%) |
| 5:00 AM to 5:29 AM | 2,127 (3.2%) | 1,118 (1.8%) |
| 5:30 AM to 5:59 AM | 2,660 (4.1%) | 1,669 (2.7%) |
| 6:00 AM to 6:29 AM | 4,695 (7.1%) | 3,589 (5.7%) |
| 6:30 AM to 6:59 AM | 5,007 (7.6%) | 5,625 (9.0%) |
| 7:00 AM to 7:29 AM | 7,508 (11.4%) | 7,583 (12.1%) |
| 7:30 AM to 7:59 AM | 6,836 (10.4%) | 7,958 (12.7%) |
| 8:00 AM to 8:29 AM | 8,422 (12.8%) | 8,801 (14.0%) |
| 8:30 AM to 8:59 AM | 5,082 (7.7%) | 5,397 (8.6%) |
| 9:00 AM to 9:59 AM | 7,059 (10.7%) | 6,159 (9.8%) |
| 10:00 AM to 10:59 AM | 2,417 (3.7%) | 3,075 (4.9%) |
| 11:00 AM to 11:59 AM | 1,473 (2.2%) | 1,030 (1.6%) |
| 12:00 PM to 3:59 PM | 5,447 (8.3%) | 5,335 (8.5%) |
| 4:00 PM to 11:59 PM | 4,448 (6.8%) | 4,420 (7.0%) |
| Total | 65,749 (100.0%) | 62,776 (100.0%) |
Housing Occupancy in Pittsburgh
Occupancy by Ownership in Pittsburgh
Of the total 137,226 dwellings in Pittsburgh, owner-occupied units account for 64,984 (47.4%), while renter-occupied units make up 72,242 (52.6%).
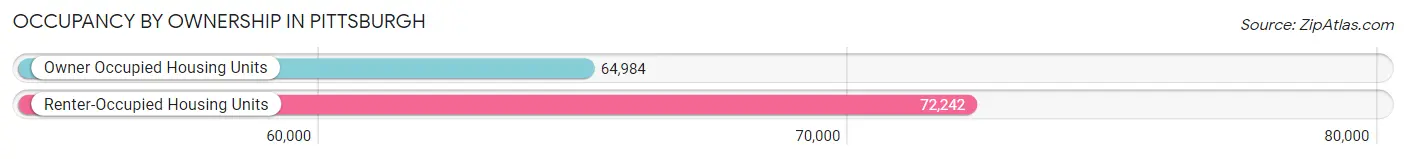
| Occupancy | # Housing Units | % Housing Units |
| Owner Occupied Housing Units | 64,984 | 47.4% |
| Renter-Occupied Housing Units | 72,242 | 52.6% |
| Total Occupied Housing Units | 137,226 | 100.0% |
Occupancy by Household Size in Pittsburgh
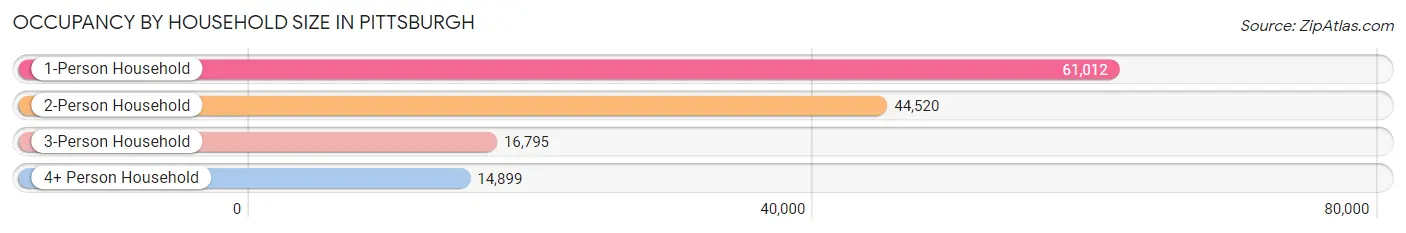
| Household Size | # Housing Units | % Housing Units |
| 1-Person Household | 61,012 | 44.5% |
| 2-Person Household | 44,520 | 32.4% |
| 3-Person Household | 16,795 | 12.2% |
| 4+ Person Household | 14,899 | 10.9% |
| Total Housing Units | 137,226 | 100.0% |
Occupancy by Ownership by Household Size in Pittsburgh
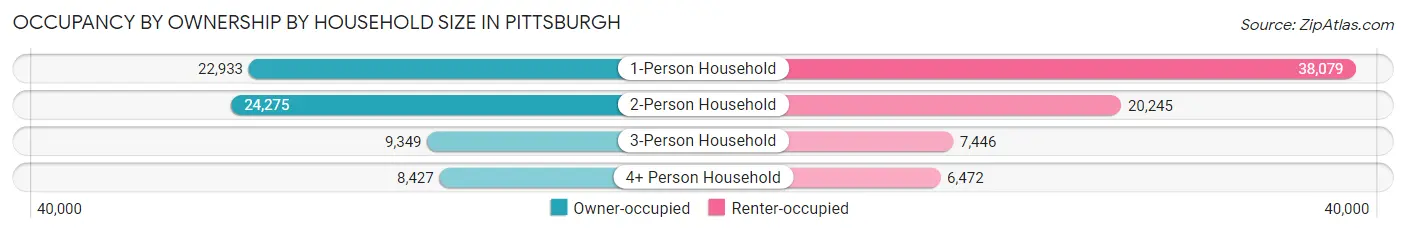
| Household Size | Owner-occupied | Renter-occupied |
| 1-Person Household | 22,933 (37.6%) | 38,079 (62.4%) |
| 2-Person Household | 24,275 (54.5%) | 20,245 (45.5%) |
| 3-Person Household | 9,349 (55.7%) | 7,446 (44.3%) |
| 4+ Person Household | 8,427 (56.6%) | 6,472 (43.4%) |
| Total Housing Units | 64,984 (47.4%) | 72,242 (52.6%) |
Occupancy by Educational Attainment in Pittsburgh
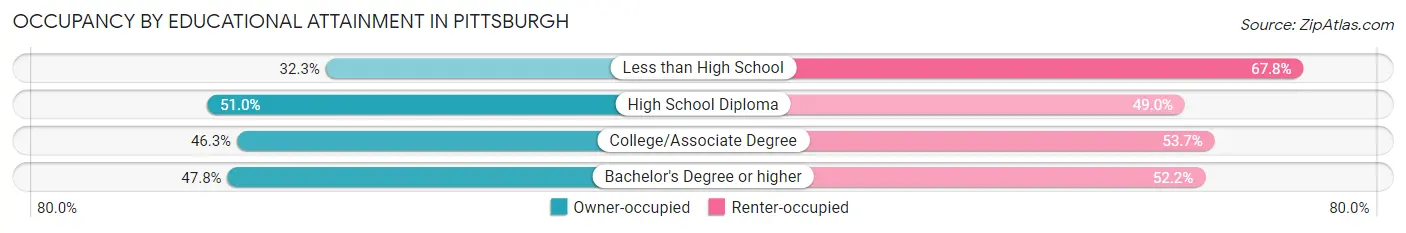
| Household Size | Owner-occupied | Renter-occupied |
| Less than High School | 2,201 (32.3%) | 4,623 (67.7%) |
| High School Diploma | 14,702 (51.0%) | 14,103 (49.0%) |
| College/Associate Degree | 15,580 (46.3%) | 18,059 (53.7%) |
| Bachelor's Degree or higher | 32,501 (47.8%) | 35,457 (52.2%) |
Occupancy by Age of Householder in Pittsburgh
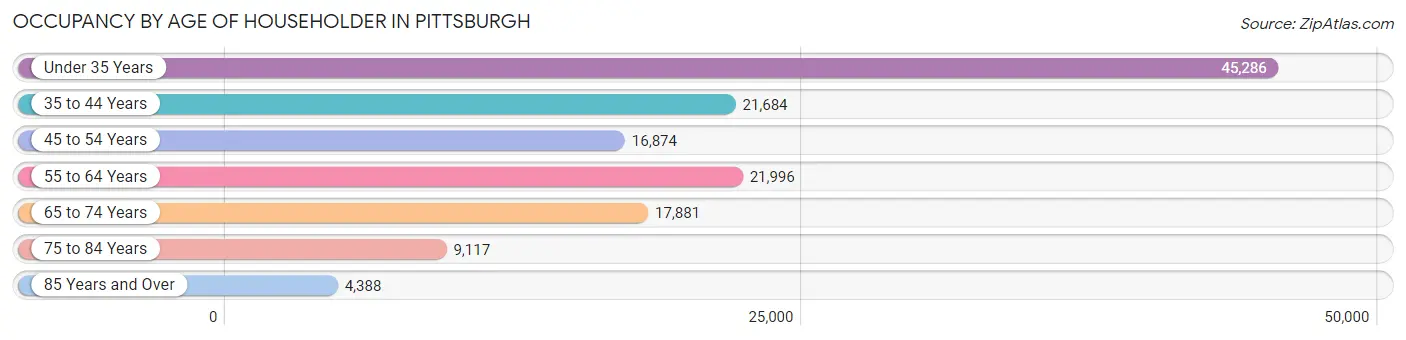
| Age Bracket | # Households | % Households |
| Under 35 Years | 45,286 | 33.0% |
| 35 to 44 Years | 21,684 | 15.8% |
| 45 to 54 Years | 16,874 | 12.3% |
| 55 to 64 Years | 21,996 | 16.0% |
| 65 to 74 Years | 17,881 | 13.0% |
| 75 to 84 Years | 9,117 | 6.6% |
| 85 Years and Over | 4,388 | 3.2% |
| Total | 137,226 | 100.0% |
Housing Finances in Pittsburgh
Median Income by Occupancy in Pittsburgh
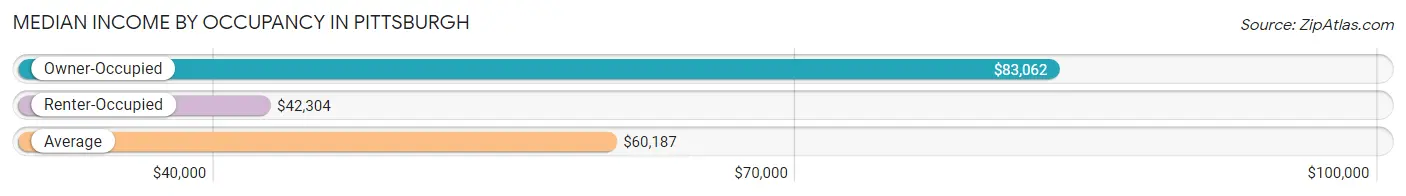
| Occupancy Type | # Households | Median Income |
| Owner-Occupied | 64,984 (47.4%) | $83,062 |
| Renter-Occupied | 72,242 (52.6%) | $42,304 |
| Average | 137,226 (100.0%) | $60,187 |
Occupancy by Householder Income Bracket in Pittsburgh
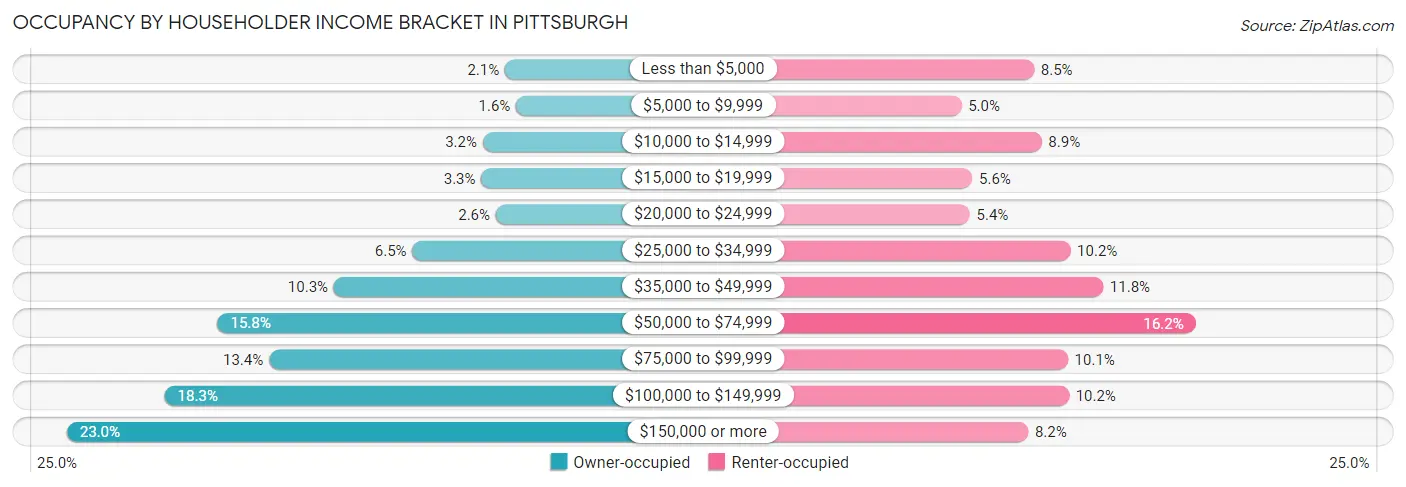
| Income Bracket | Owner-occupied | Renter-occupied |
| Less than $5,000 | 1,375 (2.1%) | 6,133 (8.5%) |
| $5,000 to $9,999 | 1,035 (1.6%) | 3,636 (5.0%) |
| $10,000 to $14,999 | 2,069 (3.2%) | 6,394 (8.8%) |
| $15,000 to $19,999 | 2,110 (3.3%) | 4,012 (5.6%) |
| $20,000 to $24,999 | 1,663 (2.6%) | 3,924 (5.4%) |
| $25,000 to $34,999 | 4,244 (6.5%) | 7,384 (10.2%) |
| $35,000 to $49,999 | 6,676 (10.3%) | 8,507 (11.8%) |
| $50,000 to $74,999 | 10,275 (15.8%) | 11,695 (16.2%) |
| $75,000 to $99,999 | 8,684 (13.4%) | 7,296 (10.1%) |
| $100,000 to $149,999 | 11,914 (18.3%) | 7,332 (10.2%) |
| $150,000 or more | 14,939 (23.0%) | 5,929 (8.2%) |
| Total | 64,984 (100.0%) | 72,242 (100.0%) |
Monthly Housing Cost Tiers in Pittsburgh
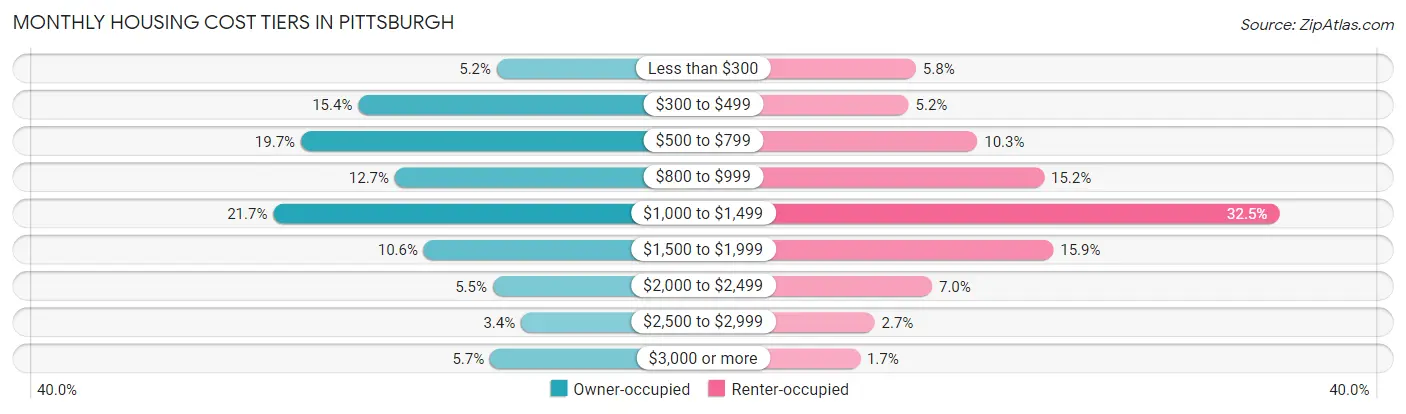
| Monthly Cost | Owner-occupied | Renter-occupied |
| Less than $300 | 3,393 (5.2%) | 4,179 (5.8%) |
| $300 to $499 | 10,028 (15.4%) | 3,785 (5.2%) |
| $500 to $799 | 12,770 (19.7%) | 7,438 (10.3%) |
| $800 to $999 | 8,271 (12.7%) | 10,995 (15.2%) |
| $1,000 to $1,499 | 14,093 (21.7%) | 23,498 (32.5%) |
| $1,500 to $1,999 | 6,889 (10.6%) | 11,487 (15.9%) |
| $2,000 to $2,499 | 3,586 (5.5%) | 5,035 (7.0%) |
| $2,500 to $2,999 | 2,236 (3.4%) | 1,978 (2.7%) |
| $3,000 or more | 3,718 (5.7%) | 1,202 (1.7%) |
| Total | 64,984 (100.0%) | 72,242 (100.0%) |
Physical Housing Characteristics in Pittsburgh
Housing Structures in Pittsburgh
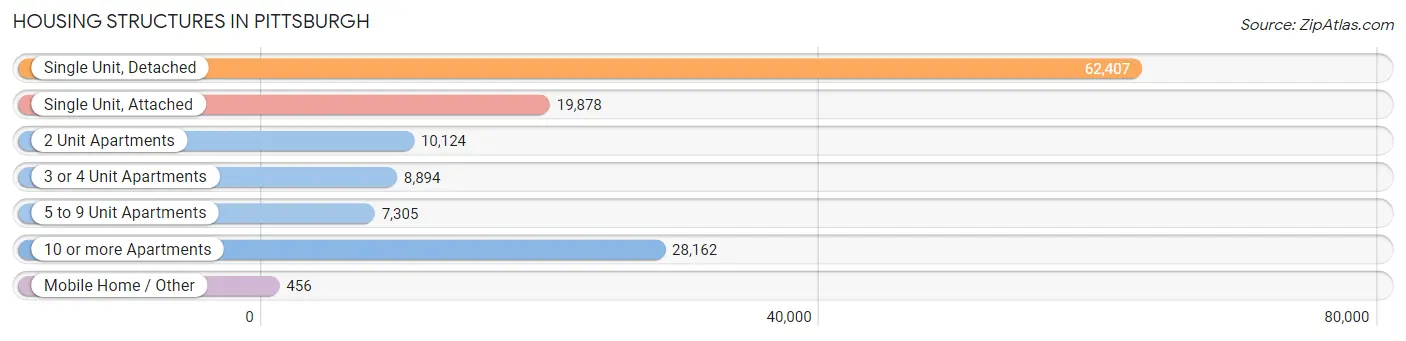
| Structure Type | # Housing Units | % Housing Units |
| Single Unit, Detached | 62,407 | 45.5% |
| Single Unit, Attached | 19,878 | 14.5% |
| 2 Unit Apartments | 10,124 | 7.4% |
| 3 or 4 Unit Apartments | 8,894 | 6.5% |
| 5 to 9 Unit Apartments | 7,305 | 5.3% |
| 10 or more Apartments | 28,162 | 20.5% |
| Mobile Home / Other | 456 | 0.3% |
| Total | 137,226 | 100.0% |
Housing Structures by Occupancy in Pittsburgh
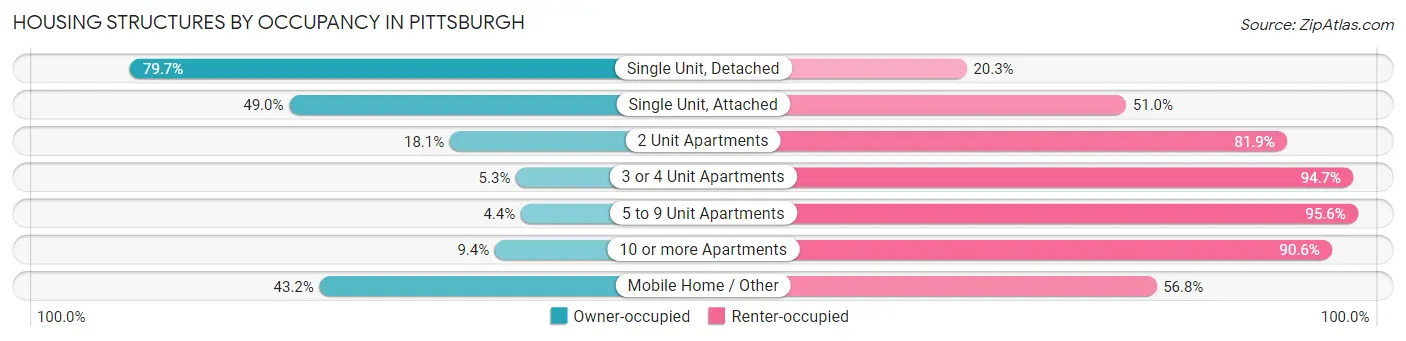
| Structure Type | Owner-occupied | Renter-occupied |
| Single Unit, Detached | 49,756 (79.7%) | 12,651 (20.3%) |
| Single Unit, Attached | 9,748 (49.0%) | 10,130 (51.0%) |
| 2 Unit Apartments | 1,831 (18.1%) | 8,293 (81.9%) |
| 3 or 4 Unit Apartments | 475 (5.3%) | 8,419 (94.7%) |
| 5 to 9 Unit Apartments | 323 (4.4%) | 6,982 (95.6%) |
| 10 or more Apartments | 2,654 (9.4%) | 25,508 (90.6%) |
| Mobile Home / Other | 197 (43.2%) | 259 (56.8%) |
| Total | 64,984 (47.4%) | 72,242 (52.6%) |
Housing Structures by Number of Rooms in Pittsburgh
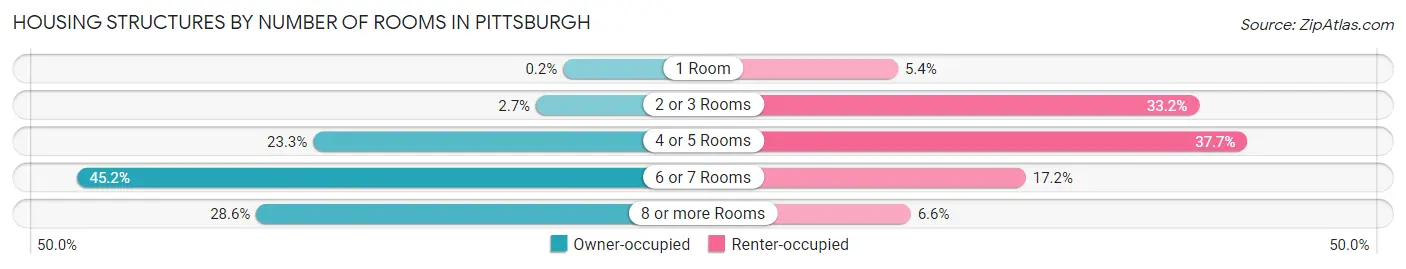
| Number of Rooms | Owner-occupied | Renter-occupied |
| 1 Room | 132 (0.2%) | 3,882 (5.4%) |
| 2 or 3 Rooms | 1,759 (2.7%) | 23,992 (33.2%) |
| 4 or 5 Rooms | 15,154 (23.3%) | 27,216 (37.7%) |
| 6 or 7 Rooms | 29,368 (45.2%) | 12,422 (17.2%) |
| 8 or more Rooms | 18,571 (28.6%) | 4,730 (6.6%) |
| Total | 64,984 (100.0%) | 72,242 (100.0%) |
Housing Structure by Heating Type in Pittsburgh
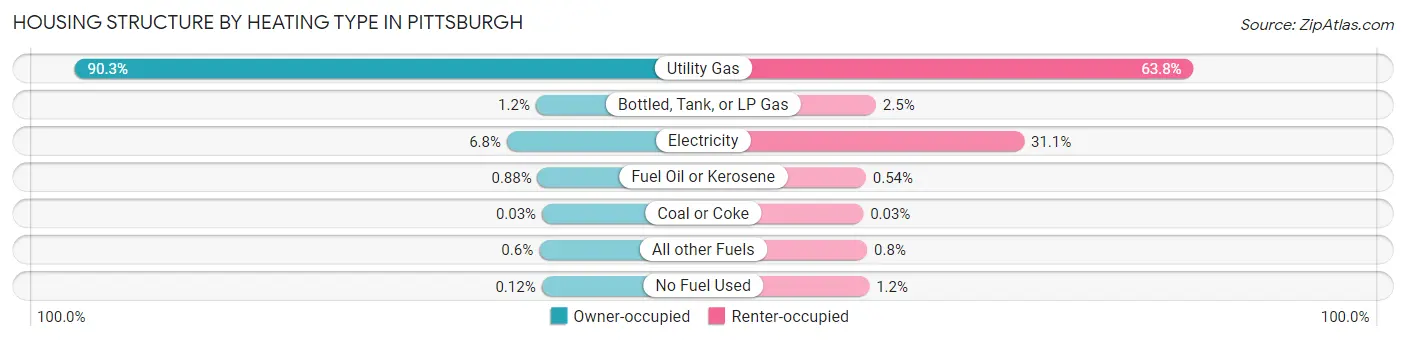
| Heating Type | Owner-occupied | Renter-occupied |
| Utility Gas | 58,694 (90.3%) | 46,116 (63.8%) |
| Bottled, Tank, or LP Gas | 801 (1.2%) | 1,798 (2.5%) |
| Electricity | 4,432 (6.8%) | 22,473 (31.1%) |
| Fuel Oil or Kerosene | 572 (0.9%) | 387 (0.5%) |
| Coal or Coke | 17 (0.0%) | 24 (0.0%) |
| All other Fuels | 388 (0.6%) | 577 (0.8%) |
| No Fuel Used | 80 (0.1%) | 867 (1.2%) |
| Total | 64,984 (100.0%) | 72,242 (100.0%) |
Household Vehicle Usage in Pittsburgh
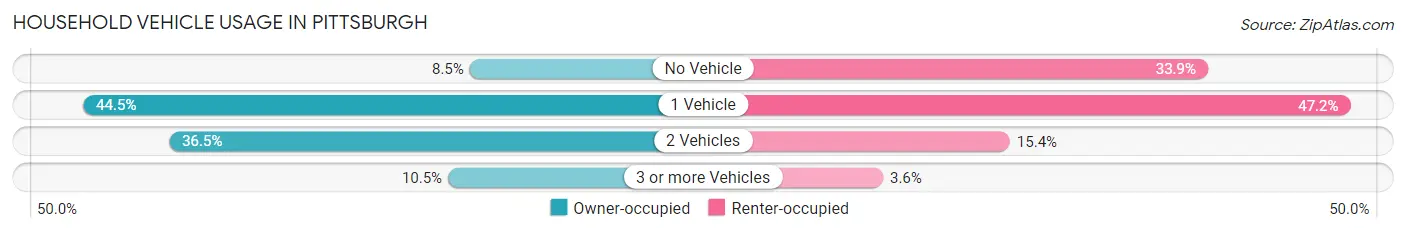
| Vehicles per Household | Owner-occupied | Renter-occupied |
| No Vehicle | 5,495 (8.5%) | 24,471 (33.9%) |
| 1 Vehicle | 28,946 (44.5%) | 34,076 (47.2%) |
| 2 Vehicles | 23,732 (36.5%) | 11,126 (15.4%) |
| 3 or more Vehicles | 6,811 (10.5%) | 2,569 (3.6%) |
| Total | 64,984 (100.0%) | 72,242 (100.0%) |
Real Estate & Mortgages in Pittsburgh
Real Estate and Mortgage Overview in Pittsburgh
| Characteristic | Without Mortgage | With Mortgage |
| Housing Units | 28,707 | 36,277 |
| Median Property Value | $147,000 | $194,100 |
| Median Household Income | $61,938 | $10,526 |
| Monthly Housing Costs | $533 | $3,539 |
| Real Estate Taxes | $1,515 | $834 |
Property Value by Mortgage Status in Pittsburgh
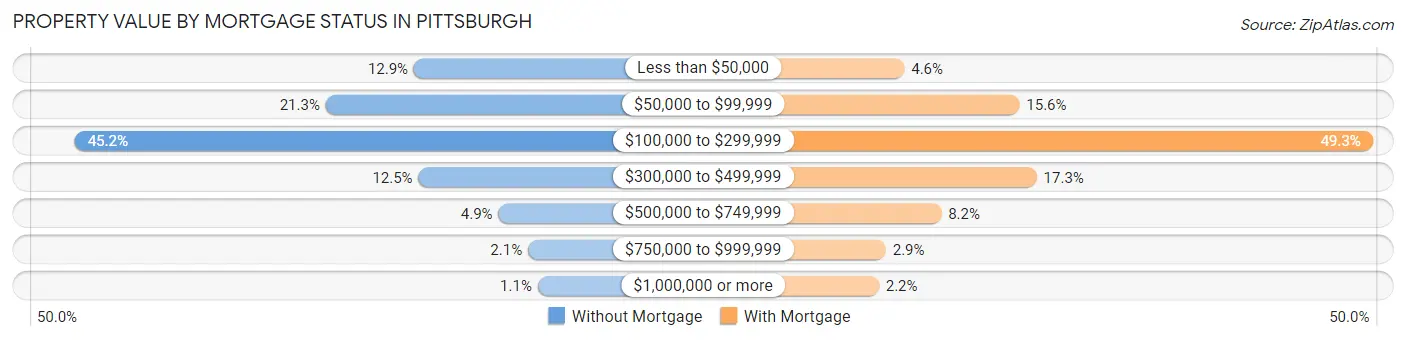
| Property Value | Without Mortgage | With Mortgage |
| Less than $50,000 | 3,708 (12.9%) | 1,685 (4.6%) |
| $50,000 to $99,999 | 6,120 (21.3%) | 5,660 (15.6%) |
| $100,000 to $299,999 | 12,981 (45.2%) | 17,866 (49.2%) |
| $300,000 to $499,999 | 3,585 (12.5%) | 6,258 (17.2%) |
| $500,000 to $749,999 | 1,398 (4.9%) | 2,960 (8.2%) |
| $750,000 to $999,999 | 592 (2.1%) | 1,045 (2.9%) |
| $1,000,000 or more | 323 (1.1%) | 803 (2.2%) |
| Total | 28,707 (100.0%) | 36,277 (100.0%) |
Household Income by Mortgage Status in Pittsburgh
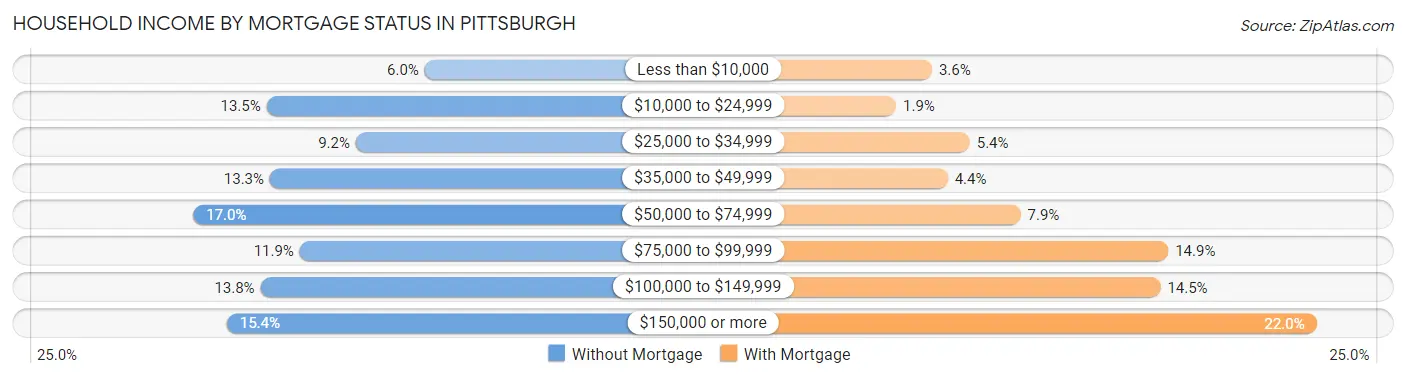
| Household Income | Without Mortgage | With Mortgage |
| Less than $10,000 | 1,709 (5.9%) | 1,319 (3.6%) |
| $10,000 to $24,999 | 3,869 (13.5%) | 701 (1.9%) |
| $25,000 to $34,999 | 2,651 (9.2%) | 1,973 (5.4%) |
| $35,000 to $49,999 | 3,823 (13.3%) | 1,593 (4.4%) |
| $50,000 to $74,999 | 4,872 (17.0%) | 2,853 (7.9%) |
| $75,000 to $99,999 | 3,417 (11.9%) | 5,403 (14.9%) |
| $100,000 to $149,999 | 3,953 (13.8%) | 5,267 (14.5%) |
| $150,000 or more | 4,413 (15.4%) | 7,961 (22.0%) |
| Total | 28,707 (100.0%) | 36,277 (100.0%) |
Property Value to Household Income Ratio in Pittsburgh
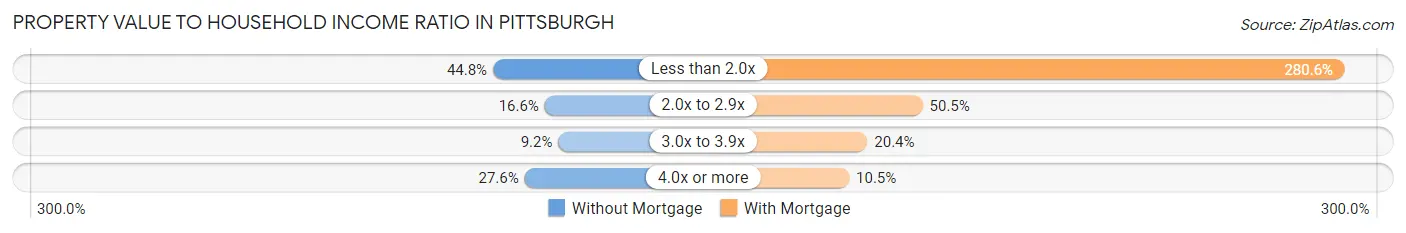
| Value-to-Income Ratio | Without Mortgage | With Mortgage |
| Less than 2.0x | 12,871 (44.8%) | 101,778 (280.6%) |
| 2.0x to 2.9x | 4,775 (16.6%) | 18,319 (50.5%) |
| 3.0x to 3.9x | 2,648 (9.2%) | 7,396 (20.4%) |
| 4.0x or more | 7,932 (27.6%) | 3,792 (10.4%) |
| Total | 28,707 (100.0%) | 36,277 (100.0%) |
Real Estate Taxes by Mortgage Status in Pittsburgh
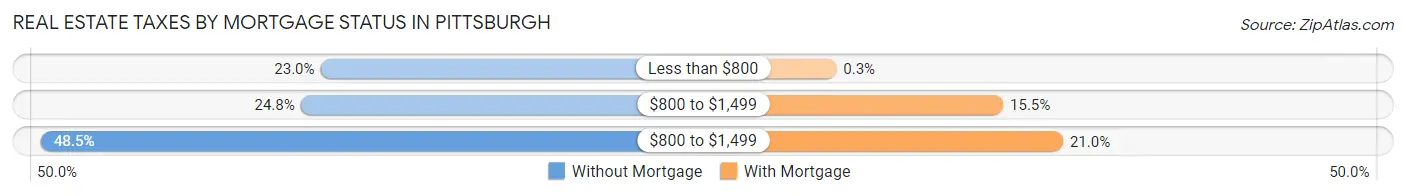
| Property Taxes | Without Mortgage | With Mortgage |
| Less than $800 | 6,599 (23.0%) | 110 (0.3%) |
| $800 to $1,499 | 7,120 (24.8%) | 5,635 (15.5%) |
| $800 to $1,499 | 13,924 (48.5%) | 7,618 (21.0%) |
| Total | 28,707 (100.0%) | 36,277 (100.0%) |
Health & Disability in Pittsburgh
Health Insurance Coverage by Age in Pittsburgh
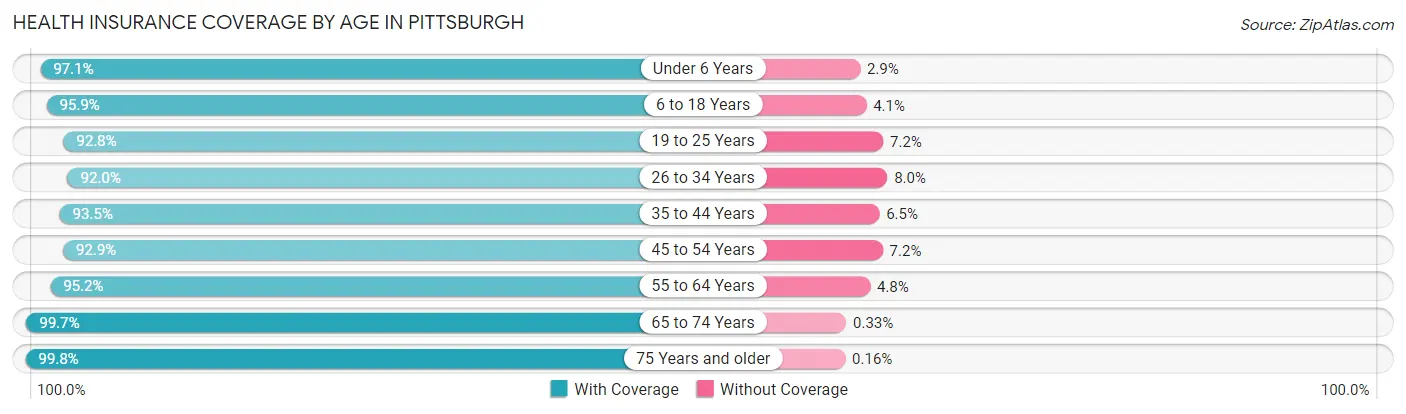
| Age Bracket | With Coverage | Without Coverage |
| Under 6 Years | 15,622 (97.1%) | 470 (2.9%) |
| 6 to 18 Years | 34,292 (95.9%) | 1,459 (4.1%) |
| 19 to 25 Years | 46,408 (92.8%) | 3,623 (7.2%) |
| 26 to 34 Years | 51,725 (92.0%) | 4,501 (8.0%) |
| 35 to 44 Years | 33,615 (93.5%) | 2,341 (6.5%) |
| 45 to 54 Years | 25,567 (92.8%) | 1,968 (7.1%) |
| 55 to 64 Years | 32,048 (95.2%) | 1,609 (4.8%) |
| 65 to 74 Years | 25,972 (99.7%) | 87 (0.3%) |
| 75 Years and older | 17,798 (99.8%) | 29 (0.2%) |
| Total | 283,047 (94.6%) | 16,087 (5.4%) |
Health Insurance Coverage by Citizenship Status in Pittsburgh
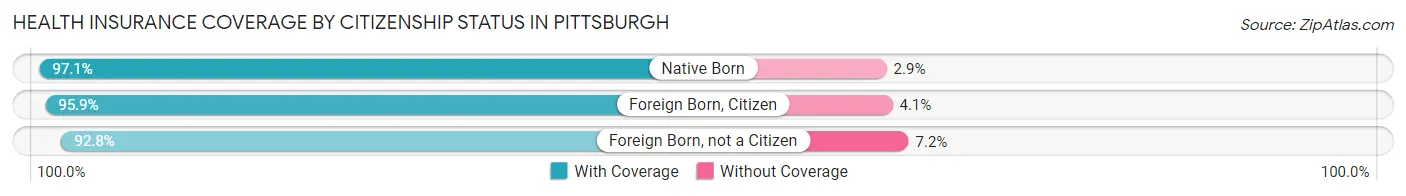
| Citizenship Status | With Coverage | Without Coverage |
| Native Born | 15,622 (97.1%) | 470 (2.9%) |
| Foreign Born, Citizen | 34,292 (95.9%) | 1,459 (4.1%) |
| Foreign Born, not a Citizen | 46,408 (92.8%) | 3,623 (7.2%) |
Health Insurance Coverage by Household Income in Pittsburgh
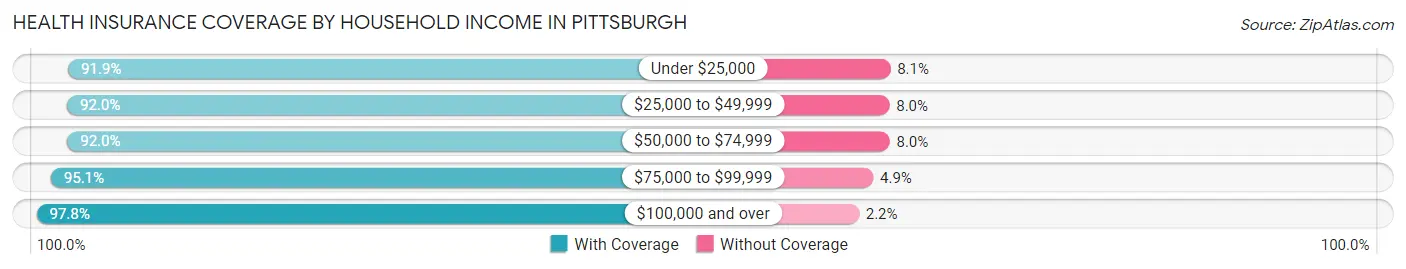
| Household Income | With Coverage | Without Coverage |
| Under $25,000 | 47,196 (91.9%) | 4,184 (8.1%) |
| $25,000 to $49,999 | 44,646 (92.0%) | 3,861 (8.0%) |
| $50,000 to $74,999 | 41,395 (92.0%) | 3,606 (8.0%) |
| $75,000 to $99,999 | 32,647 (95.1%) | 1,692 (4.9%) |
| $100,000 and over | 98,718 (97.8%) | 2,259 (2.2%) |
Public vs Private Health Insurance Coverage by Age in Pittsburgh
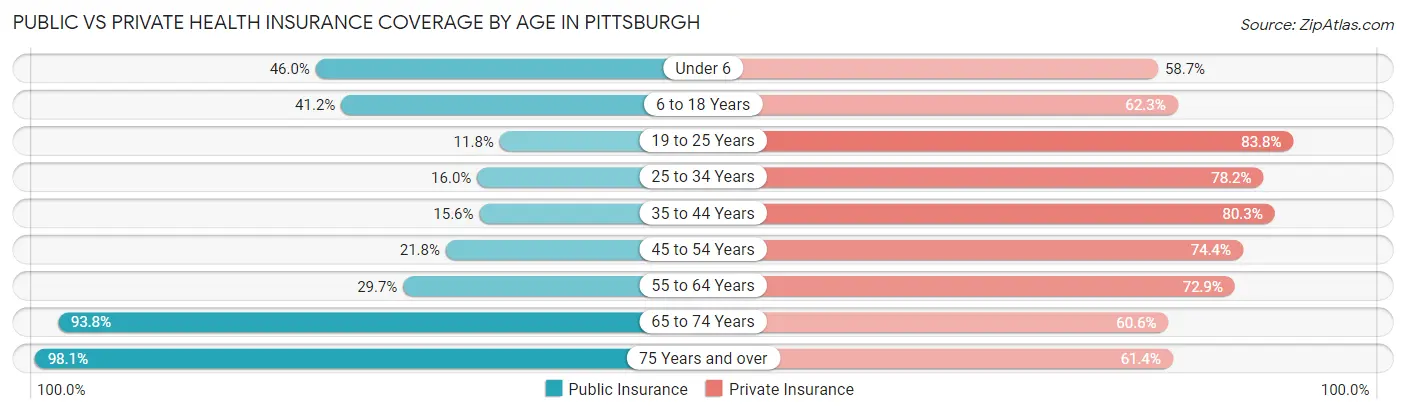
| Age Bracket | Public Insurance | Private Insurance |
| Under 6 | 7,398 (46.0%) | 9,442 (58.7%) |
| 6 to 18 Years | 14,744 (41.2%) | 22,280 (62.3%) |
| 19 to 25 Years | 5,915 (11.8%) | 41,926 (83.8%) |
| 25 to 34 Years | 8,995 (16.0%) | 43,987 (78.2%) |
| 35 to 44 Years | 5,604 (15.6%) | 28,881 (80.3%) |
| 45 to 54 Years | 6,008 (21.8%) | 20,497 (74.4%) |
| 55 to 64 Years | 10,005 (29.7%) | 24,549 (72.9%) |
| 65 to 74 Years | 24,450 (93.8%) | 15,796 (60.6%) |
| 75 Years and over | 17,490 (98.1%) | 10,949 (61.4%) |
| Total | 100,609 (33.6%) | 218,307 (73.0%) |
Disability Status by Sex by Age in Pittsburgh
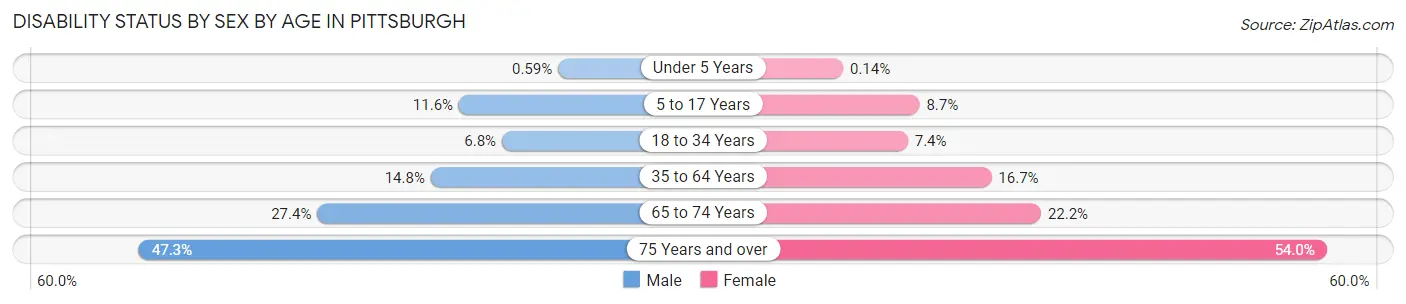
| Age Bracket | Male | Female |
| Under 5 Years | 43 (0.6%) | 9 (0.1%) |
| 5 to 17 Years | 1,862 (11.6%) | 1,251 (8.6%) |
| 18 to 34 Years | 3,821 (6.8%) | 4,263 (7.3%) |
| 35 to 64 Years | 7,162 (14.8%) | 8,103 (16.7%) |
| 65 to 74 Years | 3,197 (27.4%) | 3,193 (22.2%) |
| 75 Years and over | 3,043 (47.3%) | 6,150 (54.0%) |
Disability Class by Sex by Age in Pittsburgh
Disability Class: Hearing Difficulty
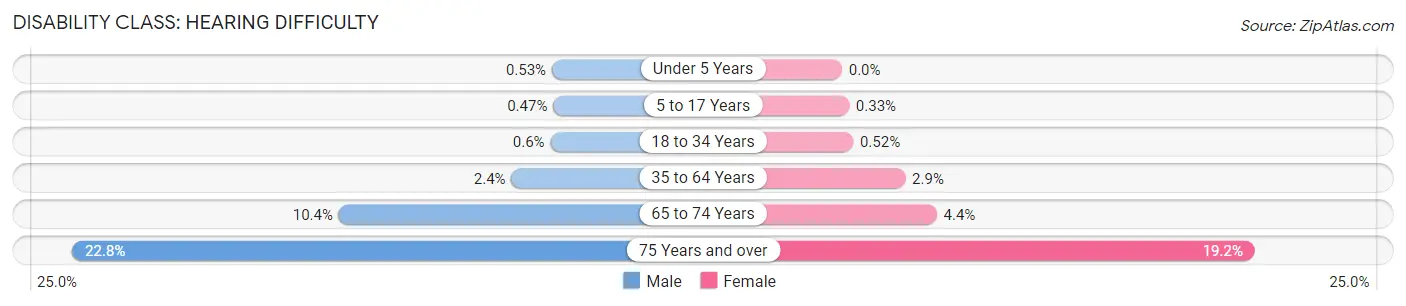
| Age Bracket | Male | Female |
| Under 5 Years | 38 (0.5%) | 0 (0.0%) |
| 5 to 17 Years | 76 (0.5%) | 48 (0.3%) |
| 18 to 34 Years | 336 (0.6%) | 300 (0.5%) |
| 35 to 64 Years | 1,167 (2.4%) | 1,430 (2.9%) |
| 65 to 74 Years | 1,216 (10.4%) | 633 (4.4%) |
| 75 Years and over | 1,468 (22.8%) | 2,182 (19.2%) |
Disability Class: Vision Difficulty
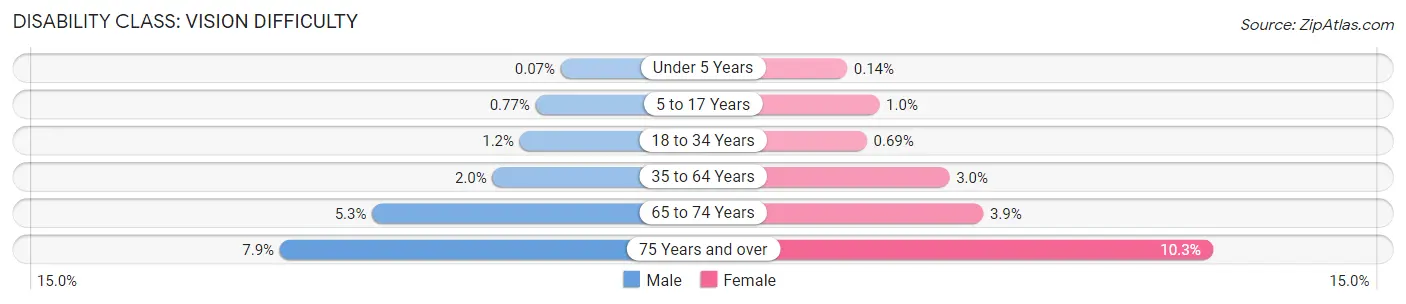
| Age Bracket | Male | Female |
| Under 5 Years | 5 (0.1%) | 9 (0.1%) |
| 5 to 17 Years | 123 (0.8%) | 151 (1.0%) |
| 18 to 34 Years | 678 (1.2%) | 398 (0.7%) |
| 35 to 64 Years | 957 (2.0%) | 1,455 (3.0%) |
| 65 to 74 Years | 620 (5.3%) | 565 (3.9%) |
| 75 Years and over | 508 (7.9%) | 1,175 (10.3%) |
Disability Class: Cognitive Difficulty
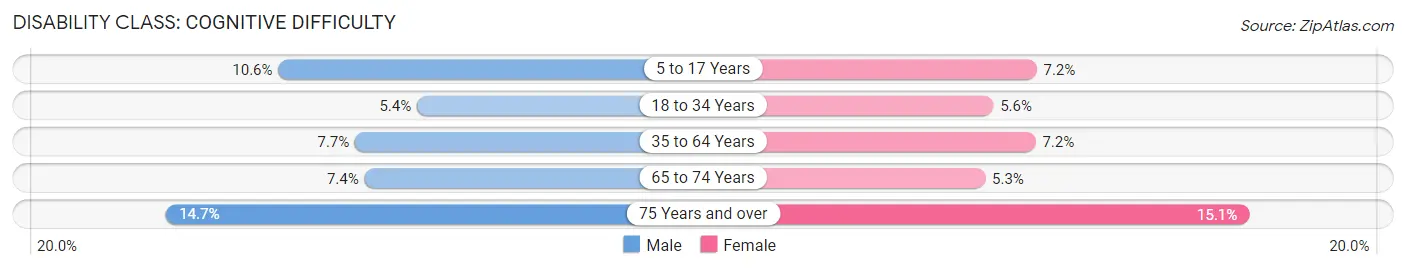
| Age Bracket | Male | Female |
| 5 to 17 Years | 1,694 (10.6%) | 1,046 (7.2%) |
| 18 to 34 Years | 3,033 (5.4%) | 3,260 (5.6%) |
| 35 to 64 Years | 3,750 (7.7%) | 3,496 (7.2%) |
| 65 to 74 Years | 861 (7.4%) | 766 (5.3%) |
| 75 Years and over | 949 (14.7%) | 1,722 (15.1%) |
Disability Class: Ambulatory Difficulty
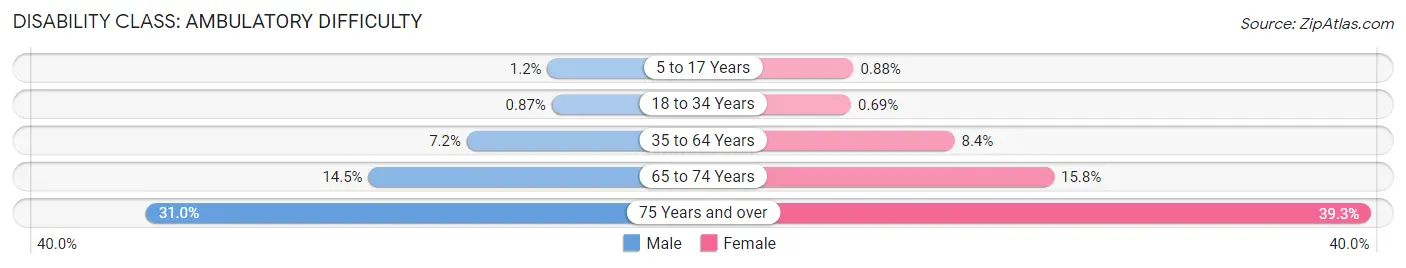
| Age Bracket | Male | Female |
| 5 to 17 Years | 189 (1.2%) | 127 (0.9%) |
| 18 to 34 Years | 486 (0.9%) | 403 (0.7%) |
| 35 to 64 Years | 3,480 (7.2%) | 4,073 (8.4%) |
| 65 to 74 Years | 1,688 (14.5%) | 2,268 (15.8%) |
| 75 Years and over | 1,996 (31.0%) | 4,476 (39.3%) |
Disability Class: Self-Care Difficulty
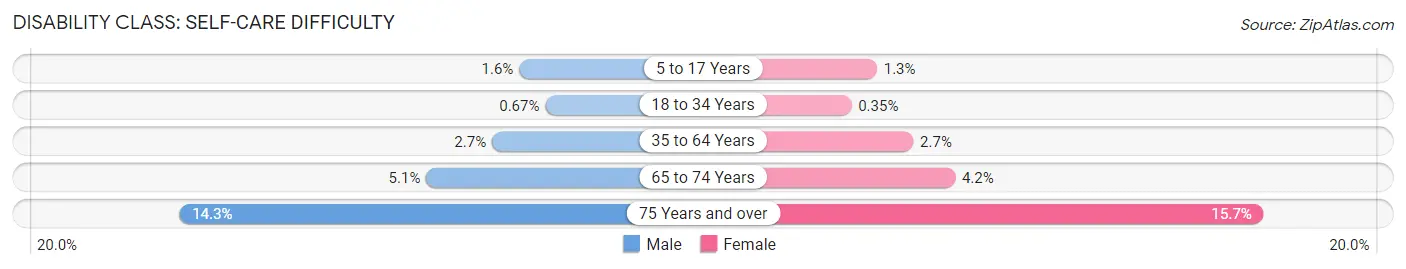
| Age Bracket | Male | Female |
| 5 to 17 Years | 262 (1.6%) | 188 (1.3%) |
| 18 to 34 Years | 376 (0.7%) | 204 (0.4%) |
| 35 to 64 Years | 1,284 (2.6%) | 1,291 (2.6%) |
| 65 to 74 Years | 594 (5.1%) | 605 (4.2%) |
| 75 Years and over | 918 (14.3%) | 1,783 (15.7%) |
Technology Access in Pittsburgh
Computing Device Access in Pittsburgh
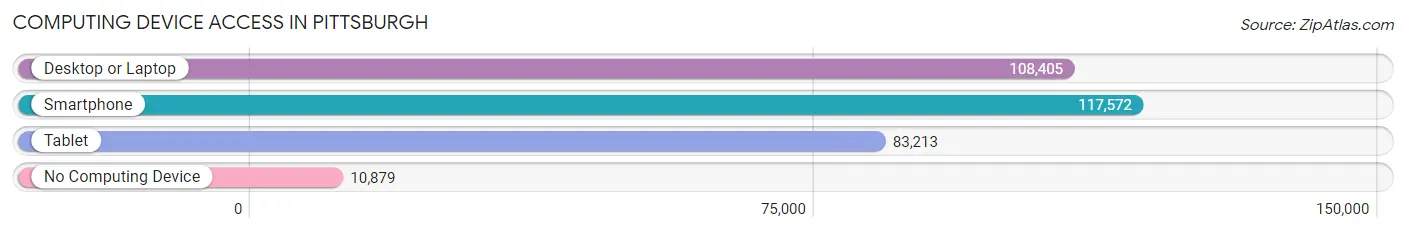
| Device Type | # Households | % Households |
| Desktop or Laptop | 108,405 | 79.0% |
| Smartphone | 117,572 | 85.7% |
| Tablet | 83,213 | 60.6% |
| No Computing Device | 10,879 | 7.9% |
| Total | 137,226 | 100.0% |
Internet Access in Pittsburgh
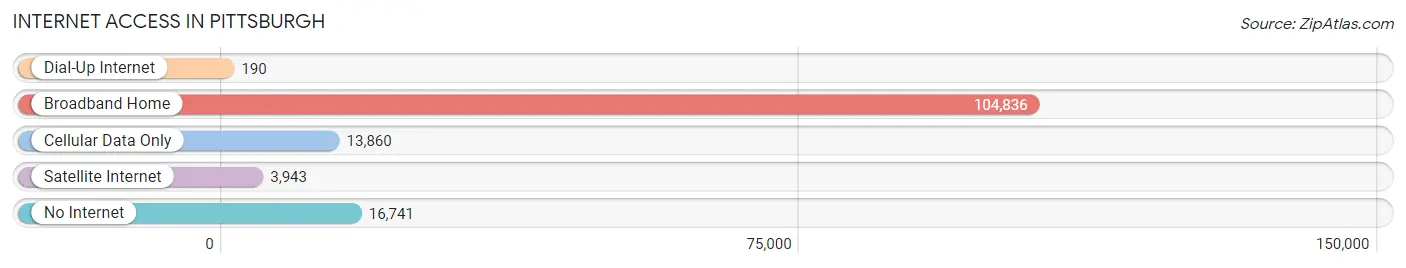
| Internet Type | # Households | % Households |
| Dial-Up Internet | 190 | 0.1% |
| Broadband Home | 104,836 | 76.4% |
| Cellular Data Only | 13,860 | 10.1% |
| Satellite Internet | 3,943 | 2.9% |
| No Internet | 16,741 | 12.2% |
| Total | 137,226 | 100.0% |
Pittsburgh Summary
Pittsburgh, Pennsylvania is a city located in the southwestern corner of the state, along the Allegheny and Monongahela Rivers. It is the county seat of Allegheny County and the second-largest city in the state. Pittsburgh is known for its steel industry, its three rivers, and its many bridges. It is also home to several universities, including the University of Pittsburgh and Carnegie Mellon University.
Geography
Pittsburgh is located in the Allegheny Plateau region of Pennsylvania, at the confluence of the Allegheny and Monongahela Rivers. The city is situated at the foothills of the Appalachian Mountains, and is surrounded by rolling hills and valleys. The city is divided into 90 neighborhoods, each with its own unique character and history.
The city has a total area of 58.3 square miles, of which 55.6 square miles is land and 2.7 square miles is water. The city is located at an elevation of 1,223 feet above sea level.
Climate
Pittsburgh has a humid continental climate, with hot, humid summers and cold, snowy winters. The average annual temperature is 52.4°F, with an average high of 73.2°F in July and an average low of 31.2°F in January. The average annual precipitation is 39.3 inches, with an average of 4.3 inches of snow in January.
History
The area that is now Pittsburgh was first settled by Native Americans in the late 17th century. The first European settlers arrived in the area in 1758, when the British built Fort Pitt. The city was incorporated in 1816, and was named after William Pitt, the British Prime Minister.
Pittsburgh quickly became an important industrial center, due to its location at the confluence of the Allegheny and Monongahela Rivers. The city was a major producer of steel, coal, and other industrial products. The city was also home to several major universities, including the University of Pittsburgh and Carnegie Mellon University.
In the late 20th century, Pittsburgh began to transition away from its industrial roots and towards a more diversified economy. The city has become a major center for technology, healthcare, finance, and education.
Economy
Pittsburgh has a diversified economy, with a focus on technology, healthcare, finance, and education. The city is home to several major corporations, including UPMC, PNC Financial Services, and PPG Industries.
The city is also home to several universities, including the University of Pittsburgh and Carnegie Mellon University. These universities are major employers in the city, and are also major sources of research and development.
Demographics
As of the 2010 census, the population of Pittsburgh was 305,704. The city is 63.8% White, 26.8% African American, 4.3% Asian, and 2.2% Hispanic or Latino. The median household income is $37,719, and the median home value is $128,000.
The city is home to several major religions, including Christianity, Judaism, and Islam. The city is also home to a large LGBT community.
Conclusion
Pittsburgh, Pennsylvania is a city with a rich history and a diverse economy. It is home to several major corporations, universities, and religious communities. The city is also home to a vibrant LGBT community. Pittsburgh is a city of many cultures and backgrounds, and is a great place to live and work.
Common Questions
What is Per Capita Income in Pittsburgh?
Per Capita income in Pittsburgh is $41,146.
What is the Median Family Income in Pittsburgh?
Median Family Income in Pittsburgh is $85,816.
What is the Median Household income in Pittsburgh?
Median Household Income in Pittsburgh is $60,187.
What is Income or Wage Gap in Pittsburgh?
Income or Wage Gap in Pittsburgh is 28.4%.
Women in Pittsburgh earn 71.6 cents for every dollar earned by a man.
What is Family Income Deficit in Pittsburgh?
Family Income Deficit in Pittsburgh is $11,665.
Families that are below poverty line in Pittsburgh earn $11,665 less on average than the poverty threshold level.
What is Inequality or Gini Index in Pittsburgh?
Inequality or Gini Index in Pittsburgh is 0.51.
What is the Total Population of Pittsburgh?
Total Population of Pittsburgh is 303,843.
What is the Total Male Population of Pittsburgh?
Total Male Population of Pittsburgh is 148,973.
What is the Total Female Population of Pittsburgh?
Total Female Population of Pittsburgh is 154,870.
What is the Ratio of Males per 100 Females in Pittsburgh?
There are 96.19 Males per 100 Females in Pittsburgh.
What is the Ratio of Females per 100 Males in Pittsburgh?
There are 103.96 Females per 100 Males in Pittsburgh.
What is the Median Population Age in Pittsburgh?
Median Population Age in Pittsburgh is 33.5 Years.
What is the Average Family Size in Pittsburgh
Average Family Size in Pittsburgh is 2.9 People.
What is the Average Household Size in Pittsburgh
Average Household Size in Pittsburgh is 2.0 People.
How Large is the Labor Force in Pittsburgh?
There are 169,898 People in the Labor Forcein in Pittsburgh.
What is the Percentage of People in the Labor Force in Pittsburgh?
64.3% of People are in the Labor Force in Pittsburgh.
What is the Unemployment Rate in Pittsburgh?
Unemployment Rate in Pittsburgh is 5.7%.