Chester, PA Map & Demographics
Chester Map
Chester Overview
$21,949
PER CAPITA INCOME
$53,048
AVG FAMILY INCOME
$39,193
AVG HOUSEHOLD INCOME
4.4%
WAGE / INCOME GAP [ % ]
95.6¢/ $1
WAGE / INCOME GAP [ $ ]
$9,731
FAMILY INCOME DEFICIT
0.46
INEQUALITY / GINI INDEX
33,048
TOTAL POPULATION
15,980
MALE POPULATION
17,068
FEMALE POPULATION
93.63
MALES / 100 FEMALES
106.81
FEMALES / 100 MALES
32.7
MEDIAN AGE
3.3
AVG FAMILY SIZE
2.4
AVG HOUSEHOLD SIZE
15,425
LABOR FORCE [ PEOPLE ]
59.2%
PERCENT IN LABOR FORCE
15.9%
UNEMPLOYMENT RATE
Chester Zip Codes
Income in Chester
Income Overview in Chester
Per Capita Income in Chester is $21,949, while median incomes of families and households are $53,048 and $39,193 respectively.
| Characteristic | Number | Measure |
| Per Capita Income | 33,048 | $21,949 |
| Median Family Income | 6,804 | $53,048 |
| Mean Family Income | 6,804 | $62,399 |
| Median Household Income | 12,471 | $39,193 |
| Mean Household Income | 12,471 | $54,115 |
| Income Deficit | 6,804 | $9,731 |
| Wage / Income Gap (%) | 33,048 | 4.40% |
| Wage / Income Gap ($) | 33,048 | 95.60¢ per $1 |
| Gini / Inequality Index | 33,048 | 0.46 |
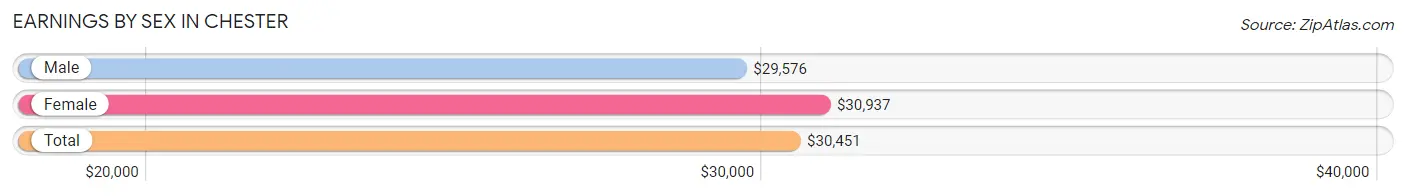
Earnings by Sex in Chester
Average Earnings in Chester are $30,451, $29,576 for men and $30,937 for women, a difference of 4.4%.
| Sex | Number | Average Earnings |
| Male | 7,029 (46.9%) | $29,576 |
| Female | 7,943 (53.0%) | $30,937 |
| Total | 14,972 (100.0%) | $30,451 |
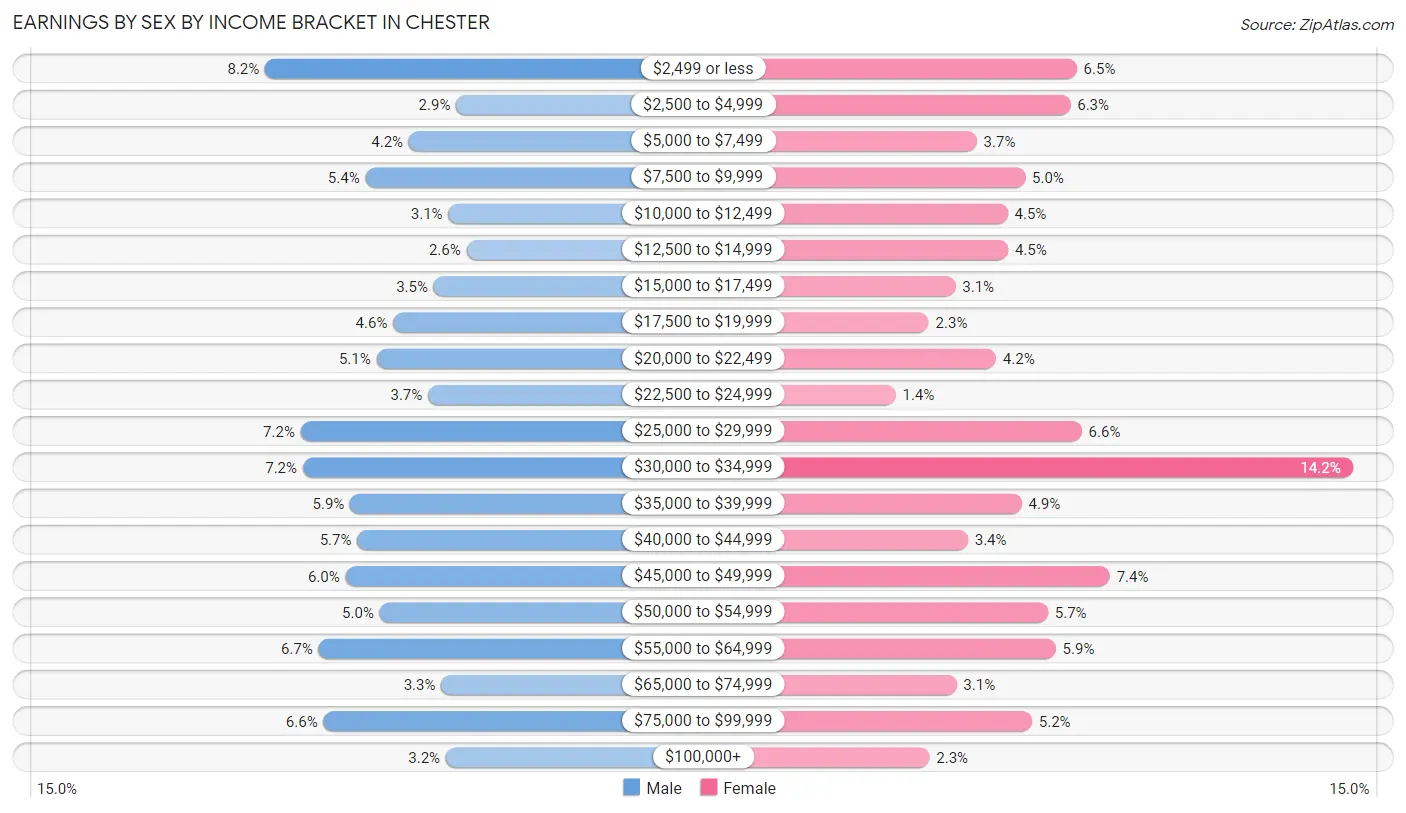
Earnings by Sex by Income Bracket in Chester
The most common earnings brackets in Chester are $2,499 or less for men (579 | 8.2%) and $30,000 to $34,999 for women (1,129 | 14.2%).
| Income | Male | Female |
| $2,499 or less | 579 (8.2%) | 513 (6.5%) |
| $2,500 to $4,999 | 202 (2.9%) | 499 (6.3%) |
| $5,000 to $7,499 | 295 (4.2%) | 290 (3.6%) |
| $7,500 to $9,999 | 381 (5.4%) | 398 (5.0%) |
| $10,000 to $12,499 | 217 (3.1%) | 359 (4.5%) |
| $12,500 to $14,999 | 181 (2.6%) | 360 (4.5%) |
| $15,000 to $17,499 | 246 (3.5%) | 242 (3.0%) |
| $17,500 to $19,999 | 326 (4.6%) | 183 (2.3%) |
| $20,000 to $22,499 | 359 (5.1%) | 333 (4.2%) |
| $22,500 to $24,999 | 257 (3.7%) | 109 (1.4%) |
| $25,000 to $29,999 | 509 (7.2%) | 524 (6.6%) |
| $30,000 to $34,999 | 505 (7.2%) | 1,129 (14.2%) |
| $35,000 to $39,999 | 411 (5.9%) | 390 (4.9%) |
| $40,000 to $44,999 | 397 (5.7%) | 270 (3.4%) |
| $45,000 to $49,999 | 420 (6.0%) | 587 (7.4%) |
| $50,000 to $54,999 | 353 (5.0%) | 449 (5.7%) |
| $55,000 to $64,999 | 474 (6.7%) | 466 (5.9%) |
| $65,000 to $74,999 | 231 (3.3%) | 245 (3.1%) |
| $75,000 to $99,999 | 464 (6.6%) | 413 (5.2%) |
| $100,000+ | 222 (3.2%) | 184 (2.3%) |
| Total | 7,029 (100.0%) | 7,943 (100.0%) |
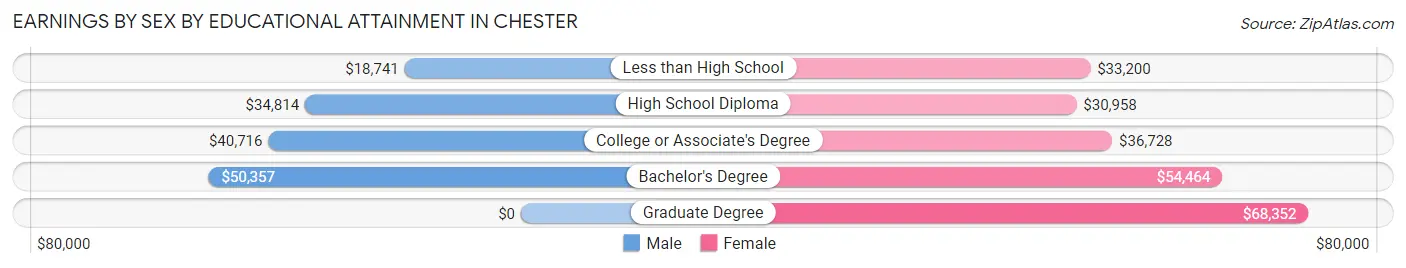
Earnings by Sex by Educational Attainment in Chester
Average earnings in Chester are $37,268 for men and $34,132 for women, a difference of 8.4%. Men with an educational attainment of bachelor's degree enjoy the highest average annual earnings of $50,357, while those with less than high school education earn the least with $18,741. Women with an educational attainment of graduate degree earn the most with the average annual earnings of $68,352, while those with high school diploma education have the smallest earnings of $30,958.
| Educational Attainment | Male Income | Female Income |
| Less than High School | $18,741 | $33,200 |
| High School Diploma | $34,814 | $30,958 |
| College or Associate's Degree | $40,716 | $36,728 |
| Bachelor's Degree | $50,357 | $54,464 |
| Graduate Degree | - | - |
| Total | $37,268 | $34,132 |
Family Income in Chester
Family Income Brackets in Chester
According to the Chester family income data, there are 1,490 families falling into the $50,000 to $74,999 income range, which is the most common income bracket and makes up 21.9% of all families. Conversely, the $200,000+ income bracket is the least frequent group with only 61 families (0.9%) belonging to this category.
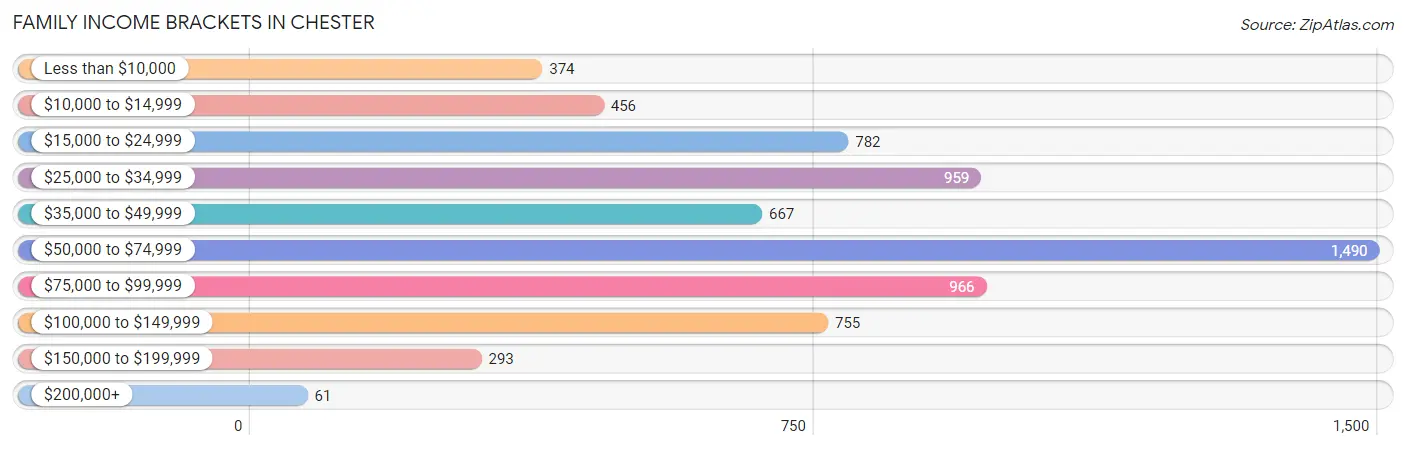
| Income Bracket | # Families | % Families |
| Less than $10,000 | 374 | 5.5% |
| $10,000 to $14,999 | 456 | 6.7% |
| $15,000 to $24,999 | 782 | 11.5% |
| $25,000 to $34,999 | 959 | 14.1% |
| $35,000 to $49,999 | 667 | 9.8% |
| $50,000 to $74,999 | 1,490 | 21.9% |
| $75,000 to $99,999 | 966 | 14.2% |
| $100,000 to $149,999 | 755 | 11.1% |
| $150,000 to $199,999 | 293 | 4.3% |
| $200,000+ | 61 | 0.9% |
Family Income by Famaliy Size in Chester
5-person families (434 | 6.4%) account for the highest median family income in Chester with $61,574 per family, while 2-person families (3,229 | 47.5%) have the highest median income of $27,000 per family member.
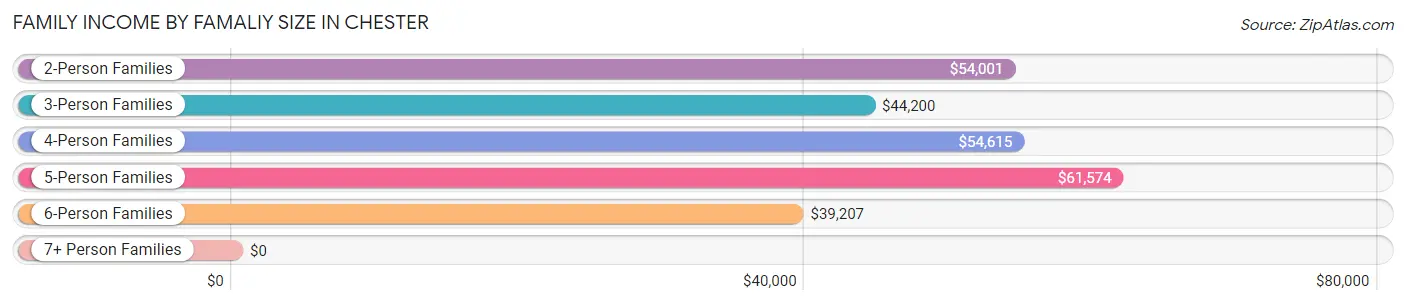
| Income Bracket | # Families | Median Income |
| 2-Person Families | 3,229 (47.5%) | $54,001 |
| 3-Person Families | 1,502 (22.1%) | $44,200 |
| 4-Person Families | 1,214 (17.8%) | $54,615 |
| 5-Person Families | 434 (6.4%) | $61,574 |
| 6-Person Families | 312 (4.6%) | $39,207 |
| 7+ Person Families | 113 (1.7%) | $0 |
| Total | 6,804 (100.0%) | $53,048 |
Family Income by Number of Earners in Chester
The median family income in Chester is $53,048, with families comprising 3+ earners (648) having the highest median family income of $98,814, while families with no earners (1,262) have the lowest median family income of $20,804, accounting for 9.5% and 18.5% of families, respectively.
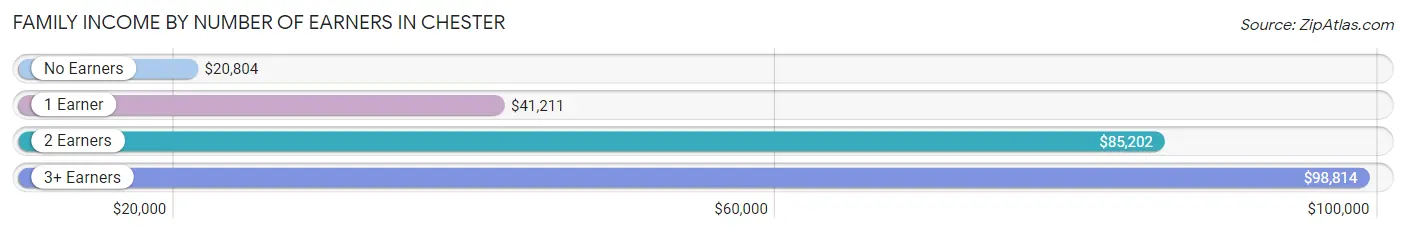
| Number of Earners | # Families | Median Income |
| No Earners | 1,262 (18.5%) | $20,804 |
| 1 Earner | 3,516 (51.7%) | $41,211 |
| 2 Earners | 1,378 (20.3%) | $85,202 |
| 3+ Earners | 648 (9.5%) | $98,814 |
| Total | 6,804 (100.0%) | $53,048 |
Household Income in Chester
Household Income Brackets in Chester
With 1,995 households falling in the category, the $50,000 to $74,999 income range is the most frequent in Chester, accounting for 16.0% of all households. In contrast, only 137 households (1.1%) fall into the $200,000+ income bracket, making it the least populous group.
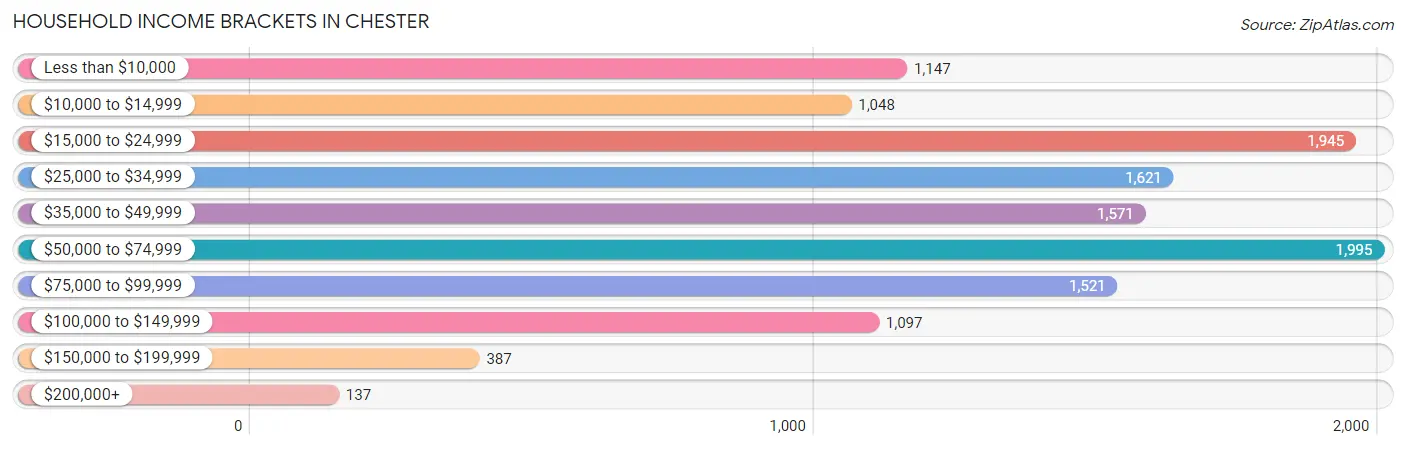
| Income Bracket | # Households | % Households |
| Less than $10,000 | 1,147 | 9.2% |
| $10,000 to $14,999 | 1,048 | 8.4% |
| $15,000 to $24,999 | 1,945 | 15.6% |
| $25,000 to $34,999 | 1,621 | 13.0% |
| $35,000 to $49,999 | 1,571 | 12.6% |
| $50,000 to $74,999 | 1,995 | 16.0% |
| $75,000 to $99,999 | 1,521 | 12.2% |
| $100,000 to $149,999 | 1,097 | 8.8% |
| $150,000 to $199,999 | 387 | 3.1% |
| $200,000+ | 137 | 1.1% |
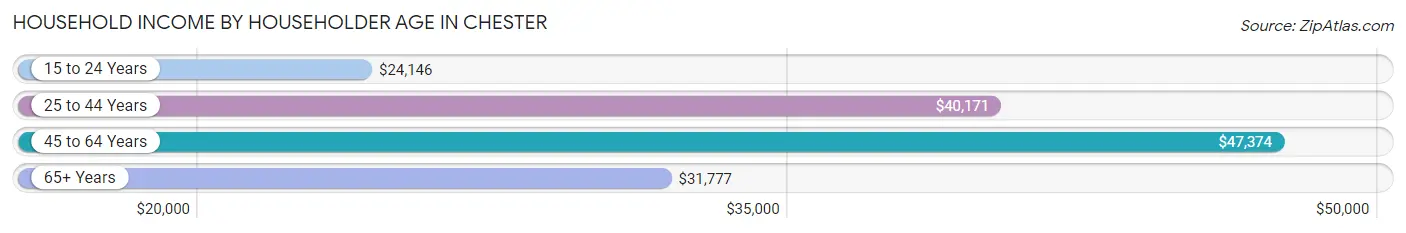
Household Income by Householder Age in Chester
The median household income in Chester is $39,193, with the highest median household income of $47,374 found in the 45 to 64 years age bracket for the primary householder. A total of 4,308 households (34.5%) fall into this category. Meanwhile, the 15 to 24 years age bracket for the primary householder has the lowest median household income of $24,146, with 596 households (4.8%) in this group.
| Income Bracket | # Households | Median Income |
| 15 to 24 Years | 596 (4.8%) | $24,146 |
| 25 to 44 Years | 3,947 (31.7%) | $40,171 |
| 45 to 64 Years | 4,308 (34.5%) | $47,374 |
| 65+ Years | 3,620 (29.0%) | $31,777 |
| Total | 12,471 (100.0%) | $39,193 |
Poverty in Chester
Income Below Poverty by Sex and Age in Chester
With 25.3% poverty level for males and 31.0% for females among the residents of Chester, 15 year old males and 12 to 14 year old females are the most vulnerable to poverty, with 142 males (58.9%) and 394 females (59.8%) in their respective age groups living below the poverty level.
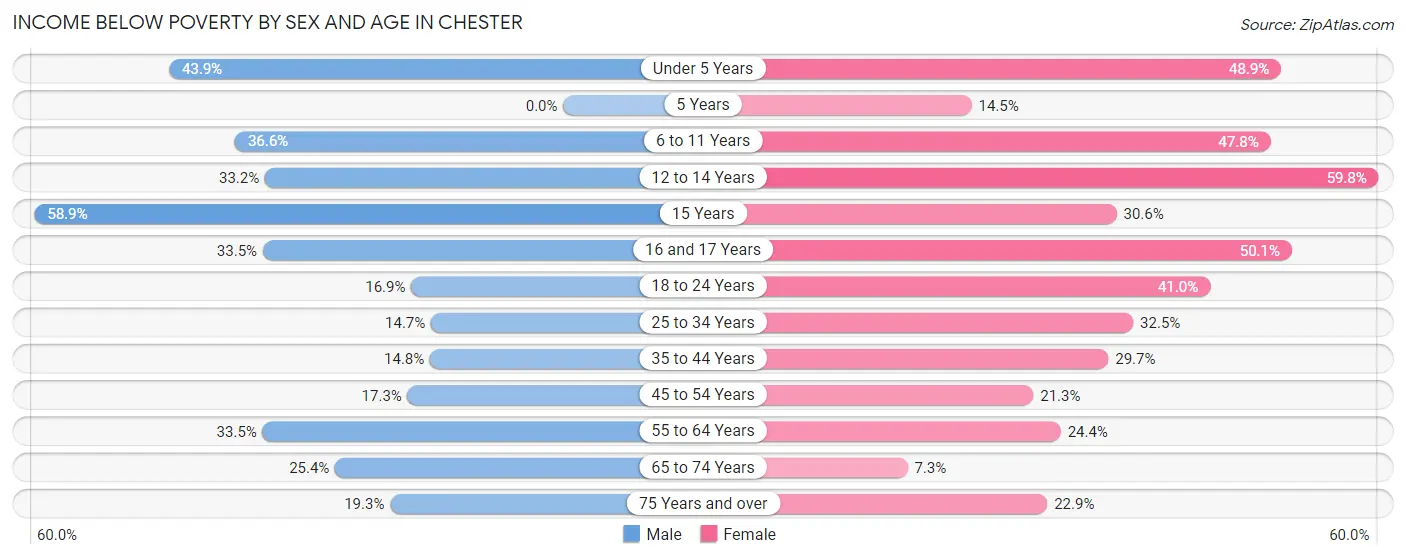
| Age Bracket | Male | Female |
| Under 5 Years | 618 (43.9%) | 436 (48.9%) |
| 5 Years | 0 (0.0%) | 25 (14.4%) |
| 6 to 11 Years | 478 (36.6%) | 519 (47.7%) |
| 12 to 14 Years | 188 (33.2%) | 394 (59.8%) |
| 15 Years | 142 (58.9%) | 56 (30.6%) |
| 16 and 17 Years | 89 (33.5%) | 227 (50.1%) |
| 18 to 24 Years | 236 (16.9%) | 831 (41.0%) |
| 25 to 34 Years | 338 (14.7%) | 737 (32.5%) |
| 35 to 44 Years | 206 (14.8%) | 602 (29.7%) |
| 45 to 54 Years | 214 (17.3%) | 337 (21.3%) |
| 55 to 64 Years | 638 (33.5%) | 444 (24.4%) |
| 65 to 74 Years | 295 (25.4%) | 131 (7.3%) |
| 75 Years and over | 118 (19.3%) | 265 (22.9%) |
| Total | 3,560 (25.3%) | 5,004 (31.0%) |
Income Above Poverty by Sex and Age in Chester
According to the poverty statistics in Chester, males aged 5 years and females aged 65 to 74 years are the age groups that are most secure financially, with 100.0% of males and 92.7% of females in these age groups living above the poverty line.
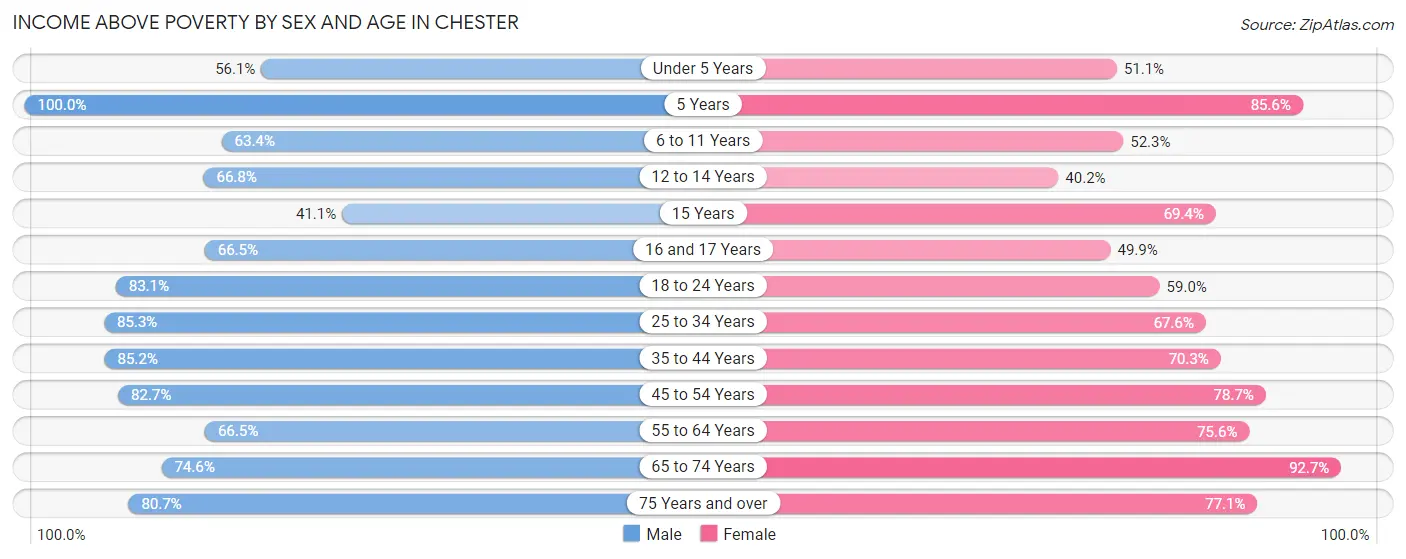
| Age Bracket | Male | Female |
| Under 5 Years | 789 (56.1%) | 455 (51.1%) |
| 5 Years | 318 (100.0%) | 148 (85.6%) |
| 6 to 11 Years | 829 (63.4%) | 568 (52.2%) |
| 12 to 14 Years | 378 (66.8%) | 265 (40.2%) |
| 15 Years | 99 (41.1%) | 127 (69.4%) |
| 16 and 17 Years | 177 (66.5%) | 226 (49.9%) |
| 18 to 24 Years | 1,158 (83.1%) | 1,196 (59.0%) |
| 25 to 34 Years | 1,956 (85.3%) | 1,534 (67.5%) |
| 35 to 44 Years | 1,182 (85.2%) | 1,426 (70.3%) |
| 45 to 54 Years | 1,020 (82.7%) | 1,243 (78.7%) |
| 55 to 64 Years | 1,267 (66.5%) | 1,377 (75.6%) |
| 65 to 74 Years | 866 (74.6%) | 1,660 (92.7%) |
| 75 Years and over | 494 (80.7%) | 893 (77.1%) |
| Total | 10,533 (74.7%) | 11,118 (69.0%) |
Income Below Poverty Among Married-Couple Families in Chester
The poverty statistics for married-couple families in Chester show that 14.5% or 296 of the total 2,045 families live below the poverty line. Families with 5 or more children have the highest poverty rate of 90.0%, comprising of 36 families. On the other hand, families with 3 or 4 children have the lowest poverty rate of 0.0%, which includes 0 families.
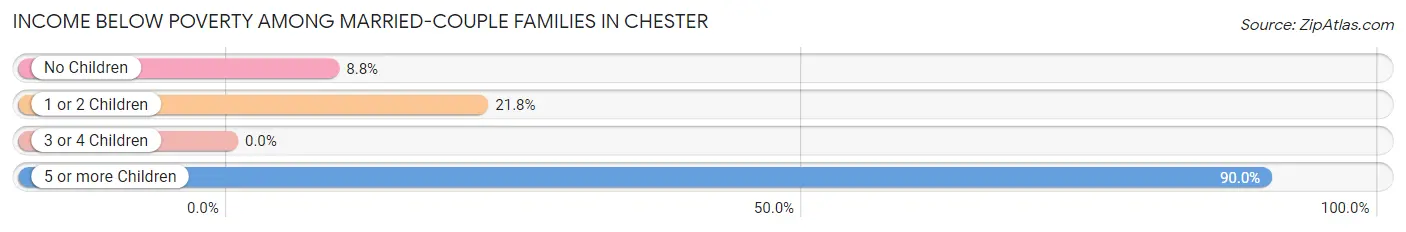
| Children | Above Poverty | Below Poverty |
| No Children | 1,127 (91.2%) | 109 (8.8%) |
| 1 or 2 Children | 542 (78.2%) | 151 (21.8%) |
| 3 or 4 Children | 76 (100.0%) | 0 (0.0%) |
| 5 or more Children | 4 (10.0%) | 36 (90.0%) |
| Total | 1,749 (85.5%) | 296 (14.5%) |
Income Below Poverty Among Single-Parent Households in Chester
According to the poverty data in Chester, 19.0% or 174 single-father households and 30.2% or 1,160 single-mother households are living below the poverty line. Among single-father households, those with 5 or more children have the highest poverty rate, with 20 households (100.0%) experiencing poverty. Likewise, among single-mother households, those with 3 or 4 children have the highest poverty rate, with 418 households (63.9%) falling below the poverty line.
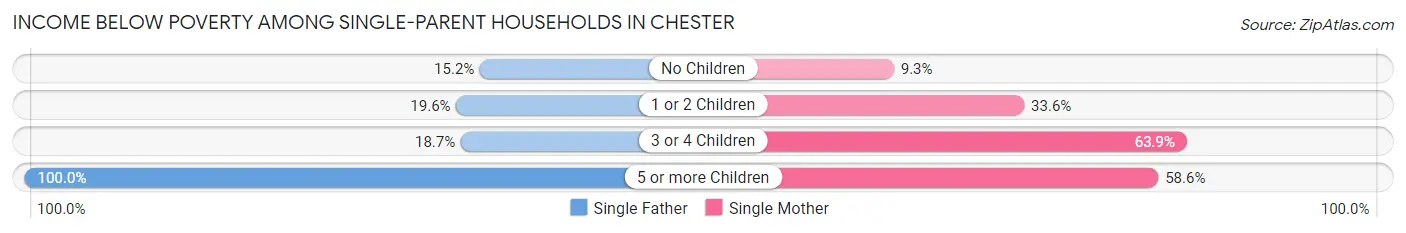
| Children | Single Father | Single Mother |
| No Children | 70 (15.1%) | 136 (9.3%) |
| 1 or 2 Children | 55 (19.6%) | 548 (33.6%) |
| 3 or 4 Children | 29 (18.7%) | 418 (63.9%) |
| 5 or more Children | 20 (100.0%) | 58 (58.6%) |
| Total | 174 (19.0%) | 1,160 (30.2%) |
Income Below Poverty Among Married-Couple vs Single-Parent Households in Chester
The poverty data for Chester shows that 296 of the married-couple family households (14.5%) and 1,334 of the single-parent households (28.0%) are living below the poverty level. Within the married-couple family households, those with 5 or more children have the highest poverty rate, with 36 households (90.0%) falling below the poverty line. Among the single-parent households, those with 5 or more children have the highest poverty rate, with 78 household (65.5%) living below poverty.
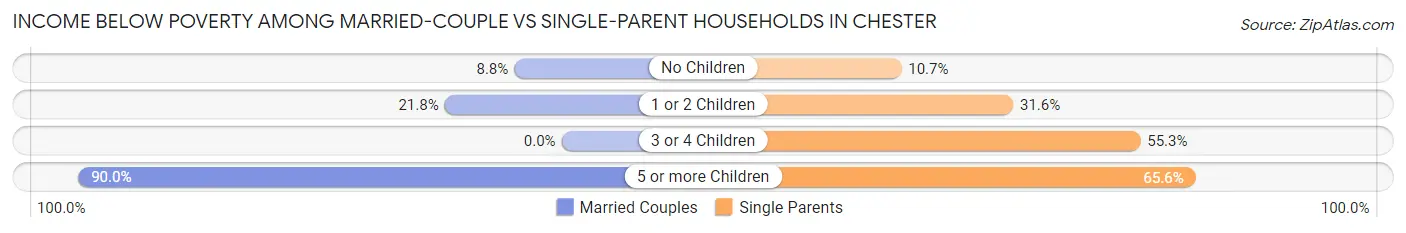
| Children | Married-Couple Families | Single-Parent Households |
| No Children | 109 (8.8%) | 206 (10.7%) |
| 1 or 2 Children | 151 (21.8%) | 603 (31.6%) |
| 3 or 4 Children | 0 (0.0%) | 447 (55.2%) |
| 5 or more Children | 36 (90.0%) | 78 (65.5%) |
| Total | 296 (14.5%) | 1,334 (28.0%) |
Race in Chester
The most populous races in Chester are Black / African American (25,095 | 75.9%), White / Caucasian (4,943 | 15.0%), and Hispanic or Latino (2,414 | 7.3%).
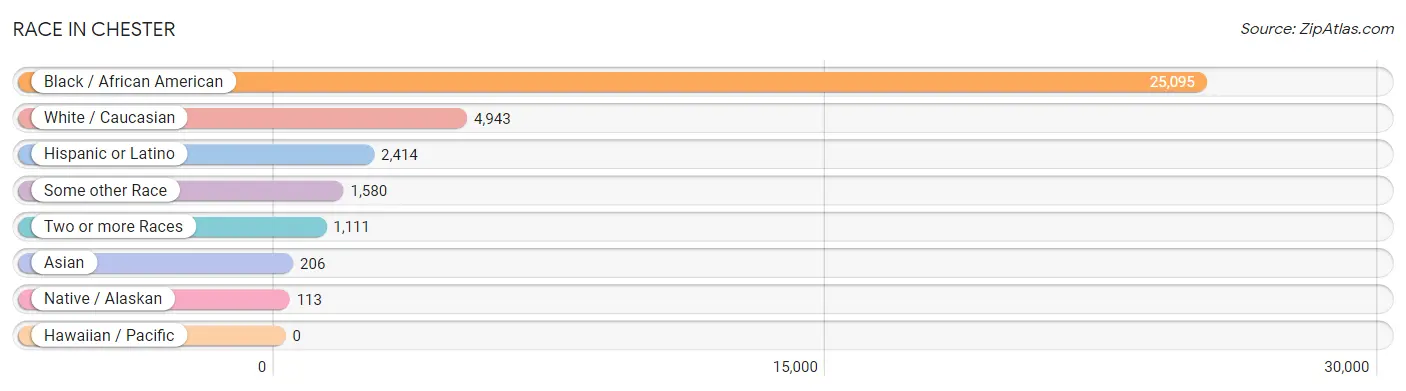
| Race | # Population | % Population |
| Asian | 206 | 0.6% |
| Black / African American | 25,095 | 75.9% |
| Hawaiian / Pacific | 0 | 0.0% |
| Hispanic or Latino | 2,414 | 7.3% |
| Native / Alaskan | 113 | 0.3% |
| White / Caucasian | 4,943 | 15.0% |
| Two or more Races | 1,111 | 3.4% |
| Some other Race | 1,580 | 4.8% |
| Total | 33,048 | 100.0% |
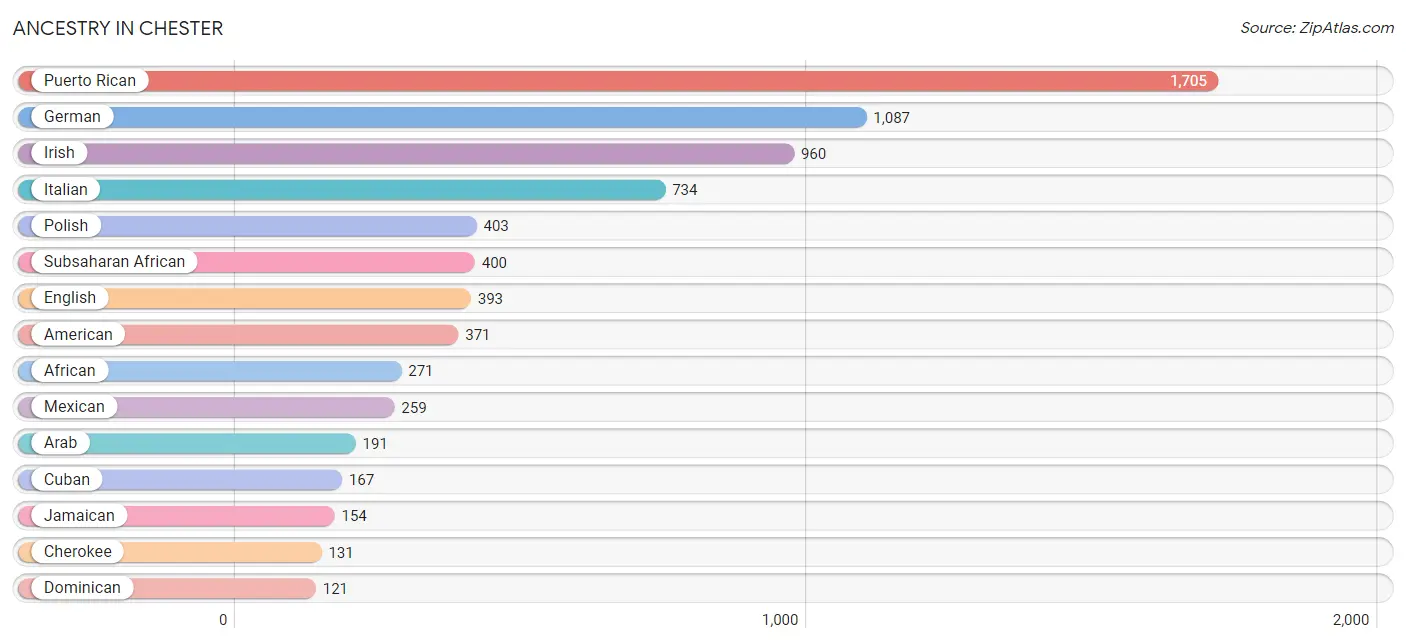
Ancestry in Chester
The most populous ancestries reported in Chester are Puerto Rican (1,705 | 5.2%), German (1,087 | 3.3%), Irish (960 | 2.9%), Italian (734 | 2.2%), and Polish (403 | 1.2%), together accounting for 14.8% of all Chester residents.
| Ancestry | # Population | % Population |
| African | 271 | 0.8% |
| American | 371 | 1.1% |
| Arab | 191 | 0.6% |
| Argentinean | 5 | 0.0% |
| Armenian | 6 | 0.0% |
| Belgian | 7 | 0.0% |
| Blackfeet | 65 | 0.2% |
| Brazilian | 8 | 0.0% |
| British | 9 | 0.0% |
| British West Indian | 15 | 0.1% |
| Burmese | 65 | 0.2% |
| Central American | 21 | 0.1% |
| Cherokee | 131 | 0.4% |
| Costa Rican | 8 | 0.0% |
| Cuban | 167 | 0.5% |
| Czech | 13 | 0.0% |
| Danish | 16 | 0.1% |
| Delaware | 14 | 0.0% |
| Dominican | 121 | 0.4% |
| Dutch | 21 | 0.1% |
| Eastern European | 45 | 0.1% |
| Ecuadorian | 6 | 0.0% |
| Egyptian | 8 | 0.0% |
| English | 393 | 1.2% |
| European | 55 | 0.2% |
| French | 29 | 0.1% |
| French Canadian | 16 | 0.1% |
| German | 1,087 | 3.3% |
| Greek | 35 | 0.1% |
| Guyanese | 11 | 0.0% |
| Haitian | 46 | 0.1% |
| Hungarian | 58 | 0.2% |
| Indian (Asian) | 46 | 0.1% |
| Irish | 960 | 2.9% |
| Iroquois | 16 | 0.1% |
| Italian | 734 | 2.2% |
| Jamaican | 154 | 0.5% |
| Japanese | 7 | 0.0% |
| Korean | 81 | 0.3% |
| Laotian | 18 | 0.1% |
| Liberian | 84 | 0.3% |
| Lithuanian | 36 | 0.1% |
| Mexican | 259 | 0.8% |
| Native Hawaiian | 68 | 0.2% |
| Nigerian | 31 | 0.1% |
| Northern European | 9 | 0.0% |
| Norwegian | 9 | 0.0% |
| Pennsylvania German | 16 | 0.1% |
| Peruvian | 21 | 0.1% |
| Polish | 403 | 1.2% |
| Portuguese | 16 | 0.1% |
| Puerto Rican | 1,705 | 5.2% |
| Romanian | 8 | 0.0% |
| Russian | 7 | 0.0% |
| Salvadoran | 13 | 0.0% |
| Scotch-Irish | 48 | 0.2% |
| Scottish | 108 | 0.3% |
| Seminole | 31 | 0.1% |
| Sierra Leonean | 8 | 0.0% |
| Slovak | 4 | 0.0% |
| South American | 32 | 0.1% |
| Spaniard | 8 | 0.0% |
| Sri Lankan | 25 | 0.1% |
| Subsaharan African | 400 | 1.2% |
| Swedish | 16 | 0.1% |
| Swiss | 8 | 0.0% |
| Thai | 83 | 0.3% |
| Trinidadian and Tobagonian | 3 | 0.0% |
| Ukrainian | 72 | 0.2% |
| Welsh | 5 | 0.0% |
| West Indian | 42 | 0.1% | View All 71 Rows |
Immigrants in Chester
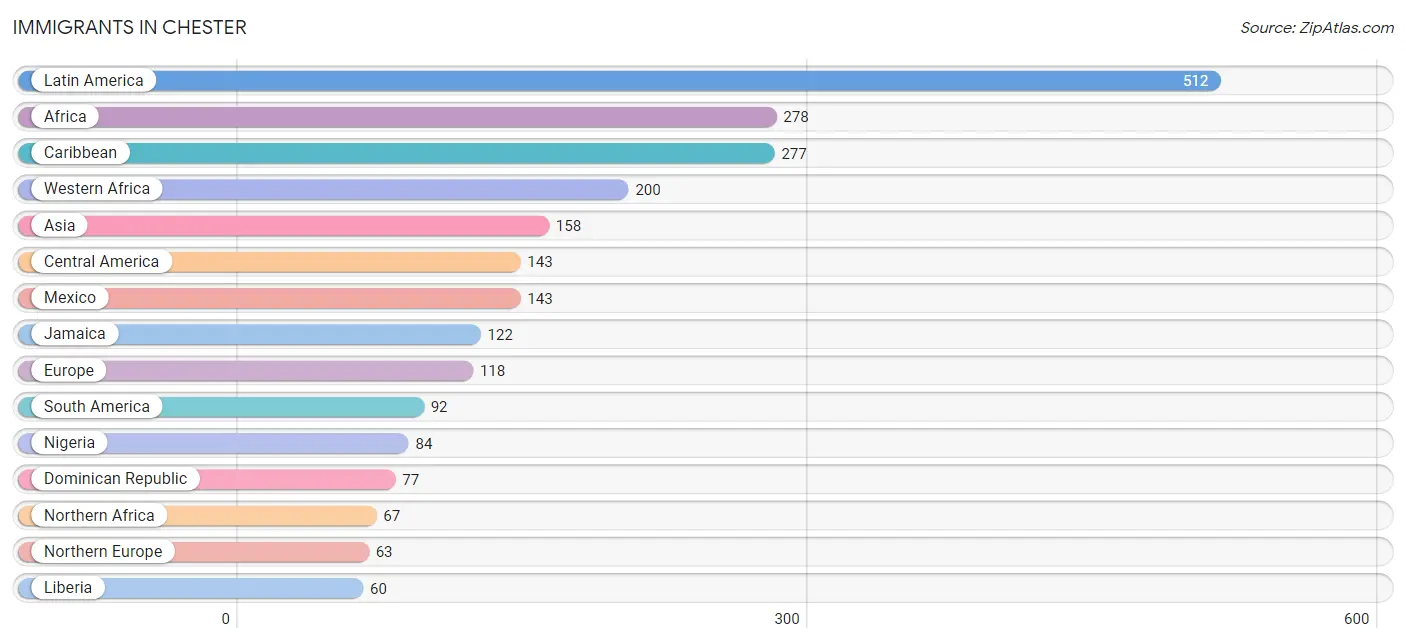
The most numerous immigrant groups reported in Chester came from Latin America (512 | 1.5%), Africa (278 | 0.8%), Caribbean (277 | 0.8%), Western Africa (200 | 0.6%), and Asia (158 | 0.5%), together accounting for 4.3% of all Chester residents.
| Immigration Origin | # Population | % Population |
| Africa | 278 | 0.8% |
| Asia | 158 | 0.5% |
| Cameroon | 4 | 0.0% |
| Caribbean | 277 | 0.8% |
| Central America | 143 | 0.4% |
| China | 20 | 0.1% |
| Cuba | 7 | 0.0% |
| Dominica | 5 | 0.0% |
| Dominican Republic | 77 | 0.2% |
| Eastern Asia | 49 | 0.2% |
| Eastern Europe | 34 | 0.1% |
| Egypt | 4 | 0.0% |
| Europe | 118 | 0.4% |
| Germany | 21 | 0.1% |
| Ghana | 4 | 0.0% |
| Grenada | 15 | 0.1% |
| Guyana | 53 | 0.2% |
| Haiti | 32 | 0.1% |
| Hong Kong | 7 | 0.0% |
| India | 20 | 0.1% |
| Indonesia | 18 | 0.1% |
| Jamaica | 122 | 0.4% |
| Korea | 29 | 0.1% |
| Latin America | 512 | 1.5% |
| Liberia | 60 | 0.2% |
| Mexico | 143 | 0.4% |
| Middle Africa | 4 | 0.0% |
| Nigeria | 84 | 0.3% |
| Northern Africa | 67 | 0.2% |
| Northern Europe | 63 | 0.2% |
| Peru | 14 | 0.0% |
| Philippines | 14 | 0.0% |
| Poland | 23 | 0.1% |
| Saudi Arabia | 46 | 0.1% |
| Sierra Leone | 8 | 0.0% |
| South Africa | 7 | 0.0% |
| South America | 92 | 0.3% |
| South Central Asia | 20 | 0.1% |
| South Eastern Asia | 43 | 0.1% |
| Trinidad and Tobago | 18 | 0.1% |
| Ukraine | 11 | 0.0% |
| Vietnam | 11 | 0.0% |
| Western Africa | 200 | 0.6% |
| Western Asia | 46 | 0.1% |
| Western Europe | 21 | 0.1% | View All 45 Rows |
Sex and Age in Chester
Sex and Age in Chester
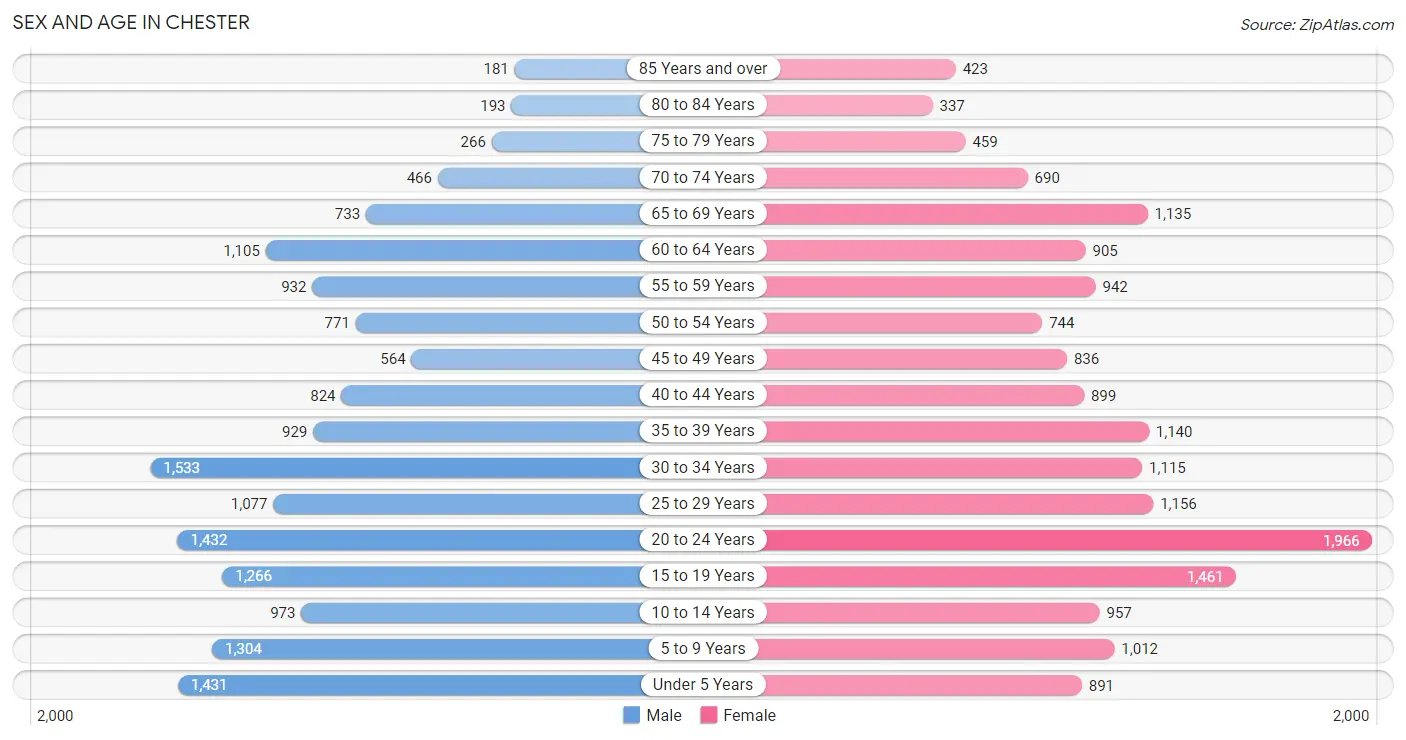
The most populous age groups in Chester are 30 to 34 Years (1,533 | 9.6%) for men and 20 to 24 Years (1,966 | 11.5%) for women.
| Age Bracket | Male | Female |
| Under 5 Years | 1,431 (8.9%) | 891 (5.2%) |
| 5 to 9 Years | 1,304 (8.2%) | 1,012 (5.9%) |
| 10 to 14 Years | 973 (6.1%) | 957 (5.6%) |
| 15 to 19 Years | 1,266 (7.9%) | 1,461 (8.6%) |
| 20 to 24 Years | 1,432 (9.0%) | 1,966 (11.5%) |
| 25 to 29 Years | 1,077 (6.7%) | 1,156 (6.8%) |
| 30 to 34 Years | 1,533 (9.6%) | 1,115 (6.5%) |
| 35 to 39 Years | 929 (5.8%) | 1,140 (6.7%) |
| 40 to 44 Years | 824 (5.2%) | 899 (5.3%) |
| 45 to 49 Years | 564 (3.5%) | 836 (4.9%) |
| 50 to 54 Years | 771 (4.8%) | 744 (4.4%) |
| 55 to 59 Years | 932 (5.8%) | 942 (5.5%) |
| 60 to 64 Years | 1,105 (6.9%) | 905 (5.3%) |
| 65 to 69 Years | 733 (4.6%) | 1,135 (6.7%) |
| 70 to 74 Years | 466 (2.9%) | 690 (4.0%) |
| 75 to 79 Years | 266 (1.7%) | 459 (2.7%) |
| 80 to 84 Years | 193 (1.2%) | 337 (2.0%) |
| 85 Years and over | 181 (1.1%) | 423 (2.5%) |
| Total | 15,980 (100.0%) | 17,068 (100.0%) |
Families and Households in Chester
Median Family Size in Chester
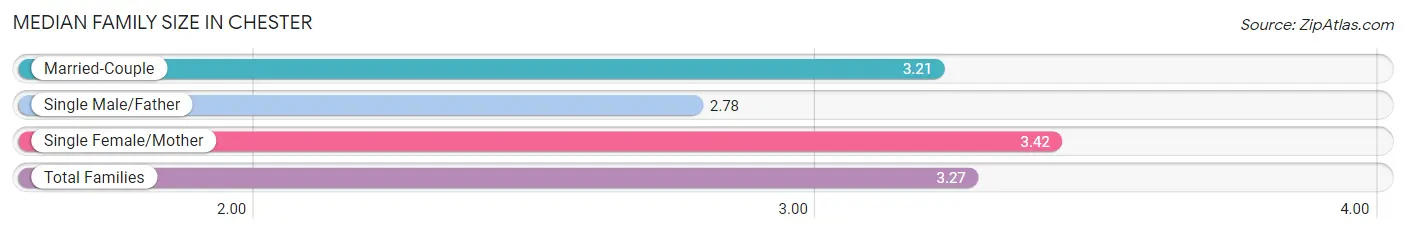
The median family size in Chester is 3.27 persons per family, with single female/mother families (3,841 | 56.5%) accounting for the largest median family size of 3.42 persons per family. On the other hand, single male/father families (918 | 13.5%) represent the smallest median family size with 2.78 persons per family.
| Family Type | # Families | Family Size |
| Married-Couple | 2,045 (30.1%) | 3.21 |
| Single Male/Father | 918 (13.5%) | 2.78 |
| Single Female/Mother | 3,841 (56.5%) | 3.42 |
| Total Families | 6,804 (100.0%) | 3.27 |
Median Household Size in Chester
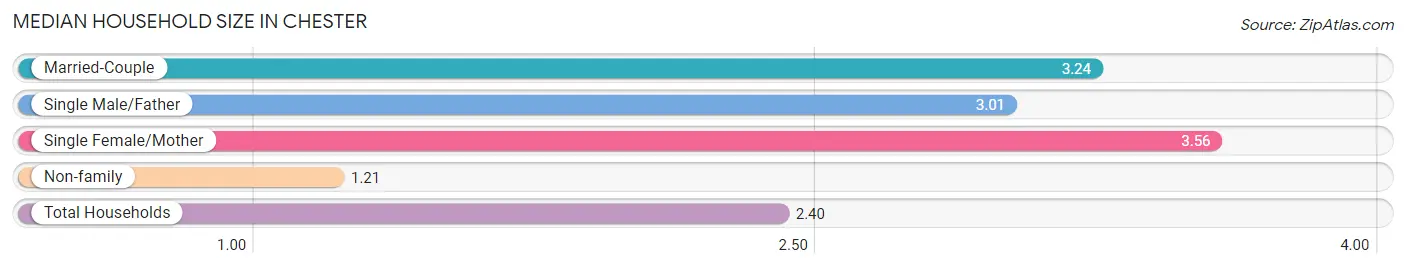
The median household size in Chester is 2.40 persons per household, with single female/mother households (3,841 | 30.8%) accounting for the largest median household size of 3.56 persons per household. non-family households (5,667 | 45.4%) represent the smallest median household size with 1.21 persons per household.
| Household Type | # Households | Household Size |
| Married-Couple | 2,045 (16.4%) | 3.24 |
| Single Male/Father | 918 (7.4%) | 3.01 |
| Single Female/Mother | 3,841 (30.8%) | 3.56 |
| Non-family | 5,667 (45.4%) | 1.21 |
| Total Households | 12,471 (100.0%) | 2.40 |
Household Size by Marriage Status in Chester
Out of a total of 12,471 households in Chester, 6,804 (54.6%) are family households, while 5,667 (45.4%) are nonfamily households. The most numerous type of family households are 2-person households, comprising 2,880, and the most common type of nonfamily households are 1-person households, comprising 4,895.
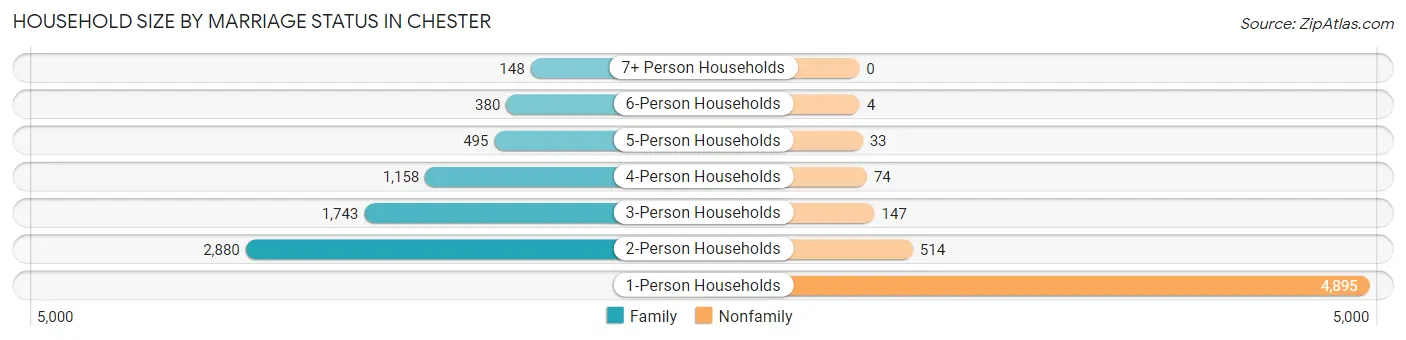
| Household Size | Family Households | Nonfamily Households |
| 1-Person Households | - | 4,895 (39.3%) |
| 2-Person Households | 2,880 (23.1%) | 514 (4.1%) |
| 3-Person Households | 1,743 (14.0%) | 147 (1.2%) |
| 4-Person Households | 1,158 (9.3%) | 74 (0.6%) |
| 5-Person Households | 495 (4.0%) | 33 (0.3%) |
| 6-Person Households | 380 (3.0%) | 4 (0.0%) |
| 7+ Person Households | 148 (1.2%) | 0 (0.0%) |
| Total | 6,804 (54.6%) | 5,667 (45.4%) |
Female Fertility in Chester
Fertility by Age in Chester
Average fertility rate in Chester is 41.0 births per 1,000 women. Women in the age bracket of 20 to 34 years have the highest fertility rate with 60.0 births per 1,000 women. Women in the age bracket of 20 to 34 years acount for 69.7% of all women with births.
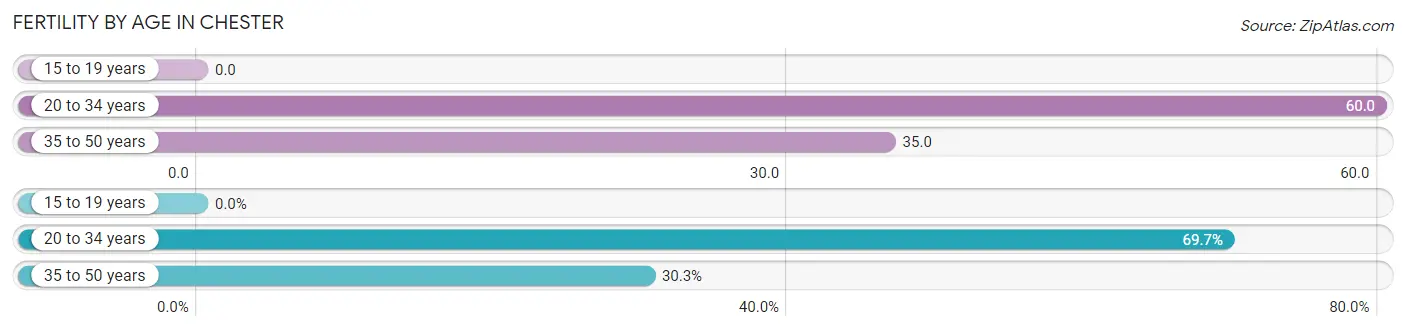
| Age Bracket | Women with Births | Births / 1,000 Women |
| 15 to 19 years | 0 (0.0%) | 0.0 |
| 20 to 34 years | 255 (69.7%) | 60.0 |
| 35 to 50 years | 111 (30.3%) | 35.0 |
| Total | 366 (100.0%) | 41.0 |
Fertility by Age by Marriage Status in Chester
52.7% of women with births (366) in Chester are married. The highest percentage of unmarried women with births falls into 20 to 34 years age bracket with 54.9% of them unmarried at the time of birth, while the lowest percentage of unmarried women with births belong to 35 to 50 years age bracket with 29.7% of them unmarried.
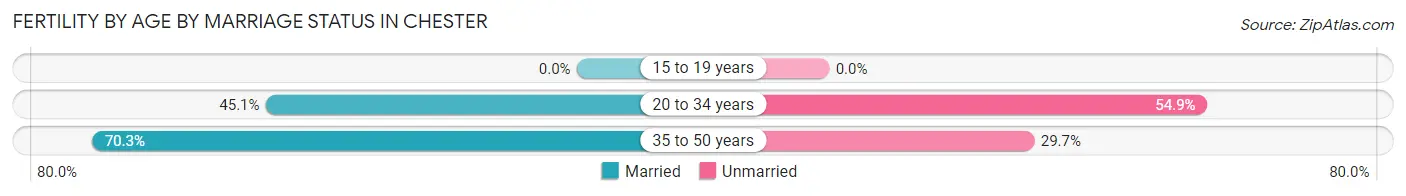
| Age Bracket | Married | Unmarried |
| 15 to 19 years | 0 (0.0%) | 0 (0.0%) |
| 20 to 34 years | 115 (45.1%) | 140 (54.9%) |
| 35 to 50 years | 78 (70.3%) | 33 (29.7%) |
| Total | 193 (52.7%) | 173 (47.3%) |
Fertility by Education in Chester
Average fertility rate in Chester is 41.0 births per 1,000 women. Women with the education attainment of graduate degree have the highest fertility rate of 248.0 births per 1,000 women, while women with the education attainment of less than high school have the lowest fertility at 3.0 births per 1,000 women. Women with the education attainment of high school diploma represent 46.7% of all women with births.
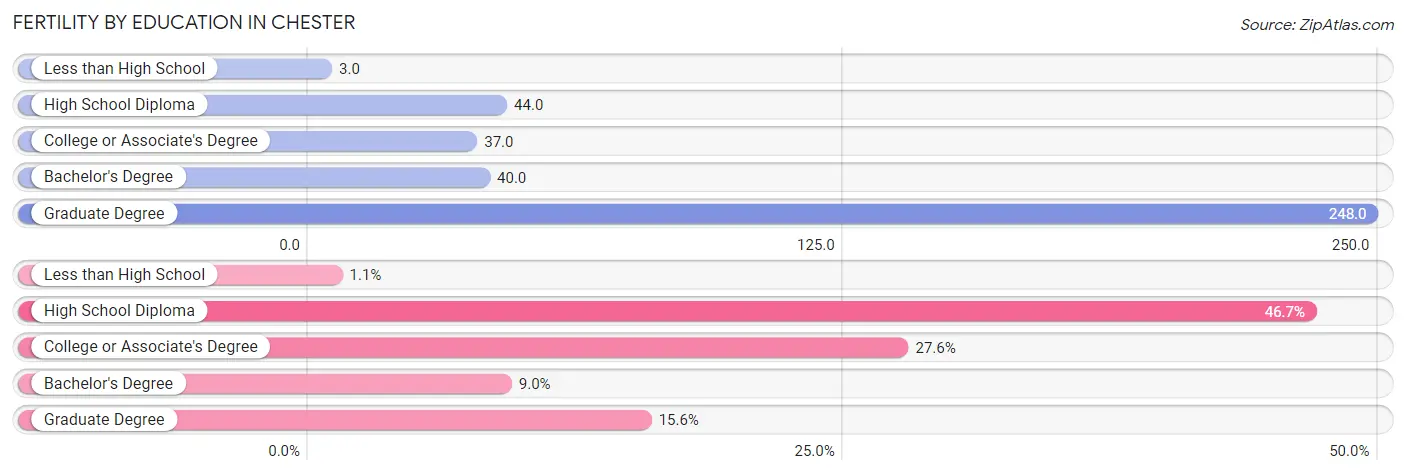
| Educational Attainment | Women with Births | Births / 1,000 Women |
| Less than High School | 4 (1.1%) | 3.0 |
| High School Diploma | 171 (46.7%) | 44.0 |
| College or Associate's Degree | 101 (27.6%) | 37.0 |
| Bachelor's Degree | 33 (9.0%) | 40.0 |
| Graduate Degree | 57 (15.6%) | 248.0 |
| Total | 366 (100.0%) | 41.0 |
Fertility by Education by Marriage Status in Chester
47.3% of women with births in Chester are unmarried. Women with the educational attainment of less than high school are most likely to be married with 100.0% of them married at childbirth, while women with the educational attainment of graduate degree are least likely to be married with 73.7% of them unmarried at childbirth.
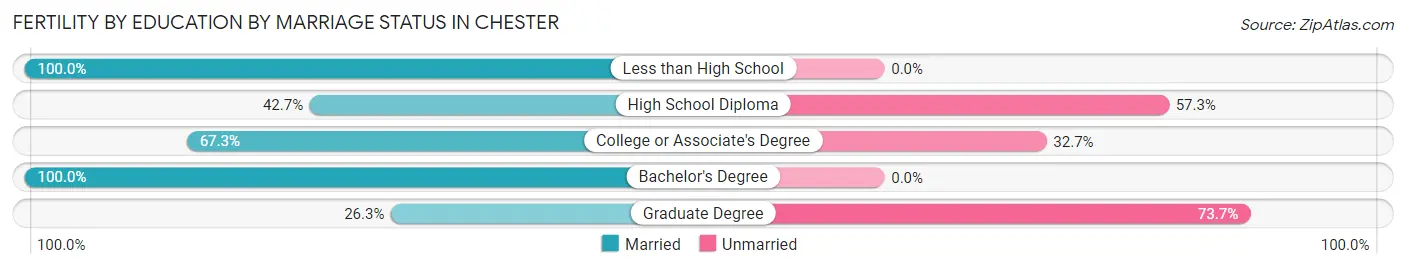
| Educational Attainment | Married | Unmarried |
| Less than High School | 4 (100.0%) | 0 (0.0%) |
| High School Diploma | 73 (42.7%) | 98 (57.3%) |
| College or Associate's Degree | 68 (67.3%) | 33 (32.7%) |
| Bachelor's Degree | 33 (100.0%) | 0 (0.0%) |
| Graduate Degree | 15 (26.3%) | 42 (73.7%) |
| Total | 193 (52.7%) | 173 (47.3%) |
Employment Characteristics in Chester
Employment by Class of Employer in Chester
Among the 12,425 employed individuals in Chester, private company employees (9,138 | 73.6%), not-for-profit organizations (1,062 | 8.6%), and local government employees (942 | 7.6%) make up the most common classes of employment.
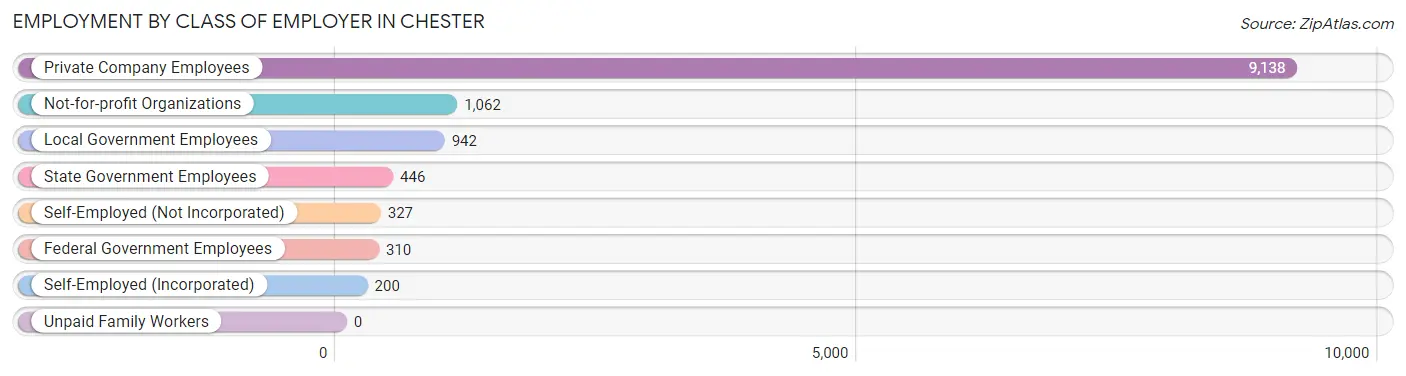
| Employer Class | # Employees | % Employees |
| Private Company Employees | 9,138 | 73.6% |
| Self-Employed (Incorporated) | 200 | 1.6% |
| Self-Employed (Not Incorporated) | 327 | 2.6% |
| Not-for-profit Organizations | 1,062 | 8.6% |
| Local Government Employees | 942 | 7.6% |
| State Government Employees | 446 | 3.6% |
| Federal Government Employees | 310 | 2.5% |
| Unpaid Family Workers | 0 | 0.0% |
| Total | 12,425 | 100.0% |
Employment Status by Age in Chester
According to the labor force statistics for Chester, out of the total population over 16 years of age (26,056), 59.2% or 15,425 individuals are in the labor force, with 15.9% or 2,453 of them unemployed. The age group with the highest labor force participation rate is 30 to 34 years, with 83.2% or 2,203 individuals in the labor force. Within the labor force, the 20 to 24 years age range has the highest percentage of unemployed individuals, with 33.5% or 887 of them being unemployed.
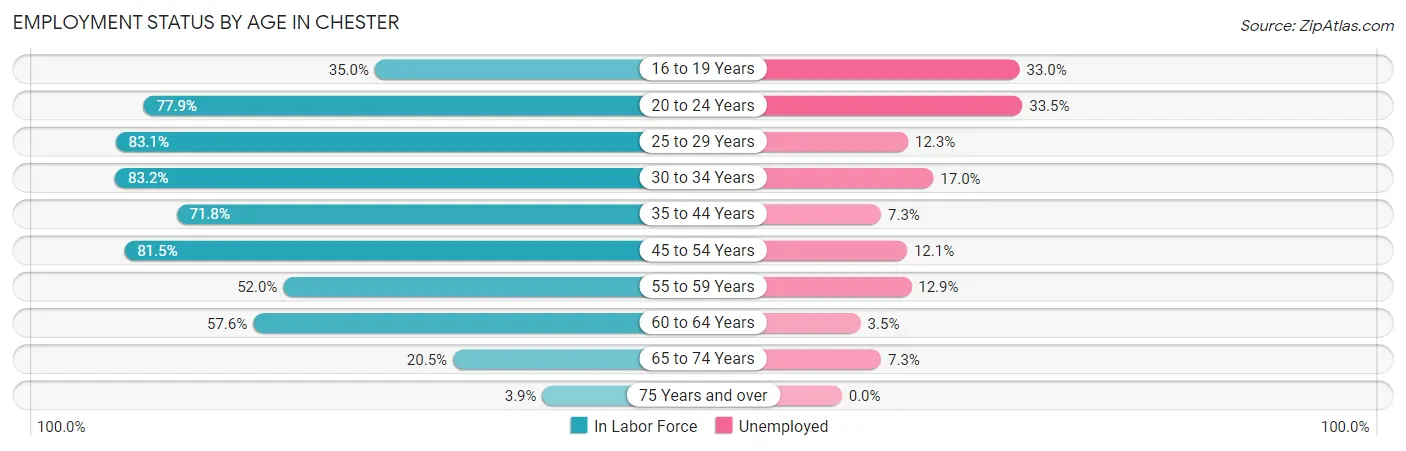
| Age Bracket | In Labor Force | Unemployed |
| 16 to 19 Years | 806 (35.0%) | 266 (33.0%) |
| 20 to 24 Years | 2,647 (77.9%) | 887 (33.5%) |
| 25 to 29 Years | 1,856 (83.1%) | 228 (12.3%) |
| 30 to 34 Years | 2,203 (83.2%) | 375 (17.0%) |
| 35 to 44 Years | 2,723 (71.8%) | 199 (7.3%) |
| 45 to 54 Years | 2,376 (81.5%) | 287 (12.1%) |
| 55 to 59 Years | 974 (52.0%) | 126 (12.9%) |
| 60 to 64 Years | 1,158 (57.6%) | 41 (3.5%) |
| 65 to 74 Years | 620 (20.5%) | 45 (7.3%) |
| 75 Years and over | 73 (3.9%) | 0 (0.0%) |
| Total | 15,425 (59.2%) | 2,453 (15.9%) |
Employment Status by Educational Attainment in Chester
According to labor force statistics for Chester, 73.0% of individuals (11,295) out of the total population between 25 and 64 years of age (15,472) are in the labor force, with 11.1% or 1,254 of them being unemployed. The group with the highest labor force participation rate are those with the educational attainment of bachelor's degree or higher, with 86.8% or 1,794 individuals in the labor force. Within the labor force, individuals with less than high school education have the highest percentage of unemployment, with 23.6% or 209 of them being unemployed.
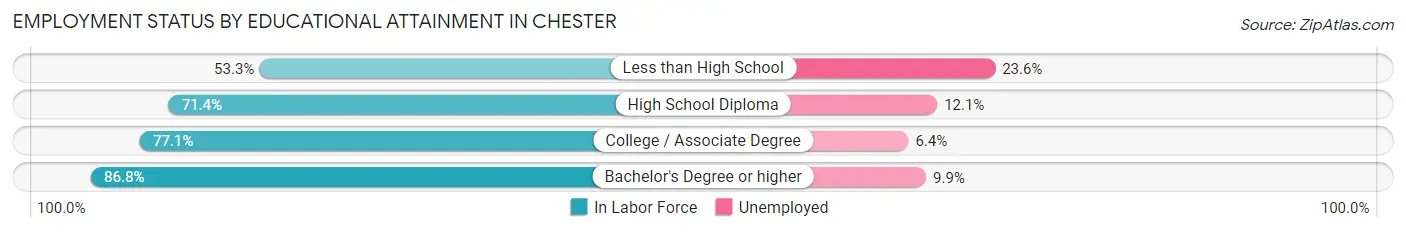
| Educational Attainment | In Labor Force | Unemployed |
| Less than High School | 886 (53.3%) | 392 (23.6%) |
| High School Diploma | 5,556 (71.4%) | 942 (12.1%) |
| College / Associate Degree | 3,055 (77.1%) | 254 (6.4%) |
| Bachelor's Degree or higher | 1,794 (86.8%) | 205 (9.9%) |
| Total | 11,295 (73.0%) | 1,717 (11.1%) |
Employment Occupations by Sex in Chester
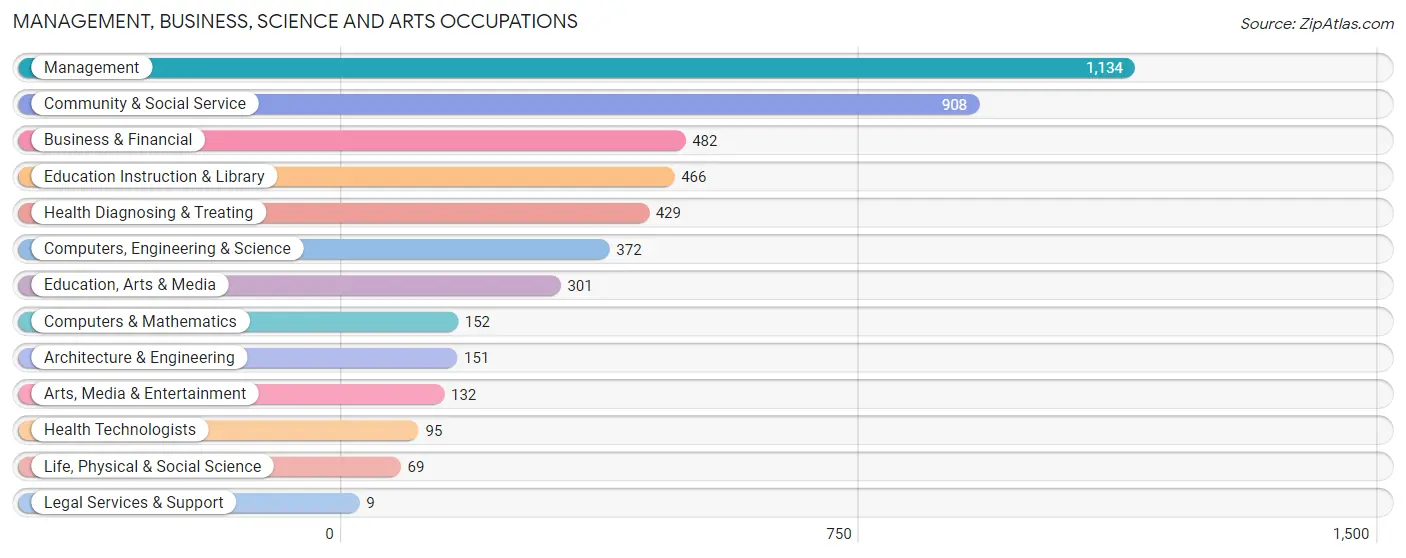
Management, Business, Science and Arts Occupations
The most common Management, Business, Science and Arts occupations in Chester are Management (1,134 | 8.7%), Community & Social Service (908 | 7.0%), Business & Financial (482 | 3.7%), Education Instruction & Library (466 | 3.6%), and Health Diagnosing & Treating (429 | 3.3%).
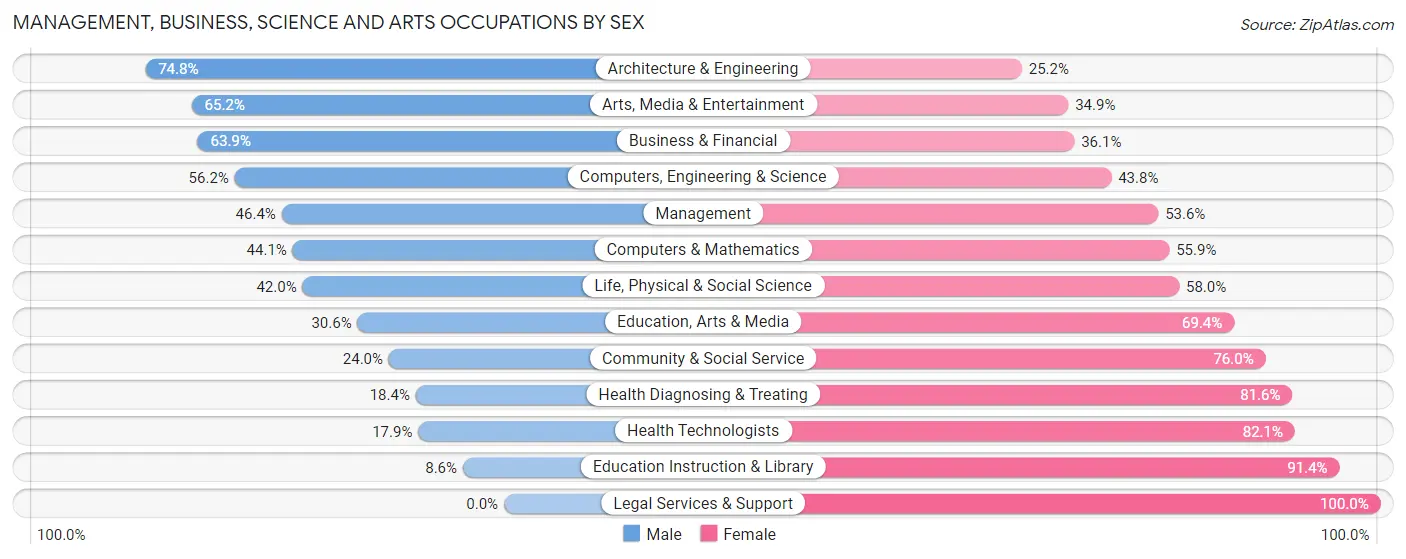
Management, Business, Science and Arts Occupations by Sex
Within the Management, Business, Science and Arts occupations in Chester, the most male-oriented occupations are Architecture & Engineering (74.8%), Arts, Media & Entertainment (65.1%), and Business & Financial (63.9%), while the most female-oriented occupations are Legal Services & Support (100.0%), Education Instruction & Library (91.4%), and Health Technologists (82.1%).
| Occupation | Male | Female |
| Management | 526 (46.4%) | 608 (53.6%) |
| Business & Financial | 308 (63.9%) | 174 (36.1%) |
| Computers, Engineering & Science | 209 (56.2%) | 163 (43.8%) |
| Computers & Mathematics | 67 (44.1%) | 85 (55.9%) |
| Architecture & Engineering | 113 (74.8%) | 38 (25.2%) |
| Life, Physical & Social Science | 29 (42.0%) | 40 (58.0%) |
| Community & Social Service | 218 (24.0%) | 690 (76.0%) |
| Education, Arts & Media | 92 (30.6%) | 209 (69.4%) |
| Legal Services & Support | 0 (0.0%) | 9 (100.0%) |
| Education Instruction & Library | 40 (8.6%) | 426 (91.4%) |
| Arts, Media & Entertainment | 86 (65.1%) | 46 (34.8%) |
| Health Diagnosing & Treating | 79 (18.4%) | 350 (81.6%) |
| Health Technologists | 17 (17.9%) | 78 (82.1%) |
| Total (Category) | 1,340 (40.3%) | 1,985 (59.7%) |
| Total (Overall) | 6,071 (46.8%) | 6,898 (53.2%) |
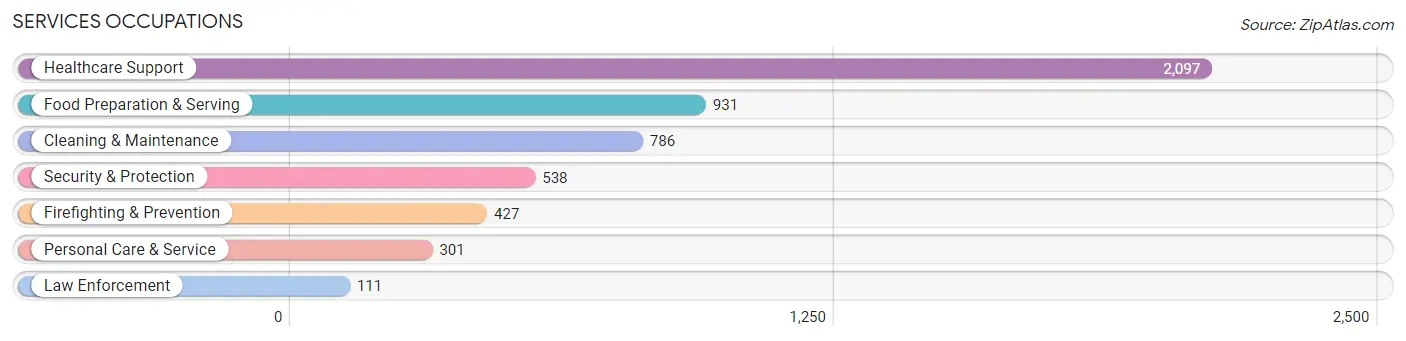
Services Occupations
The most common Services occupations in Chester are Healthcare Support (2,097 | 16.2%), Food Preparation & Serving (931 | 7.2%), Cleaning & Maintenance (786 | 6.1%), Security & Protection (538 | 4.2%), and Firefighting & Prevention (427 | 3.3%).
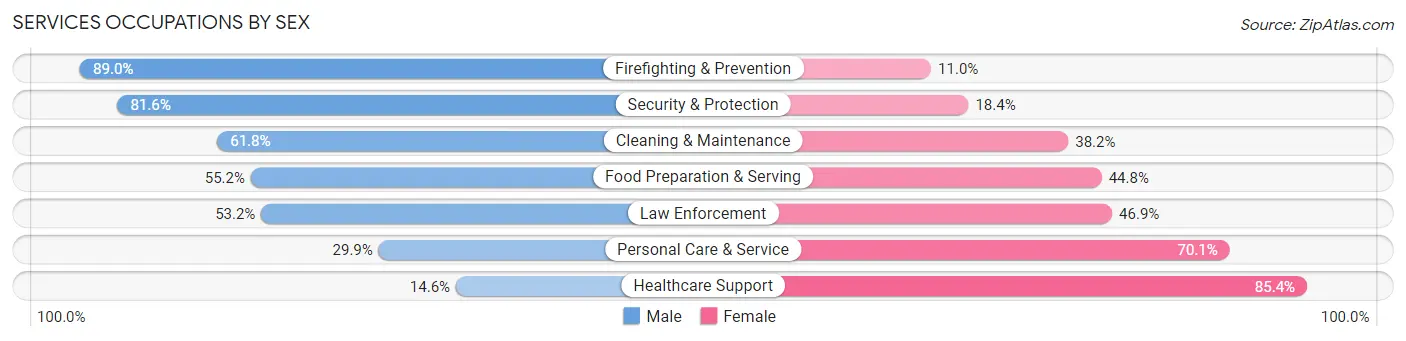
Services Occupations by Sex
Within the Services occupations in Chester, the most male-oriented occupations are Firefighting & Prevention (89.0%), Security & Protection (81.6%), and Cleaning & Maintenance (61.8%), while the most female-oriented occupations are Healthcare Support (85.4%), Personal Care & Service (70.1%), and Law Enforcement (46.9%).
| Occupation | Male | Female |
| Healthcare Support | 306 (14.6%) | 1,791 (85.4%) |
| Security & Protection | 439 (81.6%) | 99 (18.4%) |
| Firefighting & Prevention | 380 (89.0%) | 47 (11.0%) |
| Law Enforcement | 59 (53.1%) | 52 (46.9%) |
| Food Preparation & Serving | 514 (55.2%) | 417 (44.8%) |
| Cleaning & Maintenance | 486 (61.8%) | 300 (38.2%) |
| Personal Care & Service | 90 (29.9%) | 211 (70.1%) |
| Total (Category) | 1,835 (39.4%) | 2,818 (60.6%) |
| Total (Overall) | 6,071 (46.8%) | 6,898 (53.2%) |
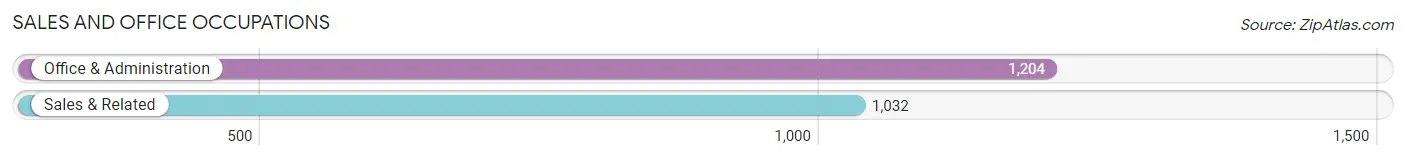
Sales and Office Occupations
The most common Sales and Office occupations in Chester are Office & Administration (1,204 | 9.3%), and Sales & Related (1,032 | 8.0%).
Sales and Office Occupations by Sex
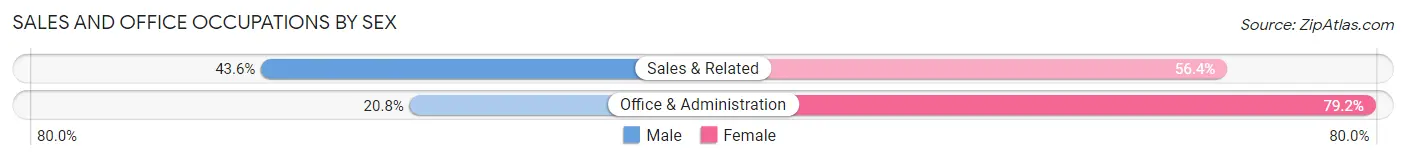
| Occupation | Male | Female |
| Sales & Related | 450 (43.6%) | 582 (56.4%) |
| Office & Administration | 250 (20.8%) | 954 (79.2%) |
| Total (Category) | 700 (31.3%) | 1,536 (68.7%) |
| Total (Overall) | 6,071 (46.8%) | 6,898 (53.2%) |
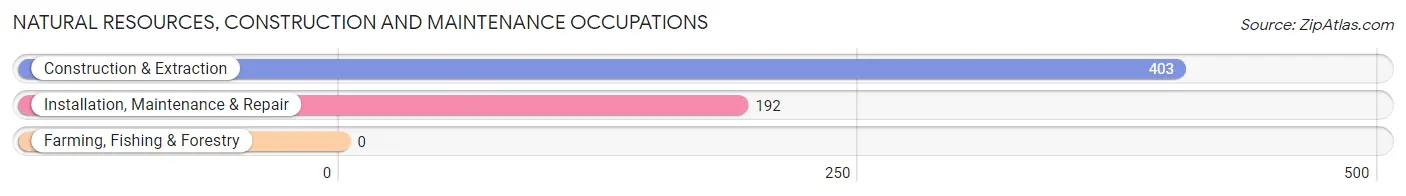
Natural Resources, Construction and Maintenance Occupations
The most common Natural Resources, Construction and Maintenance occupations in Chester are Construction & Extraction (403 | 3.1%), and Installation, Maintenance & Repair (192 | 1.5%).
Natural Resources, Construction and Maintenance Occupations by Sex
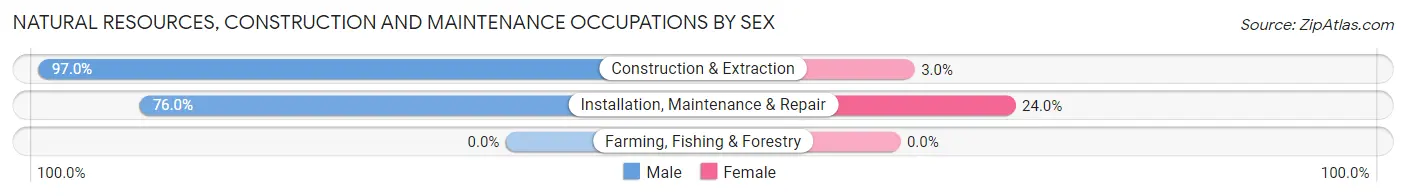
| Occupation | Male | Female |
| Farming, Fishing & Forestry | 0 (0.0%) | 0 (0.0%) |
| Construction & Extraction | 391 (97.0%) | 12 (3.0%) |
| Installation, Maintenance & Repair | 146 (76.0%) | 46 (24.0%) |
| Total (Category) | 537 (90.2%) | 58 (9.8%) |
| Total (Overall) | 6,071 (46.8%) | 6,898 (53.2%) |
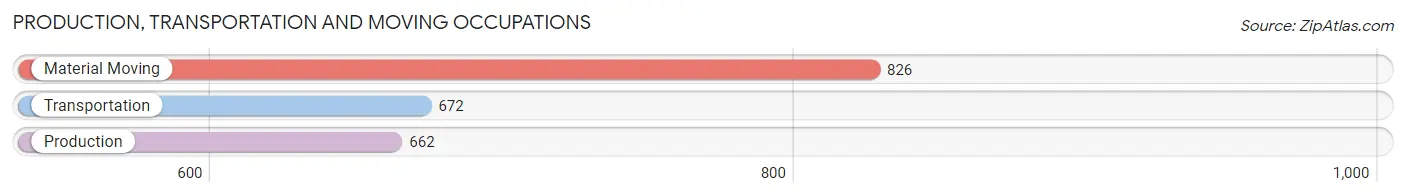
Production, Transportation and Moving Occupations
The most common Production, Transportation and Moving occupations in Chester are Material Moving (826 | 6.4%), Transportation (672 | 5.2%), and Production (662 | 5.1%).
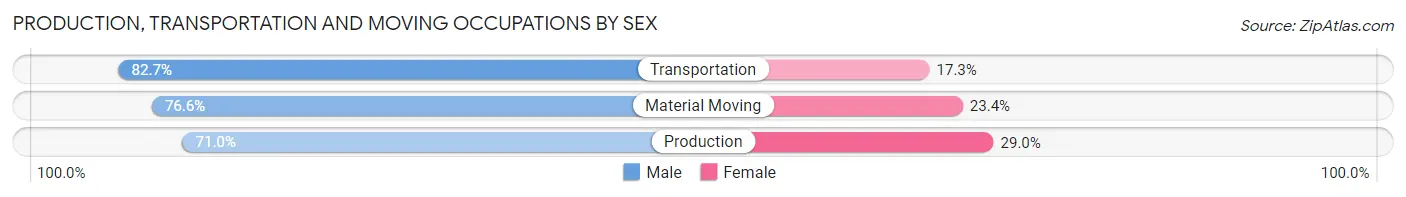
Production, Transportation and Moving Occupations by Sex
| Occupation | Male | Female |
| Production | 470 (71.0%) | 192 (29.0%) |
| Transportation | 556 (82.7%) | 116 (17.3%) |
| Material Moving | 633 (76.6%) | 193 (23.4%) |
| Total (Category) | 1,659 (76.8%) | 501 (23.2%) |
| Total (Overall) | 6,071 (46.8%) | 6,898 (53.2%) |
Employment Industries by Sex in Chester
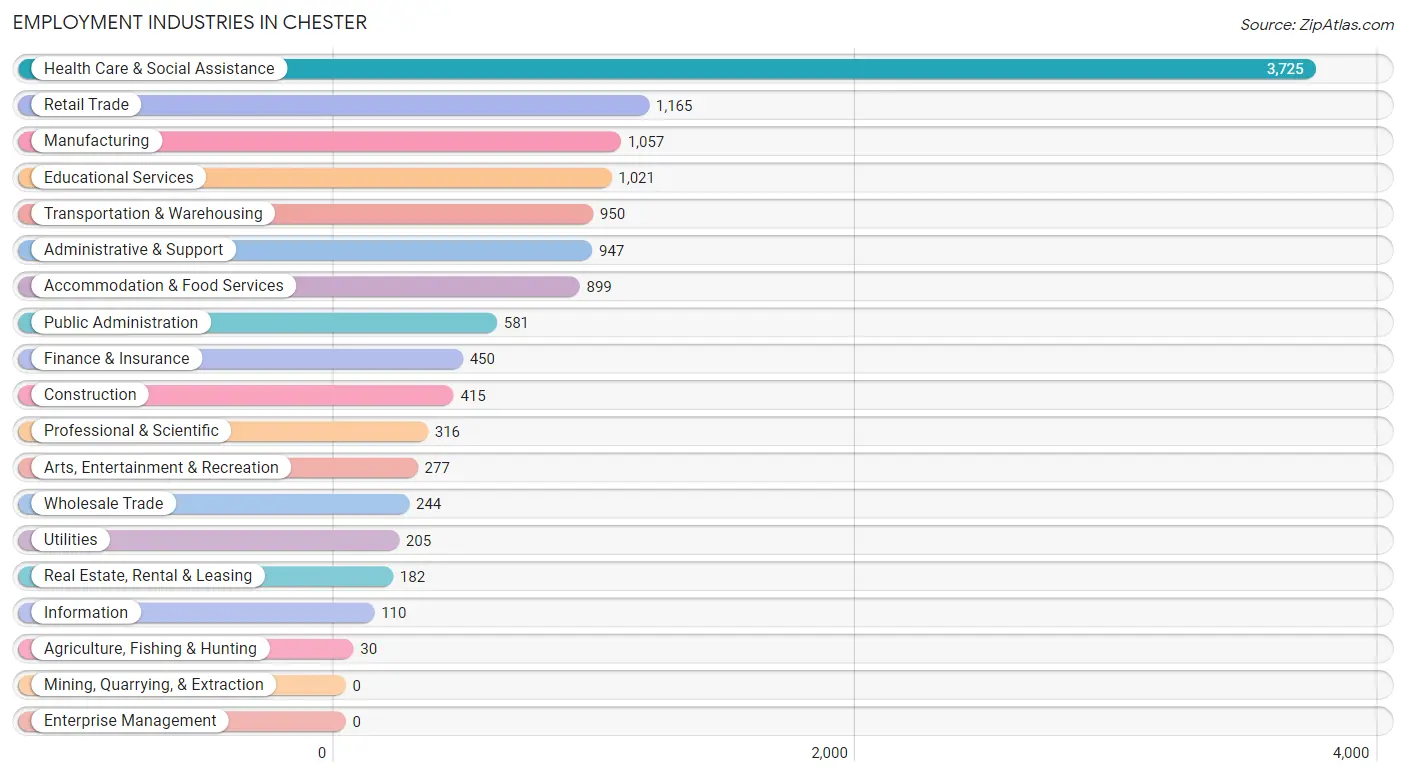
Employment Industries in Chester
The major employment industries in Chester include Health Care & Social Assistance (3,725 | 28.7%), Retail Trade (1,165 | 9.0%), Manufacturing (1,057 | 8.2%), Educational Services (1,021 | 7.9%), and Transportation & Warehousing (950 | 7.3%).
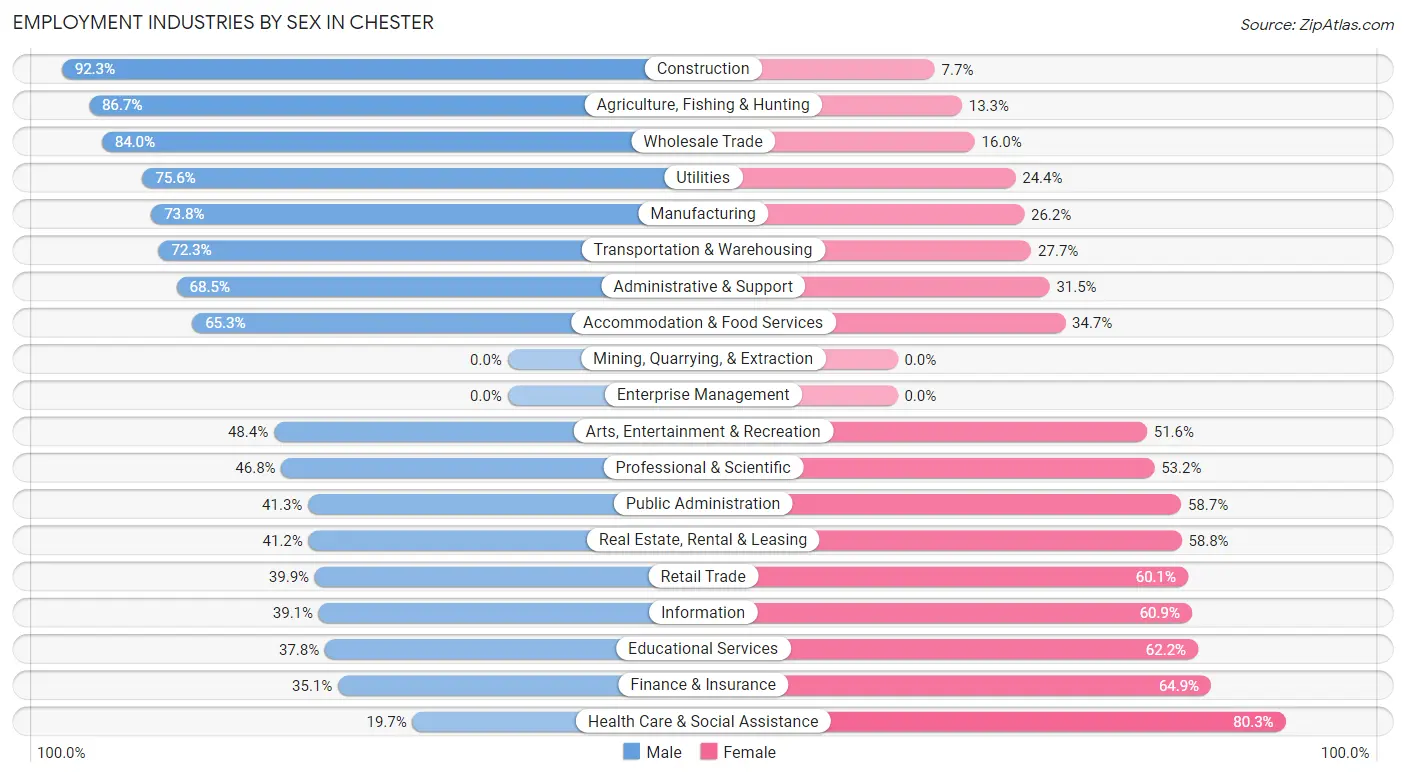
Employment Industries by Sex in Chester
The Chester industries that see more men than women are Construction (92.3%), Agriculture, Fishing & Hunting (86.7%), and Wholesale Trade (84.0%), whereas the industries that tend to have a higher number of women are Health Care & Social Assistance (80.3%), Finance & Insurance (64.9%), and Educational Services (62.2%).
| Industry | Male | Female |
| Agriculture, Fishing & Hunting | 26 (86.7%) | 4 (13.3%) |
| Mining, Quarrying, & Extraction | 0 (0.0%) | 0 (0.0%) |
| Construction | 383 (92.3%) | 32 (7.7%) |
| Manufacturing | 780 (73.8%) | 277 (26.2%) |
| Wholesale Trade | 205 (84.0%) | 39 (16.0%) |
| Retail Trade | 465 (39.9%) | 700 (60.1%) |
| Transportation & Warehousing | 687 (72.3%) | 263 (27.7%) |
| Utilities | 155 (75.6%) | 50 (24.4%) |
| Information | 43 (39.1%) | 67 (60.9%) |
| Finance & Insurance | 158 (35.1%) | 292 (64.9%) |
| Real Estate, Rental & Leasing | 75 (41.2%) | 107 (58.8%) |
| Professional & Scientific | 148 (46.8%) | 168 (53.2%) |
| Enterprise Management | 0 (0.0%) | 0 (0.0%) |
| Administrative & Support | 649 (68.5%) | 298 (31.5%) |
| Educational Services | 386 (37.8%) | 635 (62.2%) |
| Health Care & Social Assistance | 734 (19.7%) | 2,991 (80.3%) |
| Arts, Entertainment & Recreation | 134 (48.4%) | 143 (51.6%) |
| Accommodation & Food Services | 587 (65.3%) | 312 (34.7%) |
| Public Administration | 240 (41.3%) | 341 (58.7%) |
| Total | 6,071 (46.8%) | 6,898 (53.2%) |
Education in Chester
School Enrollment in Chester
The most common levels of schooling among the 9,077 students in Chester are college / undergraduate (2,991 | 33.0%), middle school (1,714 | 18.9%), and elementary school (1,646 | 18.1%).
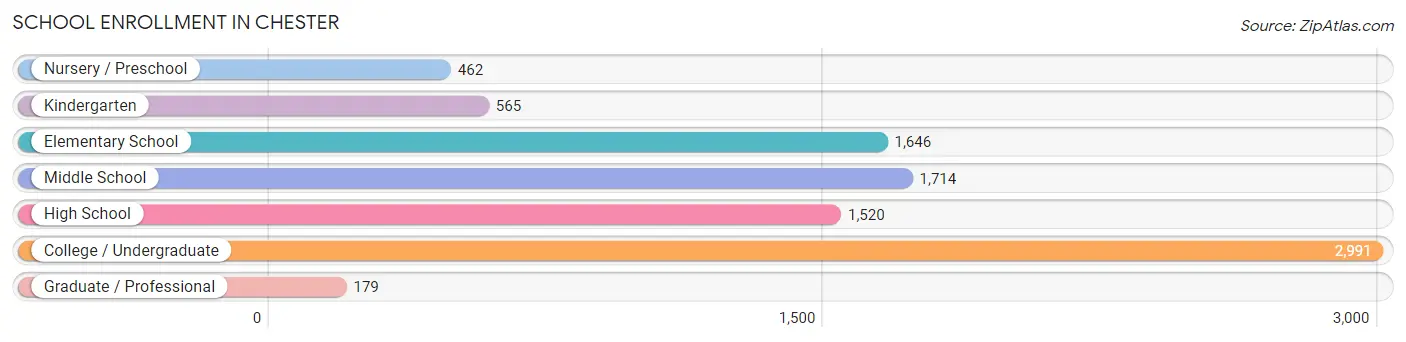
| School Level | # Students | % Students |
| Nursery / Preschool | 462 | 5.1% |
| Kindergarten | 565 | 6.2% |
| Elementary School | 1,646 | 18.1% |
| Middle School | 1,714 | 18.9% |
| High School | 1,520 | 16.8% |
| College / Undergraduate | 2,991 | 33.0% |
| Graduate / Professional | 179 | 2.0% |
| Total | 9,077 | 100.0% |
School Enrollment by Age by Funding Source in Chester
Out of a total of 9,077 students who are enrolled in schools in Chester, 2,660 (29.3%) attend a private institution, while the remaining 6,417 (70.7%) are enrolled in public schools. The age group of 20 to 24 year olds has the highest likelihood of being enrolled in private schools, with 1,323 (82.4% in the age bracket) enrolled. Conversely, the age group of 3 to 4 year olds has the lowest likelihood of being enrolled in a private school, with 378 (99.0% in the age bracket) attending a public institution.
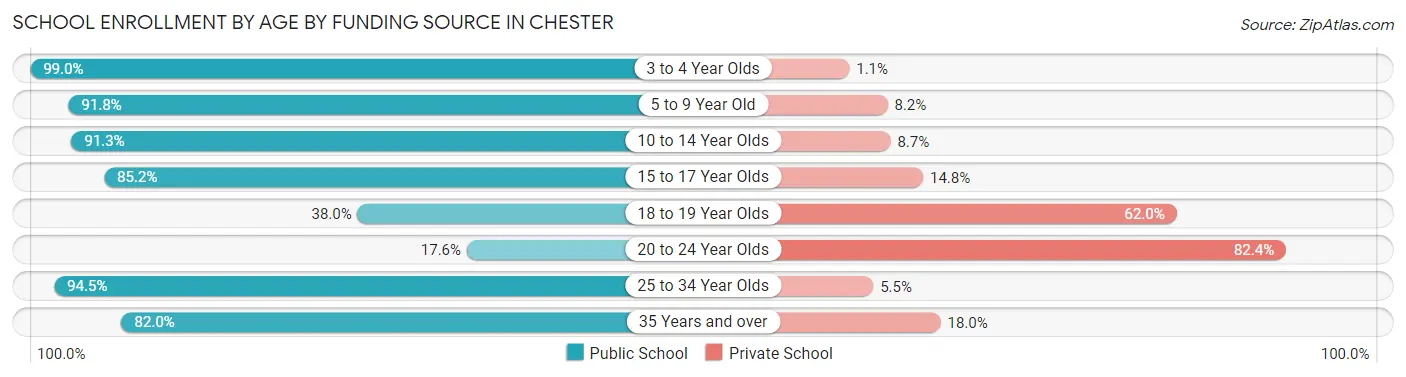
| Age Bracket | Public School | Private School |
| 3 to 4 Year Olds | 378 (99.0%) | 4 (1.1%) |
| 5 to 9 Year Old | 2,092 (91.8%) | 186 (8.2%) |
| 10 to 14 Year Olds | 1,719 (91.3%) | 164 (8.7%) |
| 15 to 17 Year Olds | 974 (85.2%) | 169 (14.8%) |
| 18 to 19 Year Olds | 457 (38.0%) | 746 (62.0%) |
| 20 to 24 Year Olds | 283 (17.6%) | 1,323 (82.4%) |
| 25 to 34 Year Olds | 309 (94.5%) | 18 (5.5%) |
| 35 Years and over | 209 (82.0%) | 46 (18.0%) |
| Total | 6,417 (70.7%) | 2,660 (29.3%) |
Educational Attainment by Field of Study in Chester
Business (791 | 26.7%), science & technology (409 | 13.8%), education (382 | 12.9%), social sciences (255 | 8.6%), and psychology (196 | 6.6%) are the most common fields of study among 2,958 individuals in Chester who have obtained a bachelor's degree or higher.
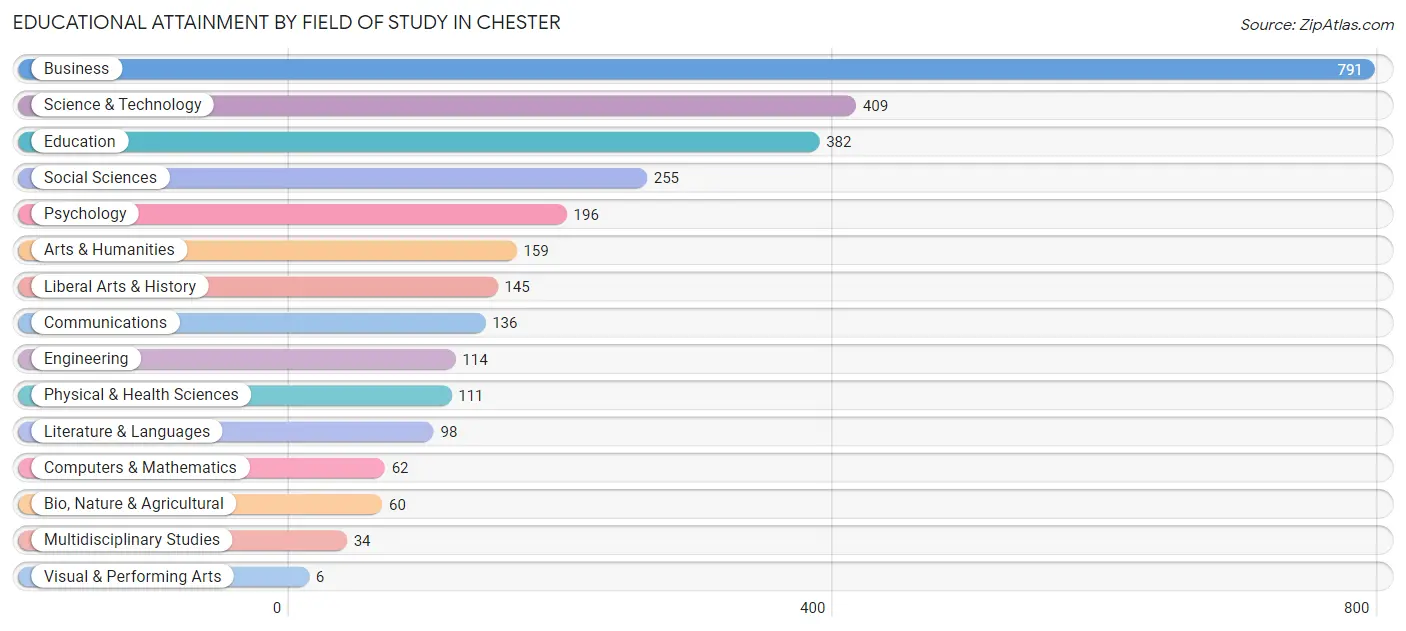
| Field of Study | # Graduates | % Graduates |
| Computers & Mathematics | 62 | 2.1% |
| Bio, Nature & Agricultural | 60 | 2.0% |
| Physical & Health Sciences | 111 | 3.7% |
| Psychology | 196 | 6.6% |
| Social Sciences | 255 | 8.6% |
| Engineering | 114 | 3.8% |
| Multidisciplinary Studies | 34 | 1.1% |
| Science & Technology | 409 | 13.8% |
| Business | 791 | 26.7% |
| Education | 382 | 12.9% |
| Literature & Languages | 98 | 3.3% |
| Liberal Arts & History | 145 | 4.9% |
| Visual & Performing Arts | 6 | 0.2% |
| Communications | 136 | 4.6% |
| Arts & Humanities | 159 | 5.4% |
| Total | 2,958 | 100.0% |
Transportation & Commute in Chester
Vehicle Availability by Sex in Chester
The most prevalent vehicle ownership categories in Chester are males with 2 vehicles (2,190, accounting for 39.9%) and females with 2 vehicles (1,928, making up 35.3%).
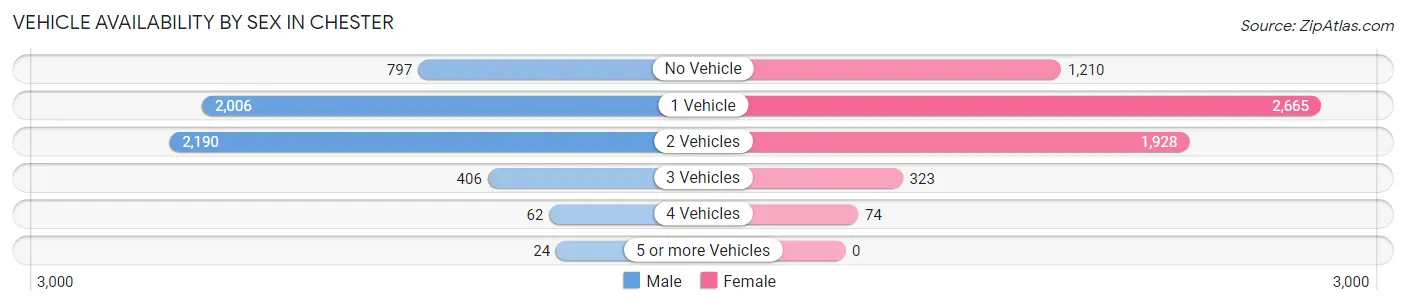
| Vehicles Available | Male | Female |
| No Vehicle | 797 (14.5%) | 1,210 (19.5%) |
| 1 Vehicle | 2,006 (36.6%) | 2,665 (43.0%) |
| 2 Vehicles | 2,190 (39.9%) | 1,928 (31.1%) |
| 3 Vehicles | 406 (7.4%) | 323 (5.2%) |
| 4 Vehicles | 62 (1.1%) | 74 (1.2%) |
| 5 or more Vehicles | 24 (0.4%) | 0 (0.0%) |
| Total | 5,485 (100.0%) | 6,200 (100.0%) |
Commute Time in Chester
The most frequently occuring commute durations in Chester are 20 to 24 minutes (2,253 commuters, 19.9%), 15 to 19 minutes (1,812 commuters, 16.0%), and 10 to 14 minutes (1,596 commuters, 14.1%).
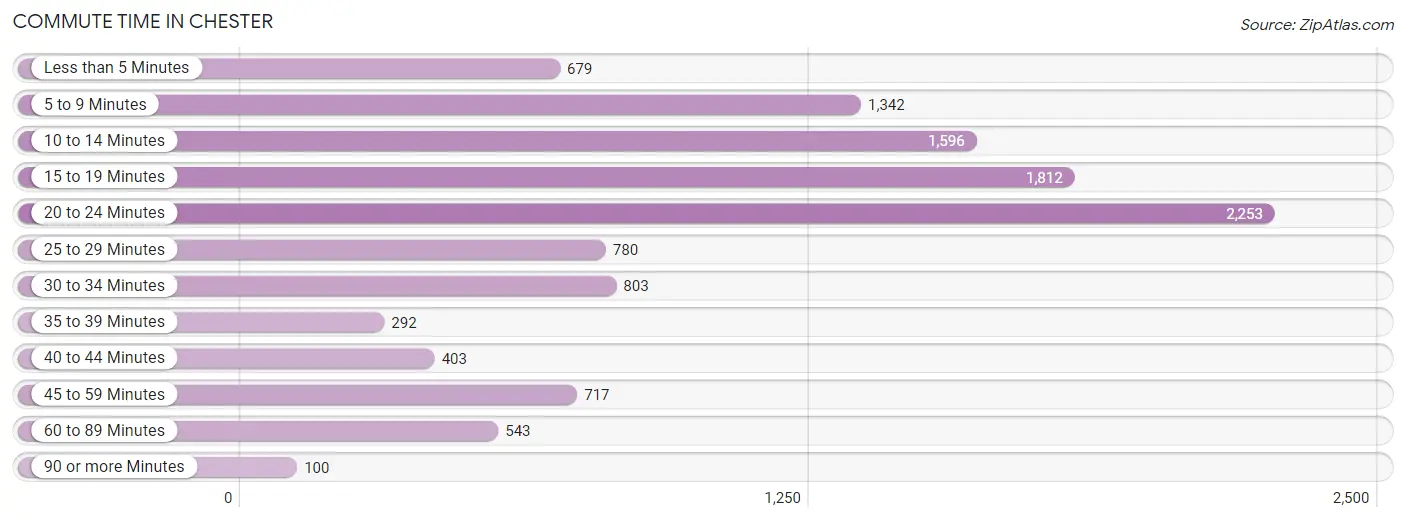
| Commute Time | # Commuters | % Commuters |
| Less than 5 Minutes | 679 | 6.0% |
| 5 to 9 Minutes | 1,342 | 11.9% |
| 10 to 14 Minutes | 1,596 | 14.1% |
| 15 to 19 Minutes | 1,812 | 16.0% |
| 20 to 24 Minutes | 2,253 | 19.9% |
| 25 to 29 Minutes | 780 | 6.9% |
| 30 to 34 Minutes | 803 | 7.1% |
| 35 to 39 Minutes | 292 | 2.6% |
| 40 to 44 Minutes | 403 | 3.6% |
| 45 to 59 Minutes | 717 | 6.3% |
| 60 to 89 Minutes | 543 | 4.8% |
| 90 or more Minutes | 100 | 0.9% |
Commute Time by Sex in Chester
The most common commute times in Chester are 15 to 19 minutes (1,001 commuters, 18.8%) for males and 20 to 24 minutes (1,369 commuters, 22.8%) for females.
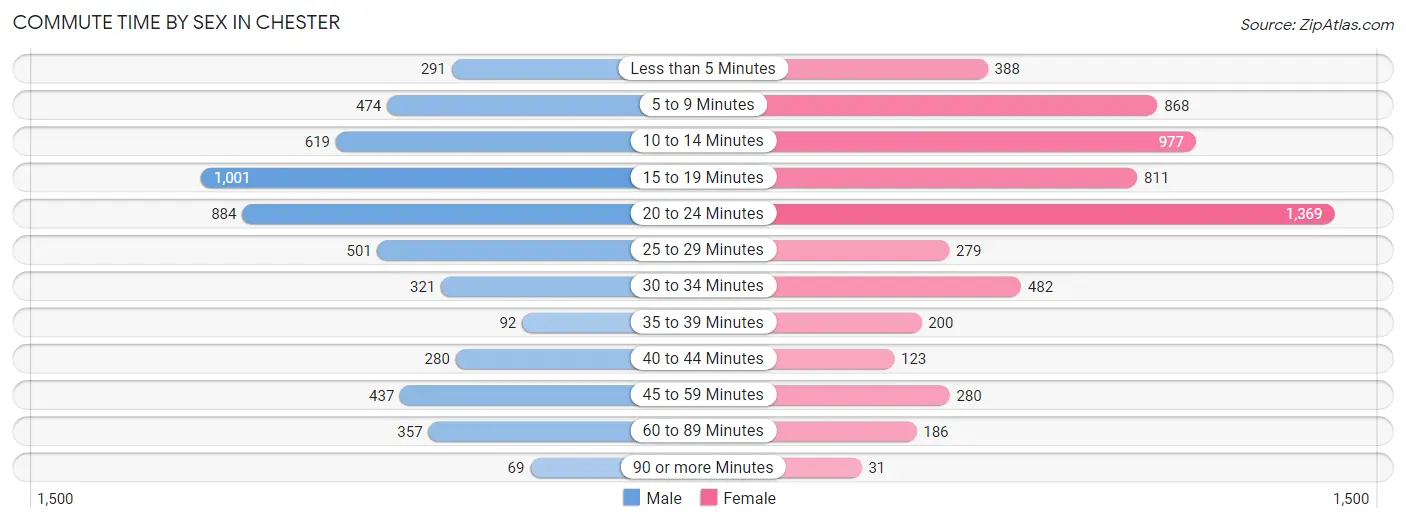
| Commute Time | Male | Female |
| Less than 5 Minutes | 291 (5.5%) | 388 (6.5%) |
| 5 to 9 Minutes | 474 (8.9%) | 868 (14.5%) |
| 10 to 14 Minutes | 619 (11.6%) | 977 (16.3%) |
| 15 to 19 Minutes | 1,001 (18.8%) | 811 (13.5%) |
| 20 to 24 Minutes | 884 (16.6%) | 1,369 (22.8%) |
| 25 to 29 Minutes | 501 (9.4%) | 279 (4.6%) |
| 30 to 34 Minutes | 321 (6.0%) | 482 (8.0%) |
| 35 to 39 Minutes | 92 (1.7%) | 200 (3.3%) |
| 40 to 44 Minutes | 280 (5.3%) | 123 (2.1%) |
| 45 to 59 Minutes | 437 (8.2%) | 280 (4.7%) |
| 60 to 89 Minutes | 357 (6.7%) | 186 (3.1%) |
| 90 or more Minutes | 69 (1.3%) | 31 (0.5%) |
Time of Departure to Work by Sex in Chester
The most frequent times of departure to work in Chester are 6:00 AM to 6:29 AM (937, 17.6%) for males and 12:00 PM to 3:59 PM (937, 15.6%) for females.
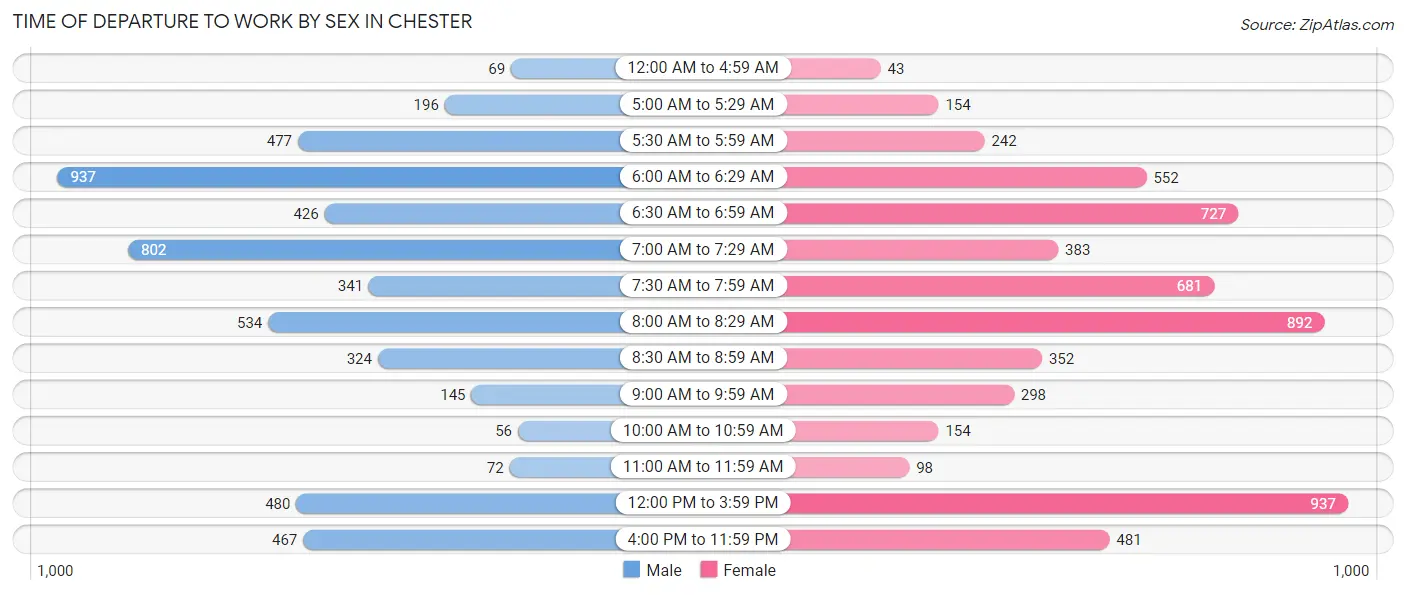
| Time of Departure | Male | Female |
| 12:00 AM to 4:59 AM | 69 (1.3%) | 43 (0.7%) |
| 5:00 AM to 5:29 AM | 196 (3.7%) | 154 (2.6%) |
| 5:30 AM to 5:59 AM | 477 (9.0%) | 242 (4.0%) |
| 6:00 AM to 6:29 AM | 937 (17.6%) | 552 (9.2%) |
| 6:30 AM to 6:59 AM | 426 (8.0%) | 727 (12.1%) |
| 7:00 AM to 7:29 AM | 802 (15.1%) | 383 (6.4%) |
| 7:30 AM to 7:59 AM | 341 (6.4%) | 681 (11.4%) |
| 8:00 AM to 8:29 AM | 534 (10.0%) | 892 (14.9%) |
| 8:30 AM to 8:59 AM | 324 (6.1%) | 352 (5.9%) |
| 9:00 AM to 9:59 AM | 145 (2.7%) | 298 (5.0%) |
| 10:00 AM to 10:59 AM | 56 (1.1%) | 154 (2.6%) |
| 11:00 AM to 11:59 AM | 72 (1.3%) | 98 (1.6%) |
| 12:00 PM to 3:59 PM | 480 (9.0%) | 937 (15.6%) |
| 4:00 PM to 11:59 PM | 467 (8.8%) | 481 (8.0%) |
| Total | 5,326 (100.0%) | 5,994 (100.0%) |
Housing Occupancy in Chester
Occupancy by Ownership in Chester
Of the total 12,471 dwellings in Chester, owner-occupied units account for 4,743 (38.0%), while renter-occupied units make up 7,728 (62.0%).
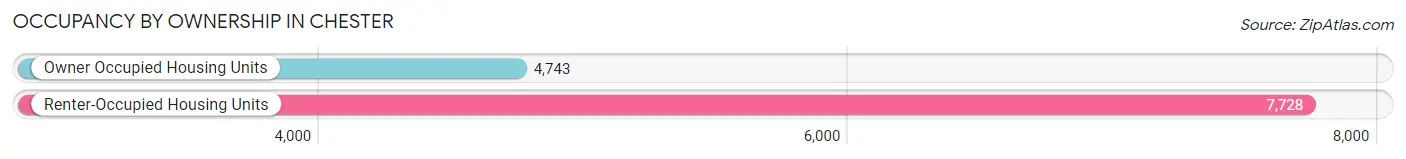
| Occupancy | # Housing Units | % Housing Units |
| Owner Occupied Housing Units | 4,743 | 38.0% |
| Renter-Occupied Housing Units | 7,728 | 62.0% |
| Total Occupied Housing Units | 12,471 | 100.0% |
Occupancy by Household Size in Chester
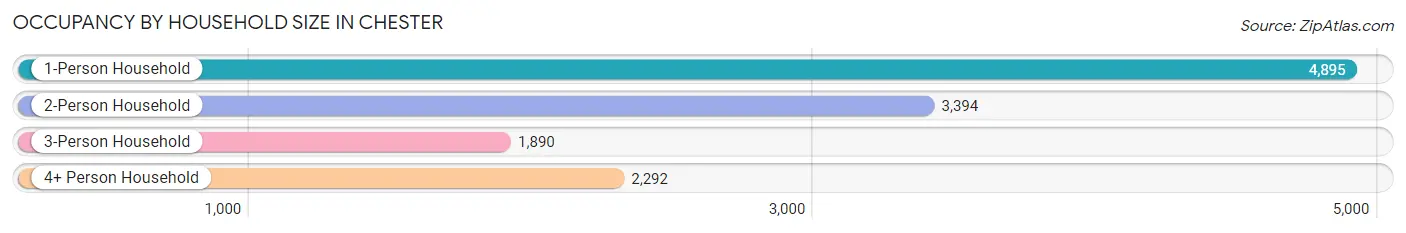
| Household Size | # Housing Units | % Housing Units |
| 1-Person Household | 4,895 | 39.3% |
| 2-Person Household | 3,394 | 27.2% |
| 3-Person Household | 1,890 | 15.2% |
| 4+ Person Household | 2,292 | 18.4% |
| Total Housing Units | 12,471 | 100.0% |
Occupancy by Ownership by Household Size in Chester
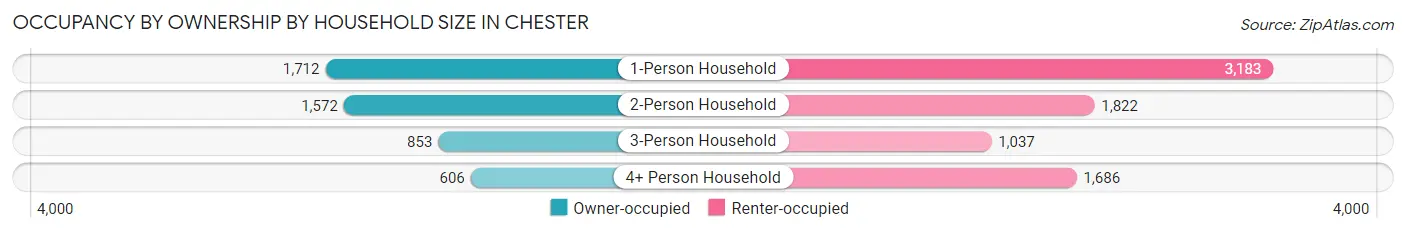
| Household Size | Owner-occupied | Renter-occupied |
| 1-Person Household | 1,712 (35.0%) | 3,183 (65.0%) |
| 2-Person Household | 1,572 (46.3%) | 1,822 (53.7%) |
| 3-Person Household | 853 (45.1%) | 1,037 (54.9%) |
| 4+ Person Household | 606 (26.4%) | 1,686 (73.6%) |
| Total Housing Units | 4,743 (38.0%) | 7,728 (62.0%) |
Occupancy by Educational Attainment in Chester
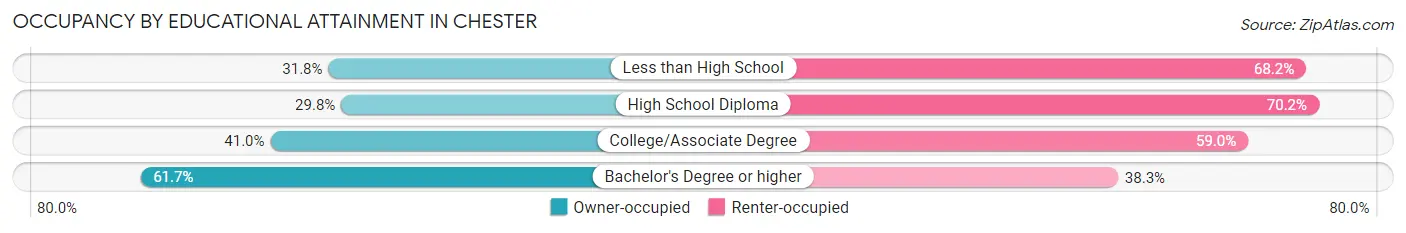
| Household Size | Owner-occupied | Renter-occupied |
| Less than High School | 482 (31.8%) | 1,033 (68.2%) |
| High School Diploma | 1,618 (29.8%) | 3,814 (70.2%) |
| College/Associate Degree | 1,517 (41.0%) | 2,181 (59.0%) |
| Bachelor's Degree or higher | 1,126 (61.7%) | 700 (38.3%) |
Occupancy by Age of Householder in Chester
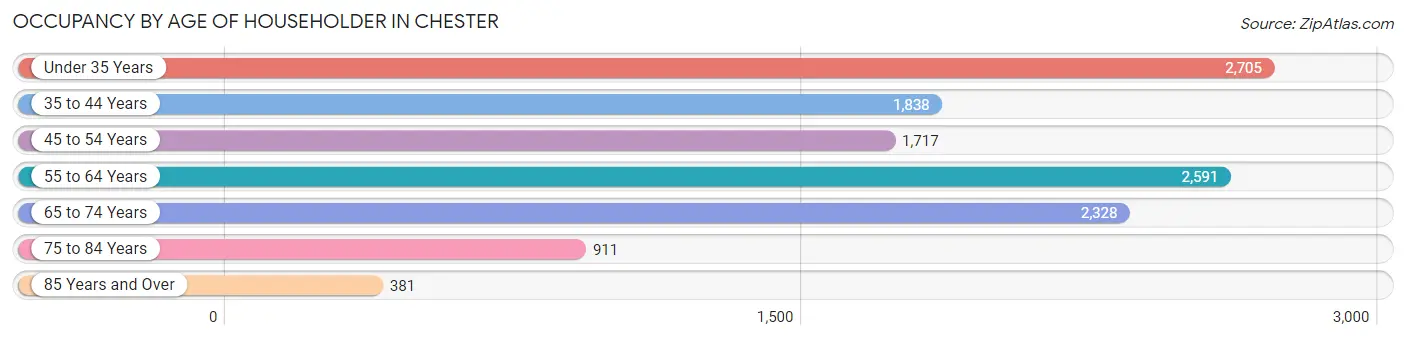
| Age Bracket | # Households | % Households |
| Under 35 Years | 2,705 | 21.7% |
| 35 to 44 Years | 1,838 | 14.7% |
| 45 to 54 Years | 1,717 | 13.8% |
| 55 to 64 Years | 2,591 | 20.8% |
| 65 to 74 Years | 2,328 | 18.7% |
| 75 to 84 Years | 911 | 7.3% |
| 85 Years and Over | 381 | 3.1% |
| Total | 12,471 | 100.0% |
Housing Finances in Chester
Median Income by Occupancy in Chester
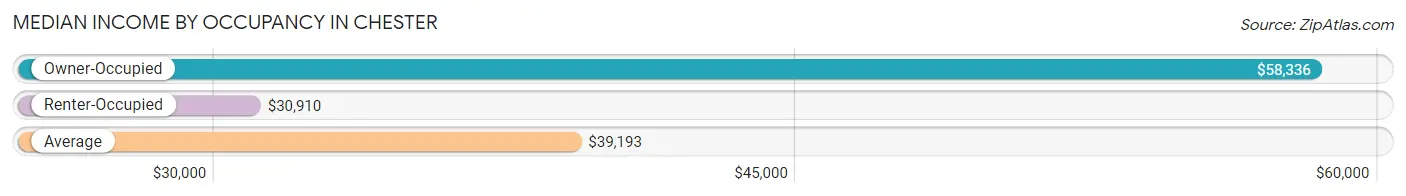
| Occupancy Type | # Households | Median Income |
| Owner-Occupied | 4,743 (38.0%) | $58,336 |
| Renter-Occupied | 7,728 (62.0%) | $30,910 |
| Average | 12,471 (100.0%) | $39,193 |
Occupancy by Householder Income Bracket in Chester
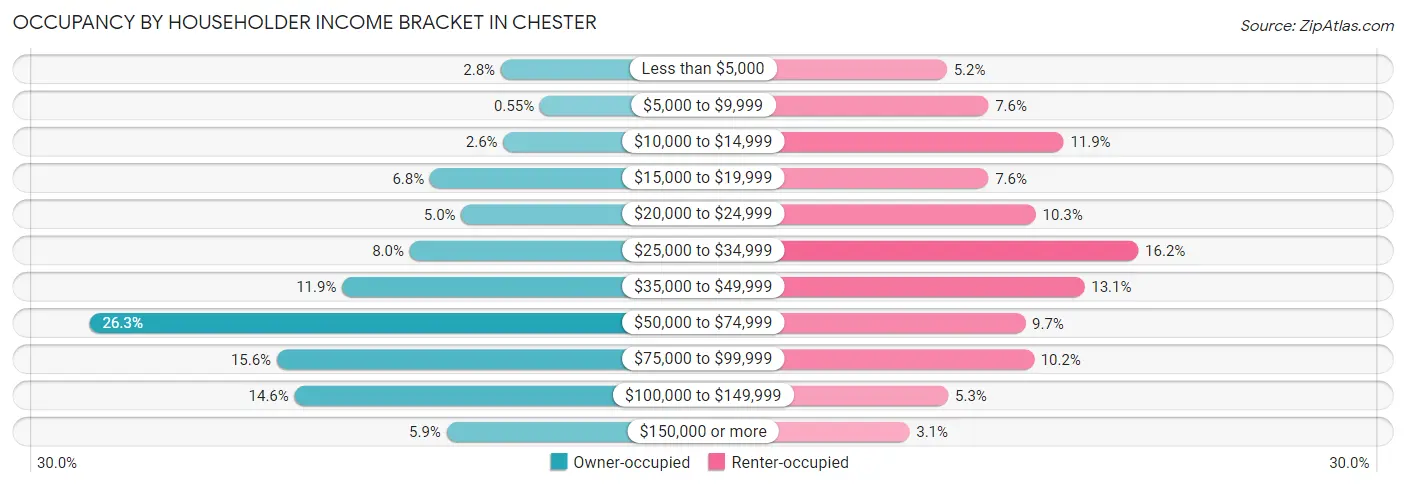
| Income Bracket | Owner-occupied | Renter-occupied |
| Less than $5,000 | 132 (2.8%) | 403 (5.2%) |
| $5,000 to $9,999 | 26 (0.5%) | 586 (7.6%) |
| $10,000 to $14,999 | 125 (2.6%) | 918 (11.9%) |
| $15,000 to $19,999 | 324 (6.8%) | 586 (7.6%) |
| $20,000 to $24,999 | 239 (5.0%) | 795 (10.3%) |
| $25,000 to $34,999 | 379 (8.0%) | 1,248 (16.2%) |
| $35,000 to $49,999 | 562 (11.8%) | 1,010 (13.1%) |
| $50,000 to $74,999 | 1,247 (26.3%) | 749 (9.7%) |
| $75,000 to $99,999 | 739 (15.6%) | 787 (10.2%) |
| $100,000 to $149,999 | 691 (14.6%) | 409 (5.3%) |
| $150,000 or more | 279 (5.9%) | 237 (3.1%) |
| Total | 4,743 (100.0%) | 7,728 (100.0%) |
Monthly Housing Cost Tiers in Chester
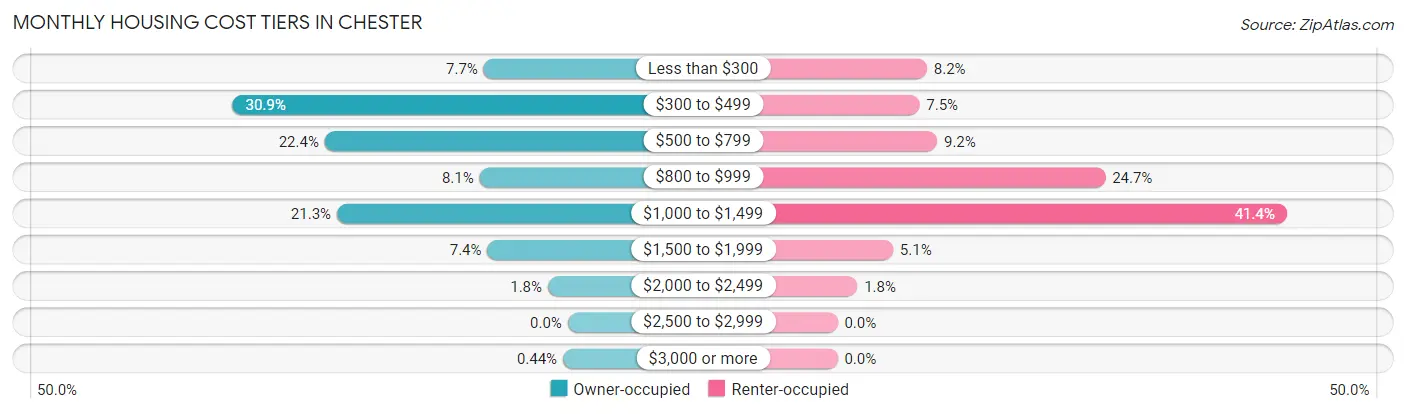
| Monthly Cost | Owner-occupied | Renter-occupied |
| Less than $300 | 367 (7.7%) | 636 (8.2%) |
| $300 to $499 | 1,463 (30.8%) | 583 (7.5%) |
| $500 to $799 | 1,061 (22.4%) | 709 (9.2%) |
| $800 to $999 | 385 (8.1%) | 1,905 (24.6%) |
| $1,000 to $1,499 | 1,008 (21.2%) | 3,196 (41.4%) |
| $1,500 to $1,999 | 351 (7.4%) | 395 (5.1%) |
| $2,000 to $2,499 | 87 (1.8%) | 141 (1.8%) |
| $2,500 to $2,999 | 0 (0.0%) | 0 (0.0%) |
| $3,000 or more | 21 (0.4%) | 0 (0.0%) |
| Total | 4,743 (100.0%) | 7,728 (100.0%) |
Physical Housing Characteristics in Chester
Housing Structures in Chester
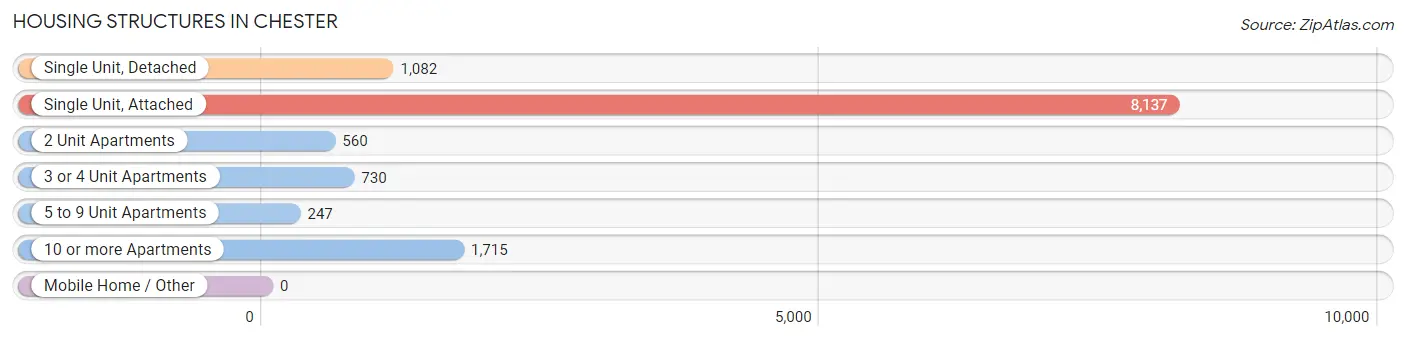
| Structure Type | # Housing Units | % Housing Units |
| Single Unit, Detached | 1,082 | 8.7% |
| Single Unit, Attached | 8,137 | 65.2% |
| 2 Unit Apartments | 560 | 4.5% |
| 3 or 4 Unit Apartments | 730 | 5.9% |
| 5 to 9 Unit Apartments | 247 | 2.0% |
| 10 or more Apartments | 1,715 | 13.8% |
| Mobile Home / Other | 0 | 0.0% |
| Total | 12,471 | 100.0% |
Housing Structures by Occupancy in Chester
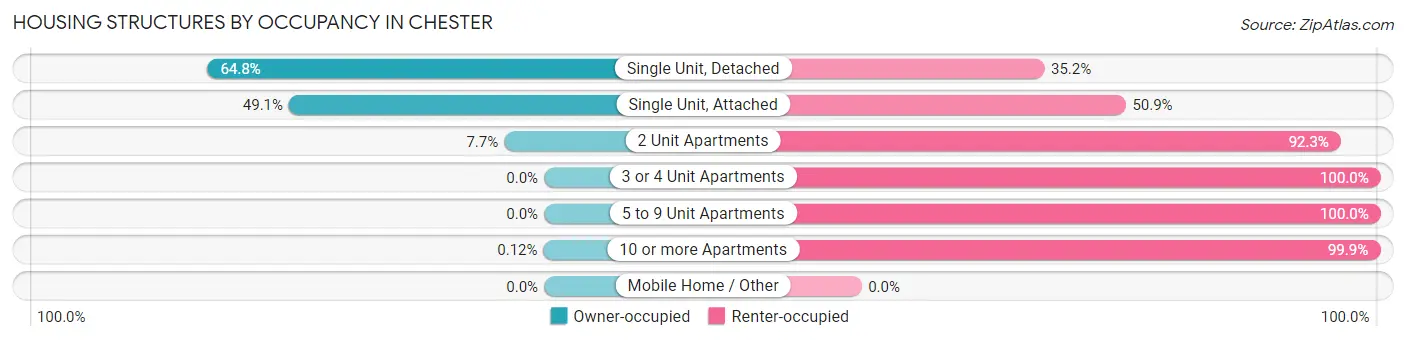
| Structure Type | Owner-occupied | Renter-occupied |
| Single Unit, Detached | 701 (64.8%) | 381 (35.2%) |
| Single Unit, Attached | 3,997 (49.1%) | 4,140 (50.9%) |
| 2 Unit Apartments | 43 (7.7%) | 517 (92.3%) |
| 3 or 4 Unit Apartments | 0 (0.0%) | 730 (100.0%) |
| 5 to 9 Unit Apartments | 0 (0.0%) | 247 (100.0%) |
| 10 or more Apartments | 2 (0.1%) | 1,713 (99.9%) |
| Mobile Home / Other | 0 (0.0%) | 0 (0.0%) |
| Total | 4,743 (38.0%) | 7,728 (62.0%) |
Housing Structures by Number of Rooms in Chester
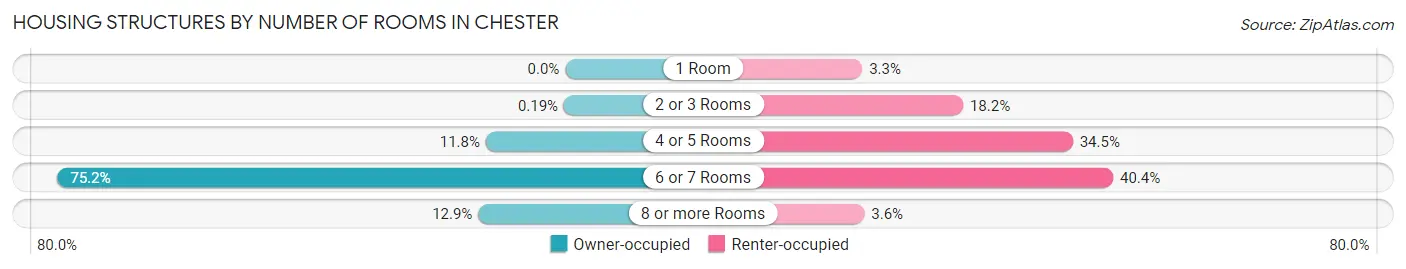
| Number of Rooms | Owner-occupied | Renter-occupied |
| 1 Room | 0 (0.0%) | 255 (3.3%) |
| 2 or 3 Rooms | 9 (0.2%) | 1,407 (18.2%) |
| 4 or 5 Rooms | 558 (11.8%) | 2,662 (34.4%) |
| 6 or 7 Rooms | 3,565 (75.2%) | 3,124 (40.4%) |
| 8 or more Rooms | 611 (12.9%) | 280 (3.6%) |
| Total | 4,743 (100.0%) | 7,728 (100.0%) |
Housing Structure by Heating Type in Chester
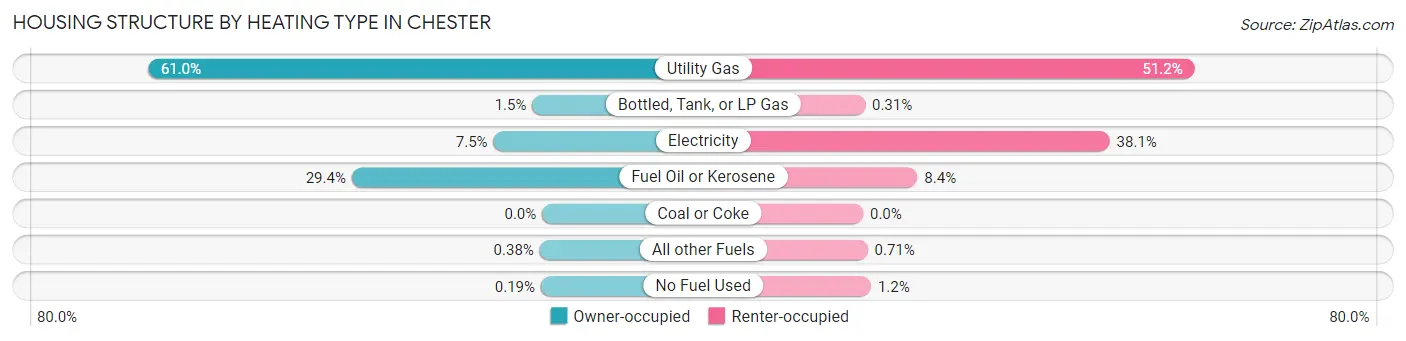
| Heating Type | Owner-occupied | Renter-occupied |
| Utility Gas | 2,891 (61.0%) | 3,960 (51.2%) |
| Bottled, Tank, or LP Gas | 72 (1.5%) | 24 (0.3%) |
| Electricity | 357 (7.5%) | 2,946 (38.1%) |
| Fuel Oil or Kerosene | 1,396 (29.4%) | 649 (8.4%) |
| Coal or Coke | 0 (0.0%) | 0 (0.0%) |
| All other Fuels | 18 (0.4%) | 55 (0.7%) |
| No Fuel Used | 9 (0.2%) | 94 (1.2%) |
| Total | 4,743 (100.0%) | 7,728 (100.0%) |
Household Vehicle Usage in Chester
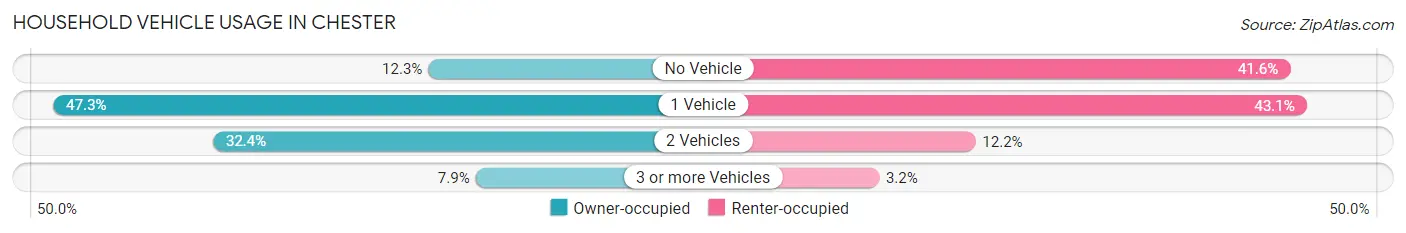
| Vehicles per Household | Owner-occupied | Renter-occupied |
| No Vehicle | 585 (12.3%) | 3,211 (41.5%) |
| 1 Vehicle | 2,245 (47.3%) | 3,330 (43.1%) |
| 2 Vehicles | 1,538 (32.4%) | 941 (12.2%) |
| 3 or more Vehicles | 375 (7.9%) | 246 (3.2%) |
| Total | 4,743 (100.0%) | 7,728 (100.0%) |
Real Estate & Mortgages in Chester
Real Estate and Mortgage Overview in Chester
| Characteristic | Without Mortgage | With Mortgage |
| Housing Units | 2,568 | 2,175 |
| Median Property Value | $67,800 | $104,300 |
| Median Household Income | $53,925 | $191 |
| Monthly Housing Costs | $420 | $21 |
| Real Estate Taxes | $1,356 | $55 |
Property Value by Mortgage Status in Chester
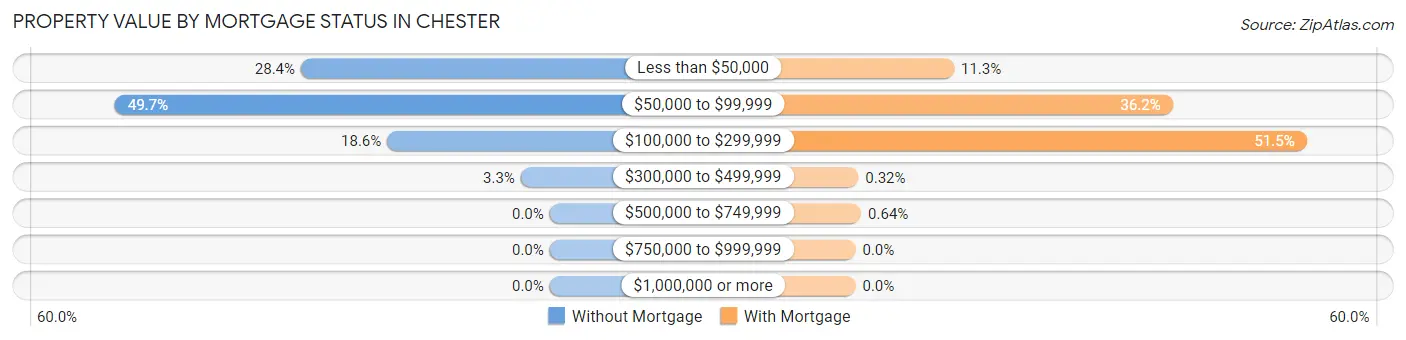
| Property Value | Without Mortgage | With Mortgage |
| Less than $50,000 | 730 (28.4%) | 245 (11.3%) |
| $50,000 to $99,999 | 1,276 (49.7%) | 788 (36.2%) |
| $100,000 to $299,999 | 477 (18.6%) | 1,121 (51.5%) |
| $300,000 to $499,999 | 85 (3.3%) | 7 (0.3%) |
| $500,000 to $749,999 | 0 (0.0%) | 14 (0.6%) |
| $750,000 to $999,999 | 0 (0.0%) | 0 (0.0%) |
| $1,000,000 or more | 0 (0.0%) | 0 (0.0%) |
| Total | 2,568 (100.0%) | 2,175 (100.0%) |
Household Income by Mortgage Status in Chester
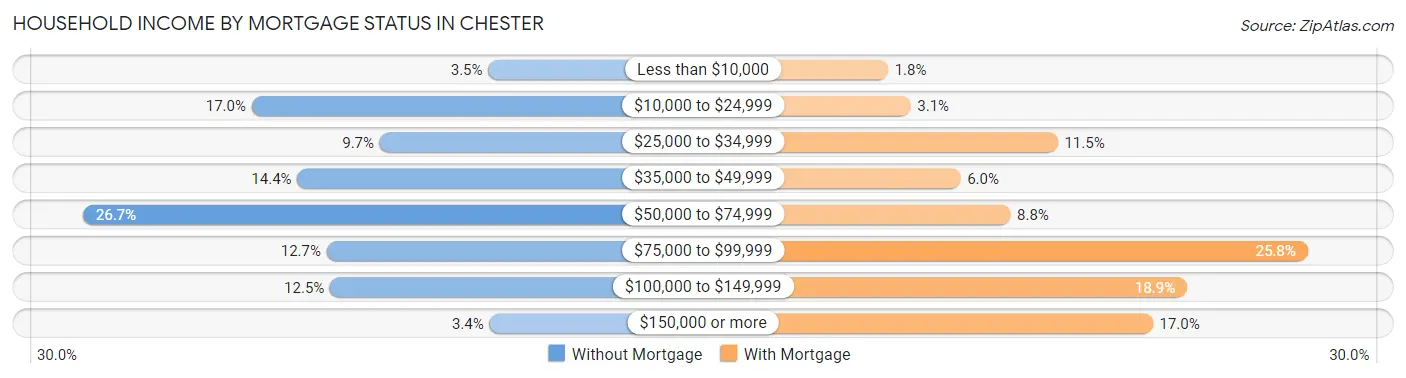
| Household Income | Without Mortgage | With Mortgage |
| Less than $10,000 | 90 (3.5%) | 40 (1.8%) |
| $10,000 to $24,999 | 437 (17.0%) | 68 (3.1%) |
| $25,000 to $34,999 | 249 (9.7%) | 251 (11.5%) |
| $35,000 to $49,999 | 370 (14.4%) | 130 (6.0%) |
| $50,000 to $74,999 | 685 (26.7%) | 192 (8.8%) |
| $75,000 to $99,999 | 327 (12.7%) | 562 (25.8%) |
| $100,000 to $149,999 | 322 (12.5%) | 412 (18.9%) |
| $150,000 or more | 88 (3.4%) | 369 (17.0%) |
| Total | 2,568 (100.0%) | 2,175 (100.0%) |
Property Value to Household Income Ratio in Chester
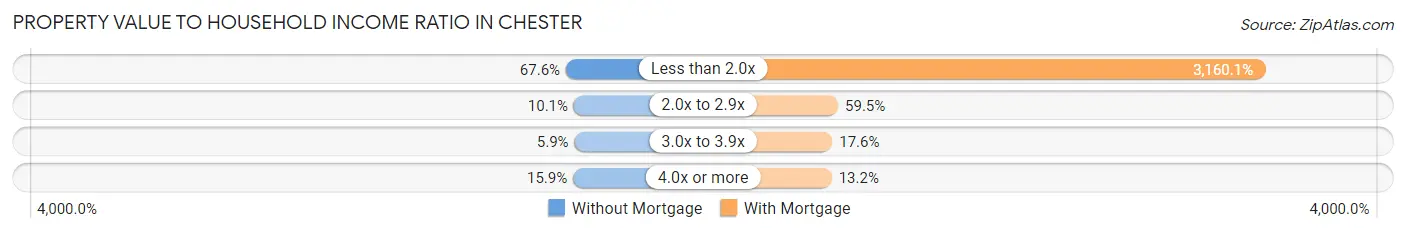
| Value-to-Income Ratio | Without Mortgage | With Mortgage |
| Less than 2.0x | 1,736 (67.6%) | 68,732 (3,160.1%) |
| 2.0x to 2.9x | 258 (10.1%) | 1,294 (59.5%) |
| 3.0x to 3.9x | 151 (5.9%) | 382 (17.6%) |
| 4.0x or more | 407 (15.9%) | 288 (13.2%) |
| Total | 2,568 (100.0%) | 2,175 (100.0%) |
Real Estate Taxes by Mortgage Status in Chester
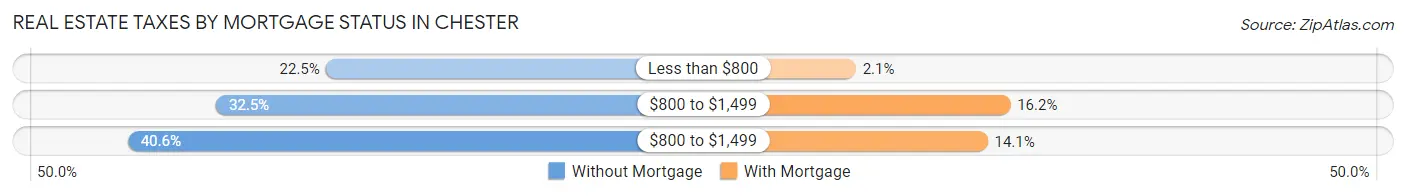
| Property Taxes | Without Mortgage | With Mortgage |
| Less than $800 | 578 (22.5%) | 45 (2.1%) |
| $800 to $1,499 | 835 (32.5%) | 352 (16.2%) |
| $800 to $1,499 | 1,042 (40.6%) | 307 (14.1%) |
| Total | 2,568 (100.0%) | 2,175 (100.0%) |
Health & Disability in Chester
Health Insurance Coverage by Age in Chester
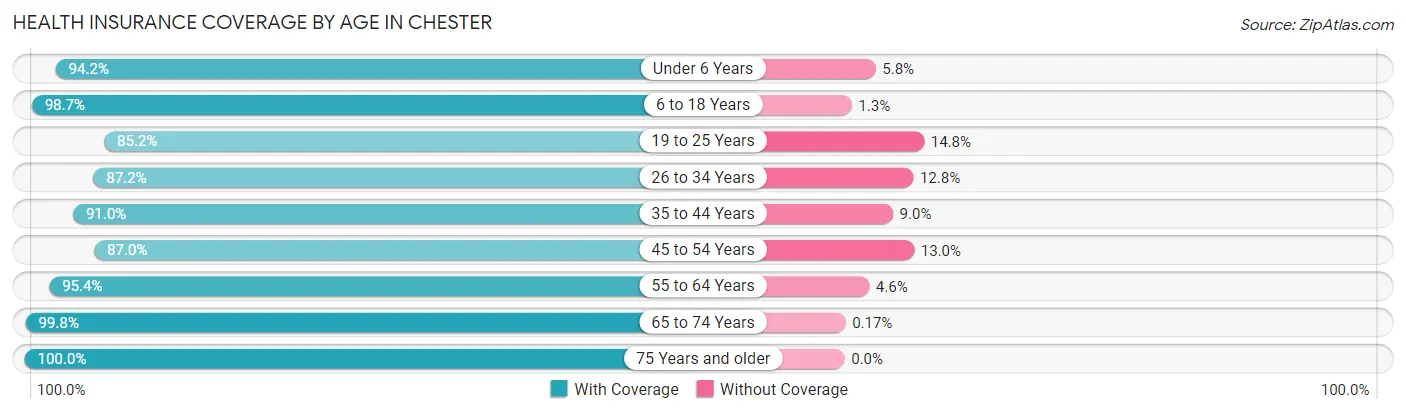
| Age Bracket | With Coverage | Without Coverage |
| Under 6 Years | 2,650 (94.2%) | 163 (5.8%) |
| 6 to 18 Years | 5,618 (98.7%) | 76 (1.3%) |
| 19 to 25 Years | 3,882 (85.2%) | 676 (14.8%) |
| 26 to 34 Years | 3,614 (87.2%) | 531 (12.8%) |
| 35 to 44 Years | 3,108 (91.0%) | 308 (9.0%) |
| 45 to 54 Years | 2,449 (87.0%) | 365 (13.0%) |
| 55 to 64 Years | 3,555 (95.4%) | 171 (4.6%) |
| 65 to 74 Years | 2,947 (99.8%) | 5 (0.2%) |
| 75 Years and older | 1,770 (100.0%) | 0 (0.0%) |
| Total | 29,593 (92.8%) | 2,295 (7.2%) |
Health Insurance Coverage by Citizenship Status in Chester
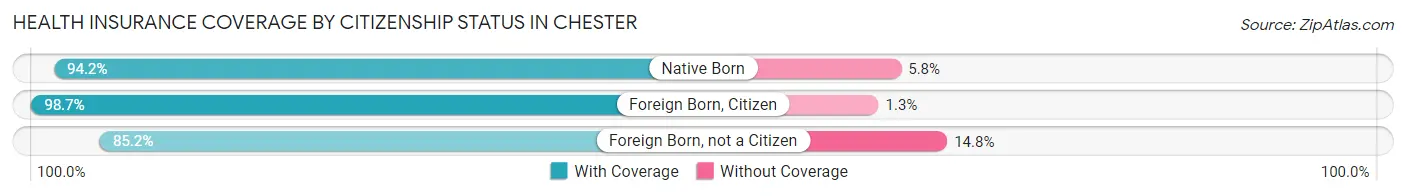
| Citizenship Status | With Coverage | Without Coverage |
| Native Born | 2,650 (94.2%) | 163 (5.8%) |
| Foreign Born, Citizen | 5,618 (98.7%) | 76 (1.3%) |
| Foreign Born, not a Citizen | 3,882 (85.2%) | 676 (14.8%) |
Health Insurance Coverage by Household Income in Chester
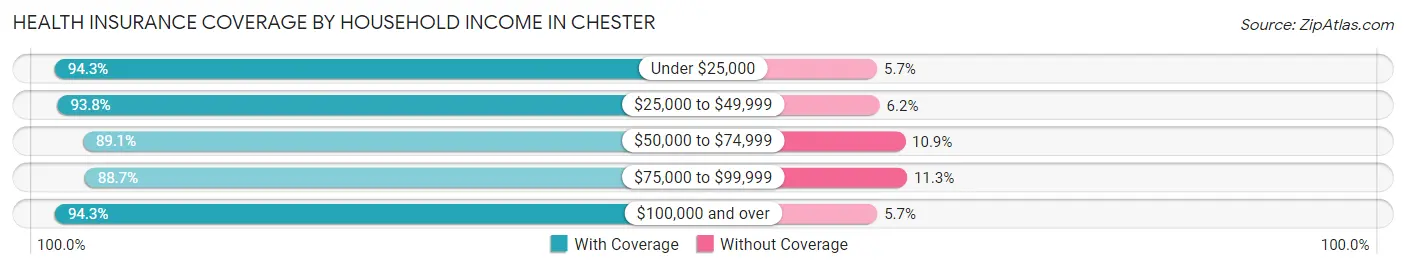
| Household Income | With Coverage | Without Coverage |
| Under $25,000 | 7,320 (94.3%) | 441 (5.7%) |
| $25,000 to $49,999 | 6,988 (93.8%) | 459 (6.2%) |
| $50,000 to $74,999 | 4,325 (89.1%) | 530 (10.9%) |
| $75,000 to $99,999 | 3,635 (88.7%) | 462 (11.3%) |
| $100,000 and over | 5,389 (94.3%) | 326 (5.7%) |
Public vs Private Health Insurance Coverage by Age in Chester
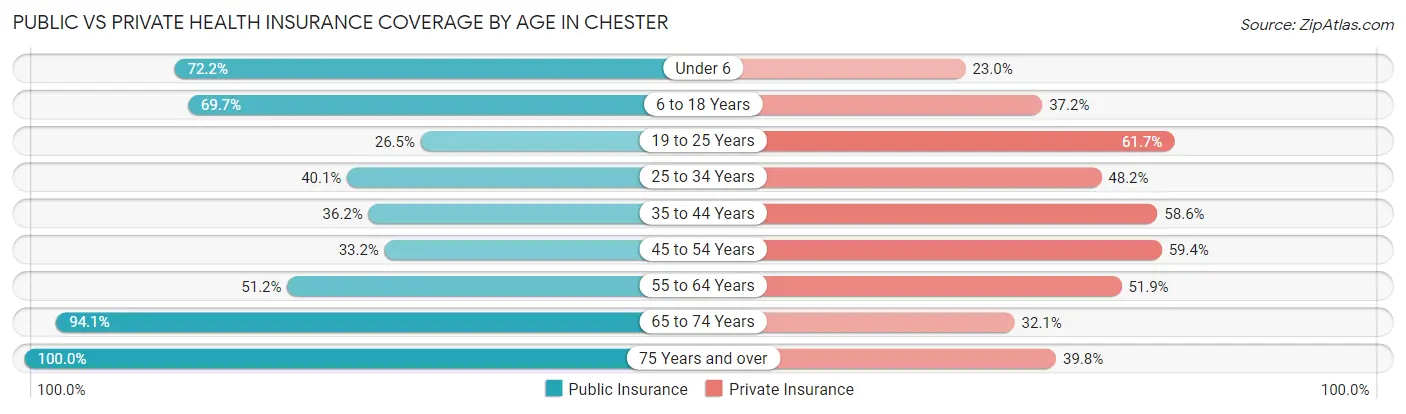
| Age Bracket | Public Insurance | Private Insurance |
| Under 6 | 2,030 (72.2%) | 646 (23.0%) |
| 6 to 18 Years | 3,968 (69.7%) | 2,118 (37.2%) |
| 19 to 25 Years | 1,206 (26.5%) | 2,810 (61.7%) |
| 25 to 34 Years | 1,663 (40.1%) | 1,997 (48.2%) |
| 35 to 44 Years | 1,235 (36.1%) | 2,001 (58.6%) |
| 45 to 54 Years | 933 (33.2%) | 1,671 (59.4%) |
| 55 to 64 Years | 1,909 (51.2%) | 1,934 (51.9%) |
| 65 to 74 Years | 2,778 (94.1%) | 947 (32.1%) |
| 75 Years and over | 1,770 (100.0%) | 704 (39.8%) |
| Total | 17,492 (54.8%) | 14,828 (46.5%) |
Disability Status by Sex by Age in Chester
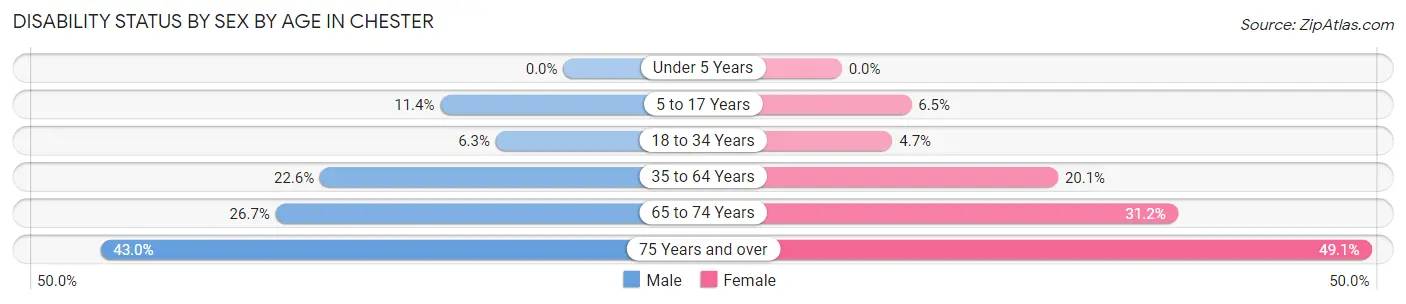
| Age Bracket | Male | Female |
| Under 5 Years | 0 (0.0%) | 0 (0.0%) |
| 5 to 17 Years | 318 (11.4%) | 168 (6.5%) |
| 18 to 34 Years | 280 (6.3%) | 236 (4.7%) |
| 35 to 64 Years | 1,022 (22.6%) | 1,089 (20.1%) |
| 65 to 74 Years | 310 (26.7%) | 558 (31.2%) |
| 75 Years and over | 263 (43.0%) | 569 (49.1%) |
Disability Class by Sex by Age in Chester
Disability Class: Hearing Difficulty
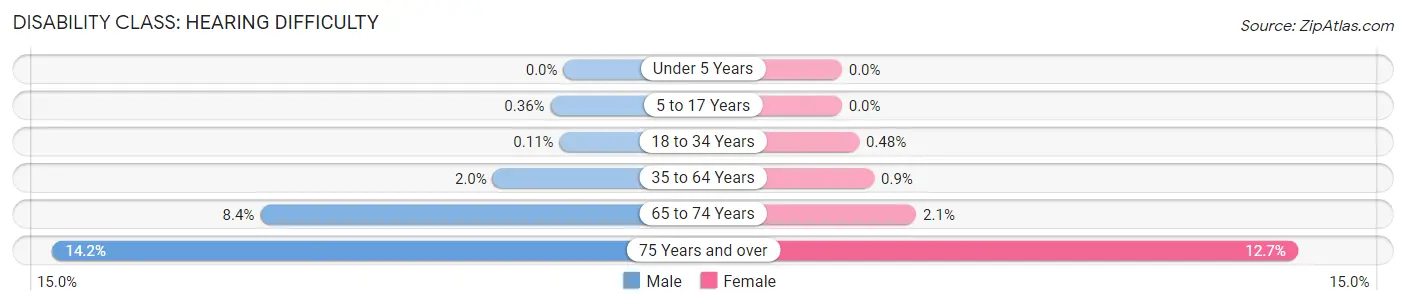
| Age Bracket | Male | Female |
| Under 5 Years | 0 (0.0%) | 0 (0.0%) |
| 5 to 17 Years | 10 (0.4%) | 0 (0.0%) |
| 18 to 34 Years | 5 (0.1%) | 24 (0.5%) |
| 35 to 64 Years | 89 (2.0%) | 49 (0.9%) |
| 65 to 74 Years | 98 (8.4%) | 37 (2.1%) |
| 75 Years and over | 87 (14.2%) | 147 (12.7%) |
Disability Class: Vision Difficulty
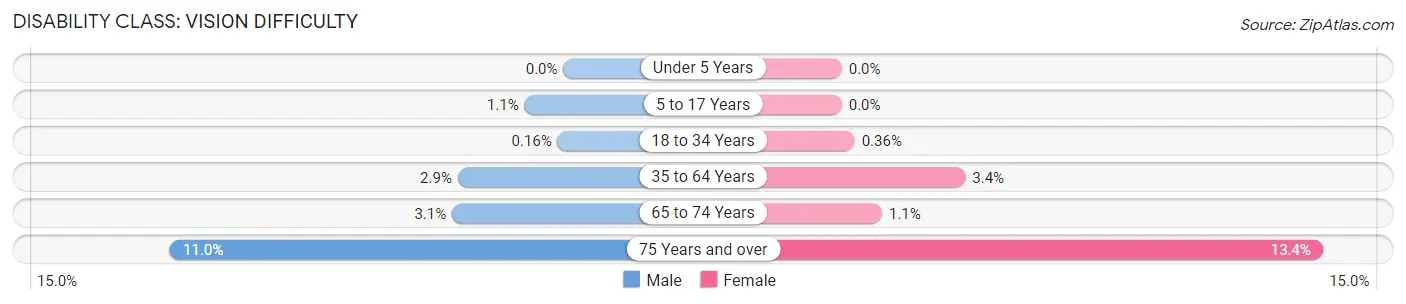
| Age Bracket | Male | Female |
| Under 5 Years | 0 (0.0%) | 0 (0.0%) |
| 5 to 17 Years | 30 (1.1%) | 0 (0.0%) |
| 18 to 34 Years | 7 (0.2%) | 18 (0.4%) |
| 35 to 64 Years | 133 (2.9%) | 187 (3.4%) |
| 65 to 74 Years | 36 (3.1%) | 20 (1.1%) |
| 75 Years and over | 67 (11.0%) | 155 (13.4%) |
Disability Class: Cognitive Difficulty
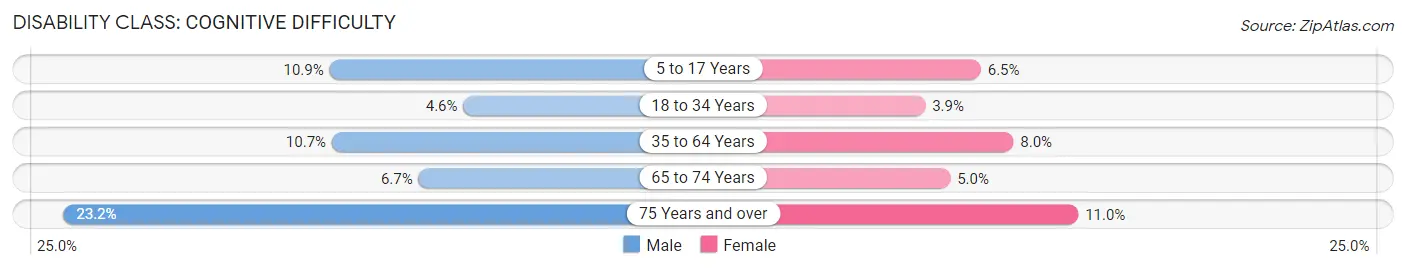
| Age Bracket | Male | Female |
| 5 to 17 Years | 302 (10.8%) | 168 (6.5%) |
| 18 to 34 Years | 207 (4.6%) | 195 (3.9%) |
| 35 to 64 Years | 486 (10.7%) | 432 (8.0%) |
| 65 to 74 Years | 78 (6.7%) | 90 (5.0%) |
| 75 Years and over | 142 (23.2%) | 127 (11.0%) |
Disability Class: Ambulatory Difficulty
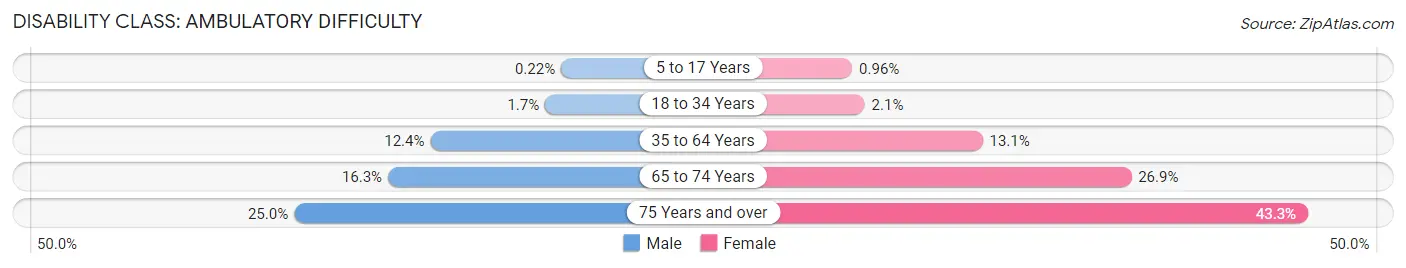
| Age Bracket | Male | Female |
| 5 to 17 Years | 6 (0.2%) | 25 (1.0%) |
| 18 to 34 Years | 76 (1.7%) | 107 (2.1%) |
| 35 to 64 Years | 559 (12.3%) | 709 (13.1%) |
| 65 to 74 Years | 189 (16.3%) | 481 (26.9%) |
| 75 Years and over | 153 (25.0%) | 501 (43.3%) |
Disability Class: Self-Care Difficulty
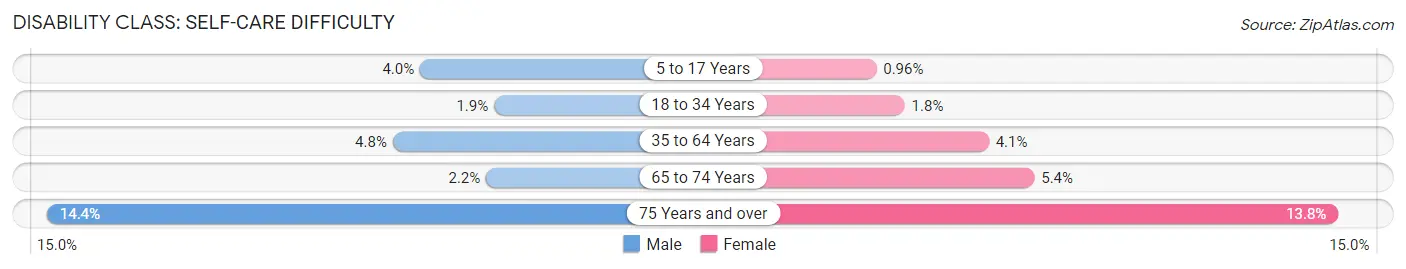
| Age Bracket | Male | Female |
| 5 to 17 Years | 111 (4.0%) | 25 (1.0%) |
| 18 to 34 Years | 86 (1.9%) | 88 (1.8%) |
| 35 to 64 Years | 215 (4.8%) | 222 (4.1%) |
| 65 to 74 Years | 25 (2.1%) | 96 (5.4%) |
| 75 Years and over | 88 (14.4%) | 160 (13.8%) |
Technology Access in Chester
Computing Device Access in Chester
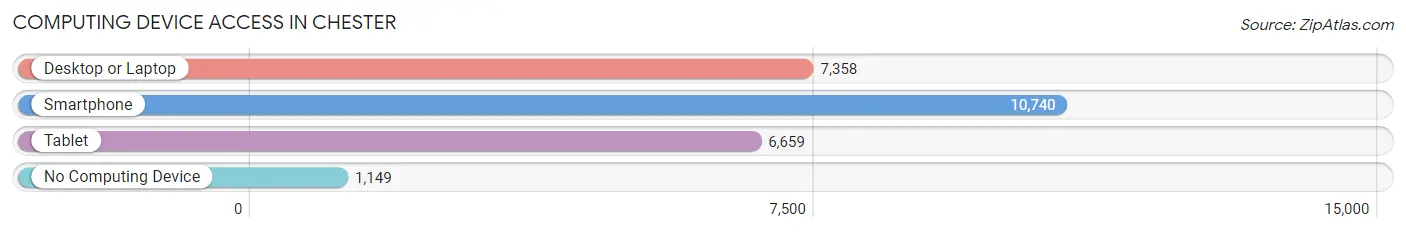
| Device Type | # Households | % Households |
| Desktop or Laptop | 7,358 | 59.0% |
| Smartphone | 10,740 | 86.1% |
| Tablet | 6,659 | 53.4% |
| No Computing Device | 1,149 | 9.2% |
| Total | 12,471 | 100.0% |
Internet Access in Chester
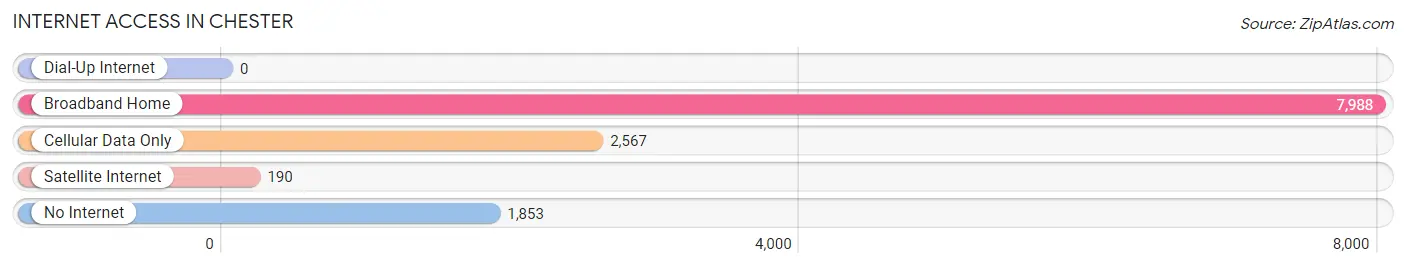
| Internet Type | # Households | % Households |
| Dial-Up Internet | 0 | 0.0% |
| Broadband Home | 7,988 | 64.0% |
| Cellular Data Only | 2,567 | 20.6% |
| Satellite Internet | 190 | 1.5% |
| No Internet | 1,853 | 14.9% |
| Total | 12,471 | 100.0% |
Chester Summary
Chester, Pennsylvania is a city located in Delaware County, Pennsylvania, United States. It is situated along the Delaware River, just south of Philadelphia. The city has a population of 33,972 as of the 2010 census, making it the largest city in Delaware County.
History
Chester was founded in 1644 by Swedish settlers, making it one of the oldest cities in the United States. The city was originally named Upland, but was renamed Chester in 1682. During the American Revolution, Chester was the site of a major battle between the British and the Continental Army. The city was also the site of the first iron works in the United States, established in 1720.
In the 19th century, Chester became an important industrial center, with the construction of the Pennsylvania Railroad and the Sun Shipbuilding Company. The city was also home to a number of prominent African-American leaders, including W.E.B. Du Bois and Thaddeus Stevens.
Geography
Chester is located in southeastern Pennsylvania, along the Delaware River. It is bordered by the cities of Philadelphia to the north, Marcus Hook to the east, and Trainer to the south. The city covers an area of 4.2 square miles, with a population density of 8,092 people per square mile.
Economy
Chester’s economy is largely based on manufacturing and services. The city is home to a number of large industrial companies, including Sun Shipbuilding, the former Pennsylvania Railroad, and the former Ford Motor Company. The city also has a number of smaller businesses, including restaurants, retail stores, and professional services.
Demographics
As of the 2010 census, Chester had a population of 33,972. The racial makeup of the city was 57.3% African American, 37.2% White, 1.2% Asian, 0.3% Native American, and 4.0% from other races. The median household income was $27,945, and the median family income was $35,945.
Chester is home to a number of educational institutions, including Widener University, Cheyney University, and the Chester Upland School District. The city also has a number of cultural attractions, including the Chester Historical Society, the Chester Art Center, and the Chester Playhouse.
Chester is a diverse city with a rich history and a vibrant economy. It is home to a number of large industrial companies, as well as a number of smaller businesses. The city is also home to a number of educational institutions and cultural attractions.
Common Questions
What is Per Capita Income in Chester?
Per Capita income in Chester is $21,949.
What is the Median Family Income in Chester?
Median Family Income in Chester is $53,048.
What is the Median Household income in Chester?
Median Household Income in Chester is $39,193.
What is Income or Wage Gap in Chester?
Income or Wage Gap in Chester is 4.4%.
Women in Chester earn 95.6 cents for every dollar earned by a man.
What is Family Income Deficit in Chester?
Family Income Deficit in Chester is $9,731.
Families that are below poverty line in Chester earn $9,731 less on average than the poverty threshold level.
What is Inequality or Gini Index in Chester?
Inequality or Gini Index in Chester is 0.46.
What is the Total Population of Chester?
Total Population of Chester is 33,048.
What is the Total Male Population of Chester?
Total Male Population of Chester is 15,980.
What is the Total Female Population of Chester?
Total Female Population of Chester is 17,068.
What is the Ratio of Males per 100 Females in Chester?
There are 93.63 Males per 100 Females in Chester.
What is the Ratio of Females per 100 Males in Chester?
There are 106.81 Females per 100 Males in Chester.
What is the Median Population Age in Chester?
Median Population Age in Chester is 32.7 Years.
What is the Average Family Size in Chester
Average Family Size in Chester is 3.3 People.
What is the Average Household Size in Chester
Average Household Size in Chester is 2.4 People.
How Large is the Labor Force in Chester?
There are 15,425 People in the Labor Forcein in Chester.
What is the Percentage of People in the Labor Force in Chester?
59.2% of People are in the Labor Force in Chester.
What is the Unemployment Rate in Chester?
Unemployment Rate in Chester is 15.9%.