Fleetwood borough, PA Map & Demographics
Fleetwood borough Overview
$42,163
PER CAPITA INCOME
$92,656
AVG FAMILY INCOME
$82,444
AVG HOUSEHOLD INCOME
16.2%
WAGE / INCOME GAP [ % ]
83.8¢/ $1
WAGE / INCOME GAP [ $ ]
0.40
INEQUALITY / GINI INDEX
4,046
TOTAL POPULATION
2,113
MALE POPULATION
1,933
FEMALE POPULATION
109.31
MALES / 100 FEMALES
91.48
FEMALES / 100 MALES
38.9
MEDIAN AGE
2.8
AVG FAMILY SIZE
2.3
AVG HOUSEHOLD SIZE
2,408
LABOR FORCE [ PEOPLE ]
70.6%
PERCENT IN LABOR FORCE
2.7%
UNEMPLOYMENT RATE
Income in Fleetwood borough
Income Overview in Fleetwood borough
Per Capita Income in Fleetwood borough is $42,163, while median incomes of families and households are $92,656 and $82,444 respectively.
| Characteristic | Number | Measure |
| Per Capita Income | 4,046 | $42,163 |
| Median Family Income | 1,017 | $92,656 |
| Mean Family Income | 1,017 | $115,485 |
| Median Household Income | 1,716 | $82,444 |
| Mean Household Income | 1,716 | $97,914 |
| Income Deficit | 1,017 | $0 |
| Wage / Income Gap (%) | 4,046 | 16.20% |
| Wage / Income Gap ($) | 4,046 | 83.80¢ per $1 |
| Gini / Inequality Index | 4,046 | 0.40 |
Earnings by Sex in Fleetwood borough
Average Earnings in Fleetwood borough are $51,400, $53,738 for men and $45,030 for women, a difference of 16.2%.
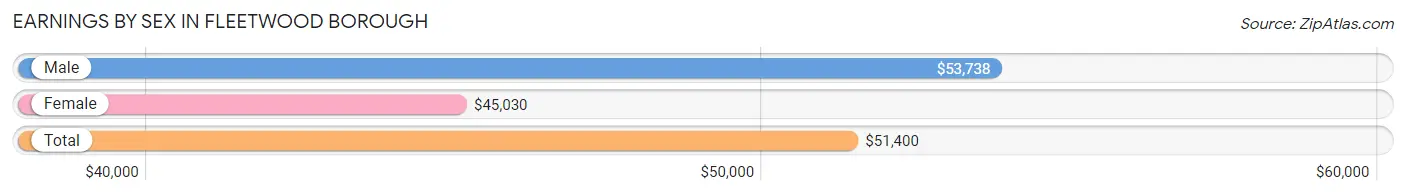
| Sex | Number | Average Earnings |
| Male | 1,269 (52.3%) | $53,738 |
| Female | 1,157 (47.7%) | $45,030 |
| Total | 2,426 (100.0%) | $51,400 |
Earnings by Sex by Income Bracket in Fleetwood borough
The most common earnings brackets in Fleetwood borough are $50,000 to $54,999 for men (200 | 15.8%) and $65,000 to $74,999 for women (133 | 11.5%).
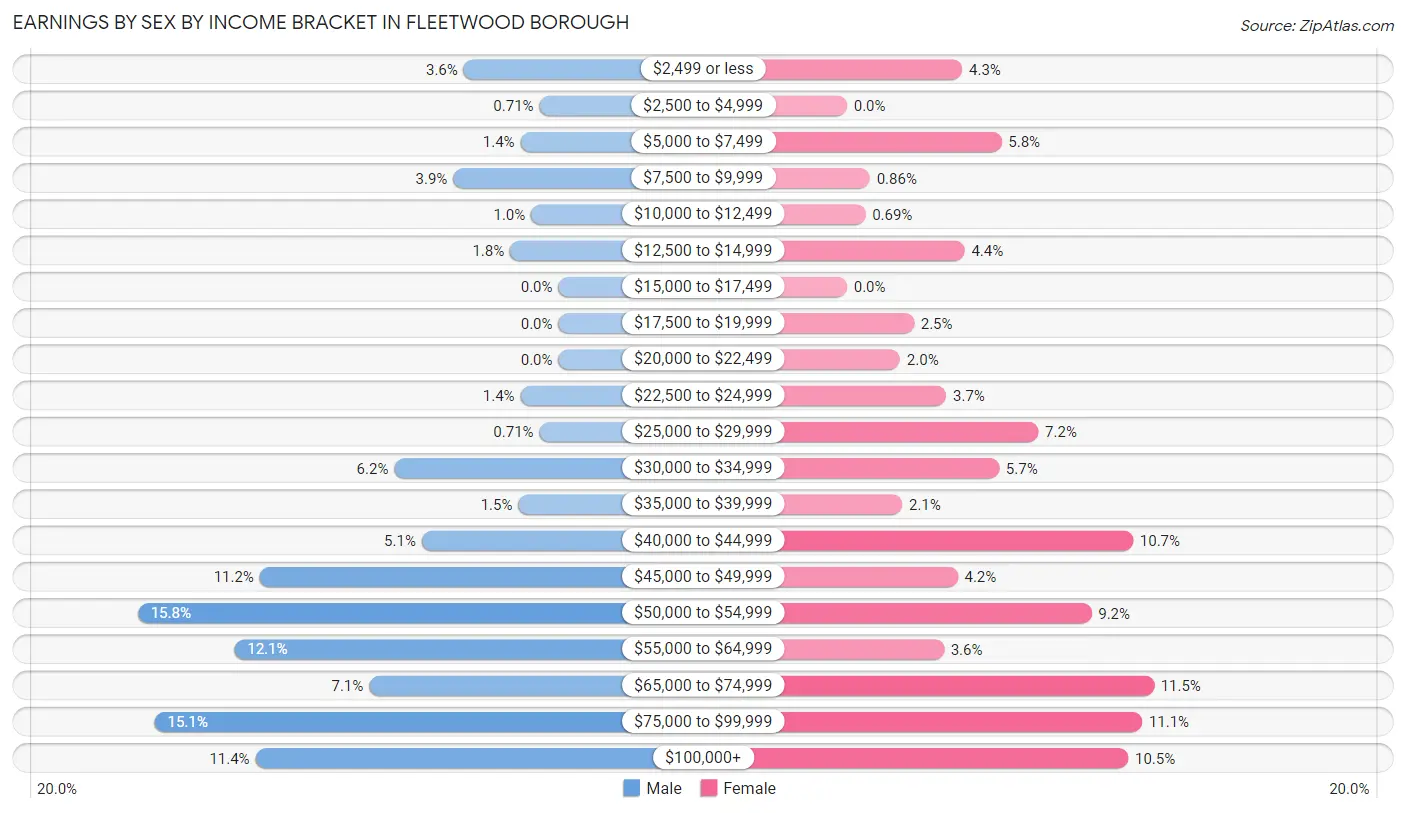
| Income | Male | Female |
| $2,499 or less | 45 (3.5%) | 50 (4.3%) |
| $2,500 to $4,999 | 9 (0.7%) | 0 (0.0%) |
| $5,000 to $7,499 | 18 (1.4%) | 67 (5.8%) |
| $7,500 to $9,999 | 50 (3.9%) | 10 (0.9%) |
| $10,000 to $12,499 | 13 (1.0%) | 8 (0.7%) |
| $12,500 to $14,999 | 23 (1.8%) | 51 (4.4%) |
| $15,000 to $17,499 | 0 (0.0%) | 0 (0.0%) |
| $17,500 to $19,999 | 0 (0.0%) | 29 (2.5%) |
| $20,000 to $22,499 | 0 (0.0%) | 23 (2.0%) |
| $22,500 to $24,999 | 18 (1.4%) | 43 (3.7%) |
| $25,000 to $29,999 | 9 (0.7%) | 83 (7.2%) |
| $30,000 to $34,999 | 78 (6.1%) | 66 (5.7%) |
| $35,000 to $39,999 | 19 (1.5%) | 24 (2.1%) |
| $40,000 to $44,999 | 65 (5.1%) | 124 (10.7%) |
| $45,000 to $49,999 | 142 (11.2%) | 48 (4.2%) |
| $50,000 to $54,999 | 200 (15.8%) | 106 (9.2%) |
| $55,000 to $64,999 | 154 (12.1%) | 42 (3.6%) |
| $65,000 to $74,999 | 90 (7.1%) | 133 (11.5%) |
| $75,000 to $99,999 | 192 (15.1%) | 128 (11.1%) |
| $100,000+ | 144 (11.4%) | 122 (10.5%) |
| Total | 1,269 (100.0%) | 1,157 (100.0%) |
Earnings by Sex by Educational Attainment in Fleetwood borough
Average earnings in Fleetwood borough are $54,907 for men and $50,467 for women, a difference of 8.1%. Men with an educational attainment of graduate degree enjoy the highest average annual earnings of $75,694, while those with college or associate's degree education earn the least with $53,281. Women with an educational attainment of graduate degree earn the most with the average annual earnings of $107,675, while those with high school diploma education have the smallest earnings of $42,457.
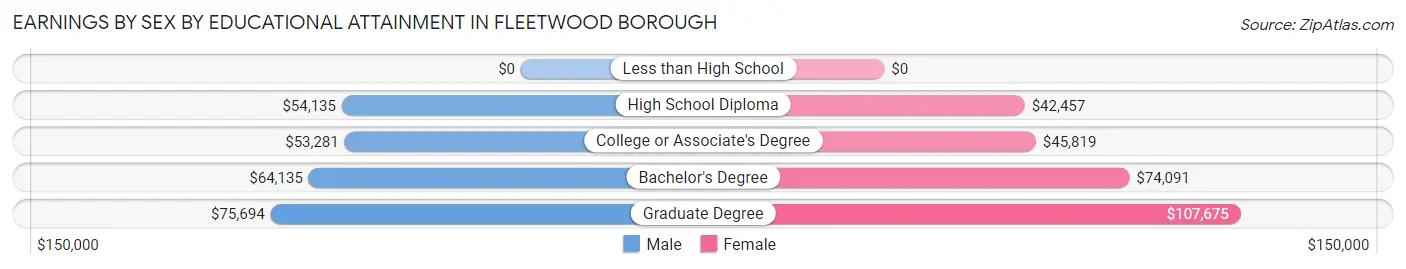
| Educational Attainment | Male Income | Female Income |
| Less than High School | - | - |
| High School Diploma | $54,135 | $42,457 |
| College or Associate's Degree | $53,281 | $45,819 |
| Bachelor's Degree | $64,135 | $74,091 |
| Graduate Degree | $75,694 | $107,675 |
| Total | $54,907 | $50,467 |
Family Income in Fleetwood borough
Family Income Brackets in Fleetwood borough
According to the Fleetwood borough family income data, there are 283 families falling into the $100,000 to $149,999 income range, which is the most common income bracket and makes up 27.8% of all families.
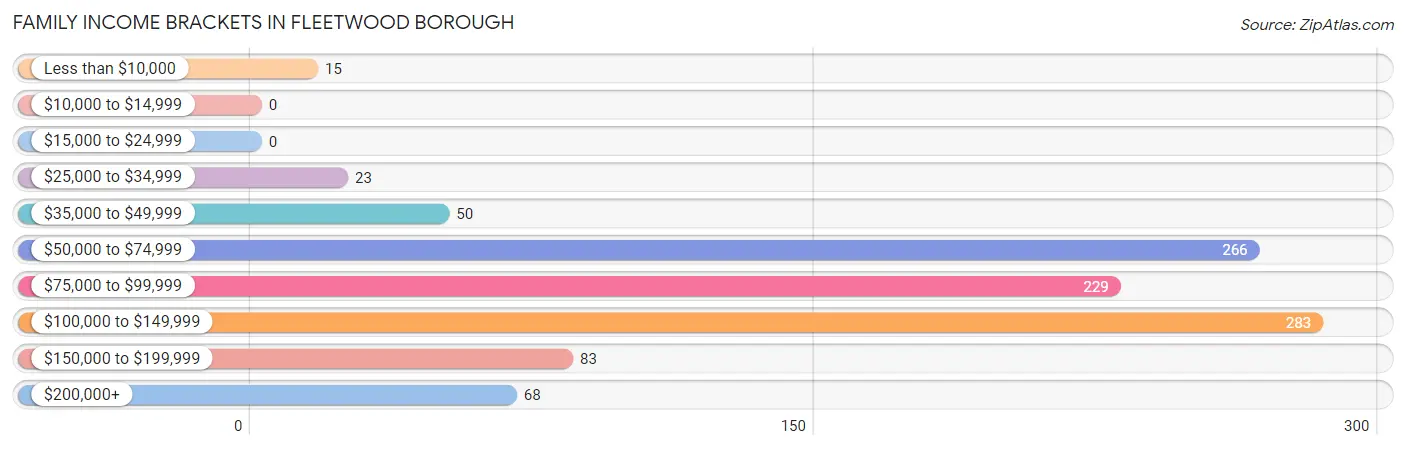
| Income Bracket | # Families | % Families |
| Less than $10,000 | 15 | 1.5% |
| $10,000 to $14,999 | 0 | 0.0% |
| $15,000 to $24,999 | 0 | 0.0% |
| $25,000 to $34,999 | 23 | 2.3% |
| $35,000 to $49,999 | 50 | 4.9% |
| $50,000 to $74,999 | 266 | 26.2% |
| $75,000 to $99,999 | 229 | 22.5% |
| $100,000 to $149,999 | 283 | 27.8% |
| $150,000 to $199,999 | 83 | 8.2% |
| $200,000+ | 68 | 6.7% |
Family Income by Famaliy Size in Fleetwood borough
5-person families (92 | 9.0%) account for the highest median family income in Fleetwood borough with $146,284 per family, while 2-person families (583 | 57.3%) have the highest median income of $42,477 per family member.
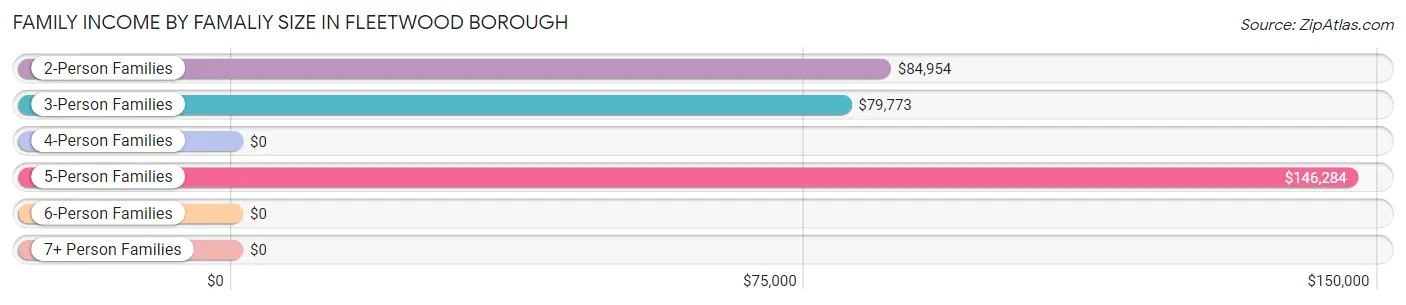
| Income Bracket | # Families | Median Income |
| 2-Person Families | 583 (57.3%) | $84,954 |
| 3-Person Families | 252 (24.8%) | $79,773 |
| 4-Person Families | 77 (7.6%) | $0 |
| 5-Person Families | 92 (9.0%) | $146,284 |
| 6-Person Families | 0 (0.0%) | $0 |
| 7+ Person Families | 13 (1.3%) | $0 |
| Total | 1,017 (100.0%) | $92,656 |
Family Income by Number of Earners in Fleetwood borough
The median family income in Fleetwood borough is $92,656, with families comprising 3+ earners (133) having the highest median family income of $146,926, while families with no earners (126) have the lowest median family income of $56,250, accounting for 13.1% and 12.4% of families, respectively.
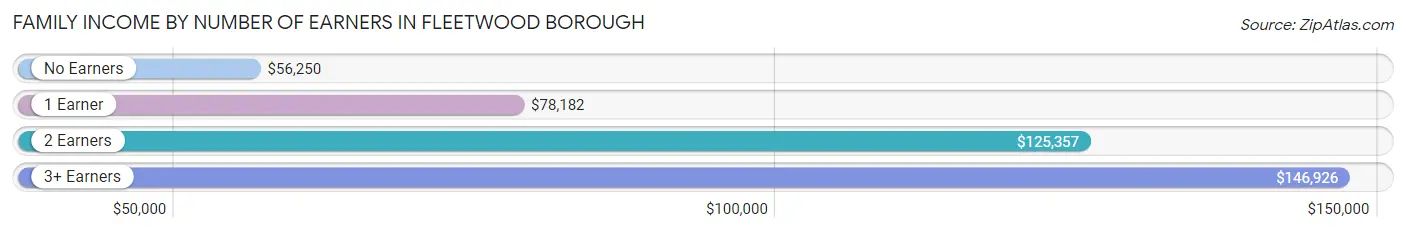
| Number of Earners | # Families | Median Income |
| No Earners | 126 (12.4%) | $56,250 |
| 1 Earner | 374 (36.8%) | $78,182 |
| 2 Earners | 384 (37.8%) | $125,357 |
| 3+ Earners | 133 (13.1%) | $146,926 |
| Total | 1,017 (100.0%) | $92,656 |
Household Income in Fleetwood borough
Household Income Brackets in Fleetwood borough
With 441 households falling in the category, the $100,000 to $149,999 income range is the most frequent in Fleetwood borough, accounting for 25.7% of all households. In contrast, only 57 households (3.3%) fall into the less than $10,000 income bracket, making it the least populous group.
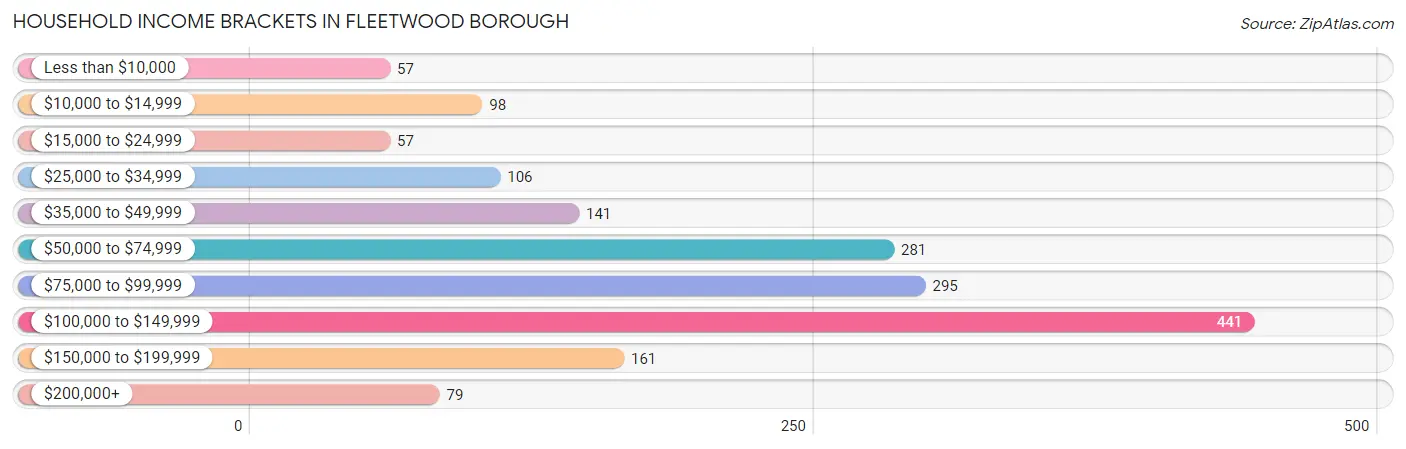
| Income Bracket | # Households | % Households |
| Less than $10,000 | 57 | 3.3% |
| $10,000 to $14,999 | 98 | 5.7% |
| $15,000 to $24,999 | 57 | 3.3% |
| $25,000 to $34,999 | 106 | 6.2% |
| $35,000 to $49,999 | 141 | 8.2% |
| $50,000 to $74,999 | 281 | 16.4% |
| $75,000 to $99,999 | 295 | 17.2% |
| $100,000 to $149,999 | 441 | 25.7% |
| $150,000 to $199,999 | 161 | 9.4% |
| $200,000+ | 79 | 4.6% |
Household Income by Householder Age in Fleetwood borough
The median household income in Fleetwood borough is $82,444, with the highest median household income of $125,685 found in the 25 to 44 years age bracket for the primary householder. A total of 586 households (34.2%) fall into this category. Meanwhile, the 15 to 24 years age bracket for the primary householder has the lowest median household income of $0, with 22 households (1.3%) in this group.
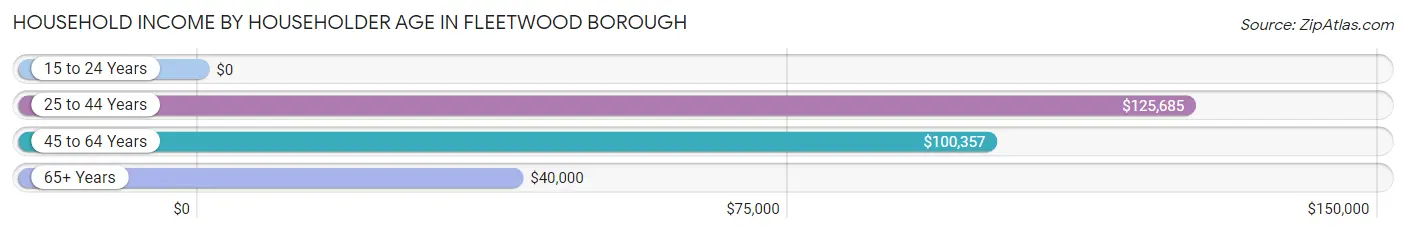
| Income Bracket | # Households | Median Income |
| 15 to 24 Years | 22 (1.3%) | $0 |
| 25 to 44 Years | 586 (34.2%) | $125,685 |
| 45 to 64 Years | 588 (34.3%) | $100,357 |
| 65+ Years | 520 (30.3%) | $40,000 |
| Total | 1,716 (100.0%) | $82,444 |
Poverty in Fleetwood borough
Income Below Poverty by Sex and Age in Fleetwood borough
With 4.4% poverty level for males and 7.0% for females among the residents of Fleetwood borough, under 5 year old males and 75 year old and over females are the most vulnerable to poverty, with 11 males (50.0%) and 83 females (33.7%) in their respective age groups living below the poverty level.
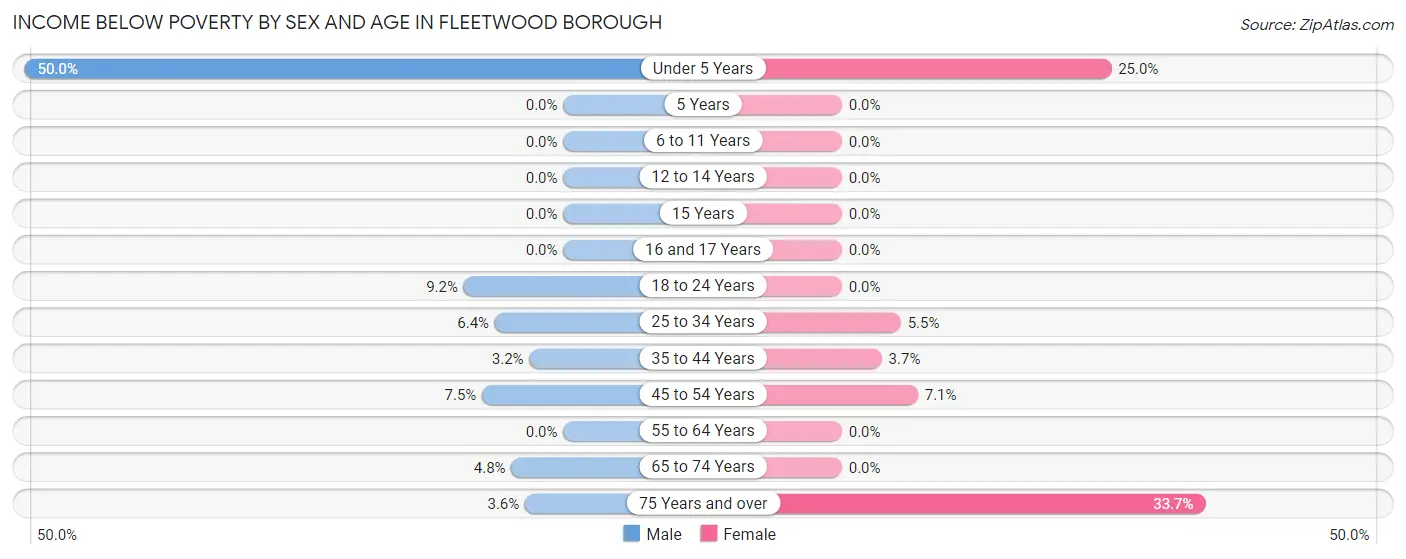
| Age Bracket | Male | Female |
| Under 5 Years | 11 (50.0%) | 7 (25.0%) |
| 5 Years | 0 (0.0%) | 0 (0.0%) |
| 6 to 11 Years | 0 (0.0%) | 0 (0.0%) |
| 12 to 14 Years | 0 (0.0%) | 0 (0.0%) |
| 15 Years | 0 (0.0%) | 0 (0.0%) |
| 16 and 17 Years | 0 (0.0%) | 0 (0.0%) |
| 18 to 24 Years | 11 (9.2%) | 0 (0.0%) |
| 25 to 34 Years | 28 (6.4%) | 15 (5.5%) |
| 35 to 44 Years | 8 (3.2%) | 13 (3.7%) |
| 45 to 54 Years | 18 (7.5%) | 17 (7.0%) |
| 55 to 64 Years | 0 (0.0%) | 0 (0.0%) |
| 65 to 74 Years | 8 (4.8%) | 0 (0.0%) |
| 75 Years and over | 5 (3.5%) | 83 (33.7%) |
| Total | 89 (4.4%) | 135 (7.0%) |
Income Above Poverty by Sex and Age in Fleetwood borough
According to the poverty statistics in Fleetwood borough, males aged 5 years and females aged 5 years are the age groups that are most secure financially, with 100.0% of males and 100.0% of females in these age groups living above the poverty line.
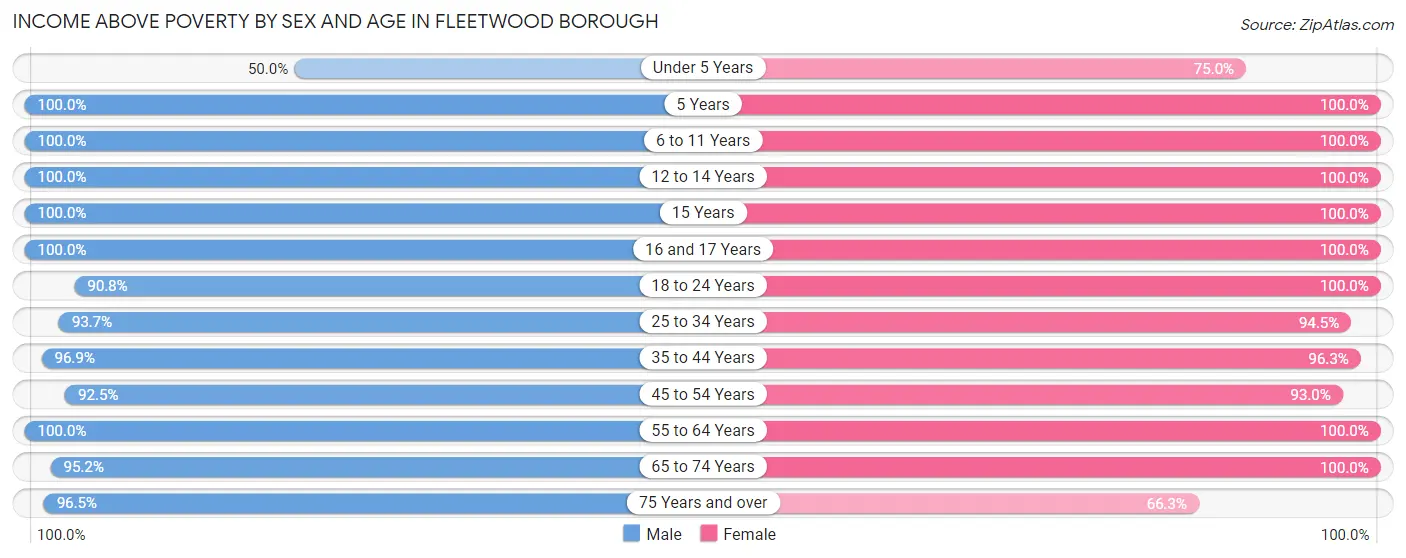
| Age Bracket | Male | Female |
| Under 5 Years | 11 (50.0%) | 21 (75.0%) |
| 5 Years | 15 (100.0%) | 29 (100.0%) |
| 6 to 11 Years | 172 (100.0%) | 25 (100.0%) |
| 12 to 14 Years | 183 (100.0%) | 32 (100.0%) |
| 15 Years | 11 (100.0%) | 45 (100.0%) |
| 16 and 17 Years | 47 (100.0%) | 105 (100.0%) |
| 18 to 24 Years | 108 (90.8%) | 90 (100.0%) |
| 25 to 34 Years | 413 (93.6%) | 259 (94.5%) |
| 35 to 44 Years | 246 (96.9%) | 338 (96.3%) |
| 45 to 54 Years | 221 (92.5%) | 224 (92.9%) |
| 55 to 64 Years | 230 (100.0%) | 195 (100.0%) |
| 65 to 74 Years | 158 (95.2%) | 272 (100.0%) |
| 75 Years and over | 136 (96.5%) | 163 (66.3%) |
| Total | 1,951 (95.6%) | 1,798 (93.0%) |
Income Below Poverty Among Married-Couple Families in Fleetwood borough
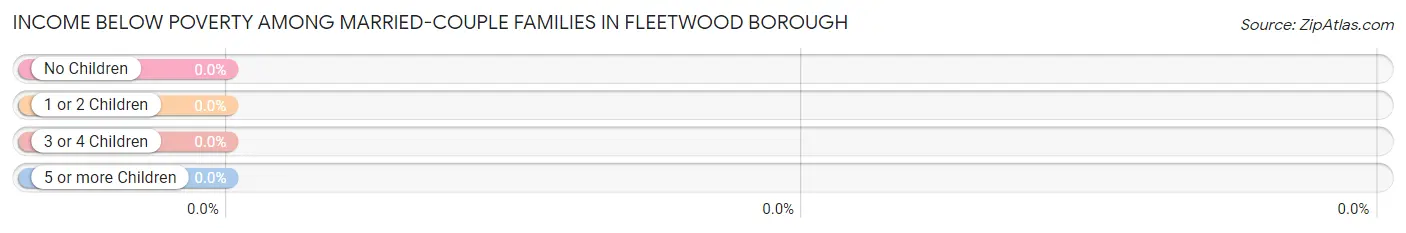
| Children | Above Poverty | Below Poverty |
| No Children | 538 (100.0%) | 0 (0.0%) |
| 1 or 2 Children | 88 (100.0%) | 0 (0.0%) |
| 3 or 4 Children | 15 (100.0%) | 0 (0.0%) |
| 5 or more Children | 13 (100.0%) | 0 (0.0%) |
| Total | 654 (100.0%) | 0 (0.0%) |
Income Below Poverty Among Single-Parent Households in Fleetwood borough
According to the poverty data in Fleetwood borough, 5.7% or 8 single-father households and 3.1% or 7 single-mother households are living below the poverty line. Among single-father households, those with 1 or 2 children have the highest poverty rate, with 8 households (10.5%) experiencing poverty. Likewise, among single-mother households, those with 1 or 2 children have the highest poverty rate, with 7 households (3.7%) falling below the poverty line.
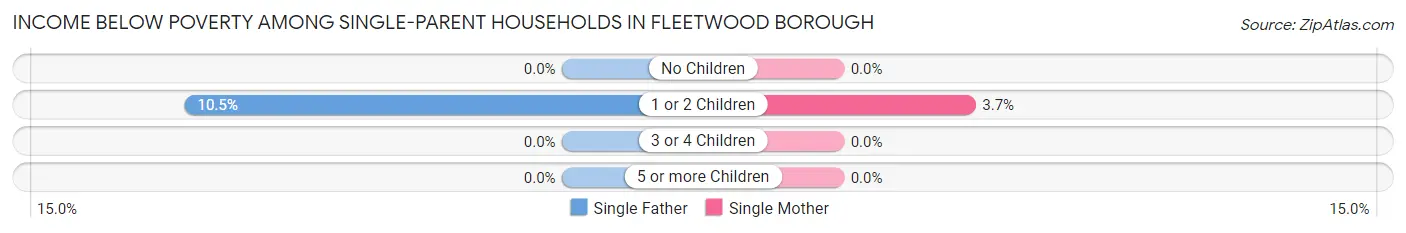
| Children | Single Father | Single Mother |
| No Children | 0 (0.0%) | 0 (0.0%) |
| 1 or 2 Children | 8 (10.5%) | 7 (3.7%) |
| 3 or 4 Children | 0 (0.0%) | 0 (0.0%) |
| 5 or more Children | 0 (0.0%) | 0 (0.0%) |
| Total | 8 (5.7%) | 7 (3.1%) |
Income Below Poverty Among Married-Couple vs Single-Parent Households in Fleetwood borough
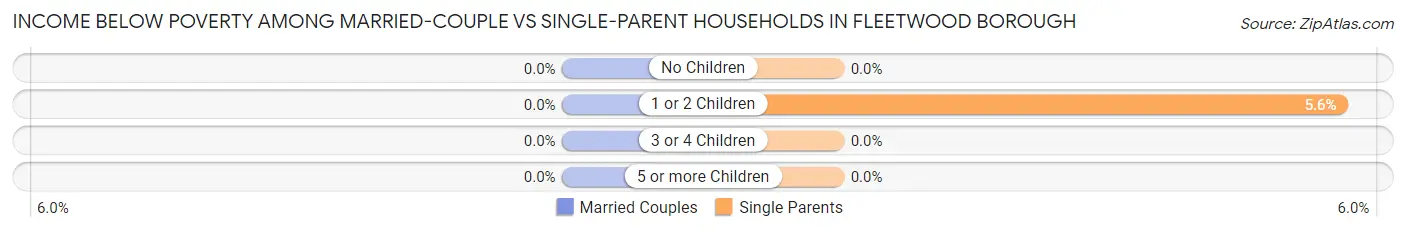
| Children | Married-Couple Families | Single-Parent Households |
| No Children | 0 (0.0%) | 0 (0.0%) |
| 1 or 2 Children | 0 (0.0%) | 15 (5.6%) |
| 3 or 4 Children | 0 (0.0%) | 0 (0.0%) |
| 5 or more Children | 0 (0.0%) | 0 (0.0%) |
| Total | 0 (0.0%) | 15 (4.1%) |
Race in Fleetwood borough
The most populous races in Fleetwood borough are White / Caucasian (3,689 | 91.2%), Hispanic or Latino (421 | 10.4%), and Two or more Races (271 | 6.7%).
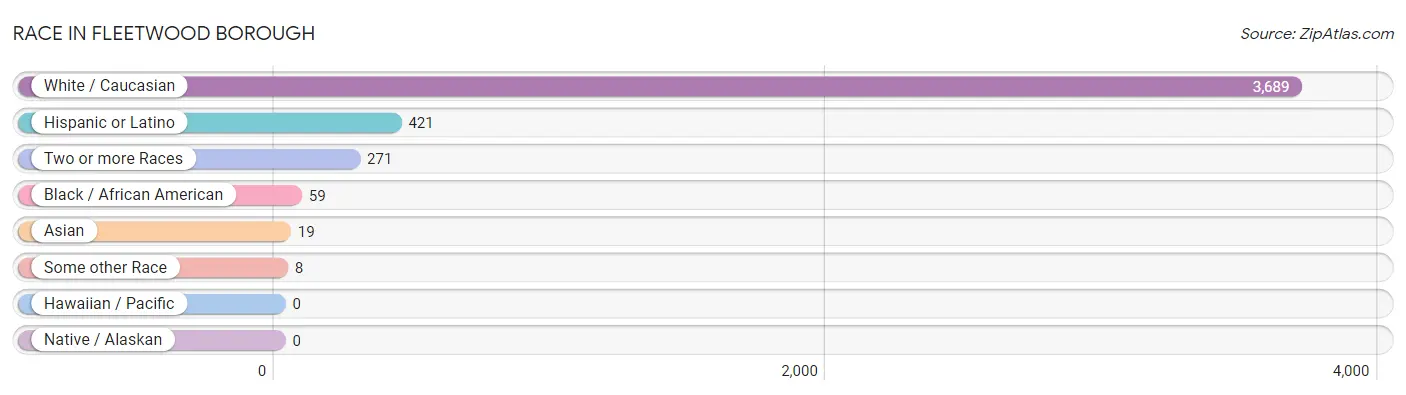
| Race | # Population | % Population |
| Asian | 19 | 0.5% |
| Black / African American | 59 | 1.5% |
| Hawaiian / Pacific | 0 | 0.0% |
| Hispanic or Latino | 421 | 10.4% |
| Native / Alaskan | 0 | 0.0% |
| White / Caucasian | 3,689 | 91.2% |
| Two or more Races | 271 | 6.7% |
| Some other Race | 8 | 0.2% |
| Total | 4,046 | 100.0% |
Ancestry in Fleetwood borough
The most populous ancestries reported in Fleetwood borough are German (1,871 | 46.2%), Italian (304 | 7.5%), Polish (292 | 7.2%), Pennsylvania German (246 | 6.1%), and Mexican (214 | 5.3%), together accounting for 72.3% of all Fleetwood borough residents.
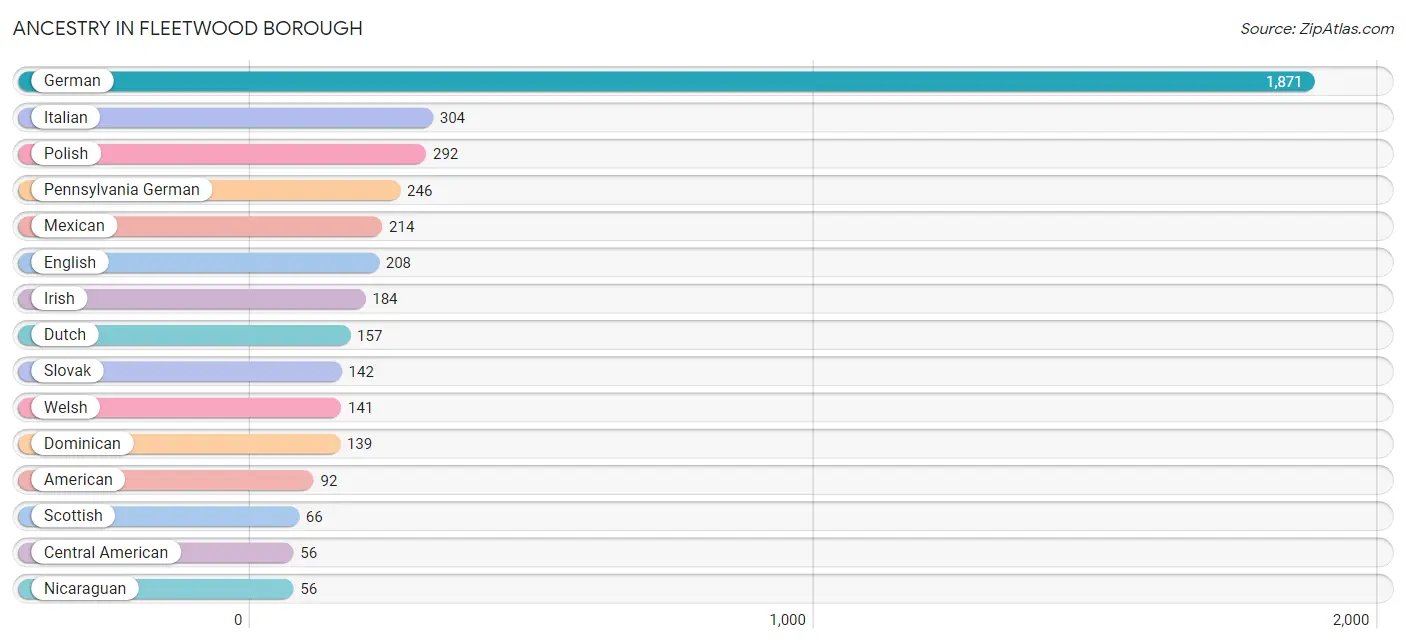
| Ancestry | # Population | % Population |
| American | 92 | 2.3% |
| Austrian | 17 | 0.4% |
| Blackfeet | 15 | 0.4% |
| British | 6 | 0.2% |
| Central American | 56 | 1.4% |
| Cherokee | 20 | 0.5% |
| Czech | 7 | 0.2% |
| Dominican | 139 | 3.4% |
| Dutch | 157 | 3.9% |
| Eastern European | 3 | 0.1% |
| English | 208 | 5.1% |
| European | 16 | 0.4% |
| French | 7 | 0.2% |
| German | 1,871 | 46.2% |
| Irish | 184 | 4.5% |
| Italian | 304 | 7.5% |
| Lithuanian | 27 | 0.7% |
| Mexican | 214 | 5.3% |
| Nicaraguan | 56 | 1.4% |
| Pennsylvania German | 246 | 6.1% |
| Polish | 292 | 7.2% |
| Russian | 13 | 0.3% |
| Scotch-Irish | 16 | 0.4% |
| Scottish | 66 | 1.6% |
| Slovak | 142 | 3.5% |
| Slovene | 18 | 0.4% |
| Spaniard | 12 | 0.3% |
| Sri Lankan | 11 | 0.3% |
| Swedish | 35 | 0.9% |
| Trinidadian and Tobagonian | 17 | 0.4% |
| Ukrainian | 9 | 0.2% |
| Vietnamese | 19 | 0.5% |
| Welsh | 141 | 3.5% | View All 33 Rows |
Immigrants in Fleetwood borough
The most numerous immigrant groups reported in Fleetwood borough came from Latin America (129 | 3.2%), Caribbean (73 | 1.8%), Central America (56 | 1.4%), Dominican Republic (56 | 1.4%), and Nicaragua (56 | 1.4%), together accounting for 9.1% of all Fleetwood borough residents.
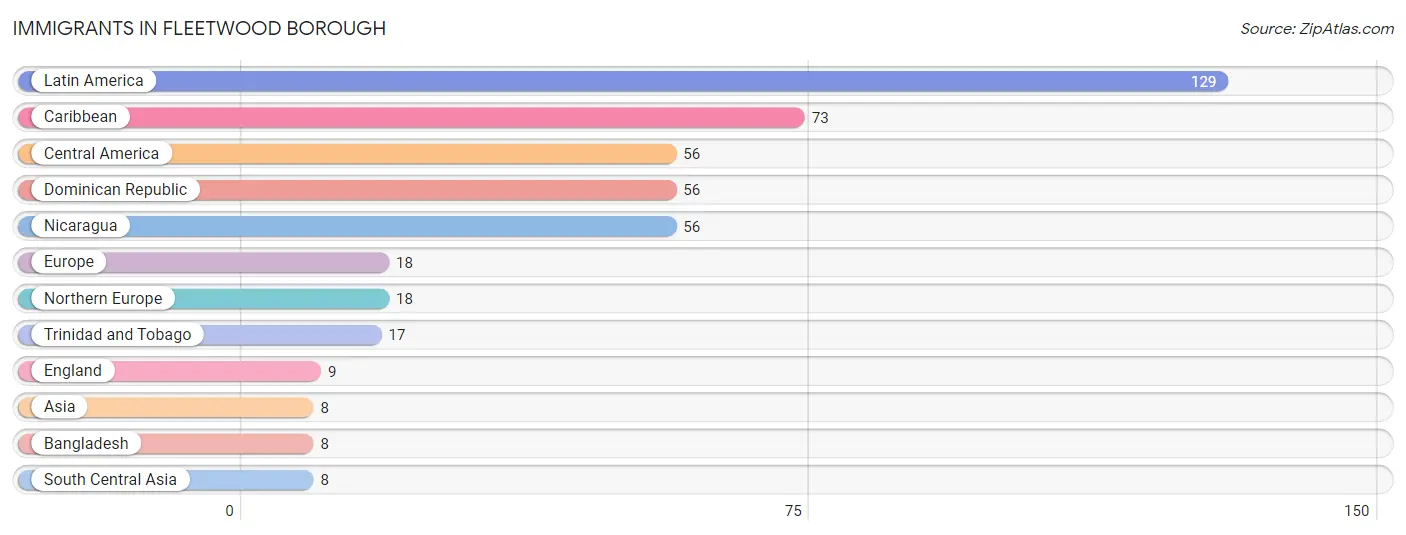
| Immigration Origin | # Population | % Population |
| Asia | 8 | 0.2% |
| Bangladesh | 8 | 0.2% |
| Caribbean | 73 | 1.8% |
| Central America | 56 | 1.4% |
| Dominican Republic | 56 | 1.4% |
| England | 9 | 0.2% |
| Europe | 18 | 0.4% |
| Latin America | 129 | 3.2% |
| Nicaragua | 56 | 1.4% |
| Northern Europe | 18 | 0.4% |
| South Central Asia | 8 | 0.2% |
| Trinidad and Tobago | 17 | 0.4% | View All 12 Rows |
Sex and Age in Fleetwood borough
Sex and Age in Fleetwood borough
The most populous age groups in Fleetwood borough are 10 to 14 Years (282 | 13.4%) for men and 35 to 39 Years (246 | 12.7%) for women.
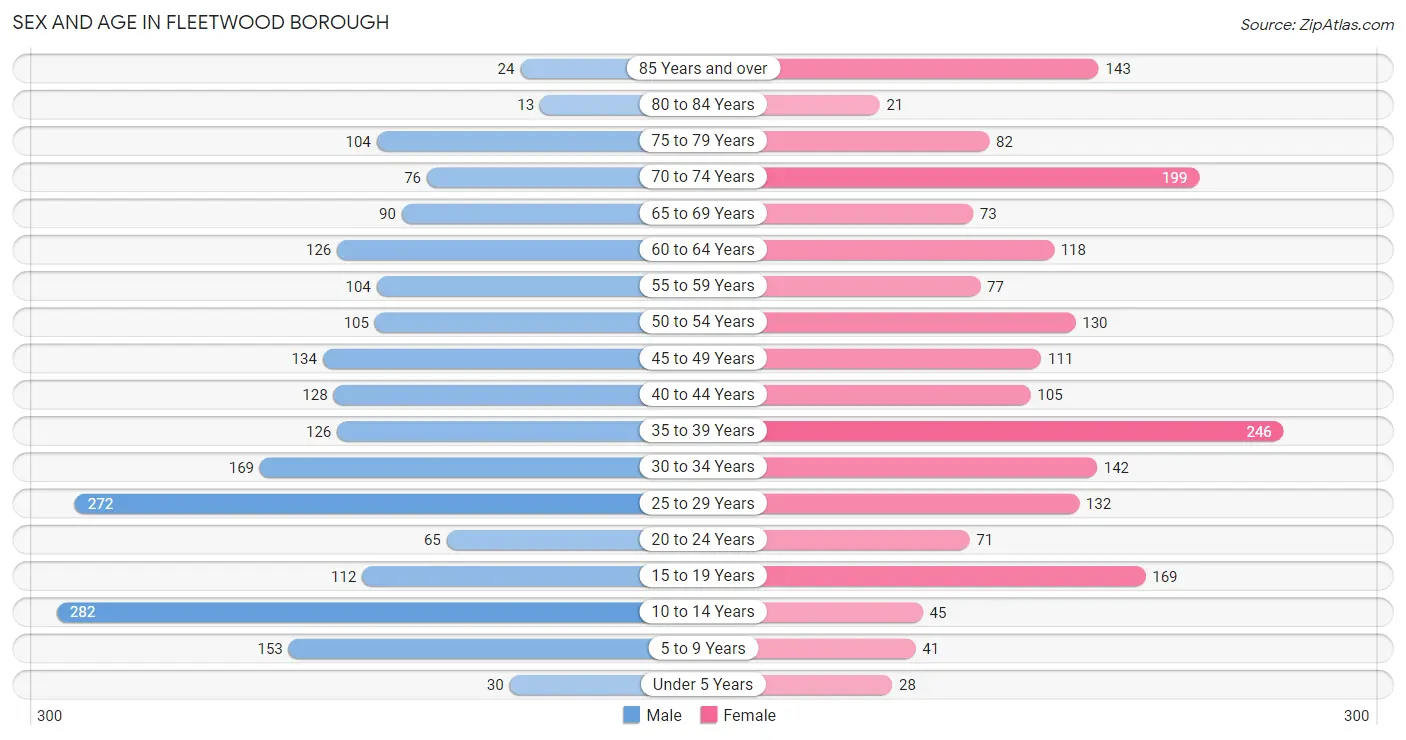
| Age Bracket | Male | Female |
| Under 5 Years | 30 (1.4%) | 28 (1.5%) |
| 5 to 9 Years | 153 (7.2%) | 41 (2.1%) |
| 10 to 14 Years | 282 (13.4%) | 45 (2.3%) |
| 15 to 19 Years | 112 (5.3%) | 169 (8.7%) |
| 20 to 24 Years | 65 (3.1%) | 71 (3.7%) |
| 25 to 29 Years | 272 (12.9%) | 132 (6.8%) |
| 30 to 34 Years | 169 (8.0%) | 142 (7.3%) |
| 35 to 39 Years | 126 (6.0%) | 246 (12.7%) |
| 40 to 44 Years | 128 (6.1%) | 105 (5.4%) |
| 45 to 49 Years | 134 (6.3%) | 111 (5.7%) |
| 50 to 54 Years | 105 (5.0%) | 130 (6.7%) |
| 55 to 59 Years | 104 (4.9%) | 77 (4.0%) |
| 60 to 64 Years | 126 (6.0%) | 118 (6.1%) |
| 65 to 69 Years | 90 (4.3%) | 73 (3.8%) |
| 70 to 74 Years | 76 (3.6%) | 199 (10.3%) |
| 75 to 79 Years | 104 (4.9%) | 82 (4.2%) |
| 80 to 84 Years | 13 (0.6%) | 21 (1.1%) |
| 85 Years and over | 24 (1.1%) | 143 (7.4%) |
| Total | 2,113 (100.0%) | 1,933 (100.0%) |
Families and Households in Fleetwood borough
Median Family Size in Fleetwood borough
The median family size in Fleetwood borough is 2.77 persons per family, with single female/mother families (223 | 21.9%) accounting for the largest median family size of 3.16 persons per family. On the other hand, single male/father families (140 | 13.8%) represent the smallest median family size with 2.52 persons per family.
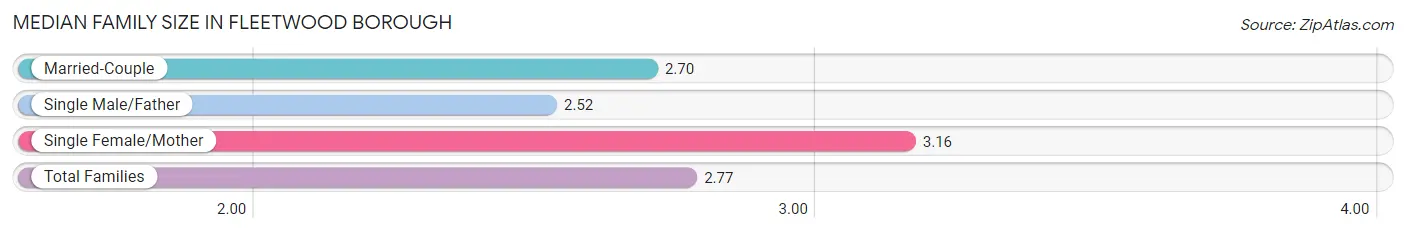
| Family Type | # Families | Family Size |
| Married-Couple | 654 (64.3%) | 2.70 |
| Single Male/Father | 140 (13.8%) | 2.52 |
| Single Female/Mother | 223 (21.9%) | 3.16 |
| Total Families | 1,017 (100.0%) | 2.77 |
Median Household Size in Fleetwood borough
The median household size in Fleetwood borough is 2.34 persons per household, with single female/mother households (223 | 13.0%) accounting for the largest median household size of 3.56 persons per household. non-family households (699 | 40.7%) represent the smallest median household size with 1.41 persons per household.
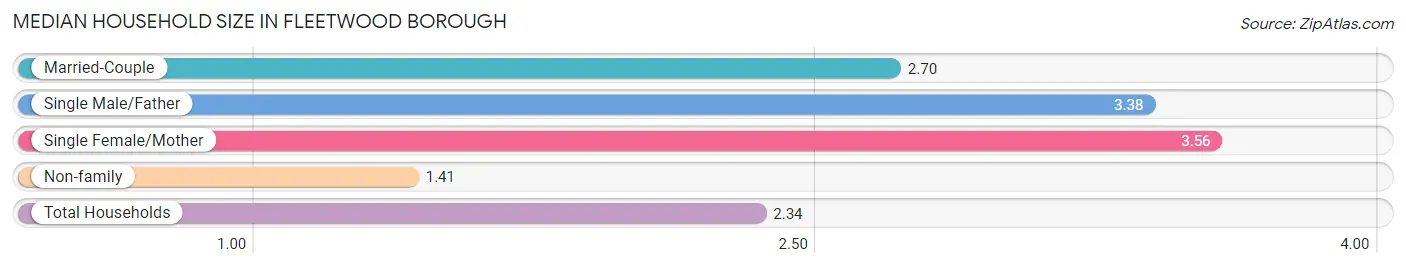
| Household Type | # Households | Household Size |
| Married-Couple | 654 (38.1%) | 2.70 |
| Single Male/Father | 140 (8.2%) | 3.38 |
| Single Female/Mother | 223 (13.0%) | 3.56 |
| Non-family | 699 (40.7%) | 1.41 |
| Total Households | 1,716 (100.0%) | 2.34 |
Household Size by Marriage Status in Fleetwood borough
Out of a total of 1,716 households in Fleetwood borough, 1,017 (59.3%) are family households, while 699 (40.7%) are nonfamily households. The most numerous type of family households are 2-person households, comprising 567, and the most common type of nonfamily households are 1-person households, comprising 538.
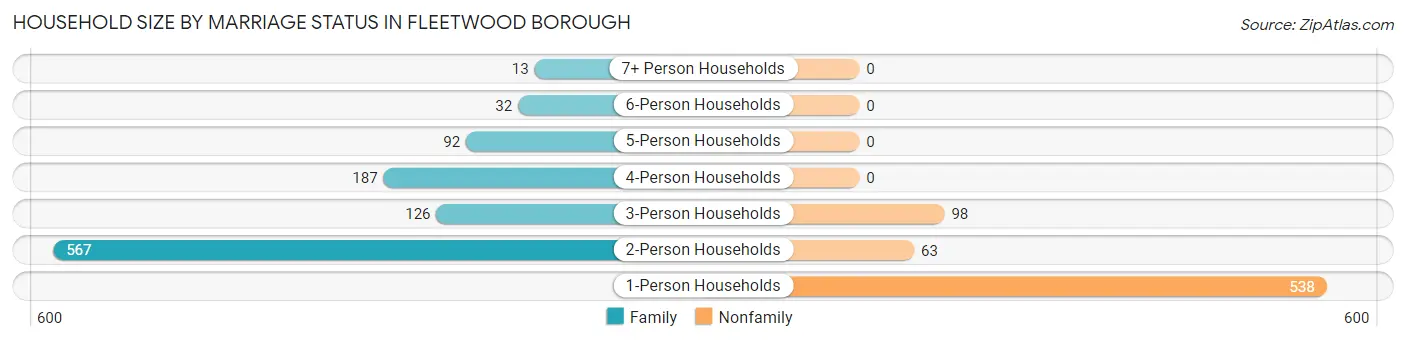
| Household Size | Family Households | Nonfamily Households |
| 1-Person Households | - | 538 (31.4%) |
| 2-Person Households | 567 (33.0%) | 63 (3.7%) |
| 3-Person Households | 126 (7.3%) | 98 (5.7%) |
| 4-Person Households | 187 (10.9%) | 0 (0.0%) |
| 5-Person Households | 92 (5.4%) | 0 (0.0%) |
| 6-Person Households | 32 (1.9%) | 0 (0.0%) |
| 7+ Person Households | 13 (0.8%) | 0 (0.0%) |
| Total | 1,017 (59.3%) | 699 (40.7%) |
Female Fertility in Fleetwood borough
Fertility by Age in Fleetwood borough
Average fertility rate in Fleetwood borough is 26.0 births per 1,000 women. Women in the age bracket of 20 to 34 years have the highest fertility rate with 41.0 births per 1,000 women. Women in the age bracket of 20 to 34 years acount for 53.8% of all women with births.
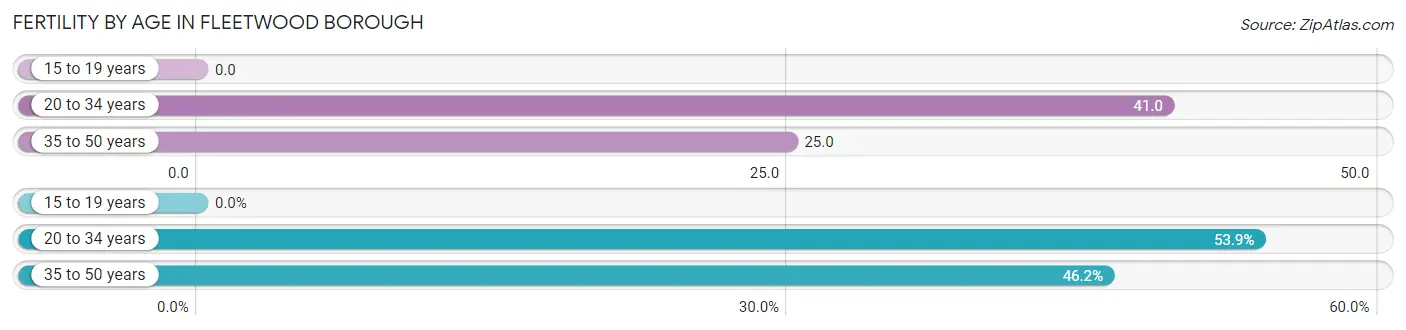
| Age Bracket | Women with Births | Births / 1,000 Women |
| 15 to 19 years | 0 (0.0%) | 0.0 |
| 20 to 34 years | 14 (53.8%) | 41.0 |
| 35 to 50 years | 12 (46.2%) | 25.0 |
| Total | 26 (100.0%) | 26.0 |
Fertility by Age by Marriage Status in Fleetwood borough
73.1% of women with births (26) in Fleetwood borough are married. The highest percentage of unmarried women with births falls into 35 to 50 years age bracket with 58.3% of them unmarried at the time of birth, while the lowest percentage of unmarried women with births belong to 20 to 34 years age bracket with 0.0% of them unmarried.
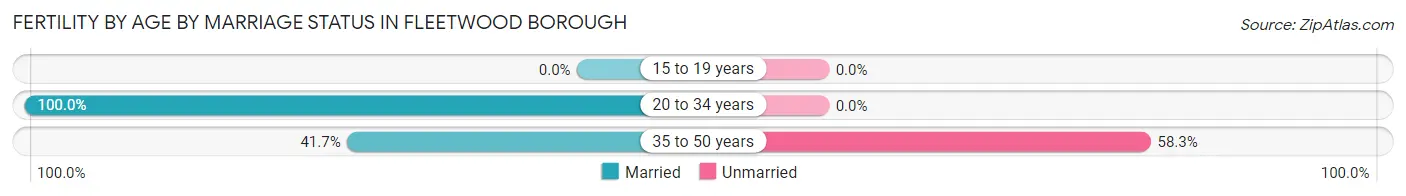
| Age Bracket | Married | Unmarried |
| 15 to 19 years | 0 (0.0%) | 0 (0.0%) |
| 20 to 34 years | 14 (100.0%) | 0 (0.0%) |
| 35 to 50 years | 5 (41.7%) | 7 (58.3%) |
| Total | 19 (73.1%) | 7 (26.9%) |
Fertility by Education in Fleetwood borough
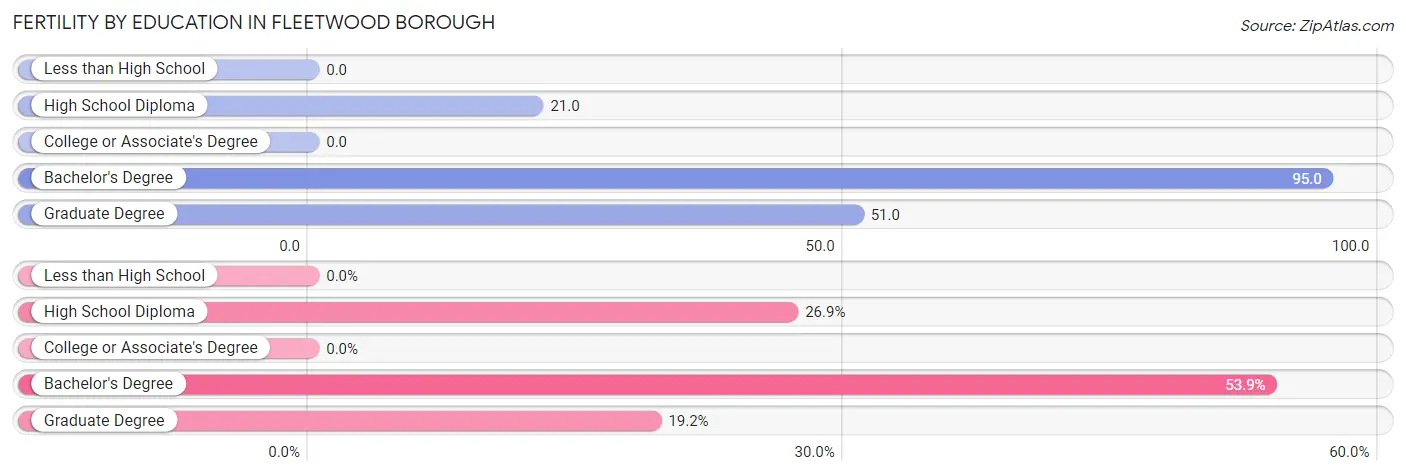
| Educational Attainment | Women with Births | Births / 1,000 Women |
| Less than High School | 0 (0.0%) | 0.0 |
| High School Diploma | 7 (26.9%) | 21.0 |
| College or Associate's Degree | 0 (0.0%) | 0.0 |
| Bachelor's Degree | 14 (53.8%) | 95.0 |
| Graduate Degree | 5 (19.2%) | 51.0 |
| Total | 26 (100.0%) | 26.0 |
Fertility by Education by Marriage Status in Fleetwood borough
26.9% of women with births in Fleetwood borough are unmarried. Women with the educational attainment of bachelor's degree are most likely to be married with 100.0% of them married at childbirth, while women with the educational attainment of high school diploma are least likely to be married with 100.0% of them unmarried at childbirth.
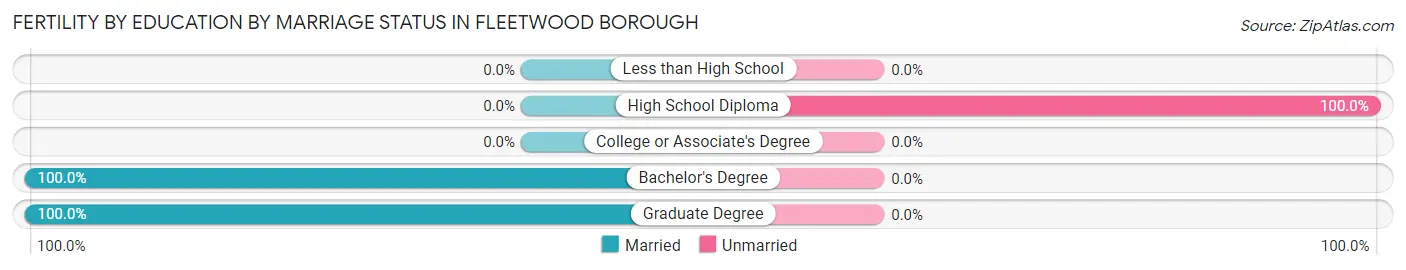
| Educational Attainment | Married | Unmarried |
| Less than High School | 0 (0.0%) | 0 (0.0%) |
| High School Diploma | 0 (0.0%) | 7 (100.0%) |
| College or Associate's Degree | 0 (0.0%) | 0 (0.0%) |
| Bachelor's Degree | 14 (100.0%) | 0 (0.0%) |
| Graduate Degree | 5 (100.0%) | 0 (0.0%) |
| Total | 19 (73.1%) | 7 (26.9%) |
Employment Characteristics in Fleetwood borough
Employment by Class of Employer in Fleetwood borough
Among the 2,325 employed individuals in Fleetwood borough, private company employees (1,833 | 78.8%), not-for-profit organizations (203 | 8.7%), and local government employees (112 | 4.8%) make up the most common classes of employment.
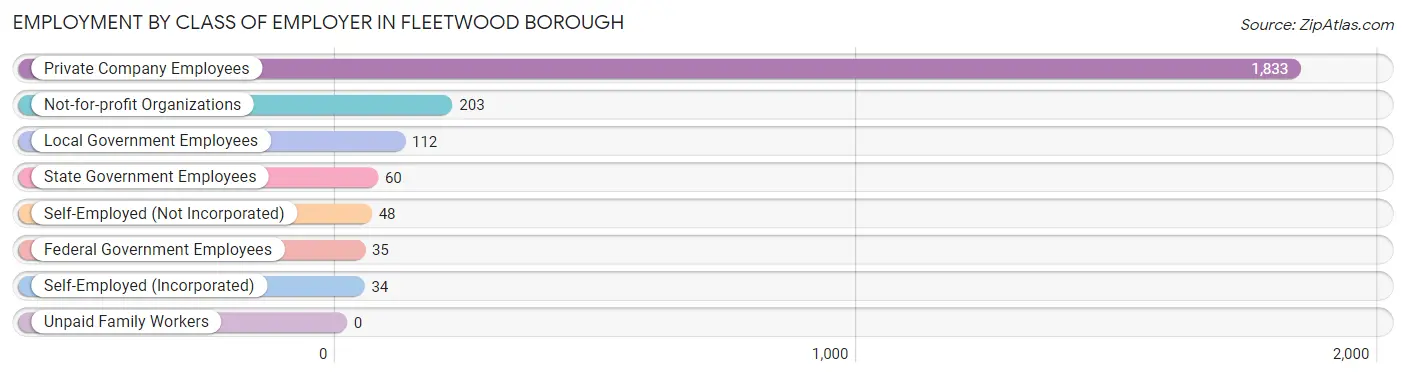
| Employer Class | # Employees | % Employees |
| Private Company Employees | 1,833 | 78.8% |
| Self-Employed (Incorporated) | 34 | 1.5% |
| Self-Employed (Not Incorporated) | 48 | 2.1% |
| Not-for-profit Organizations | 203 | 8.7% |
| Local Government Employees | 112 | 4.8% |
| State Government Employees | 60 | 2.6% |
| Federal Government Employees | 35 | 1.5% |
| Unpaid Family Workers | 0 | 0.0% |
| Total | 2,325 | 100.0% |
Employment Status by Age in Fleetwood borough
According to the labor force statistics for Fleetwood borough, out of the total population over 16 years of age (3,411), 70.6% or 2,408 individuals are in the labor force, with 2.7% or 65 of them unemployed. The age group with the highest labor force participation rate is 25 to 29 years, with 100.0% or 404 individuals in the labor force. Within the labor force, the 55 to 59 years age range has the highest percentage of unemployed individuals, with 10.7% or 16 of them being unemployed.
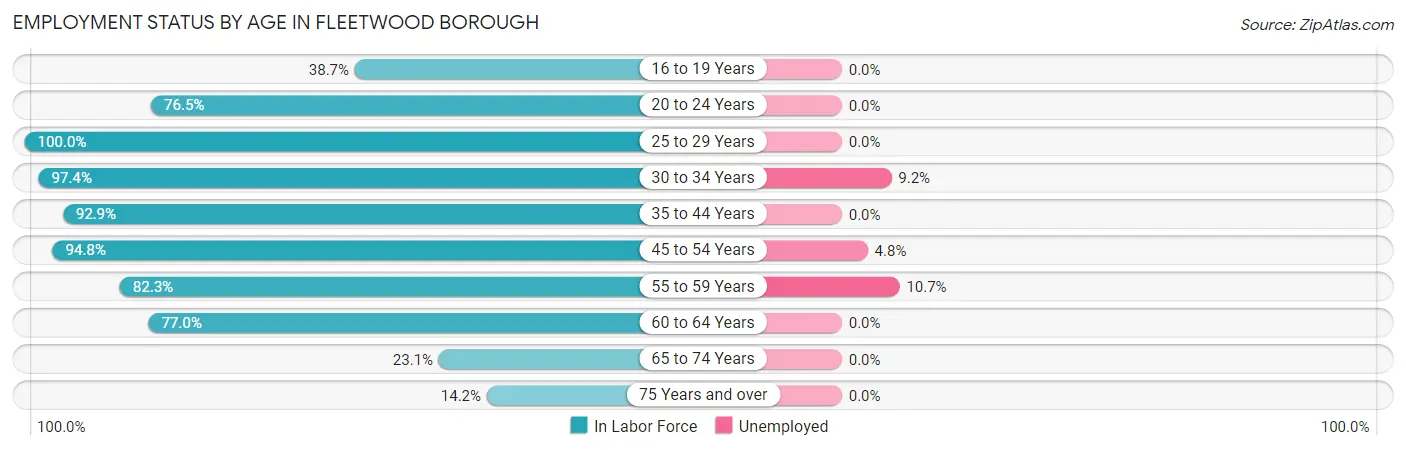
| Age Bracket | In Labor Force | Unemployed |
| 16 to 19 Years | 87 (38.7%) | 0 (0.0%) |
| 20 to 24 Years | 104 (76.5%) | 0 (0.0%) |
| 25 to 29 Years | 404 (100.0%) | 0 (0.0%) |
| 30 to 34 Years | 303 (97.4%) | 28 (9.2%) |
| 35 to 44 Years | 562 (92.9%) | 0 (0.0%) |
| 45 to 54 Years | 455 (94.8%) | 22 (4.8%) |
| 55 to 59 Years | 149 (82.3%) | 16 (10.7%) |
| 60 to 64 Years | 188 (77.0%) | 0 (0.0%) |
| 65 to 74 Years | 101 (23.1%) | 0 (0.0%) |
| 75 Years and over | 55 (14.2%) | 0 (0.0%) |
| Total | 2,408 (70.6%) | 65 (2.7%) |
Employment Status by Educational Attainment in Fleetwood borough
According to labor force statistics for Fleetwood borough, 92.6% of individuals (2,060) out of the total population between 25 and 64 years of age (2,225) are in the labor force, with 3.2% or 66 of them being unemployed. The group with the highest labor force participation rate are those with the educational attainment of bachelor's degree or higher, with 93.2% or 505 individuals in the labor force. Within the labor force, individuals with less than high school education have the highest percentage of unemployment, with 54.9% or 28 of them being unemployed.
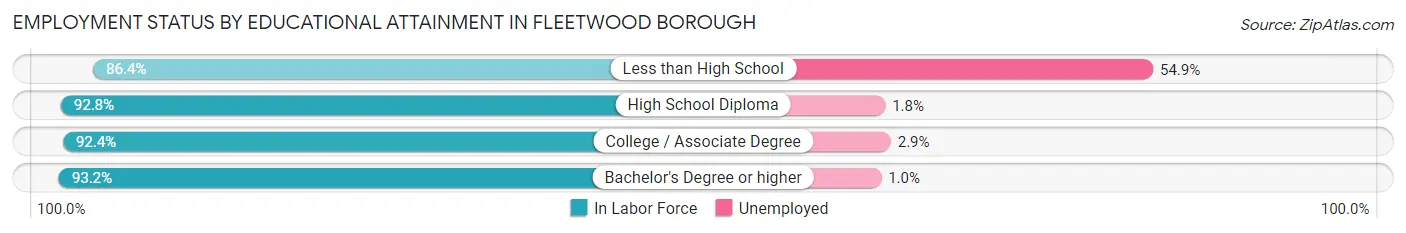
| Educational Attainment | In Labor Force | Unemployed |
| Less than High School | 51 (86.4%) | 32 (54.9%) |
| High School Diploma | 947 (92.8%) | 18 (1.8%) |
| College / Associate Degree | 558 (92.4%) | 18 (2.9%) |
| Bachelor's Degree or higher | 505 (93.2%) | 5 (1.0%) |
| Total | 2,060 (92.6%) | 71 (3.2%) |
Employment Occupations by Sex in Fleetwood borough
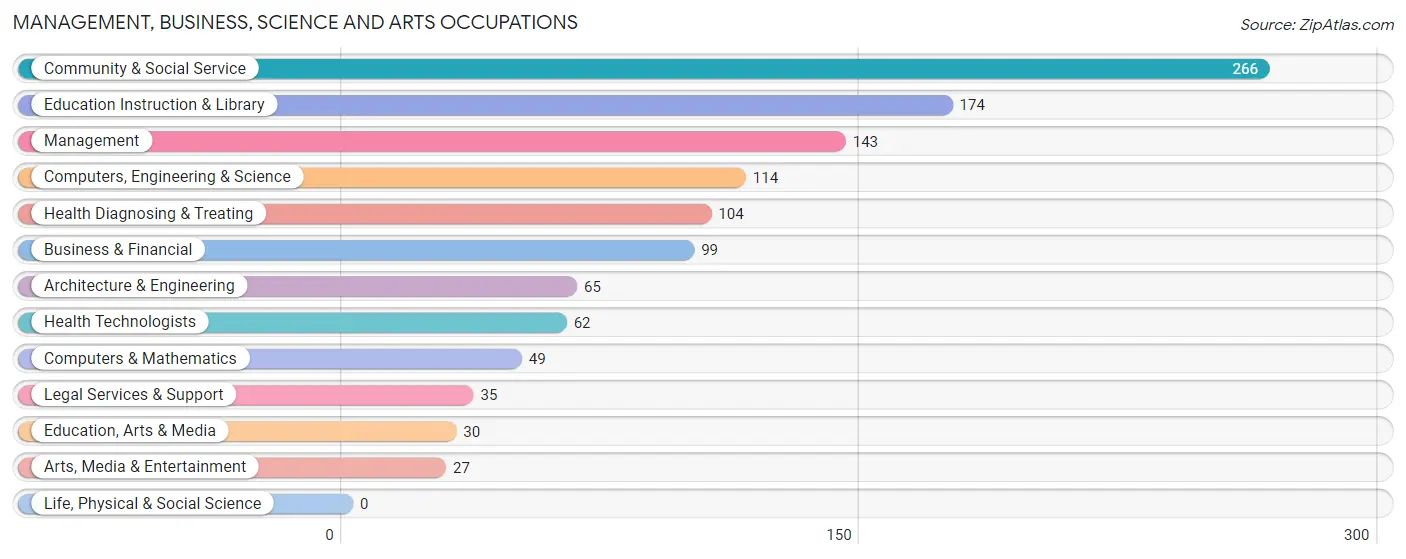
Management, Business, Science and Arts Occupations
The most common Management, Business, Science and Arts occupations in Fleetwood borough are Community & Social Service (266 | 11.4%), Education Instruction & Library (174 | 7.4%), Management (143 | 6.1%), Computers, Engineering & Science (114 | 4.9%), and Health Diagnosing & Treating (104 | 4.4%).
Management, Business, Science and Arts Occupations by Sex
Within the Management, Business, Science and Arts occupations in Fleetwood borough, the most male-oriented occupations are Architecture & Engineering (100.0%), Computers, Engineering & Science (85.1%), and Education, Arts & Media (66.7%), while the most female-oriented occupations are Legal Services & Support (100.0%), Health Technologists (85.5%), and Education Instruction & Library (85.1%).
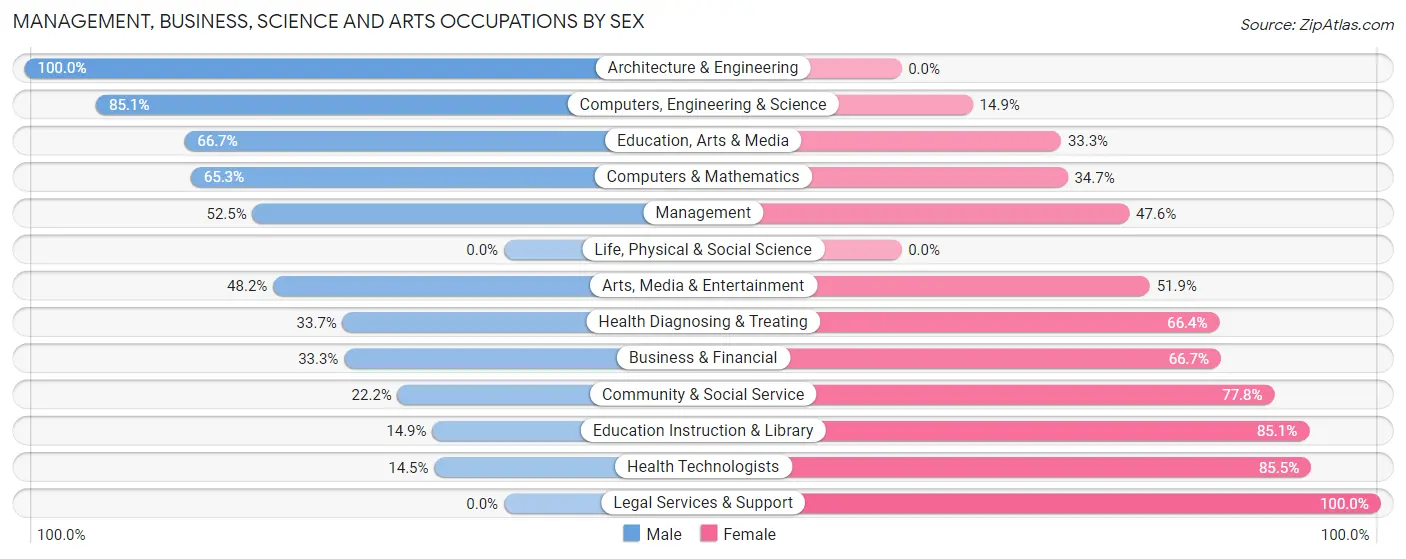
| Occupation | Male | Female |
| Management | 75 (52.4%) | 68 (47.5%) |
| Business & Financial | 33 (33.3%) | 66 (66.7%) |
| Computers, Engineering & Science | 97 (85.1%) | 17 (14.9%) |
| Computers & Mathematics | 32 (65.3%) | 17 (34.7%) |
| Architecture & Engineering | 65 (100.0%) | 0 (0.0%) |
| Life, Physical & Social Science | 0 (0.0%) | 0 (0.0%) |
| Community & Social Service | 59 (22.2%) | 207 (77.8%) |
| Education, Arts & Media | 20 (66.7%) | 10 (33.3%) |
| Legal Services & Support | 0 (0.0%) | 35 (100.0%) |
| Education Instruction & Library | 26 (14.9%) | 148 (85.1%) |
| Arts, Media & Entertainment | 13 (48.1%) | 14 (51.8%) |
| Health Diagnosing & Treating | 35 (33.7%) | 69 (66.3%) |
| Health Technologists | 9 (14.5%) | 53 (85.5%) |
| Total (Category) | 299 (41.2%) | 427 (58.8%) |
| Total (Overall) | 1,240 (52.9%) | 1,102 (47.0%) |
Services Occupations
The most common Services occupations in Fleetwood borough are Food Preparation & Serving (214 | 9.1%), Healthcare Support (40 | 1.7%), Cleaning & Maintenance (27 | 1.1%), Security & Protection (18 | 0.8%), and Personal Care & Service (14 | 0.6%).
Services Occupations by Sex
Within the Services occupations in Fleetwood borough, the most male-oriented occupations are Law Enforcement (100.0%), Security & Protection (55.6%), and Food Preparation & Serving (38.8%), while the most female-oriented occupations are Healthcare Support (100.0%), Firefighting & Prevention (100.0%), and Personal Care & Service (100.0%).
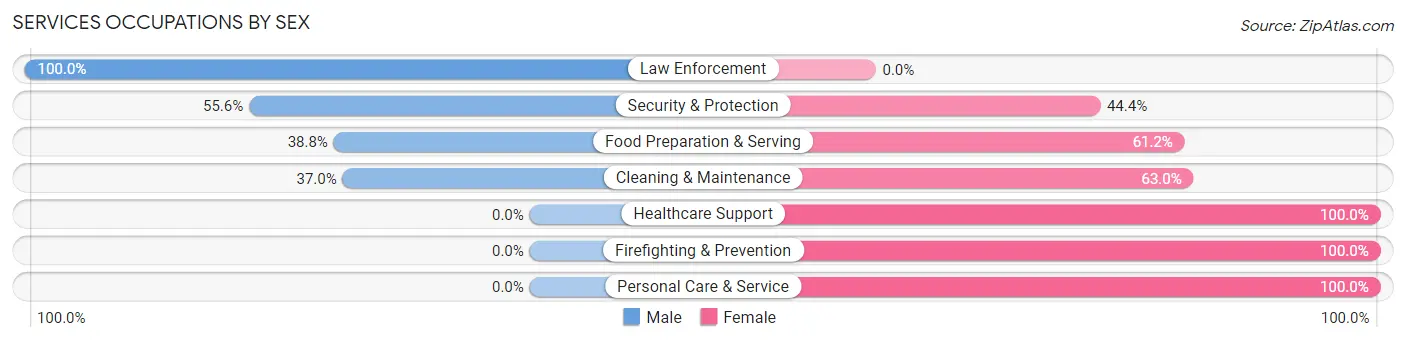
| Occupation | Male | Female |
| Healthcare Support | 0 (0.0%) | 40 (100.0%) |
| Security & Protection | 10 (55.6%) | 8 (44.4%) |
| Firefighting & Prevention | 0 (0.0%) | 8 (100.0%) |
| Law Enforcement | 10 (100.0%) | 0 (0.0%) |
| Food Preparation & Serving | 83 (38.8%) | 131 (61.2%) |
| Cleaning & Maintenance | 10 (37.0%) | 17 (63.0%) |
| Personal Care & Service | 0 (0.0%) | 14 (100.0%) |
| Total (Category) | 103 (32.9%) | 210 (67.1%) |
| Total (Overall) | 1,240 (52.9%) | 1,102 (47.0%) |
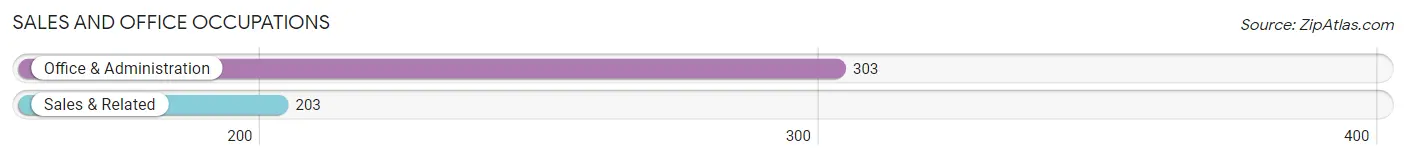
Sales and Office Occupations
The most common Sales and Office occupations in Fleetwood borough are Office & Administration (303 | 12.9%), and Sales & Related (203 | 8.7%).
Sales and Office Occupations by Sex
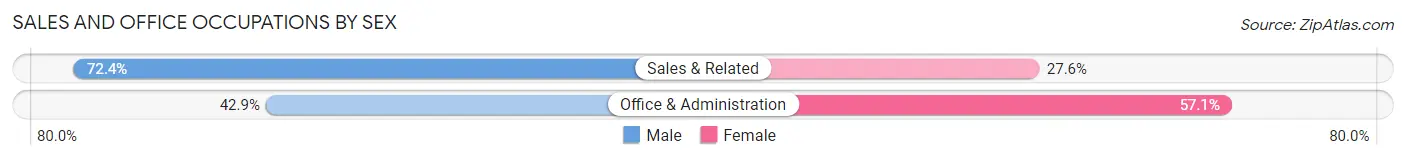
| Occupation | Male | Female |
| Sales & Related | 147 (72.4%) | 56 (27.6%) |
| Office & Administration | 130 (42.9%) | 173 (57.1%) |
| Total (Category) | 277 (54.7%) | 229 (45.3%) |
| Total (Overall) | 1,240 (52.9%) | 1,102 (47.0%) |
Natural Resources, Construction and Maintenance Occupations
The most common Natural Resources, Construction and Maintenance occupations in Fleetwood borough are Installation, Maintenance & Repair (66 | 2.8%), Construction & Extraction (22 | 0.9%), and Farming, Fishing & Forestry (11 | 0.5%).
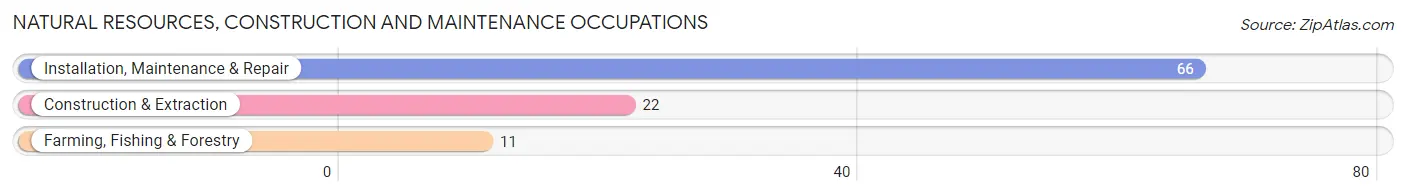
Natural Resources, Construction and Maintenance Occupations by Sex
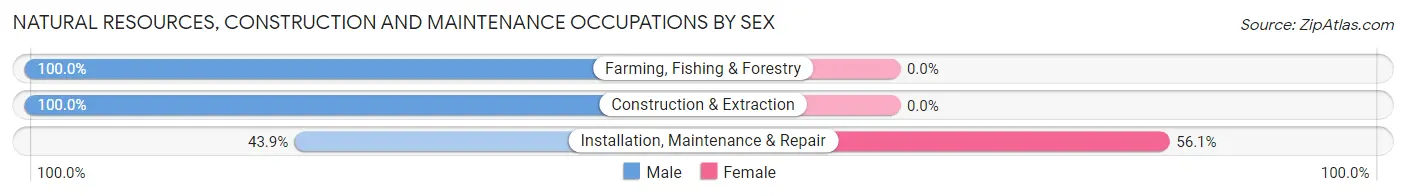
| Occupation | Male | Female |
| Farming, Fishing & Forestry | 11 (100.0%) | 0 (0.0%) |
| Construction & Extraction | 22 (100.0%) | 0 (0.0%) |
| Installation, Maintenance & Repair | 29 (43.9%) | 37 (56.1%) |
| Total (Category) | 62 (62.6%) | 37 (37.4%) |
| Total (Overall) | 1,240 (52.9%) | 1,102 (47.0%) |
Production, Transportation and Moving Occupations
The most common Production, Transportation and Moving occupations in Fleetwood borough are Production (505 | 21.6%), Transportation (102 | 4.4%), and Material Moving (91 | 3.9%).
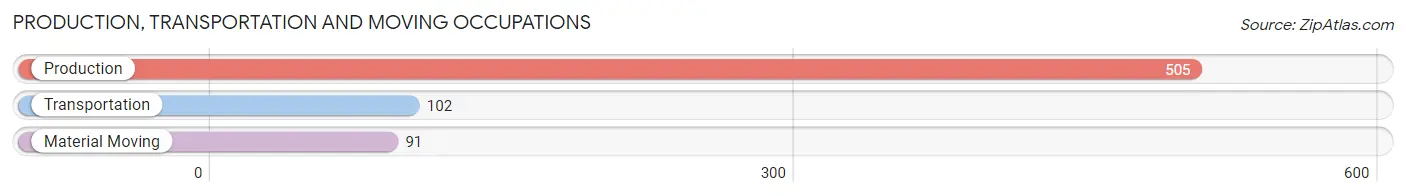
Production, Transportation and Moving Occupations by Sex
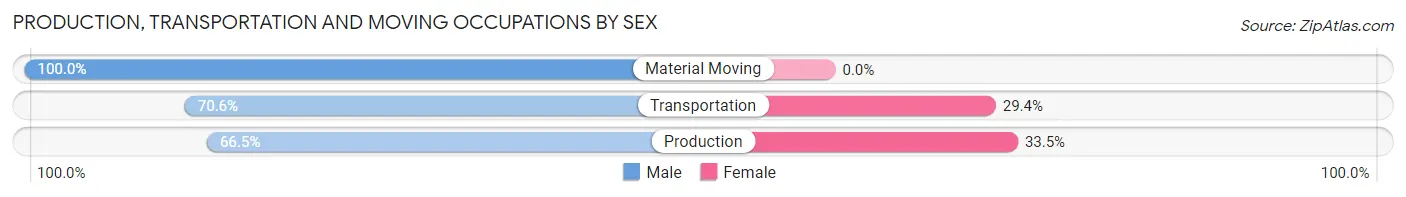
| Occupation | Male | Female |
| Production | 336 (66.5%) | 169 (33.5%) |
| Transportation | 72 (70.6%) | 30 (29.4%) |
| Material Moving | 91 (100.0%) | 0 (0.0%) |
| Total (Category) | 499 (71.5%) | 199 (28.5%) |
| Total (Overall) | 1,240 (52.9%) | 1,102 (47.0%) |
Employment Industries by Sex in Fleetwood borough
Employment Industries in Fleetwood borough
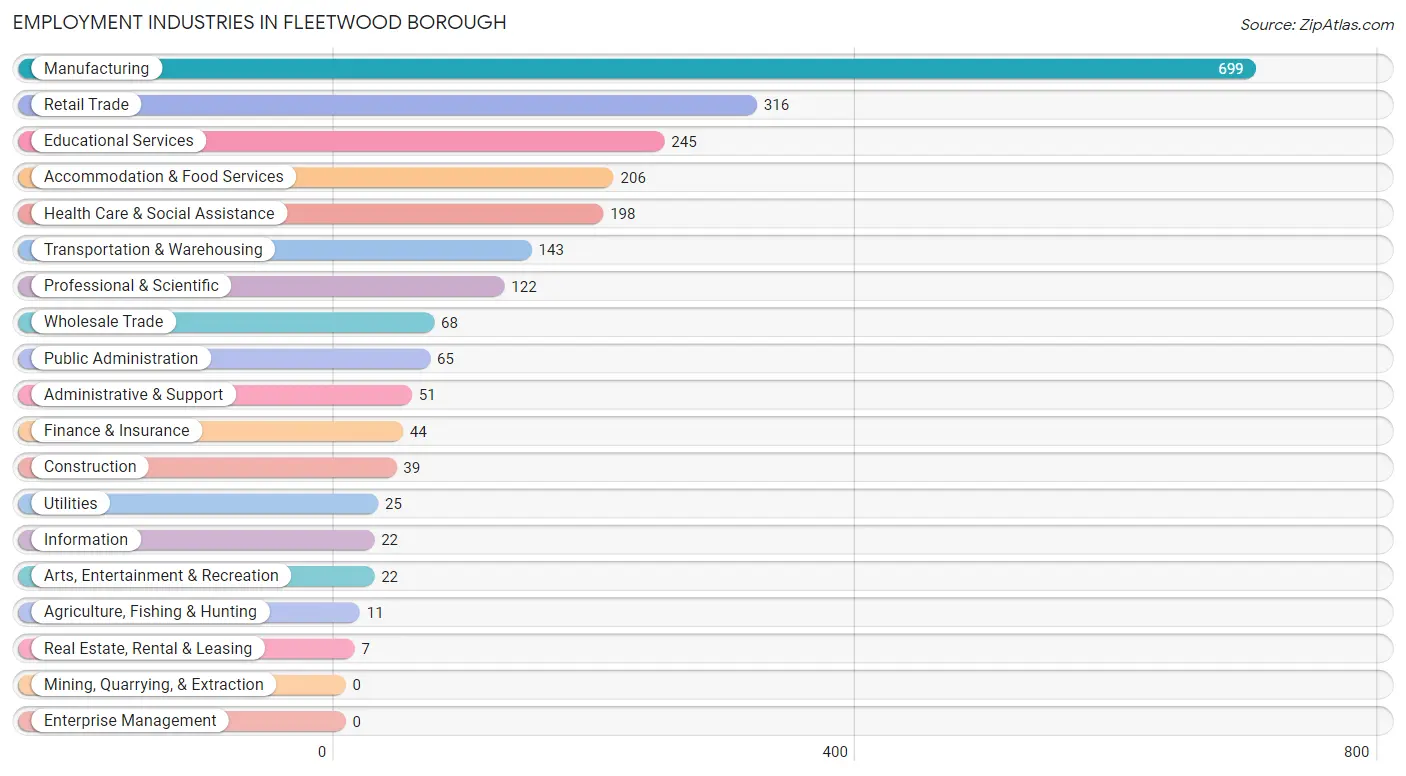
The major employment industries in Fleetwood borough include Manufacturing (699 | 29.8%), Retail Trade (316 | 13.5%), Educational Services (245 | 10.5%), Accommodation & Food Services (206 | 8.8%), and Health Care & Social Assistance (198 | 8.5%).
Employment Industries by Sex in Fleetwood borough
The Fleetwood borough industries that see more men than women are Agriculture, Fishing & Hunting (100.0%), Construction (100.0%), and Real Estate, Rental & Leasing (100.0%), whereas the industries that tend to have a higher number of women are Information (100.0%), Health Care & Social Assistance (84.9%), and Public Administration (84.6%).
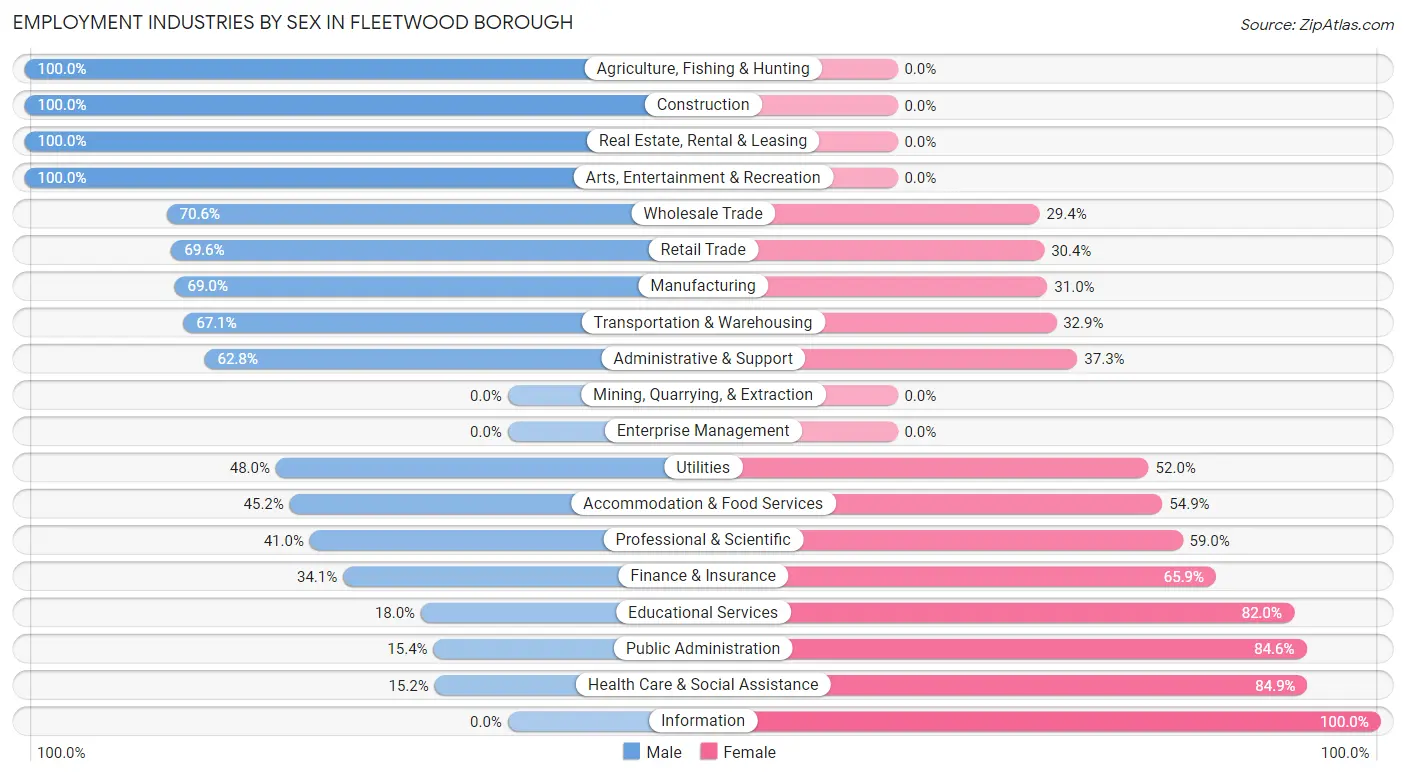
| Industry | Male | Female |
| Agriculture, Fishing & Hunting | 11 (100.0%) | 0 (0.0%) |
| Mining, Quarrying, & Extraction | 0 (0.0%) | 0 (0.0%) |
| Construction | 39 (100.0%) | 0 (0.0%) |
| Manufacturing | 482 (69.0%) | 217 (31.0%) |
| Wholesale Trade | 48 (70.6%) | 20 (29.4%) |
| Retail Trade | 220 (69.6%) | 96 (30.4%) |
| Transportation & Warehousing | 96 (67.1%) | 47 (32.9%) |
| Utilities | 12 (48.0%) | 13 (52.0%) |
| Information | 0 (0.0%) | 22 (100.0%) |
| Finance & Insurance | 15 (34.1%) | 29 (65.9%) |
| Real Estate, Rental & Leasing | 7 (100.0%) | 0 (0.0%) |
| Professional & Scientific | 50 (41.0%) | 72 (59.0%) |
| Enterprise Management | 0 (0.0%) | 0 (0.0%) |
| Administrative & Support | 32 (62.7%) | 19 (37.2%) |
| Educational Services | 44 (18.0%) | 201 (82.0%) |
| Health Care & Social Assistance | 30 (15.1%) | 168 (84.9%) |
| Arts, Entertainment & Recreation | 22 (100.0%) | 0 (0.0%) |
| Accommodation & Food Services | 93 (45.2%) | 113 (54.8%) |
| Public Administration | 10 (15.4%) | 55 (84.6%) |
| Total | 1,240 (52.9%) | 1,102 (47.0%) |
Education in Fleetwood borough
School Enrollment in Fleetwood borough
The most common levels of schooling among the 906 students in Fleetwood borough are middle school (294 | 32.5%), high school (292 | 32.2%), and elementary school (150 | 16.6%).
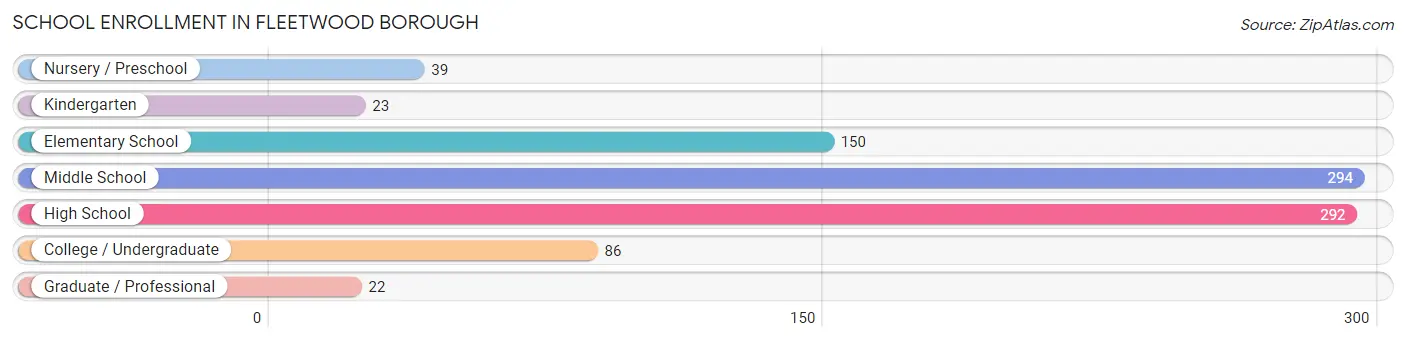
| School Level | # Students | % Students |
| Nursery / Preschool | 39 | 4.3% |
| Kindergarten | 23 | 2.5% |
| Elementary School | 150 | 16.6% |
| Middle School | 294 | 32.5% |
| High School | 292 | 32.2% |
| College / Undergraduate | 86 | 9.5% |
| Graduate / Professional | 22 | 2.4% |
| Total | 906 | 100.0% |
School Enrollment by Age by Funding Source in Fleetwood borough
Out of a total of 906 students who are enrolled in schools in Fleetwood borough, 71 (7.8%) attend a private institution, while the remaining 835 (92.2%) are enrolled in public schools. The age group of 3 to 4 year olds has the highest likelihood of being enrolled in private schools, with 11 (100.0% in the age bracket) enrolled. Conversely, the age group of 20 to 24 year olds has the lowest likelihood of being enrolled in a private school, with 59 (100.0% in the age bracket) attending a public institution.
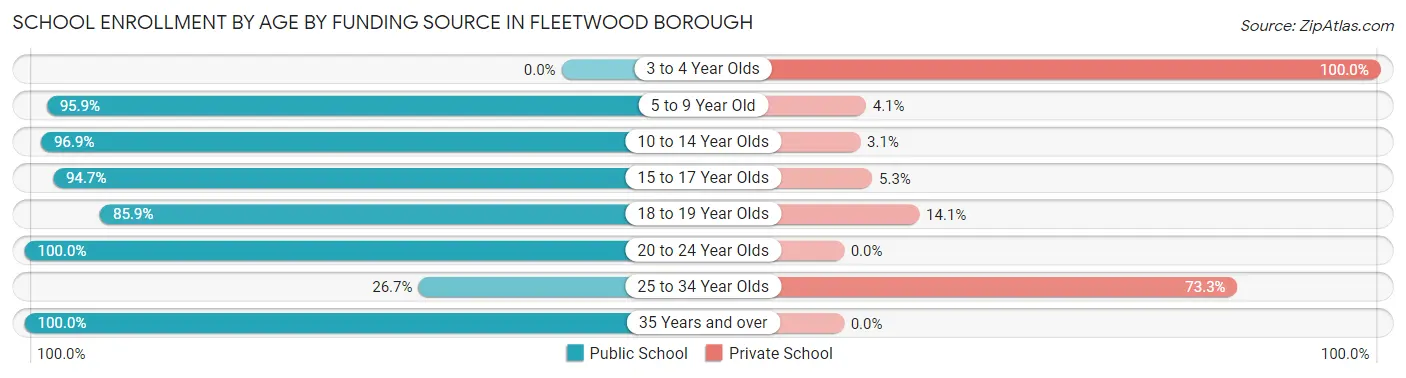
| Age Bracket | Public School | Private School |
| 3 to 4 Year Olds | 0 (0.0%) | 11 (100.0%) |
| 5 to 9 Year Old | 186 (95.9%) | 8 (4.1%) |
| 10 to 14 Year Olds | 317 (96.9%) | 10 (3.1%) |
| 15 to 17 Year Olds | 197 (94.7%) | 11 (5.3%) |
| 18 to 19 Year Olds | 55 (85.9%) | 9 (14.1%) |
| 20 to 24 Year Olds | 59 (100.0%) | 0 (0.0%) |
| 25 to 34 Year Olds | 8 (26.7%) | 22 (73.3%) |
| 35 Years and over | 13 (100.0%) | 0 (0.0%) |
| Total | 835 (92.2%) | 71 (7.8%) |
Educational Attainment by Field of Study in Fleetwood borough
Education (169 | 24.7%), business (146 | 21.3%), science & technology (78 | 11.4%), engineering (65 | 9.5%), and visual & performing arts (46 | 6.7%) are the most common fields of study among 684 individuals in Fleetwood borough who have obtained a bachelor's degree or higher.
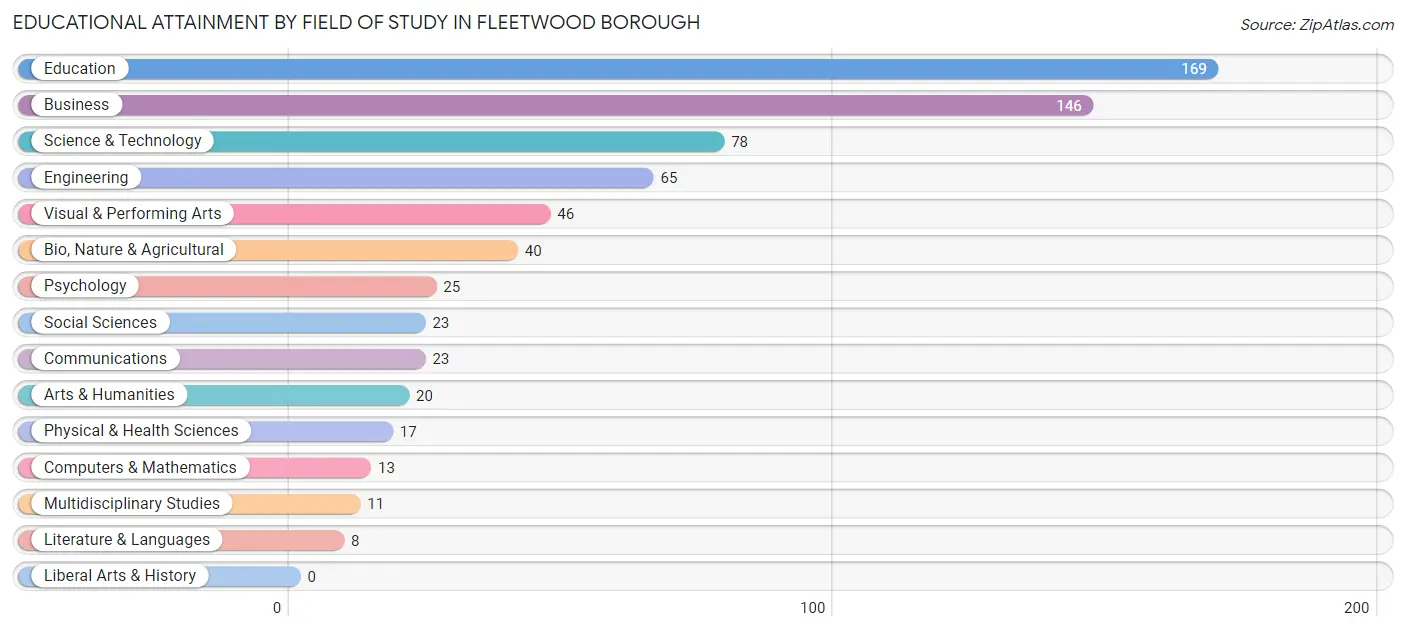
| Field of Study | # Graduates | % Graduates |
| Computers & Mathematics | 13 | 1.9% |
| Bio, Nature & Agricultural | 40 | 5.9% |
| Physical & Health Sciences | 17 | 2.5% |
| Psychology | 25 | 3.6% |
| Social Sciences | 23 | 3.4% |
| Engineering | 65 | 9.5% |
| Multidisciplinary Studies | 11 | 1.6% |
| Science & Technology | 78 | 11.4% |
| Business | 146 | 21.3% |
| Education | 169 | 24.7% |
| Literature & Languages | 8 | 1.2% |
| Liberal Arts & History | 0 | 0.0% |
| Visual & Performing Arts | 46 | 6.7% |
| Communications | 23 | 3.4% |
| Arts & Humanities | 20 | 2.9% |
| Total | 684 | 100.0% |
Transportation & Commute in Fleetwood borough
Vehicle Availability by Sex in Fleetwood borough
The most prevalent vehicle ownership categories in Fleetwood borough are males with 2 vehicles (543, accounting for 43.8%) and females with 2 vehicles (582, making up 50.0%).
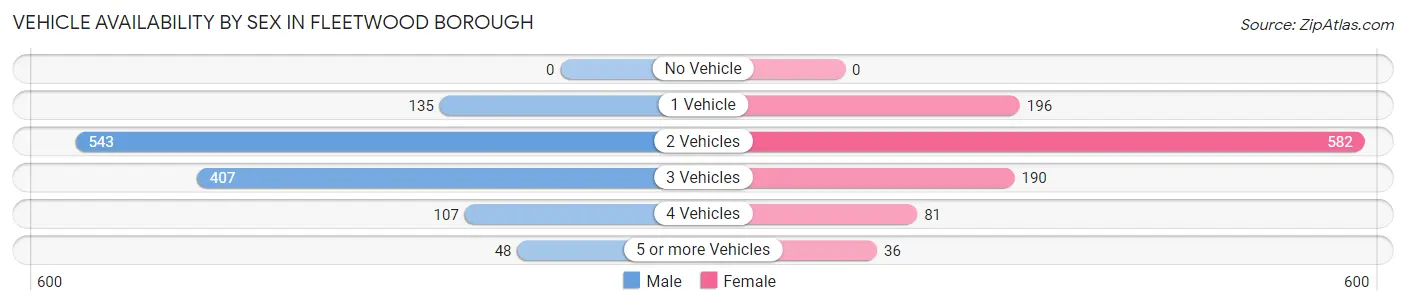
| Vehicles Available | Male | Female |
| No Vehicle | 0 (0.0%) | 0 (0.0%) |
| 1 Vehicle | 135 (10.9%) | 196 (18.1%) |
| 2 Vehicles | 543 (43.8%) | 582 (53.6%) |
| 3 Vehicles | 407 (32.8%) | 190 (17.5%) |
| 4 Vehicles | 107 (8.6%) | 81 (7.5%) |
| 5 or more Vehicles | 48 (3.9%) | 36 (3.3%) |
| Total | 1,240 (100.0%) | 1,085 (100.0%) |
Commute Time in Fleetwood borough
The most frequently occuring commute durations in Fleetwood borough are 20 to 24 minutes (360 commuters, 16.8%), 10 to 14 minutes (296 commuters, 13.8%), and 30 to 34 minutes (276 commuters, 12.9%).
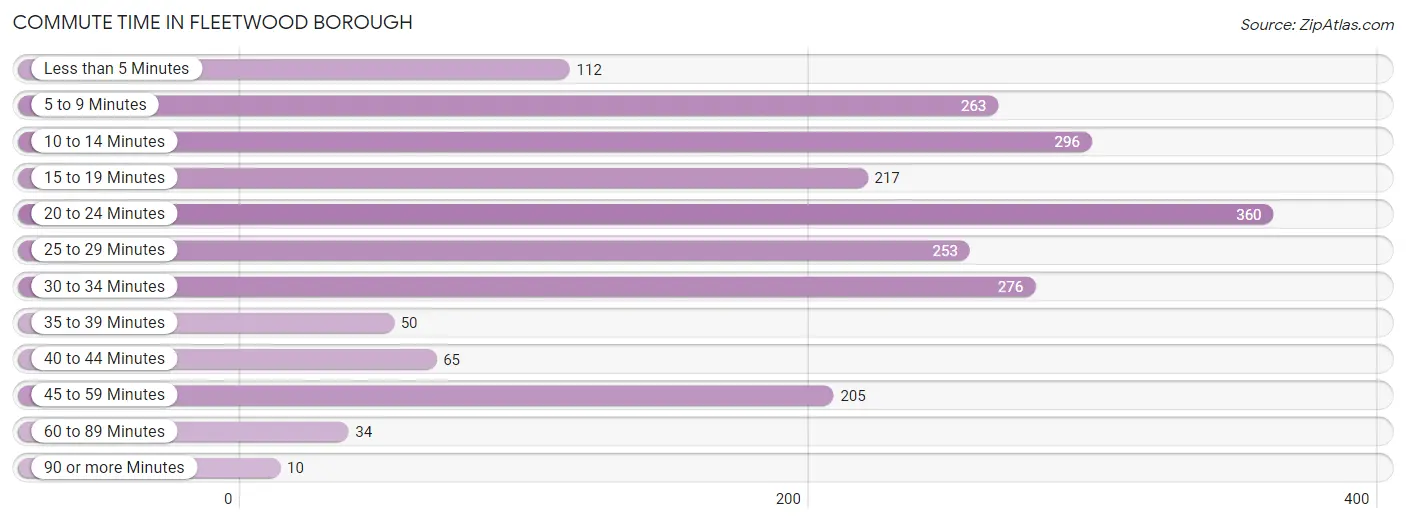
| Commute Time | # Commuters | % Commuters |
| Less than 5 Minutes | 112 | 5.2% |
| 5 to 9 Minutes | 263 | 12.3% |
| 10 to 14 Minutes | 296 | 13.8% |
| 15 to 19 Minutes | 217 | 10.1% |
| 20 to 24 Minutes | 360 | 16.8% |
| 25 to 29 Minutes | 253 | 11.8% |
| 30 to 34 Minutes | 276 | 12.9% |
| 35 to 39 Minutes | 50 | 2.3% |
| 40 to 44 Minutes | 65 | 3.0% |
| 45 to 59 Minutes | 205 | 9.6% |
| 60 to 89 Minutes | 34 | 1.6% |
| 90 or more Minutes | 10 | 0.5% |
Commute Time by Sex in Fleetwood borough
The most common commute times in Fleetwood borough are 30 to 34 minutes (207 commuters, 18.3%) for males and 20 to 24 minutes (207 commuters, 20.5%) for females.
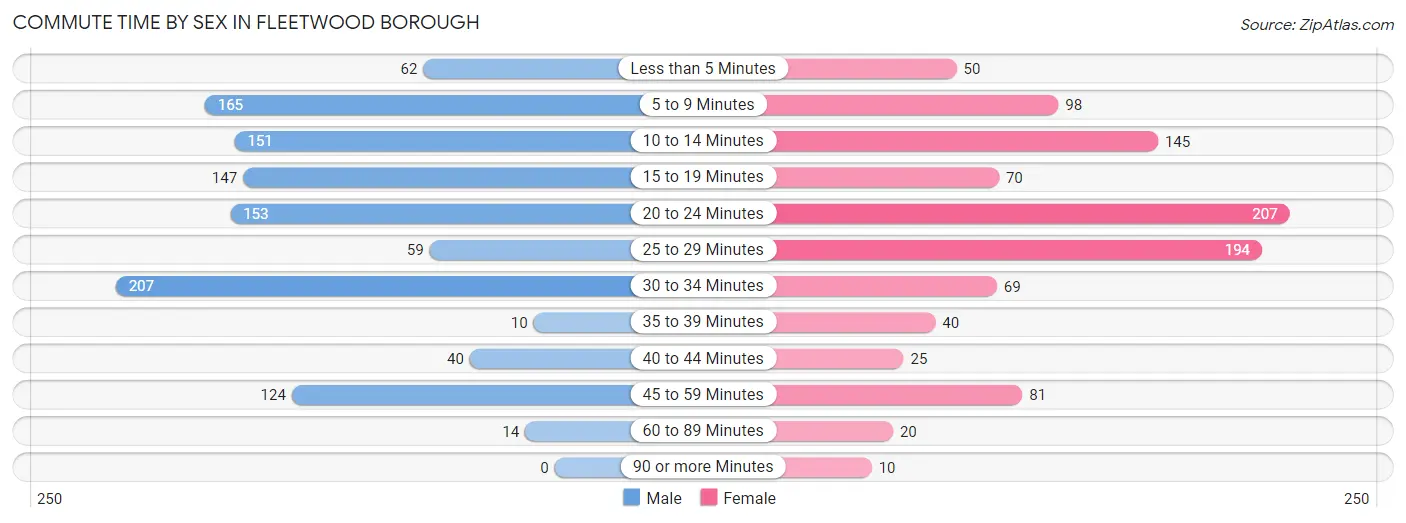
| Commute Time | Male | Female |
| Less than 5 Minutes | 62 (5.5%) | 50 (5.0%) |
| 5 to 9 Minutes | 165 (14.6%) | 98 (9.7%) |
| 10 to 14 Minutes | 151 (13.3%) | 145 (14.4%) |
| 15 to 19 Minutes | 147 (13.0%) | 70 (6.9%) |
| 20 to 24 Minutes | 153 (13.5%) | 207 (20.5%) |
| 25 to 29 Minutes | 59 (5.2%) | 194 (19.2%) |
| 30 to 34 Minutes | 207 (18.3%) | 69 (6.8%) |
| 35 to 39 Minutes | 10 (0.9%) | 40 (4.0%) |
| 40 to 44 Minutes | 40 (3.5%) | 25 (2.5%) |
| 45 to 59 Minutes | 124 (11.0%) | 81 (8.0%) |
| 60 to 89 Minutes | 14 (1.2%) | 20 (2.0%) |
| 90 or more Minutes | 0 (0.0%) | 10 (1.0%) |
Time of Departure to Work by Sex in Fleetwood borough
The most frequent times of departure to work in Fleetwood borough are 6:30 AM to 6:59 AM (236, 20.8%) for males and 6:30 AM to 6:59 AM (299, 29.6%) for females.
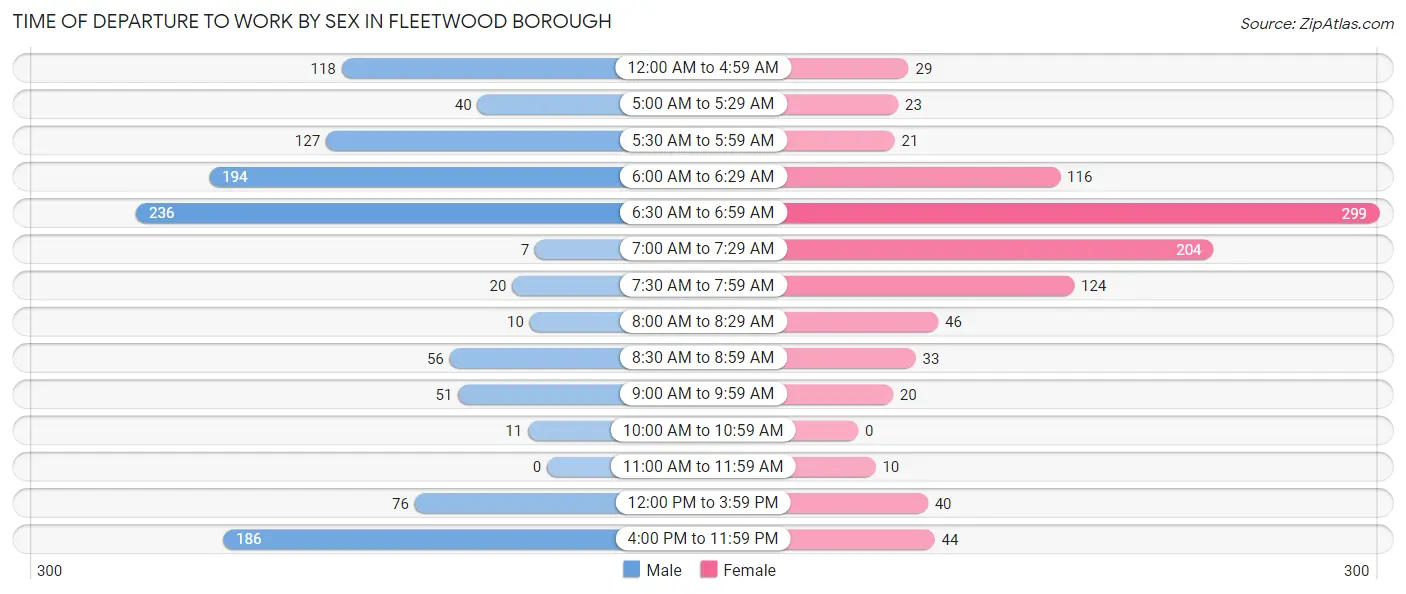
| Time of Departure | Male | Female |
| 12:00 AM to 4:59 AM | 118 (10.4%) | 29 (2.9%) |
| 5:00 AM to 5:29 AM | 40 (3.5%) | 23 (2.3%) |
| 5:30 AM to 5:59 AM | 127 (11.2%) | 21 (2.1%) |
| 6:00 AM to 6:29 AM | 194 (17.1%) | 116 (11.5%) |
| 6:30 AM to 6:59 AM | 236 (20.8%) | 299 (29.6%) |
| 7:00 AM to 7:29 AM | 7 (0.6%) | 204 (20.2%) |
| 7:30 AM to 7:59 AM | 20 (1.8%) | 124 (12.3%) |
| 8:00 AM to 8:29 AM | 10 (0.9%) | 46 (4.6%) |
| 8:30 AM to 8:59 AM | 56 (5.0%) | 33 (3.3%) |
| 9:00 AM to 9:59 AM | 51 (4.5%) | 20 (2.0%) |
| 10:00 AM to 10:59 AM | 11 (1.0%) | 0 (0.0%) |
| 11:00 AM to 11:59 AM | 0 (0.0%) | 10 (1.0%) |
| 12:00 PM to 3:59 PM | 76 (6.7%) | 40 (4.0%) |
| 4:00 PM to 11:59 PM | 186 (16.4%) | 44 (4.4%) |
| Total | 1,132 (100.0%) | 1,009 (100.0%) |
Housing Occupancy in Fleetwood borough
Occupancy by Ownership in Fleetwood borough
Of the total 1,716 dwellings in Fleetwood borough, owner-occupied units account for 1,232 (71.8%), while renter-occupied units make up 484 (28.2%).
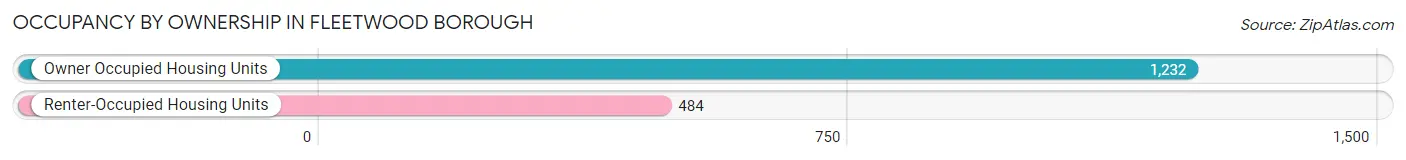
| Occupancy | # Housing Units | % Housing Units |
| Owner Occupied Housing Units | 1,232 | 71.8% |
| Renter-Occupied Housing Units | 484 | 28.2% |
| Total Occupied Housing Units | 1,716 | 100.0% |
Occupancy by Household Size in Fleetwood borough
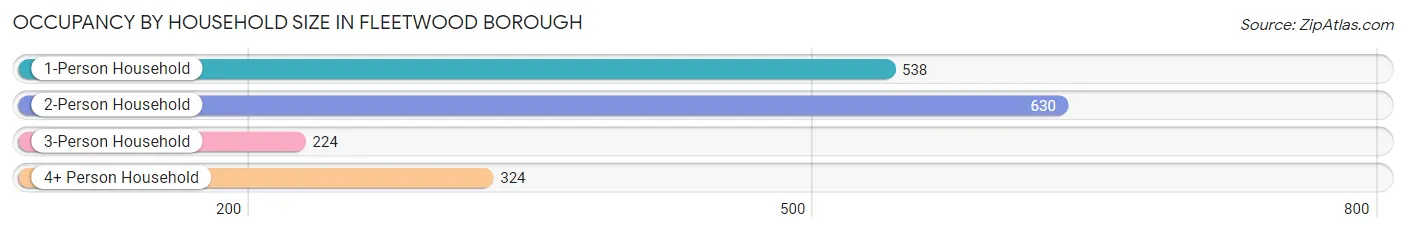
| Household Size | # Housing Units | % Housing Units |
| 1-Person Household | 538 | 31.4% |
| 2-Person Household | 630 | 36.7% |
| 3-Person Household | 224 | 13.1% |
| 4+ Person Household | 324 | 18.9% |
| Total Housing Units | 1,716 | 100.0% |
Occupancy by Ownership by Household Size in Fleetwood borough
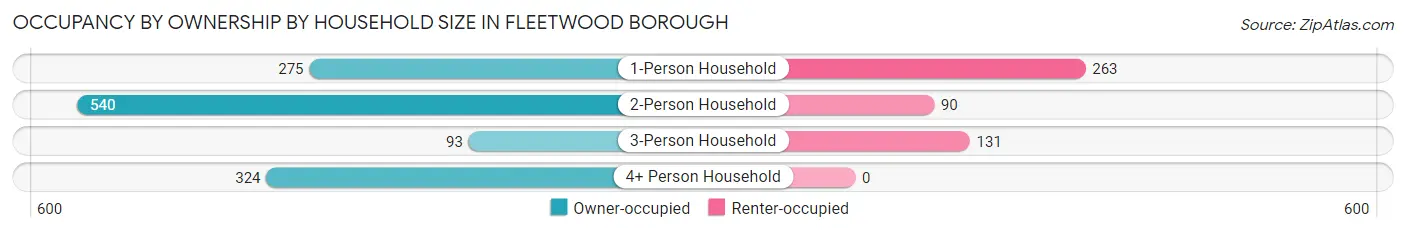
| Household Size | Owner-occupied | Renter-occupied |
| 1-Person Household | 275 (51.1%) | 263 (48.9%) |
| 2-Person Household | 540 (85.7%) | 90 (14.3%) |
| 3-Person Household | 93 (41.5%) | 131 (58.5%) |
| 4+ Person Household | 324 (100.0%) | 0 (0.0%) |
| Total Housing Units | 1,232 (71.8%) | 484 (28.2%) |
Occupancy by Educational Attainment in Fleetwood borough
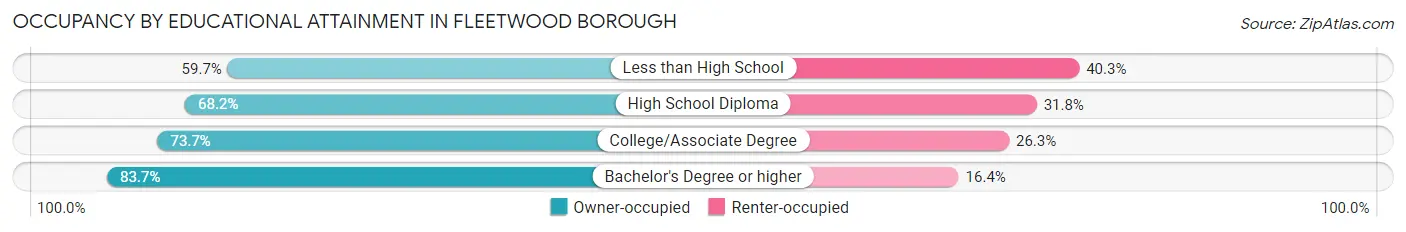
| Household Size | Owner-occupied | Renter-occupied |
| Less than High School | 46 (59.7%) | 31 (40.3%) |
| High School Diploma | 651 (68.2%) | 304 (31.8%) |
| College/Associate Degree | 274 (73.7%) | 98 (26.3%) |
| Bachelor's Degree or higher | 261 (83.7%) | 51 (16.4%) |
Occupancy by Age of Householder in Fleetwood borough
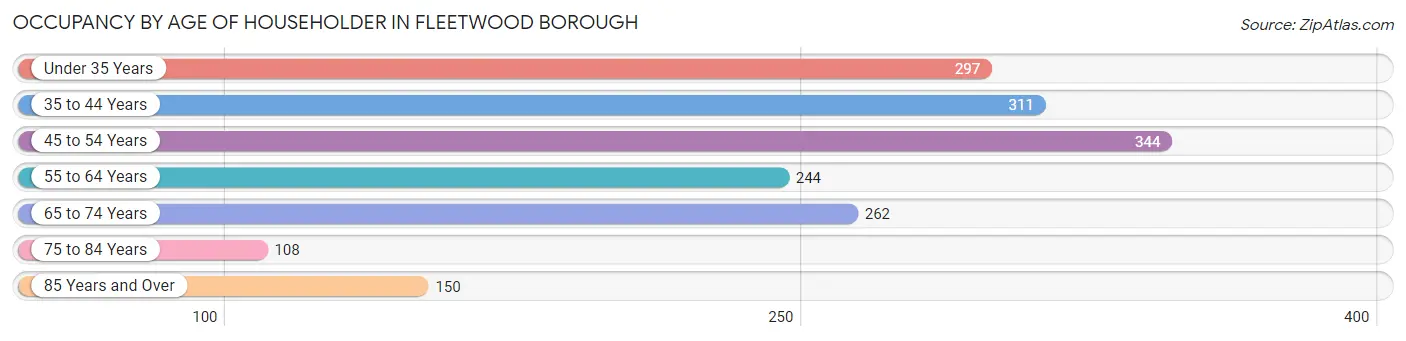
| Age Bracket | # Households | % Households |
| Under 35 Years | 297 | 17.3% |
| 35 to 44 Years | 311 | 18.1% |
| 45 to 54 Years | 344 | 20.1% |
| 55 to 64 Years | 244 | 14.2% |
| 65 to 74 Years | 262 | 15.3% |
| 75 to 84 Years | 108 | 6.3% |
| 85 Years and Over | 150 | 8.7% |
| Total | 1,716 | 100.0% |
Housing Finances in Fleetwood borough
Median Income by Occupancy in Fleetwood borough
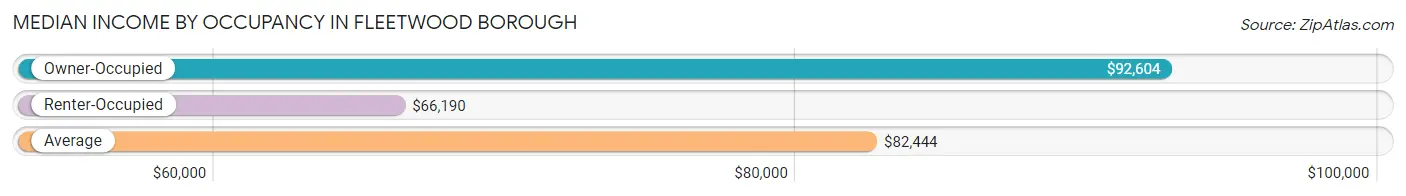
| Occupancy Type | # Households | Median Income |
| Owner-Occupied | 1,232 (71.8%) | $92,604 |
| Renter-Occupied | 484 (28.2%) | $66,190 |
| Average | 1,716 (100.0%) | $82,444 |
Occupancy by Householder Income Bracket in Fleetwood borough
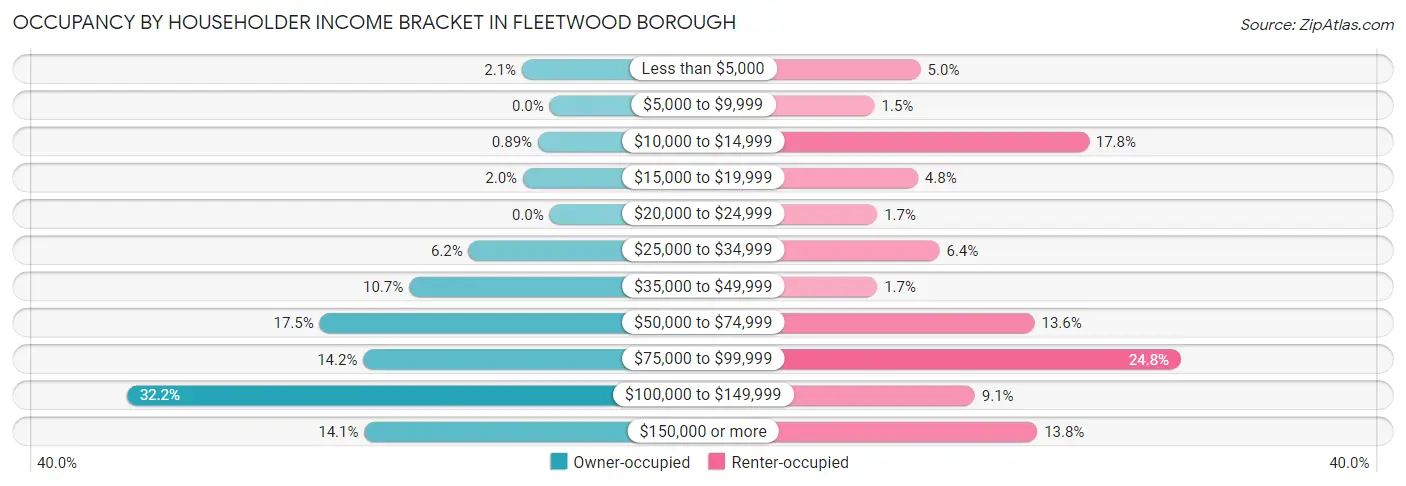
| Income Bracket | Owner-occupied | Renter-occupied |
| Less than $5,000 | 26 (2.1%) | 24 (5.0%) |
| $5,000 to $9,999 | 0 (0.0%) | 7 (1.5%) |
| $10,000 to $14,999 | 11 (0.9%) | 86 (17.8%) |
| $15,000 to $19,999 | 25 (2.0%) | 23 (4.8%) |
| $20,000 to $24,999 | 0 (0.0%) | 8 (1.7%) |
| $25,000 to $34,999 | 76 (6.2%) | 31 (6.4%) |
| $35,000 to $49,999 | 132 (10.7%) | 8 (1.7%) |
| $50,000 to $74,999 | 216 (17.5%) | 66 (13.6%) |
| $75,000 to $99,999 | 175 (14.2%) | 120 (24.8%) |
| $100,000 to $149,999 | 397 (32.2%) | 44 (9.1%) |
| $150,000 or more | 174 (14.1%) | 67 (13.8%) |
| Total | 1,232 (100.0%) | 484 (100.0%) |
Monthly Housing Cost Tiers in Fleetwood borough
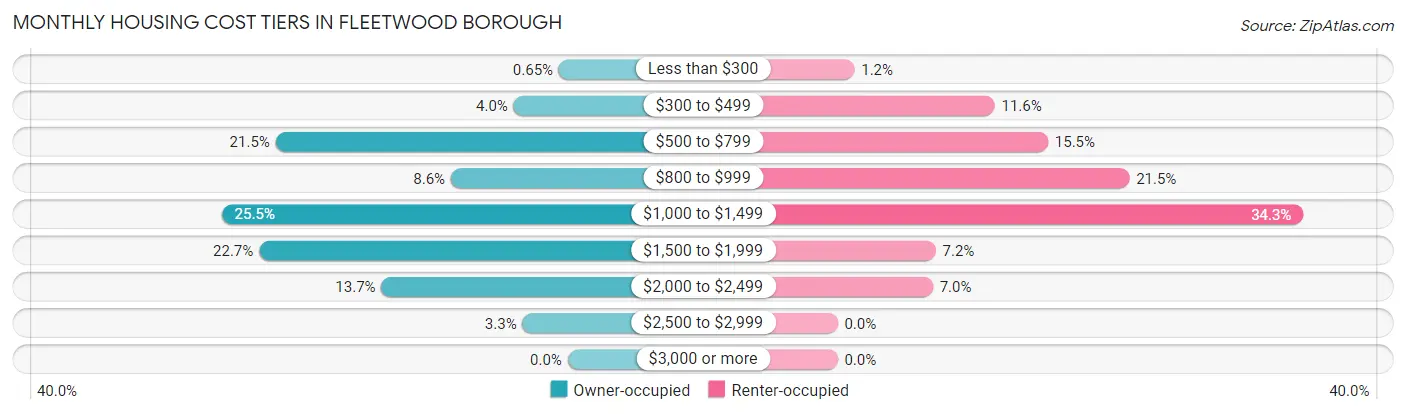
| Monthly Cost | Owner-occupied | Renter-occupied |
| Less than $300 | 8 (0.6%) | 6 (1.2%) |
| $300 to $499 | 49 (4.0%) | 56 (11.6%) |
| $500 to $799 | 265 (21.5%) | 75 (15.5%) |
| $800 to $999 | 106 (8.6%) | 104 (21.5%) |
| $1,000 to $1,499 | 314 (25.5%) | 166 (34.3%) |
| $1,500 to $1,999 | 280 (22.7%) | 35 (7.2%) |
| $2,000 to $2,499 | 169 (13.7%) | 34 (7.0%) |
| $2,500 to $2,999 | 41 (3.3%) | 0 (0.0%) |
| $3,000 or more | 0 (0.0%) | 0 (0.0%) |
| Total | 1,232 (100.0%) | 484 (100.0%) |
Physical Housing Characteristics in Fleetwood borough
Housing Structures in Fleetwood borough
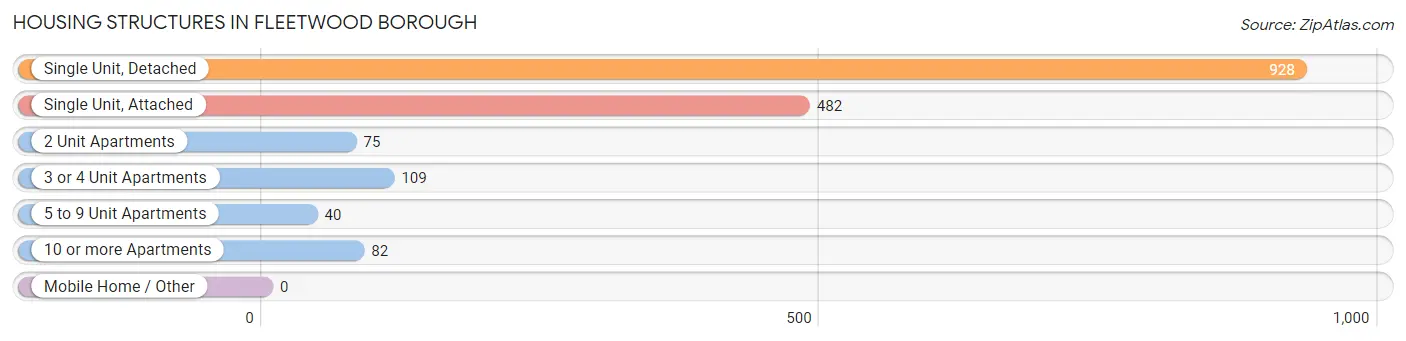
| Structure Type | # Housing Units | % Housing Units |
| Single Unit, Detached | 928 | 54.1% |
| Single Unit, Attached | 482 | 28.1% |
| 2 Unit Apartments | 75 | 4.4% |
| 3 or 4 Unit Apartments | 109 | 6.4% |
| 5 to 9 Unit Apartments | 40 | 2.3% |
| 10 or more Apartments | 82 | 4.8% |
| Mobile Home / Other | 0 | 0.0% |
| Total | 1,716 | 100.0% |
Housing Structures by Occupancy in Fleetwood borough
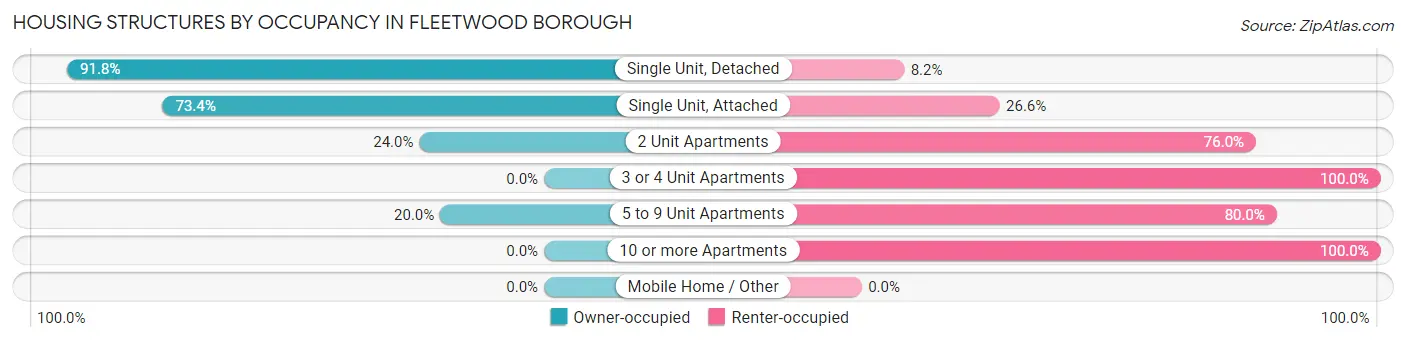
| Structure Type | Owner-occupied | Renter-occupied |
| Single Unit, Detached | 852 (91.8%) | 76 (8.2%) |
| Single Unit, Attached | 354 (73.4%) | 128 (26.6%) |
| 2 Unit Apartments | 18 (24.0%) | 57 (76.0%) |
| 3 or 4 Unit Apartments | 0 (0.0%) | 109 (100.0%) |
| 5 to 9 Unit Apartments | 8 (20.0%) | 32 (80.0%) |
| 10 or more Apartments | 0 (0.0%) | 82 (100.0%) |
| Mobile Home / Other | 0 (0.0%) | 0 (0.0%) |
| Total | 1,232 (71.8%) | 484 (28.2%) |
Housing Structures by Number of Rooms in Fleetwood borough
| Number of Rooms | Owner-occupied | Renter-occupied |
| 1 Room | 0 (0.0%) | 28 (5.8%) |
| 2 or 3 Rooms | 8 (0.6%) | 131 (27.1%) |
| 4 or 5 Rooms | 295 (23.9%) | 160 (33.1%) |
| 6 or 7 Rooms | 573 (46.5%) | 145 (30.0%) |
| 8 or more Rooms | 356 (28.9%) | 20 (4.1%) |
| Total | 1,232 (100.0%) | 484 (100.0%) |
Housing Structure by Heating Type in Fleetwood borough
| Heating Type | Owner-occupied | Renter-occupied |
| Utility Gas | 553 (44.9%) | 181 (37.4%) |
| Bottled, Tank, or LP Gas | 103 (8.4%) | 0 (0.0%) |
| Electricity | 154 (12.5%) | 250 (51.6%) |
| Fuel Oil or Kerosene | 394 (32.0%) | 53 (11.0%) |
| Coal or Coke | 0 (0.0%) | 0 (0.0%) |
| All other Fuels | 28 (2.3%) | 0 (0.0%) |
| No Fuel Used | 0 (0.0%) | 0 (0.0%) |
| Total | 1,232 (100.0%) | 484 (100.0%) |
Household Vehicle Usage in Fleetwood borough
| Vehicles per Household | Owner-occupied | Renter-occupied |
| No Vehicle | 24 (1.9%) | 44 (9.1%) |
| 1 Vehicle | 311 (25.2%) | 243 (50.2%) |
| 2 Vehicles | 631 (51.2%) | 120 (24.8%) |
| 3 or more Vehicles | 266 (21.6%) | 77 (15.9%) |
| Total | 1,232 (100.0%) | 484 (100.0%) |
Real Estate & Mortgages in Fleetwood borough
Real Estate and Mortgage Overview in Fleetwood borough
| Characteristic | Without Mortgage | With Mortgage |
| Housing Units | 401 | 831 |
| Median Property Value | $205,600 | $207,400 |
| Median Household Income | $59,137 | $108 |
| Monthly Housing Costs | $695 | $0 |
| Real Estate Taxes | $3,814 | $16 |
Property Value by Mortgage Status in Fleetwood borough
| Property Value | Without Mortgage | With Mortgage |
| Less than $50,000 | 0 (0.0%) | 0 (0.0%) |
| $50,000 to $99,999 | 23 (5.7%) | 47 (5.7%) |
| $100,000 to $299,999 | 324 (80.8%) | 716 (86.2%) |
| $300,000 to $499,999 | 54 (13.5%) | 68 (8.2%) |
| $500,000 to $749,999 | 0 (0.0%) | 0 (0.0%) |
| $750,000 to $999,999 | 0 (0.0%) | 0 (0.0%) |
| $1,000,000 or more | 0 (0.0%) | 0 (0.0%) |
| Total | 401 (100.0%) | 831 (100.0%) |
Household Income by Mortgage Status in Fleetwood borough

| Household Income | Without Mortgage | With Mortgage |
| Less than $10,000 | 16 (4.0%) | 97 (11.7%) |
| $10,000 to $24,999 | 17 (4.2%) | 10 (1.2%) |
| $25,000 to $34,999 | 76 (19.0%) | 19 (2.3%) |
| $35,000 to $49,999 | 51 (12.7%) | 0 (0.0%) |
| $50,000 to $74,999 | 103 (25.7%) | 81 (9.8%) |
| $75,000 to $99,999 | 34 (8.5%) | 113 (13.6%) |
| $100,000 to $149,999 | 38 (9.5%) | 141 (17.0%) |
| $150,000 or more | 66 (16.5%) | 359 (43.2%) |
| Total | 401 (100.0%) | 831 (100.0%) |
Property Value to Household Income Ratio in Fleetwood borough
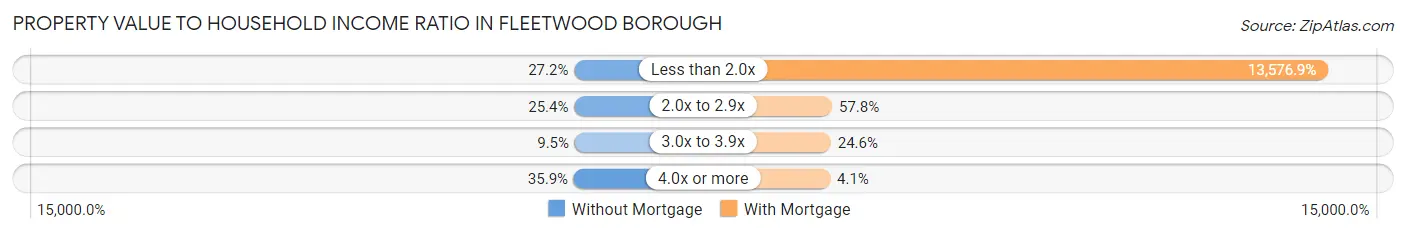
| Value-to-Income Ratio | Without Mortgage | With Mortgage |
| Less than 2.0x | 109 (27.2%) | 112,824 (13,576.9%) |
| 2.0x to 2.9x | 102 (25.4%) | 480 (57.8%) |
| 3.0x to 3.9x | 38 (9.5%) | 204 (24.5%) |
| 4.0x or more | 144 (35.9%) | 34 (4.1%) |
| Total | 401 (100.0%) | 831 (100.0%) |
Real Estate Taxes by Mortgage Status in Fleetwood borough
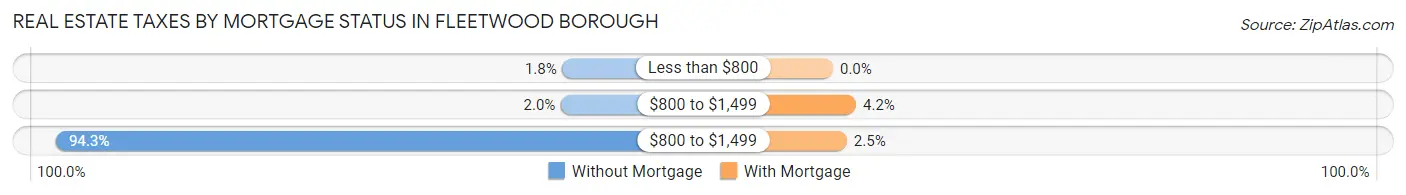
| Property Taxes | Without Mortgage | With Mortgage |
| Less than $800 | 7 (1.8%) | 0 (0.0%) |
| $800 to $1,499 | 8 (2.0%) | 35 (4.2%) |
| $800 to $1,499 | 378 (94.3%) | 21 (2.5%) |
| Total | 401 (100.0%) | 831 (100.0%) |
Health & Disability in Fleetwood borough
Health Insurance Coverage by Age in Fleetwood borough
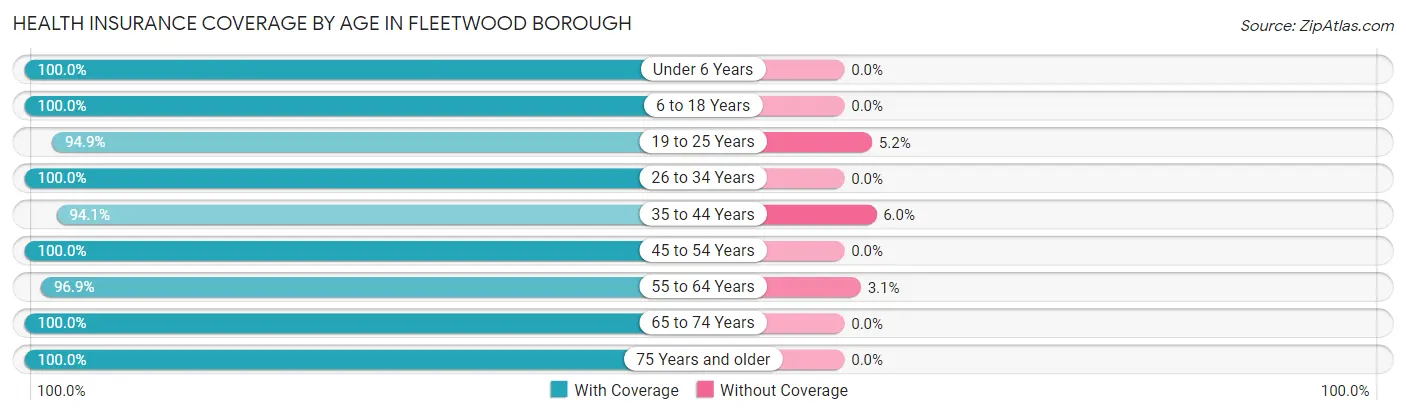
| Age Bracket | With Coverage | Without Coverage |
| Under 6 Years | 102 (100.0%) | 0 (0.0%) |
| 6 to 18 Years | 739 (100.0%) | 0 (0.0%) |
| 19 to 25 Years | 184 (94.9%) | 10 (5.1%) |
| 26 to 34 Years | 676 (100.0%) | 0 (0.0%) |
| 35 to 44 Years | 569 (94.1%) | 36 (5.9%) |
| 45 to 54 Years | 480 (100.0%) | 0 (0.0%) |
| 55 to 64 Years | 412 (96.9%) | 13 (3.1%) |
| 65 to 74 Years | 438 (100.0%) | 0 (0.0%) |
| 75 Years and older | 387 (100.0%) | 0 (0.0%) |
| Total | 3,987 (98.5%) | 59 (1.5%) |
Health Insurance Coverage by Citizenship Status in Fleetwood borough
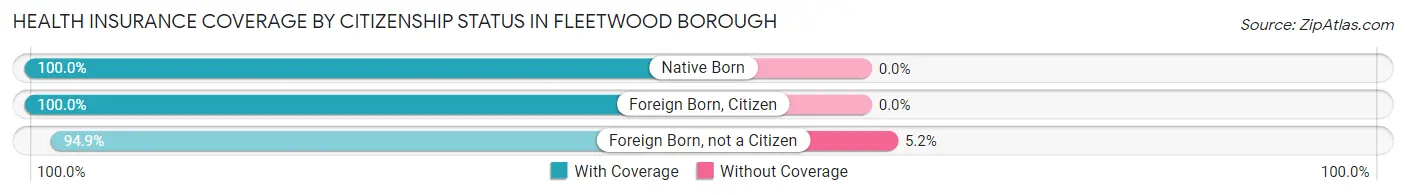
| Citizenship Status | With Coverage | Without Coverage |
| Native Born | 102 (100.0%) | 0 (0.0%) |
| Foreign Born, Citizen | 739 (100.0%) | 0 (0.0%) |
| Foreign Born, not a Citizen | 184 (94.9%) | 10 (5.1%) |
Health Insurance Coverage by Household Income in Fleetwood borough
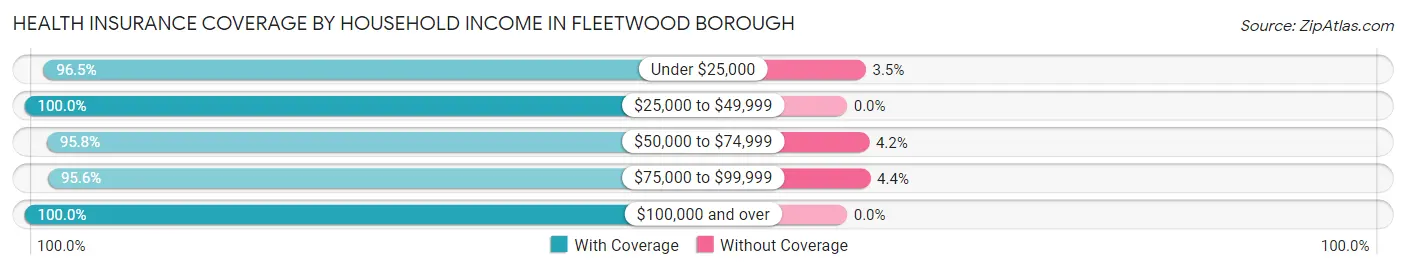
| Household Income | With Coverage | Without Coverage |
| Under $25,000 | 220 (96.5%) | 8 (3.5%) |
| $25,000 to $49,999 | 377 (100.0%) | 0 (0.0%) |
| $50,000 to $74,999 | 530 (95.8%) | 23 (4.2%) |
| $75,000 to $99,999 | 611 (95.6%) | 28 (4.4%) |
| $100,000 and over | 2,221 (100.0%) | 0 (0.0%) |
Public vs Private Health Insurance Coverage by Age in Fleetwood borough
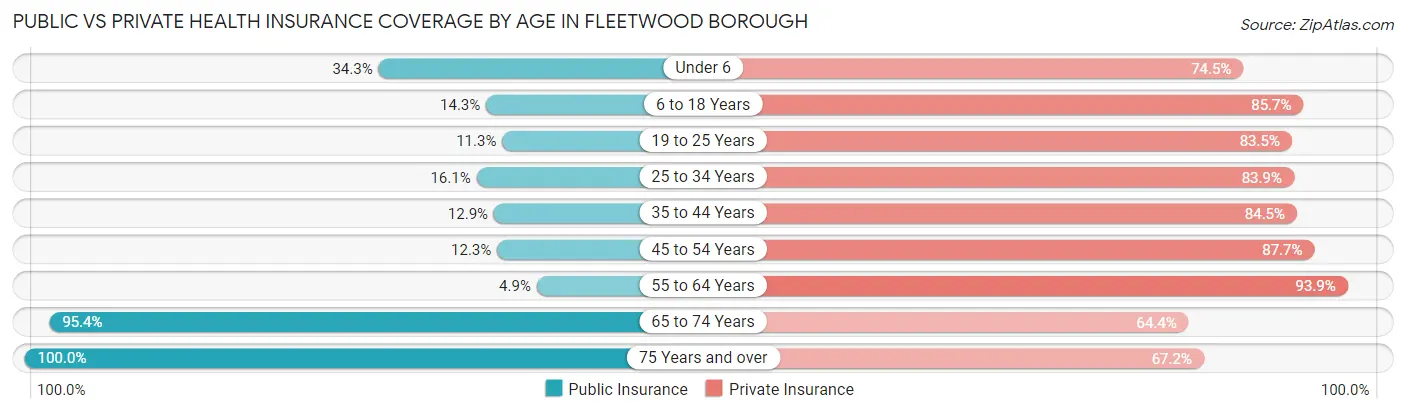
| Age Bracket | Public Insurance | Private Insurance |
| Under 6 | 35 (34.3%) | 76 (74.5%) |
| 6 to 18 Years | 106 (14.3%) | 633 (85.7%) |
| 19 to 25 Years | 22 (11.3%) | 162 (83.5%) |
| 25 to 34 Years | 109 (16.1%) | 567 (83.9%) |
| 35 to 44 Years | 78 (12.9%) | 511 (84.5%) |
| 45 to 54 Years | 59 (12.3%) | 421 (87.7%) |
| 55 to 64 Years | 21 (4.9%) | 399 (93.9%) |
| 65 to 74 Years | 418 (95.4%) | 282 (64.4%) |
| 75 Years and over | 387 (100.0%) | 260 (67.2%) |
| Total | 1,235 (30.5%) | 3,311 (81.8%) |
Disability Status by Sex by Age in Fleetwood borough
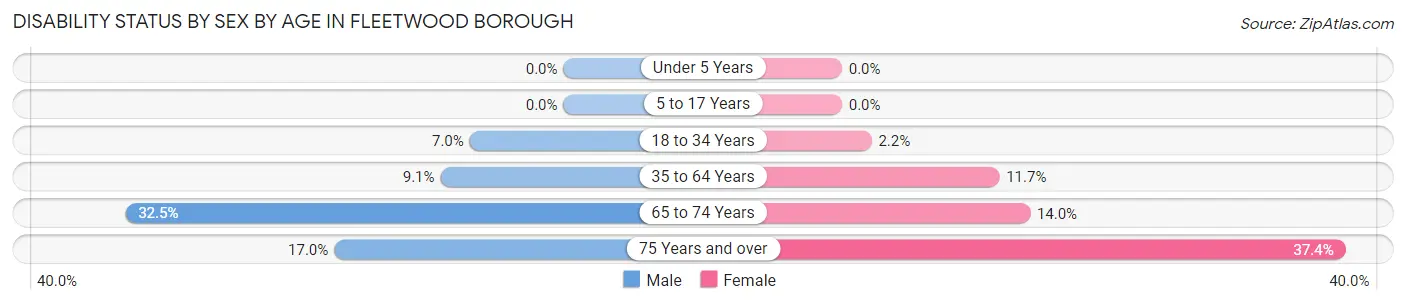
| Age Bracket | Male | Female |
| Under 5 Years | 0 (0.0%) | 0 (0.0%) |
| 5 to 17 Years | 0 (0.0%) | 0 (0.0%) |
| 18 to 34 Years | 39 (7.0%) | 8 (2.2%) |
| 35 to 64 Years | 66 (9.1%) | 92 (11.7%) |
| 65 to 74 Years | 54 (32.5%) | 38 (14.0%) |
| 75 Years and over | 24 (17.0%) | 92 (37.4%) |
Disability Class by Sex by Age in Fleetwood borough
Disability Class: Hearing Difficulty
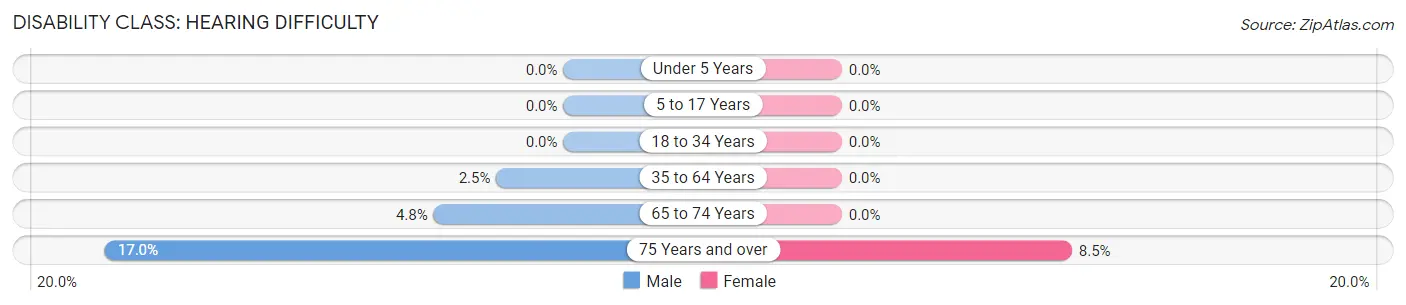
| Age Bracket | Male | Female |
| Under 5 Years | 0 (0.0%) | 0 (0.0%) |
| 5 to 17 Years | 0 (0.0%) | 0 (0.0%) |
| 18 to 34 Years | 0 (0.0%) | 0 (0.0%) |
| 35 to 64 Years | 18 (2.5%) | 0 (0.0%) |
| 65 to 74 Years | 8 (4.8%) | 0 (0.0%) |
| 75 Years and over | 24 (17.0%) | 21 (8.5%) |
Disability Class: Vision Difficulty
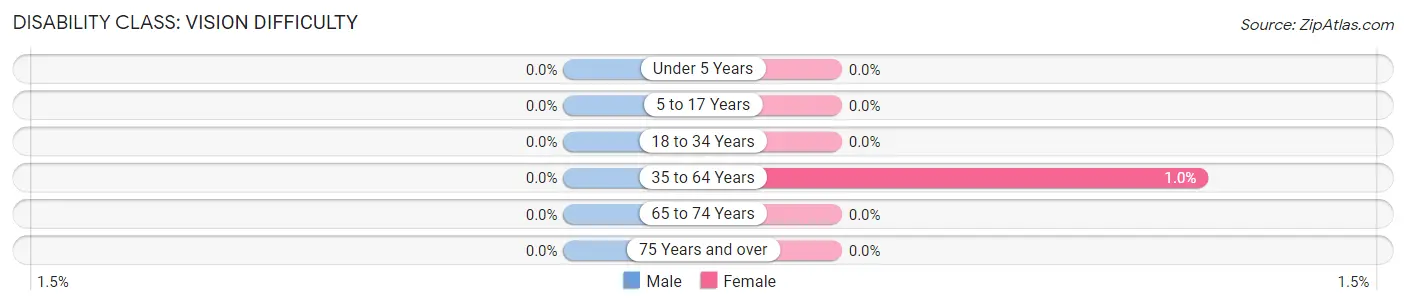
| Age Bracket | Male | Female |
| Under 5 Years | 0 (0.0%) | 0 (0.0%) |
| 5 to 17 Years | 0 (0.0%) | 0 (0.0%) |
| 18 to 34 Years | 0 (0.0%) | 0 (0.0%) |
| 35 to 64 Years | 0 (0.0%) | 8 (1.0%) |
| 65 to 74 Years | 0 (0.0%) | 0 (0.0%) |
| 75 Years and over | 0 (0.0%) | 0 (0.0%) |
Disability Class: Cognitive Difficulty
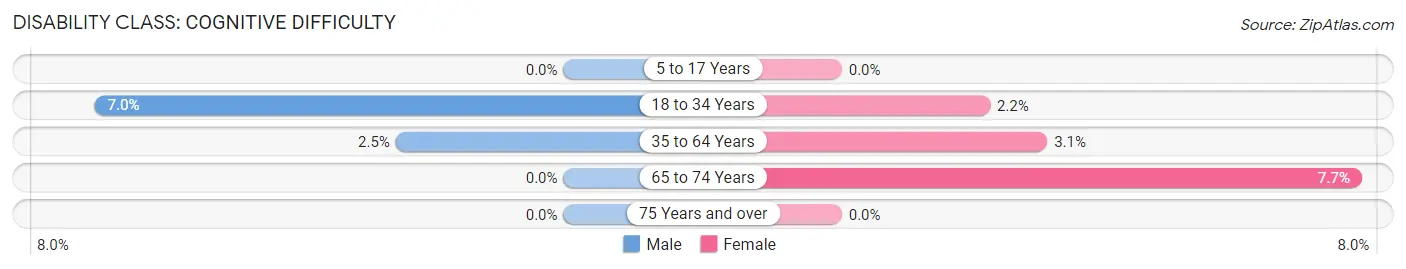
| Age Bracket | Male | Female |
| 5 to 17 Years | 0 (0.0%) | 0 (0.0%) |
| 18 to 34 Years | 39 (7.0%) | 8 (2.2%) |
| 35 to 64 Years | 18 (2.5%) | 24 (3.0%) |
| 65 to 74 Years | 0 (0.0%) | 21 (7.7%) |
| 75 Years and over | 0 (0.0%) | 0 (0.0%) |
Disability Class: Ambulatory Difficulty
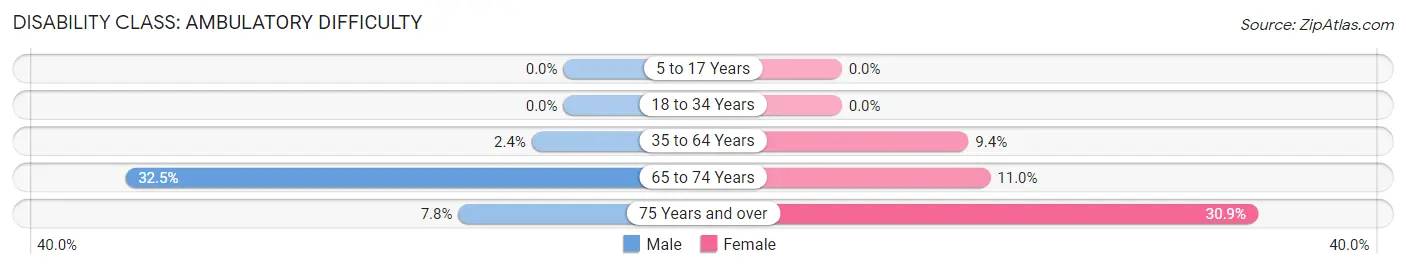
| Age Bracket | Male | Female |
| 5 to 17 Years | 0 (0.0%) | 0 (0.0%) |
| 18 to 34 Years | 0 (0.0%) | 0 (0.0%) |
| 35 to 64 Years | 17 (2.4%) | 74 (9.4%) |
| 65 to 74 Years | 54 (32.5%) | 30 (11.0%) |
| 75 Years and over | 11 (7.8%) | 76 (30.9%) |
Disability Class: Self-Care Difficulty
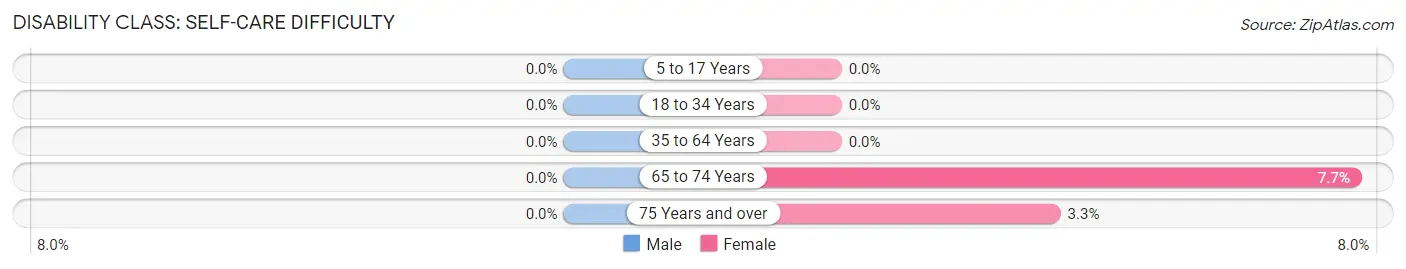
| Age Bracket | Male | Female |
| 5 to 17 Years | 0 (0.0%) | 0 (0.0%) |
| 18 to 34 Years | 0 (0.0%) | 0 (0.0%) |
| 35 to 64 Years | 0 (0.0%) | 0 (0.0%) |
| 65 to 74 Years | 0 (0.0%) | 21 (7.7%) |
| 75 Years and over | 0 (0.0%) | 8 (3.3%) |
Technology Access in Fleetwood borough
Computing Device Access in Fleetwood borough
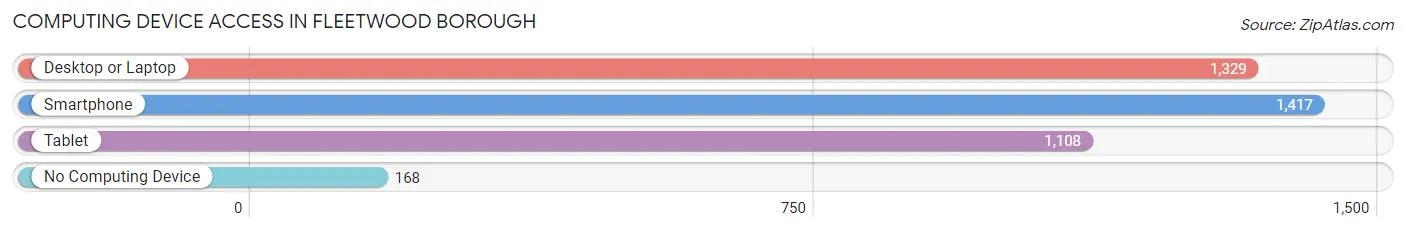
| Device Type | # Households | % Households |
| Desktop or Laptop | 1,329 | 77.4% |
| Smartphone | 1,417 | 82.6% |
| Tablet | 1,108 | 64.6% |
| No Computing Device | 168 | 9.8% |
| Total | 1,716 | 100.0% |
Internet Access in Fleetwood borough
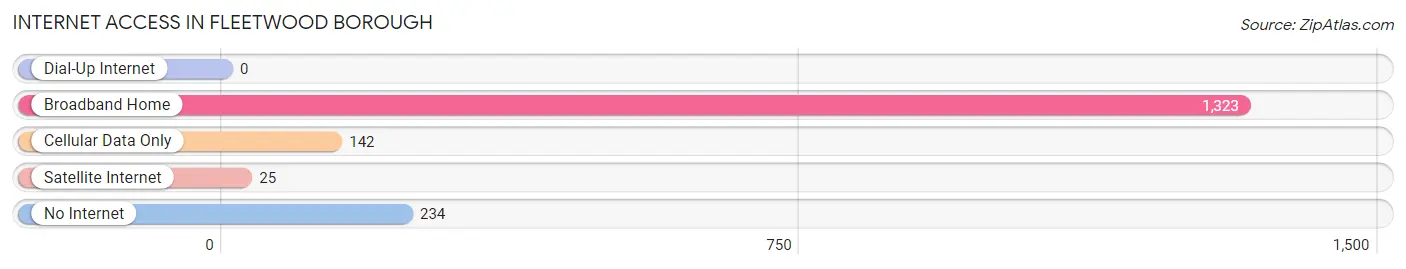
| Internet Type | # Households | % Households |
| Dial-Up Internet | 0 | 0.0% |
| Broadband Home | 1,323 | 77.1% |
| Cellular Data Only | 142 | 8.3% |
| Satellite Internet | 25 | 1.5% |
| No Internet | 234 | 13.6% |
| Total | 1,716 | 100.0% |
Fleetwood borough Summary
Fleetwood Borough is a small borough located in Berks County, Pennsylvania. It is situated in the southeastern corner of the county, just north of the city of Reading. The borough is home to a population of approximately 4,000 people, and is part of the Reading Metropolitan Statistical Area.
Geography
Fleetwood Borough is located at 40°24'45" North, 75°55'45" West (40.412500, -75.929167). It is situated in the southeastern corner of Berks County, just north of the city of Reading. The borough is bordered by Richmond Township to the north, Maidencreek Township to the east, and Ontelaunee Township to the south and west. The borough covers an area of 1.2 square miles, all of which is land.
The borough is located in the Schuylkill River watershed. The Schuylkill River forms the western boundary of the borough, and the Maiden Creek forms the eastern boundary. The borough is located in the Piedmont region of Pennsylvania, and is characterized by rolling hills and valleys.
Demographics
As of the 2010 census, there were 4,085 people, 1,619 households, and 1,093 families residing in the borough. The population density was 3,400.2 people per square mile (1,312.2/km2). There were 1,717 housing units at an average density of 1,427.2 per square mile (551.3/km2). The racial makeup of the borough was 97.2% White, 0.7% African American, 0.2% Native American, 0.5% Asian, 0.2% from other races, and 1.2% from two or more races. Hispanic or Latino of any race were 1.2% of the population.
There were 1,619 households, out of which 32.2% had children under the age of 18 living with them, 51.2% were married couples living together, 11.2% had a female householder with no husband present, and 32.7% were non-families. 28.2% of all households were made up of individuals, and 13.2% had someone living alone who was 65 years of age or older. The average household size was 2.50 and the average family size was 3.09.
In the borough, the population was spread out, with 25.2% under the age of 18, 7.2% from 18 to 24, 30.2% from 25 to 44, 21.2% from 45 to 64, and 16.2% who were 65 years of age or older. The median age was 38 years. For every 100 females, there were 92.2 males. For every 100 females age 18 and over, there were 88.2 males.
The median income for a household in the borough was $45,000, and the median income for a family was $51,250. Males had a median income of $37,500 versus $25,000 for females. The per capita income for the borough was $20,945. About 4.2% of families and 5.7% of the population were below the poverty line, including 6.2% of those under age 18 and 6.2% of those age 65 or over.
Economy
Fleetwood Borough is a small, rural community with a largely agricultural economy. The borough is home to several small businesses, including a few restaurants, a grocery store, and a few retail stores. The borough is also home to a few manufacturing companies, including a plastics manufacturer and a metal fabrication company.
The borough is served by the Reading Area Community College, which offers a variety of educational and vocational programs. The college also serves as a hub for the local economy, providing a variety of services to local businesses and residents.
The borough is also home to a few small parks and recreational areas, including a public pool, a skate park, and a few playgrounds. The borough also hosts a variety of community events throughout the year, including a summer concert series and a holiday parade.
Conclusion
Fleetwood Borough is a small borough located in Berks County, Pennsylvania. It is situated in the southeastern corner of the county, just north of the city of Reading. The borough is home to a population of approximately 4,000 people, and is part of the Reading Metropolitan Statistical Area. The borough is characterized by rolling hills and valleys, and is located in the Schuylkill River watershed. The borough has a largely agricultural economy, and is home to a few small businesses, a community college, and a variety of parks and recreational areas.
Common Questions
What is Per Capita Income in Fleetwood borough?
Per Capita income in Fleetwood borough is $42,163.
What is the Median Family Income in Fleetwood borough?
Median Family Income in Fleetwood borough is $92,656.
What is the Median Household income in Fleetwood borough?
Median Household Income in Fleetwood borough is $82,444.
What is Income or Wage Gap in Fleetwood borough?
Income or Wage Gap in Fleetwood borough is 16.2%.
Women in Fleetwood borough earn 83.8 cents for every dollar earned by a man.
What is Inequality or Gini Index in Fleetwood borough?
Inequality or Gini Index in Fleetwood borough is 0.40.
What is the Total Population of Fleetwood borough?
Total Population of Fleetwood borough is 4,046.
What is the Total Male Population of Fleetwood borough?
Total Male Population of Fleetwood borough is 2,113.
What is the Total Female Population of Fleetwood borough?
Total Female Population of Fleetwood borough is 1,933.
What is the Ratio of Males per 100 Females in Fleetwood borough?
There are 109.31 Males per 100 Females in Fleetwood borough.
What is the Ratio of Females per 100 Males in Fleetwood borough?
There are 91.48 Females per 100 Males in Fleetwood borough.
What is the Median Population Age in Fleetwood borough?
Median Population Age in Fleetwood borough is 38.9 Years.
What is the Average Family Size in Fleetwood borough
Average Family Size in Fleetwood borough is 2.8 People.
What is the Average Household Size in Fleetwood borough
Average Household Size in Fleetwood borough is 2.3 People.
How Large is the Labor Force in Fleetwood borough?
There are 2,408 People in the Labor Forcein in Fleetwood borough.
What is the Percentage of People in the Labor Force in Fleetwood borough?
70.6% of People are in the Labor Force in Fleetwood borough.
What is the Unemployment Rate in Fleetwood borough?
Unemployment Rate in Fleetwood borough is 2.7%.