Blakely borough, PA Map & Demographics
Blakely borough Overview
$34,493
PER CAPITA INCOME
$81,768
AVG FAMILY INCOME
$62,065
AVG HOUSEHOLD INCOME
24.9%
WAGE / INCOME GAP [ % ]
75.1¢/ $1
WAGE / INCOME GAP [ $ ]
0.38
INEQUALITY / GINI INDEX
6,646
TOTAL POPULATION
2,814
MALE POPULATION
3,832
FEMALE POPULATION
73.43
MALES / 100 FEMALES
136.18
FEMALES / 100 MALES
52.8
MEDIAN AGE
2.8
AVG FAMILY SIZE
2.1
AVG HOUSEHOLD SIZE
3,276
LABOR FORCE [ PEOPLE ]
58.3%
PERCENT IN LABOR FORCE
3.5%
UNEMPLOYMENT RATE
Income in Blakely borough
Income Overview in Blakely borough
Per Capita Income in Blakely borough is $34,493, while median incomes of families and households are $81,768 and $62,065 respectively.
| Characteristic | Number | Measure |
| Per Capita Income | 6,646 | $34,493 |
| Median Family Income | 1,732 | $81,768 |
| Mean Family Income | 1,732 | $91,294 |
| Median Household Income | 3,009 | $62,065 |
| Mean Household Income | 3,009 | $73,253 |
| Income Deficit | 1,732 | $0 |
| Wage / Income Gap (%) | 6,646 | 24.86% |
| Wage / Income Gap ($) | 6,646 | 75.14¢ per $1 |
| Gini / Inequality Index | 6,646 | 0.38 |
Earnings by Sex in Blakely borough
Average Earnings in Blakely borough are $45,250, $47,234 for men and $35,491 for women, a difference of 24.9%.
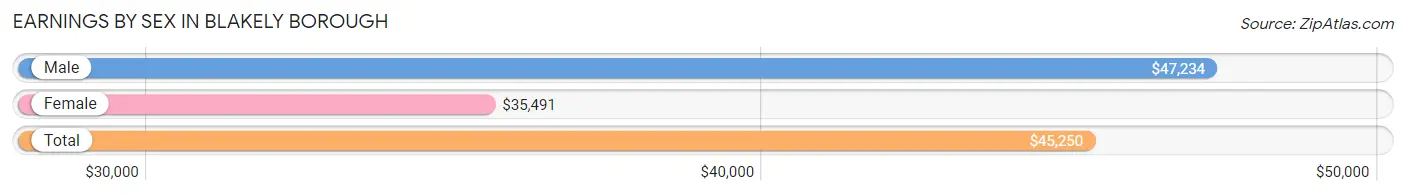
| Sex | Number | Average Earnings |
| Male | 1,693 (51.6%) | $47,234 |
| Female | 1,586 (48.4%) | $35,491 |
| Total | 3,279 (100.0%) | $45,250 |
Earnings by Sex by Income Bracket in Blakely borough
The most common earnings brackets in Blakely borough are $55,000 to $64,999 for men (243 | 14.3%) and $75,000 to $99,999 for women (198 | 12.5%).
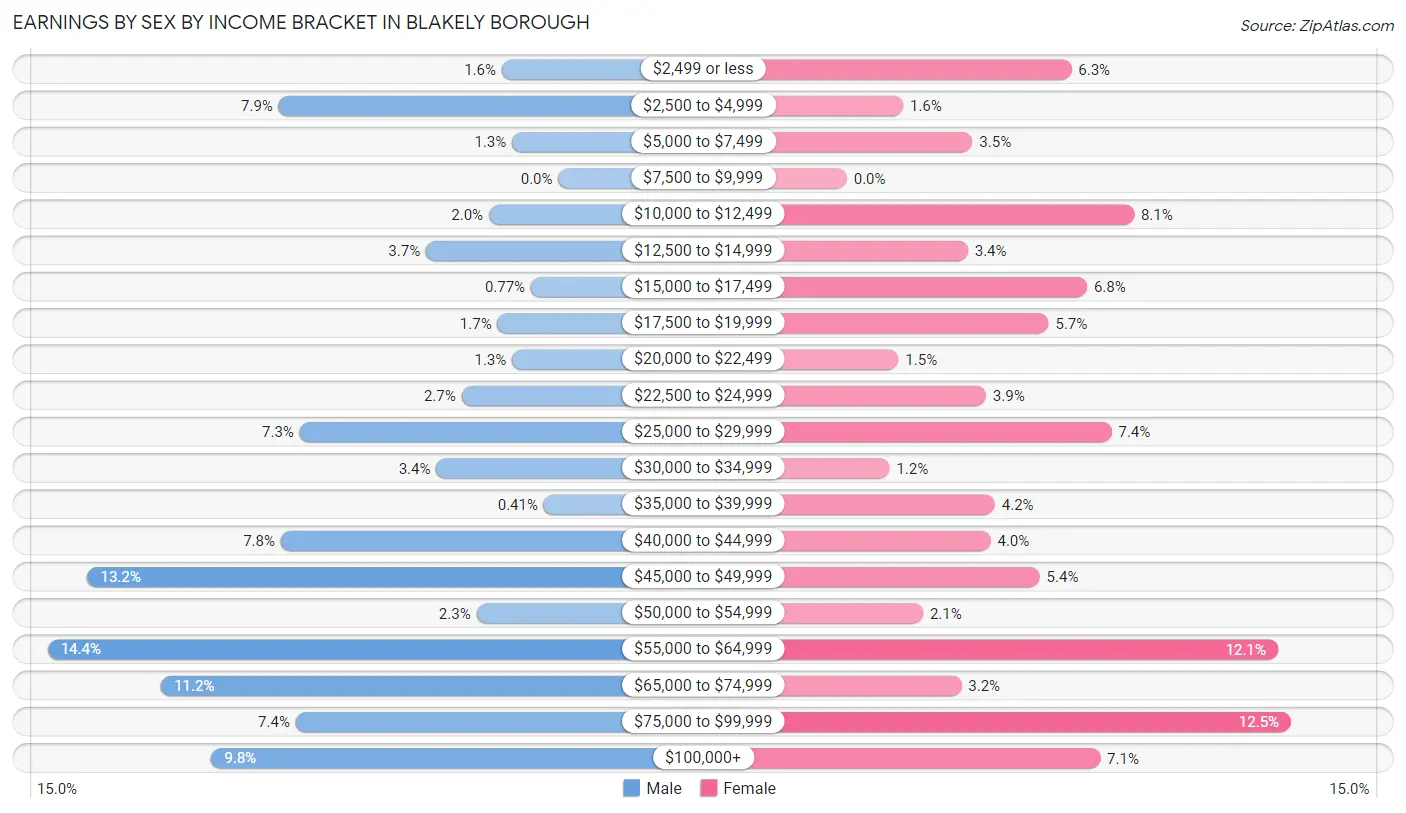
| Income | Male | Female |
| $2,499 or less | 27 (1.6%) | 100 (6.3%) |
| $2,500 to $4,999 | 133 (7.9%) | 25 (1.6%) |
| $5,000 to $7,499 | 22 (1.3%) | 56 (3.5%) |
| $7,500 to $9,999 | 0 (0.0%) | 0 (0.0%) |
| $10,000 to $12,499 | 33 (1.9%) | 128 (8.1%) |
| $12,500 to $14,999 | 63 (3.7%) | 54 (3.4%) |
| $15,000 to $17,499 | 13 (0.8%) | 107 (6.8%) |
| $17,500 to $19,999 | 29 (1.7%) | 90 (5.7%) |
| $20,000 to $22,499 | 22 (1.3%) | 23 (1.5%) |
| $22,500 to $24,999 | 46 (2.7%) | 62 (3.9%) |
| $25,000 to $29,999 | 123 (7.3%) | 118 (7.4%) |
| $30,000 to $34,999 | 58 (3.4%) | 19 (1.2%) |
| $35,000 to $39,999 | 7 (0.4%) | 66 (4.2%) |
| $40,000 to $44,999 | 132 (7.8%) | 64 (4.0%) |
| $45,000 to $49,999 | 224 (13.2%) | 86 (5.4%) |
| $50,000 to $54,999 | 39 (2.3%) | 34 (2.1%) |
| $55,000 to $64,999 | 243 (14.3%) | 192 (12.1%) |
| $65,000 to $74,999 | 189 (11.2%) | 51 (3.2%) |
| $75,000 to $99,999 | 125 (7.4%) | 198 (12.5%) |
| $100,000+ | 165 (9.8%) | 113 (7.1%) |
| Total | 1,693 (100.0%) | 1,586 (100.0%) |
Earnings by Sex by Educational Attainment in Blakely borough
Average earnings in Blakely borough are $49,076 for men and $41,364 for women, a difference of 15.7%. Men with an educational attainment of bachelor's degree enjoy the highest average annual earnings of $58,853, while those with high school diploma education earn the least with $41,830. Women with an educational attainment of graduate degree earn the most with the average annual earnings of $95,686, while those with high school diploma education have the smallest earnings of $19,193.
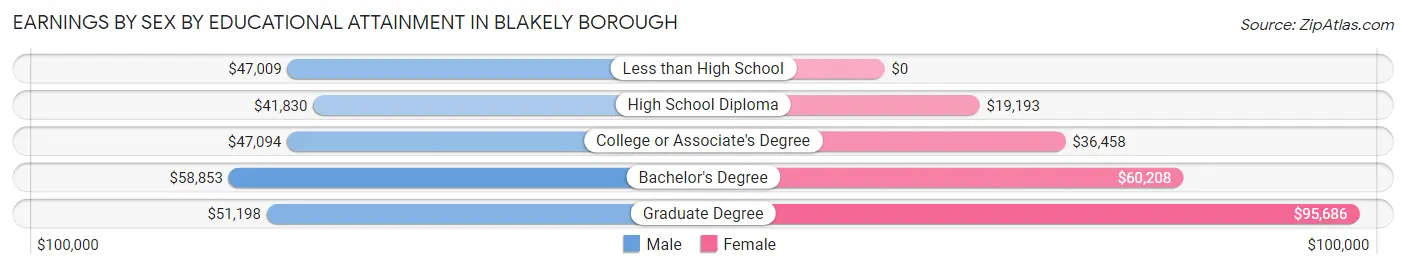
| Educational Attainment | Male Income | Female Income |
| Less than High School | $47,009 | $0 |
| High School Diploma | $41,830 | $19,193 |
| College or Associate's Degree | $47,094 | $36,458 |
| Bachelor's Degree | $58,853 | $60,208 |
| Graduate Degree | $51,198 | $95,686 |
| Total | $49,076 | $41,364 |
Family Income in Blakely borough
Family Income Brackets in Blakely borough
According to the Blakely borough family income data, there are 487 families falling into the $50,000 to $74,999 income range, which is the most common income bracket and makes up 28.1% of all families.
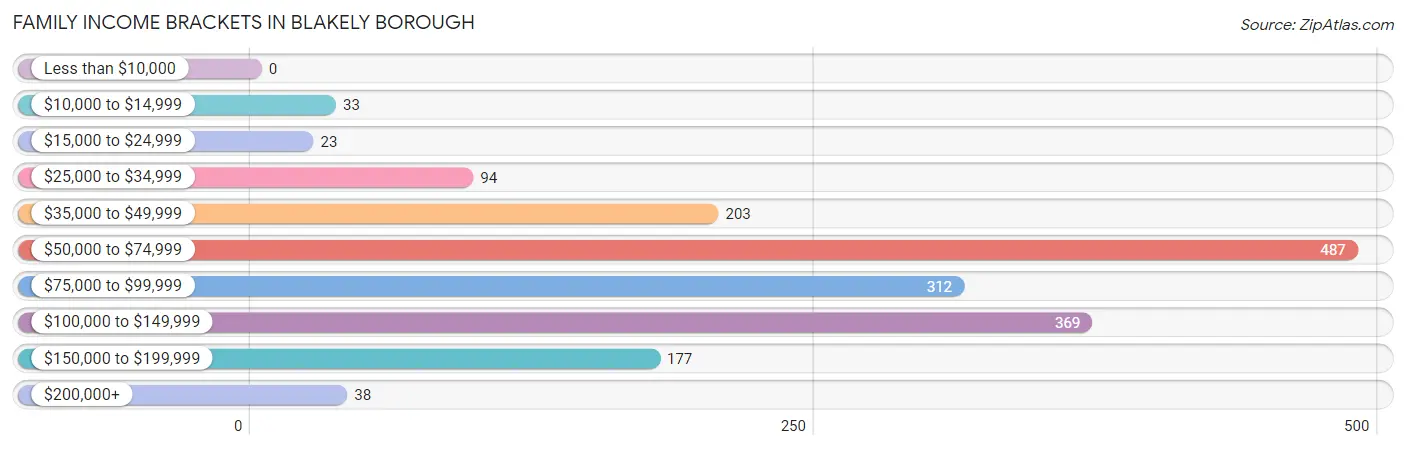
| Income Bracket | # Families | % Families |
| Less than $10,000 | 0 | 0.0% |
| $10,000 to $14,999 | 33 | 1.9% |
| $15,000 to $24,999 | 23 | 1.3% |
| $25,000 to $34,999 | 94 | 5.4% |
| $35,000 to $49,999 | 203 | 11.7% |
| $50,000 to $74,999 | 487 | 28.1% |
| $75,000 to $99,999 | 312 | 18.0% |
| $100,000 to $149,999 | 369 | 21.3% |
| $150,000 to $199,999 | 177 | 10.2% |
| $200,000+ | 38 | 2.2% |
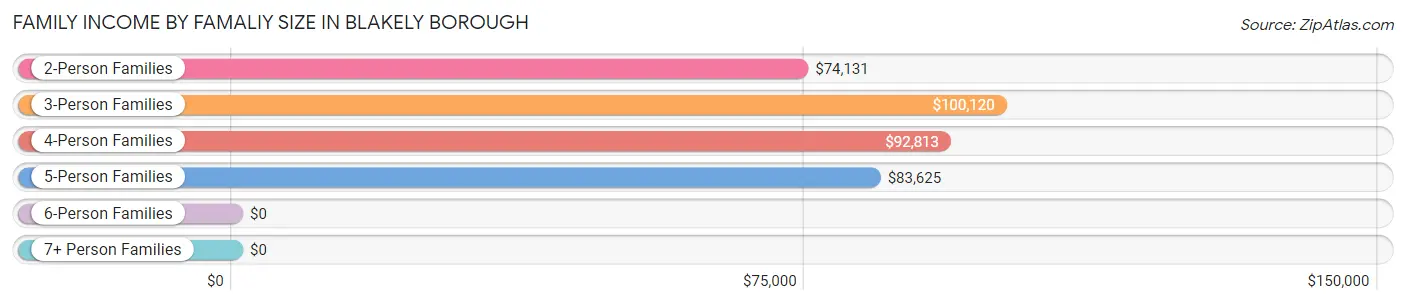
Family Income by Famaliy Size in Blakely borough
3-person families (385 | 22.2%) account for the highest median family income in Blakely borough with $100,120 per family, while 2-person families (1,013 | 58.5%) have the highest median income of $37,066 per family member.
| Income Bracket | # Families | Median Income |
| 2-Person Families | 1,013 (58.5%) | $74,131 |
| 3-Person Families | 385 (22.2%) | $100,120 |
| 4-Person Families | 228 (13.2%) | $92,813 |
| 5-Person Families | 39 (2.2%) | $83,625 |
| 6-Person Families | 67 (3.9%) | $0 |
| 7+ Person Families | 0 (0.0%) | $0 |
| Total | 1,732 (100.0%) | $81,768 |
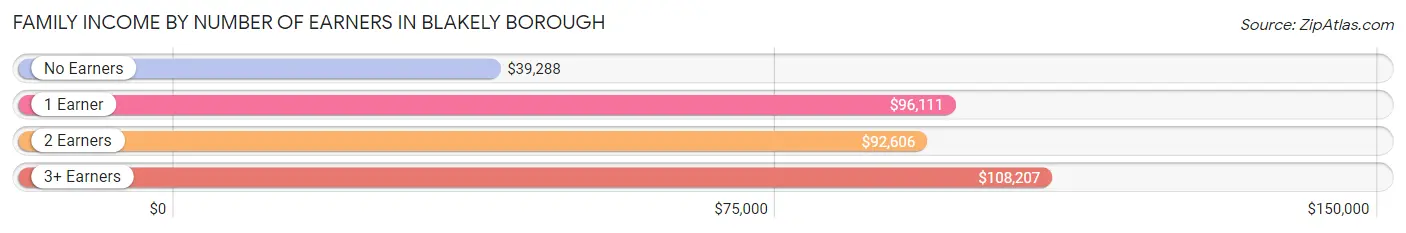
Family Income by Number of Earners in Blakely borough
The median family income in Blakely borough is $81,768, with families comprising 3+ earners (171) having the highest median family income of $108,207, while families with no earners (381) have the lowest median family income of $39,288, accounting for 9.9% and 22.0% of families, respectively.
| Number of Earners | # Families | Median Income |
| No Earners | 381 (22.0%) | $39,288 |
| 1 Earner | 498 (28.7%) | $96,111 |
| 2 Earners | 682 (39.4%) | $92,606 |
| 3+ Earners | 171 (9.9%) | $108,207 |
| Total | 1,732 (100.0%) | $81,768 |
Household Income in Blakely borough
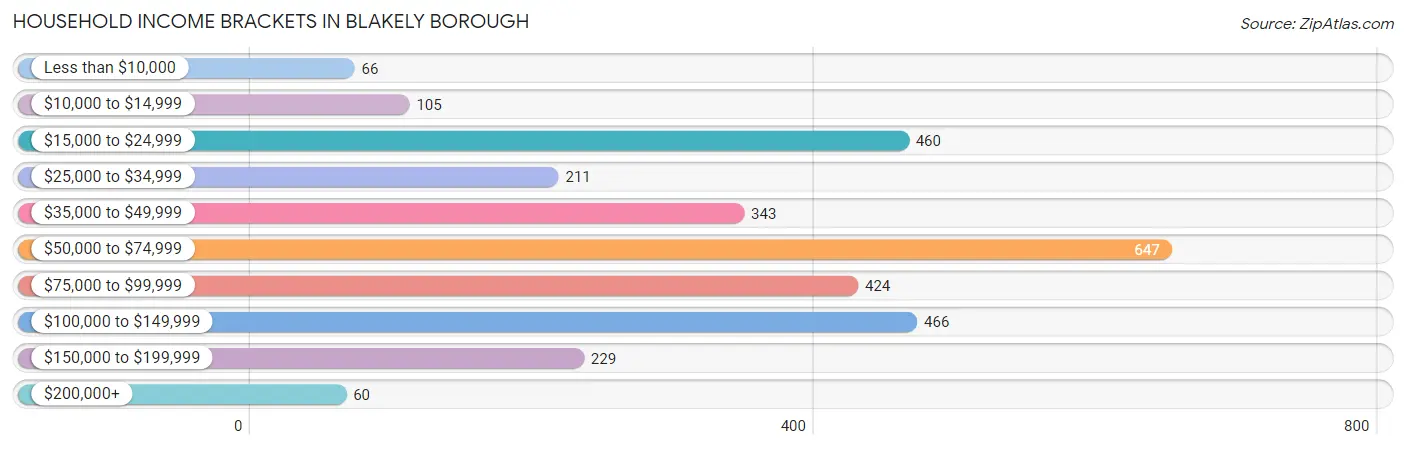
Household Income Brackets in Blakely borough
With 647 households falling in the category, the $50,000 to $74,999 income range is the most frequent in Blakely borough, accounting for 21.5% of all households. In contrast, only 60 households (2.0%) fall into the $200,000+ income bracket, making it the least populous group.
| Income Bracket | # Households | % Households |
| Less than $10,000 | 66 | 2.2% |
| $10,000 to $14,999 | 105 | 3.5% |
| $15,000 to $24,999 | 460 | 15.3% |
| $25,000 to $34,999 | 211 | 7.0% |
| $35,000 to $49,999 | 343 | 11.4% |
| $50,000 to $74,999 | 647 | 21.5% |
| $75,000 to $99,999 | 424 | 14.1% |
| $100,000 to $149,999 | 466 | 15.5% |
| $150,000 to $199,999 | 229 | 7.6% |
| $200,000+ | 60 | 2.0% |
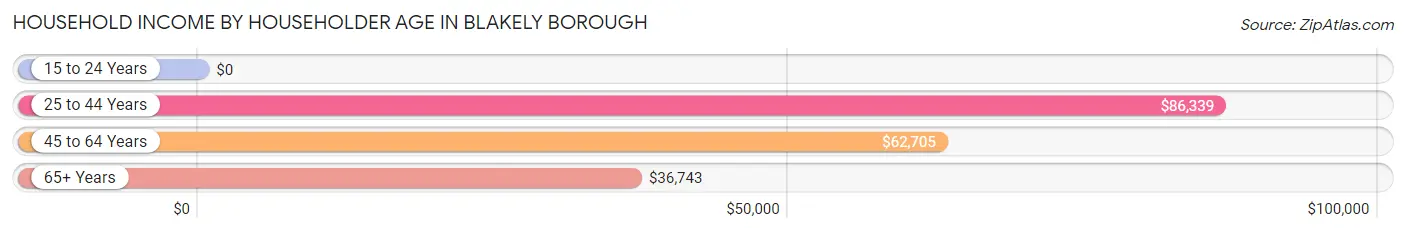
Household Income by Householder Age in Blakely borough
The median household income in Blakely borough is $62,065, with the highest median household income of $86,339 found in the 25 to 44 years age bracket for the primary householder. A total of 735 households (24.4%) fall into this category. Meanwhile, the 15 to 24 years age bracket for the primary householder has the lowest median household income of $0, with 30 households (1.0%) in this group.
| Income Bracket | # Households | Median Income |
| 15 to 24 Years | 30 (1.0%) | $0 |
| 25 to 44 Years | 735 (24.4%) | $86,339 |
| 45 to 64 Years | 953 (31.7%) | $62,705 |
| 65+ Years | 1,291 (42.9%) | $36,743 |
| Total | 3,009 (100.0%) | $62,065 |
Poverty in Blakely borough
Income Below Poverty by Sex and Age in Blakely borough
With 3.2% poverty level for males and 9.0% for females among the residents of Blakely borough, 25 to 34 year old males and 18 to 24 year old females are the most vulnerable to poverty, with 20 males (9.8%) and 76 females (35.3%) in their respective age groups living below the poverty level.
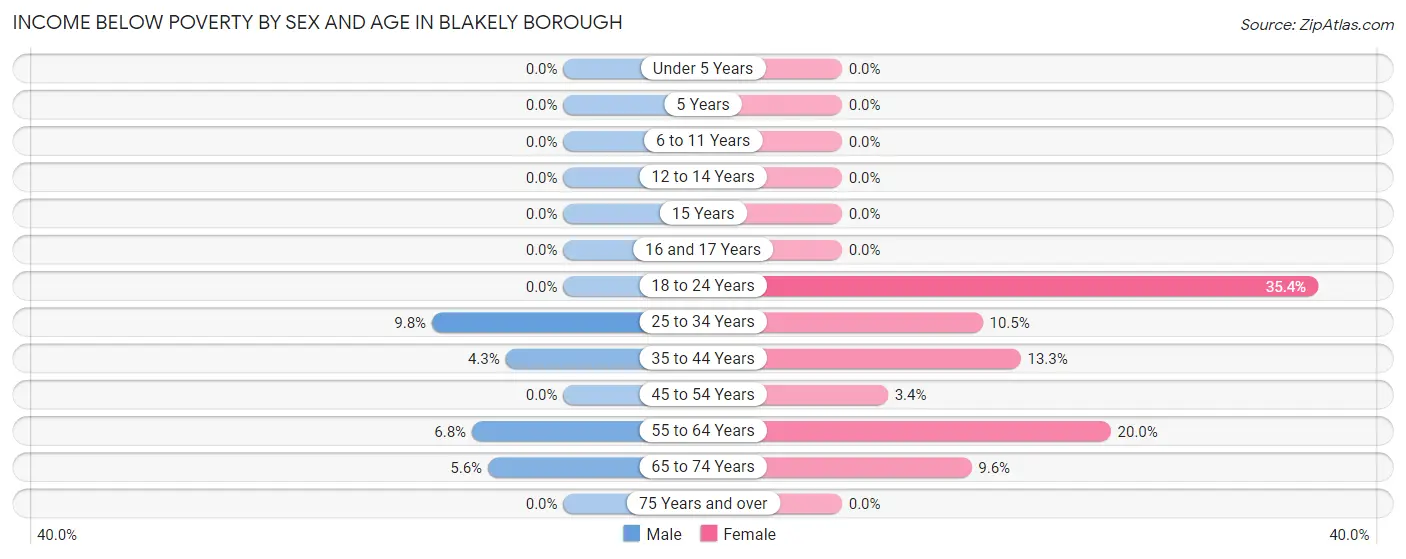
| Age Bracket | Male | Female |
| Under 5 Years | 0 (0.0%) | 0 (0.0%) |
| 5 Years | 0 (0.0%) | 0 (0.0%) |
| 6 to 11 Years | 0 (0.0%) | 0 (0.0%) |
| 12 to 14 Years | 0 (0.0%) | 0 (0.0%) |
| 15 Years | 0 (0.0%) | 0 (0.0%) |
| 16 and 17 Years | 0 (0.0%) | 0 (0.0%) |
| 18 to 24 Years | 0 (0.0%) | 76 (35.3%) |
| 25 to 34 Years | 20 (9.8%) | 28 (10.4%) |
| 35 to 44 Years | 15 (4.3%) | 67 (13.3%) |
| 45 to 54 Years | 0 (0.0%) | 14 (3.4%) |
| 55 to 64 Years | 33 (6.8%) | 96 (20.0%) |
| 65 to 74 Years | 21 (5.6%) | 40 (9.6%) |
| 75 Years and over | 0 (0.0%) | 0 (0.0%) |
| Total | 89 (3.2%) | 321 (9.0%) |
Income Above Poverty by Sex and Age in Blakely borough
According to the poverty statistics in Blakely borough, males aged under 5 years and females aged under 5 years are the age groups that are most secure financially, with 100.0% of males and 100.0% of females in these age groups living above the poverty line.
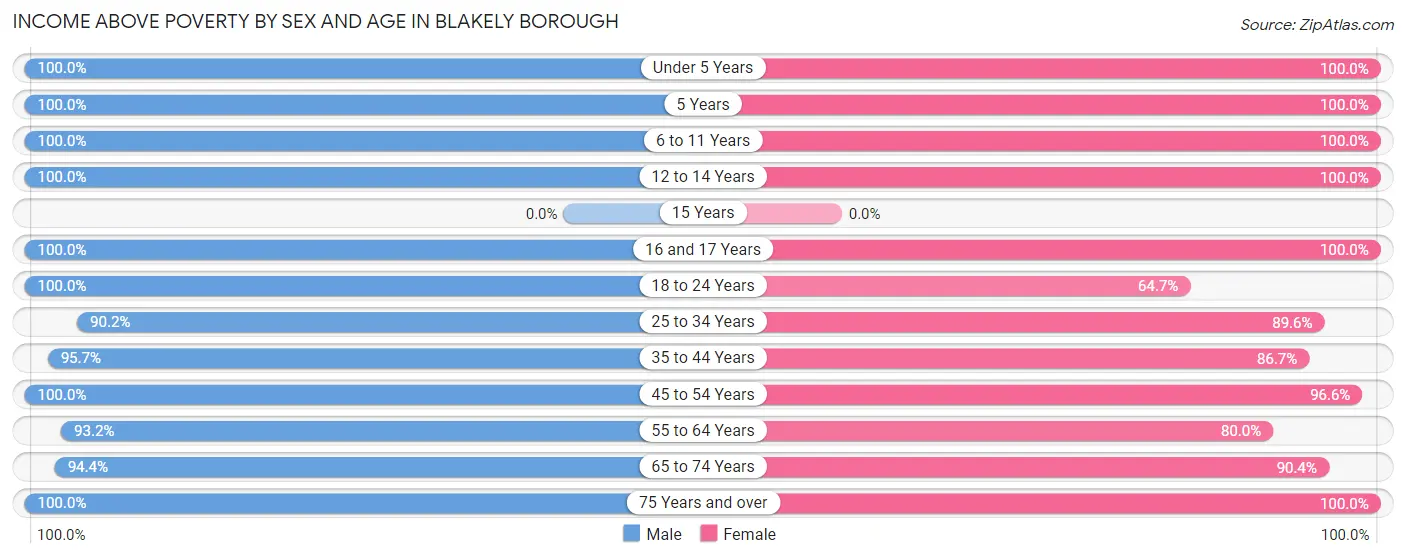
| Age Bracket | Male | Female |
| Under 5 Years | 180 (100.0%) | 107 (100.0%) |
| 5 Years | 95 (100.0%) | 11 (100.0%) |
| 6 to 11 Years | 183 (100.0%) | 204 (100.0%) |
| 12 to 14 Years | 102 (100.0%) | 132 (100.0%) |
| 15 Years | 0 (0.0%) | 0 (0.0%) |
| 16 and 17 Years | 27 (100.0%) | 91 (100.0%) |
| 18 to 24 Years | 93 (100.0%) | 139 (64.6%) |
| 25 to 34 Years | 185 (90.2%) | 240 (89.5%) |
| 35 to 44 Years | 335 (95.7%) | 438 (86.7%) |
| 45 to 54 Years | 365 (100.0%) | 397 (96.6%) |
| 55 to 64 Years | 453 (93.2%) | 385 (80.0%) |
| 65 to 74 Years | 354 (94.4%) | 376 (90.4%) |
| 75 Years and over | 316 (100.0%) | 730 (100.0%) |
| Total | 2,688 (96.8%) | 3,250 (91.0%) |
Income Below Poverty Among Married-Couple Families in Blakely borough
The poverty statistics for married-couple families in Blakely borough show that 2.7% or 33 of the total 1,224 families live below the poverty line. Families with no children have the highest poverty rate of 3.5%, comprising of 33 families. On the other hand, families with 1 or 2 children have the lowest poverty rate of 0.0%, which includes 0 families.
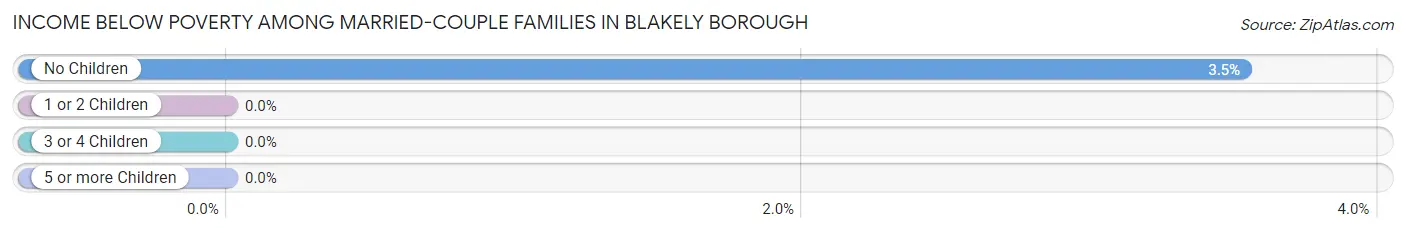
| Children | Above Poverty | Below Poverty |
| No Children | 901 (96.5%) | 33 (3.5%) |
| 1 or 2 Children | 199 (100.0%) | 0 (0.0%) |
| 3 or 4 Children | 91 (100.0%) | 0 (0.0%) |
| 5 or more Children | 0 (0.0%) | 0 (0.0%) |
| Total | 1,191 (97.3%) | 33 (2.7%) |
Income Below Poverty Among Single-Parent Households in Blakely borough
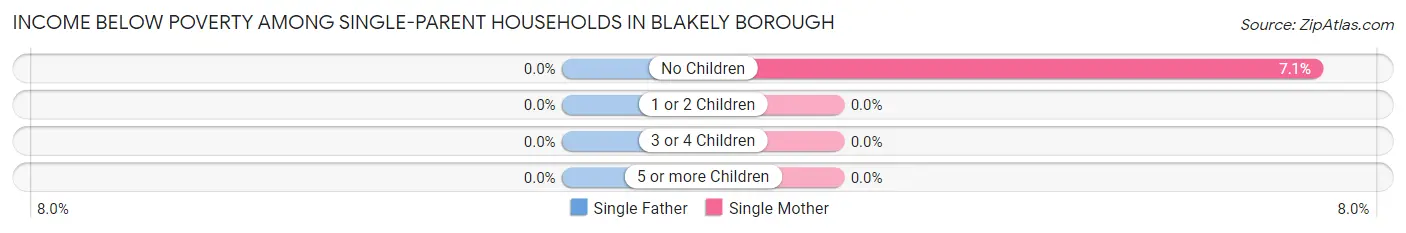
| Children | Single Father | Single Mother |
| No Children | 0 (0.0%) | 9 (7.1%) |
| 1 or 2 Children | 0 (0.0%) | 0 (0.0%) |
| 3 or 4 Children | 0 (0.0%) | 0 (0.0%) |
| 5 or more Children | 0 (0.0%) | 0 (0.0%) |
| Total | 0 (0.0%) | 9 (3.5%) |
Income Below Poverty Among Married-Couple vs Single-Parent Households in Blakely borough
The poverty data for Blakely borough shows that 33 of the married-couple family households (2.7%) and 9 of the single-parent households (1.8%) are living below the poverty level. Within the married-couple family households, those with no children have the highest poverty rate, with 33 households (3.5%) falling below the poverty line. Among the single-parent households, those with no children have the highest poverty rate, with 9 household (3.6%) living below poverty.
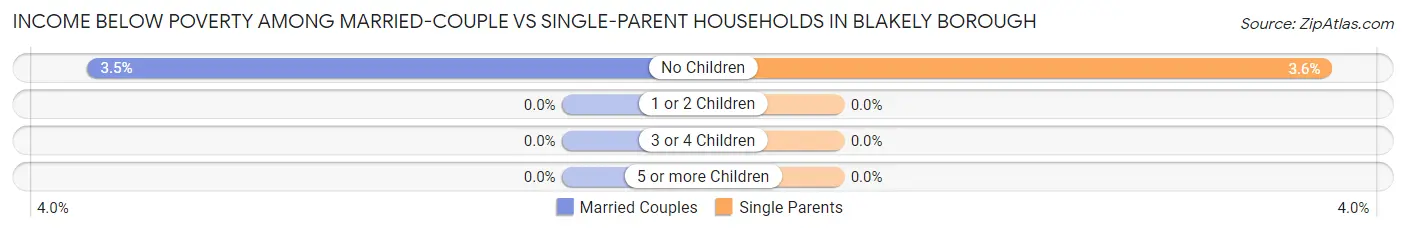
| Children | Married-Couple Families | Single-Parent Households |
| No Children | 33 (3.5%) | 9 (3.6%) |
| 1 or 2 Children | 0 (0.0%) | 0 (0.0%) |
| 3 or 4 Children | 0 (0.0%) | 0 (0.0%) |
| 5 or more Children | 0 (0.0%) | 0 (0.0%) |
| Total | 33 (2.7%) | 9 (1.8%) |
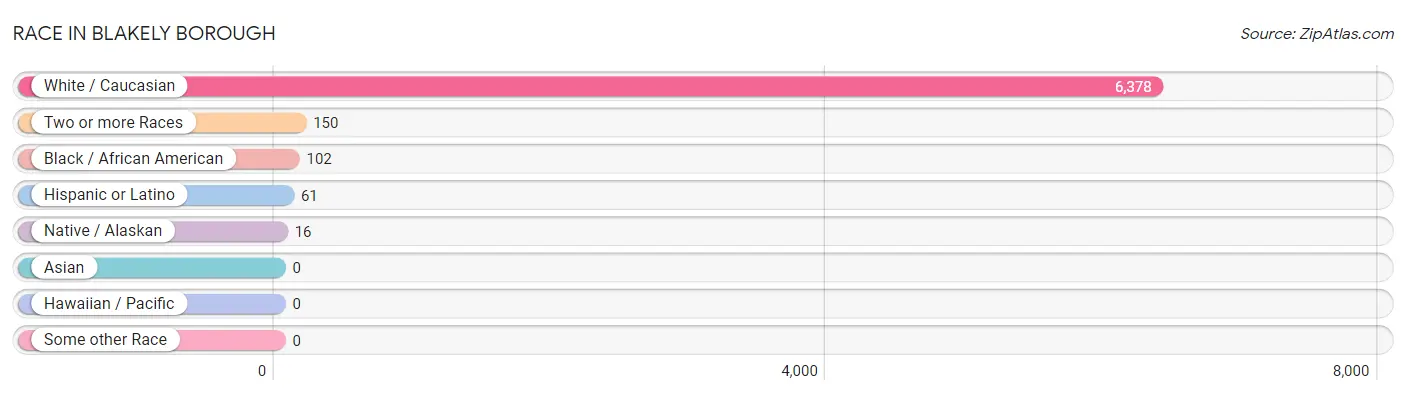
Race in Blakely borough
The most populous races in Blakely borough are White / Caucasian (6,378 | 96.0%), Two or more Races (150 | 2.3%), and Black / African American (102 | 1.5%).
| Race | # Population | % Population |
| Asian | 0 | 0.0% |
| Black / African American | 102 | 1.5% |
| Hawaiian / Pacific | 0 | 0.0% |
| Hispanic or Latino | 61 | 0.9% |
| Native / Alaskan | 16 | 0.2% |
| White / Caucasian | 6,378 | 96.0% |
| Two or more Races | 150 | 2.3% |
| Some other Race | 0 | 0.0% |
| Total | 6,646 | 100.0% |
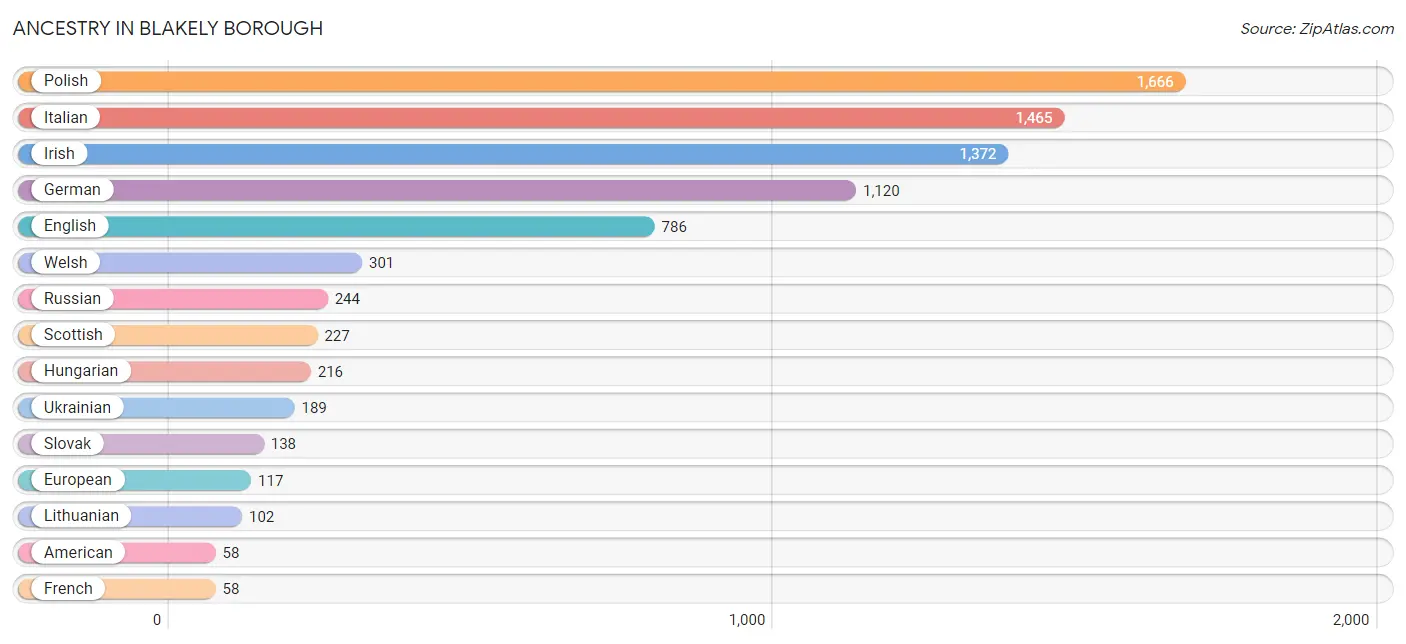
Ancestry in Blakely borough
The most populous ancestries reported in Blakely borough are Polish (1,666 | 25.1%), Italian (1,465 | 22.0%), Irish (1,372 | 20.6%), German (1,120 | 16.9%), and English (786 | 11.8%), together accounting for 96.4% of all Blakely borough residents.
| Ancestry | # Population | % Population |
| American | 58 | 0.9% |
| Arab | 41 | 0.6% |
| Australian | 42 | 0.6% |
| Canadian | 16 | 0.2% |
| Croatian | 19 | 0.3% |
| Czech | 42 | 0.6% |
| Dutch | 45 | 0.7% |
| English | 786 | 11.8% |
| European | 117 | 1.8% |
| French | 58 | 0.9% |
| German | 1,120 | 16.9% |
| Greek | 43 | 0.6% |
| Hungarian | 216 | 3.3% |
| Irish | 1,372 | 20.6% |
| Iroquois | 16 | 0.2% |
| Italian | 1,465 | 22.0% |
| Jamaican | 44 | 0.7% |
| Lithuanian | 102 | 1.5% |
| Norwegian | 57 | 0.9% |
| Pennsylvania German | 57 | 0.9% |
| Polish | 1,666 | 25.1% |
| Puerto Rican | 43 | 0.6% |
| Russian | 244 | 3.7% |
| Scottish | 227 | 3.4% |
| Slovak | 138 | 2.1% |
| Spaniard | 18 | 0.3% |
| Swedish | 51 | 0.8% |
| Syrian | 41 | 0.6% |
| Ukrainian | 189 | 2.8% |
| Welsh | 301 | 4.5% | View All 30 Rows |
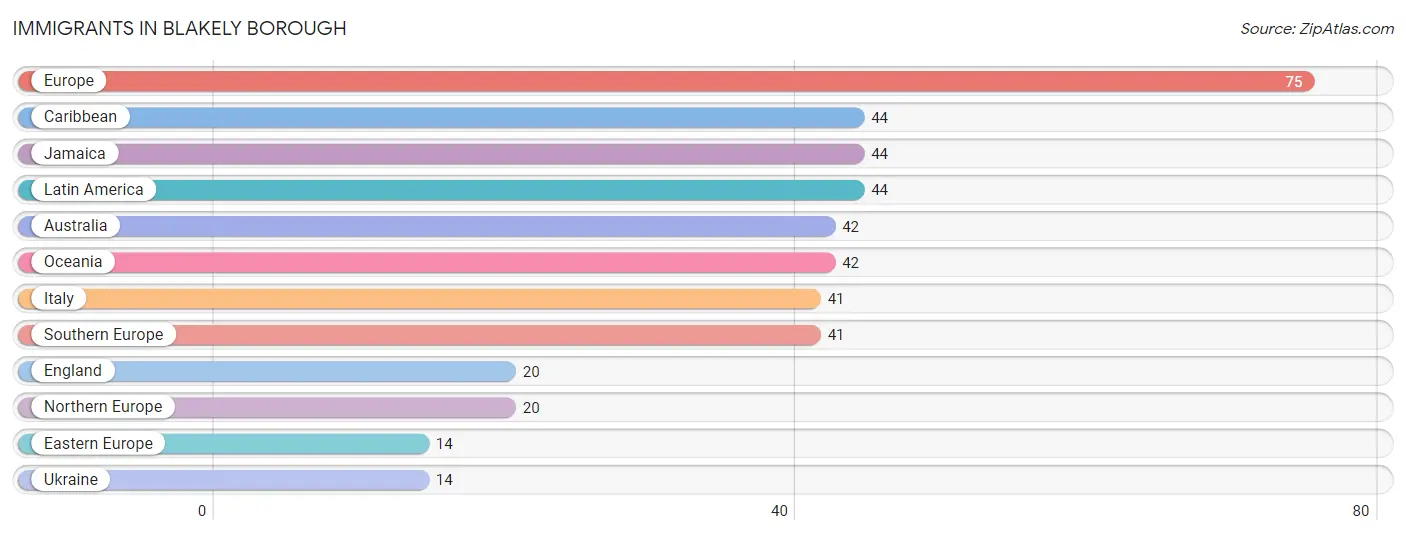
Immigrants in Blakely borough
The most numerous immigrant groups reported in Blakely borough came from Europe (75 | 1.1%), Caribbean (44 | 0.7%), Jamaica (44 | 0.7%), Latin America (44 | 0.7%), and Australia (42 | 0.6%), together accounting for 3.7% of all Blakely borough residents.
| Immigration Origin | # Population | % Population |
| Australia | 42 | 0.6% |
| Caribbean | 44 | 0.7% |
| Eastern Europe | 14 | 0.2% |
| England | 20 | 0.3% |
| Europe | 75 | 1.1% |
| Italy | 41 | 0.6% |
| Jamaica | 44 | 0.7% |
| Latin America | 44 | 0.7% |
| Northern Europe | 20 | 0.3% |
| Oceania | 42 | 0.6% |
| Southern Europe | 41 | 0.6% |
| Ukraine | 14 | 0.2% | View All 12 Rows |
Sex and Age in Blakely borough
Sex and Age in Blakely borough
The most populous age groups in Blakely borough are 55 to 59 Years (293 | 10.4%) for men and 85 Years and over (479 | 12.5%) for women.
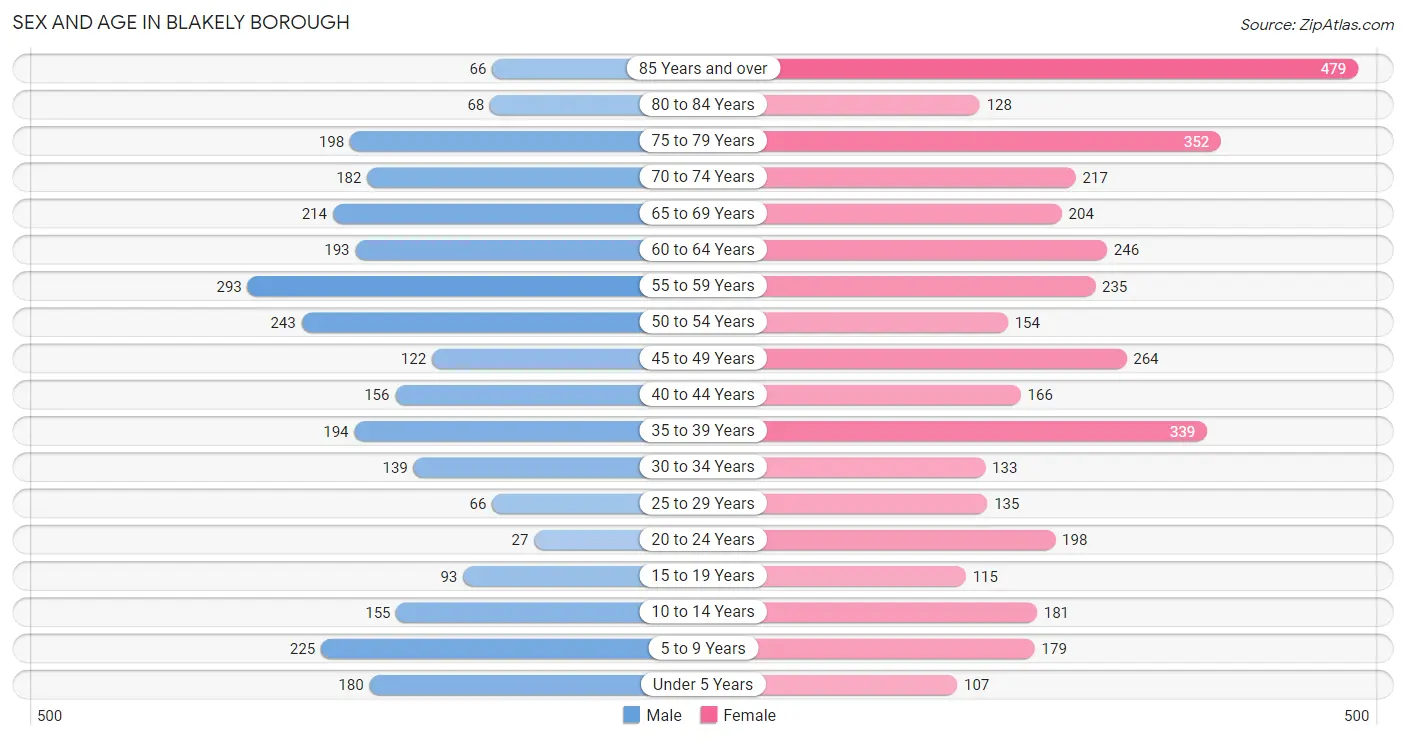
| Age Bracket | Male | Female |
| Under 5 Years | 180 (6.4%) | 107 (2.8%) |
| 5 to 9 Years | 225 (8.0%) | 179 (4.7%) |
| 10 to 14 Years | 155 (5.5%) | 181 (4.7%) |
| 15 to 19 Years | 93 (3.3%) | 115 (3.0%) |
| 20 to 24 Years | 27 (1.0%) | 198 (5.2%) |
| 25 to 29 Years | 66 (2.4%) | 135 (3.5%) |
| 30 to 34 Years | 139 (4.9%) | 133 (3.5%) |
| 35 to 39 Years | 194 (6.9%) | 339 (8.8%) |
| 40 to 44 Years | 156 (5.5%) | 166 (4.3%) |
| 45 to 49 Years | 122 (4.3%) | 264 (6.9%) |
| 50 to 54 Years | 243 (8.6%) | 154 (4.0%) |
| 55 to 59 Years | 293 (10.4%) | 235 (6.1%) |
| 60 to 64 Years | 193 (6.9%) | 246 (6.4%) |
| 65 to 69 Years | 214 (7.6%) | 204 (5.3%) |
| 70 to 74 Years | 182 (6.5%) | 217 (5.7%) |
| 75 to 79 Years | 198 (7.0%) | 352 (9.2%) |
| 80 to 84 Years | 68 (2.4%) | 128 (3.3%) |
| 85 Years and over | 66 (2.4%) | 479 (12.5%) |
| Total | 2,814 (100.0%) | 3,832 (100.0%) |
Families and Households in Blakely borough
Median Family Size in Blakely borough
The median family size in Blakely borough is 2.78 persons per family, with single female/mother families (258 | 14.9%) accounting for the largest median family size of 3.08 persons per family. On the other hand, single male/father families (250 | 14.4%) represent the smallest median family size with 2.30 persons per family.
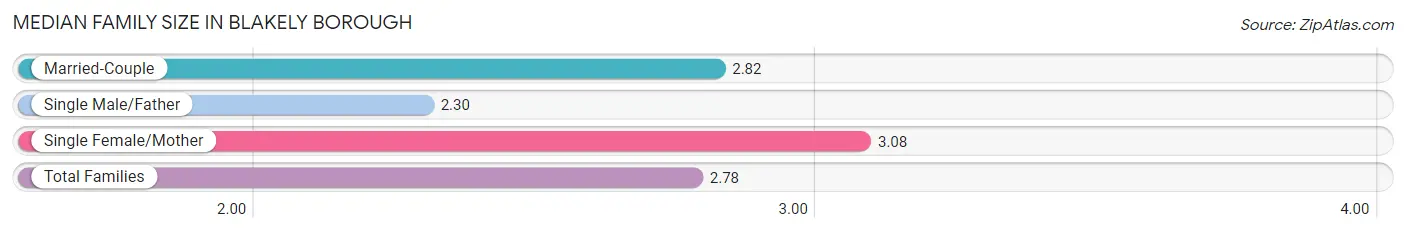
| Family Type | # Families | Family Size |
| Married-Couple | 1,224 (70.7%) | 2.82 |
| Single Male/Father | 250 (14.4%) | 2.30 |
| Single Female/Mother | 258 (14.9%) | 3.08 |
| Total Families | 1,732 (100.0%) | 2.78 |
Median Household Size in Blakely borough
The median household size in Blakely borough is 2.11 persons per household, with single female/mother households (258 | 8.6%) accounting for the largest median household size of 3.23 persons per household. non-family households (1,277 | 42.4%) represent the smallest median household size with 1.11 persons per household.
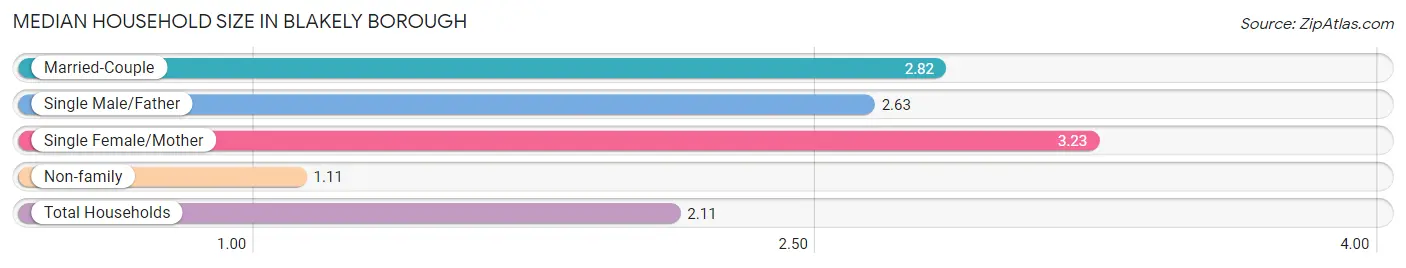
| Household Type | # Households | Household Size |
| Married-Couple | 1,224 (40.7%) | 2.82 |
| Single Male/Father | 250 (8.3%) | 2.63 |
| Single Female/Mother | 258 (8.6%) | 3.23 |
| Non-family | 1,277 (42.4%) | 1.11 |
| Total Households | 3,009 (100.0%) | 2.11 |
Household Size by Marriage Status in Blakely borough
Out of a total of 3,009 households in Blakely borough, 1,732 (57.6%) are family households, while 1,277 (42.4%) are nonfamily households. The most numerous type of family households are 2-person households, comprising 952, and the most common type of nonfamily households are 1-person households, comprising 1,158.
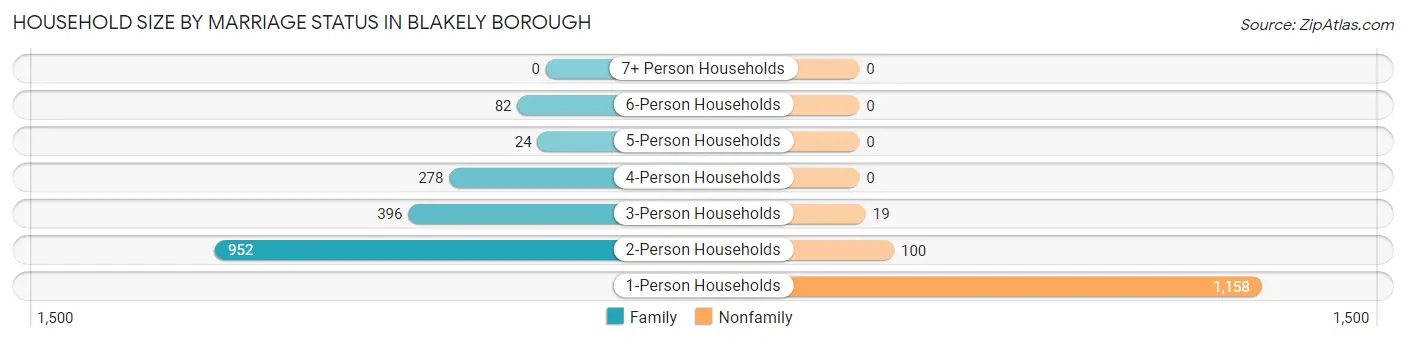
| Household Size | Family Households | Nonfamily Households |
| 1-Person Households | - | 1,158 (38.5%) |
| 2-Person Households | 952 (31.6%) | 100 (3.3%) |
| 3-Person Households | 396 (13.2%) | 19 (0.6%) |
| 4-Person Households | 278 (9.2%) | 0 (0.0%) |
| 5-Person Households | 24 (0.8%) | 0 (0.0%) |
| 6-Person Households | 82 (2.7%) | 0 (0.0%) |
| 7+ Person Households | 0 (0.0%) | 0 (0.0%) |
| Total | 1,732 (57.6%) | 1,277 (42.4%) |
Female Fertility in Blakely borough
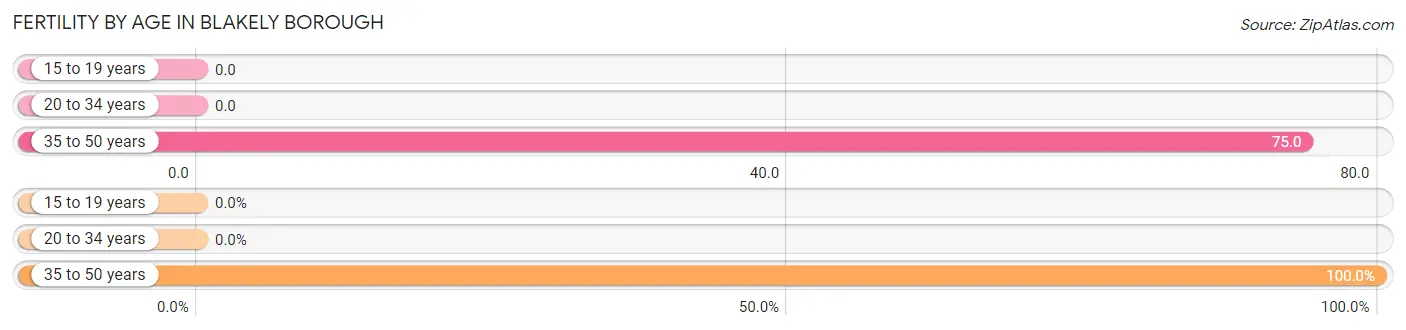
Fertility by Age in Blakely borough
Average fertility rate in Blakely borough is 43.0 births per 1,000 women. Women in the age bracket of 35 to 50 years have the highest fertility rate with 75.0 births per 1,000 women. Women in the age bracket of 35 to 50 years acount for 100.0% of all women with births.
| Age Bracket | Women with Births | Births / 1,000 Women |
| 15 to 19 years | 0 (0.0%) | 0.0 |
| 20 to 34 years | 0 (0.0%) | 0.0 |
| 35 to 50 years | 60 (100.0%) | 75.0 |
| Total | 60 (100.0%) | 43.0 |
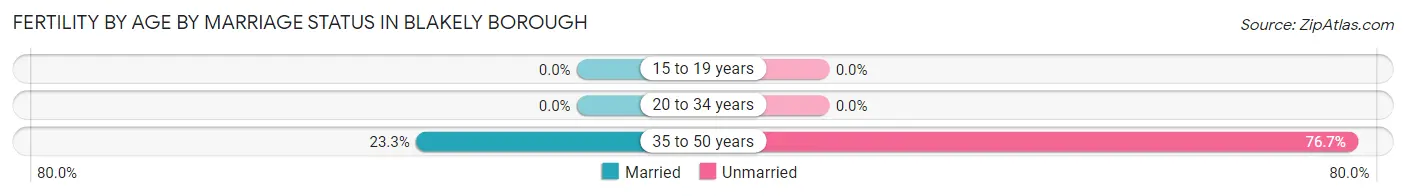
Fertility by Age by Marriage Status in Blakely borough
23.3% of women with births (60) in Blakely borough are married. The highest percentage of unmarried women with births falls into 35 to 50 years age bracket with 76.7% of them unmarried at the time of birth, while the lowest percentage of unmarried women with births belong to 35 to 50 years age bracket with 76.7% of them unmarried.
| Age Bracket | Married | Unmarried |
| 15 to 19 years | 0 (0.0%) | 0 (0.0%) |
| 20 to 34 years | 0 (0.0%) | 0 (0.0%) |
| 35 to 50 years | 14 (23.3%) | 46 (76.7%) |
| Total | 14 (23.3%) | 46 (76.7%) |
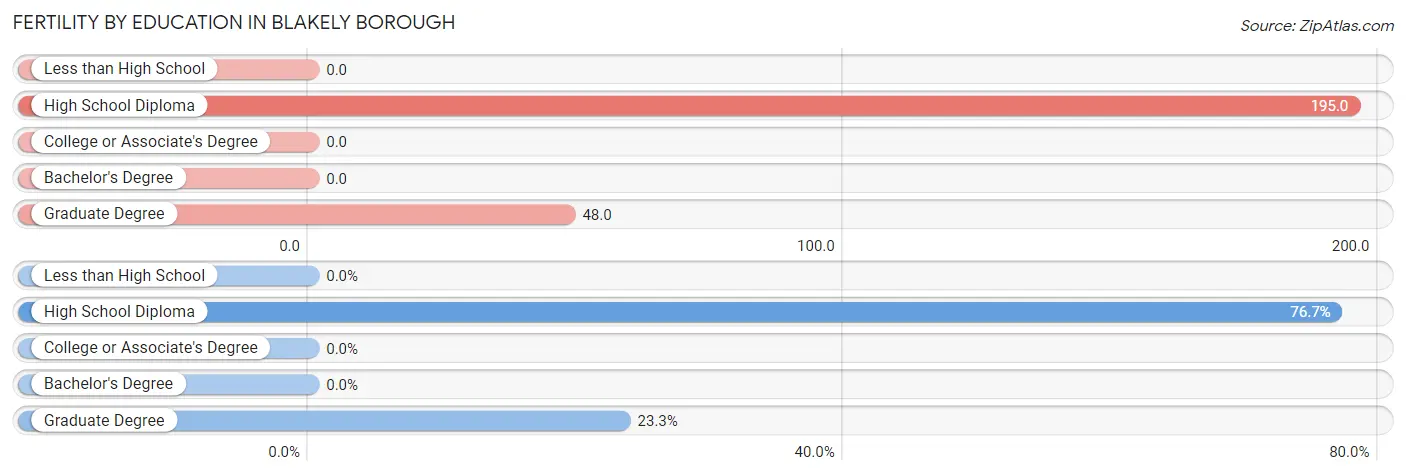
Fertility by Education in Blakely borough
| Educational Attainment | Women with Births | Births / 1,000 Women |
| Less than High School | 0 (0.0%) | 0.0 |
| High School Diploma | 46 (76.7%) | 195.0 |
| College or Associate's Degree | 0 (0.0%) | 0.0 |
| Bachelor's Degree | 0 (0.0%) | 0.0 |
| Graduate Degree | 14 (23.3%) | 48.0 |
| Total | 60 (100.0%) | 43.0 |
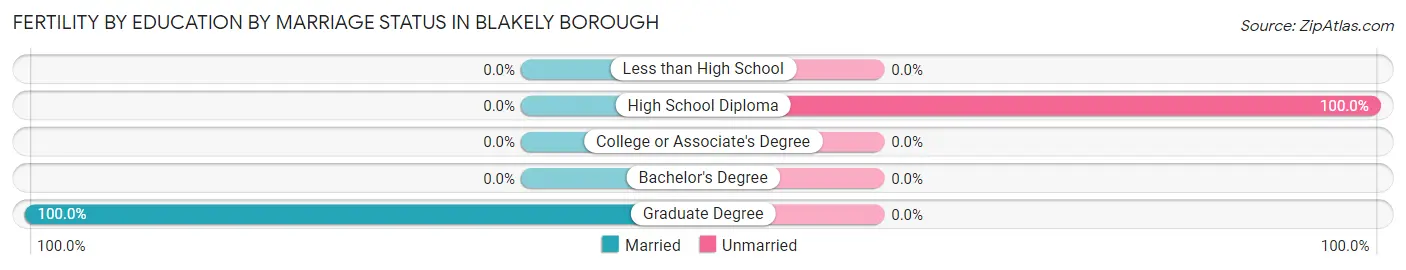
Fertility by Education by Marriage Status in Blakely borough
76.7% of women with births in Blakely borough are unmarried. Women with the educational attainment of graduate degree are most likely to be married with 100.0% of them married at childbirth, while women with the educational attainment of high school diploma are least likely to be married with 100.0% of them unmarried at childbirth.
| Educational Attainment | Married | Unmarried |
| Less than High School | 0 (0.0%) | 0 (0.0%) |
| High School Diploma | 0 (0.0%) | 46 (100.0%) |
| College or Associate's Degree | 0 (0.0%) | 0 (0.0%) |
| Bachelor's Degree | 0 (0.0%) | 0 (0.0%) |
| Graduate Degree | 14 (100.0%) | 0 (0.0%) |
| Total | 14 (23.3%) | 46 (76.7%) |
Employment Characteristics in Blakely borough
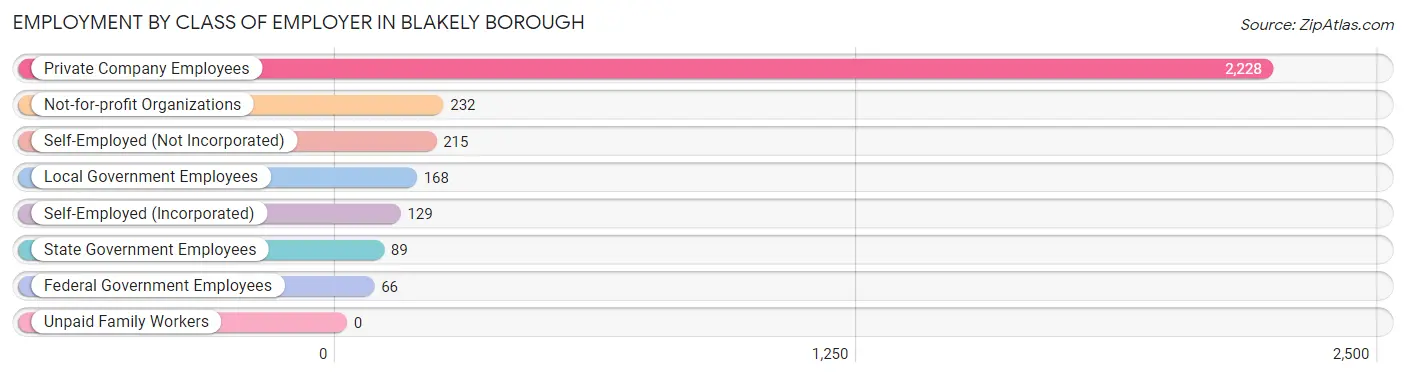
Employment by Class of Employer in Blakely borough
Among the 3,127 employed individuals in Blakely borough, private company employees (2,228 | 71.3%), not-for-profit organizations (232 | 7.4%), and self-employed (not incorporated) (215 | 6.9%) make up the most common classes of employment.
| Employer Class | # Employees | % Employees |
| Private Company Employees | 2,228 | 71.3% |
| Self-Employed (Incorporated) | 129 | 4.1% |
| Self-Employed (Not Incorporated) | 215 | 6.9% |
| Not-for-profit Organizations | 232 | 7.4% |
| Local Government Employees | 168 | 5.4% |
| State Government Employees | 89 | 2.9% |
| Federal Government Employees | 66 | 2.1% |
| Unpaid Family Workers | 0 | 0.0% |
| Total | 3,127 | 100.0% |
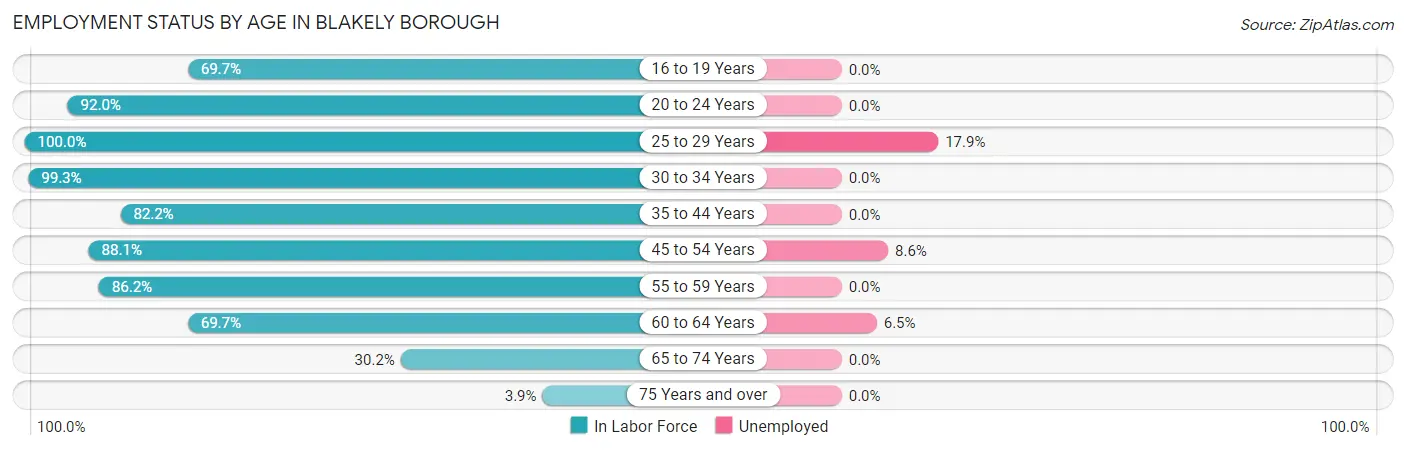
Employment Status by Age in Blakely borough
According to the labor force statistics for Blakely borough, out of the total population over 16 years of age (5,619), 58.3% or 3,276 individuals are in the labor force, with 3.5% or 115 of them unemployed. The age group with the highest labor force participation rate is 25 to 29 years, with 100.0% or 201 individuals in the labor force. Within the labor force, the 25 to 29 years age range has the highest percentage of unemployed individuals, with 17.9% or 36 of them being unemployed.
| Age Bracket | In Labor Force | Unemployed |
| 16 to 19 Years | 145 (69.7%) | 0 (0.0%) |
| 20 to 24 Years | 207 (92.0%) | 0 (0.0%) |
| 25 to 29 Years | 201 (100.0%) | 36 (17.9%) |
| 30 to 34 Years | 270 (99.3%) | 0 (0.0%) |
| 35 to 44 Years | 703 (82.2%) | 0 (0.0%) |
| 45 to 54 Years | 690 (88.1%) | 59 (8.6%) |
| 55 to 59 Years | 455 (86.2%) | 0 (0.0%) |
| 60 to 64 Years | 306 (69.7%) | 20 (6.5%) |
| 65 to 74 Years | 247 (30.2%) | 0 (0.0%) |
| 75 Years and over | 50 (3.9%) | 0 (0.0%) |
| Total | 3,276 (58.3%) | 115 (3.5%) |
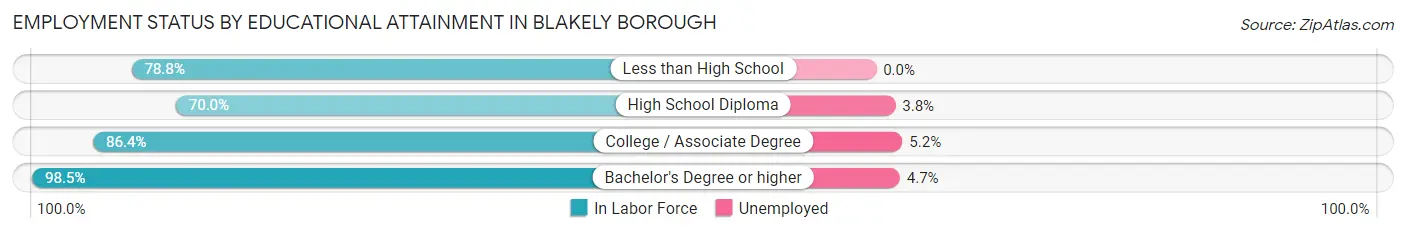
Employment Status by Educational Attainment in Blakely borough
According to labor force statistics for Blakely borough, 85.3% of individuals (2,626) out of the total population between 25 and 64 years of age (3,078) are in the labor force, with 4.4% or 116 of them being unemployed. The group with the highest labor force participation rate are those with the educational attainment of bachelor's degree or higher, with 98.5% or 946 individuals in the labor force. Within the labor force, individuals with college / associate degree education have the highest percentage of unemployment, with 5.2% or 49 of them being unemployed.
| Educational Attainment | In Labor Force | Unemployed |
| Less than High School | 152 (78.8%) | 0 (0.0%) |
| High School Diploma | 581 (70.0%) | 32 (3.8%) |
| College / Associate Degree | 946 (86.4%) | 57 (5.2%) |
| Bachelor's Degree or higher | 946 (98.5%) | 45 (4.7%) |
| Total | 2,626 (85.3%) | 135 (4.4%) |
Employment Occupations by Sex in Blakely borough
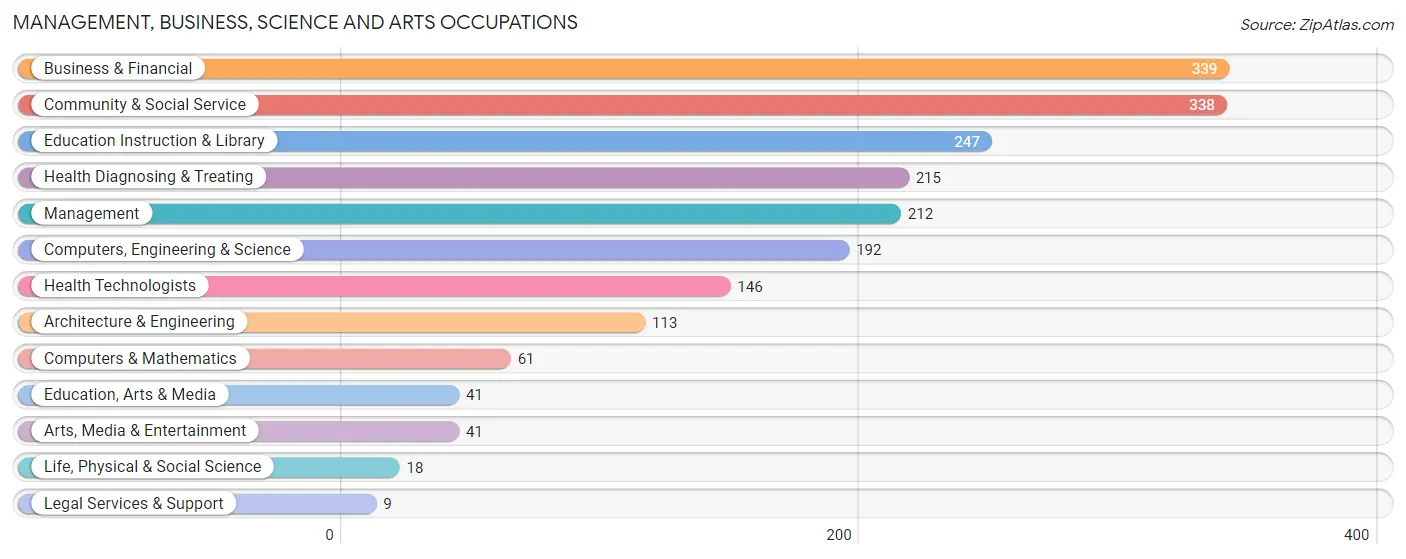
Management, Business, Science and Arts Occupations
The most common Management, Business, Science and Arts occupations in Blakely borough are Business & Financial (339 | 10.7%), Community & Social Service (338 | 10.7%), Education Instruction & Library (247 | 7.8%), Health Diagnosing & Treating (215 | 6.8%), and Management (212 | 6.7%).
Management, Business, Science and Arts Occupations by Sex
Within the Management, Business, Science and Arts occupations in Blakely borough, the most male-oriented occupations are Computers & Mathematics (100.0%), Education, Arts & Media (100.0%), and Arts, Media & Entertainment (100.0%), while the most female-oriented occupations are Life, Physical & Social Science (100.0%), Legal Services & Support (100.0%), and Health Diagnosing & Treating (95.4%).
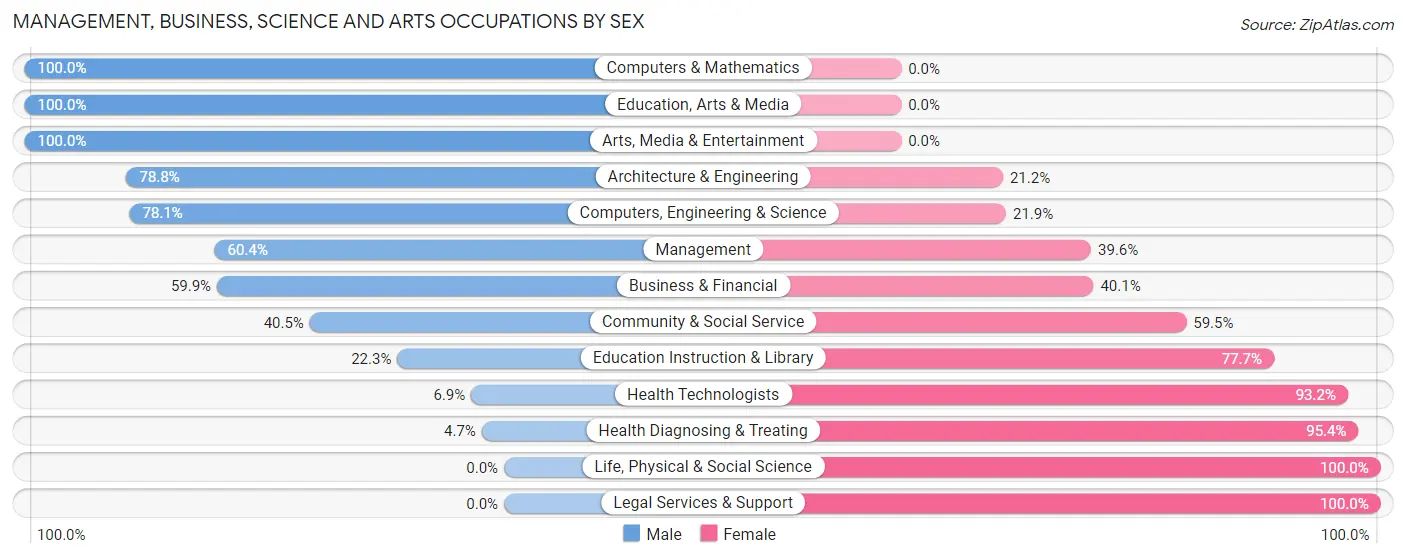
| Occupation | Male | Female |
| Management | 128 (60.4%) | 84 (39.6%) |
| Business & Financial | 203 (59.9%) | 136 (40.1%) |
| Computers, Engineering & Science | 150 (78.1%) | 42 (21.9%) |
| Computers & Mathematics | 61 (100.0%) | 0 (0.0%) |
| Architecture & Engineering | 89 (78.8%) | 24 (21.2%) |
| Life, Physical & Social Science | 0 (0.0%) | 18 (100.0%) |
| Community & Social Service | 137 (40.5%) | 201 (59.5%) |
| Education, Arts & Media | 41 (100.0%) | 0 (0.0%) |
| Legal Services & Support | 0 (0.0%) | 9 (100.0%) |
| Education Instruction & Library | 55 (22.3%) | 192 (77.7%) |
| Arts, Media & Entertainment | 41 (100.0%) | 0 (0.0%) |
| Health Diagnosing & Treating | 10 (4.6%) | 205 (95.4%) |
| Health Technologists | 10 (6.9%) | 136 (93.1%) |
| Total (Category) | 628 (48.5%) | 668 (51.5%) |
| Total (Overall) | 1,627 (51.5%) | 1,532 (48.5%) |
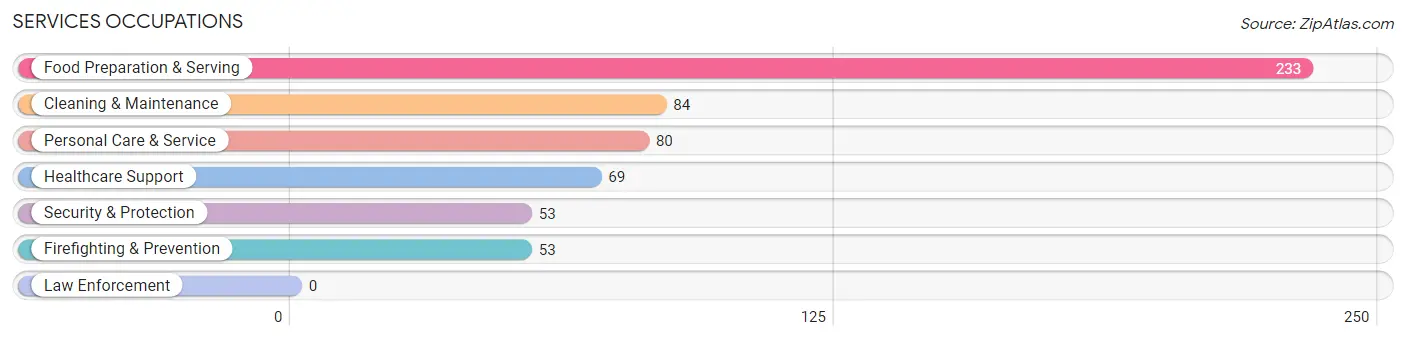
Services Occupations
The most common Services occupations in Blakely borough are Food Preparation & Serving (233 | 7.4%), Cleaning & Maintenance (84 | 2.7%), Personal Care & Service (80 | 2.5%), Healthcare Support (69 | 2.2%), and Security & Protection (53 | 1.7%).
Services Occupations by Sex
Within the Services occupations in Blakely borough, the most male-oriented occupations are Security & Protection (100.0%), Firefighting & Prevention (100.0%), and Cleaning & Maintenance (55.9%), while the most female-oriented occupations are Healthcare Support (100.0%), Food Preparation & Serving (56.7%), and Personal Care & Service (45.0%).
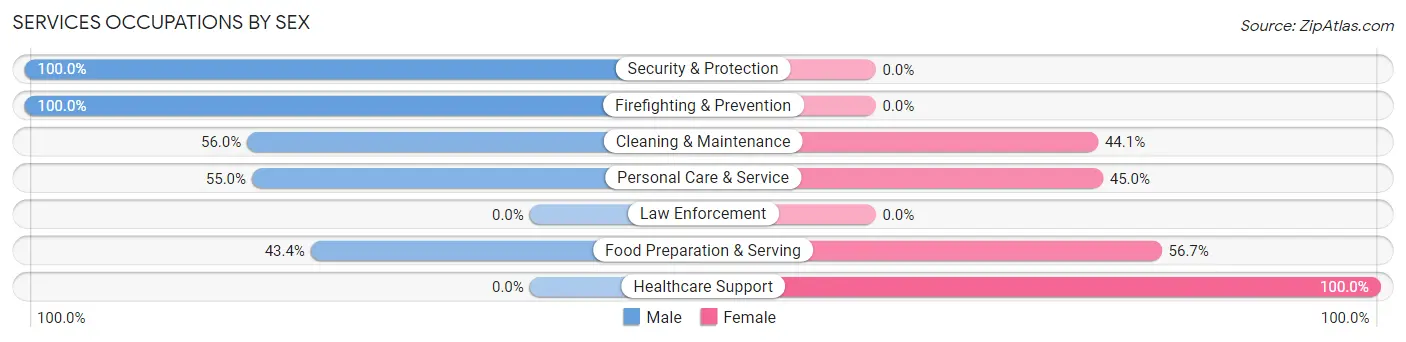
| Occupation | Male | Female |
| Healthcare Support | 0 (0.0%) | 69 (100.0%) |
| Security & Protection | 53 (100.0%) | 0 (0.0%) |
| Firefighting & Prevention | 53 (100.0%) | 0 (0.0%) |
| Law Enforcement | 0 (0.0%) | 0 (0.0%) |
| Food Preparation & Serving | 101 (43.3%) | 132 (56.7%) |
| Cleaning & Maintenance | 47 (55.9%) | 37 (44.1%) |
| Personal Care & Service | 44 (55.0%) | 36 (45.0%) |
| Total (Category) | 245 (47.2%) | 274 (52.8%) |
| Total (Overall) | 1,627 (51.5%) | 1,532 (48.5%) |
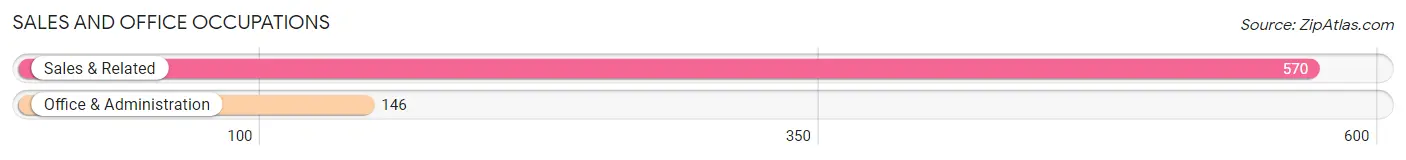
Sales and Office Occupations
The most common Sales and Office occupations in Blakely borough are Sales & Related (570 | 18.0%), and Office & Administration (146 | 4.6%).
Sales and Office Occupations by Sex
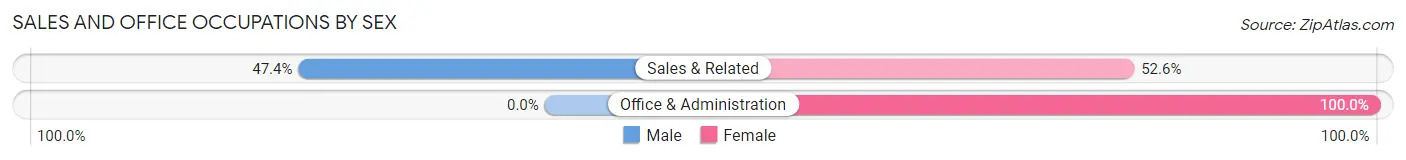
| Occupation | Male | Female |
| Sales & Related | 270 (47.4%) | 300 (52.6%) |
| Office & Administration | 0 (0.0%) | 146 (100.0%) |
| Total (Category) | 270 (37.7%) | 446 (62.3%) |
| Total (Overall) | 1,627 (51.5%) | 1,532 (48.5%) |
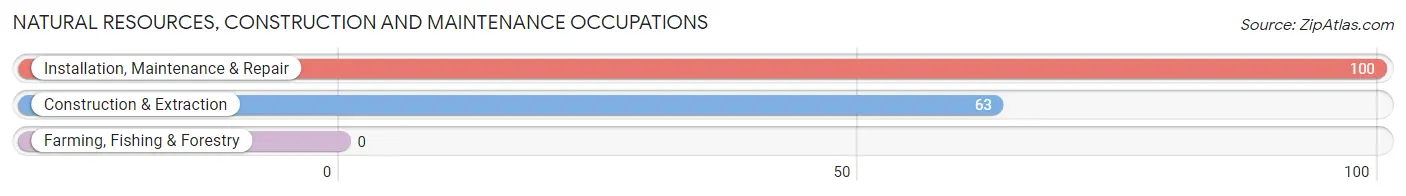
Natural Resources, Construction and Maintenance Occupations
The most common Natural Resources, Construction and Maintenance occupations in Blakely borough are Installation, Maintenance & Repair (100 | 3.2%), and Construction & Extraction (63 | 2.0%).
Natural Resources, Construction and Maintenance Occupations by Sex
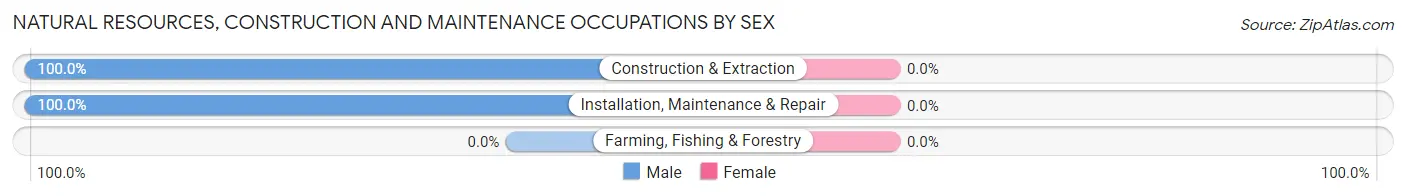
| Occupation | Male | Female |
| Farming, Fishing & Forestry | 0 (0.0%) | 0 (0.0%) |
| Construction & Extraction | 63 (100.0%) | 0 (0.0%) |
| Installation, Maintenance & Repair | 100 (100.0%) | 0 (0.0%) |
| Total (Category) | 163 (100.0%) | 0 (0.0%) |
| Total (Overall) | 1,627 (51.5%) | 1,532 (48.5%) |
Production, Transportation and Moving Occupations
The most common Production, Transportation and Moving occupations in Blakely borough are Transportation (215 | 6.8%), Production (135 | 4.3%), and Material Moving (115 | 3.6%).
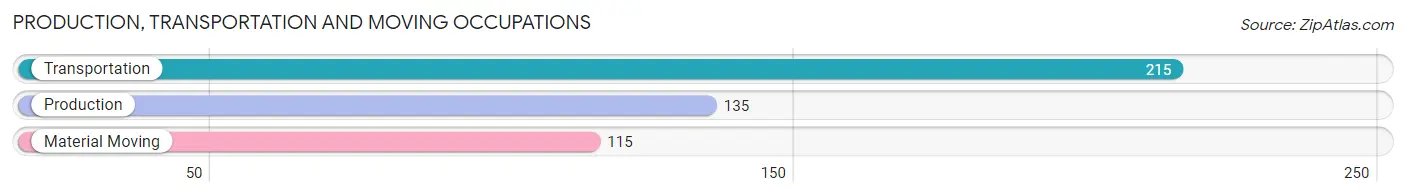
Production, Transportation and Moving Occupations by Sex
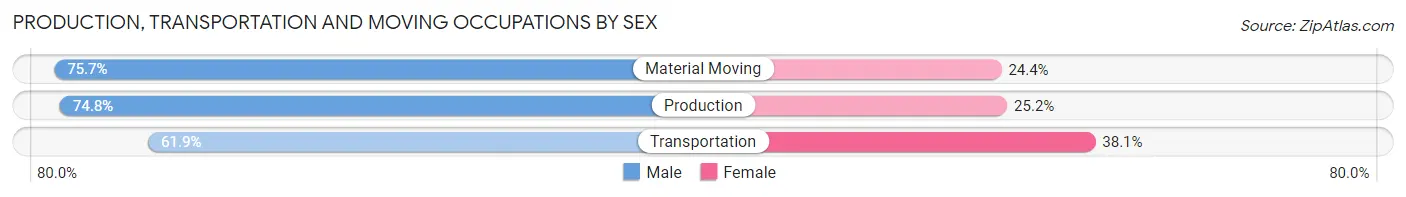
| Occupation | Male | Female |
| Production | 101 (74.8%) | 34 (25.2%) |
| Transportation | 133 (61.9%) | 82 (38.1%) |
| Material Moving | 87 (75.6%) | 28 (24.3%) |
| Total (Category) | 321 (69.0%) | 144 (31.0%) |
| Total (Overall) | 1,627 (51.5%) | 1,532 (48.5%) |
Employment Industries by Sex in Blakely borough
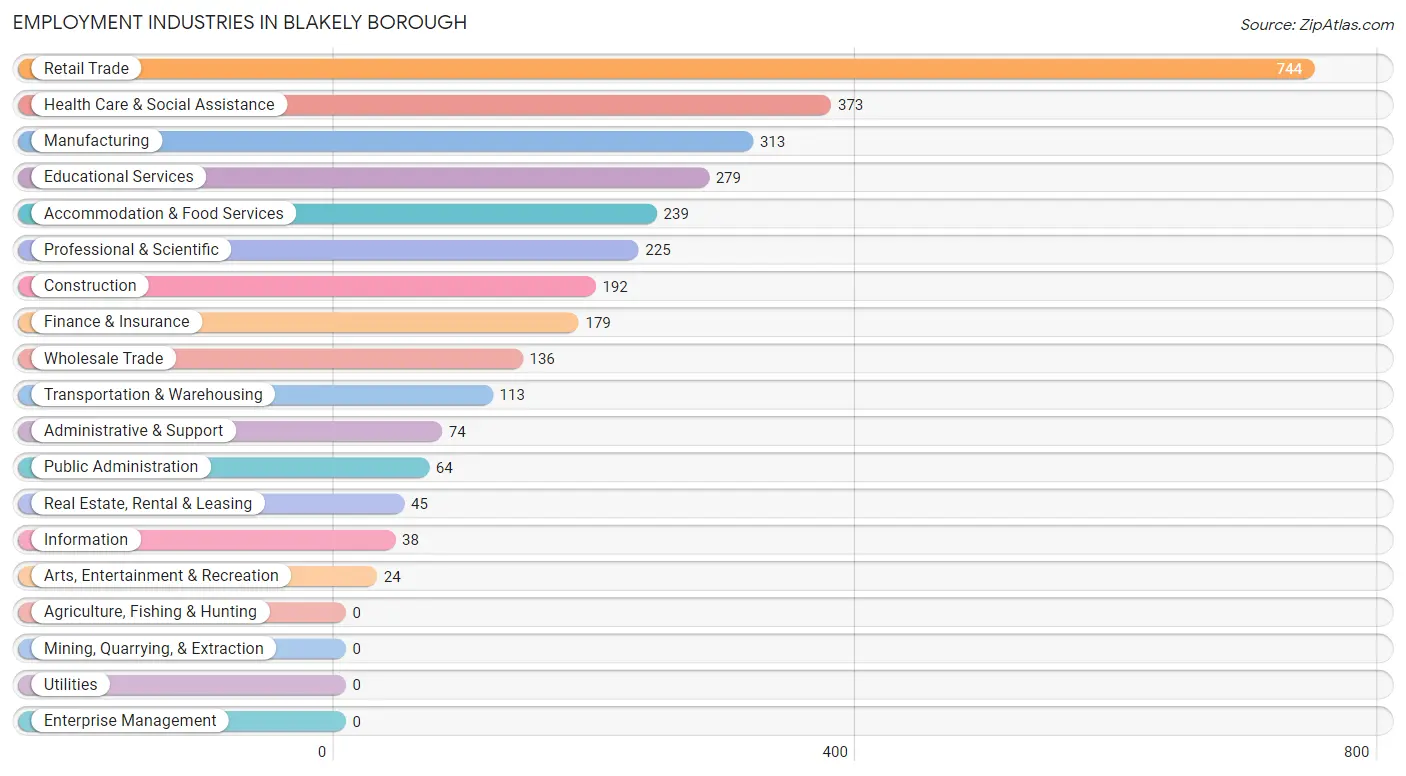
Employment Industries in Blakely borough
The major employment industries in Blakely borough include Retail Trade (744 | 23.5%), Health Care & Social Assistance (373 | 11.8%), Manufacturing (313 | 9.9%), Educational Services (279 | 8.8%), and Accommodation & Food Services (239 | 7.6%).
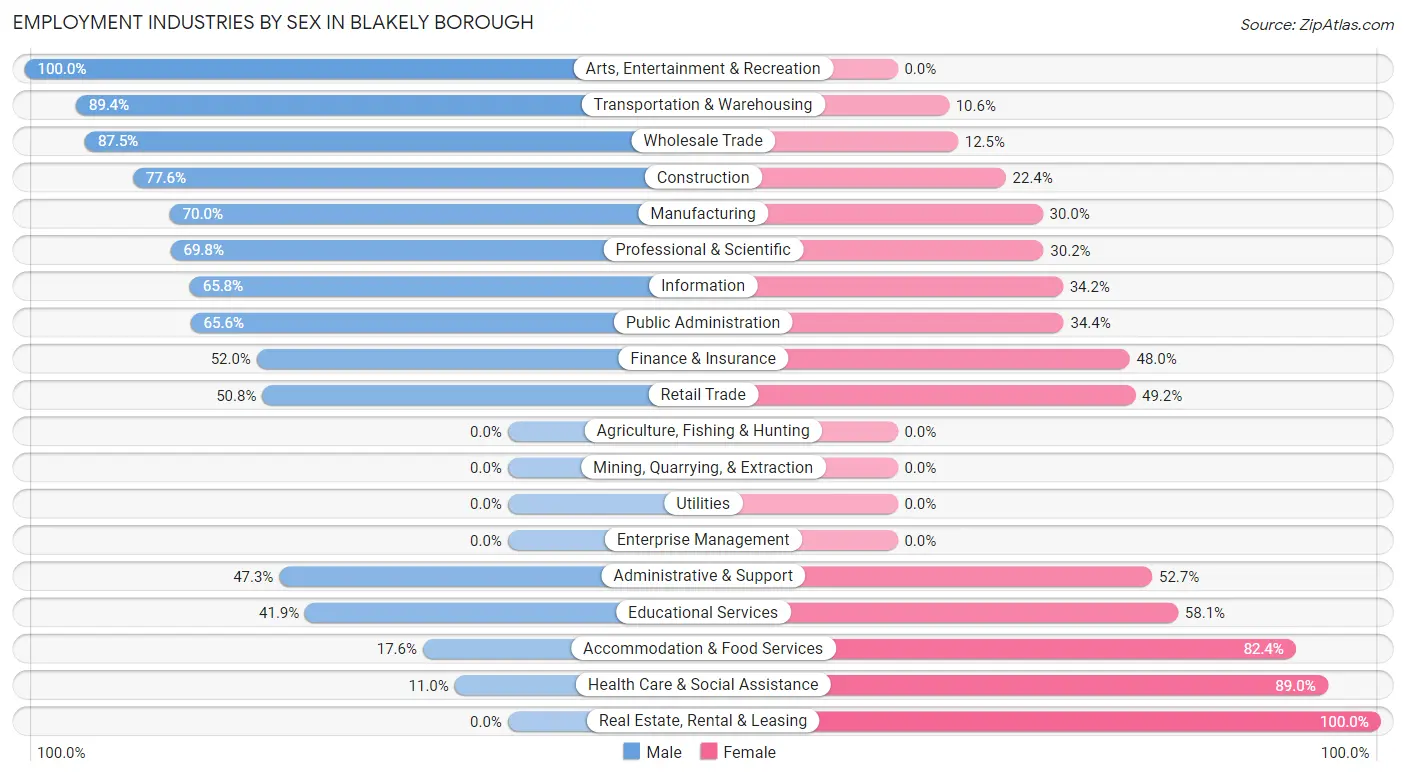
Employment Industries by Sex in Blakely borough
The Blakely borough industries that see more men than women are Arts, Entertainment & Recreation (100.0%), Transportation & Warehousing (89.4%), and Wholesale Trade (87.5%), whereas the industries that tend to have a higher number of women are Real Estate, Rental & Leasing (100.0%), Health Care & Social Assistance (89.0%), and Accommodation & Food Services (82.4%).
| Industry | Male | Female |
| Agriculture, Fishing & Hunting | 0 (0.0%) | 0 (0.0%) |
| Mining, Quarrying, & Extraction | 0 (0.0%) | 0 (0.0%) |
| Construction | 149 (77.6%) | 43 (22.4%) |
| Manufacturing | 219 (70.0%) | 94 (30.0%) |
| Wholesale Trade | 119 (87.5%) | 17 (12.5%) |
| Retail Trade | 378 (50.8%) | 366 (49.2%) |
| Transportation & Warehousing | 101 (89.4%) | 12 (10.6%) |
| Utilities | 0 (0.0%) | 0 (0.0%) |
| Information | 25 (65.8%) | 13 (34.2%) |
| Finance & Insurance | 93 (52.0%) | 86 (48.0%) |
| Real Estate, Rental & Leasing | 0 (0.0%) | 45 (100.0%) |
| Professional & Scientific | 157 (69.8%) | 68 (30.2%) |
| Enterprise Management | 0 (0.0%) | 0 (0.0%) |
| Administrative & Support | 35 (47.3%) | 39 (52.7%) |
| Educational Services | 117 (41.9%) | 162 (58.1%) |
| Health Care & Social Assistance | 41 (11.0%) | 332 (89.0%) |
| Arts, Entertainment & Recreation | 24 (100.0%) | 0 (0.0%) |
| Accommodation & Food Services | 42 (17.6%) | 197 (82.4%) |
| Public Administration | 42 (65.6%) | 22 (34.4%) |
| Total | 1,627 (51.5%) | 1,532 (48.5%) |
Education in Blakely borough
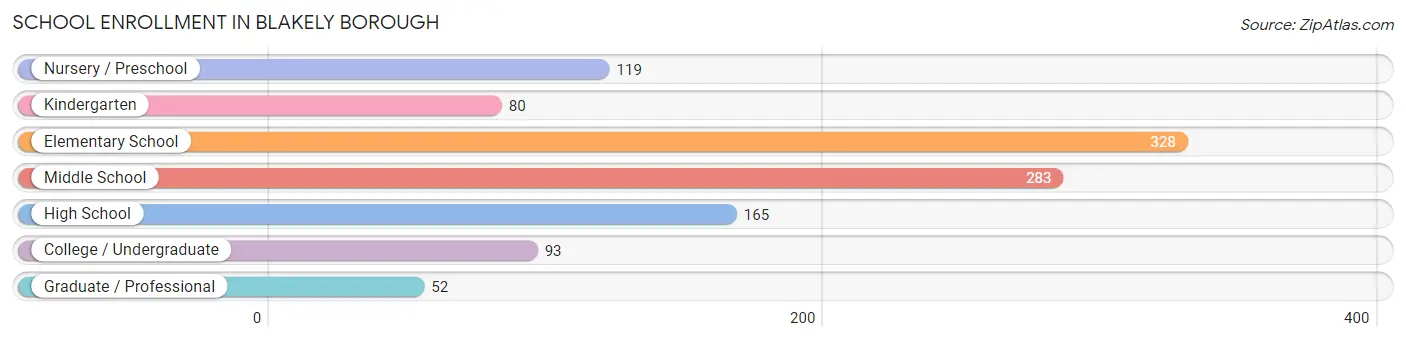
School Enrollment in Blakely borough
The most common levels of schooling among the 1,120 students in Blakely borough are elementary school (328 | 29.3%), middle school (283 | 25.3%), and high school (165 | 14.7%).
| School Level | # Students | % Students |
| Nursery / Preschool | 119 | 10.6% |
| Kindergarten | 80 | 7.1% |
| Elementary School | 328 | 29.3% |
| Middle School | 283 | 25.3% |
| High School | 165 | 14.7% |
| College / Undergraduate | 93 | 8.3% |
| Graduate / Professional | 52 | 4.6% |
| Total | 1,120 | 100.0% |
School Enrollment by Age by Funding Source in Blakely borough
Out of a total of 1,120 students who are enrolled in schools in Blakely borough, 256 (22.9%) attend a private institution, while the remaining 864 (77.1%) are enrolled in public schools. The age group of 18 to 19 year olds has the highest likelihood of being enrolled in private schools, with 66 (100.0% in the age bracket) enrolled. Conversely, the age group of 20 to 24 year olds has the lowest likelihood of being enrolled in a private school, with 11 (100.0% in the age bracket) attending a public institution.
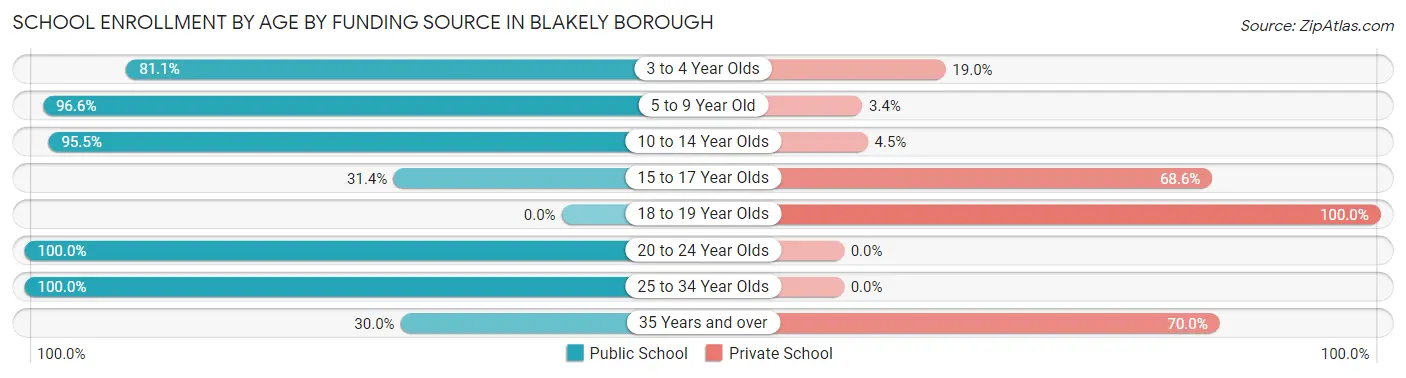
| Age Bracket | Public School | Private School |
| 3 to 4 Year Olds | 77 (81.0%) | 18 (19.0%) |
| 5 to 9 Year Old | 366 (96.6%) | 13 (3.4%) |
| 10 to 14 Year Olds | 321 (95.5%) | 15 (4.5%) |
| 15 to 17 Year Olds | 37 (31.4%) | 81 (68.6%) |
| 18 to 19 Year Olds | 0 (0.0%) | 66 (100.0%) |
| 20 to 24 Year Olds | 11 (100.0%) | 0 (0.0%) |
| 25 to 34 Year Olds | 25 (100.0%) | 0 (0.0%) |
| 35 Years and over | 27 (30.0%) | 63 (70.0%) |
| Total | 864 (77.1%) | 256 (22.9%) |
Educational Attainment by Field of Study in Blakely borough
Science & technology (389 | 28.1%), business (302 | 21.8%), education (138 | 10.0%), physical & health sciences (111 | 8.0%), and arts & humanities (99 | 7.1%) are the most common fields of study among 1,387 individuals in Blakely borough who have obtained a bachelor's degree or higher.
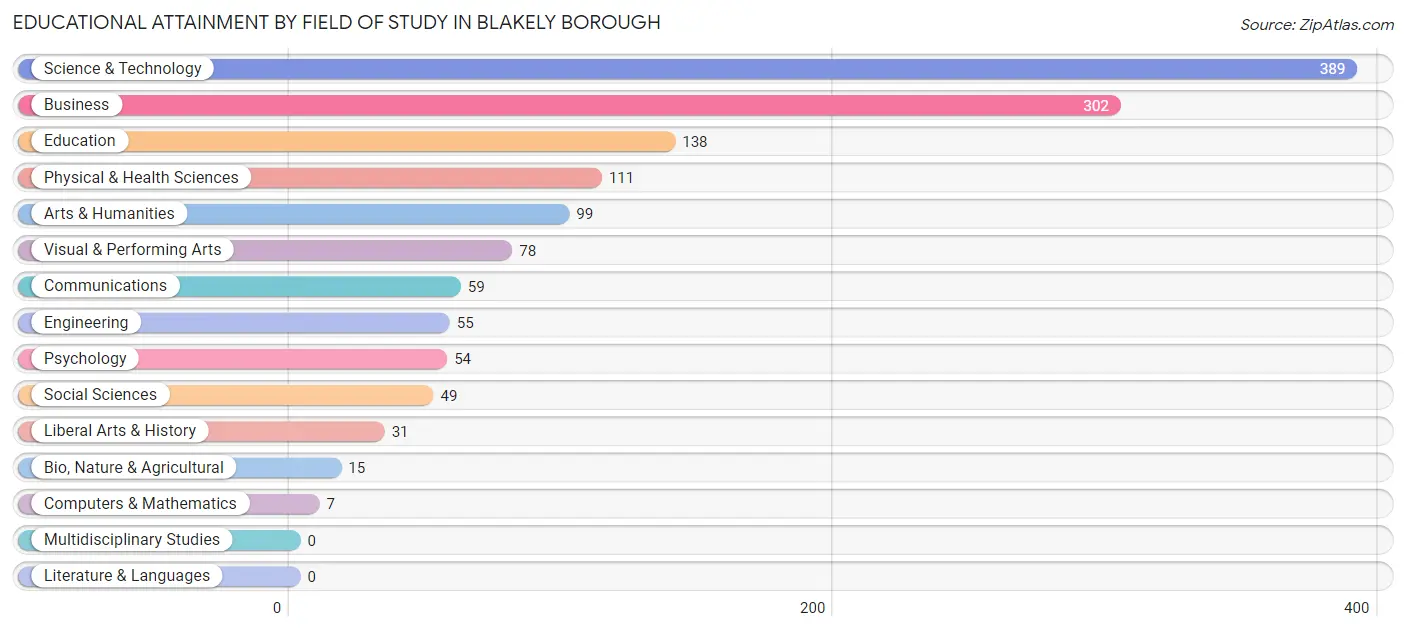
| Field of Study | # Graduates | % Graduates |
| Computers & Mathematics | 7 | 0.5% |
| Bio, Nature & Agricultural | 15 | 1.1% |
| Physical & Health Sciences | 111 | 8.0% |
| Psychology | 54 | 3.9% |
| Social Sciences | 49 | 3.5% |
| Engineering | 55 | 4.0% |
| Multidisciplinary Studies | 0 | 0.0% |
| Science & Technology | 389 | 28.1% |
| Business | 302 | 21.8% |
| Education | 138 | 10.0% |
| Literature & Languages | 0 | 0.0% |
| Liberal Arts & History | 31 | 2.2% |
| Visual & Performing Arts | 78 | 5.6% |
| Communications | 59 | 4.3% |
| Arts & Humanities | 99 | 7.1% |
| Total | 1,387 | 100.0% |
Transportation & Commute in Blakely borough
Vehicle Availability by Sex in Blakely borough
The most prevalent vehicle ownership categories in Blakely borough are males with 2 vehicles (796, accounting for 49.1%) and females with 2 vehicles (573, making up 52.8%).
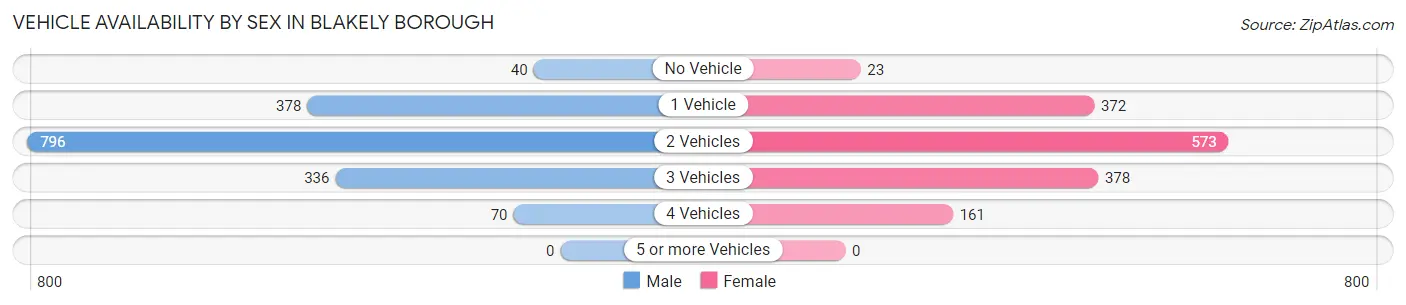
| Vehicles Available | Male | Female |
| No Vehicle | 40 (2.5%) | 23 (1.5%) |
| 1 Vehicle | 378 (23.3%) | 372 (24.7%) |
| 2 Vehicles | 796 (49.1%) | 573 (38.0%) |
| 3 Vehicles | 336 (20.7%) | 378 (25.1%) |
| 4 Vehicles | 70 (4.3%) | 161 (10.7%) |
| 5 or more Vehicles | 0 (0.0%) | 0 (0.0%) |
| Total | 1,620 (100.0%) | 1,507 (100.0%) |
Commute Time in Blakely borough
The most frequently occuring commute durations in Blakely borough are 10 to 14 minutes (628 commuters, 22.1%), 15 to 19 minutes (547 commuters, 19.2%), and 20 to 24 minutes (476 commuters, 16.7%).
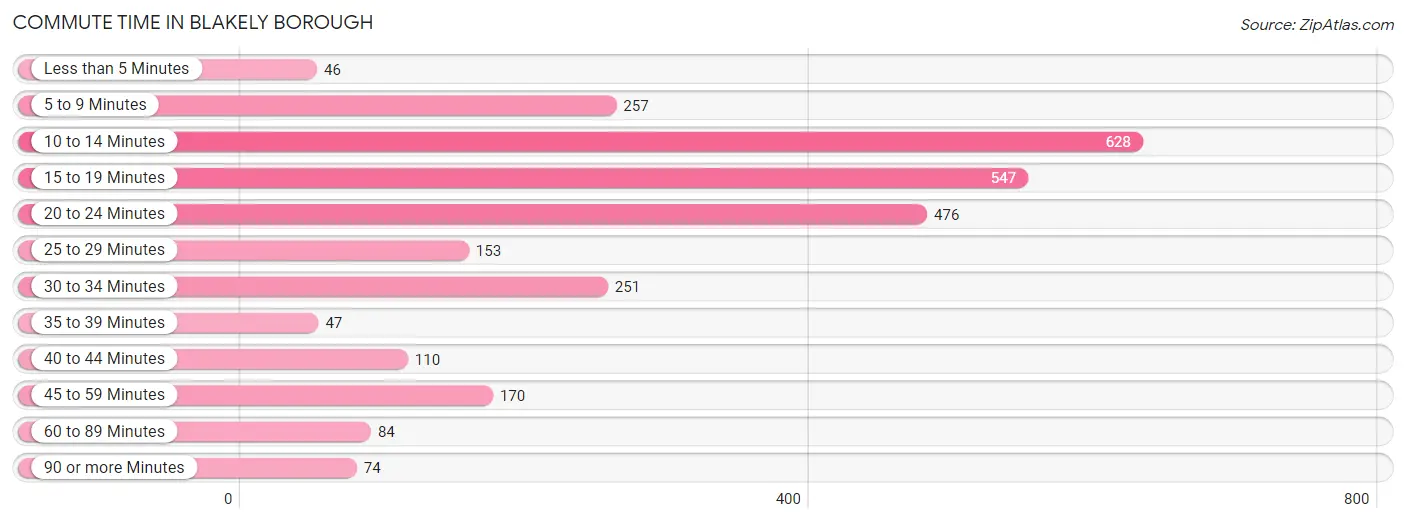
| Commute Time | # Commuters | % Commuters |
| Less than 5 Minutes | 46 | 1.6% |
| 5 to 9 Minutes | 257 | 9.0% |
| 10 to 14 Minutes | 628 | 22.1% |
| 15 to 19 Minutes | 547 | 19.2% |
| 20 to 24 Minutes | 476 | 16.7% |
| 25 to 29 Minutes | 153 | 5.4% |
| 30 to 34 Minutes | 251 | 8.8% |
| 35 to 39 Minutes | 47 | 1.7% |
| 40 to 44 Minutes | 110 | 3.9% |
| 45 to 59 Minutes | 170 | 6.0% |
| 60 to 89 Minutes | 84 | 2.9% |
| 90 or more Minutes | 74 | 2.6% |
Commute Time by Sex in Blakely borough
The most common commute times in Blakely borough are 10 to 14 minutes (381 commuters, 24.8%) for males and 15 to 19 minutes (291 commuters, 22.2%) for females.
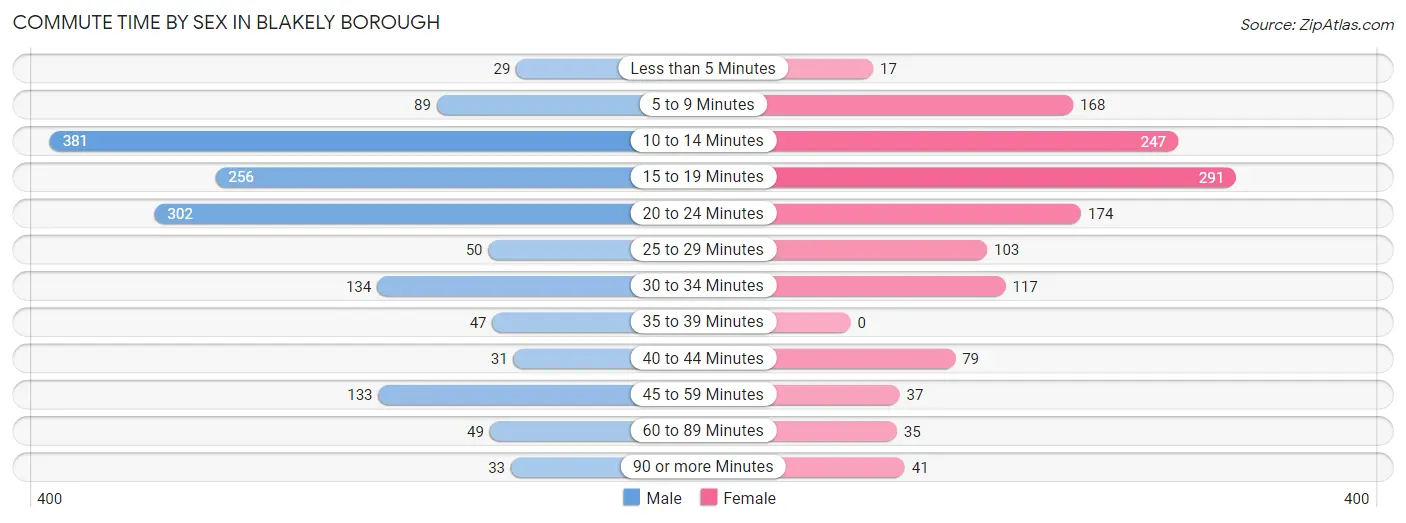
| Commute Time | Male | Female |
| Less than 5 Minutes | 29 (1.9%) | 17 (1.3%) |
| 5 to 9 Minutes | 89 (5.8%) | 168 (12.8%) |
| 10 to 14 Minutes | 381 (24.8%) | 247 (18.9%) |
| 15 to 19 Minutes | 256 (16.7%) | 291 (22.2%) |
| 20 to 24 Minutes | 302 (19.7%) | 174 (13.3%) |
| 25 to 29 Minutes | 50 (3.3%) | 103 (7.9%) |
| 30 to 34 Minutes | 134 (8.7%) | 117 (8.9%) |
| 35 to 39 Minutes | 47 (3.1%) | 0 (0.0%) |
| 40 to 44 Minutes | 31 (2.0%) | 79 (6.0%) |
| 45 to 59 Minutes | 133 (8.7%) | 37 (2.8%) |
| 60 to 89 Minutes | 49 (3.2%) | 35 (2.7%) |
| 90 or more Minutes | 33 (2.1%) | 41 (3.1%) |
Time of Departure to Work by Sex in Blakely borough
The most frequent times of departure to work in Blakely borough are 6:30 AM to 6:59 AM (223, 14.5%) for males and 7:30 AM to 7:59 AM (307, 23.4%) for females.
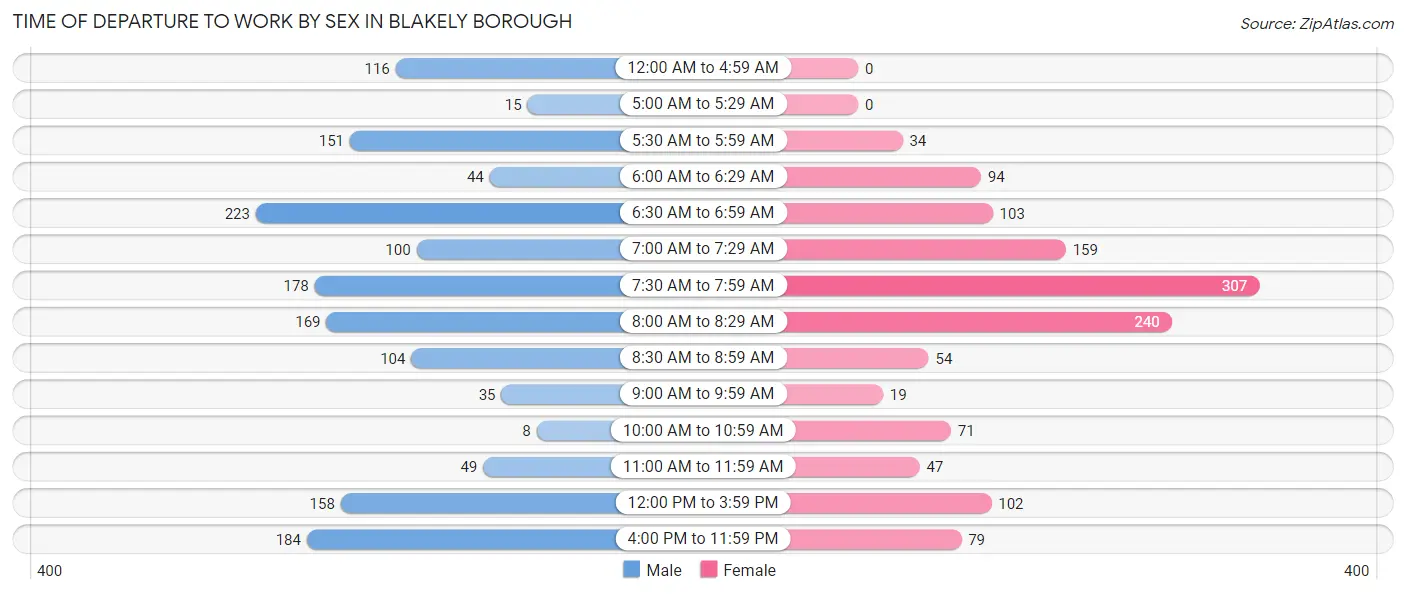
| Time of Departure | Male | Female |
| 12:00 AM to 4:59 AM | 116 (7.6%) | 0 (0.0%) |
| 5:00 AM to 5:29 AM | 15 (1.0%) | 0 (0.0%) |
| 5:30 AM to 5:59 AM | 151 (9.8%) | 34 (2.6%) |
| 6:00 AM to 6:29 AM | 44 (2.9%) | 94 (7.2%) |
| 6:30 AM to 6:59 AM | 223 (14.5%) | 103 (7.9%) |
| 7:00 AM to 7:29 AM | 100 (6.5%) | 159 (12.1%) |
| 7:30 AM to 7:59 AM | 178 (11.6%) | 307 (23.4%) |
| 8:00 AM to 8:29 AM | 169 (11.0%) | 240 (18.3%) |
| 8:30 AM to 8:59 AM | 104 (6.8%) | 54 (4.1%) |
| 9:00 AM to 9:59 AM | 35 (2.3%) | 19 (1.5%) |
| 10:00 AM to 10:59 AM | 8 (0.5%) | 71 (5.4%) |
| 11:00 AM to 11:59 AM | 49 (3.2%) | 47 (3.6%) |
| 12:00 PM to 3:59 PM | 158 (10.3%) | 102 (7.8%) |
| 4:00 PM to 11:59 PM | 184 (12.0%) | 79 (6.0%) |
| Total | 1,534 (100.0%) | 1,309 (100.0%) |
Housing Occupancy in Blakely borough
Occupancy by Ownership in Blakely borough
Of the total 3,009 dwellings in Blakely borough, owner-occupied units account for 2,117 (70.4%), while renter-occupied units make up 892 (29.6%).
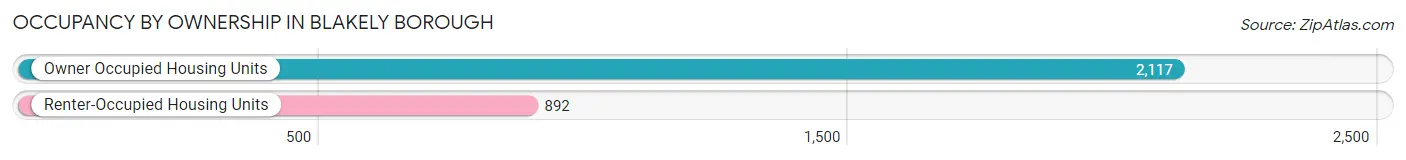
| Occupancy | # Housing Units | % Housing Units |
| Owner Occupied Housing Units | 2,117 | 70.4% |
| Renter-Occupied Housing Units | 892 | 29.6% |
| Total Occupied Housing Units | 3,009 | 100.0% |
Occupancy by Household Size in Blakely borough
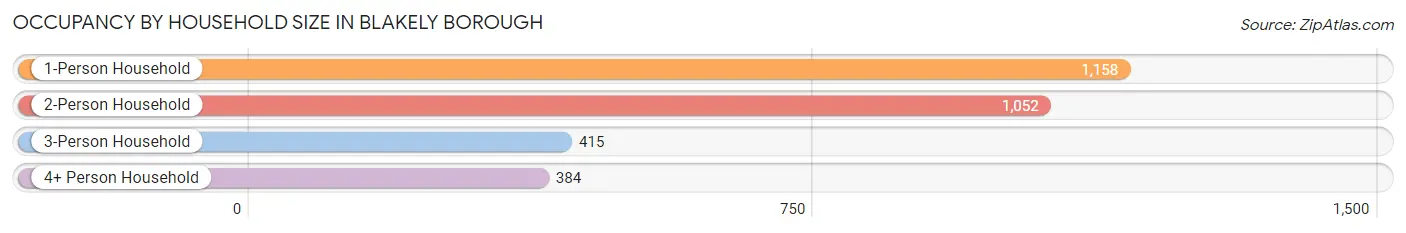
| Household Size | # Housing Units | % Housing Units |
| 1-Person Household | 1,158 | 38.5% |
| 2-Person Household | 1,052 | 35.0% |
| 3-Person Household | 415 | 13.8% |
| 4+ Person Household | 384 | 12.8% |
| Total Housing Units | 3,009 | 100.0% |
Occupancy by Ownership by Household Size in Blakely borough
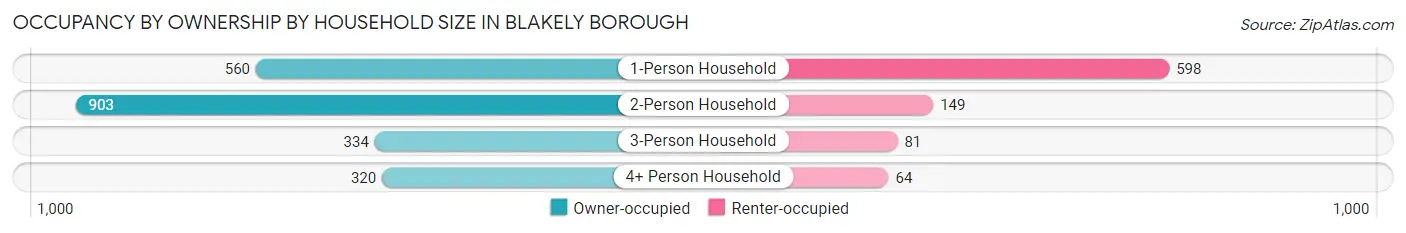
| Household Size | Owner-occupied | Renter-occupied |
| 1-Person Household | 560 (48.4%) | 598 (51.6%) |
| 2-Person Household | 903 (85.8%) | 149 (14.2%) |
| 3-Person Household | 334 (80.5%) | 81 (19.5%) |
| 4+ Person Household | 320 (83.3%) | 64 (16.7%) |
| Total Housing Units | 2,117 (70.4%) | 892 (29.6%) |
Occupancy by Educational Attainment in Blakely borough
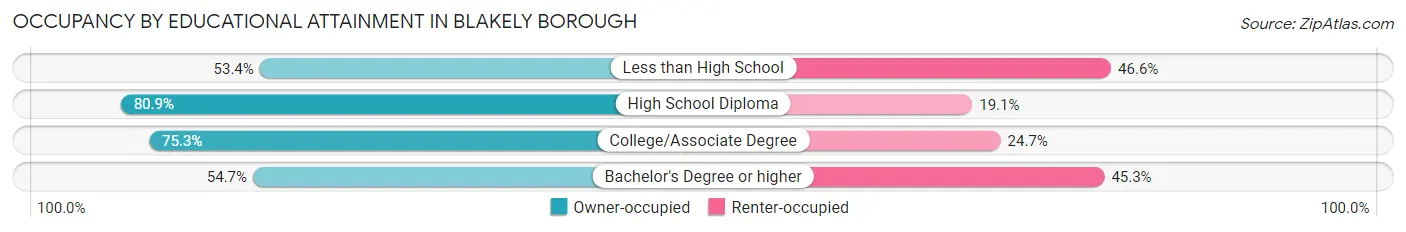
| Household Size | Owner-occupied | Renter-occupied |
| Less than High School | 47 (53.4%) | 41 (46.6%) |
| High School Diploma | 909 (80.9%) | 214 (19.1%) |
| College/Associate Degree | 647 (75.3%) | 212 (24.7%) |
| Bachelor's Degree or higher | 514 (54.7%) | 425 (45.3%) |
Occupancy by Age of Householder in Blakely borough
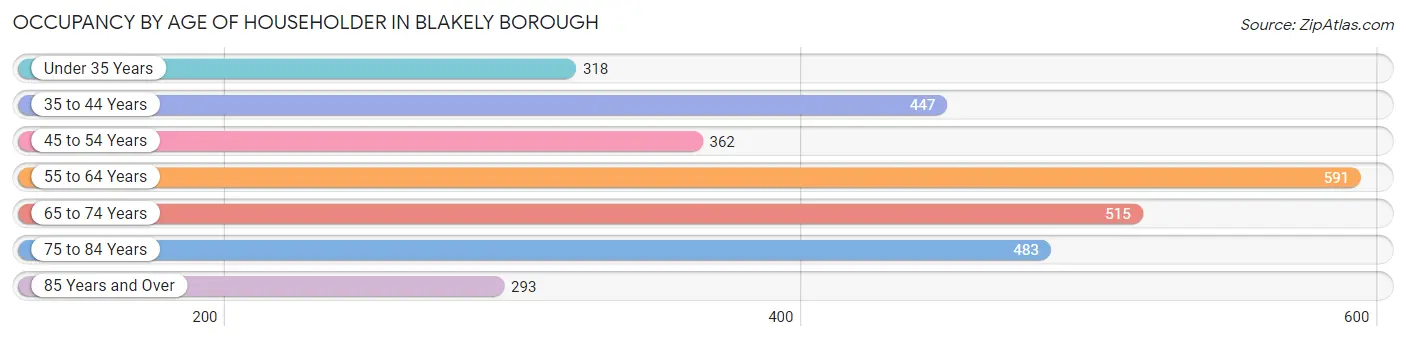
| Age Bracket | # Households | % Households |
| Under 35 Years | 318 | 10.6% |
| 35 to 44 Years | 447 | 14.9% |
| 45 to 54 Years | 362 | 12.0% |
| 55 to 64 Years | 591 | 19.6% |
| 65 to 74 Years | 515 | 17.1% |
| 75 to 84 Years | 483 | 16.1% |
| 85 Years and Over | 293 | 9.7% |
| Total | 3,009 | 100.0% |
Housing Finances in Blakely borough
Median Income by Occupancy in Blakely borough
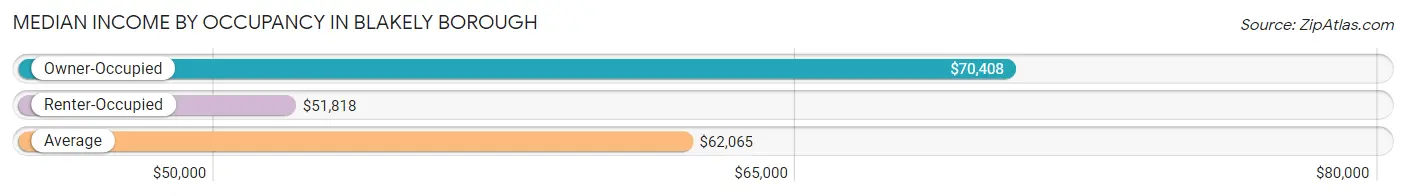
| Occupancy Type | # Households | Median Income |
| Owner-Occupied | 2,117 (70.4%) | $70,408 |
| Renter-Occupied | 892 (29.6%) | $51,818 |
| Average | 3,009 (100.0%) | $62,065 |
Occupancy by Householder Income Bracket in Blakely borough
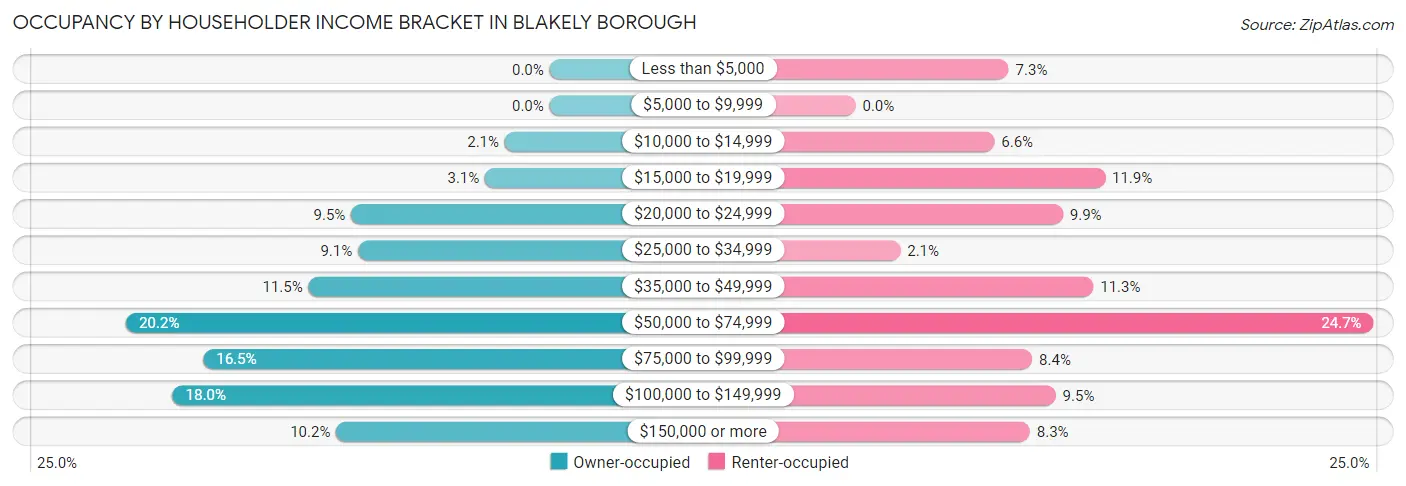
| Income Bracket | Owner-occupied | Renter-occupied |
| Less than $5,000 | 0 (0.0%) | 65 (7.3%) |
| $5,000 to $9,999 | 0 (0.0%) | 0 (0.0%) |
| $10,000 to $14,999 | 45 (2.1%) | 59 (6.6%) |
| $15,000 to $19,999 | 65 (3.1%) | 106 (11.9%) |
| $20,000 to $24,999 | 200 (9.5%) | 88 (9.9%) |
| $25,000 to $34,999 | 193 (9.1%) | 19 (2.1%) |
| $35,000 to $49,999 | 243 (11.5%) | 101 (11.3%) |
| $50,000 to $74,999 | 427 (20.2%) | 220 (24.7%) |
| $75,000 to $99,999 | 349 (16.5%) | 75 (8.4%) |
| $100,000 to $149,999 | 380 (17.9%) | 85 (9.5%) |
| $150,000 or more | 215 (10.2%) | 74 (8.3%) |
| Total | 2,117 (100.0%) | 892 (100.0%) |
Monthly Housing Cost Tiers in Blakely borough
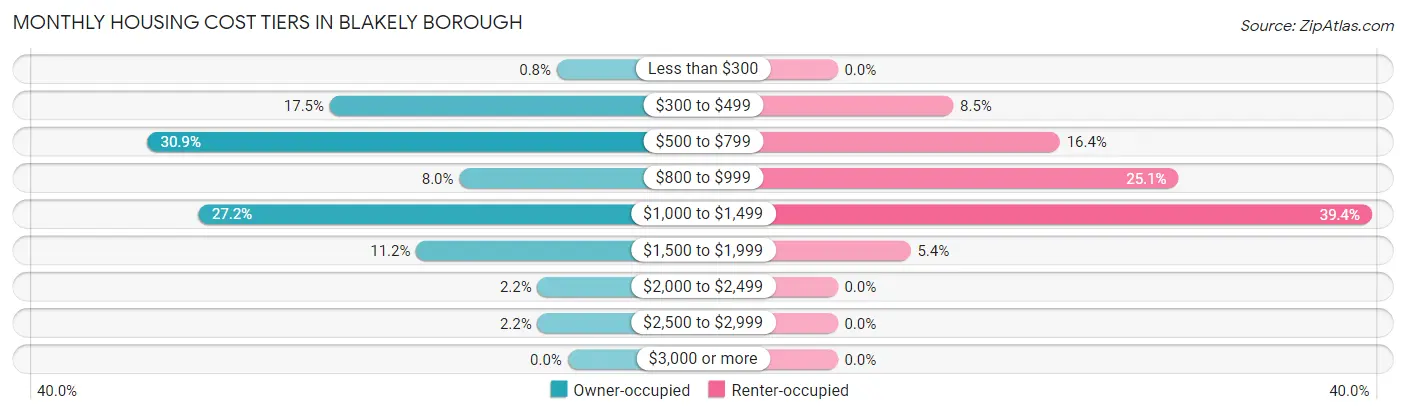
| Monthly Cost | Owner-occupied | Renter-occupied |
| Less than $300 | 17 (0.8%) | 0 (0.0%) |
| $300 to $499 | 371 (17.5%) | 76 (8.5%) |
| $500 to $799 | 655 (30.9%) | 146 (16.4%) |
| $800 to $999 | 169 (8.0%) | 224 (25.1%) |
| $1,000 to $1,499 | 575 (27.2%) | 351 (39.4%) |
| $1,500 to $1,999 | 236 (11.2%) | 48 (5.4%) |
| $2,000 to $2,499 | 47 (2.2%) | 0 (0.0%) |
| $2,500 to $2,999 | 47 (2.2%) | 0 (0.0%) |
| $3,000 or more | 0 (0.0%) | 0 (0.0%) |
| Total | 2,117 (100.0%) | 892 (100.0%) |
Physical Housing Characteristics in Blakely borough
Housing Structures in Blakely borough
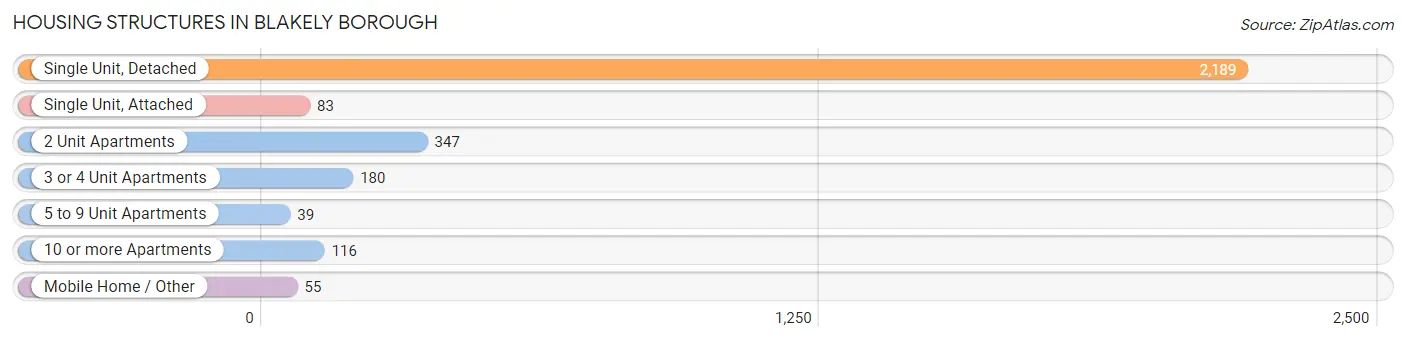
| Structure Type | # Housing Units | % Housing Units |
| Single Unit, Detached | 2,189 | 72.8% |
| Single Unit, Attached | 83 | 2.8% |
| 2 Unit Apartments | 347 | 11.5% |
| 3 or 4 Unit Apartments | 180 | 6.0% |
| 5 to 9 Unit Apartments | 39 | 1.3% |
| 10 or more Apartments | 116 | 3.9% |
| Mobile Home / Other | 55 | 1.8% |
| Total | 3,009 | 100.0% |
Housing Structures by Occupancy in Blakely borough
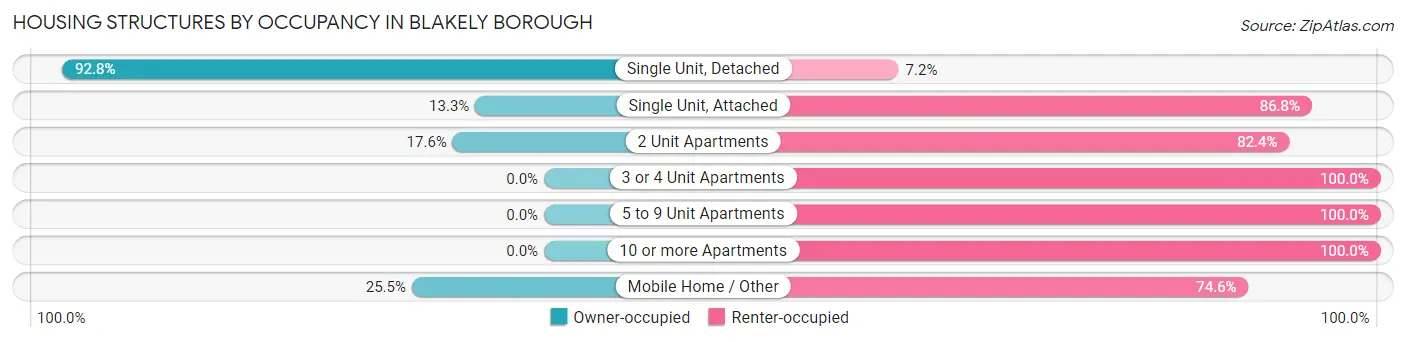
| Structure Type | Owner-occupied | Renter-occupied |
| Single Unit, Detached | 2,031 (92.8%) | 158 (7.2%) |
| Single Unit, Attached | 11 (13.3%) | 72 (86.8%) |
| 2 Unit Apartments | 61 (17.6%) | 286 (82.4%) |
| 3 or 4 Unit Apartments | 0 (0.0%) | 180 (100.0%) |
| 5 to 9 Unit Apartments | 0 (0.0%) | 39 (100.0%) |
| 10 or more Apartments | 0 (0.0%) | 116 (100.0%) |
| Mobile Home / Other | 14 (25.5%) | 41 (74.6%) |
| Total | 2,117 (70.4%) | 892 (29.6%) |
Housing Structures by Number of Rooms in Blakely borough
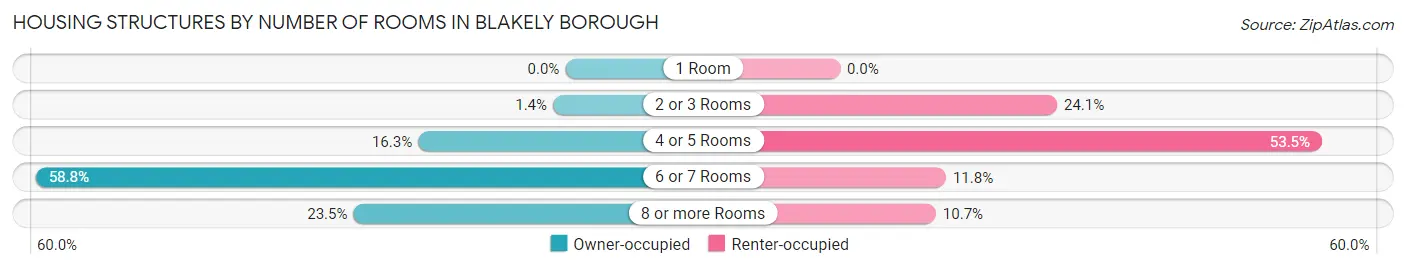
| Number of Rooms | Owner-occupied | Renter-occupied |
| 1 Room | 0 (0.0%) | 0 (0.0%) |
| 2 or 3 Rooms | 29 (1.4%) | 215 (24.1%) |
| 4 or 5 Rooms | 346 (16.3%) | 477 (53.5%) |
| 6 or 7 Rooms | 1,244 (58.8%) | 105 (11.8%) |
| 8 or more Rooms | 498 (23.5%) | 95 (10.6%) |
| Total | 2,117 (100.0%) | 892 (100.0%) |
Housing Structure by Heating Type in Blakely borough
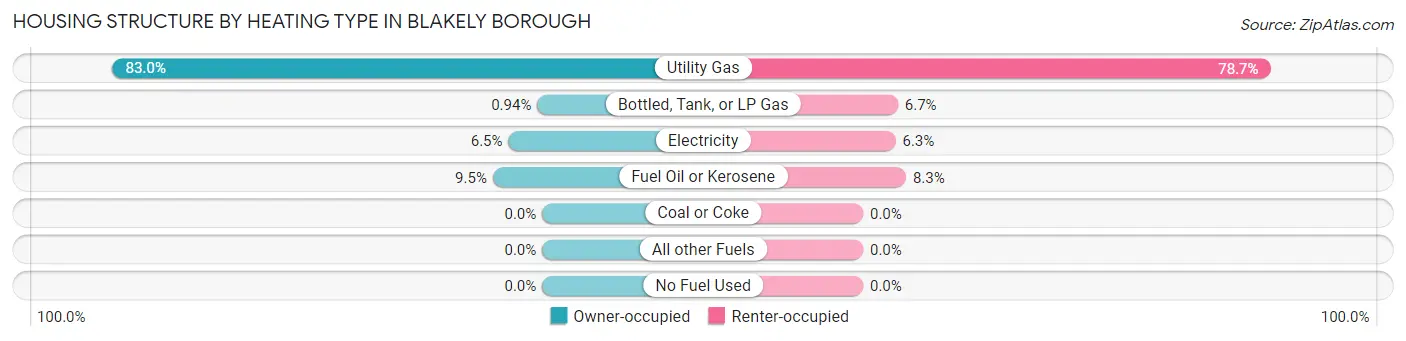
| Heating Type | Owner-occupied | Renter-occupied |
| Utility Gas | 1,757 (83.0%) | 702 (78.7%) |
| Bottled, Tank, or LP Gas | 20 (0.9%) | 60 (6.7%) |
| Electricity | 138 (6.5%) | 56 (6.3%) |
| Fuel Oil or Kerosene | 202 (9.5%) | 74 (8.3%) |
| Coal or Coke | 0 (0.0%) | 0 (0.0%) |
| All other Fuels | 0 (0.0%) | 0 (0.0%) |
| No Fuel Used | 0 (0.0%) | 0 (0.0%) |
| Total | 2,117 (100.0%) | 892 (100.0%) |
Household Vehicle Usage in Blakely borough
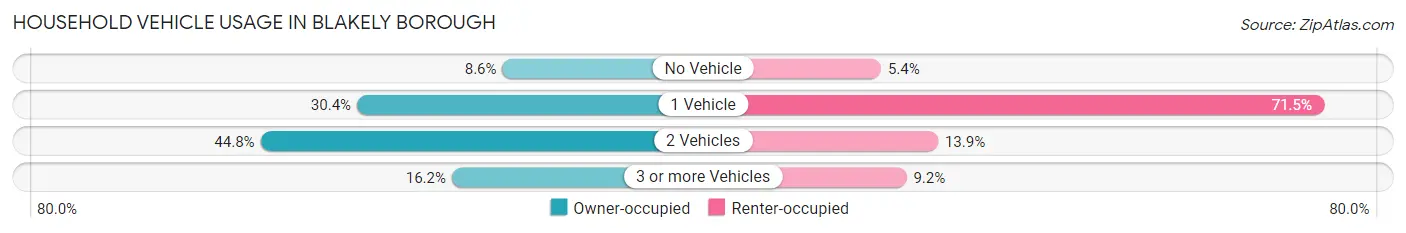
| Vehicles per Household | Owner-occupied | Renter-occupied |
| No Vehicle | 183 (8.6%) | 48 (5.4%) |
| 1 Vehicle | 643 (30.4%) | 638 (71.5%) |
| 2 Vehicles | 948 (44.8%) | 124 (13.9%) |
| 3 or more Vehicles | 343 (16.2%) | 82 (9.2%) |
| Total | 2,117 (100.0%) | 892 (100.0%) |
Real Estate & Mortgages in Blakely borough
Real Estate and Mortgage Overview in Blakely borough
| Characteristic | Without Mortgage | With Mortgage |
| Housing Units | 1,029 | 1,088 |
| Median Property Value | $159,700 | $173,300 |
| Median Household Income | $47,014 | $192 |
| Monthly Housing Costs | $580 | $0 |
| Real Estate Taxes | $2,115 | $0 |
Property Value by Mortgage Status in Blakely borough
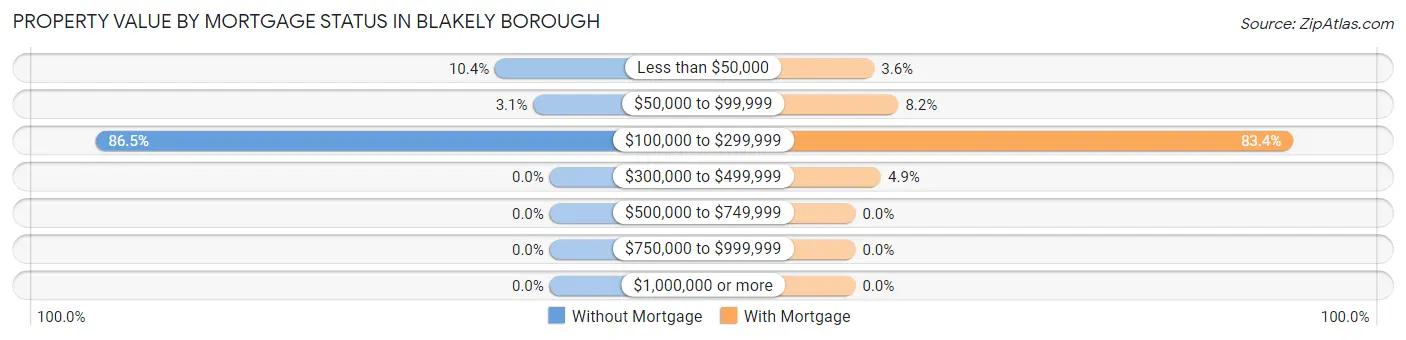
| Property Value | Without Mortgage | With Mortgage |
| Less than $50,000 | 107 (10.4%) | 39 (3.6%) |
| $50,000 to $99,999 | 32 (3.1%) | 89 (8.2%) |
| $100,000 to $299,999 | 890 (86.5%) | 907 (83.4%) |
| $300,000 to $499,999 | 0 (0.0%) | 53 (4.9%) |
| $500,000 to $749,999 | 0 (0.0%) | 0 (0.0%) |
| $750,000 to $999,999 | 0 (0.0%) | 0 (0.0%) |
| $1,000,000 or more | 0 (0.0%) | 0 (0.0%) |
| Total | 1,029 (100.0%) | 1,088 (100.0%) |
Household Income by Mortgage Status in Blakely borough
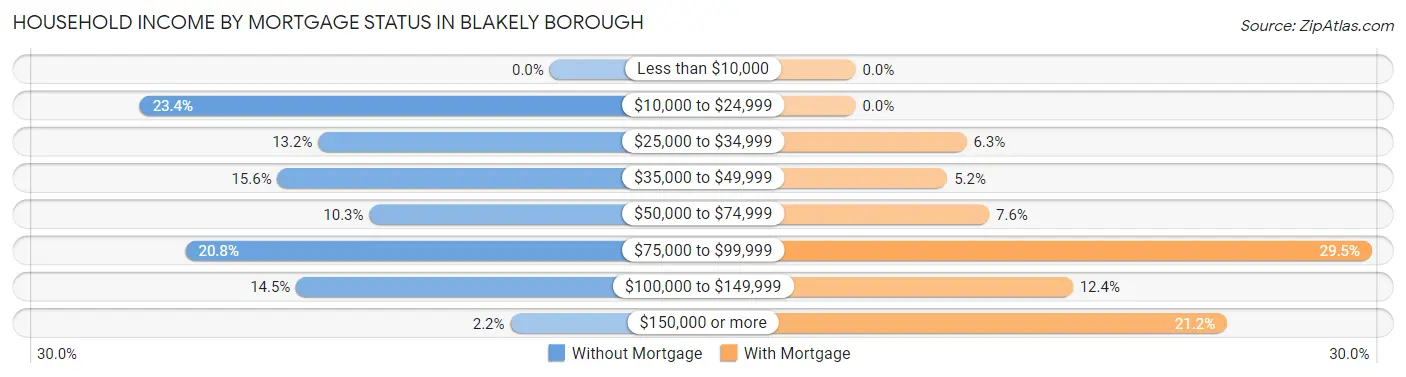
| Household Income | Without Mortgage | With Mortgage |
| Less than $10,000 | 0 (0.0%) | 0 (0.0%) |
| $10,000 to $24,999 | 241 (23.4%) | 0 (0.0%) |
| $25,000 to $34,999 | 136 (13.2%) | 69 (6.3%) |
| $35,000 to $49,999 | 160 (15.5%) | 57 (5.2%) |
| $50,000 to $74,999 | 106 (10.3%) | 83 (7.6%) |
| $75,000 to $99,999 | 214 (20.8%) | 321 (29.5%) |
| $100,000 to $149,999 | 149 (14.5%) | 135 (12.4%) |
| $150,000 or more | 23 (2.2%) | 231 (21.2%) |
| Total | 1,029 (100.0%) | 1,088 (100.0%) |
Property Value to Household Income Ratio in Blakely borough
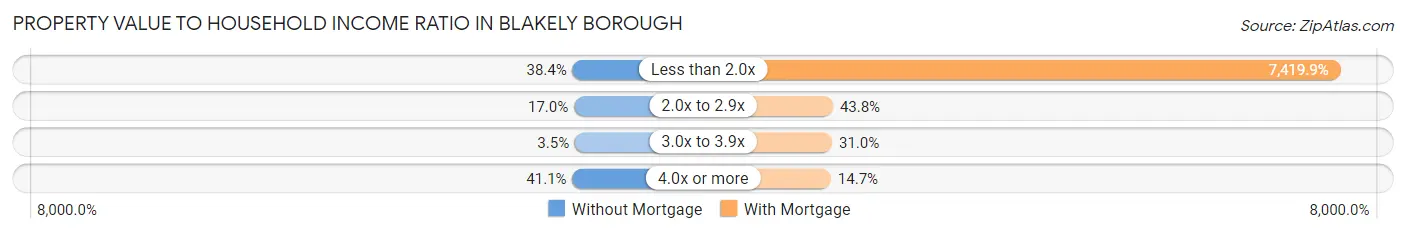
| Value-to-Income Ratio | Without Mortgage | With Mortgage |
| Less than 2.0x | 395 (38.4%) | 80,729 (7,419.9%) |
| 2.0x to 2.9x | 175 (17.0%) | 477 (43.8%) |
| 3.0x to 3.9x | 36 (3.5%) | 337 (31.0%) |
| 4.0x or more | 423 (41.1%) | 160 (14.7%) |
| Total | 1,029 (100.0%) | 1,088 (100.0%) |
Real Estate Taxes by Mortgage Status in Blakely borough
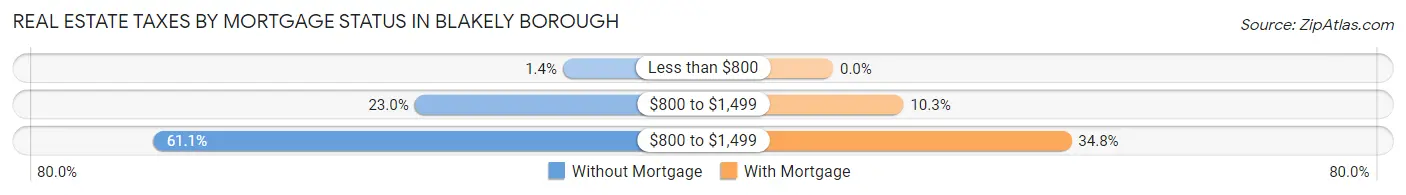
| Property Taxes | Without Mortgage | With Mortgage |
| Less than $800 | 14 (1.4%) | 0 (0.0%) |
| $800 to $1,499 | 237 (23.0%) | 112 (10.3%) |
| $800 to $1,499 | 629 (61.1%) | 379 (34.8%) |
| Total | 1,029 (100.0%) | 1,088 (100.0%) |
Health & Disability in Blakely borough
Health Insurance Coverage by Age in Blakely borough
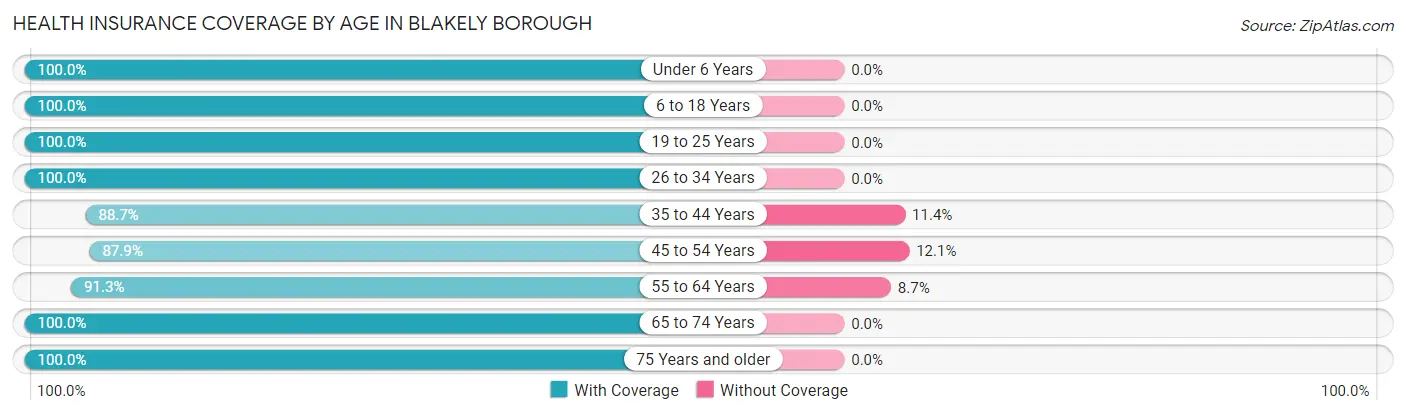
| Age Bracket | With Coverage | Without Coverage |
| Under 6 Years | 393 (100.0%) | 0 (0.0%) |
| 6 to 18 Years | 752 (100.0%) | 0 (0.0%) |
| 19 to 25 Years | 333 (100.0%) | 0 (0.0%) |
| 26 to 34 Years | 448 (100.0%) | 0 (0.0%) |
| 35 to 44 Years | 758 (88.6%) | 97 (11.4%) |
| 45 to 54 Years | 682 (87.9%) | 94 (12.1%) |
| 55 to 64 Years | 883 (91.3%) | 84 (8.7%) |
| 65 to 74 Years | 791 (100.0%) | 0 (0.0%) |
| 75 Years and older | 1,046 (100.0%) | 0 (0.0%) |
| Total | 6,086 (95.7%) | 275 (4.3%) |
Health Insurance Coverage by Citizenship Status in Blakely borough
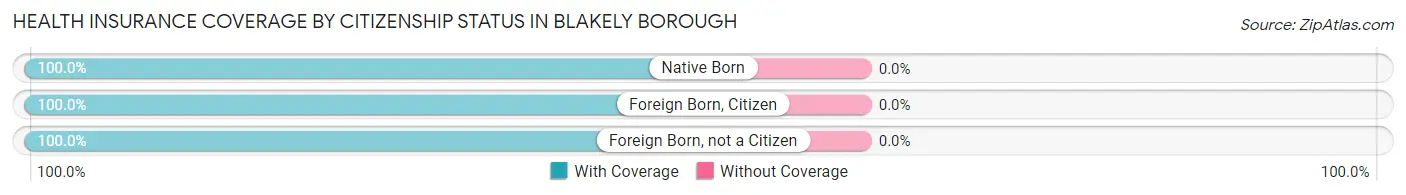
| Citizenship Status | With Coverage | Without Coverage |
| Native Born | 393 (100.0%) | 0 (0.0%) |
| Foreign Born, Citizen | 752 (100.0%) | 0 (0.0%) |
| Foreign Born, not a Citizen | 333 (100.0%) | 0 (0.0%) |
Health Insurance Coverage by Household Income in Blakely borough
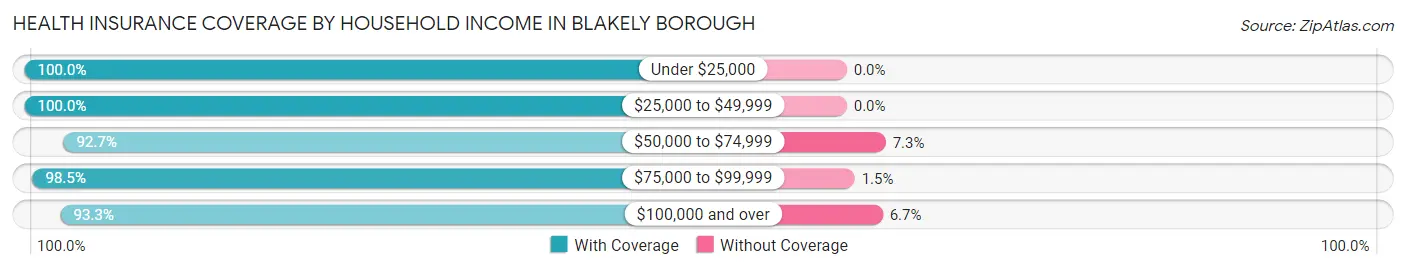
| Household Income | With Coverage | Without Coverage |
| Under $25,000 | 761 (100.0%) | 0 (0.0%) |
| $25,000 to $49,999 | 915 (100.0%) | 0 (0.0%) |
| $50,000 to $74,999 | 1,539 (92.7%) | 121 (7.3%) |
| $75,000 to $99,999 | 929 (98.5%) | 14 (1.5%) |
| $100,000 and over | 1,940 (93.3%) | 140 (6.7%) |
Public vs Private Health Insurance Coverage by Age in Blakely borough
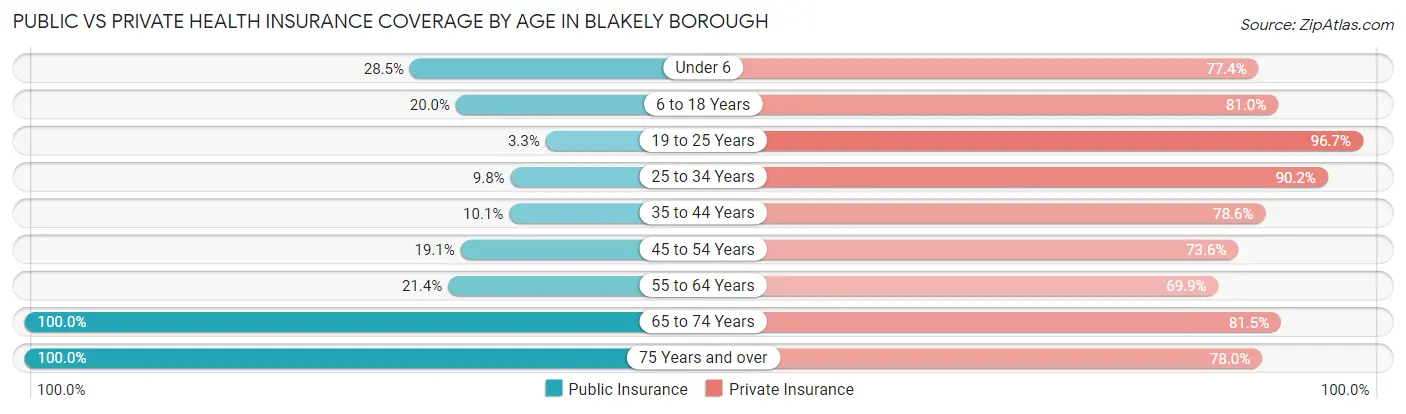
| Age Bracket | Public Insurance | Private Insurance |
| Under 6 | 112 (28.5%) | 304 (77.3%) |
| 6 to 18 Years | 150 (20.0%) | 609 (81.0%) |
| 19 to 25 Years | 11 (3.3%) | 322 (96.7%) |
| 25 to 34 Years | 44 (9.8%) | 404 (90.2%) |
| 35 to 44 Years | 86 (10.1%) | 672 (78.6%) |
| 45 to 54 Years | 148 (19.1%) | 571 (73.6%) |
| 55 to 64 Years | 207 (21.4%) | 676 (69.9%) |
| 65 to 74 Years | 791 (100.0%) | 645 (81.5%) |
| 75 Years and over | 1,046 (100.0%) | 816 (78.0%) |
| Total | 2,595 (40.8%) | 5,019 (78.9%) |
Disability Status by Sex by Age in Blakely borough
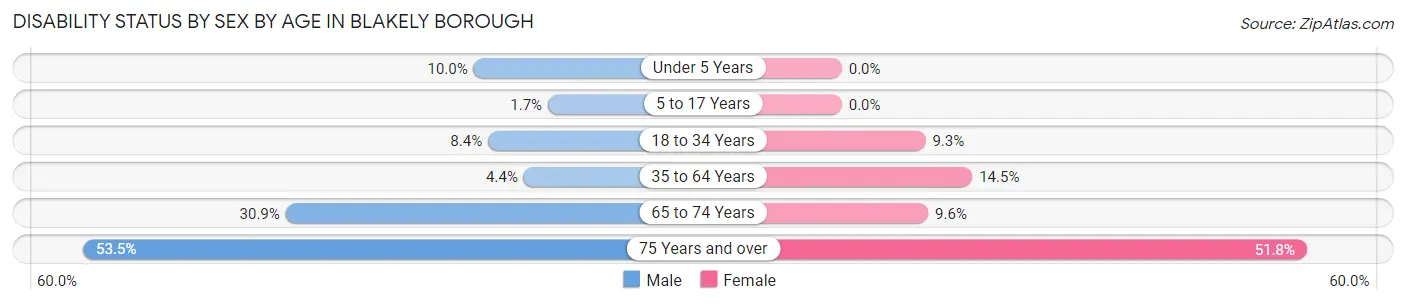
| Age Bracket | Male | Female |
| Under 5 Years | 18 (10.0%) | 0 (0.0%) |
| 5 to 17 Years | 7 (1.7%) | 0 (0.0%) |
| 18 to 34 Years | 25 (8.4%) | 45 (9.3%) |
| 35 to 64 Years | 53 (4.4%) | 203 (14.5%) |
| 65 to 74 Years | 116 (30.9%) | 40 (9.6%) |
| 75 Years and over | 169 (53.5%) | 378 (51.8%) |
Disability Class by Sex by Age in Blakely borough
Disability Class: Hearing Difficulty
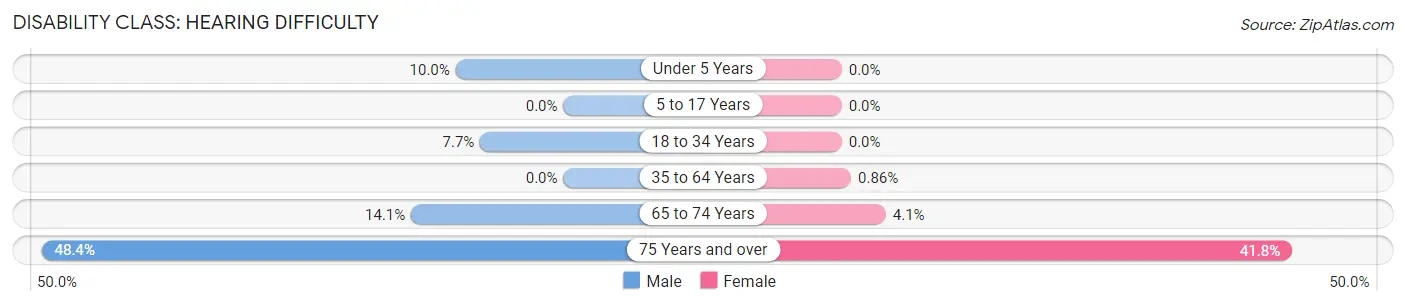
| Age Bracket | Male | Female |
| Under 5 Years | 18 (10.0%) | 0 (0.0%) |
| 5 to 17 Years | 0 (0.0%) | 0 (0.0%) |
| 18 to 34 Years | 23 (7.7%) | 0 (0.0%) |
| 35 to 64 Years | 0 (0.0%) | 12 (0.9%) |
| 65 to 74 Years | 53 (14.1%) | 17 (4.1%) |
| 75 Years and over | 153 (48.4%) | 305 (41.8%) |
Disability Class: Vision Difficulty
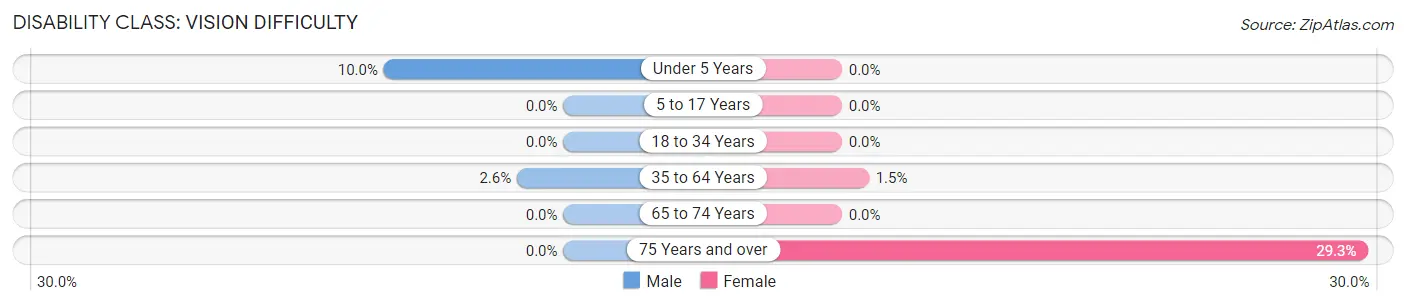
| Age Bracket | Male | Female |
| Under 5 Years | 18 (10.0%) | 0 (0.0%) |
| 5 to 17 Years | 0 (0.0%) | 0 (0.0%) |
| 18 to 34 Years | 0 (0.0%) | 0 (0.0%) |
| 35 to 64 Years | 31 (2.6%) | 21 (1.5%) |
| 65 to 74 Years | 0 (0.0%) | 0 (0.0%) |
| 75 Years and over | 0 (0.0%) | 214 (29.3%) |
Disability Class: Cognitive Difficulty
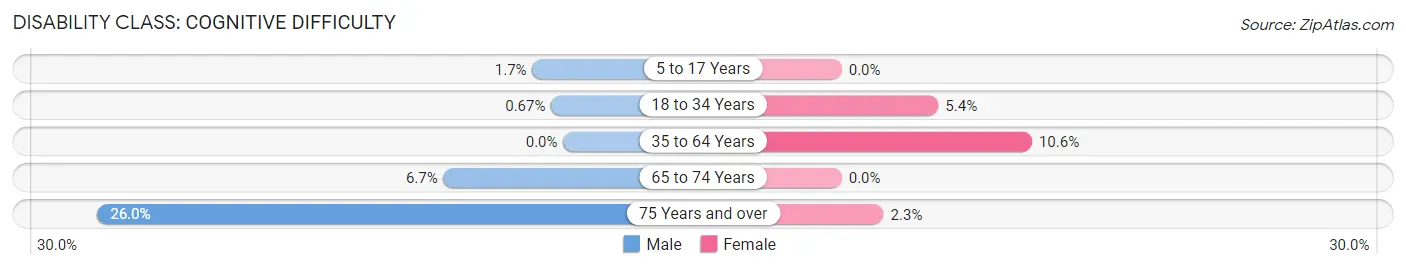
| Age Bracket | Male | Female |
| 5 to 17 Years | 7 (1.7%) | 0 (0.0%) |
| 18 to 34 Years | 2 (0.7%) | 26 (5.4%) |
| 35 to 64 Years | 0 (0.0%) | 148 (10.6%) |
| 65 to 74 Years | 25 (6.7%) | 0 (0.0%) |
| 75 Years and over | 82 (26.0%) | 17 (2.3%) |
Disability Class: Ambulatory Difficulty
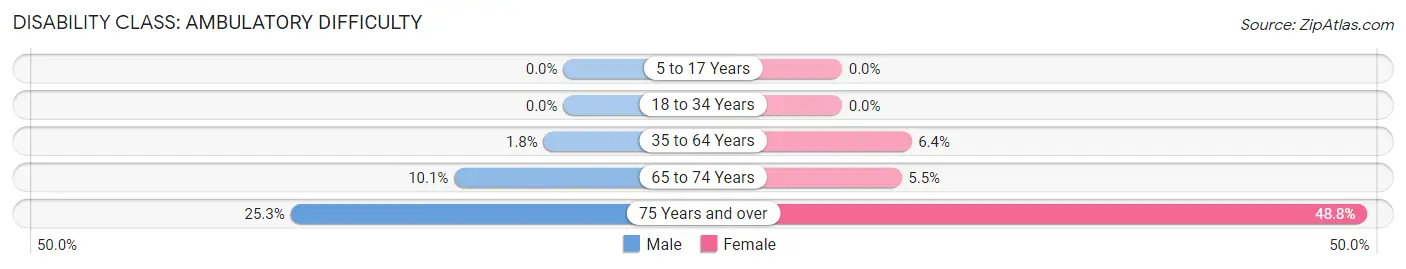
| Age Bracket | Male | Female |
| 5 to 17 Years | 0 (0.0%) | 0 (0.0%) |
| 18 to 34 Years | 0 (0.0%) | 0 (0.0%) |
| 35 to 64 Years | 22 (1.8%) | 90 (6.4%) |
| 65 to 74 Years | 38 (10.1%) | 23 (5.5%) |
| 75 Years and over | 80 (25.3%) | 356 (48.8%) |
Disability Class: Self-Care Difficulty
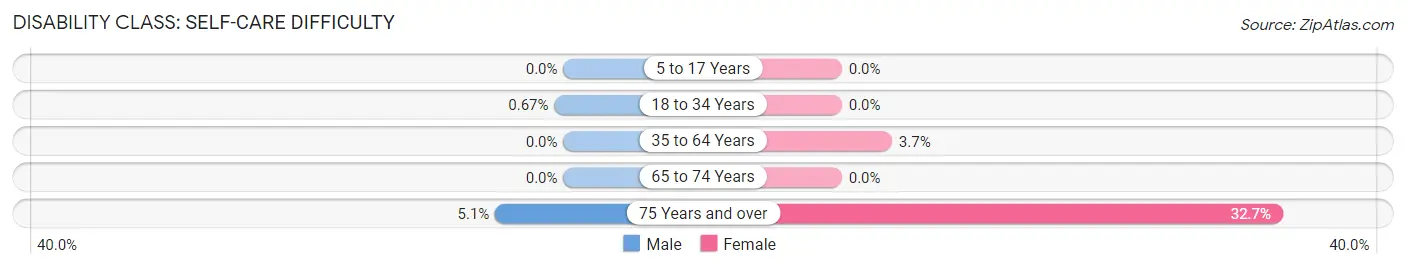
| Age Bracket | Male | Female |
| 5 to 17 Years | 0 (0.0%) | 0 (0.0%) |
| 18 to 34 Years | 2 (0.7%) | 0 (0.0%) |
| 35 to 64 Years | 0 (0.0%) | 52 (3.7%) |
| 65 to 74 Years | 0 (0.0%) | 0 (0.0%) |
| 75 Years and over | 16 (5.1%) | 239 (32.7%) |
Technology Access in Blakely borough
Computing Device Access in Blakely borough
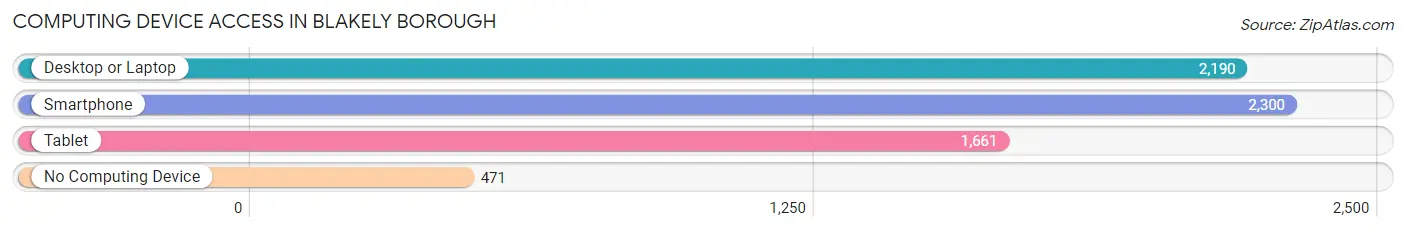
| Device Type | # Households | % Households |
| Desktop or Laptop | 2,190 | 72.8% |
| Smartphone | 2,300 | 76.4% |
| Tablet | 1,661 | 55.2% |
| No Computing Device | 471 | 15.7% |
| Total | 3,009 | 100.0% |
Internet Access in Blakely borough
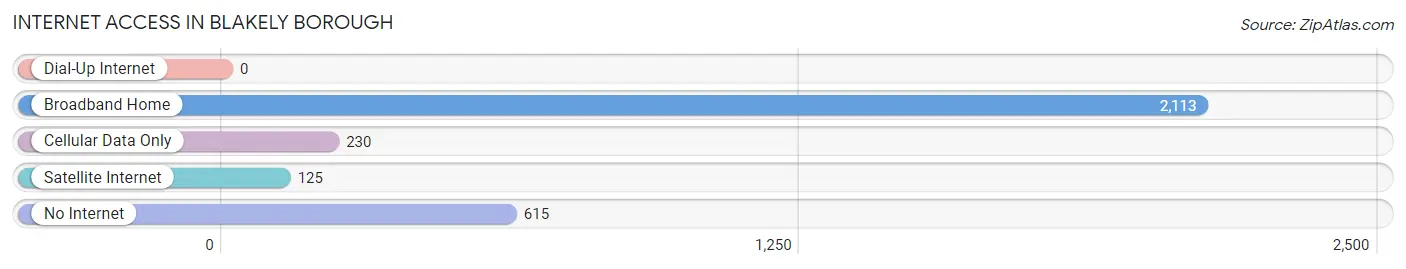
| Internet Type | # Households | % Households |
| Dial-Up Internet | 0 | 0.0% |
| Broadband Home | 2,113 | 70.2% |
| Cellular Data Only | 230 | 7.6% |
| Satellite Internet | 125 | 4.2% |
| No Internet | 615 | 20.4% |
| Total | 3,009 | 100.0% |
Blakely borough Summary
Blakely Borough is a small borough located in Lackawanna County, Pennsylvania. It is situated in the heart of the Pocono Mountains and is part of the Scranton–Wilkes-Barre–Hazleton Metropolitan Statistical Area. The borough was incorporated in 1876 and has a population of approximately 2,500 people.
Geography
Blakely Borough is located in the Pocono Mountains of northeastern Pennsylvania. It is situated in the Lackawanna River Valley, which is part of the larger Susquehanna River Valley. The borough is bordered by the boroughs of Olyphant and Dickson City to the north, the townships of Jefferson and Roaring Brook to the east, the boroughs of Archbald and Jessup to the south, and the boroughs of Throop and Dunmore to the west. The borough covers an area of 1.2 square miles and is located at an elevation of 1,000 feet above sea level.
The borough is located in a region of Pennsylvania known as the Endless Mountains. The area is characterized by rolling hills, forests, and streams. The borough is home to several parks, including Blakely Borough Park, which features a playground, basketball court, and picnic area. The borough is also home to the Lackawanna River, which is a popular destination for fishing and canoeing.
Economy
The economy of Blakely Borough is largely based on the service industry. The borough is home to several restaurants, retail stores, and other businesses. The borough is also home to several manufacturing companies, including a paper mill and a plastics factory. The borough is also home to a number of small businesses, including a bakery, a florist, and a furniture store.
Demographics
As of the 2010 census, the population of Blakely Borough was 2,521. The racial makeup of the borough was 97.2% White, 0.9% African American, 0.3% Native American, 0.4% Asian, 0.1% Pacific Islander, 0.3% from other races, and 0.8% from two or more races. Hispanic or Latino of any race were 1.2% of the population.
The median household income in Blakely Borough was $37,917, and the median family income was $45,938. The per capita income for the borough was $19,945. About 11.2% of families and 13.2% of the population were below the poverty line, including 17.2% of those under age 18 and 8.2% of those age 65 or over.
Conclusion
Blakely Borough is a small borough located in Lackawanna County, Pennsylvania. It is situated in the heart of the Pocono Mountains and is part of the Scranton–Wilkes-Barre–Hazleton Metropolitan Statistical Area. The borough was incorporated in 1876 and has a population of approximately 2,500 people. The economy of Blakely Borough is largely based on the service industry, and the borough is home to several manufacturing companies. The racial makeup of the borough is predominantly White, with a small percentage of African American, Native American, Asian, and Pacific Islander residents. The median household income in Blakely Borough is $37,917, and the per capita income is $19,945.
Common Questions
What is Per Capita Income in Blakely borough?
Per Capita income in Blakely borough is $34,493.
What is the Median Family Income in Blakely borough?
Median Family Income in Blakely borough is $81,768.
What is the Median Household income in Blakely borough?
Median Household Income in Blakely borough is $62,065.
What is Income or Wage Gap in Blakely borough?
Income or Wage Gap in Blakely borough is 24.9%.
Women in Blakely borough earn 75.1 cents for every dollar earned by a man.
What is Inequality or Gini Index in Blakely borough?
Inequality or Gini Index in Blakely borough is 0.38.
What is the Total Population of Blakely borough?
Total Population of Blakely borough is 6,646.
What is the Total Male Population of Blakely borough?
Total Male Population of Blakely borough is 2,814.
What is the Total Female Population of Blakely borough?
Total Female Population of Blakely borough is 3,832.
What is the Ratio of Males per 100 Females in Blakely borough?
There are 73.43 Males per 100 Females in Blakely borough.
What is the Ratio of Females per 100 Males in Blakely borough?
There are 136.18 Females per 100 Males in Blakely borough.
What is the Median Population Age in Blakely borough?
Median Population Age in Blakely borough is 52.8 Years.
What is the Average Family Size in Blakely borough
Average Family Size in Blakely borough is 2.8 People.
What is the Average Household Size in Blakely borough
Average Household Size in Blakely borough is 2.1 People.
How Large is the Labor Force in Blakely borough?
There are 3,276 People in the Labor Forcein in Blakely borough.
What is the Percentage of People in the Labor Force in Blakely borough?
58.3% of People are in the Labor Force in Blakely borough.
What is the Unemployment Rate in Blakely borough?
Unemployment Rate in Blakely borough is 3.5%.