Ransomville, NY Map & Demographics
Ransomville Map
Ransomville Overview
$32,608
PER CAPITA INCOME
$113,571
AVG FAMILY INCOME
$78,854
AVG HOUSEHOLD INCOME
0.8%
WAGE / INCOME GAP [ % ]
99.2¢/ $1
WAGE / INCOME GAP [ $ ]
0.38
INEQUALITY / GINI INDEX
1,554
TOTAL POPULATION
828
MALE POPULATION
726
FEMALE POPULATION
114.05
MALES / 100 FEMALES
87.68
FEMALES / 100 MALES
42.8
MEDIAN AGE
3.3
AVG FAMILY SIZE
2.8
AVG HOUSEHOLD SIZE
887
LABOR FORCE [ PEOPLE ]
69.3%
PERCENT IN LABOR FORCE
3.5%
UNEMPLOYMENT RATE
Ransomville Zip Codes
Ransomville Area Codes
Income in Ransomville
Income Overview in Ransomville
Per Capita Income in Ransomville is $32,608, while median incomes of families and households are $113,571 and $78,854 respectively.
| Characteristic | Number | Measure |
| Per Capita Income | 1,554 | $32,608 |
| Median Family Income | 386 | $113,571 |
| Mean Family Income | 386 | $108,775 |
| Median Household Income | 537 | $78,854 |
| Mean Household Income | 537 | $91,487 |
| Income Deficit | 386 | $0 |
| Wage / Income Gap (%) | 1,554 | 0.83% |
| Wage / Income Gap ($) | 1,554 | 99.17¢ per $1 |
| Gini / Inequality Index | 1,554 | 0.38 |
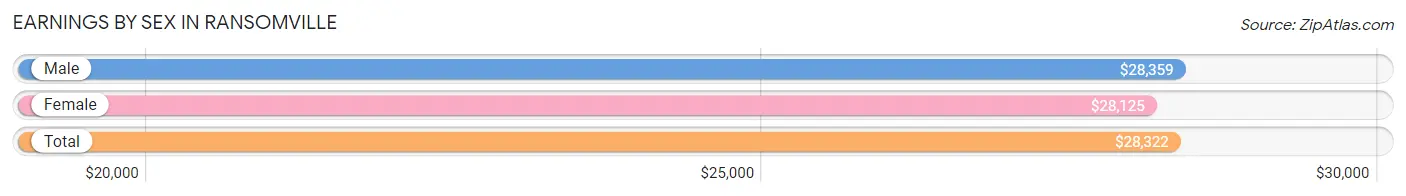
Earnings by Sex in Ransomville
Average Earnings in Ransomville are $28,322, $28,359 for men and $28,125 for women, a difference of 0.8%.
| Sex | Number | Average Earnings |
| Male | 512 (52.2%) | $28,359 |
| Female | 468 (47.8%) | $28,125 |
| Total | 980 (100.0%) | $28,322 |
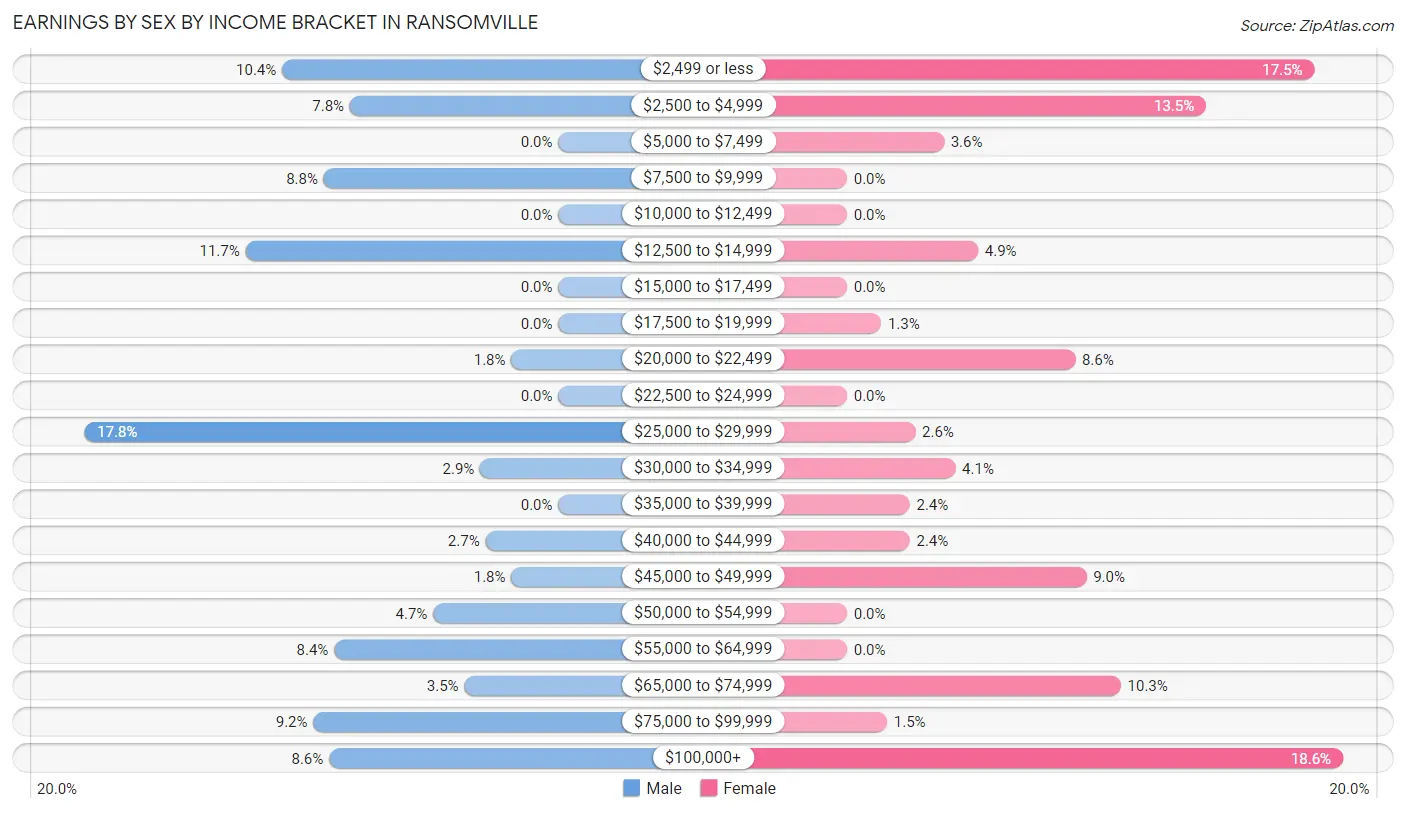
Earnings by Sex by Income Bracket in Ransomville
The most common earnings brackets in Ransomville are $25,000 to $29,999 for men (91 | 17.8%) and $100,000+ for women (87 | 18.6%).
| Income | Male | Female |
| $2,499 or less | 53 (10.3%) | 82 (17.5%) |
| $2,500 to $4,999 | 40 (7.8%) | 63 (13.5%) |
| $5,000 to $7,499 | 0 (0.0%) | 17 (3.6%) |
| $7,500 to $9,999 | 45 (8.8%) | 0 (0.0%) |
| $10,000 to $12,499 | 0 (0.0%) | 0 (0.0%) |
| $12,500 to $14,999 | 60 (11.7%) | 23 (4.9%) |
| $15,000 to $17,499 | 0 (0.0%) | 0 (0.0%) |
| $17,500 to $19,999 | 0 (0.0%) | 6 (1.3%) |
| $20,000 to $22,499 | 9 (1.8%) | 40 (8.6%) |
| $22,500 to $24,999 | 0 (0.0%) | 0 (0.0%) |
| $25,000 to $29,999 | 91 (17.8%) | 12 (2.6%) |
| $30,000 to $34,999 | 15 (2.9%) | 19 (4.1%) |
| $35,000 to $39,999 | 0 (0.0%) | 11 (2.4%) |
| $40,000 to $44,999 | 14 (2.7%) | 11 (2.4%) |
| $45,000 to $49,999 | 9 (1.8%) | 42 (9.0%) |
| $50,000 to $54,999 | 24 (4.7%) | 0 (0.0%) |
| $55,000 to $64,999 | 43 (8.4%) | 0 (0.0%) |
| $65,000 to $74,999 | 18 (3.5%) | 48 (10.3%) |
| $75,000 to $99,999 | 47 (9.2%) | 7 (1.5%) |
| $100,000+ | 44 (8.6%) | 87 (18.6%) |
| Total | 512 (100.0%) | 468 (100.0%) |
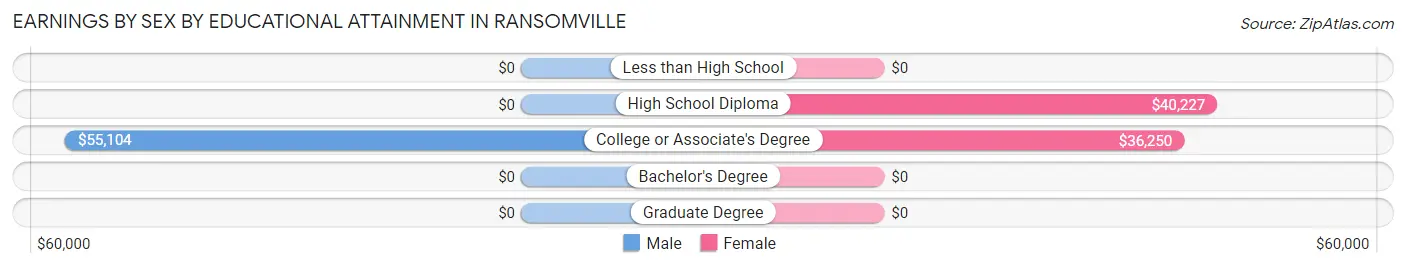
Earnings by Sex by Educational Attainment in Ransomville
Average earnings in Ransomville are $44,911 for men and $47,991 for women, a difference of 6.4%. Men with an educational attainment of college or associate's degree enjoy the highest average annual earnings of $55,104, while those with college or associate's degree education earn the least with $55,104. Women with an educational attainment of high school diploma earn the most with the average annual earnings of $40,227, while those with college or associate's degree education have the smallest earnings of $36,250.
| Educational Attainment | Male Income | Female Income |
| Less than High School | - | - |
| High School Diploma | - | - |
| College or Associate's Degree | $55,104 | $36,250 |
| Bachelor's Degree | - | - |
| Graduate Degree | - | - |
| Total | $44,911 | $47,991 |
Family Income in Ransomville
Family Income Brackets in Ransomville
According to the Ransomville family income data, there are 122 families falling into the $150,000 to $199,999 income range, which is the most common income bracket and makes up 31.6% of all families.
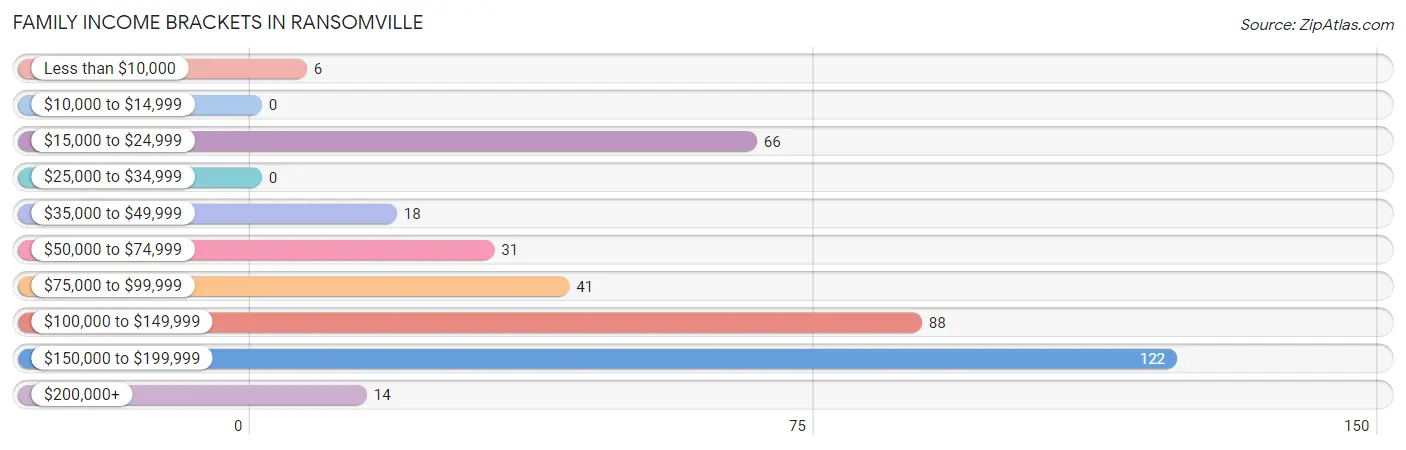
| Income Bracket | # Families | % Families |
| Less than $10,000 | 6 | 1.6% |
| $10,000 to $14,999 | 0 | 0.0% |
| $15,000 to $24,999 | 66 | 17.1% |
| $25,000 to $34,999 | 0 | 0.0% |
| $35,000 to $49,999 | 18 | 4.7% |
| $50,000 to $74,999 | 31 | 8.0% |
| $75,000 to $99,999 | 41 | 10.6% |
| $100,000 to $149,999 | 88 | 22.8% |
| $150,000 to $199,999 | 122 | 31.6% |
| $200,000+ | 14 | 3.6% |
Family Income by Famaliy Size in Ransomville
5-person families (70 | 18.1%) account for the highest median family income in Ransomville with $160,817 per family, while 3-person families (59 | 15.3%) have the highest median income of $33,512 per family member.
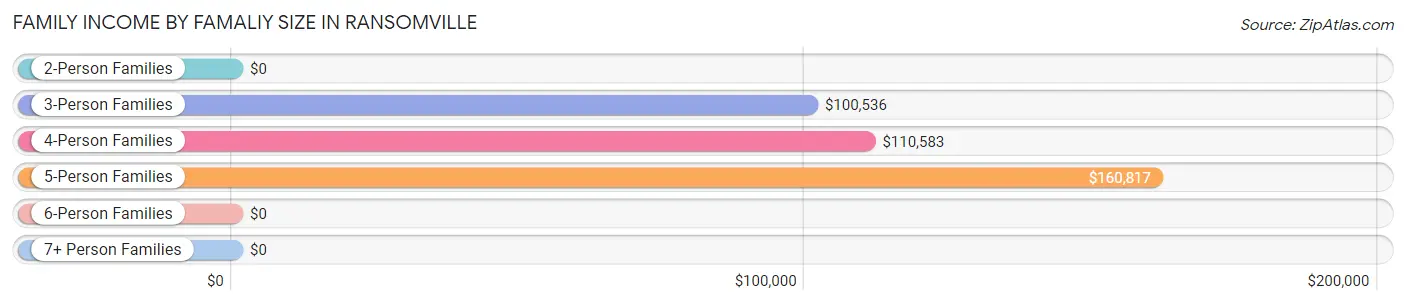
| Income Bracket | # Families | Median Income |
| 2-Person Families | 154 (39.9%) | $0 |
| 3-Person Families | 59 (15.3%) | $100,536 |
| 4-Person Families | 103 (26.7%) | $110,583 |
| 5-Person Families | 70 (18.1%) | $160,817 |
| 6-Person Families | 0 (0.0%) | $0 |
| 7+ Person Families | 0 (0.0%) | $0 |
| Total | 386 (100.0%) | $113,571 |
Family Income by Number of Earners in Ransomville
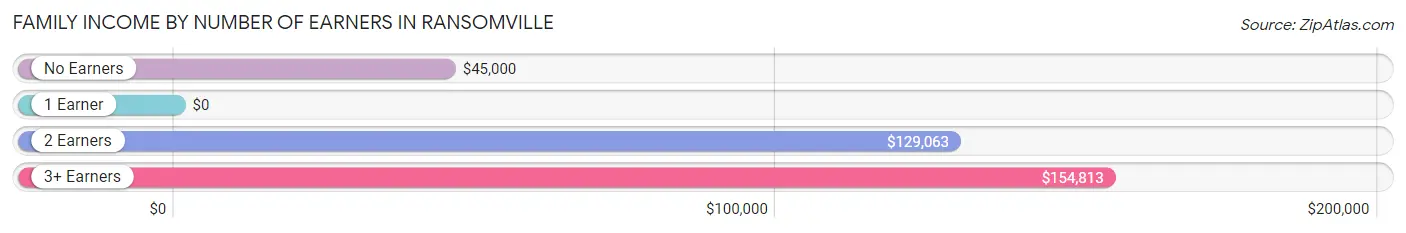
| Number of Earners | # Families | Median Income |
| No Earners | 44 (11.4%) | $45,000 |
| 1 Earner | 128 (33.2%) | $0 |
| 2 Earners | 81 (21.0%) | $129,063 |
| 3+ Earners | 133 (34.5%) | $154,813 |
| Total | 386 (100.0%) | $113,571 |
Household Income in Ransomville
Household Income Brackets in Ransomville
With 122 households falling in the category, the $150,000 to $199,999 income range is the most frequent in Ransomville, accounting for 22.7% of all households.
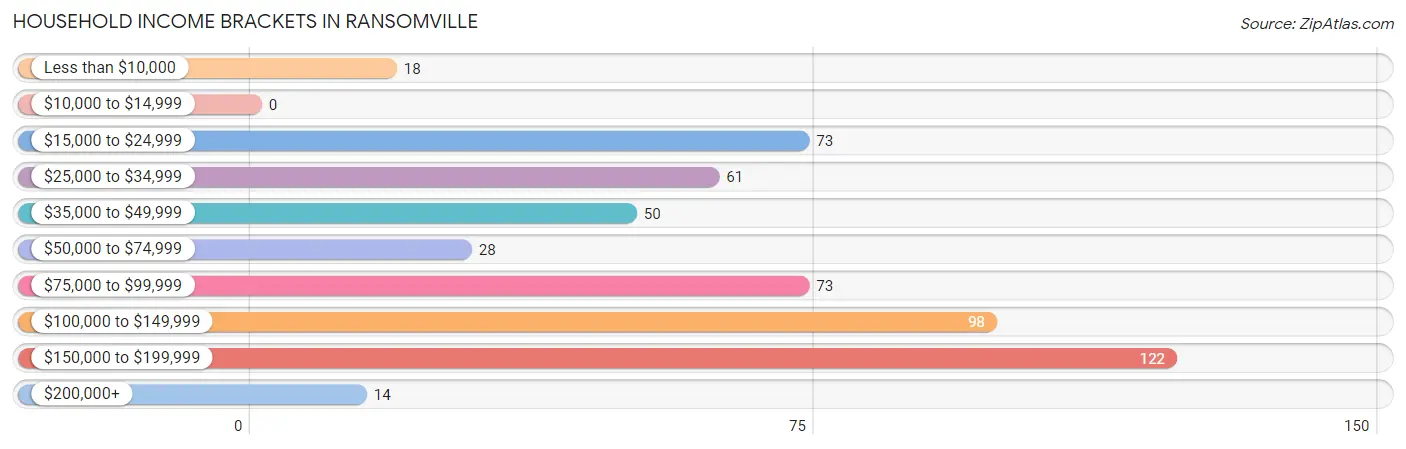
| Income Bracket | # Households | % Households |
| Less than $10,000 | 18 | 3.4% |
| $10,000 to $14,999 | 0 | 0.0% |
| $15,000 to $24,999 | 73 | 13.6% |
| $25,000 to $34,999 | 61 | 11.4% |
| $35,000 to $49,999 | 50 | 9.3% |
| $50,000 to $74,999 | 28 | 5.2% |
| $75,000 to $99,999 | 73 | 13.6% |
| $100,000 to $149,999 | 98 | 18.2% |
| $150,000 to $199,999 | 122 | 22.7% |
| $200,000+ | 14 | 2.6% |
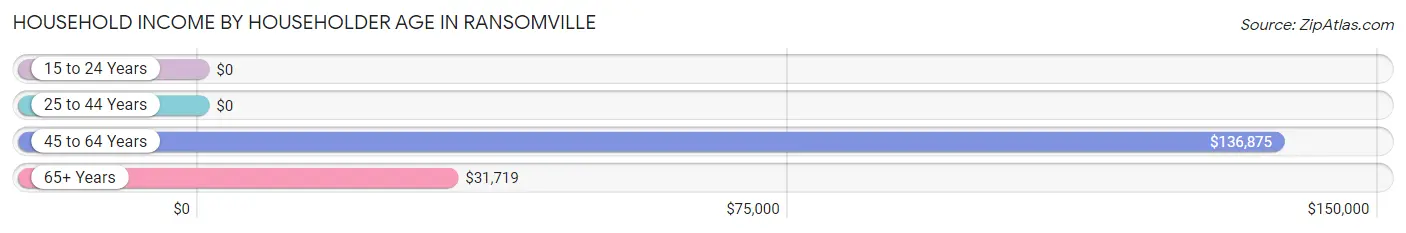
Household Income by Householder Age in Ransomville
The median household income in Ransomville is $78,854, with the highest median household income of $136,875 found in the 45 to 64 years age bracket for the primary householder. A total of 277 households (51.6%) fall into this category.
| Income Bracket | # Households | Median Income |
| 15 to 24 Years | 0 (0.0%) | $0 |
| 25 to 44 Years | 143 (26.6%) | $0 |
| 45 to 64 Years | 277 (51.6%) | $136,875 |
| 65+ Years | 117 (21.8%) | $31,719 |
| Total | 537 (100.0%) | $78,854 |
Poverty in Ransomville
Income Below Poverty by Sex and Age in Ransomville
With 6.4% poverty level for males and 12.4% for females among the residents of Ransomville, 5 year old males and 12 to 14 year old females are the most vulnerable to poverty, with 28 males (66.7%) and 28 females (73.7%) in their respective age groups living below the poverty level.
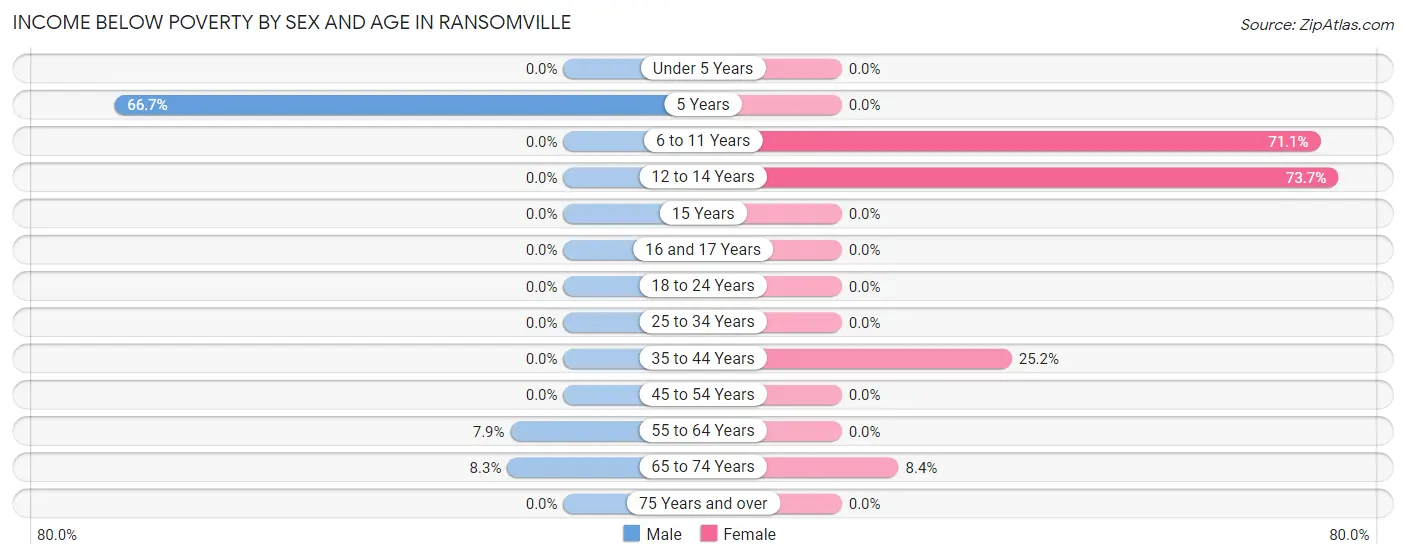
| Age Bracket | Male | Female |
| Under 5 Years | 0 (0.0%) | 0 (0.0%) |
| 5 Years | 28 (66.7%) | 0 (0.0%) |
| 6 to 11 Years | 0 (0.0%) | 27 (71.1%) |
| 12 to 14 Years | 0 (0.0%) | 28 (73.7%) |
| 15 Years | 0 (0.0%) | 0 (0.0%) |
| 16 and 17 Years | 0 (0.0%) | 0 (0.0%) |
| 18 to 24 Years | 0 (0.0%) | 0 (0.0%) |
| 25 to 34 Years | 0 (0.0%) | 0 (0.0%) |
| 35 to 44 Years | 0 (0.0%) | 26 (25.2%) |
| 45 to 54 Years | 0 (0.0%) | 0 (0.0%) |
| 55 to 64 Years | 17 (7.9%) | 0 (0.0%) |
| 65 to 74 Years | 6 (8.3%) | 7 (8.4%) |
| 75 Years and over | 0 (0.0%) | 0 (0.0%) |
| Total | 51 (6.4%) | 88 (12.4%) |
Income Above Poverty by Sex and Age in Ransomville
According to the poverty statistics in Ransomville, males aged under 5 years and females aged 16 and 17 years are the age groups that are most secure financially, with 100.0% of males and 100.0% of females in these age groups living above the poverty line.
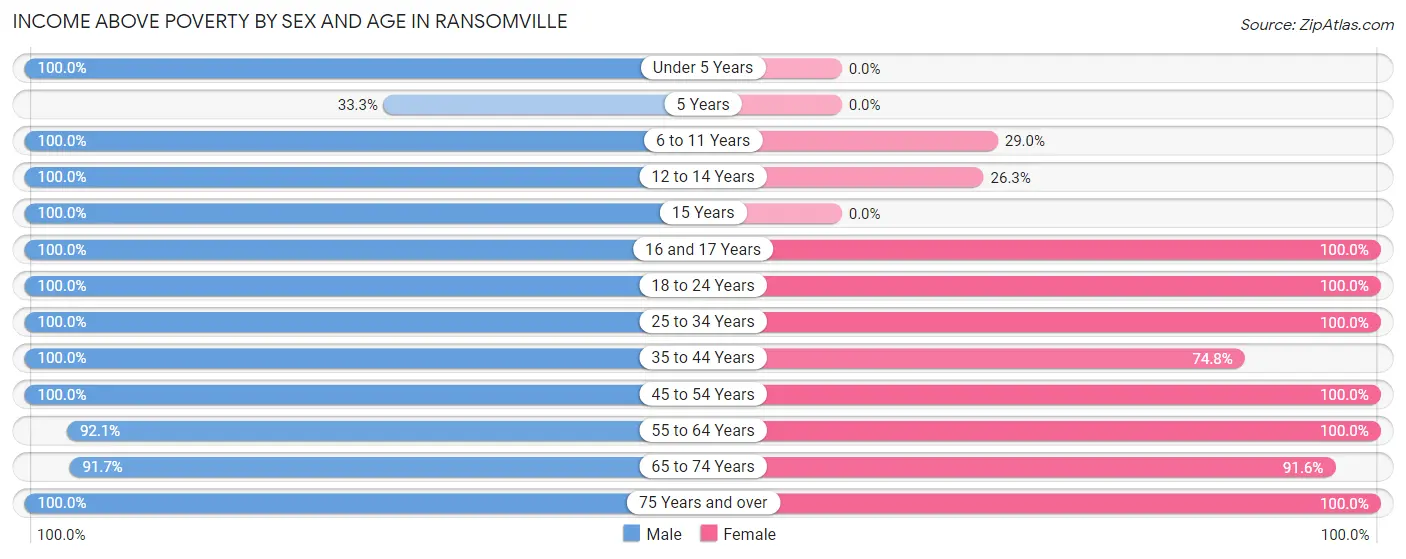
| Age Bracket | Male | Female |
| Under 5 Years | 30 (100.0%) | 0 (0.0%) |
| 5 Years | 14 (33.3%) | 0 (0.0%) |
| 6 to 11 Years | 34 (100.0%) | 11 (28.9%) |
| 12 to 14 Years | 31 (100.0%) | 10 (26.3%) |
| 15 Years | 16 (100.0%) | 0 (0.0%) |
| 16 and 17 Years | 19 (100.0%) | 69 (100.0%) |
| 18 to 24 Years | 122 (100.0%) | 70 (100.0%) |
| 25 to 34 Years | 49 (100.0%) | 6 (100.0%) |
| 35 to 44 Years | 94 (100.0%) | 77 (74.8%) |
| 45 to 54 Years | 52 (100.0%) | 109 (100.0%) |
| 55 to 64 Years | 199 (92.1%) | 149 (100.0%) |
| 65 to 74 Years | 66 (91.7%) | 76 (91.6%) |
| 75 Years and over | 21 (100.0%) | 46 (100.0%) |
| Total | 747 (93.6%) | 623 (87.6%) |
Income Below Poverty Among Married-Couple Families in Ransomville
The poverty statistics for married-couple families in Ransomville show that 1.8% or 6 of the total 333 families live below the poverty line. Families with no children have the highest poverty rate of 2.8%, comprising of 6 families. On the other hand, families with 1 or 2 children have the lowest poverty rate of 0.0%, which includes 0 families.
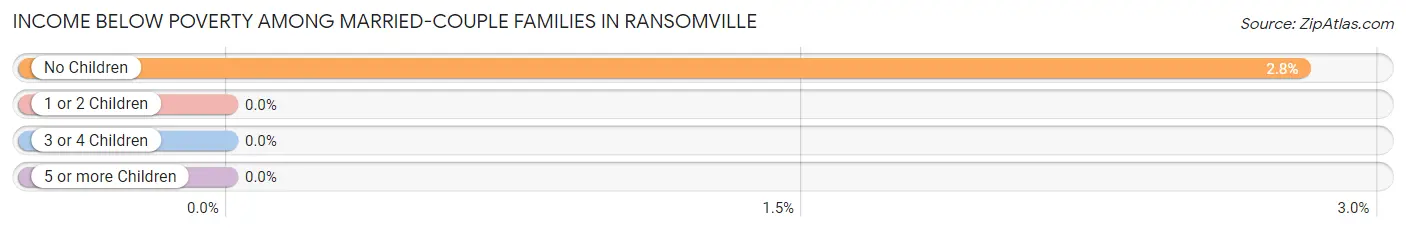
| Children | Above Poverty | Below Poverty |
| No Children | 208 (97.2%) | 6 (2.8%) |
| 1 or 2 Children | 106 (100.0%) | 0 (0.0%) |
| 3 or 4 Children | 13 (100.0%) | 0 (0.0%) |
| 5 or more Children | 0 (0.0%) | 0 (0.0%) |
| Total | 327 (98.2%) | 6 (1.8%) |
Income Below Poverty Among Single-Parent Households in Ransomville
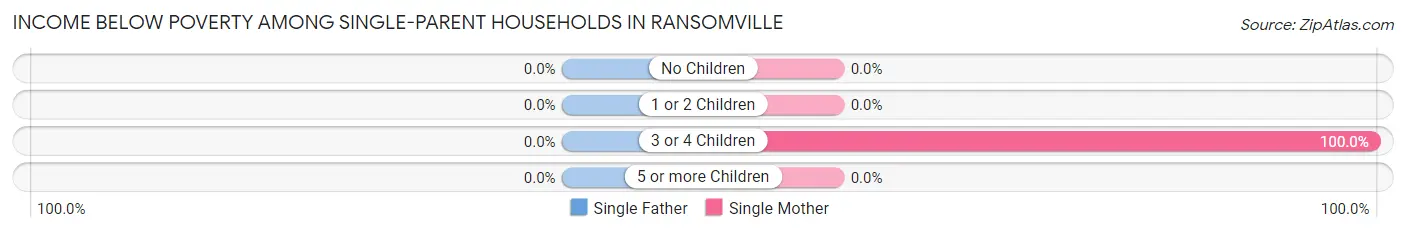
| Children | Single Father | Single Mother |
| No Children | 0 (0.0%) | 0 (0.0%) |
| 1 or 2 Children | 0 (0.0%) | 0 (0.0%) |
| 3 or 4 Children | 0 (0.0%) | 26 (100.0%) |
| 5 or more Children | 0 (0.0%) | 0 (0.0%) |
| Total | 0 (0.0%) | 26 (55.3%) |
Income Below Poverty Among Married-Couple vs Single-Parent Households in Ransomville
The poverty data for Ransomville shows that 6 of the married-couple family households (1.8%) and 26 of the single-parent households (49.1%) are living below the poverty level. Within the married-couple family households, those with no children have the highest poverty rate, with 6 households (2.8%) falling below the poverty line. Among the single-parent households, those with 3 or 4 children have the highest poverty rate, with 26 household (100.0%) living below poverty.
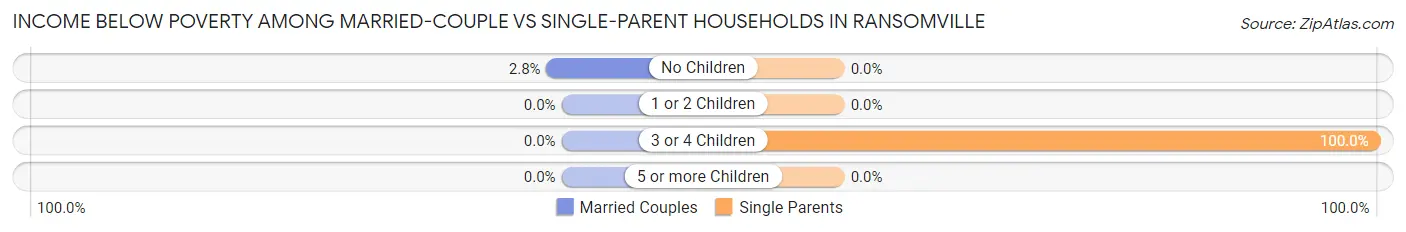
| Children | Married-Couple Families | Single-Parent Households |
| No Children | 6 (2.8%) | 0 (0.0%) |
| 1 or 2 Children | 0 (0.0%) | 0 (0.0%) |
| 3 or 4 Children | 0 (0.0%) | 26 (100.0%) |
| 5 or more Children | 0 (0.0%) | 0 (0.0%) |
| Total | 6 (1.8%) | 26 (49.1%) |
Race in Ransomville
The most populous races in Ransomville are White / Caucasian (1,503 | 96.7%), Black / African American (42 | 2.7%), and Hispanic or Latino (9 | 0.6%).
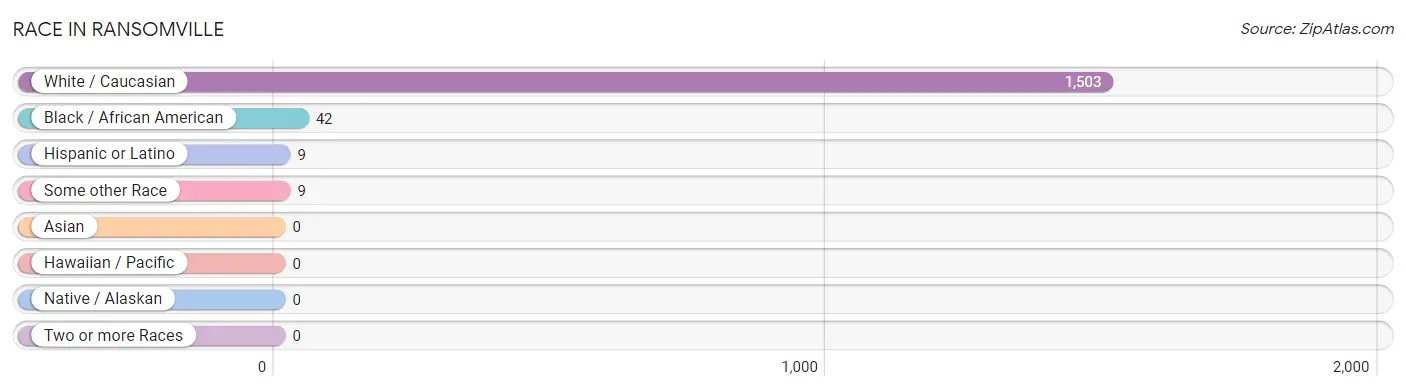
| Race | # Population | % Population |
| Asian | 0 | 0.0% |
| Black / African American | 42 | 2.7% |
| Hawaiian / Pacific | 0 | 0.0% |
| Hispanic or Latino | 9 | 0.6% |
| Native / Alaskan | 0 | 0.0% |
| White / Caucasian | 1,503 | 96.7% |
| Two or more Races | 0 | 0.0% |
| Some other Race | 9 | 0.6% |
| Total | 1,554 | 100.0% |
Ancestry in Ransomville
The most populous ancestries reported in Ransomville are English (456 | 29.3%), German (393 | 25.3%), Irish (281 | 18.1%), Polish (250 | 16.1%), and Italian (107 | 6.9%), together accounting for 95.7% of all Ransomville residents.
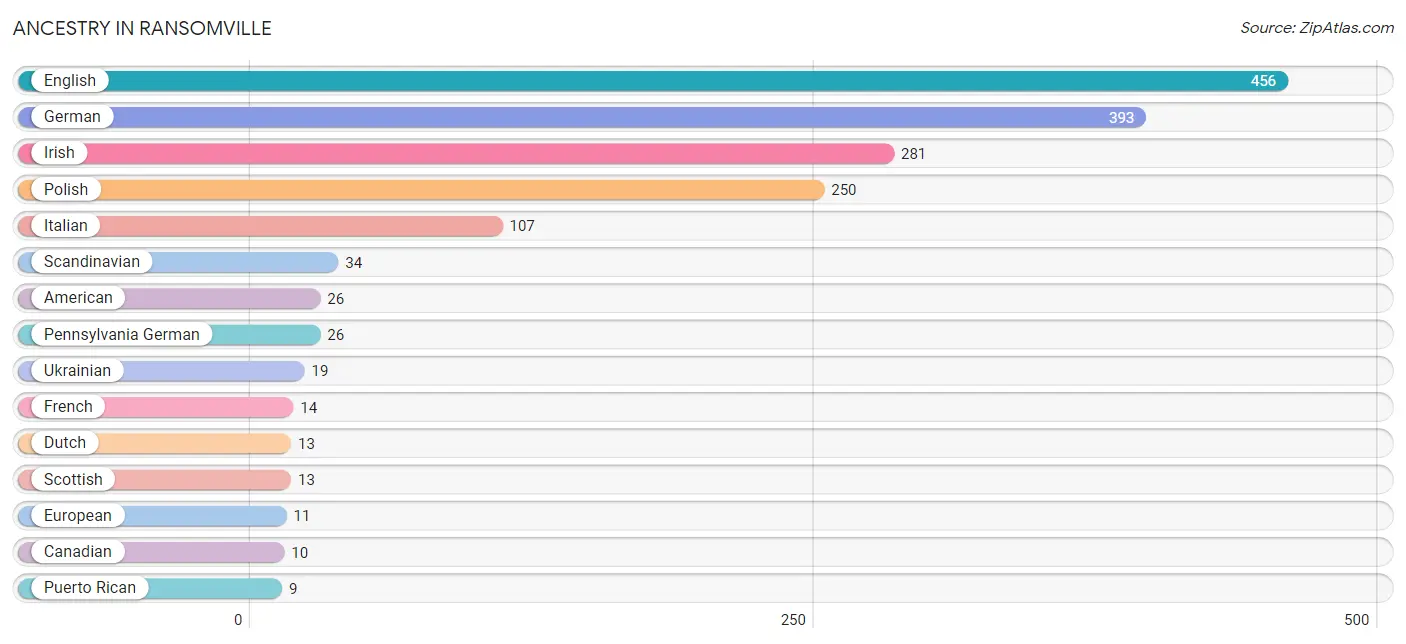
| Ancestry | # Population | % Population |
| African | 5 | 0.3% |
| American | 26 | 1.7% |
| Canadian | 10 | 0.6% |
| Danish | 7 | 0.4% |
| Dutch | 13 | 0.8% |
| English | 456 | 29.3% |
| European | 11 | 0.7% |
| French | 14 | 0.9% |
| German | 393 | 25.3% |
| Irish | 281 | 18.1% |
| Italian | 107 | 6.9% |
| Pennsylvania German | 26 | 1.7% |
| Polish | 250 | 16.1% |
| Puerto Rican | 9 | 0.6% |
| Scandinavian | 34 | 2.2% |
| Scottish | 13 | 0.8% |
| Subsaharan African | 5 | 0.3% |
| Ukrainian | 19 | 1.2% | View All 18 Rows |
Immigrants in Ransomville
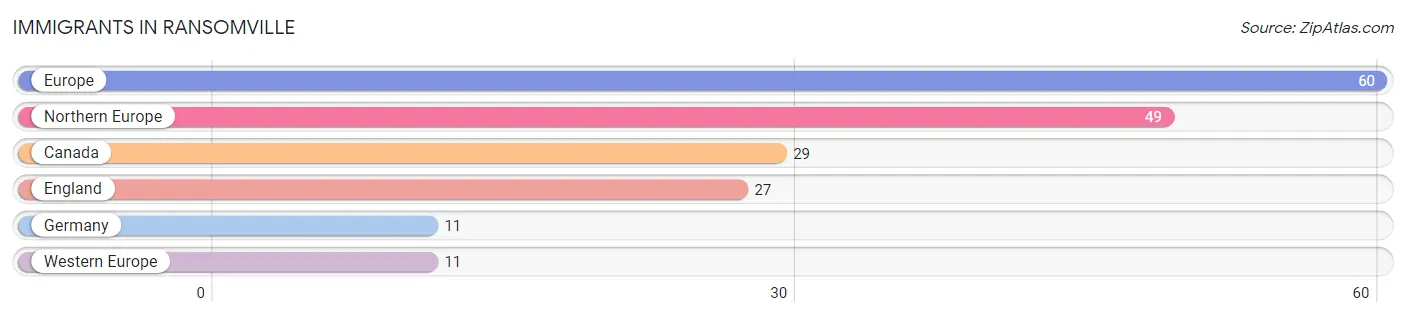
The most numerous immigrant groups reported in Ransomville came from Europe (60 | 3.9%), Northern Europe (49 | 3.2%), Canada (29 | 1.9%), England (27 | 1.7%), and Germany (11 | 0.7%), together accounting for 11.3% of all Ransomville residents.
| Immigration Origin | # Population | % Population |
| Canada | 29 | 1.9% |
| England | 27 | 1.7% |
| Europe | 60 | 3.9% |
| Germany | 11 | 0.7% |
| Northern Europe | 49 | 3.2% |
| Western Europe | 11 | 0.7% | View All 6 Rows |
Sex and Age in Ransomville
Sex and Age in Ransomville
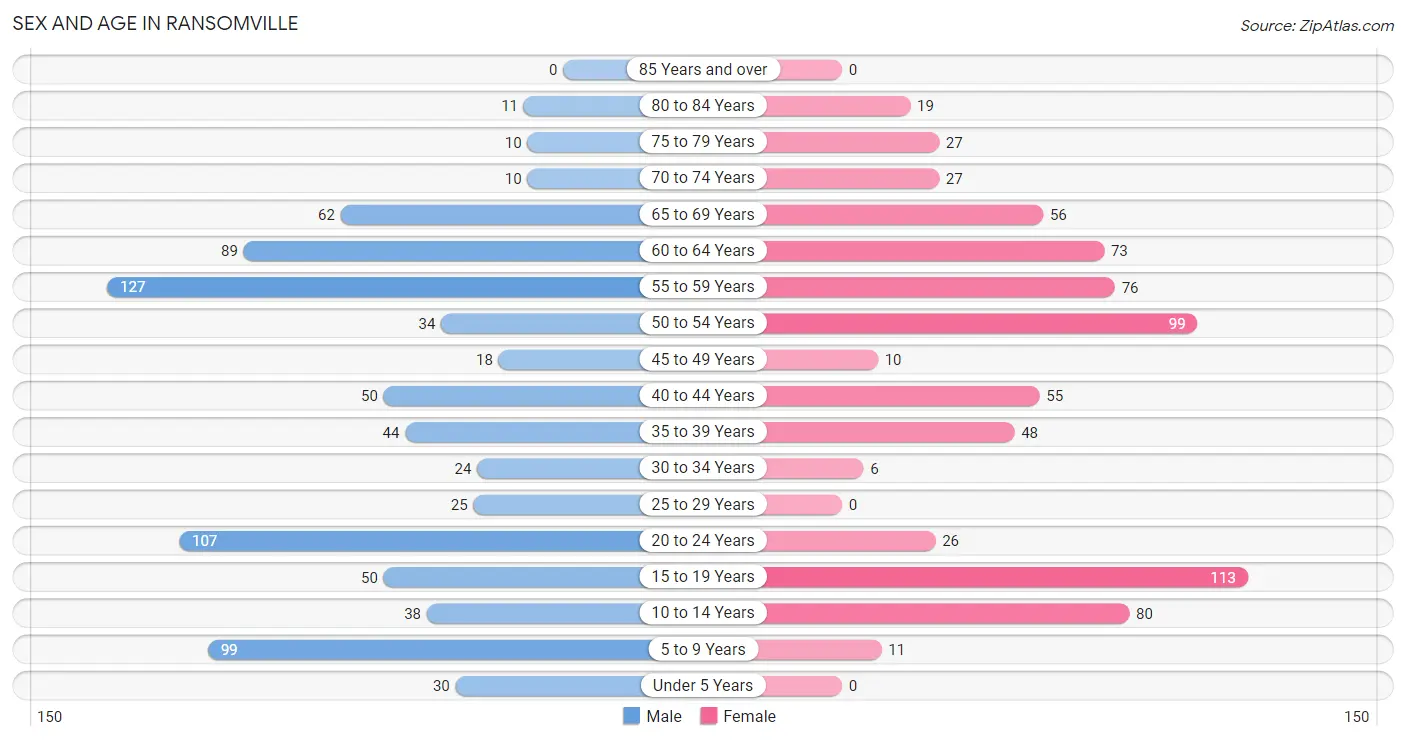
The most populous age groups in Ransomville are 55 to 59 Years (127 | 15.3%) for men and 15 to 19 Years (113 | 15.6%) for women.
| Age Bracket | Male | Female |
| Under 5 Years | 30 (3.6%) | 0 (0.0%) |
| 5 to 9 Years | 99 (12.0%) | 11 (1.5%) |
| 10 to 14 Years | 38 (4.6%) | 80 (11.0%) |
| 15 to 19 Years | 50 (6.0%) | 113 (15.6%) |
| 20 to 24 Years | 107 (12.9%) | 26 (3.6%) |
| 25 to 29 Years | 25 (3.0%) | 0 (0.0%) |
| 30 to 34 Years | 24 (2.9%) | 6 (0.8%) |
| 35 to 39 Years | 44 (5.3%) | 48 (6.6%) |
| 40 to 44 Years | 50 (6.0%) | 55 (7.6%) |
| 45 to 49 Years | 18 (2.2%) | 10 (1.4%) |
| 50 to 54 Years | 34 (4.1%) | 99 (13.6%) |
| 55 to 59 Years | 127 (15.3%) | 76 (10.5%) |
| 60 to 64 Years | 89 (10.7%) | 73 (10.1%) |
| 65 to 69 Years | 62 (7.5%) | 56 (7.7%) |
| 70 to 74 Years | 10 (1.2%) | 27 (3.7%) |
| 75 to 79 Years | 10 (1.2%) | 27 (3.7%) |
| 80 to 84 Years | 11 (1.3%) | 19 (2.6%) |
| 85 Years and over | 0 (0.0%) | 0 (0.0%) |
| Total | 828 (100.0%) | 726 (100.0%) |
Families and Households in Ransomville
Median Family Size in Ransomville
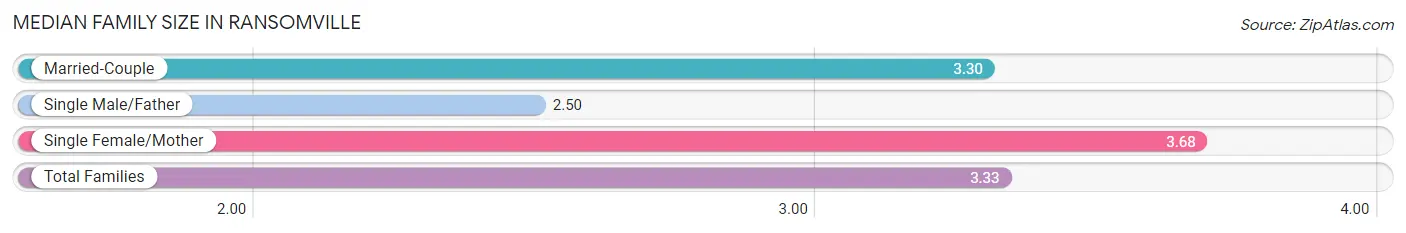
The median family size in Ransomville is 3.33 persons per family, with single female/mother families (47 | 12.2%) accounting for the largest median family size of 3.68 persons per family. On the other hand, single male/father families (6 | 1.5%) represent the smallest median family size with 2.50 persons per family.
| Family Type | # Families | Family Size |
| Married-Couple | 333 (86.3%) | 3.30 |
| Single Male/Father | 6 (1.5%) | 2.50 |
| Single Female/Mother | 47 (12.2%) | 3.68 |
| Total Families | 386 (100.0%) | 3.33 |
Median Household Size in Ransomville
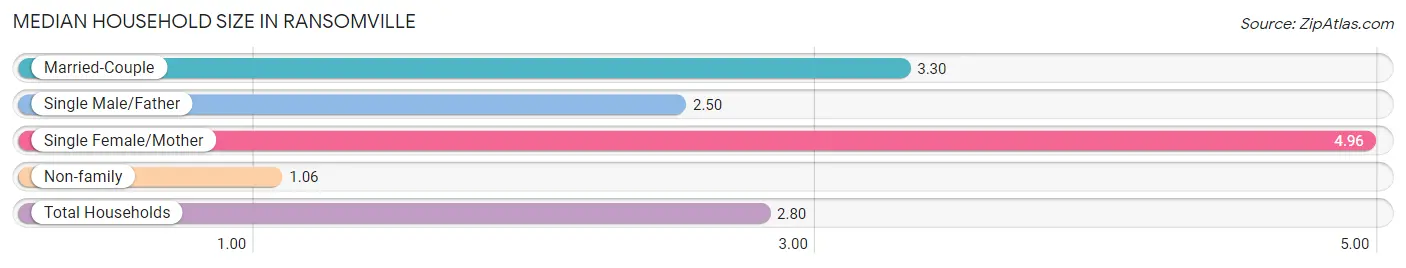
The median household size in Ransomville is 2.80 persons per household, with single female/mother households (47 | 8.7%) accounting for the largest median household size of 4.96 persons per household. non-family households (151 | 28.1%) represent the smallest median household size with 1.06 persons per household.
| Household Type | # Households | Household Size |
| Married-Couple | 333 (62.0%) | 3.30 |
| Single Male/Father | 6 (1.1%) | 2.50 |
| Single Female/Mother | 47 (8.7%) | 4.96 |
| Non-family | 151 (28.1%) | 1.06 |
| Total Households | 537 (100.0%) | 2.80 |
Household Size by Marriage Status in Ransomville
Out of a total of 537 households in Ransomville, 386 (71.9%) are family households, while 151 (28.1%) are nonfamily households. The most numerous type of family households are 2-person households, comprising 154, and the most common type of nonfamily households are 1-person households, comprising 141.
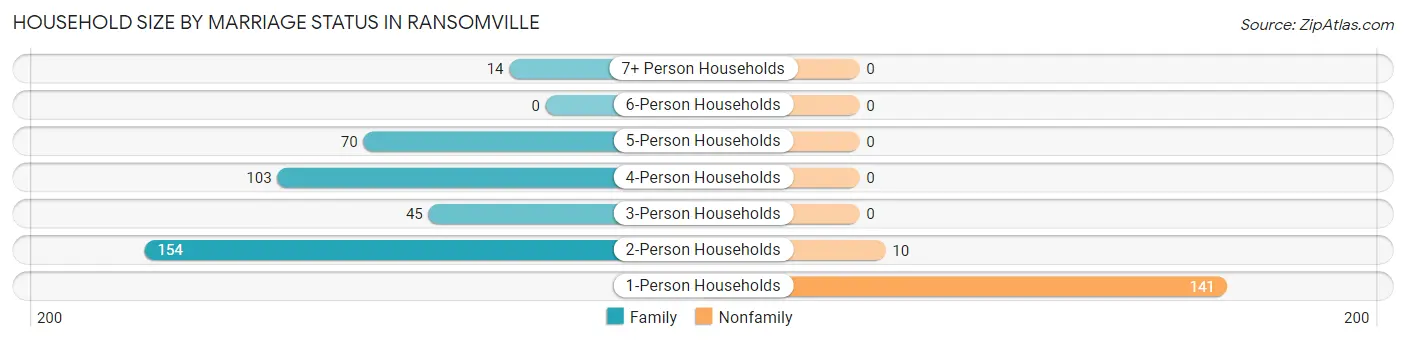
| Household Size | Family Households | Nonfamily Households |
| 1-Person Households | - | 141 (26.3%) |
| 2-Person Households | 154 (28.7%) | 10 (1.9%) |
| 3-Person Households | 45 (8.4%) | 0 (0.0%) |
| 4-Person Households | 103 (19.2%) | 0 (0.0%) |
| 5-Person Households | 70 (13.0%) | 0 (0.0%) |
| 6-Person Households | 0 (0.0%) | 0 (0.0%) |
| 7+ Person Households | 14 (2.6%) | 0 (0.0%) |
| Total | 386 (71.9%) | 151 (28.1%) |
Female Fertility in Ransomville
Fertility by Age in Ransomville
Average fertility rate in Ransomville is 78.0 births per 1,000 women. Women in the age bracket of 20 to 34 years have the highest fertility rate with 188.0 births per 1,000 women. Women in the age bracket of 35 to 50 years acount for 70.0% of all women with births.
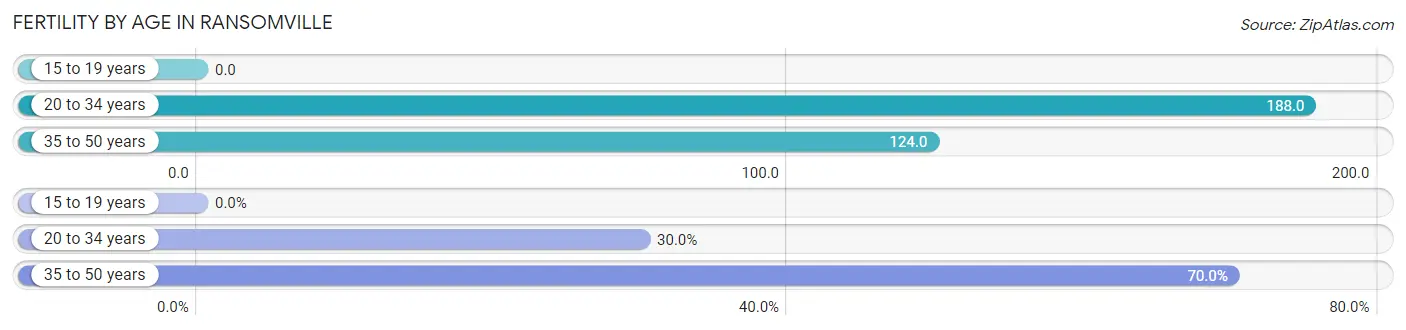
| Age Bracket | Women with Births | Births / 1,000 Women |
| 15 to 19 years | 0 (0.0%) | 0.0 |
| 20 to 34 years | 6 (30.0%) | 188.0 |
| 35 to 50 years | 14 (70.0%) | 124.0 |
| Total | 20 (100.0%) | 78.0 |
Fertility by Age by Marriage Status in Ransomville
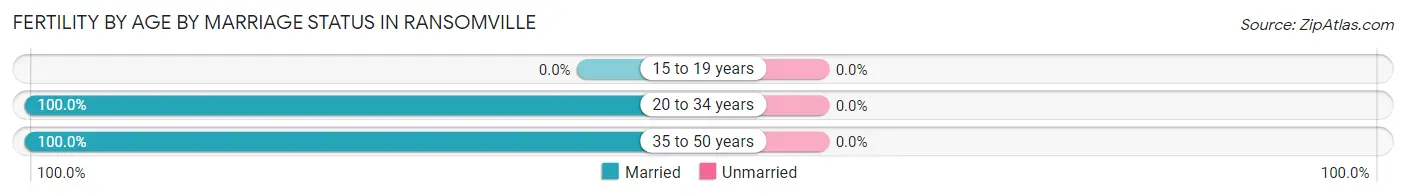
| Age Bracket | Married | Unmarried |
| 15 to 19 years | 0 (0.0%) | 0 (0.0%) |
| 20 to 34 years | 6 (100.0%) | 0 (0.0%) |
| 35 to 50 years | 14 (100.0%) | 0 (0.0%) |
| Total | 20 (100.0%) | 0 (0.0%) |
Fertility by Education in Ransomville
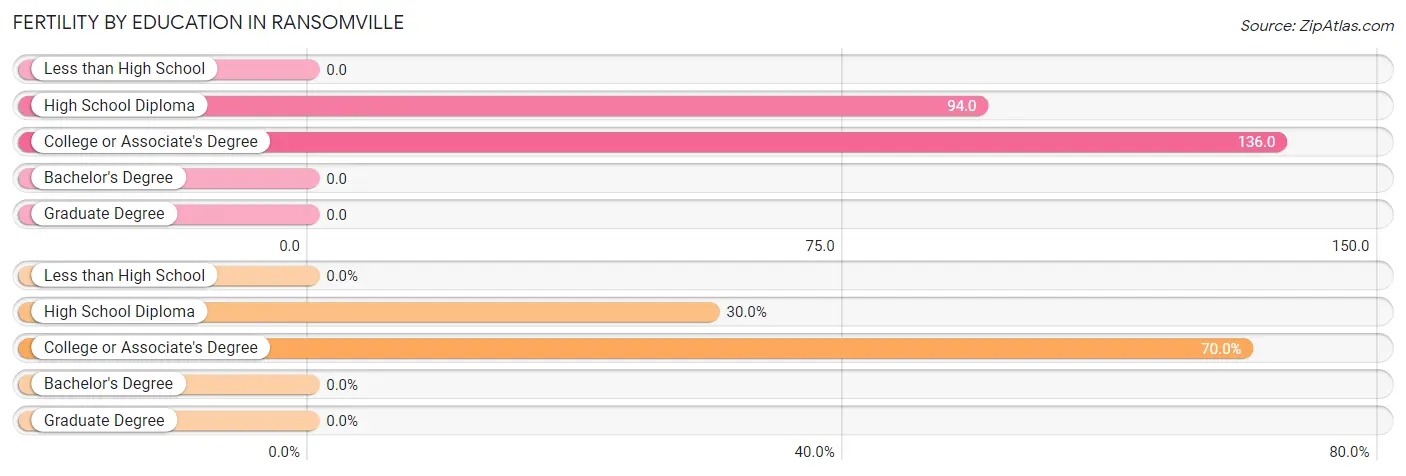
| Educational Attainment | Women with Births | Births / 1,000 Women |
| Less than High School | 0 (0.0%) | 0.0 |
| High School Diploma | 6 (30.0%) | 94.0 |
| College or Associate's Degree | 14 (70.0%) | 136.0 |
| Bachelor's Degree | 0 (0.0%) | 0.0 |
| Graduate Degree | 0 (0.0%) | 0.0 |
| Total | 20 (100.0%) | 78.0 |
Fertility by Education by Marriage Status in Ransomville
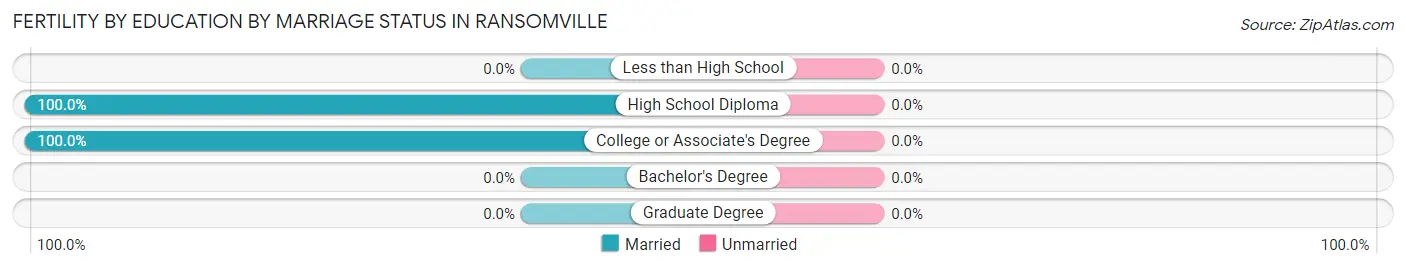
| Educational Attainment | Married | Unmarried |
| Less than High School | 0 (0.0%) | 0 (0.0%) |
| High School Diploma | 6 (100.0%) | 0 (0.0%) |
| College or Associate's Degree | 14 (100.0%) | 0 (0.0%) |
| Bachelor's Degree | 0 (0.0%) | 0 (0.0%) |
| Graduate Degree | 0 (0.0%) | 0 (0.0%) |
| Total | 20 (100.0%) | 0 (0.0%) |
Employment Characteristics in Ransomville
Employment by Class of Employer in Ransomville
Among the 850 employed individuals in Ransomville, private company employees (561 | 66.0%), self-employed (not incorporated) (109 | 12.8%), and not-for-profit organizations (97 | 11.4%) make up the most common classes of employment.
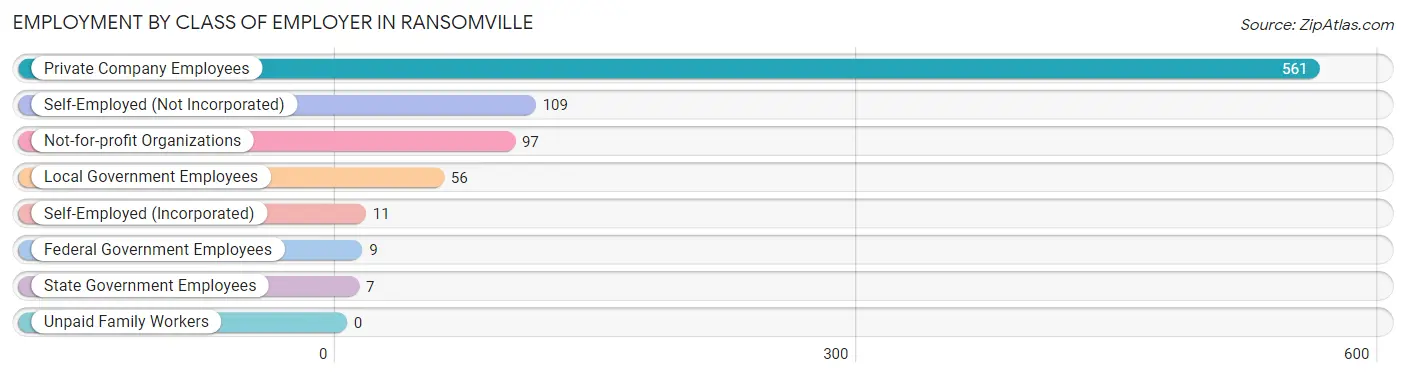
| Employer Class | # Employees | % Employees |
| Private Company Employees | 561 | 66.0% |
| Self-Employed (Incorporated) | 11 | 1.3% |
| Self-Employed (Not Incorporated) | 109 | 12.8% |
| Not-for-profit Organizations | 97 | 11.4% |
| Local Government Employees | 56 | 6.6% |
| State Government Employees | 7 | 0.8% |
| Federal Government Employees | 9 | 1.1% |
| Unpaid Family Workers | 0 | 0.0% |
| Total | 850 | 100.0% |
Employment Status by Age in Ransomville
According to the labor force statistics for Ransomville, out of the total population over 16 years of age (1,280), 69.3% or 887 individuals are in the labor force, with 3.5% or 31 of them unemployed. The age group with the highest labor force participation rate is 20 to 24 years, with 100.0% or 133 individuals in the labor force. Within the labor force, the 30 to 34 years age range has the highest percentage of unemployed individuals, with 43.3% or 13 of them being unemployed.
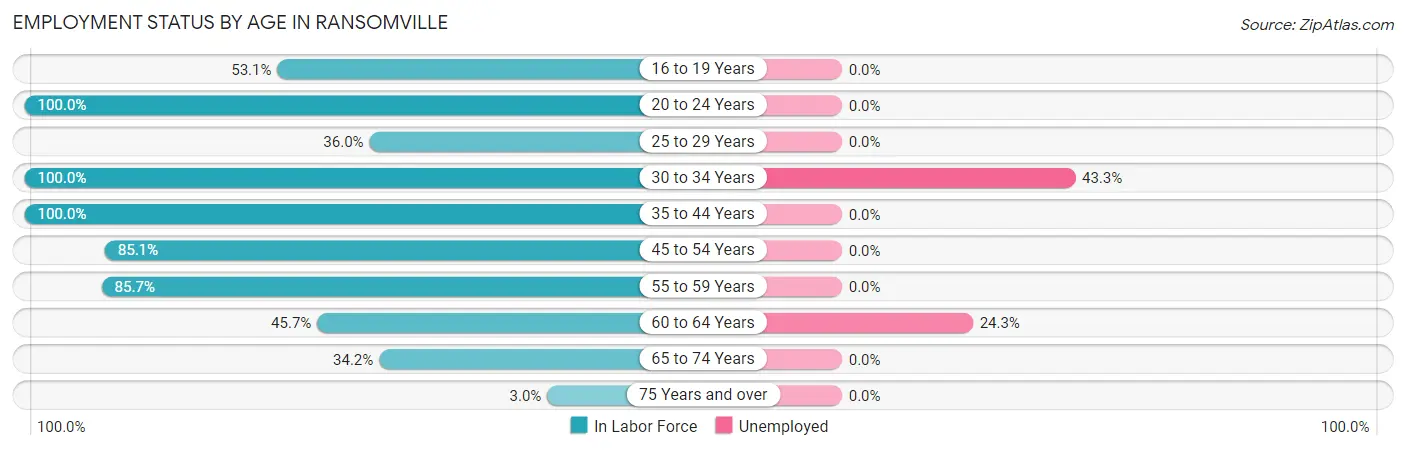
| Age Bracket | In Labor Force | Unemployed |
| 16 to 19 Years | 78 (53.1%) | 0 (0.0%) |
| 20 to 24 Years | 133 (100.0%) | 0 (0.0%) |
| 25 to 29 Years | 9 (36.0%) | 0 (0.0%) |
| 30 to 34 Years | 30 (100.0%) | 13 (43.3%) |
| 35 to 44 Years | 197 (100.0%) | 0 (0.0%) |
| 45 to 54 Years | 137 (85.1%) | 0 (0.0%) |
| 55 to 59 Years | 174 (85.7%) | 0 (0.0%) |
| 60 to 64 Years | 74 (45.7%) | 18 (24.3%) |
| 65 to 74 Years | 53 (34.2%) | 0 (0.0%) |
| 75 Years and over | 2 (3.0%) | 0 (0.0%) |
| Total | 887 (69.3%) | 31 (3.5%) |
Employment Status by Educational Attainment in Ransomville
According to labor force statistics for Ransomville, 79.8% of individuals (621) out of the total population between 25 and 64 years of age (778) are in the labor force, with 5.0% or 31 of them being unemployed. The group with the highest labor force participation rate are those with the educational attainment of less than high school, with 100.0% or 15 individuals in the labor force. Within the labor force, individuals with high school diploma education have the highest percentage of unemployment, with 8.3% or 19 of them being unemployed.
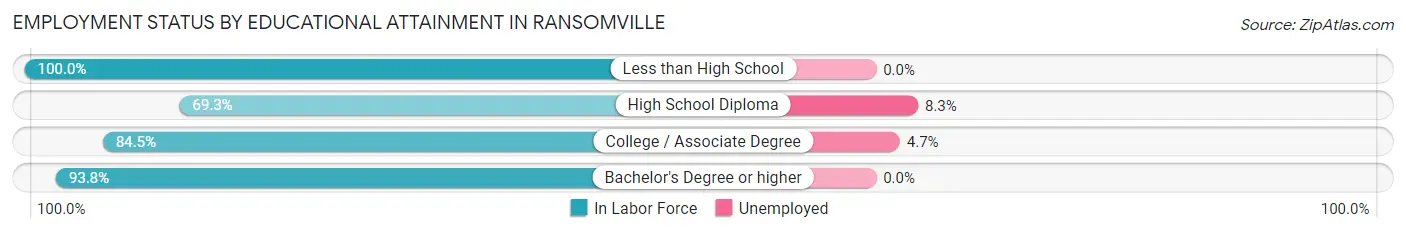
| Educational Attainment | In Labor Force | Unemployed |
| Less than High School | 15 (100.0%) | 0 (0.0%) |
| High School Diploma | 230 (69.3%) | 28 (8.3%) |
| College / Associate Degree | 256 (84.5%) | 14 (4.7%) |
| Bachelor's Degree or higher | 120 (93.8%) | 0 (0.0%) |
| Total | 621 (79.8%) | 39 (5.0%) |
Employment Occupations by Sex in Ransomville
Management, Business, Science and Arts Occupations
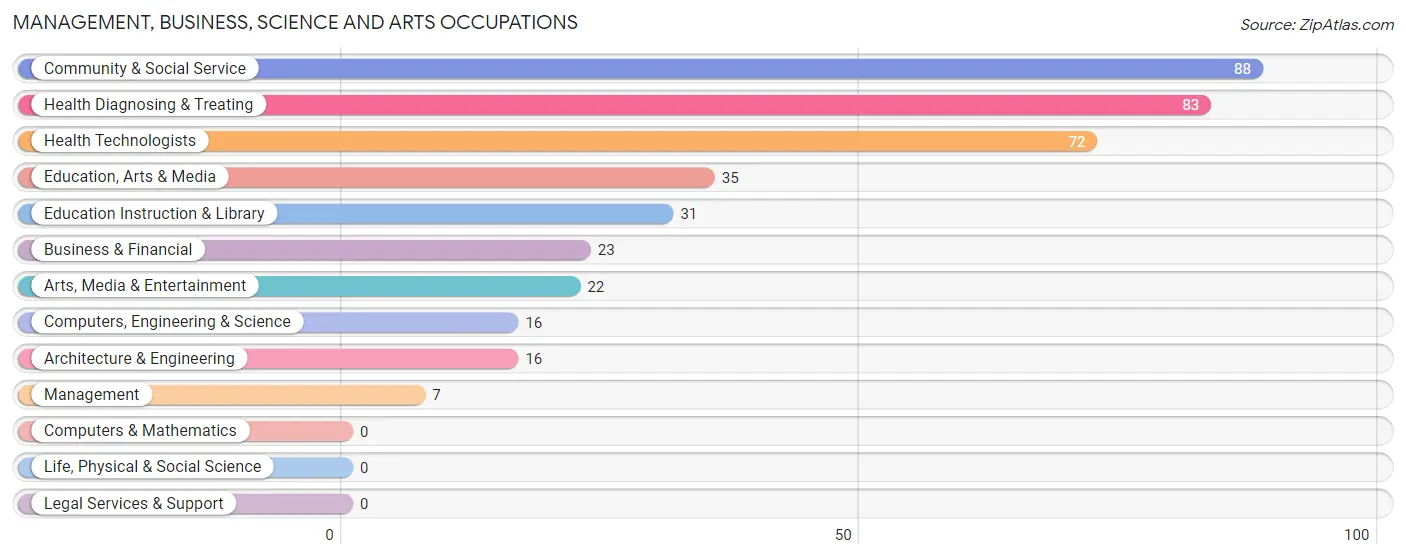
The most common Management, Business, Science and Arts occupations in Ransomville are Community & Social Service (88 | 10.3%), Health Diagnosing & Treating (83 | 9.7%), Health Technologists (72 | 8.4%), Education, Arts & Media (35 | 4.1%), and Education Instruction & Library (31 | 3.6%).
Management, Business, Science and Arts Occupations by Sex
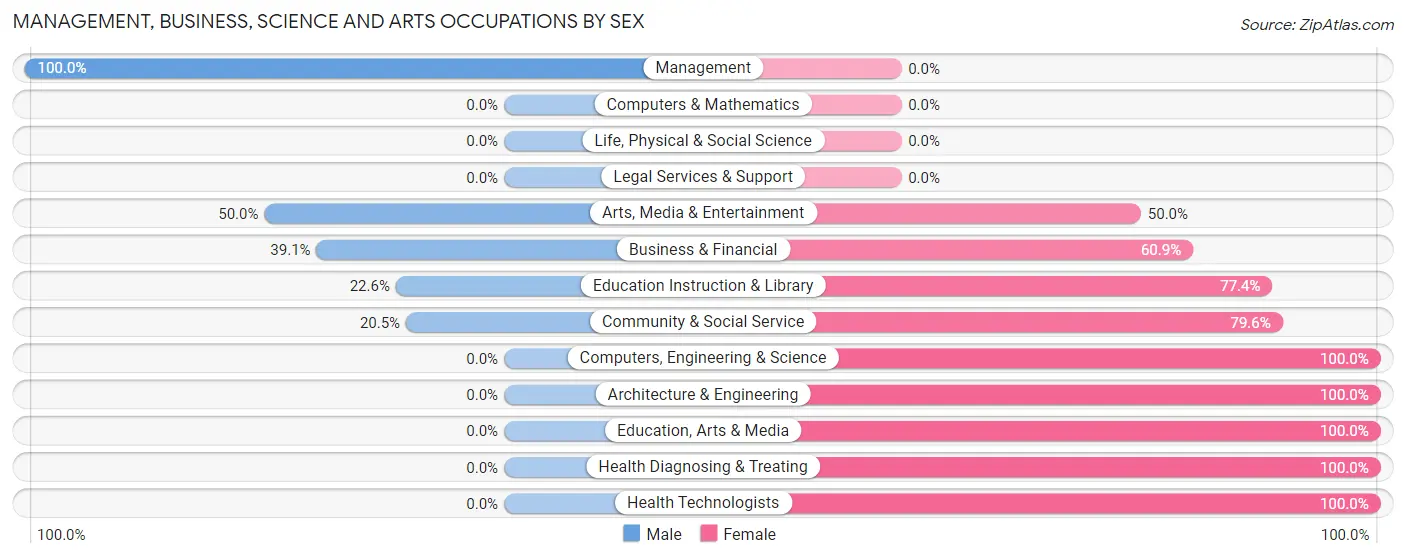
Within the Management, Business, Science and Arts occupations in Ransomville, the most male-oriented occupations are Management (100.0%), Arts, Media & Entertainment (50.0%), and Business & Financial (39.1%), while the most female-oriented occupations are Computers, Engineering & Science (100.0%), Architecture & Engineering (100.0%), and Education, Arts & Media (100.0%).
| Occupation | Male | Female |
| Management | 7 (100.0%) | 0 (0.0%) |
| Business & Financial | 9 (39.1%) | 14 (60.9%) |
| Computers, Engineering & Science | 0 (0.0%) | 16 (100.0%) |
| Computers & Mathematics | 0 (0.0%) | 0 (0.0%) |
| Architecture & Engineering | 0 (0.0%) | 16 (100.0%) |
| Life, Physical & Social Science | 0 (0.0%) | 0 (0.0%) |
| Community & Social Service | 18 (20.4%) | 70 (79.5%) |
| Education, Arts & Media | 0 (0.0%) | 35 (100.0%) |
| Legal Services & Support | 0 (0.0%) | 0 (0.0%) |
| Education Instruction & Library | 7 (22.6%) | 24 (77.4%) |
| Arts, Media & Entertainment | 11 (50.0%) | 11 (50.0%) |
| Health Diagnosing & Treating | 0 (0.0%) | 83 (100.0%) |
| Health Technologists | 0 (0.0%) | 72 (100.0%) |
| Total (Category) | 34 (15.7%) | 183 (84.3%) |
| Total (Overall) | 487 (56.9%) | 369 (43.1%) |
Services Occupations
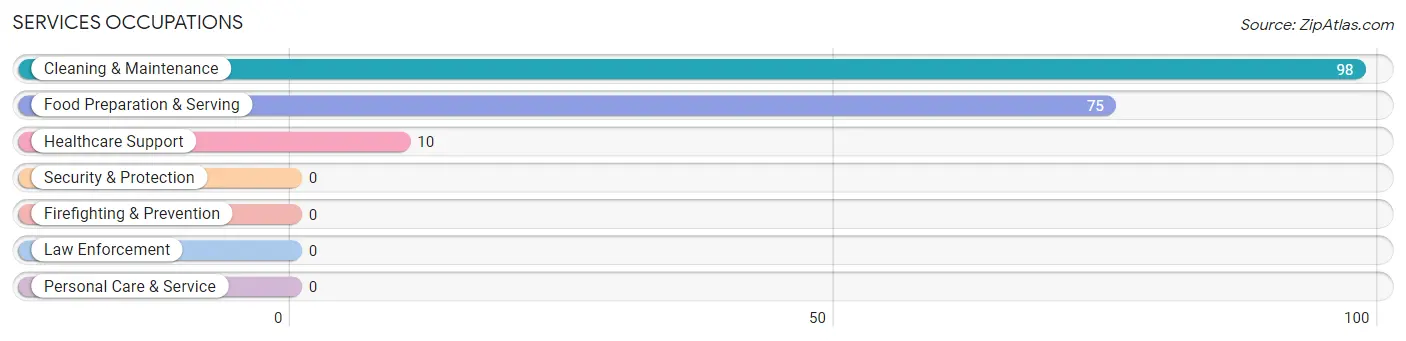
The most common Services occupations in Ransomville are Cleaning & Maintenance (98 | 11.5%), Food Preparation & Serving (75 | 8.8%), and Healthcare Support (10 | 1.2%).
Services Occupations by Sex
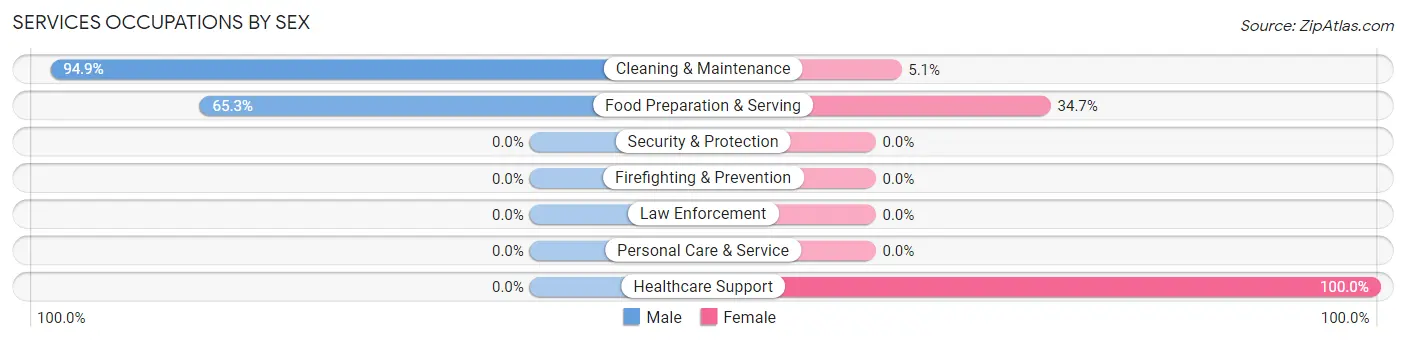
Within the Services occupations in Ransomville, the most male-oriented occupations are Cleaning & Maintenance (94.9%), and Food Preparation & Serving (65.3%), while the most female-oriented occupations are Healthcare Support (100.0%), Food Preparation & Serving (34.7%), and Cleaning & Maintenance (5.1%).
| Occupation | Male | Female |
| Healthcare Support | 0 (0.0%) | 10 (100.0%) |
| Security & Protection | 0 (0.0%) | 0 (0.0%) |
| Firefighting & Prevention | 0 (0.0%) | 0 (0.0%) |
| Law Enforcement | 0 (0.0%) | 0 (0.0%) |
| Food Preparation & Serving | 49 (65.3%) | 26 (34.7%) |
| Cleaning & Maintenance | 93 (94.9%) | 5 (5.1%) |
| Personal Care & Service | 0 (0.0%) | 0 (0.0%) |
| Total (Category) | 142 (77.6%) | 41 (22.4%) |
| Total (Overall) | 487 (56.9%) | 369 (43.1%) |
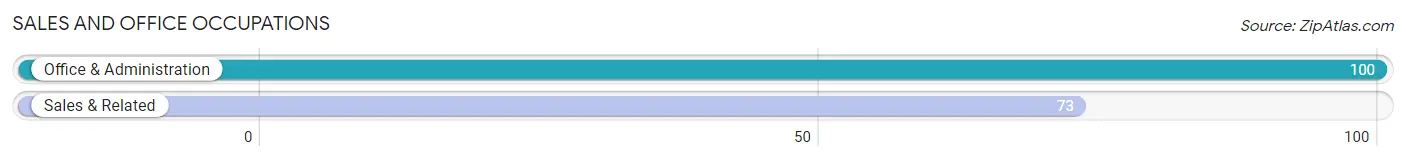
Sales and Office Occupations
The most common Sales and Office occupations in Ransomville are Office & Administration (100 | 11.7%), and Sales & Related (73 | 8.5%).
Sales and Office Occupations by Sex
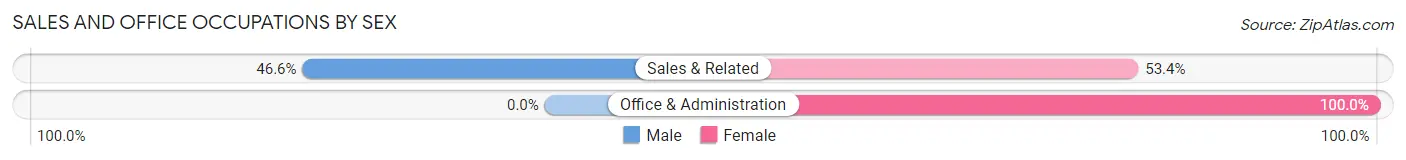
| Occupation | Male | Female |
| Sales & Related | 34 (46.6%) | 39 (53.4%) |
| Office & Administration | 0 (0.0%) | 100 (100.0%) |
| Total (Category) | 34 (19.7%) | 139 (80.3%) |
| Total (Overall) | 487 (56.9%) | 369 (43.1%) |
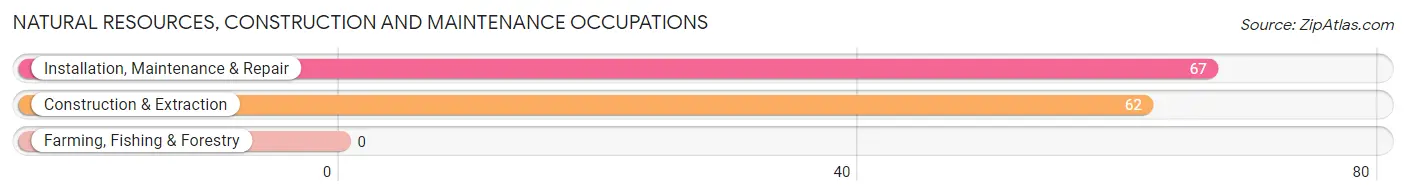
Natural Resources, Construction and Maintenance Occupations
The most common Natural Resources, Construction and Maintenance occupations in Ransomville are Installation, Maintenance & Repair (67 | 7.8%), and Construction & Extraction (62 | 7.2%).
Natural Resources, Construction and Maintenance Occupations by Sex
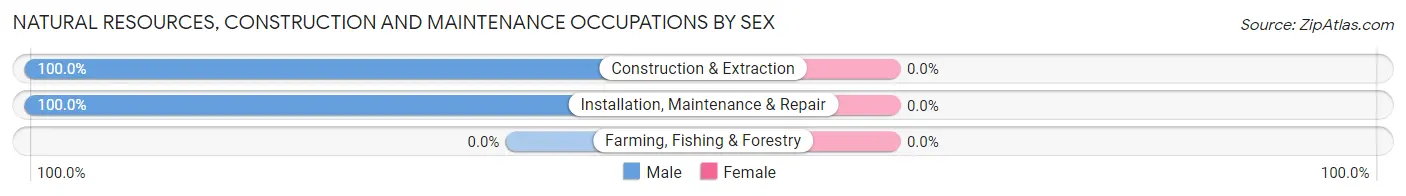
| Occupation | Male | Female |
| Farming, Fishing & Forestry | 0 (0.0%) | 0 (0.0%) |
| Construction & Extraction | 62 (100.0%) | 0 (0.0%) |
| Installation, Maintenance & Repair | 67 (100.0%) | 0 (0.0%) |
| Total (Category) | 129 (100.0%) | 0 (0.0%) |
| Total (Overall) | 487 (56.9%) | 369 (43.1%) |
Production, Transportation and Moving Occupations
The most common Production, Transportation and Moving occupations in Ransomville are Material Moving (80 | 9.3%), and Production (74 | 8.6%).
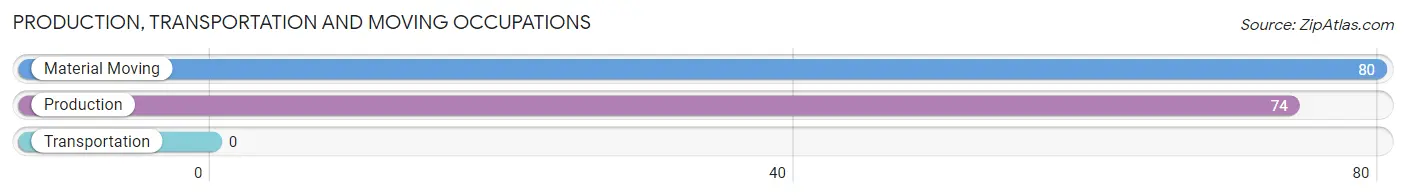
Production, Transportation and Moving Occupations by Sex
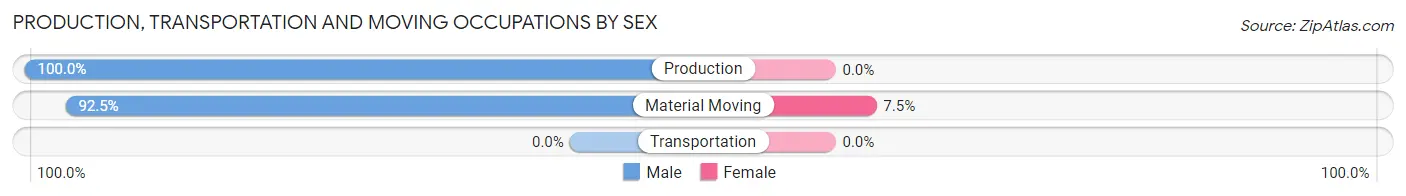
| Occupation | Male | Female |
| Production | 74 (100.0%) | 0 (0.0%) |
| Transportation | 0 (0.0%) | 0 (0.0%) |
| Material Moving | 74 (92.5%) | 6 (7.5%) |
| Total (Category) | 148 (96.1%) | 6 (3.9%) |
| Total (Overall) | 487 (56.9%) | 369 (43.1%) |
Employment Industries by Sex in Ransomville
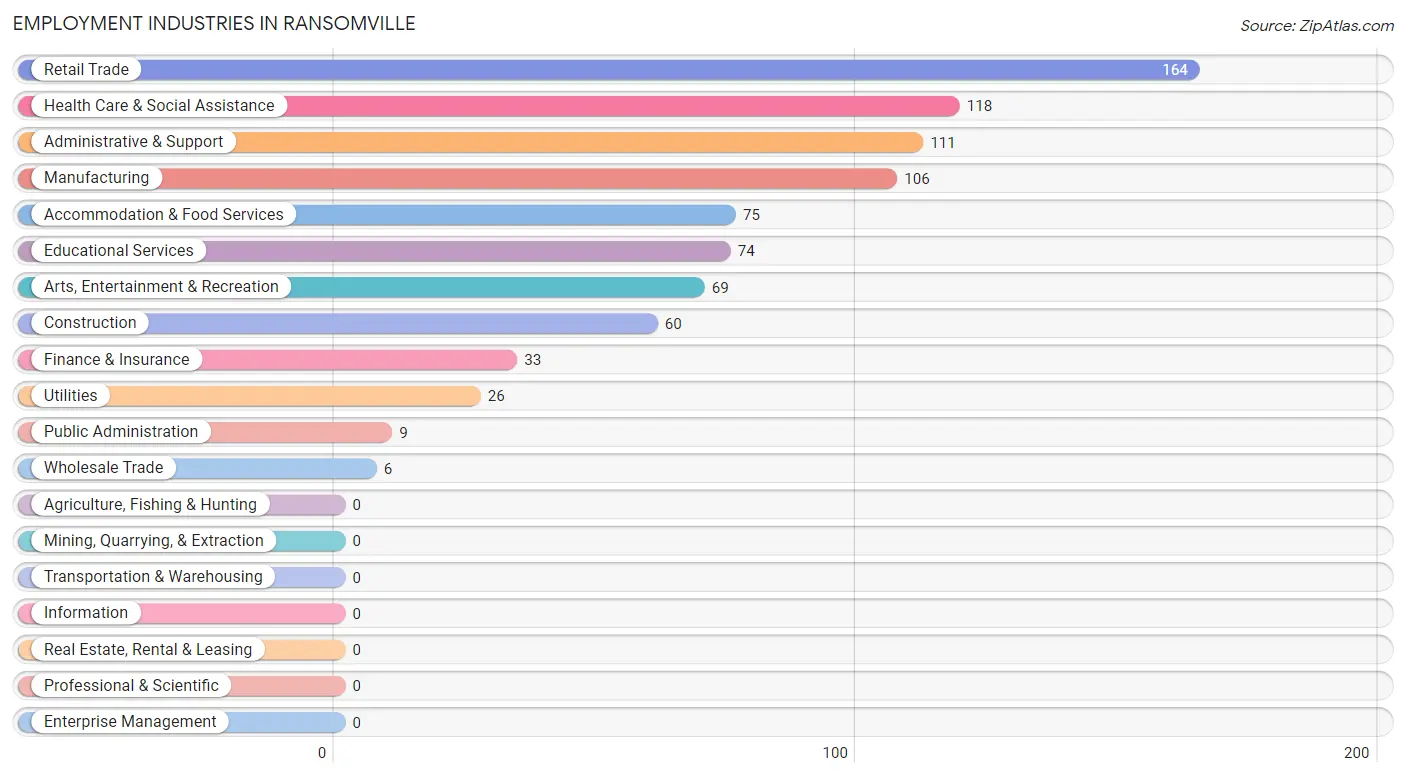
Employment Industries in Ransomville
The major employment industries in Ransomville include Retail Trade (164 | 19.2%), Health Care & Social Assistance (118 | 13.8%), Administrative & Support (111 | 13.0%), Manufacturing (106 | 12.4%), and Accommodation & Food Services (75 | 8.8%).
Employment Industries by Sex in Ransomville
The Ransomville industries that see more men than women are Construction (100.0%), Wholesale Trade (100.0%), and Utilities (100.0%), whereas the industries that tend to have a higher number of women are Finance & Insurance (100.0%), Health Care & Social Assistance (87.3%), and Arts, Entertainment & Recreation (84.1%).
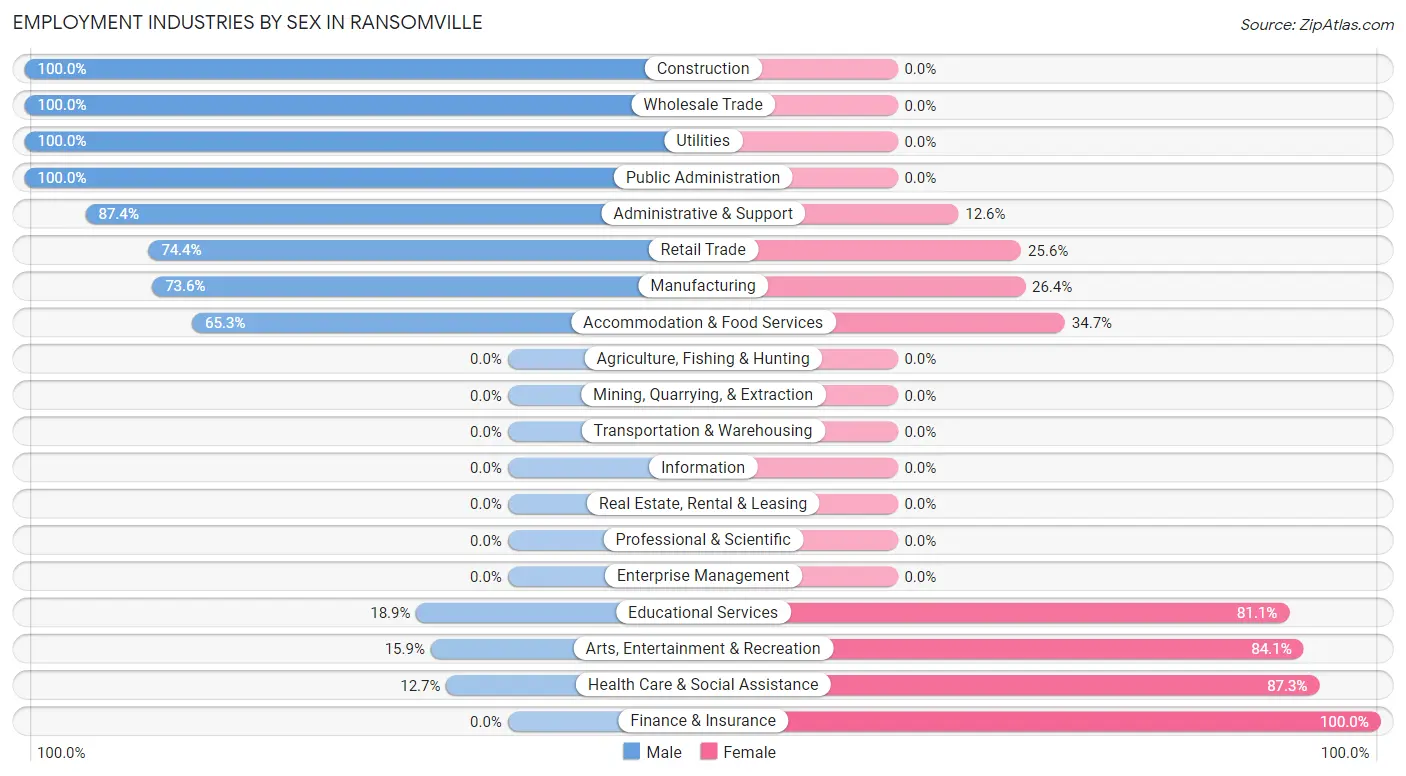
| Industry | Male | Female |
| Agriculture, Fishing & Hunting | 0 (0.0%) | 0 (0.0%) |
| Mining, Quarrying, & Extraction | 0 (0.0%) | 0 (0.0%) |
| Construction | 60 (100.0%) | 0 (0.0%) |
| Manufacturing | 78 (73.6%) | 28 (26.4%) |
| Wholesale Trade | 6 (100.0%) | 0 (0.0%) |
| Retail Trade | 122 (74.4%) | 42 (25.6%) |
| Transportation & Warehousing | 0 (0.0%) | 0 (0.0%) |
| Utilities | 26 (100.0%) | 0 (0.0%) |
| Information | 0 (0.0%) | 0 (0.0%) |
| Finance & Insurance | 0 (0.0%) | 33 (100.0%) |
| Real Estate, Rental & Leasing | 0 (0.0%) | 0 (0.0%) |
| Professional & Scientific | 0 (0.0%) | 0 (0.0%) |
| Enterprise Management | 0 (0.0%) | 0 (0.0%) |
| Administrative & Support | 97 (87.4%) | 14 (12.6%) |
| Educational Services | 14 (18.9%) | 60 (81.1%) |
| Health Care & Social Assistance | 15 (12.7%) | 103 (87.3%) |
| Arts, Entertainment & Recreation | 11 (15.9%) | 58 (84.1%) |
| Accommodation & Food Services | 49 (65.3%) | 26 (34.7%) |
| Public Administration | 9 (100.0%) | 0 (0.0%) |
| Total | 487 (56.9%) | 369 (43.1%) |
Education in Ransomville
School Enrollment in Ransomville
The most common levels of schooling among the 443 students in Ransomville are middle school (118 | 26.6%), college / undergraduate (111 | 25.1%), and high school (104 | 23.5%).
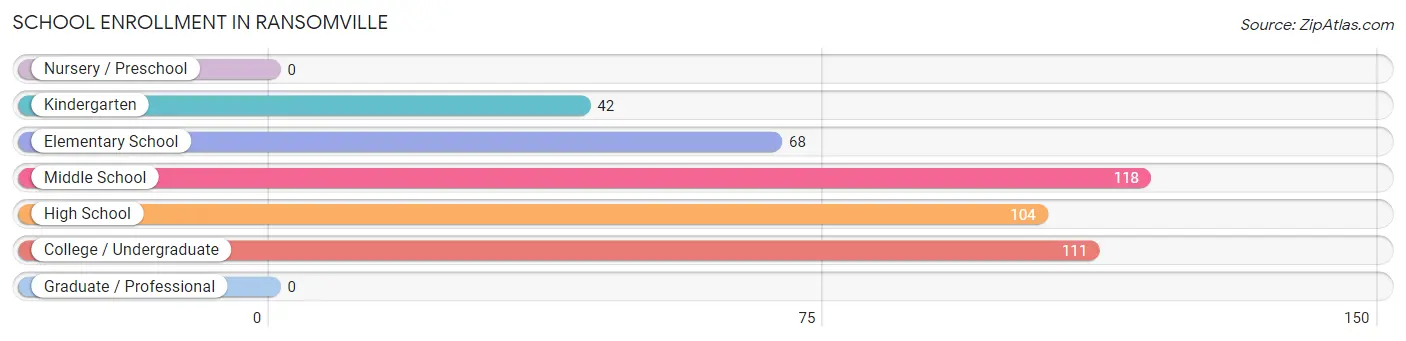
| School Level | # Students | % Students |
| Nursery / Preschool | 0 | 0.0% |
| Kindergarten | 42 | 9.5% |
| Elementary School | 68 | 15.3% |
| Middle School | 118 | 26.6% |
| High School | 104 | 23.5% |
| College / Undergraduate | 111 | 25.1% |
| Graduate / Professional | 0 | 0.0% |
| Total | 443 | 100.0% |
School Enrollment by Age by Funding Source in Ransomville
Out of a total of 443 students who are enrolled in schools in Ransomville, 32 (7.2%) attend a private institution, while the remaining 411 (92.8%) are enrolled in public schools. The age group of 35 years and over has the highest likelihood of being enrolled in private schools, with 11 (44.0% in the age bracket) enrolled. Conversely, the age group of 5 to 9 year old has the lowest likelihood of being enrolled in a private school, with 110 (100.0% in the age bracket) attending a public institution.
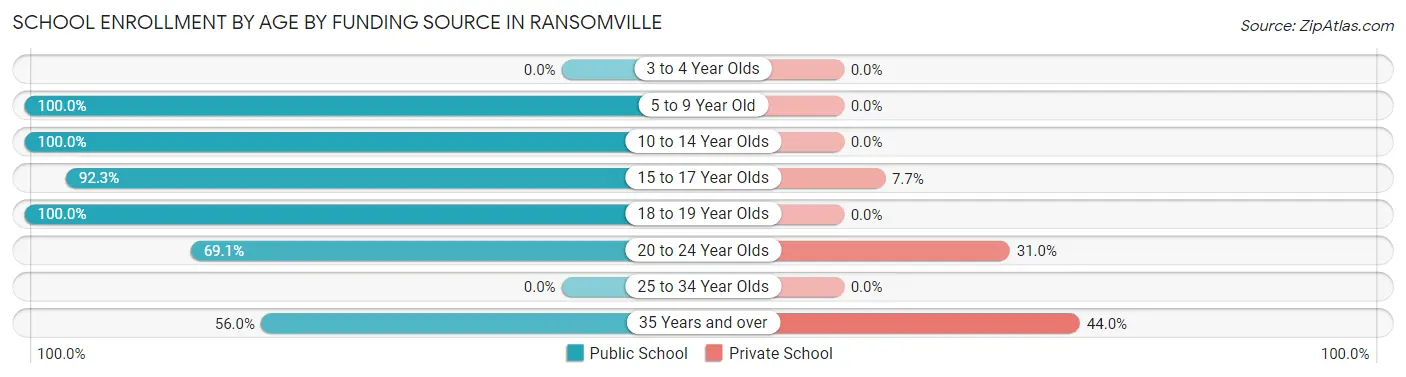
| Age Bracket | Public School | Private School |
| 3 to 4 Year Olds | 0 (0.0%) | 0 (0.0%) |
| 5 to 9 Year Old | 110 (100.0%) | 0 (0.0%) |
| 10 to 14 Year Olds | 118 (100.0%) | 0 (0.0%) |
| 15 to 17 Year Olds | 96 (92.3%) | 8 (7.7%) |
| 18 to 19 Year Olds | 44 (100.0%) | 0 (0.0%) |
| 20 to 24 Year Olds | 29 (69.1%) | 13 (30.9%) |
| 25 to 34 Year Olds | 0 (0.0%) | 0 (0.0%) |
| 35 Years and over | 14 (56.0%) | 11 (44.0%) |
| Total | 411 (92.8%) | 32 (7.2%) |
Educational Attainment by Field of Study in Ransomville
Science & technology (87 | 58.8%), education (39 | 26.4%), communications (10 | 6.8%), computers & mathematics (7 | 4.7%), and business (5 | 3.4%) are the most common fields of study among 148 individuals in Ransomville who have obtained a bachelor's degree or higher.
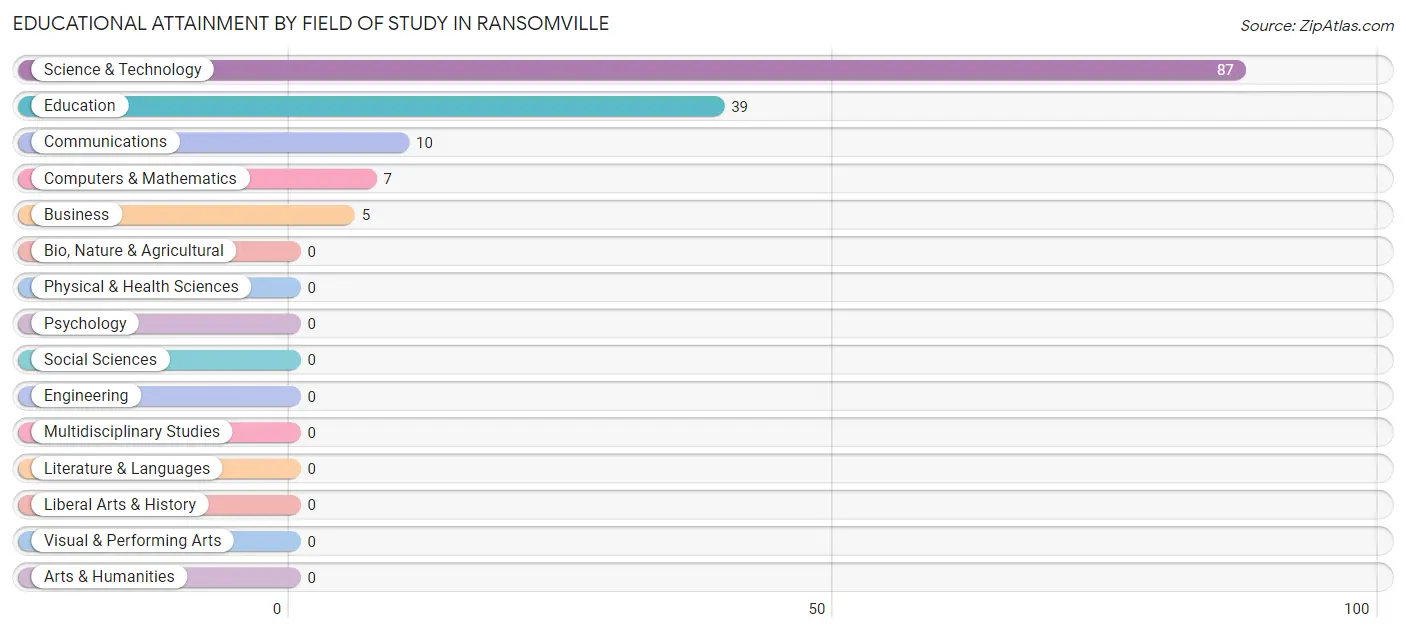
| Field of Study | # Graduates | % Graduates |
| Computers & Mathematics | 7 | 4.7% |
| Bio, Nature & Agricultural | 0 | 0.0% |
| Physical & Health Sciences | 0 | 0.0% |
| Psychology | 0 | 0.0% |
| Social Sciences | 0 | 0.0% |
| Engineering | 0 | 0.0% |
| Multidisciplinary Studies | 0 | 0.0% |
| Science & Technology | 87 | 58.8% |
| Business | 5 | 3.4% |
| Education | 39 | 26.4% |
| Literature & Languages | 0 | 0.0% |
| Liberal Arts & History | 0 | 0.0% |
| Visual & Performing Arts | 0 | 0.0% |
| Communications | 10 | 6.8% |
| Arts & Humanities | 0 | 0.0% |
| Total | 148 | 100.0% |
Transportation & Commute in Ransomville
Vehicle Availability by Sex in Ransomville
The most prevalent vehicle ownership categories in Ransomville are males with 5 or more vehicles (136, accounting for 27.9%) and females with 5 or more vehicles (108, making up 37.5%).
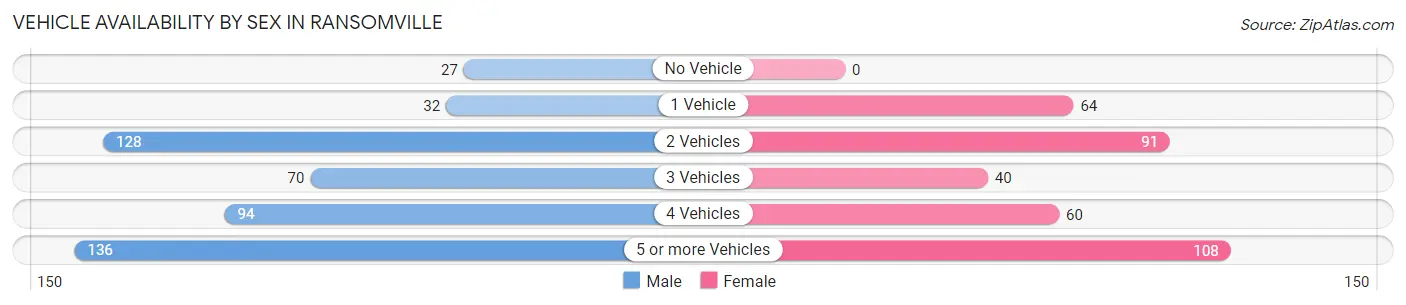
| Vehicles Available | Male | Female |
| No Vehicle | 27 (5.5%) | 0 (0.0%) |
| 1 Vehicle | 32 (6.6%) | 64 (17.6%) |
| 2 Vehicles | 128 (26.3%) | 91 (25.1%) |
| 3 Vehicles | 70 (14.4%) | 40 (11.0%) |
| 4 Vehicles | 94 (19.3%) | 60 (16.5%) |
| 5 or more Vehicles | 136 (27.9%) | 108 (29.7%) |
| Total | 487 (100.0%) | 363 (100.0%) |
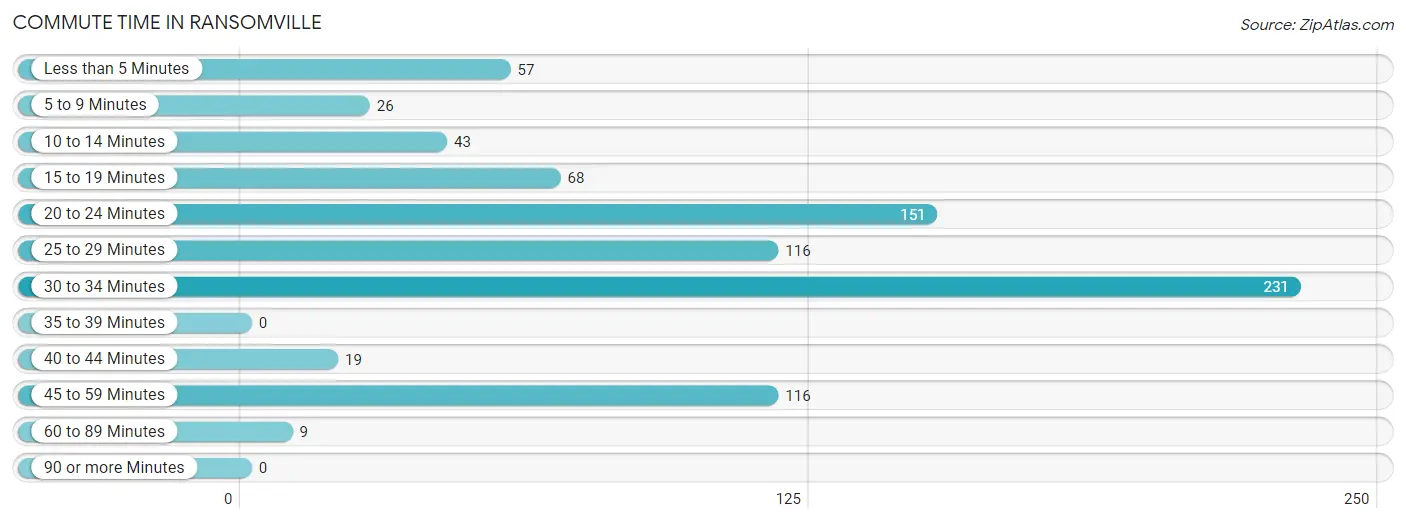
Commute Time in Ransomville
The most frequently occuring commute durations in Ransomville are 30 to 34 minutes (231 commuters, 27.6%), 20 to 24 minutes (151 commuters, 18.1%), and 25 to 29 minutes (116 commuters, 13.9%).
| Commute Time | # Commuters | % Commuters |
| Less than 5 Minutes | 57 | 6.8% |
| 5 to 9 Minutes | 26 | 3.1% |
| 10 to 14 Minutes | 43 | 5.1% |
| 15 to 19 Minutes | 68 | 8.1% |
| 20 to 24 Minutes | 151 | 18.1% |
| 25 to 29 Minutes | 116 | 13.9% |
| 30 to 34 Minutes | 231 | 27.6% |
| 35 to 39 Minutes | 0 | 0.0% |
| 40 to 44 Minutes | 19 | 2.3% |
| 45 to 59 Minutes | 116 | 13.9% |
| 60 to 89 Minutes | 9 | 1.1% |
| 90 or more Minutes | 0 | 0.0% |
Commute Time by Sex in Ransomville
The most common commute times in Ransomville are 30 to 34 minutes (221 commuters, 45.4%) for males and 20 to 24 minutes (121 commuters, 34.7%) for females.
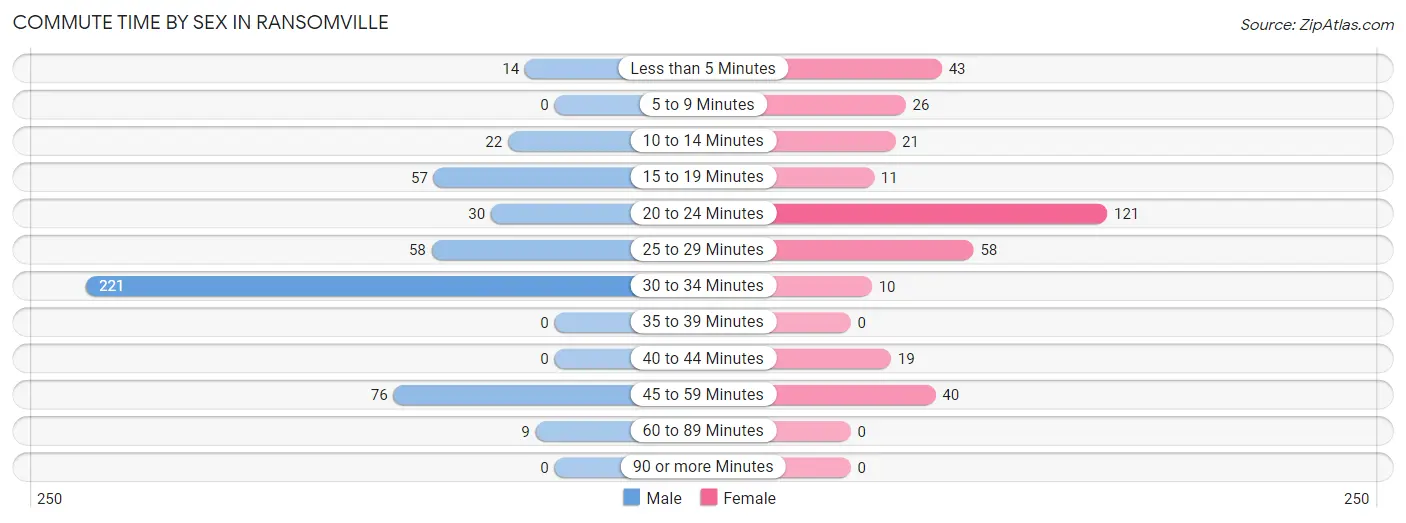
| Commute Time | Male | Female |
| Less than 5 Minutes | 14 (2.9%) | 43 (12.3%) |
| 5 to 9 Minutes | 0 (0.0%) | 26 (7.4%) |
| 10 to 14 Minutes | 22 (4.5%) | 21 (6.0%) |
| 15 to 19 Minutes | 57 (11.7%) | 11 (3.2%) |
| 20 to 24 Minutes | 30 (6.2%) | 121 (34.7%) |
| 25 to 29 Minutes | 58 (11.9%) | 58 (16.6%) |
| 30 to 34 Minutes | 221 (45.4%) | 10 (2.9%) |
| 35 to 39 Minutes | 0 (0.0%) | 0 (0.0%) |
| 40 to 44 Minutes | 0 (0.0%) | 19 (5.4%) |
| 45 to 59 Minutes | 76 (15.6%) | 40 (11.5%) |
| 60 to 89 Minutes | 9 (1.8%) | 0 (0.0%) |
| 90 or more Minutes | 0 (0.0%) | 0 (0.0%) |
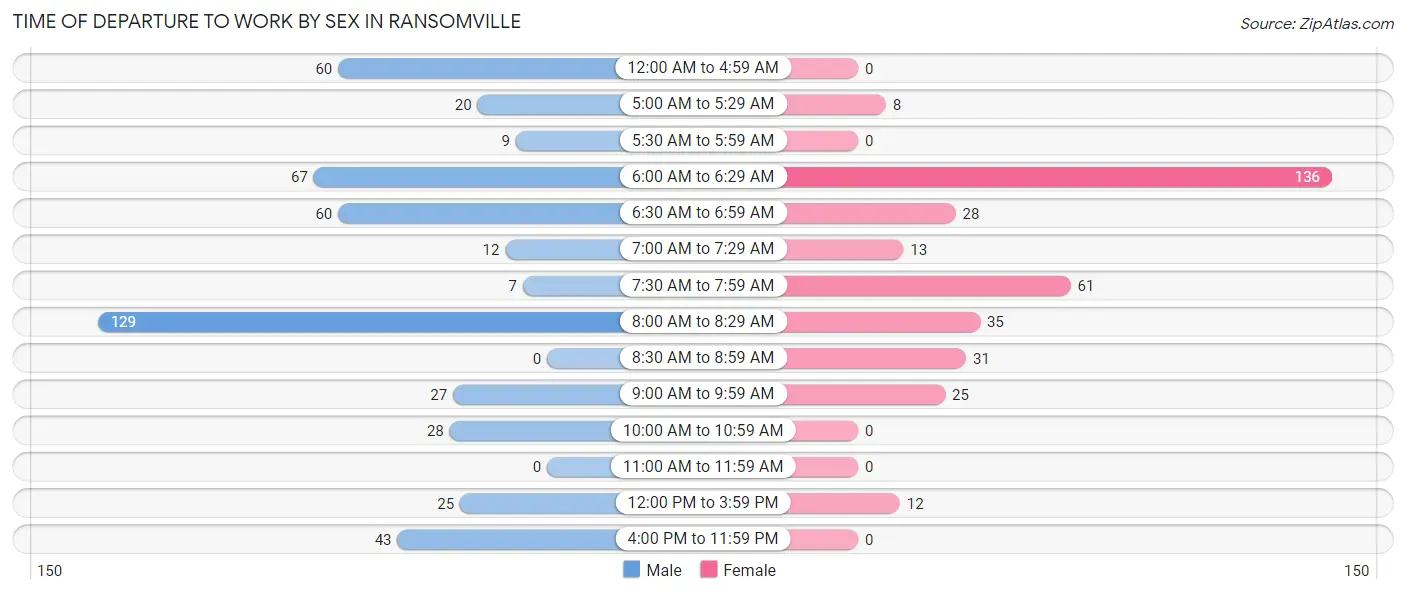
Time of Departure to Work by Sex in Ransomville
The most frequent times of departure to work in Ransomville are 8:00 AM to 8:29 AM (129, 26.5%) for males and 6:00 AM to 6:29 AM (136, 39.0%) for females.
| Time of Departure | Male | Female |
| 12:00 AM to 4:59 AM | 60 (12.3%) | 0 (0.0%) |
| 5:00 AM to 5:29 AM | 20 (4.1%) | 8 (2.3%) |
| 5:30 AM to 5:59 AM | 9 (1.8%) | 0 (0.0%) |
| 6:00 AM to 6:29 AM | 67 (13.8%) | 136 (39.0%) |
| 6:30 AM to 6:59 AM | 60 (12.3%) | 28 (8.0%) |
| 7:00 AM to 7:29 AM | 12 (2.5%) | 13 (3.7%) |
| 7:30 AM to 7:59 AM | 7 (1.4%) | 61 (17.5%) |
| 8:00 AM to 8:29 AM | 129 (26.5%) | 35 (10.0%) |
| 8:30 AM to 8:59 AM | 0 (0.0%) | 31 (8.9%) |
| 9:00 AM to 9:59 AM | 27 (5.5%) | 25 (7.2%) |
| 10:00 AM to 10:59 AM | 28 (5.8%) | 0 (0.0%) |
| 11:00 AM to 11:59 AM | 0 (0.0%) | 0 (0.0%) |
| 12:00 PM to 3:59 PM | 25 (5.1%) | 12 (3.4%) |
| 4:00 PM to 11:59 PM | 43 (8.8%) | 0 (0.0%) |
| Total | 487 (100.0%) | 349 (100.0%) |
Housing Occupancy in Ransomville
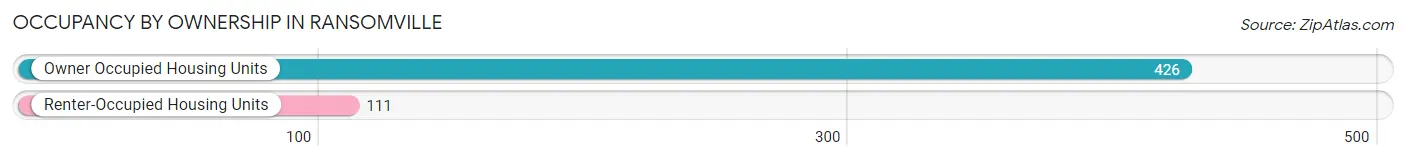
Occupancy by Ownership in Ransomville
Of the total 537 dwellings in Ransomville, owner-occupied units account for 426 (79.3%), while renter-occupied units make up 111 (20.7%).
| Occupancy | # Housing Units | % Housing Units |
| Owner Occupied Housing Units | 426 | 79.3% |
| Renter-Occupied Housing Units | 111 | 20.7% |
| Total Occupied Housing Units | 537 | 100.0% |
Occupancy by Household Size in Ransomville
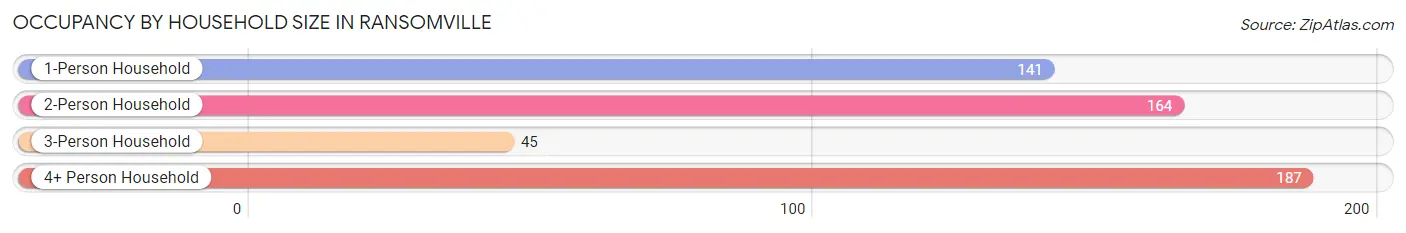
| Household Size | # Housing Units | % Housing Units |
| 1-Person Household | 141 | 26.3% |
| 2-Person Household | 164 | 30.5% |
| 3-Person Household | 45 | 8.4% |
| 4+ Person Household | 187 | 34.8% |
| Total Housing Units | 537 | 100.0% |
Occupancy by Ownership by Household Size in Ransomville
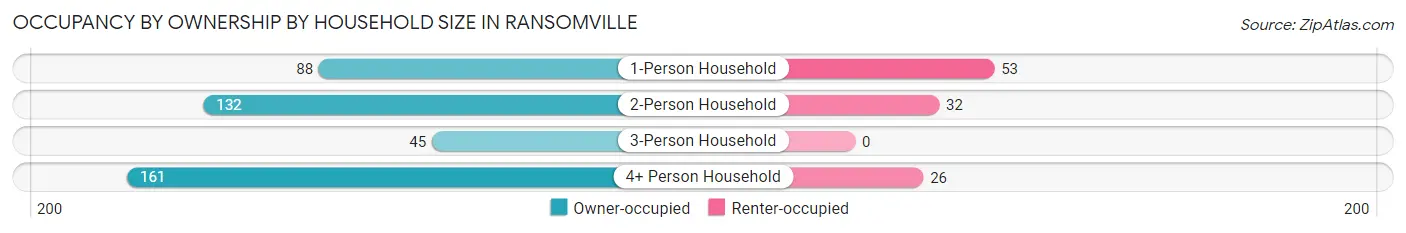
| Household Size | Owner-occupied | Renter-occupied |
| 1-Person Household | 88 (62.4%) | 53 (37.6%) |
| 2-Person Household | 132 (80.5%) | 32 (19.5%) |
| 3-Person Household | 45 (100.0%) | 0 (0.0%) |
| 4+ Person Household | 161 (86.1%) | 26 (13.9%) |
| Total Housing Units | 426 (79.3%) | 111 (20.7%) |
Occupancy by Educational Attainment in Ransomville
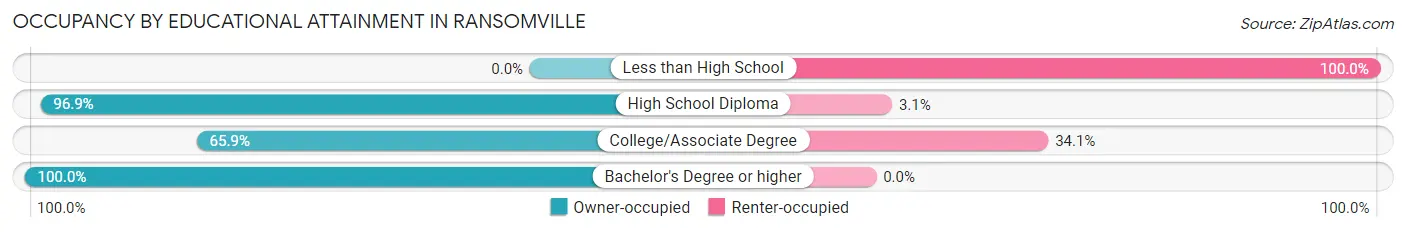
| Household Size | Owner-occupied | Renter-occupied |
| Less than High School | 0 (0.0%) | 32 (100.0%) |
| High School Diploma | 185 (96.9%) | 6 (3.1%) |
| College/Associate Degree | 141 (65.9%) | 73 (34.1%) |
| Bachelor's Degree or higher | 100 (100.0%) | 0 (0.0%) |
Occupancy by Age of Householder in Ransomville
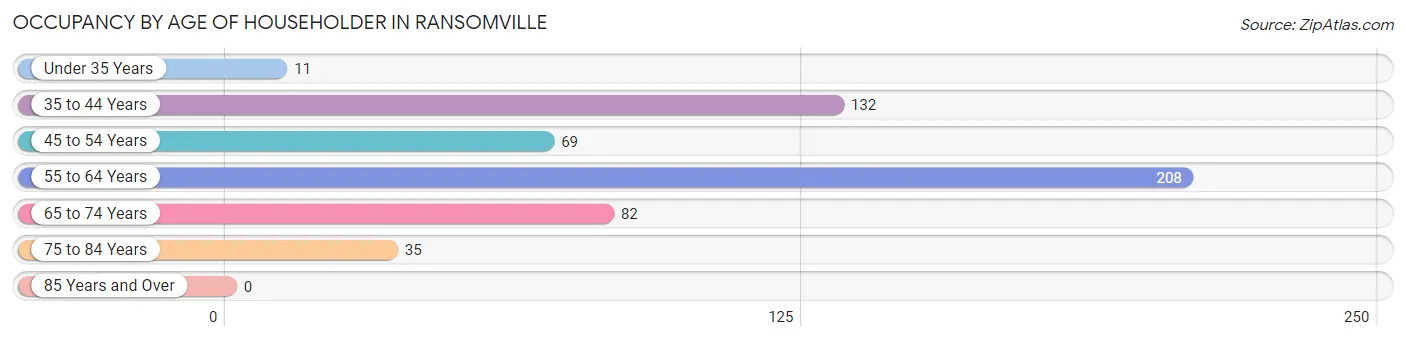
| Age Bracket | # Households | % Households |
| Under 35 Years | 11 | 2.1% |
| 35 to 44 Years | 132 | 24.6% |
| 45 to 54 Years | 69 | 12.9% |
| 55 to 64 Years | 208 | 38.7% |
| 65 to 74 Years | 82 | 15.3% |
| 75 to 84 Years | 35 | 6.5% |
| 85 Years and Over | 0 | 0.0% |
| Total | 537 | 100.0% |
Housing Finances in Ransomville
Median Income by Occupancy in Ransomville
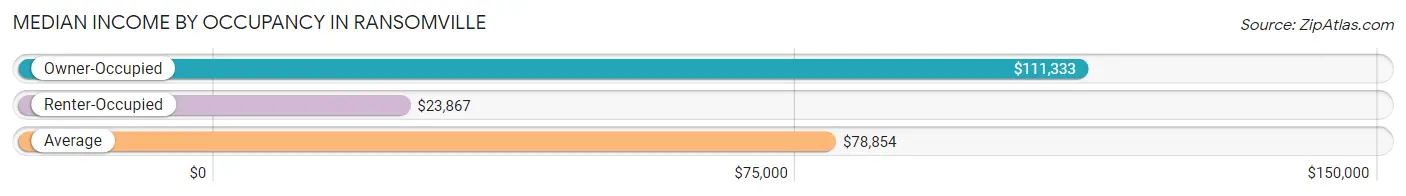
| Occupancy Type | # Households | Median Income |
| Owner-Occupied | 426 (79.3%) | $111,333 |
| Renter-Occupied | 111 (20.7%) | $23,867 |
| Average | 537 (100.0%) | $78,854 |
Occupancy by Householder Income Bracket in Ransomville
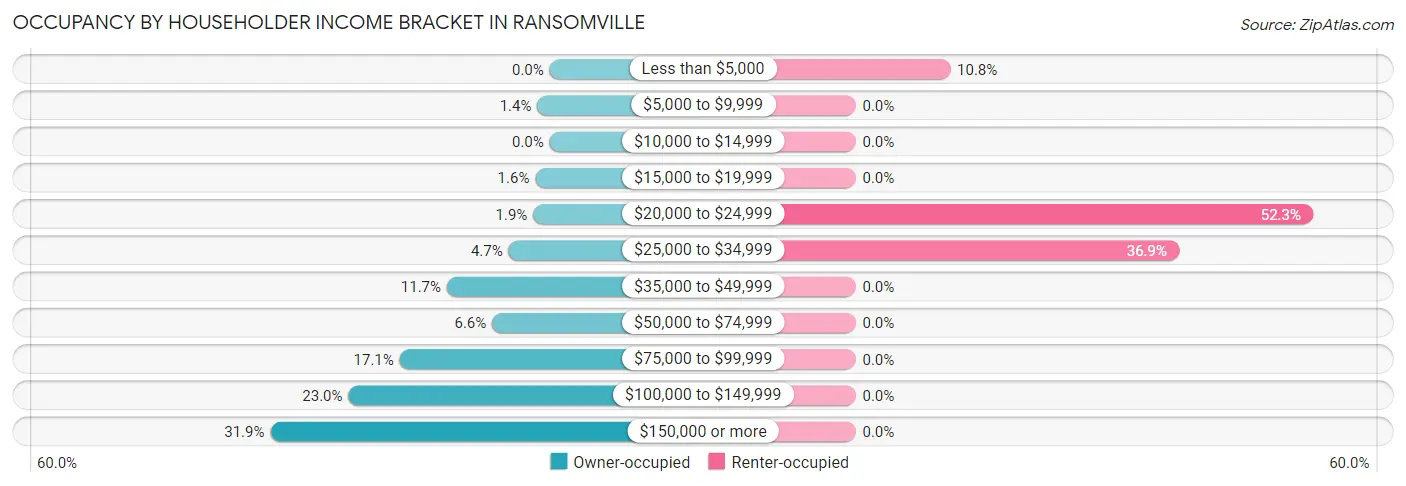
| Income Bracket | Owner-occupied | Renter-occupied |
| Less than $5,000 | 0 (0.0%) | 12 (10.8%) |
| $5,000 to $9,999 | 6 (1.4%) | 0 (0.0%) |
| $10,000 to $14,999 | 0 (0.0%) | 0 (0.0%) |
| $15,000 to $19,999 | 7 (1.6%) | 0 (0.0%) |
| $20,000 to $24,999 | 8 (1.9%) | 58 (52.2%) |
| $25,000 to $34,999 | 20 (4.7%) | 41 (36.9%) |
| $35,000 to $49,999 | 50 (11.7%) | 0 (0.0%) |
| $50,000 to $74,999 | 28 (6.6%) | 0 (0.0%) |
| $75,000 to $99,999 | 73 (17.1%) | 0 (0.0%) |
| $100,000 to $149,999 | 98 (23.0%) | 0 (0.0%) |
| $150,000 or more | 136 (31.9%) | 0 (0.0%) |
| Total | 426 (100.0%) | 111 (100.0%) |
Monthly Housing Cost Tiers in Ransomville
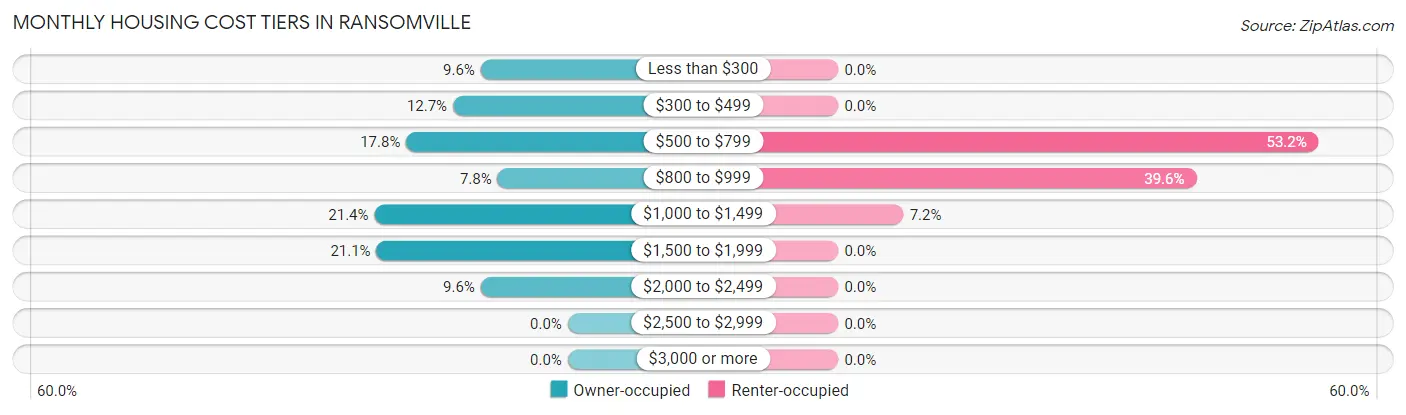
| Monthly Cost | Owner-occupied | Renter-occupied |
| Less than $300 | 41 (9.6%) | 0 (0.0%) |
| $300 to $499 | 54 (12.7%) | 0 (0.0%) |
| $500 to $799 | 76 (17.8%) | 59 (53.1%) |
| $800 to $999 | 33 (7.7%) | 44 (39.6%) |
| $1,000 to $1,499 | 91 (21.4%) | 8 (7.2%) |
| $1,500 to $1,999 | 90 (21.1%) | 0 (0.0%) |
| $2,000 to $2,499 | 41 (9.6%) | 0 (0.0%) |
| $2,500 to $2,999 | 0 (0.0%) | 0 (0.0%) |
| $3,000 or more | 0 (0.0%) | 0 (0.0%) |
| Total | 426 (100.0%) | 111 (100.0%) |
Physical Housing Characteristics in Ransomville
Housing Structures in Ransomville
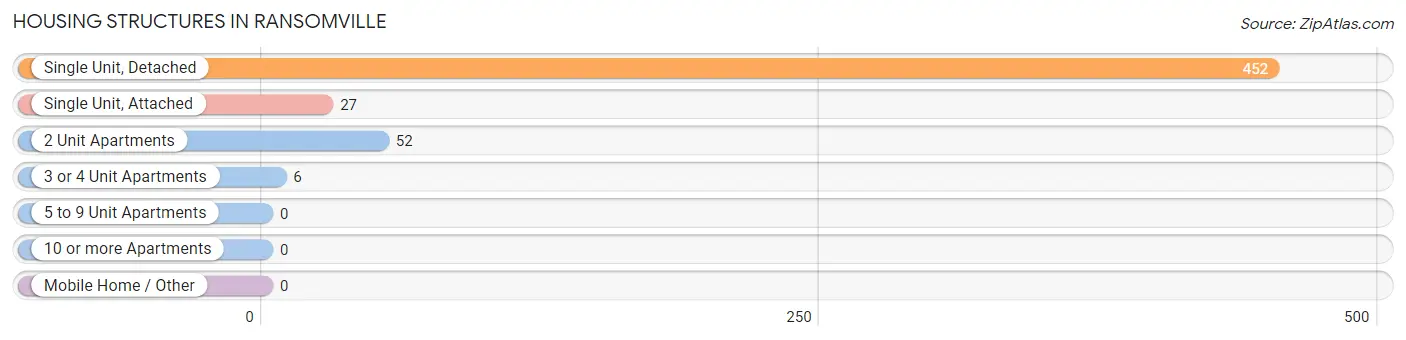
| Structure Type | # Housing Units | % Housing Units |
| Single Unit, Detached | 452 | 84.2% |
| Single Unit, Attached | 27 | 5.0% |
| 2 Unit Apartments | 52 | 9.7% |
| 3 or 4 Unit Apartments | 6 | 1.1% |
| 5 to 9 Unit Apartments | 0 | 0.0% |
| 10 or more Apartments | 0 | 0.0% |
| Mobile Home / Other | 0 | 0.0% |
| Total | 537 | 100.0% |
Housing Structures by Occupancy in Ransomville
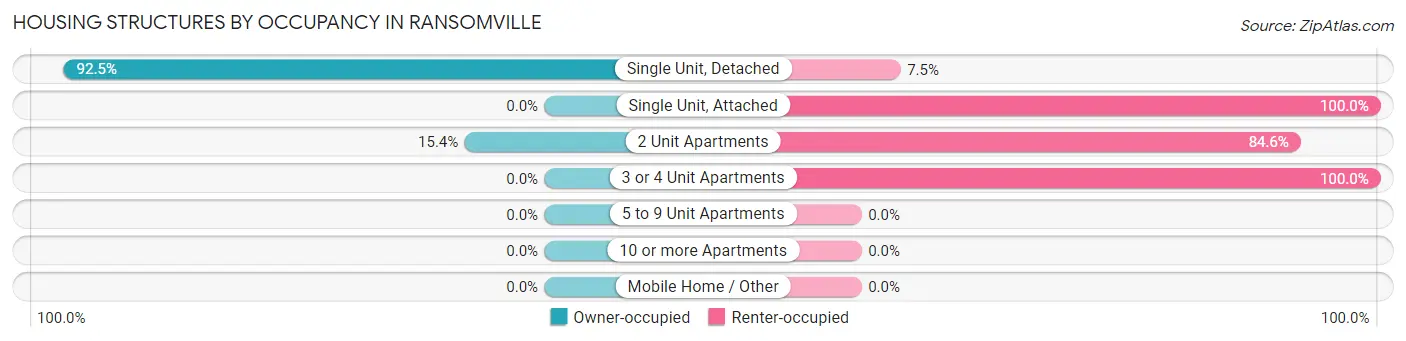
| Structure Type | Owner-occupied | Renter-occupied |
| Single Unit, Detached | 418 (92.5%) | 34 (7.5%) |
| Single Unit, Attached | 0 (0.0%) | 27 (100.0%) |
| 2 Unit Apartments | 8 (15.4%) | 44 (84.6%) |
| 3 or 4 Unit Apartments | 0 (0.0%) | 6 (100.0%) |
| 5 to 9 Unit Apartments | 0 (0.0%) | 0 (0.0%) |
| 10 or more Apartments | 0 (0.0%) | 0 (0.0%) |
| Mobile Home / Other | 0 (0.0%) | 0 (0.0%) |
| Total | 426 (79.3%) | 111 (20.7%) |
Housing Structures by Number of Rooms in Ransomville
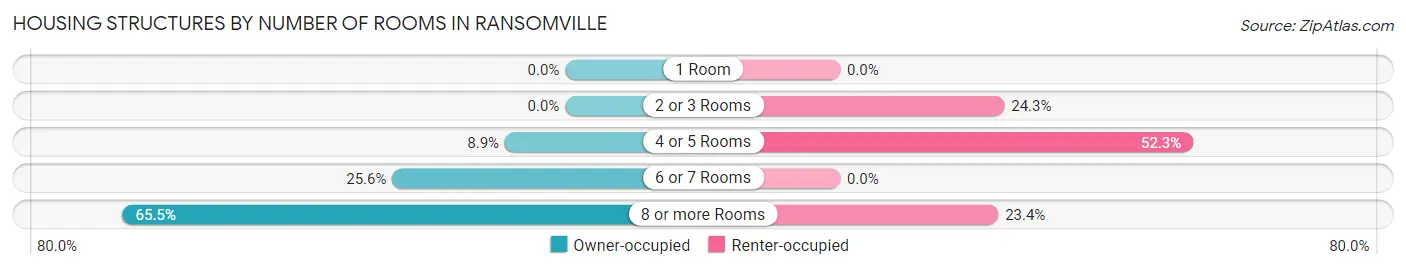
| Number of Rooms | Owner-occupied | Renter-occupied |
| 1 Room | 0 (0.0%) | 0 (0.0%) |
| 2 or 3 Rooms | 0 (0.0%) | 27 (24.3%) |
| 4 or 5 Rooms | 38 (8.9%) | 58 (52.2%) |
| 6 or 7 Rooms | 109 (25.6%) | 0 (0.0%) |
| 8 or more Rooms | 279 (65.5%) | 26 (23.4%) |
| Total | 426 (100.0%) | 111 (100.0%) |
Housing Structure by Heating Type in Ransomville
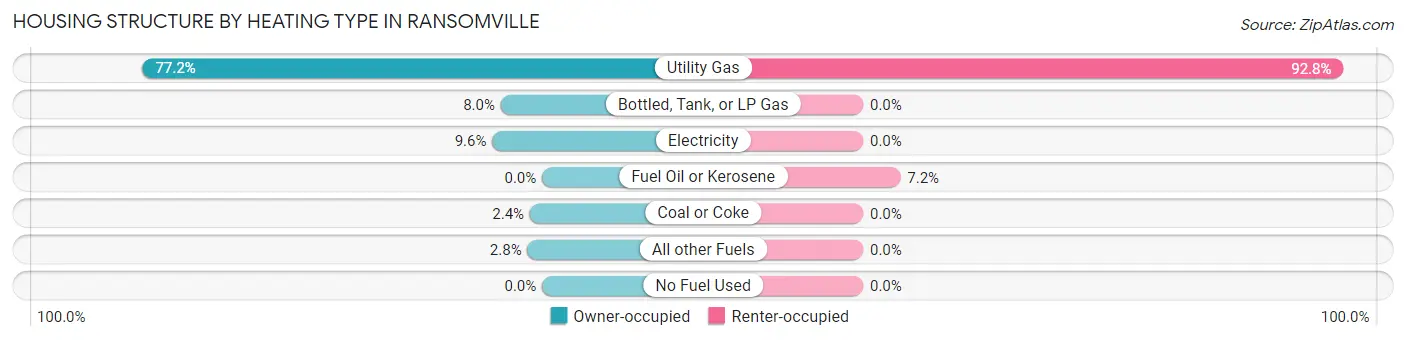
| Heating Type | Owner-occupied | Renter-occupied |
| Utility Gas | 329 (77.2%) | 103 (92.8%) |
| Bottled, Tank, or LP Gas | 34 (8.0%) | 0 (0.0%) |
| Electricity | 41 (9.6%) | 0 (0.0%) |
| Fuel Oil or Kerosene | 0 (0.0%) | 8 (7.2%) |
| Coal or Coke | 10 (2.4%) | 0 (0.0%) |
| All other Fuels | 12 (2.8%) | 0 (0.0%) |
| No Fuel Used | 0 (0.0%) | 0 (0.0%) |
| Total | 426 (100.0%) | 111 (100.0%) |
Household Vehicle Usage in Ransomville
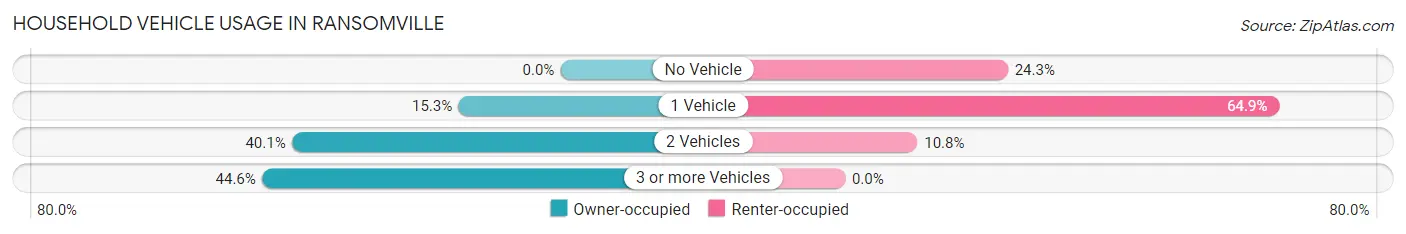
| Vehicles per Household | Owner-occupied | Renter-occupied |
| No Vehicle | 0 (0.0%) | 27 (24.3%) |
| 1 Vehicle | 65 (15.3%) | 72 (64.9%) |
| 2 Vehicles | 171 (40.1%) | 12 (10.8%) |
| 3 or more Vehicles | 190 (44.6%) | 0 (0.0%) |
| Total | 426 (100.0%) | 111 (100.0%) |
Real Estate & Mortgages in Ransomville
Real Estate and Mortgage Overview in Ransomville
| Characteristic | Without Mortgage | With Mortgage |
| Housing Units | 144 | 282 |
| Median Property Value | $191,700 | $197,100 |
| Median Household Income | - | - |
| Monthly Housing Costs | $460 | $0 |
| Real Estate Taxes | $2,469 | $0 |
Property Value by Mortgage Status in Ransomville
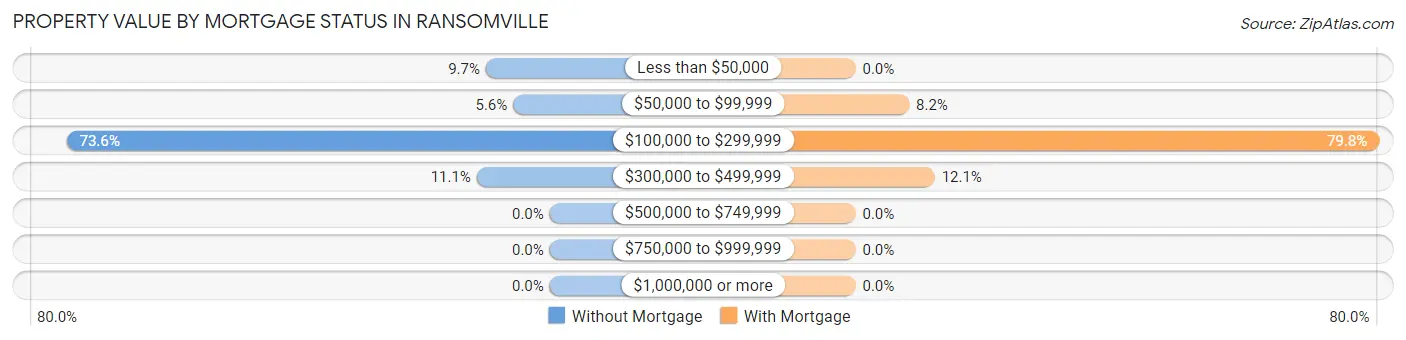
| Property Value | Without Mortgage | With Mortgage |
| Less than $50,000 | 14 (9.7%) | 0 (0.0%) |
| $50,000 to $99,999 | 8 (5.6%) | 23 (8.2%) |
| $100,000 to $299,999 | 106 (73.6%) | 225 (79.8%) |
| $300,000 to $499,999 | 16 (11.1%) | 34 (12.1%) |
| $500,000 to $749,999 | 0 (0.0%) | 0 (0.0%) |
| $750,000 to $999,999 | 0 (0.0%) | 0 (0.0%) |
| $1,000,000 or more | 0 (0.0%) | 0 (0.0%) |
| Total | 144 (100.0%) | 282 (100.0%) |
Household Income by Mortgage Status in Ransomville
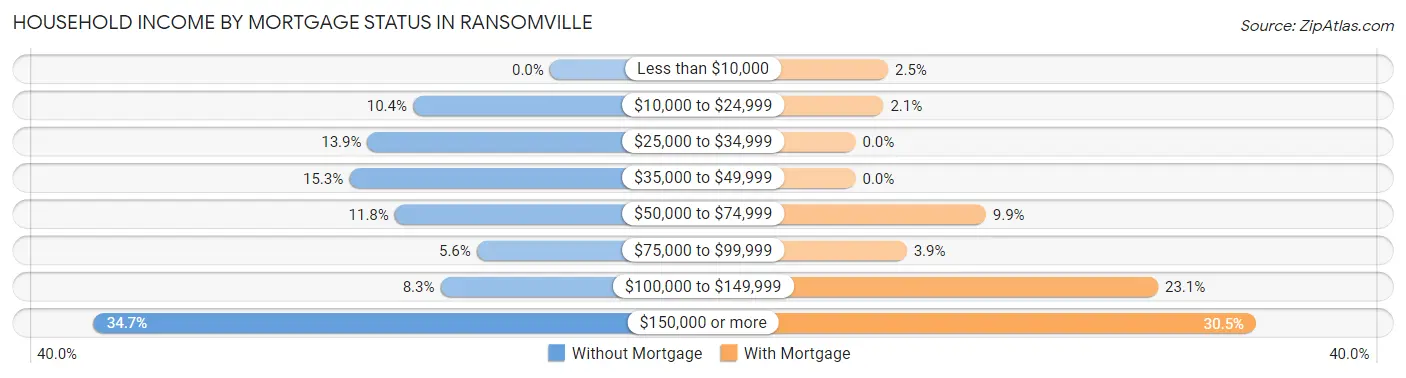
| Household Income | Without Mortgage | With Mortgage |
| Less than $10,000 | 0 (0.0%) | 7 (2.5%) |
| $10,000 to $24,999 | 15 (10.4%) | 6 (2.1%) |
| $25,000 to $34,999 | 20 (13.9%) | 0 (0.0%) |
| $35,000 to $49,999 | 22 (15.3%) | 0 (0.0%) |
| $50,000 to $74,999 | 17 (11.8%) | 28 (9.9%) |
| $75,000 to $99,999 | 8 (5.6%) | 11 (3.9%) |
| $100,000 to $149,999 | 12 (8.3%) | 65 (23.1%) |
| $150,000 or more | 50 (34.7%) | 86 (30.5%) |
| Total | 144 (100.0%) | 282 (100.0%) |
Property Value to Household Income Ratio in Ransomville
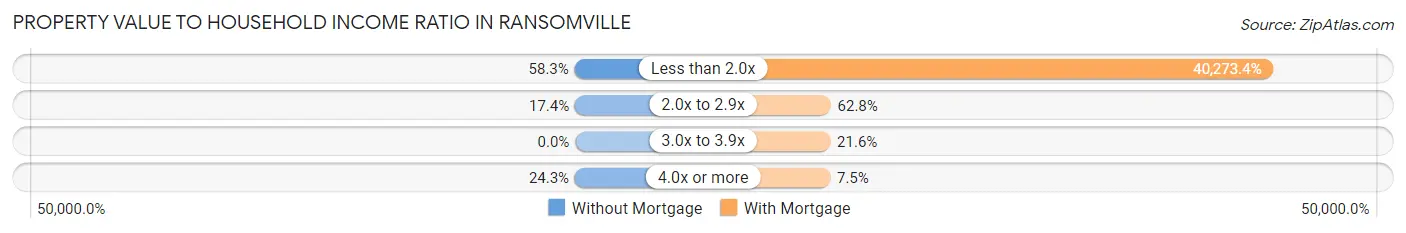
| Value-to-Income Ratio | Without Mortgage | With Mortgage |
| Less than 2.0x | 84 (58.3%) | 113,571 (40,273.4%) |
| 2.0x to 2.9x | 25 (17.4%) | 177 (62.8%) |
| 3.0x to 3.9x | 0 (0.0%) | 61 (21.6%) |
| 4.0x or more | 35 (24.3%) | 21 (7.4%) |
| Total | 144 (100.0%) | 282 (100.0%) |
Real Estate Taxes by Mortgage Status in Ransomville
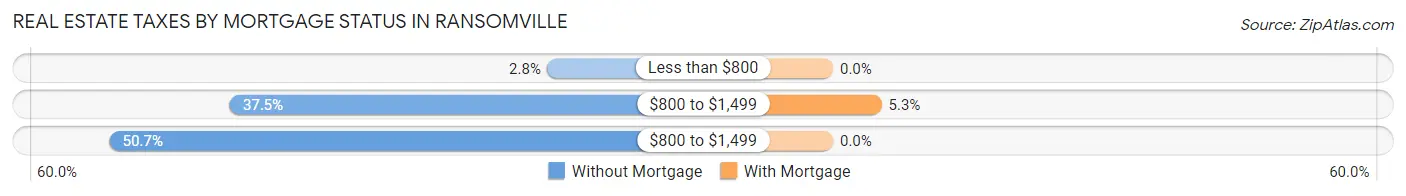
| Property Taxes | Without Mortgage | With Mortgage |
| Less than $800 | 4 (2.8%) | 0 (0.0%) |
| $800 to $1,499 | 54 (37.5%) | 15 (5.3%) |
| $800 to $1,499 | 73 (50.7%) | 0 (0.0%) |
| Total | 144 (100.0%) | 282 (100.0%) |
Health & Disability in Ransomville
Health Insurance Coverage by Age in Ransomville
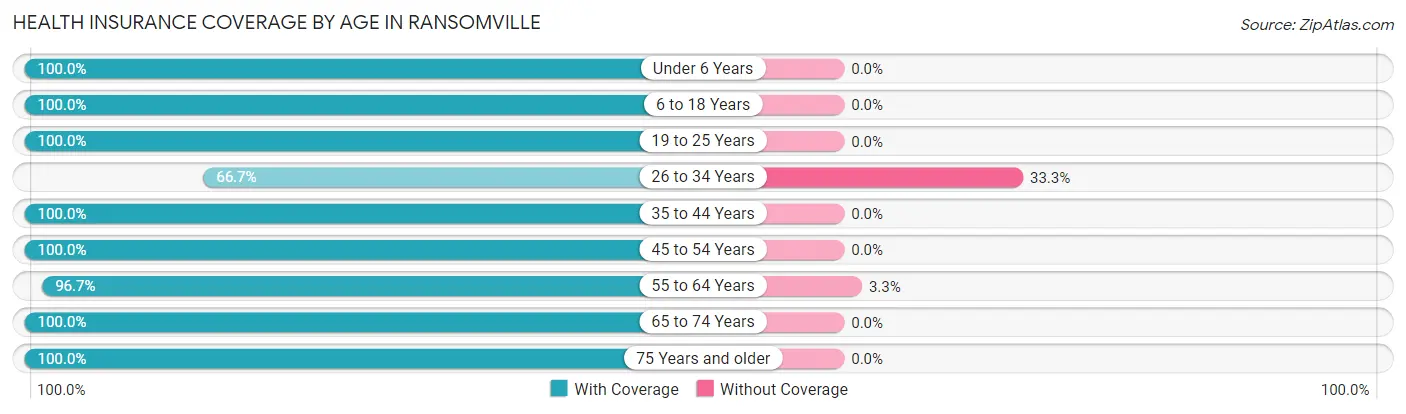
| Age Bracket | With Coverage | Without Coverage |
| Under 6 Years | 72 (100.0%) | 0 (0.0%) |
| 6 to 18 Years | 290 (100.0%) | 0 (0.0%) |
| 19 to 25 Years | 208 (100.0%) | 0 (0.0%) |
| 26 to 34 Years | 26 (66.7%) | 13 (33.3%) |
| 35 to 44 Years | 197 (100.0%) | 0 (0.0%) |
| 45 to 54 Years | 161 (100.0%) | 0 (0.0%) |
| 55 to 64 Years | 353 (96.7%) | 12 (3.3%) |
| 65 to 74 Years | 155 (100.0%) | 0 (0.0%) |
| 75 Years and older | 67 (100.0%) | 0 (0.0%) |
| Total | 1,529 (98.4%) | 25 (1.6%) |
Health Insurance Coverage by Citizenship Status in Ransomville
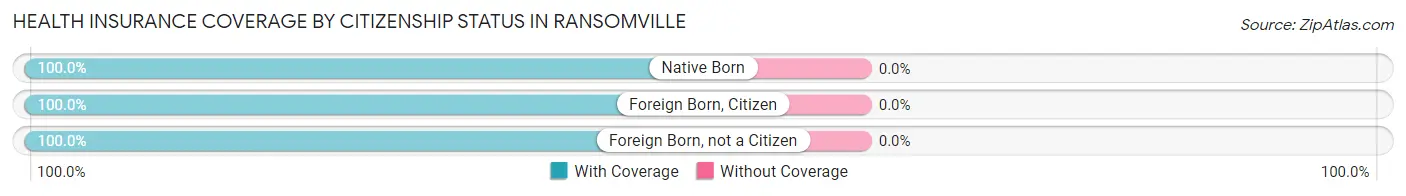
| Citizenship Status | With Coverage | Without Coverage |
| Native Born | 72 (100.0%) | 0 (0.0%) |
| Foreign Born, Citizen | 290 (100.0%) | 0 (0.0%) |
| Foreign Born, not a Citizen | 208 (100.0%) | 0 (0.0%) |
Health Insurance Coverage by Household Income in Ransomville
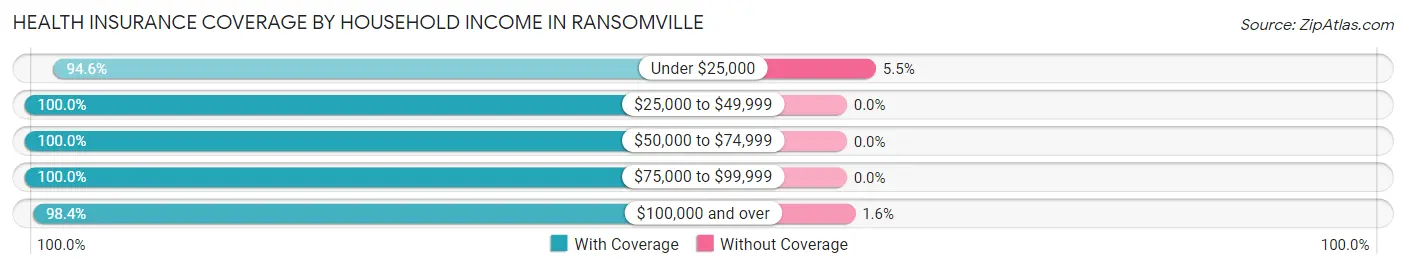
| Household Income | With Coverage | Without Coverage |
| Under $25,000 | 208 (94.6%) | 12 (5.4%) |
| $25,000 to $49,999 | 130 (100.0%) | 0 (0.0%) |
| $50,000 to $74,999 | 44 (100.0%) | 0 (0.0%) |
| $75,000 to $99,999 | 284 (100.0%) | 0 (0.0%) |
| $100,000 and over | 815 (98.4%) | 13 (1.6%) |
Public vs Private Health Insurance Coverage by Age in Ransomville
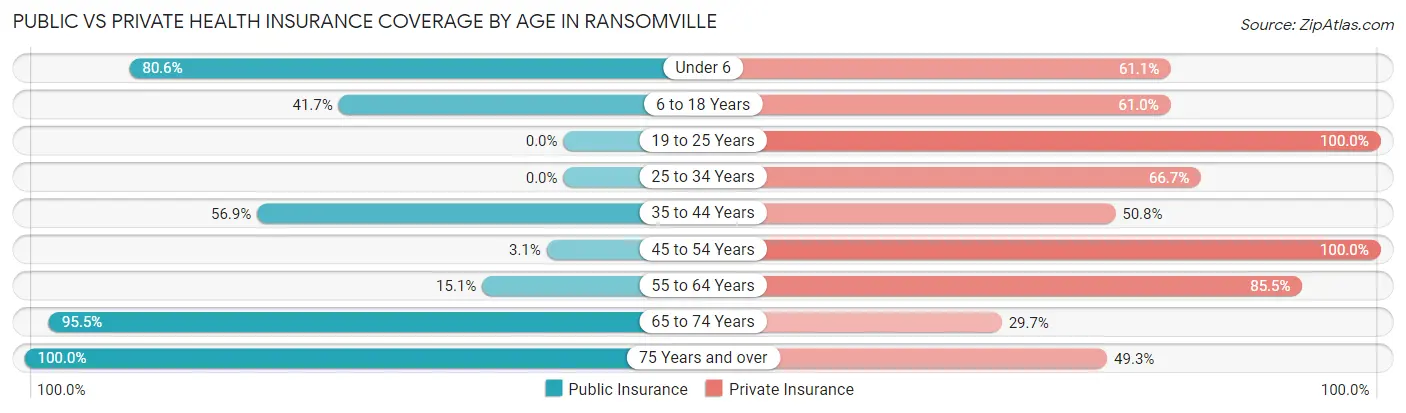
| Age Bracket | Public Insurance | Private Insurance |
| Under 6 | 58 (80.6%) | 44 (61.1%) |
| 6 to 18 Years | 121 (41.7%) | 177 (61.0%) |
| 19 to 25 Years | 0 (0.0%) | 208 (100.0%) |
| 25 to 34 Years | 0 (0.0%) | 26 (66.7%) |
| 35 to 44 Years | 112 (56.9%) | 100 (50.8%) |
| 45 to 54 Years | 5 (3.1%) | 161 (100.0%) |
| 55 to 64 Years | 55 (15.1%) | 312 (85.5%) |
| 65 to 74 Years | 148 (95.5%) | 46 (29.7%) |
| 75 Years and over | 67 (100.0%) | 33 (49.2%) |
| Total | 566 (36.4%) | 1,107 (71.2%) |
Disability Status by Sex by Age in Ransomville
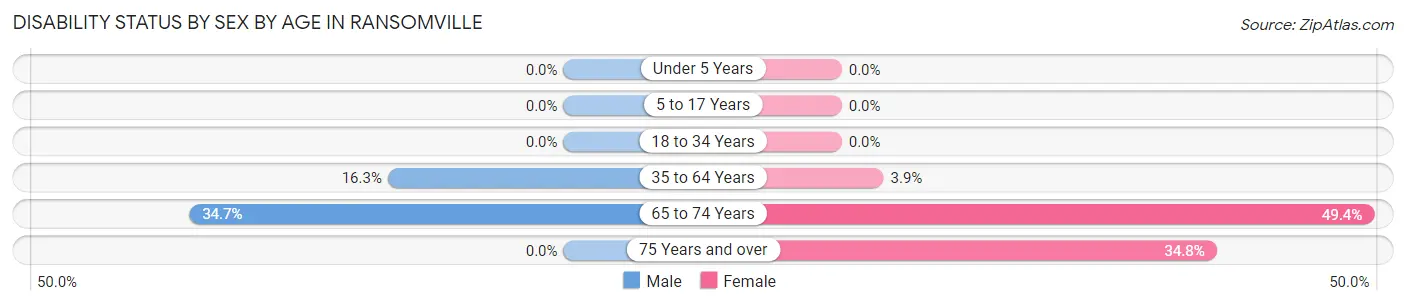
| Age Bracket | Male | Female |
| Under 5 Years | 0 (0.0%) | 0 (0.0%) |
| 5 to 17 Years | 0 (0.0%) | 0 (0.0%) |
| 18 to 34 Years | 0 (0.0%) | 0 (0.0%) |
| 35 to 64 Years | 59 (16.3%) | 14 (3.9%) |
| 65 to 74 Years | 25 (34.7%) | 41 (49.4%) |
| 75 Years and over | 0 (0.0%) | 16 (34.8%) |
Disability Class by Sex by Age in Ransomville
Disability Class: Hearing Difficulty
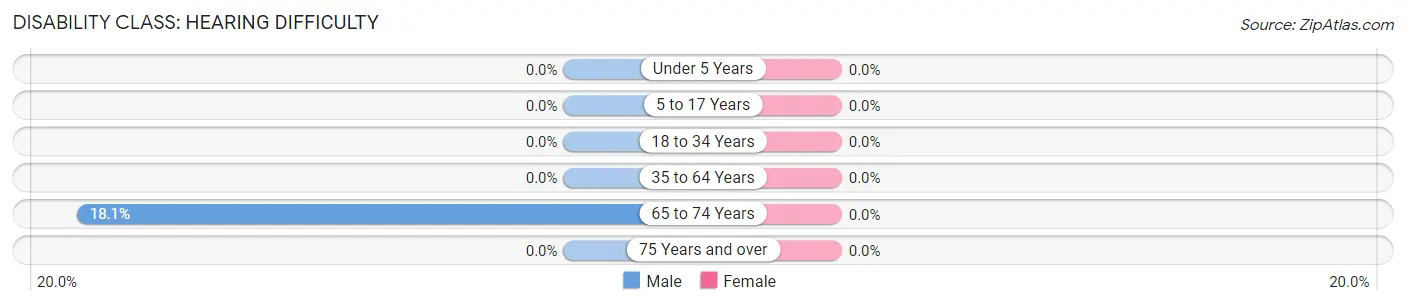
| Age Bracket | Male | Female |
| Under 5 Years | 0 (0.0%) | 0 (0.0%) |
| 5 to 17 Years | 0 (0.0%) | 0 (0.0%) |
| 18 to 34 Years | 0 (0.0%) | 0 (0.0%) |
| 35 to 64 Years | 0 (0.0%) | 0 (0.0%) |
| 65 to 74 Years | 13 (18.1%) | 0 (0.0%) |
| 75 Years and over | 0 (0.0%) | 0 (0.0%) |
Disability Class: Vision Difficulty
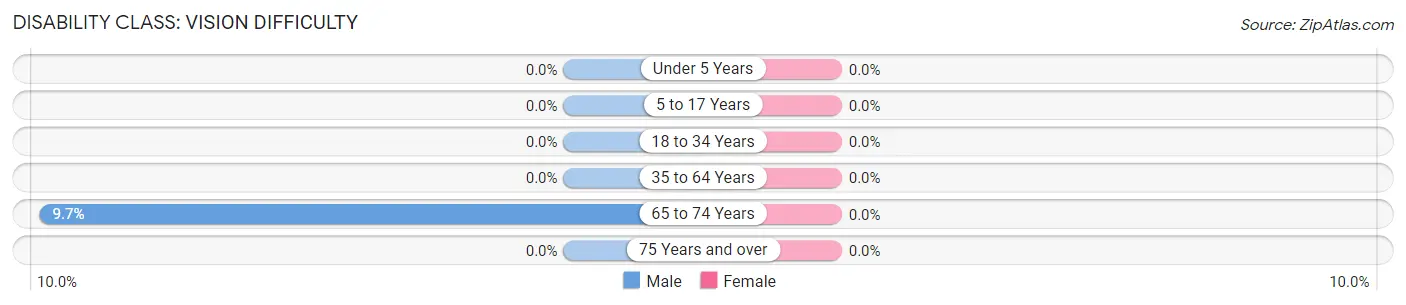
| Age Bracket | Male | Female |
| Under 5 Years | 0 (0.0%) | 0 (0.0%) |
| 5 to 17 Years | 0 (0.0%) | 0 (0.0%) |
| 18 to 34 Years | 0 (0.0%) | 0 (0.0%) |
| 35 to 64 Years | 0 (0.0%) | 0 (0.0%) |
| 65 to 74 Years | 7 (9.7%) | 0 (0.0%) |
| 75 Years and over | 0 (0.0%) | 0 (0.0%) |
Disability Class: Cognitive Difficulty
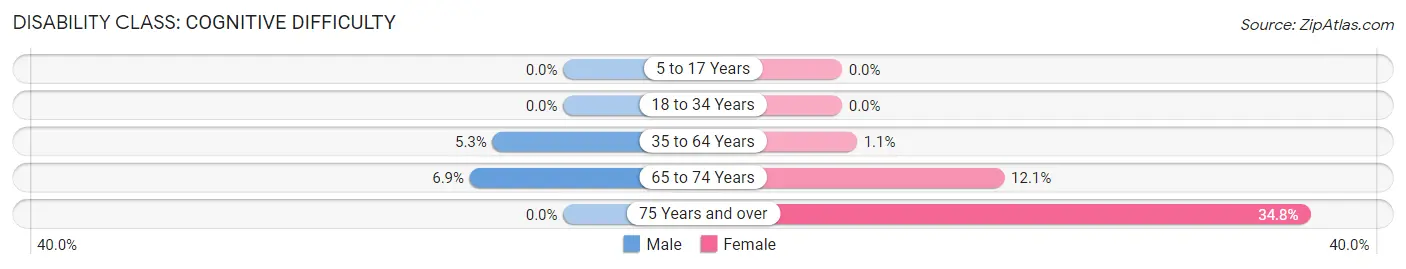
| Age Bracket | Male | Female |
| 5 to 17 Years | 0 (0.0%) | 0 (0.0%) |
| 18 to 34 Years | 0 (0.0%) | 0 (0.0%) |
| 35 to 64 Years | 19 (5.2%) | 4 (1.1%) |
| 65 to 74 Years | 5 (6.9%) | 10 (12.0%) |
| 75 Years and over | 0 (0.0%) | 16 (34.8%) |
Disability Class: Ambulatory Difficulty
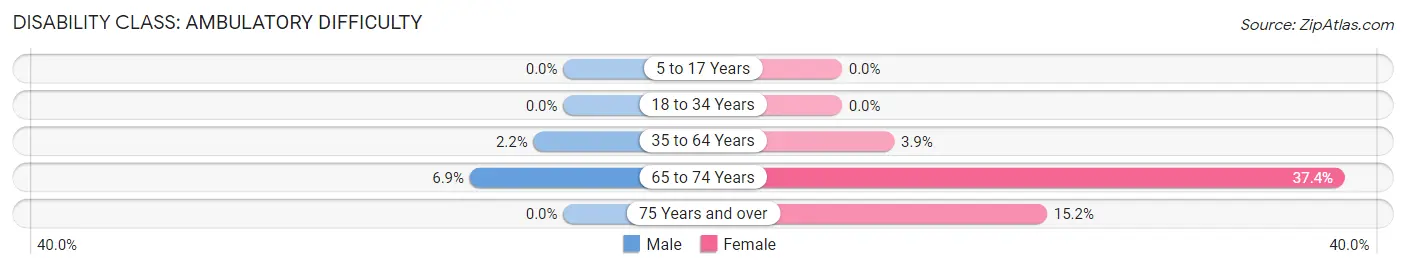
| Age Bracket | Male | Female |
| 5 to 17 Years | 0 (0.0%) | 0 (0.0%) |
| 18 to 34 Years | 0 (0.0%) | 0 (0.0%) |
| 35 to 64 Years | 8 (2.2%) | 14 (3.9%) |
| 65 to 74 Years | 5 (6.9%) | 31 (37.3%) |
| 75 Years and over | 0 (0.0%) | 7 (15.2%) |
Disability Class: Self-Care Difficulty
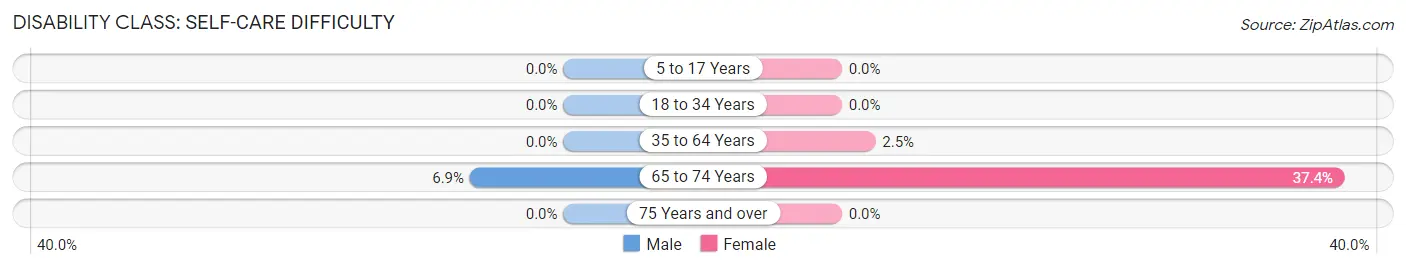
| Age Bracket | Male | Female |
| 5 to 17 Years | 0 (0.0%) | 0 (0.0%) |
| 18 to 34 Years | 0 (0.0%) | 0 (0.0%) |
| 35 to 64 Years | 0 (0.0%) | 9 (2.5%) |
| 65 to 74 Years | 5 (6.9%) | 31 (37.3%) |
| 75 Years and over | 0 (0.0%) | 0 (0.0%) |
Technology Access in Ransomville
Computing Device Access in Ransomville
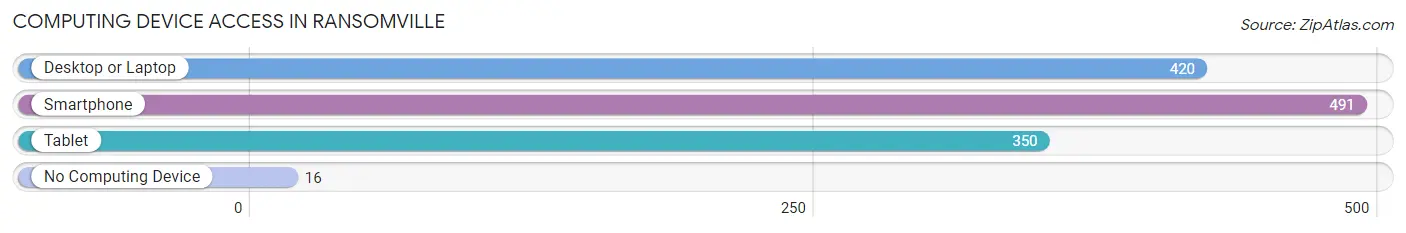
| Device Type | # Households | % Households |
| Desktop or Laptop | 420 | 78.2% |
| Smartphone | 491 | 91.4% |
| Tablet | 350 | 65.2% |
| No Computing Device | 16 | 3.0% |
| Total | 537 | 100.0% |
Internet Access in Ransomville
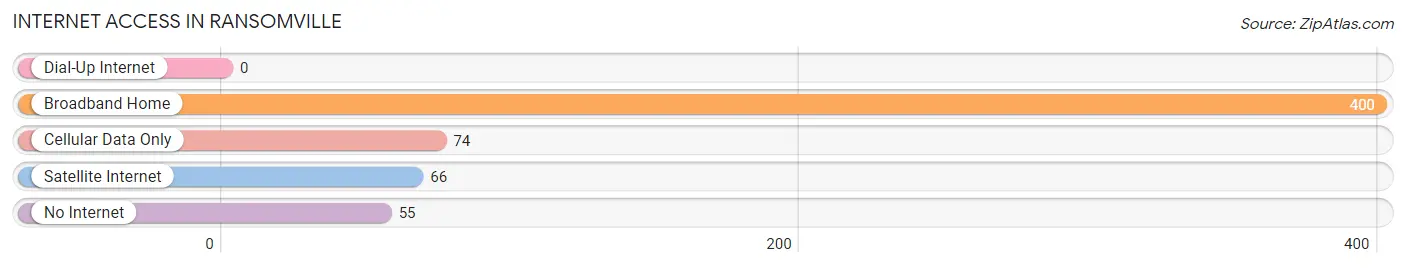
| Internet Type | # Households | % Households |
| Dial-Up Internet | 0 | 0.0% |
| Broadband Home | 400 | 74.5% |
| Cellular Data Only | 74 | 13.8% |
| Satellite Internet | 66 | 12.3% |
| No Internet | 55 | 10.2% |
| Total | 537 | 100.0% |
Ransomville Summary
Ransomville is a hamlet located in the Town of Porter in Niagara County, New York, United States. It is located on the banks of the Niagara River, just south of the City of Niagara Falls. The population was 1,845 at the 2010 census.
Geography
Ransomville is located at 43 1745 78 9072
According to the United States Census Bureau, the hamlet has a total area of 1.2 square miles (3.1 km2), all of it land.
History
Ransomville was founded in 1824 by William Ransom, a farmer from Connecticut. He purchased the land from the Holland Land Company and built a log cabin on the banks of the Niagara River. The hamlet was originally known as Ransomville Corners, but the name was shortened to Ransomville in 1845.
The hamlet grew slowly over the years, and by the late 19th century, it had become a popular summer resort destination. The hamlet was home to several hotels, including the Ransomville Hotel, which was built in 1875 and was one of the largest hotels in the area.
In the early 20th century, the hamlet began to decline as a resort destination, and many of the hotels were closed or converted into private residences. The hamlet continued to grow slowly, and by the 1950s, it had become a popular destination for weekenders from Buffalo and Niagara Falls.
Economy
Ransomville is primarily a residential community, but it does have a few businesses, including a grocery store, a hardware store, a gas station, and a few restaurants. The hamlet is also home to the Ransomville Speedway, which hosts stock car races on Friday nights during the summer months.
Demographics
As of the census of 2010, there were 1,845 people, 717 households, and 486 families residing in the hamlet. The population density was 1,539.2 people per square mile (595.2/km2). There were 767 housing units at an average density of 639.2 per square mile (247.2/km2). The racial makeup of the hamlet was 97.2% White, 0.7% African American, 0.2% Native American, 0.4% Asian, 0.1% Pacific Islander, 0.4% from other races, and 1.0% from two or more races. Hispanic or Latino of any race were 1.7% of the population.
There were 717 households, out of which 33.2% had children under the age of 18 living with them, 48.2% were married couples living together, 12.7% had a female householder with no husband present, and 33.2% were non-families. 28.2% of all households were made up of individuals, and 11.2% had someone living alone who was 65 years of age or older. The average household size was 2.56 and the average family size was 3.14.
In the hamlet, the population was spread out, with 25.7% under the age of 18, 7.2% from 18 to 24, 28.2% from 25 to 44, 24.2% from 45 to 64, and 14.7% who were 65 years of age or older. The median age was 38 years. For every 100 females, there were 95.2 males. For every 100 females age 18 and over, there were 92.2 males.
The median income for a household in the hamlet was $41,250, and the median income for a family was $50,000. Males had a median income of $36,250 versus $25,000 for females. The per capita income for the hamlet was $19,945. About 5.2% of families and 8.2% of the population were below the poverty line, including 10.2% of those under age 18 and 5.2% of those age 65 or over.
Common Questions
What is Per Capita Income in Ransomville?
Per Capita income in Ransomville is $32,608.
What is the Median Family Income in Ransomville?
Median Family Income in Ransomville is $113,571.
What is the Median Household income in Ransomville?
Median Household Income in Ransomville is $78,854.
What is Income or Wage Gap in Ransomville?
Income or Wage Gap in Ransomville is 0.8%.
Women in Ransomville earn 99.2 cents for every dollar earned by a man.
What is Inequality or Gini Index in Ransomville?
Inequality or Gini Index in Ransomville is 0.38.
What is the Total Population of Ransomville?
Total Population of Ransomville is 1,554.
What is the Total Male Population of Ransomville?
Total Male Population of Ransomville is 828.
What is the Total Female Population of Ransomville?
Total Female Population of Ransomville is 726.
What is the Ratio of Males per 100 Females in Ransomville?
There are 114.05 Males per 100 Females in Ransomville.
What is the Ratio of Females per 100 Males in Ransomville?
There are 87.68 Females per 100 Males in Ransomville.
What is the Median Population Age in Ransomville?
Median Population Age in Ransomville is 42.8 Years.
What is the Average Family Size in Ransomville
Average Family Size in Ransomville is 3.3 People.
What is the Average Household Size in Ransomville
Average Household Size in Ransomville is 2.8 People.
How Large is the Labor Force in Ransomville?
There are 887 People in the Labor Forcein in Ransomville.
What is the Percentage of People in the Labor Force in Ransomville?
69.3% of People are in the Labor Force in Ransomville.
What is the Unemployment Rate in Ransomville?
Unemployment Rate in Ransomville is 3.5%.