Shelter Island, NY Map & Demographics
Shelter Island Map
Shelter Island Overview
$48,529
PER CAPITA INCOME
$122,517
AVG FAMILY INCOME
$98,902
AVG HOUSEHOLD INCOME
25.2%
WAGE / INCOME GAP [ % ]
74.8¢/ $1
WAGE / INCOME GAP [ $ ]
0.33
INEQUALITY / GINI INDEX
2,564
TOTAL POPULATION
1,173
MALE POPULATION
1,391
FEMALE POPULATION
84.33
MALES / 100 FEMALES
118.58
FEMALES / 100 MALES
40.5
MEDIAN AGE
3.3
AVG FAMILY SIZE
2.8
AVG HOUSEHOLD SIZE
1,243
LABOR FORCE [ PEOPLE ]
66.2%
PERCENT IN LABOR FORCE
5.7%
UNEMPLOYMENT RATE
Shelter Island Zip Codes
Shelter Island Area Codes
Income in Shelter Island
Income Overview in Shelter Island
Per Capita Income in Shelter Island is $48,529, while median incomes of families and households are $122,517 and $98,902 respectively.
| Characteristic | Number | Measure |
| Per Capita Income | 2,564 | $48,529 |
| Median Family Income | 677 | $122,517 |
| Mean Family Income | 677 | $138,017 |
| Median Household Income | 926 | $98,902 |
| Mean Household Income | 926 | $133,191 |
| Income Deficit | 677 | $0 |
| Wage / Income Gap (%) | 2,564 | 25.24% |
| Wage / Income Gap ($) | 2,564 | 74.76¢ per $1 |
| Gini / Inequality Index | 2,564 | 0.33 |
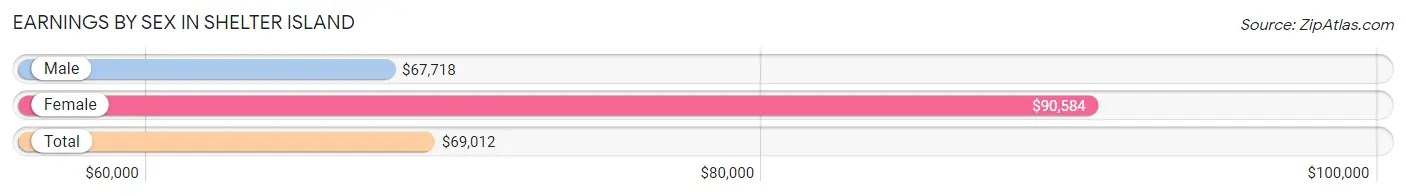
Earnings by Sex in Shelter Island
Average Earnings in Shelter Island are $69,012, $67,718 for men and $90,584 for women, a difference of 25.2%.
| Sex | Number | Average Earnings |
| Male | 729 (58.7%) | $67,718 |
| Female | 513 (41.3%) | $90,584 |
| Total | 1,242 (100.0%) | $69,012 |
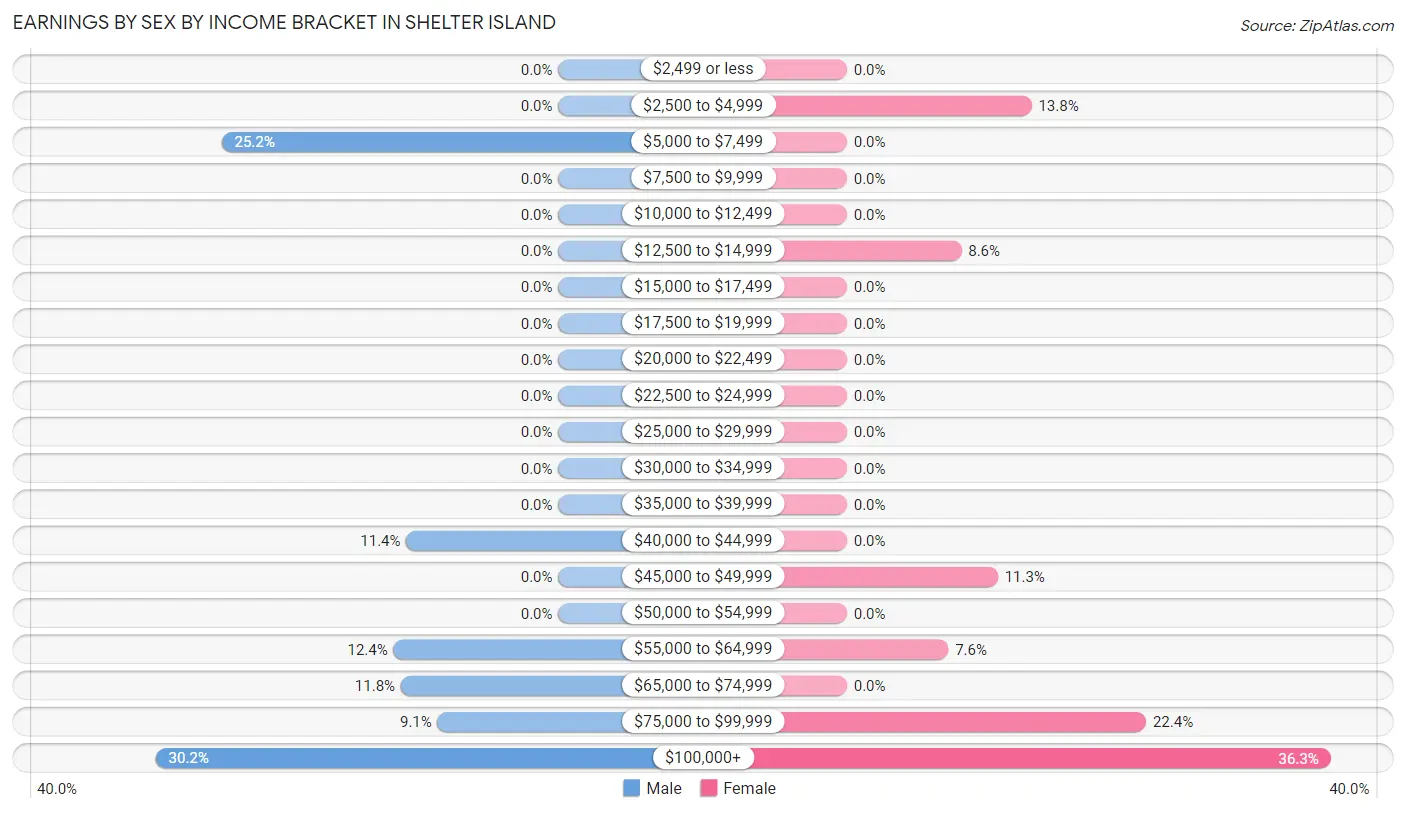
Earnings by Sex by Income Bracket in Shelter Island
The most common earnings brackets in Shelter Island are $100,000+ for men (220 | 30.2%) and $100,000+ for women (186 | 36.3%).
| Income | Male | Female |
| $2,499 or less | 0 (0.0%) | 0 (0.0%) |
| $2,500 to $4,999 | 0 (0.0%) | 71 (13.8%) |
| $5,000 to $7,499 | 184 (25.2%) | 0 (0.0%) |
| $7,500 to $9,999 | 0 (0.0%) | 0 (0.0%) |
| $10,000 to $12,499 | 0 (0.0%) | 0 (0.0%) |
| $12,500 to $14,999 | 0 (0.0%) | 44 (8.6%) |
| $15,000 to $17,499 | 0 (0.0%) | 0 (0.0%) |
| $17,500 to $19,999 | 0 (0.0%) | 0 (0.0%) |
| $20,000 to $22,499 | 0 (0.0%) | 0 (0.0%) |
| $22,500 to $24,999 | 0 (0.0%) | 0 (0.0%) |
| $25,000 to $29,999 | 0 (0.0%) | 0 (0.0%) |
| $30,000 to $34,999 | 0 (0.0%) | 0 (0.0%) |
| $35,000 to $39,999 | 0 (0.0%) | 0 (0.0%) |
| $40,000 to $44,999 | 83 (11.4%) | 0 (0.0%) |
| $45,000 to $49,999 | 0 (0.0%) | 58 (11.3%) |
| $50,000 to $54,999 | 0 (0.0%) | 0 (0.0%) |
| $55,000 to $64,999 | 90 (12.3%) | 39 (7.6%) |
| $65,000 to $74,999 | 86 (11.8%) | 0 (0.0%) |
| $75,000 to $99,999 | 66 (9.0%) | 115 (22.4%) |
| $100,000+ | 220 (30.2%) | 186 (36.3%) |
| Total | 729 (100.0%) | 513 (100.0%) |
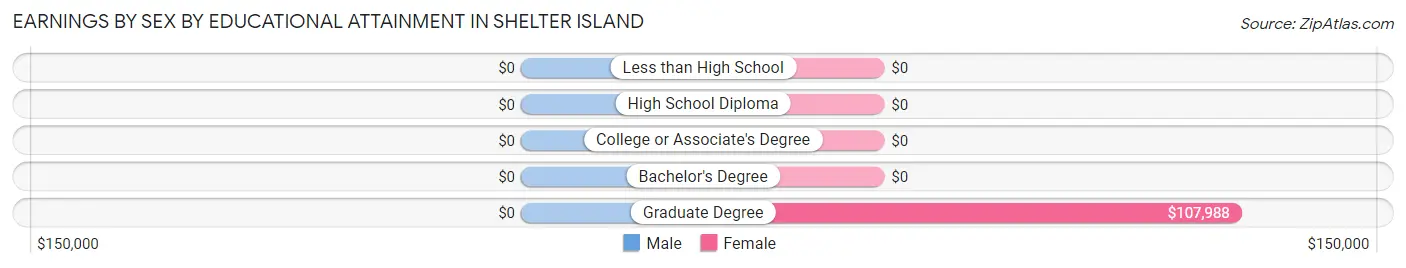
Earnings by Sex by Educational Attainment in Shelter Island
| Educational Attainment | Male Income | Female Income |
| Less than High School | - | - |
| High School Diploma | - | - |
| College or Associate's Degree | - | - |
| Bachelor's Degree | - | - |
| Graduate Degree | - | - |
| Total | $99,640 | $90,584 |
Family Income in Shelter Island
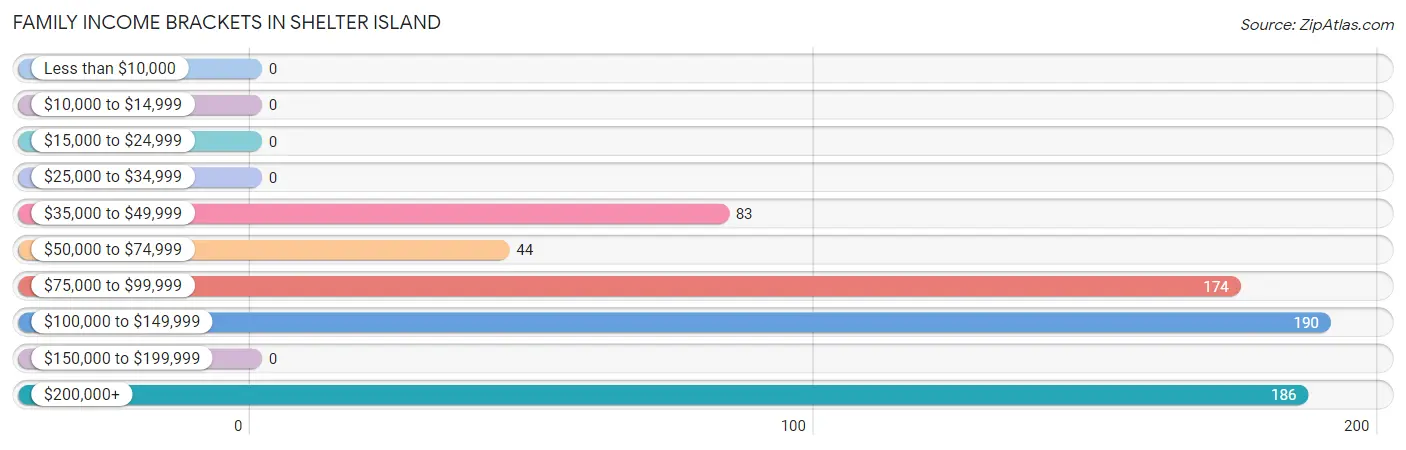
Family Income Brackets in Shelter Island
According to the Shelter Island family income data, there are 190 families falling into the $100,000 to $149,999 income range, which is the most common income bracket and makes up 28.1% of all families.
| Income Bracket | # Families | % Families |
| Less than $10,000 | 0 | 0.0% |
| $10,000 to $14,999 | 0 | 0.0% |
| $15,000 to $24,999 | 0 | 0.0% |
| $25,000 to $34,999 | 0 | 0.0% |
| $35,000 to $49,999 | 83 | 12.3% |
| $50,000 to $74,999 | 44 | 6.5% |
| $75,000 to $99,999 | 174 | 25.7% |
| $100,000 to $149,999 | 190 | 28.1% |
| $150,000 to $199,999 | 0 | 0.0% |
| $200,000+ | 186 | 27.5% |
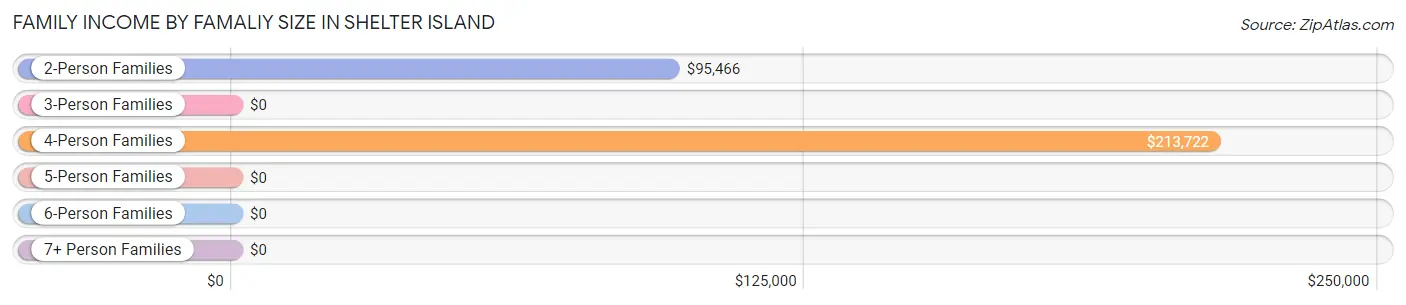
Family Income by Famaliy Size in Shelter Island
4-person families (220 | 32.5%) account for the highest median family income in Shelter Island with $213,722 per family, while 4-person families (220 | 32.5%) have the highest median income of $53,430 per family member.
| Income Bracket | # Families | Median Income |
| 2-Person Families | 221 (32.6%) | $95,466 |
| 3-Person Families | 153 (22.6%) | $0 |
| 4-Person Families | 220 (32.5%) | $213,722 |
| 5-Person Families | 0 (0.0%) | $0 |
| 6-Person Families | 83 (12.3%) | $0 |
| 7+ Person Families | 0 (0.0%) | $0 |
| Total | 677 (100.0%) | $122,517 |
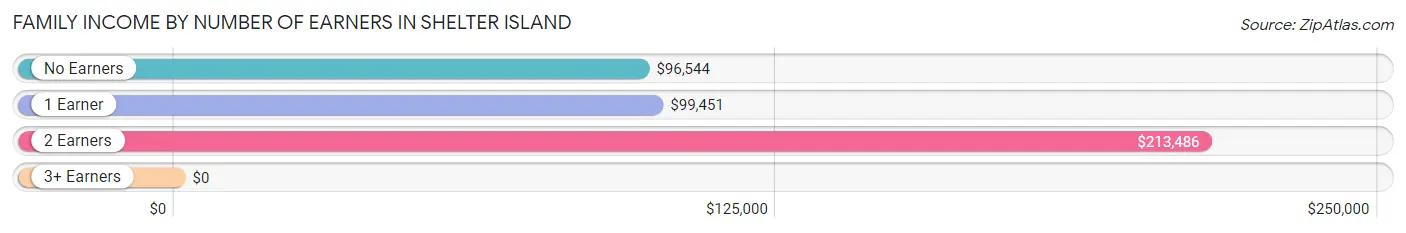
Family Income by Number of Earners in Shelter Island
| Number of Earners | # Families | Median Income |
| No Earners | 177 (26.1%) | $96,544 |
| 1 Earner | 191 (28.2%) | $99,451 |
| 2 Earners | 237 (35.0%) | $213,486 |
| 3+ Earners | 72 (10.6%) | $0 |
| Total | 677 (100.0%) | $122,517 |
Household Income in Shelter Island
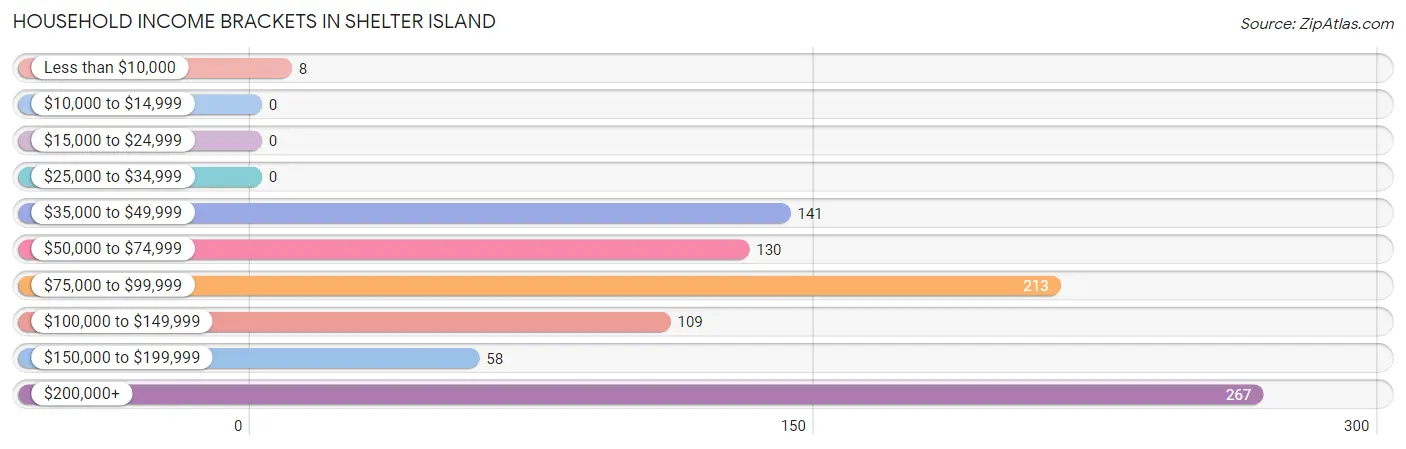
Household Income Brackets in Shelter Island
With 267 households falling in the category, the $200,000+ income range is the most frequent in Shelter Island, accounting for 28.8% of all households.
| Income Bracket | # Households | % Households |
| Less than $10,000 | 8 | 0.9% |
| $10,000 to $14,999 | 0 | 0.0% |
| $15,000 to $24,999 | 0 | 0.0% |
| $25,000 to $34,999 | 0 | 0.0% |
| $35,000 to $49,999 | 141 | 15.2% |
| $50,000 to $74,999 | 130 | 14.0% |
| $75,000 to $99,999 | 213 | 23.0% |
| $100,000 to $149,999 | 109 | 11.8% |
| $150,000 to $199,999 | 58 | 6.3% |
| $200,000+ | 267 | 28.8% |
Household Income by Householder Age in Shelter Island
The median household income in Shelter Island is $98,902, with the highest median household income of $214,278 found in the 25 to 44 years age bracket for the primary householder. A total of 260 households (28.1%) fall into this category. Meanwhile, the 15 to 24 years age bracket for the primary householder has the lowest median household income of $0, with 86 households (9.3%) in this group.
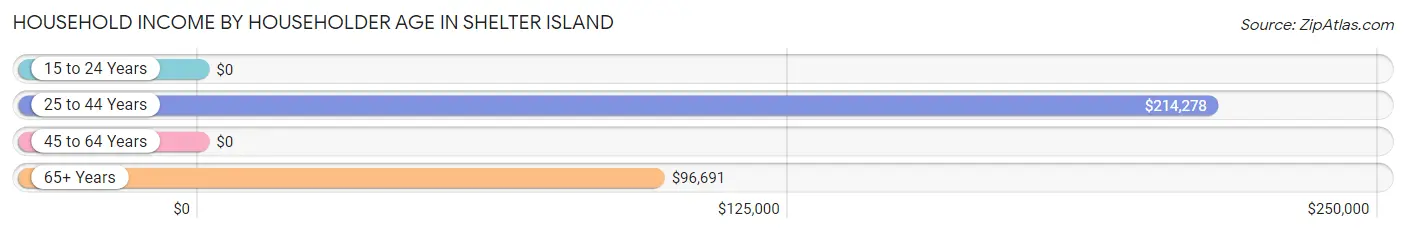
| Income Bracket | # Households | Median Income |
| 15 to 24 Years | 86 (9.3%) | $0 |
| 25 to 44 Years | 260 (28.1%) | $214,278 |
| 45 to 64 Years | 293 (31.6%) | $0 |
| 65+ Years | 287 (31.0%) | $96,691 |
| Total | 926 (100.0%) | $98,902 |
Poverty in Shelter Island
Income Below Poverty by Sex and Age in Shelter Island
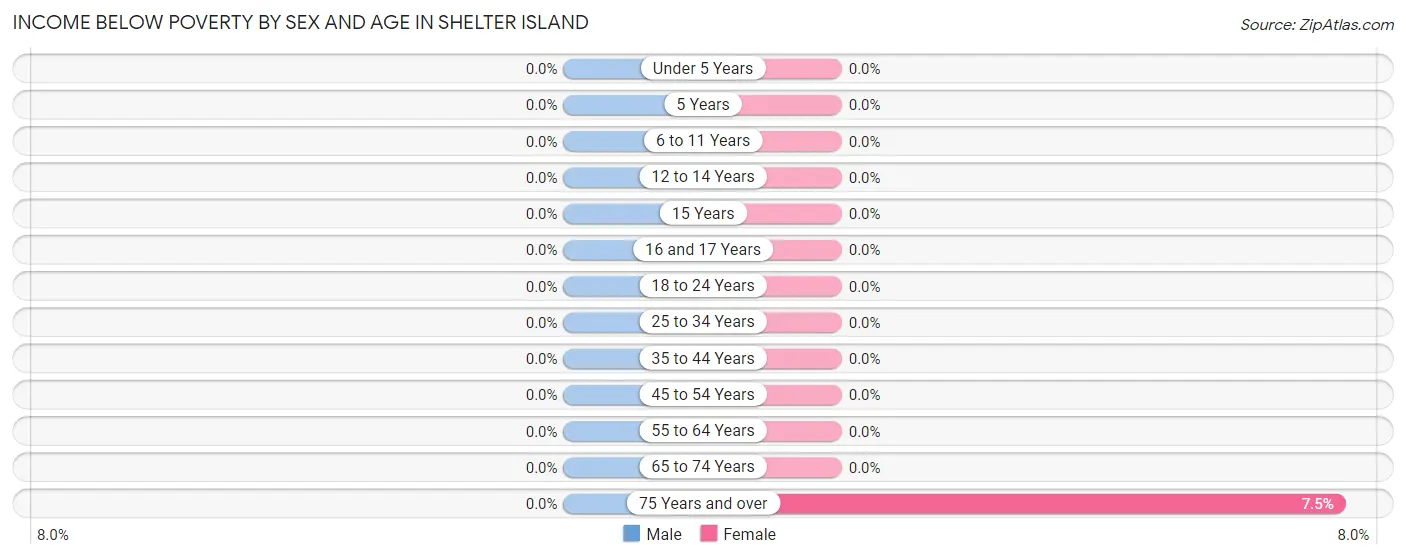
| Age Bracket | Male | Female |
| Under 5 Years | 0 (0.0%) | 0 (0.0%) |
| 5 Years | 0 (0.0%) | 0 (0.0%) |
| 6 to 11 Years | 0 (0.0%) | 0 (0.0%) |
| 12 to 14 Years | 0 (0.0%) | 0 (0.0%) |
| 15 Years | 0 (0.0%) | 0 (0.0%) |
| 16 and 17 Years | 0 (0.0%) | 0 (0.0%) |
| 18 to 24 Years | 0 (0.0%) | 0 (0.0%) |
| 25 to 34 Years | 0 (0.0%) | 0 (0.0%) |
| 35 to 44 Years | 0 (0.0%) | 0 (0.0%) |
| 45 to 54 Years | 0 (0.0%) | 0 (0.0%) |
| 55 to 64 Years | 0 (0.0%) | 0 (0.0%) |
| 65 to 74 Years | 0 (0.0%) | 0 (0.0%) |
| 75 Years and over | 0 (0.0%) | 8 (7.5%) |
| Total | 0 (0.0%) | 8 (0.6%) |
Income Above Poverty by Sex and Age in Shelter Island
According to the poverty statistics in Shelter Island, males aged under 5 years and females aged under 5 years are the age groups that are most secure financially, with 100.0% of males and 100.0% of females in these age groups living above the poverty line.
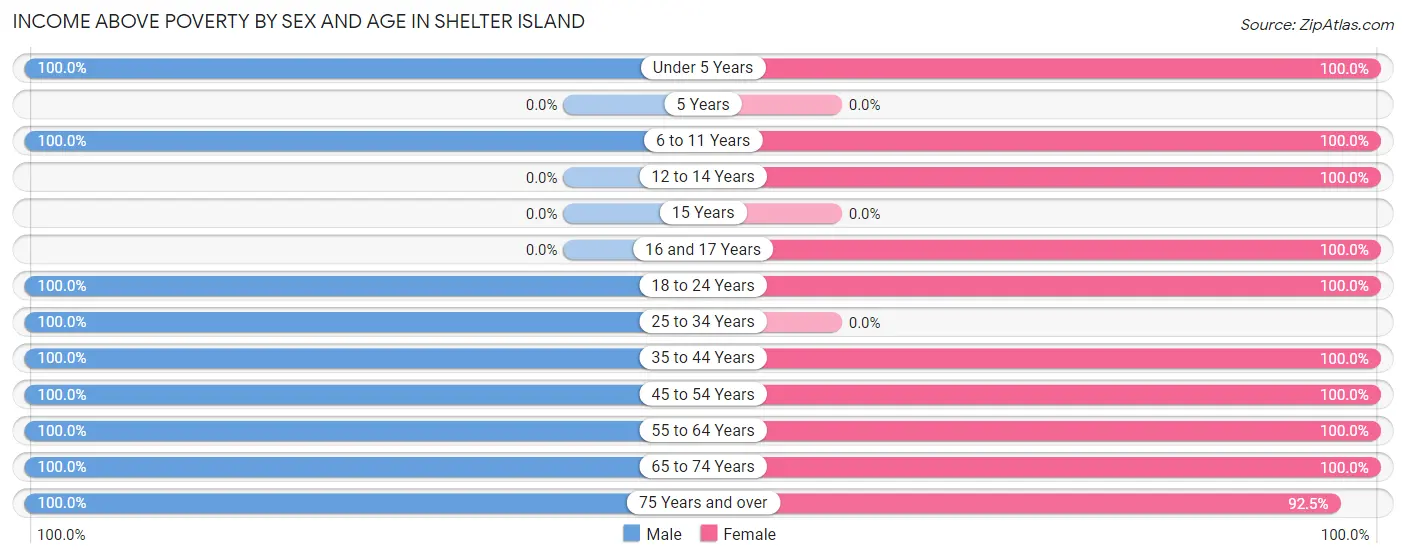
| Age Bracket | Male | Female |
| Under 5 Years | 145 (100.0%) | 234 (100.0%) |
| 5 Years | 0 (0.0%) | 0 (0.0%) |
| 6 to 11 Years | 90 (100.0%) | 97 (100.0%) |
| 12 to 14 Years | 0 (0.0%) | 121 (100.0%) |
| 15 Years | 0 (0.0%) | 0 (0.0%) |
| 16 and 17 Years | 0 (0.0%) | 83 (100.0%) |
| 18 to 24 Years | 270 (100.0%) | 45 (100.0%) |
| 25 to 34 Years | 66 (100.0%) | 0 (0.0%) |
| 35 to 44 Years | 195 (100.0%) | 347 (100.0%) |
| 45 to 54 Years | 126 (100.0%) | 80 (100.0%) |
| 55 to 64 Years | 72 (100.0%) | 58 (100.0%) |
| 65 to 74 Years | 70 (100.0%) | 219 (100.0%) |
| 75 Years and over | 139 (100.0%) | 99 (92.5%) |
| Total | 1,173 (100.0%) | 1,383 (99.4%) |
Income Below Poverty Among Married-Couple Families in Shelter Island
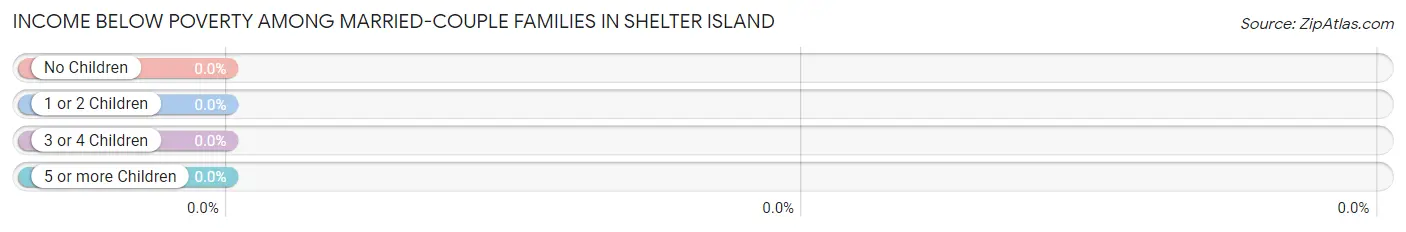
| Children | Above Poverty | Below Poverty |
| No Children | 302 (100.0%) | 0 (0.0%) |
| 1 or 2 Children | 220 (100.0%) | 0 (0.0%) |
| 3 or 4 Children | 83 (100.0%) | 0 (0.0%) |
| 5 or more Children | 0 (0.0%) | 0 (0.0%) |
| Total | 605 (100.0%) | 0 (0.0%) |
Income Below Poverty Among Single-Parent Households in Shelter Island
| Children | Single Father | Single Mother |
| No Children | 0 (0.0%) | 0 (0.0%) |
| 1 or 2 Children | 0 (0.0%) | 0 (0.0%) |
| 3 or 4 Children | 0 (0.0%) | 0 (0.0%) |
| 5 or more Children | 0 (0.0%) | 0 (0.0%) |
| Total | 0 (0.0%) | 0 (0.0%) |
Income Below Poverty Among Married-Couple vs Single-Parent Households in Shelter Island
| Children | Married-Couple Families | Single-Parent Households |
| No Children | 0 (0.0%) | 0 (0.0%) |
| 1 or 2 Children | 0 (0.0%) | 0 (0.0%) |
| 3 or 4 Children | 0 (0.0%) | 0 (0.0%) |
| 5 or more Children | 0 (0.0%) | 0 (0.0%) |
| Total | 0 (0.0%) | 0 (0.0%) |
Race in Shelter Island
The most populous races in Shelter Island are White / Caucasian (1,593 | 62.1%), Hispanic or Latino (505 | 19.7%), and Native / Alaskan (505 | 19.7%).
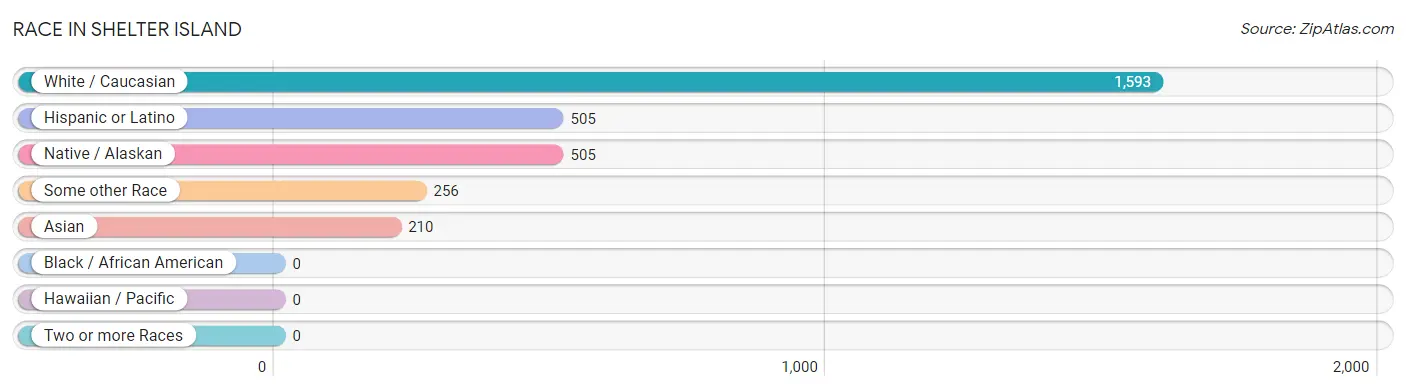
| Race | # Population | % Population |
| Asian | 210 | 8.2% |
| Black / African American | 0 | 0.0% |
| Hawaiian / Pacific | 0 | 0.0% |
| Hispanic or Latino | 505 | 19.7% |
| Native / Alaskan | 505 | 19.7% |
| White / Caucasian | 1,593 | 62.1% |
| Two or more Races | 0 | 0.0% |
| Some other Race | 256 | 10.0% |
| Total | 2,564 | 100.0% |
Ancestry in Shelter Island
The most populous ancestries reported in Shelter Island are Mexican (505 | 19.7%), Mexican American Indian (505 | 19.7%), Italian (476 | 18.6%), Irish (468 | 18.2%), and European (307 | 12.0%), together accounting for 88.2% of all Shelter Island residents.
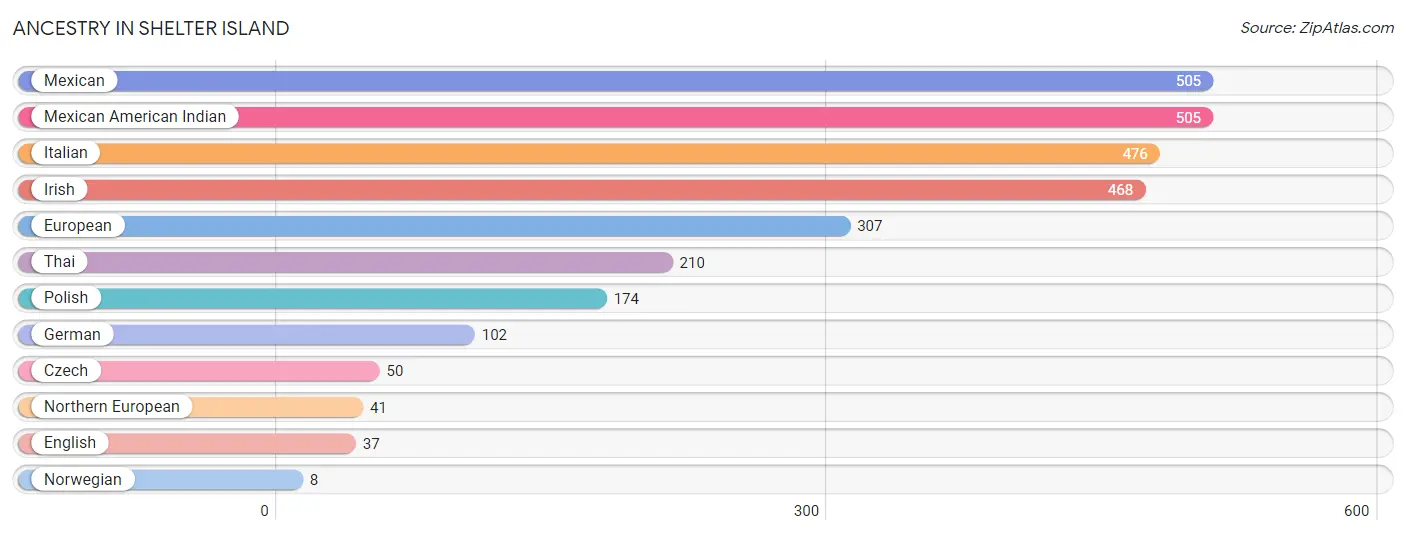
| Ancestry | # Population | % Population |
| Czech | 50 | 1.9% |
| English | 37 | 1.4% |
| European | 307 | 12.0% |
| German | 102 | 4.0% |
| Irish | 468 | 18.2% |
| Italian | 476 | 18.6% |
| Mexican | 505 | 19.7% |
| Mexican American Indian | 505 | 19.7% |
| Northern European | 41 | 1.6% |
| Norwegian | 8 | 0.3% |
| Polish | 174 | 6.8% |
| Thai | 210 | 8.2% | View All 12 Rows |
Immigrants in Shelter Island
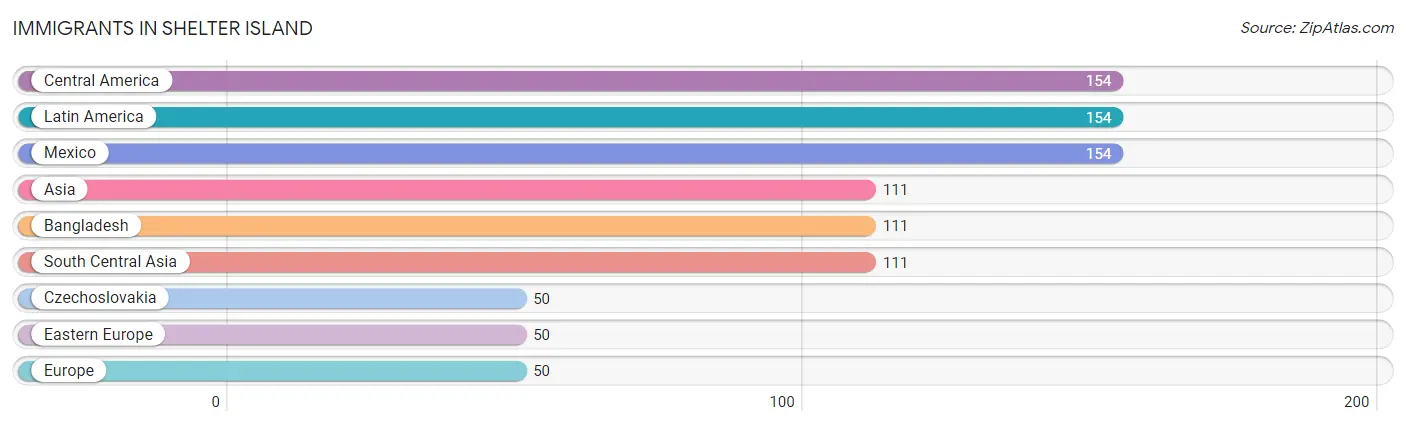
The most numerous immigrant groups reported in Shelter Island came from Central America (154 | 6.0%), Latin America (154 | 6.0%), Mexico (154 | 6.0%), Asia (111 | 4.3%), and Bangladesh (111 | 4.3%), together accounting for 26.7% of all Shelter Island residents.
| Immigration Origin | # Population | % Population |
| Asia | 111 | 4.3% |
| Bangladesh | 111 | 4.3% |
| Central America | 154 | 6.0% |
| Czechoslovakia | 50 | 1.9% |
| Eastern Europe | 50 | 1.9% |
| Europe | 50 | 1.9% |
| Latin America | 154 | 6.0% |
| Mexico | 154 | 6.0% |
| South Central Asia | 111 | 4.3% | View All 9 Rows |
Sex and Age in Shelter Island
Sex and Age in Shelter Island
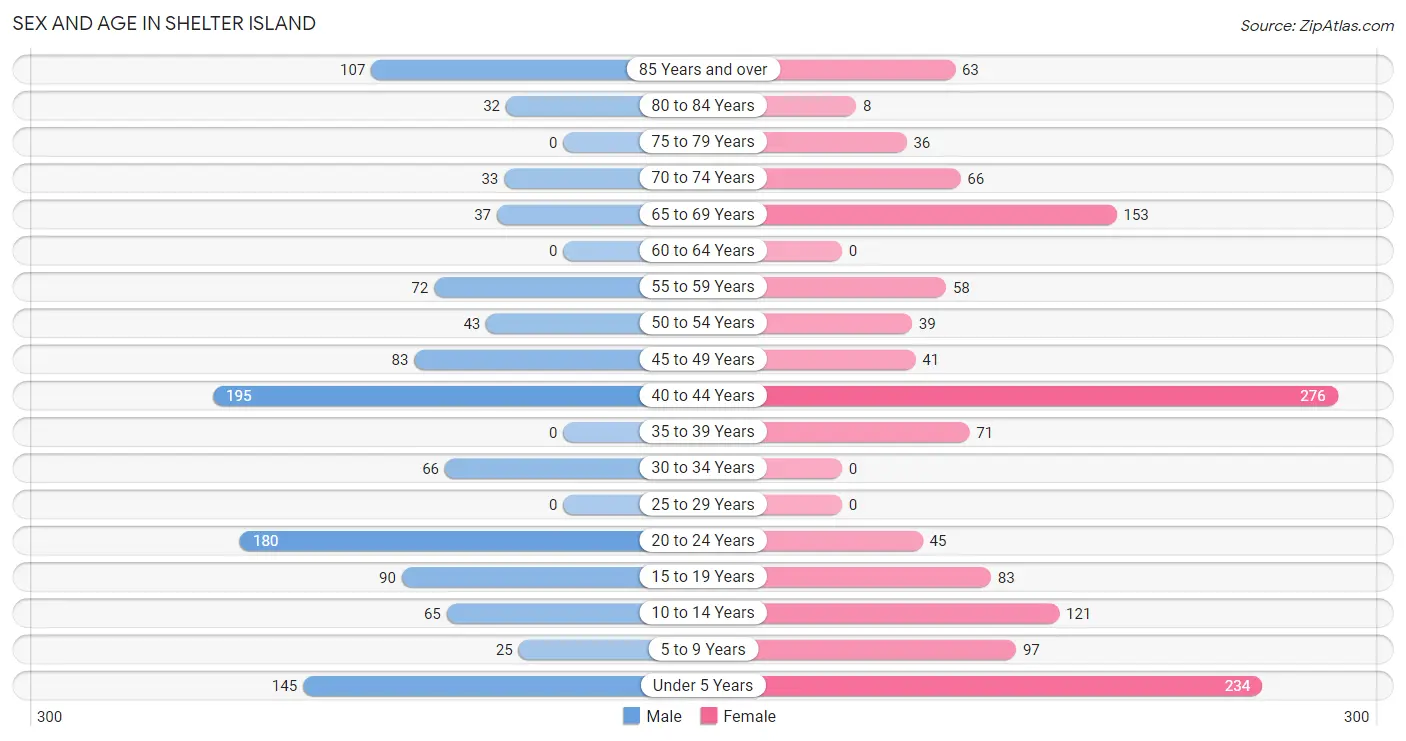
The most populous age groups in Shelter Island are 40 to 44 Years (195 | 16.6%) for men and 40 to 44 Years (276 | 19.8%) for women.
| Age Bracket | Male | Female |
| Under 5 Years | 145 (12.4%) | 234 (16.8%) |
| 5 to 9 Years | 25 (2.1%) | 97 (7.0%) |
| 10 to 14 Years | 65 (5.5%) | 121 (8.7%) |
| 15 to 19 Years | 90 (7.7%) | 83 (6.0%) |
| 20 to 24 Years | 180 (15.3%) | 45 (3.2%) |
| 25 to 29 Years | 0 (0.0%) | 0 (0.0%) |
| 30 to 34 Years | 66 (5.6%) | 0 (0.0%) |
| 35 to 39 Years | 0 (0.0%) | 71 (5.1%) |
| 40 to 44 Years | 195 (16.6%) | 276 (19.8%) |
| 45 to 49 Years | 83 (7.1%) | 41 (2.9%) |
| 50 to 54 Years | 43 (3.7%) | 39 (2.8%) |
| 55 to 59 Years | 72 (6.1%) | 58 (4.2%) |
| 60 to 64 Years | 0 (0.0%) | 0 (0.0%) |
| 65 to 69 Years | 37 (3.2%) | 153 (11.0%) |
| 70 to 74 Years | 33 (2.8%) | 66 (4.7%) |
| 75 to 79 Years | 0 (0.0%) | 36 (2.6%) |
| 80 to 84 Years | 32 (2.7%) | 8 (0.6%) |
| 85 Years and over | 107 (9.1%) | 63 (4.5%) |
| Total | 1,173 (100.0%) | 1,391 (100.0%) |
Families and Households in Shelter Island
Median Family Size in Shelter Island
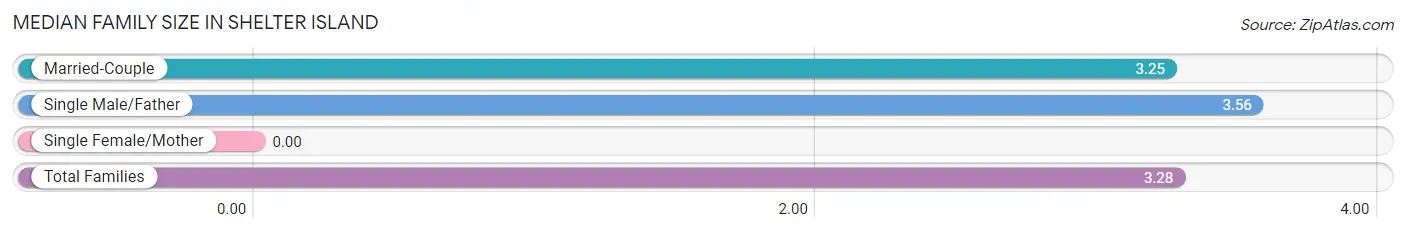
| Family Type | # Families | Family Size |
| Married-Couple | 605 (89.4%) | 3.25 |
| Single Male/Father | 72 (10.6%) | 3.56 |
| Single Female/Mother | 0 (0.0%) | - |
| Total Families | 677 (100.0%) | 3.28 |
Median Household Size in Shelter Island
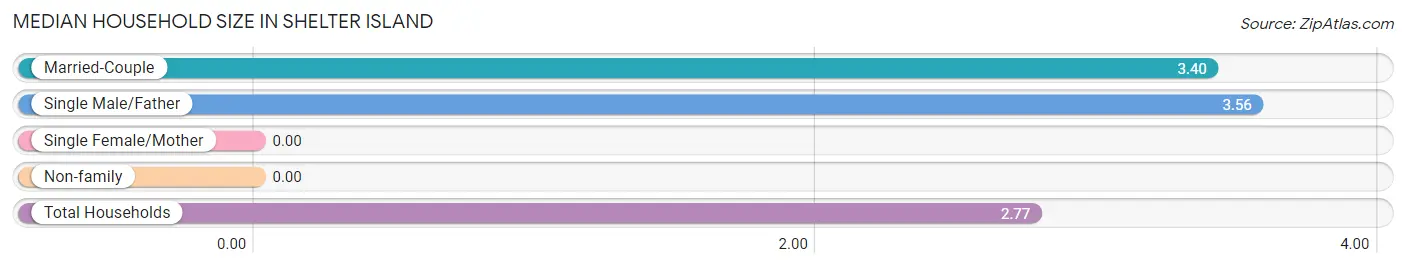
| Household Type | # Households | Household Size |
| Married-Couple | 605 (65.3%) | 3.40 |
| Single Male/Father | 72 (7.8%) | 3.56 |
| Single Female/Mother | 0 (0.0%) | - |
| Non-family | 249 (26.9%) | - |
| Total Households | 926 (100.0%) | 2.77 |
Household Size by Marriage Status in Shelter Island
Out of a total of 926 households in Shelter Island, 677 (73.1%) are family households, while 249 (26.9%) are nonfamily households. The most numerous type of family households are 4-person households, comprising 301, and the most common type of nonfamily households are 1-person households, comprising 249.
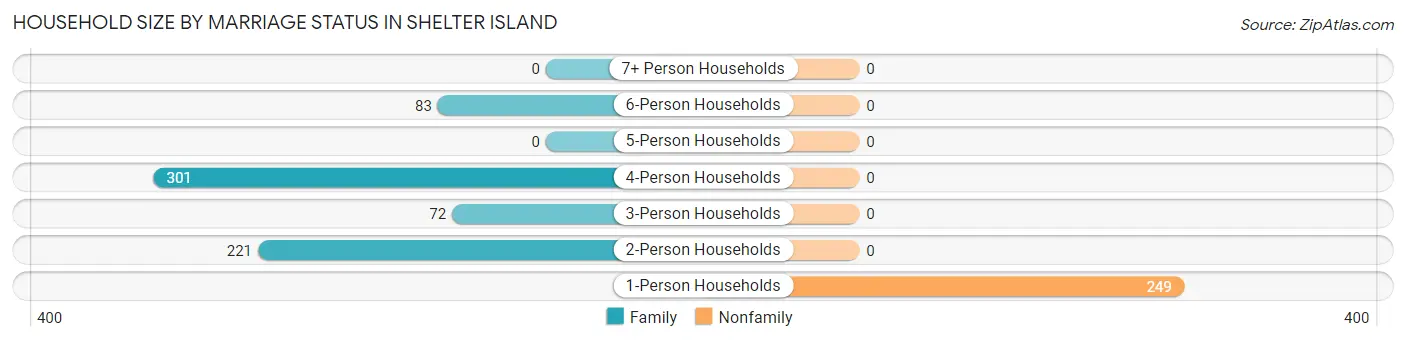
| Household Size | Family Households | Nonfamily Households |
| 1-Person Households | - | 249 (26.9%) |
| 2-Person Households | 221 (23.9%) | 0 (0.0%) |
| 3-Person Households | 72 (7.8%) | 0 (0.0%) |
| 4-Person Households | 301 (32.5%) | 0 (0.0%) |
| 5-Person Households | 0 (0.0%) | 0 (0.0%) |
| 6-Person Households | 83 (9.0%) | 0 (0.0%) |
| 7+ Person Households | 0 (0.0%) | 0 (0.0%) |
| Total | 677 (73.1%) | 249 (26.9%) |
Female Fertility in Shelter Island
Fertility by Age in Shelter Island
Average fertility rate in Shelter Island is 87.0 births per 1,000 women. Women in the age bracket of 20 to 34 years have the highest fertility rate with 1,000.0 births per 1,000 women. Women in the age bracket of 20 to 34 years acount for 100.0% of all women with births.
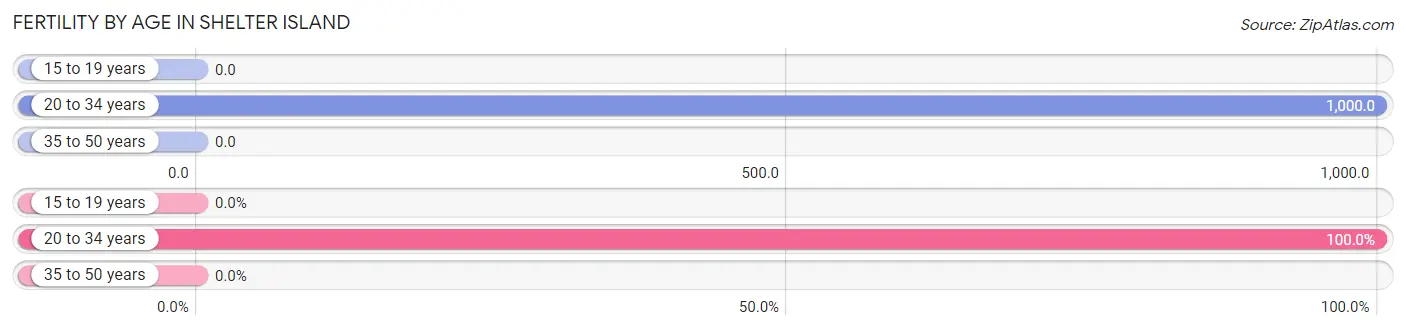
| Age Bracket | Women with Births | Births / 1,000 Women |
| 15 to 19 years | 0 (0.0%) | 0.0 |
| 20 to 34 years | 45 (100.0%) | 1,000.0 |
| 35 to 50 years | 0 (0.0%) | 0.0 |
| Total | 45 (100.0%) | 87.0 |
Fertility by Age by Marriage Status in Shelter Island
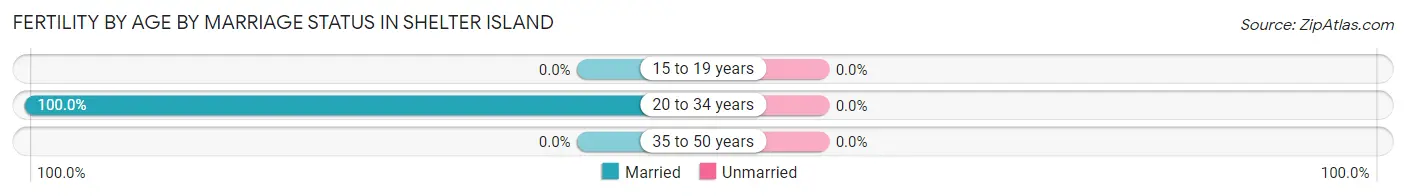
| Age Bracket | Married | Unmarried |
| 15 to 19 years | 0 (0.0%) | 0 (0.0%) |
| 20 to 34 years | 45 (100.0%) | 0 (0.0%) |
| 35 to 50 years | 0 (0.0%) | 0 (0.0%) |
| Total | 45 (100.0%) | 0 (0.0%) |
Fertility by Education in Shelter Island
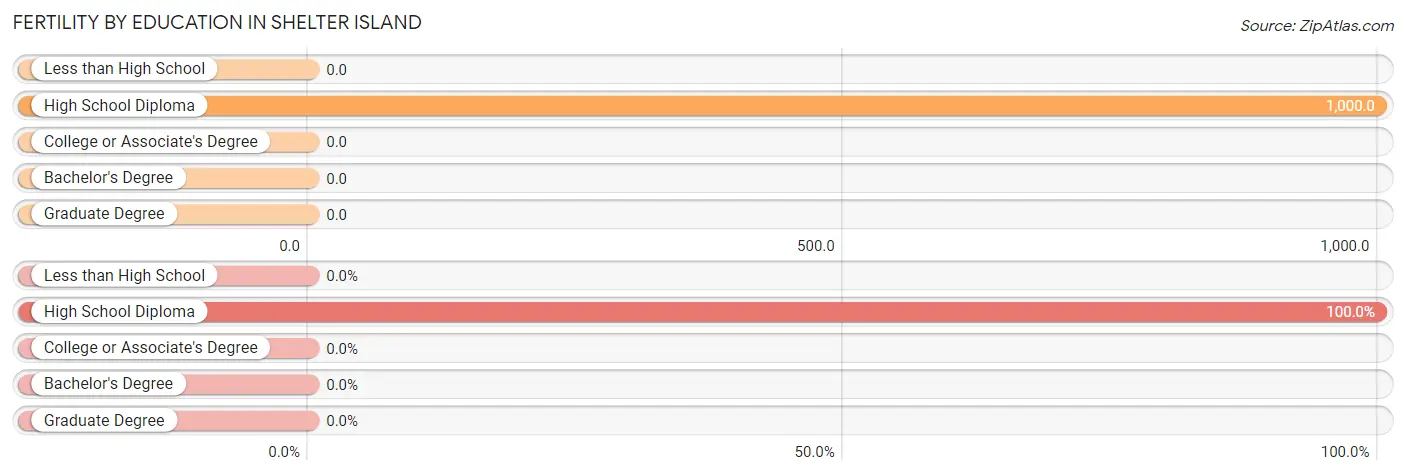
| Educational Attainment | Women with Births | Births / 1,000 Women |
| Less than High School | 0 (0.0%) | 0.0 |
| High School Diploma | 45 (100.0%) | 1,000.0 |
| College or Associate's Degree | 0 (0.0%) | 0.0 |
| Bachelor's Degree | 0 (0.0%) | 0.0 |
| Graduate Degree | 0 (0.0%) | 0.0 |
| Total | 45 (100.0%) | 87.0 |
Fertility by Education by Marriage Status in Shelter Island
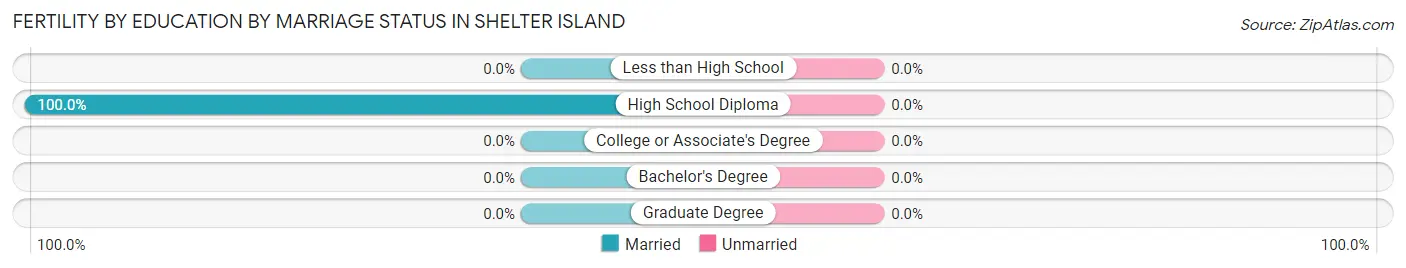
| Educational Attainment | Married | Unmarried |
| Less than High School | 0 (0.0%) | 0 (0.0%) |
| High School Diploma | 45 (100.0%) | 0 (0.0%) |
| College or Associate's Degree | 0 (0.0%) | 0 (0.0%) |
| Bachelor's Degree | 0 (0.0%) | 0 (0.0%) |
| Graduate Degree | 0 (0.0%) | 0 (0.0%) |
| Total | 45 (100.0%) | 0 (0.0%) |
Employment Characteristics in Shelter Island
Employment by Class of Employer in Shelter Island
Among the 1,171 employed individuals in Shelter Island, private company employees (741 | 63.3%), self-employed (not incorporated) (164 | 14.0%), and state government employees (135 | 11.5%) make up the most common classes of employment.
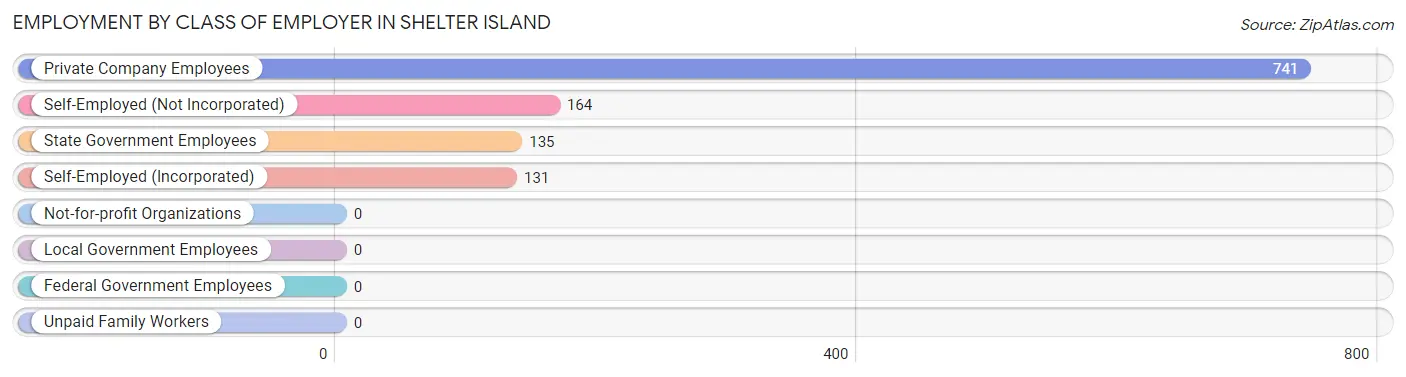
| Employer Class | # Employees | % Employees |
| Private Company Employees | 741 | 63.3% |
| Self-Employed (Incorporated) | 131 | 11.2% |
| Self-Employed (Not Incorporated) | 164 | 14.0% |
| Not-for-profit Organizations | 0 | 0.0% |
| Local Government Employees | 0 | 0.0% |
| State Government Employees | 135 | 11.5% |
| Federal Government Employees | 0 | 0.0% |
| Unpaid Family Workers | 0 | 0.0% |
| Total | 1,171 | 100.0% |
Employment Status by Age in Shelter Island
According to the labor force statistics for Shelter Island, out of the total population over 16 years of age (1,877), 66.2% or 1,243 individuals are in the labor force, with 5.7% or 71 of them unemployed. The age group with the highest labor force participation rate is 30 to 34 years, with 100.0% or 66 individuals in the labor force. Within the labor force, the 35 to 44 years age range has the highest percentage of unemployed individuals, with 15.2% or 71 of them being unemployed.
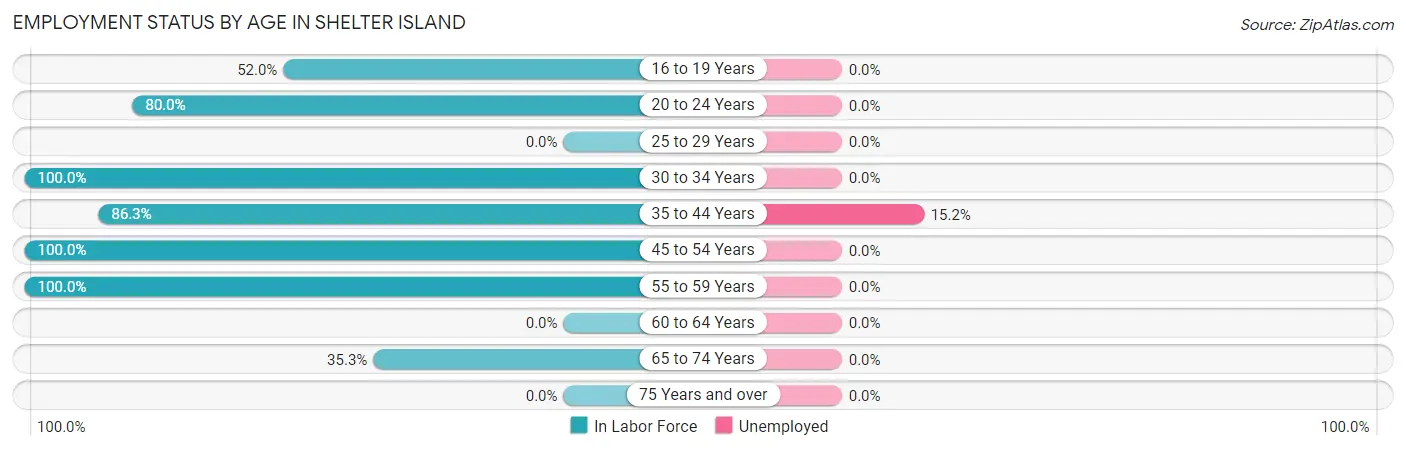
| Age Bracket | In Labor Force | Unemployed |
| 16 to 19 Years | 90 (52.0%) | 0 (0.0%) |
| 20 to 24 Years | 180 (80.0%) | 0 (0.0%) |
| 25 to 29 Years | 0 (0.0%) | 0 (0.0%) |
| 30 to 34 Years | 66 (100.0%) | 0 (0.0%) |
| 35 to 44 Years | 468 (86.3%) | 71 (15.2%) |
| 45 to 54 Years | 206 (100.0%) | 0 (0.0%) |
| 55 to 59 Years | 130 (100.0%) | 0 (0.0%) |
| 60 to 64 Years | 0 (0.0%) | 0 (0.0%) |
| 65 to 74 Years | 102 (35.3%) | 0 (0.0%) |
| 75 Years and over | 0 (0.0%) | 0 (0.0%) |
| Total | 1,243 (66.2%) | 71 (5.7%) |
Employment Status by Educational Attainment in Shelter Island
According to labor force statistics for Shelter Island, 92.2% of individuals (870) out of the total population between 25 and 64 years of age (944) are in the labor force, with 8.2% or 71 of them being unemployed. The group with the highest labor force participation rate are those with the educational attainment of less than high school, with 100.0% or 154 individuals in the labor force. Within the labor force, individuals with less than high school education have the highest percentage of unemployment, with 46.1% or 71 of them being unemployed.
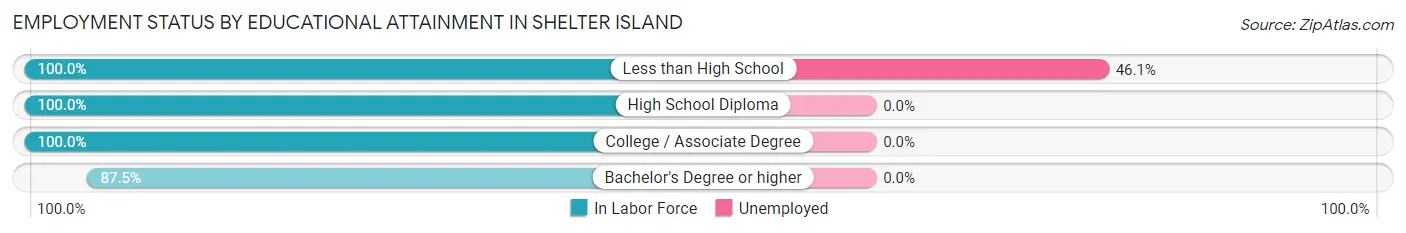
| Educational Attainment | In Labor Force | Unemployed |
| Less than High School | 154 (100.0%) | 71 (46.1%) |
| High School Diploma | 72 (100.0%) | 0 (0.0%) |
| College / Associate Degree | 124 (100.0%) | 0 (0.0%) |
| Bachelor's Degree or higher | 520 (87.5%) | 0 (0.0%) |
| Total | 870 (92.2%) | 77 (8.2%) |
Employment Occupations by Sex in Shelter Island
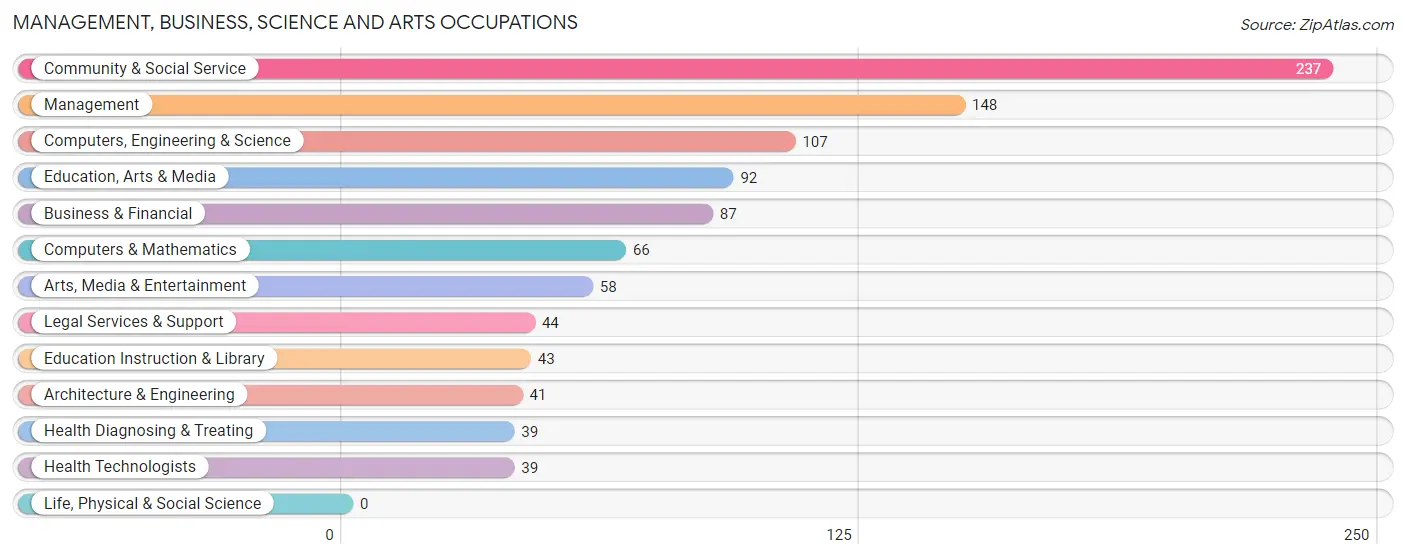
Management, Business, Science and Arts Occupations
The most common Management, Business, Science and Arts occupations in Shelter Island are Community & Social Service (237 | 20.2%), Management (148 | 12.6%), Computers, Engineering & Science (107 | 9.1%), Education, Arts & Media (92 | 7.9%), and Business & Financial (87 | 7.4%).
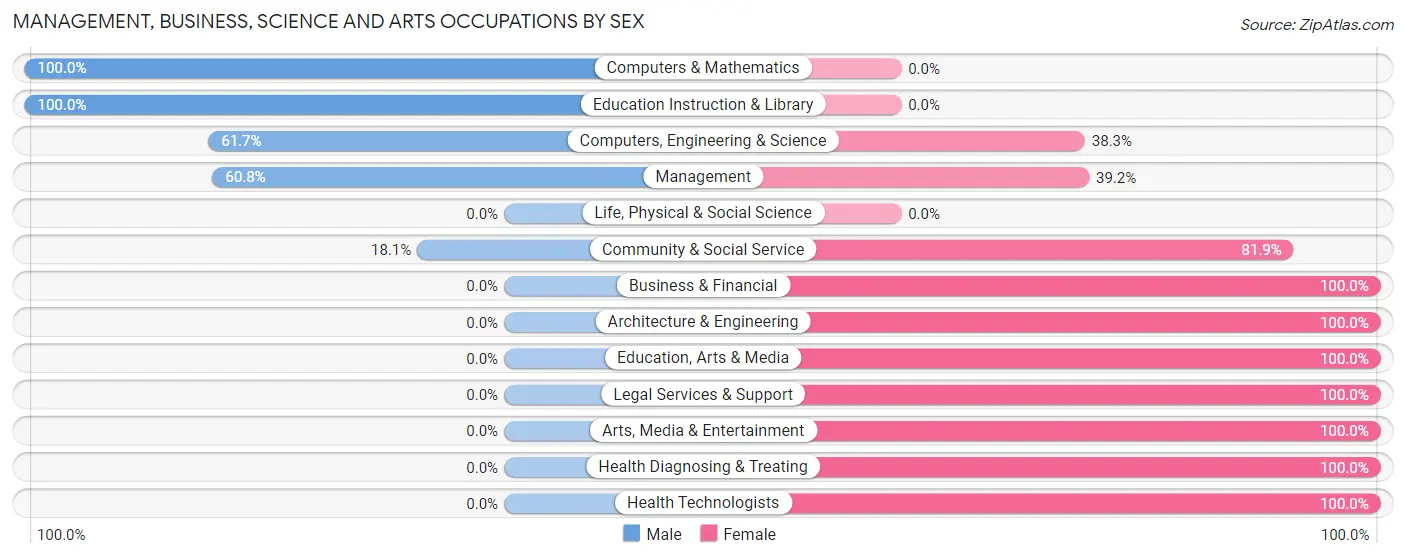
Management, Business, Science and Arts Occupations by Sex
Within the Management, Business, Science and Arts occupations in Shelter Island, the most male-oriented occupations are Computers & Mathematics (100.0%), Education Instruction & Library (100.0%), and Computers, Engineering & Science (61.7%), while the most female-oriented occupations are Business & Financial (100.0%), Architecture & Engineering (100.0%), and Education, Arts & Media (100.0%).
| Occupation | Male | Female |
| Management | 90 (60.8%) | 58 (39.2%) |
| Business & Financial | 0 (0.0%) | 87 (100.0%) |
| Computers, Engineering & Science | 66 (61.7%) | 41 (38.3%) |
| Computers & Mathematics | 66 (100.0%) | 0 (0.0%) |
| Architecture & Engineering | 0 (0.0%) | 41 (100.0%) |
| Life, Physical & Social Science | 0 (0.0%) | 0 (0.0%) |
| Community & Social Service | 43 (18.1%) | 194 (81.9%) |
| Education, Arts & Media | 0 (0.0%) | 92 (100.0%) |
| Legal Services & Support | 0 (0.0%) | 44 (100.0%) |
| Education Instruction & Library | 43 (100.0%) | 0 (0.0%) |
| Arts, Media & Entertainment | 0 (0.0%) | 58 (100.0%) |
| Health Diagnosing & Treating | 0 (0.0%) | 39 (100.0%) |
| Health Technologists | 0 (0.0%) | 39 (100.0%) |
| Total (Category) | 199 (32.2%) | 419 (67.8%) |
| Total (Overall) | 729 (62.3%) | 442 (37.8%) |
Services Occupations
Services Occupations by Sex
| Occupation | Male | Female |
| Healthcare Support | 0 (0.0%) | 0 (0.0%) |
| Security & Protection | 0 (0.0%) | 0 (0.0%) |
| Firefighting & Prevention | 0 (0.0%) | 0 (0.0%) |
| Law Enforcement | 0 (0.0%) | 0 (0.0%) |
| Food Preparation & Serving | 0 (0.0%) | 0 (0.0%) |
| Cleaning & Maintenance | 0 (0.0%) | 0 (0.0%) |
| Personal Care & Service | 0 (0.0%) | 0 (0.0%) |
| Total (Category) | 0 (0.0%) | 0 (0.0%) |
| Total (Overall) | 729 (62.3%) | 442 (37.8%) |
Sales and Office Occupations
The most common Sales and Office occupations in Shelter Island are Office & Administration (81 | 6.9%), and Sales & Related (23 | 2.0%).
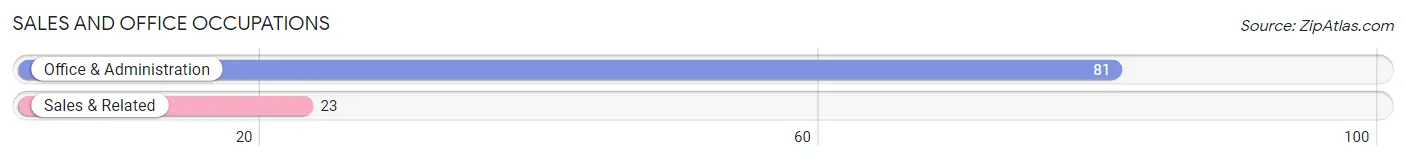
Sales and Office Occupations by Sex
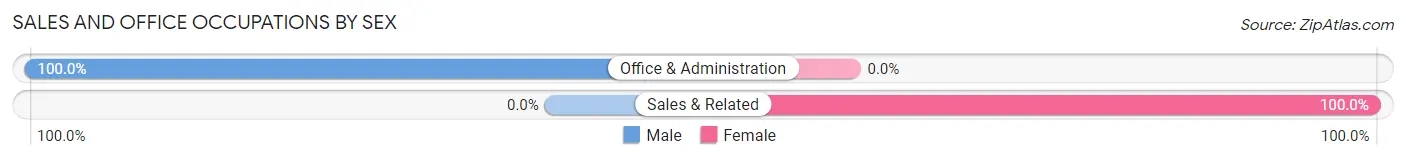
| Occupation | Male | Female |
| Sales & Related | 0 (0.0%) | 23 (100.0%) |
| Office & Administration | 81 (100.0%) | 0 (0.0%) |
| Total (Category) | 81 (77.9%) | 23 (22.1%) |
| Total (Overall) | 729 (62.3%) | 442 (37.8%) |
Natural Resources, Construction and Maintenance Occupations
The most common Natural Resources, Construction and Maintenance occupations in Shelter Island are , and Construction & Extraction (83 | 7.1%).
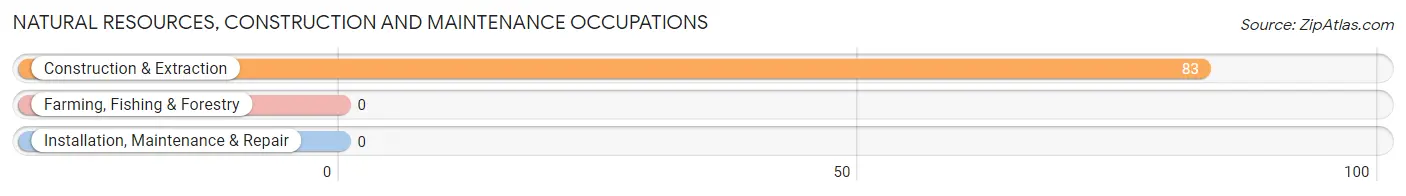
Natural Resources, Construction and Maintenance Occupations by Sex
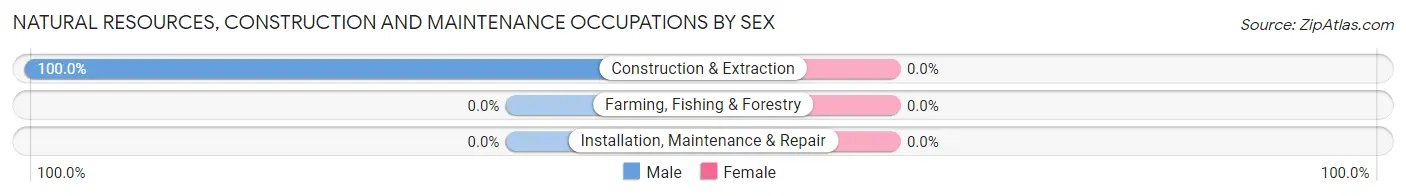
| Occupation | Male | Female |
| Farming, Fishing & Forestry | 0 (0.0%) | 0 (0.0%) |
| Construction & Extraction | 83 (100.0%) | 0 (0.0%) |
| Installation, Maintenance & Repair | 0 (0.0%) | 0 (0.0%) |
| Total (Category) | 83 (100.0%) | 0 (0.0%) |
| Total (Overall) | 729 (62.3%) | 442 (37.8%) |
Production, Transportation and Moving Occupations
The most common Production, Transportation and Moving occupations in Shelter Island are Transportation (280 | 23.9%), and Material Moving (86 | 7.3%).
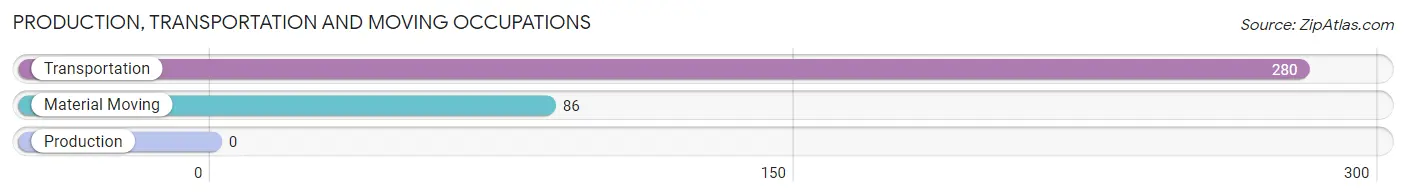
Production, Transportation and Moving Occupations by Sex
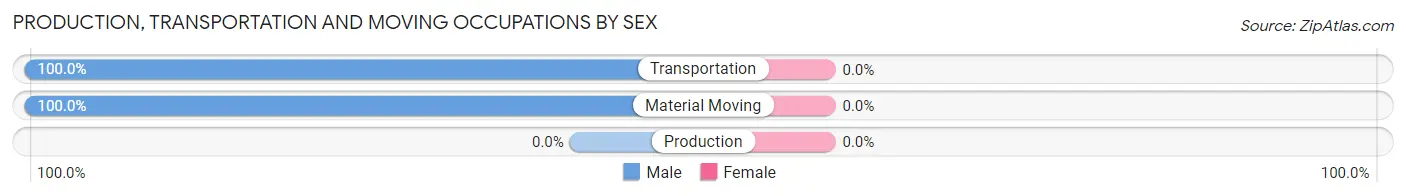
| Occupation | Male | Female |
| Production | 0 (0.0%) | 0 (0.0%) |
| Transportation | 280 (100.0%) | 0 (0.0%) |
| Material Moving | 86 (100.0%) | 0 (0.0%) |
| Total (Category) | 366 (100.0%) | 0 (0.0%) |
| Total (Overall) | 729 (62.3%) | 442 (37.8%) |
Employment Industries by Sex in Shelter Island
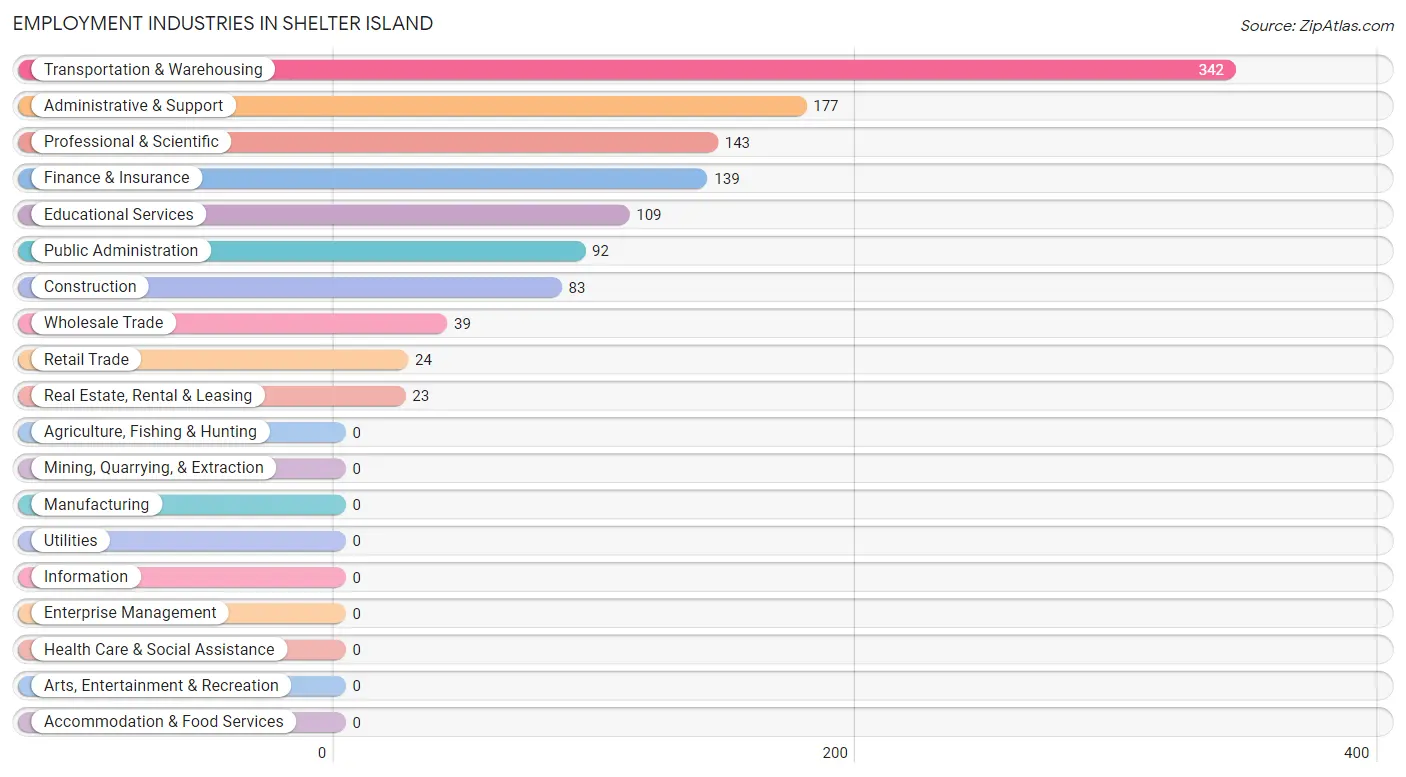
Employment Industries in Shelter Island
The major employment industries in Shelter Island include Transportation & Warehousing (342 | 29.2%), Administrative & Support (177 | 15.1%), Professional & Scientific (143 | 12.2%), Finance & Insurance (139 | 11.9%), and Educational Services (109 | 9.3%).
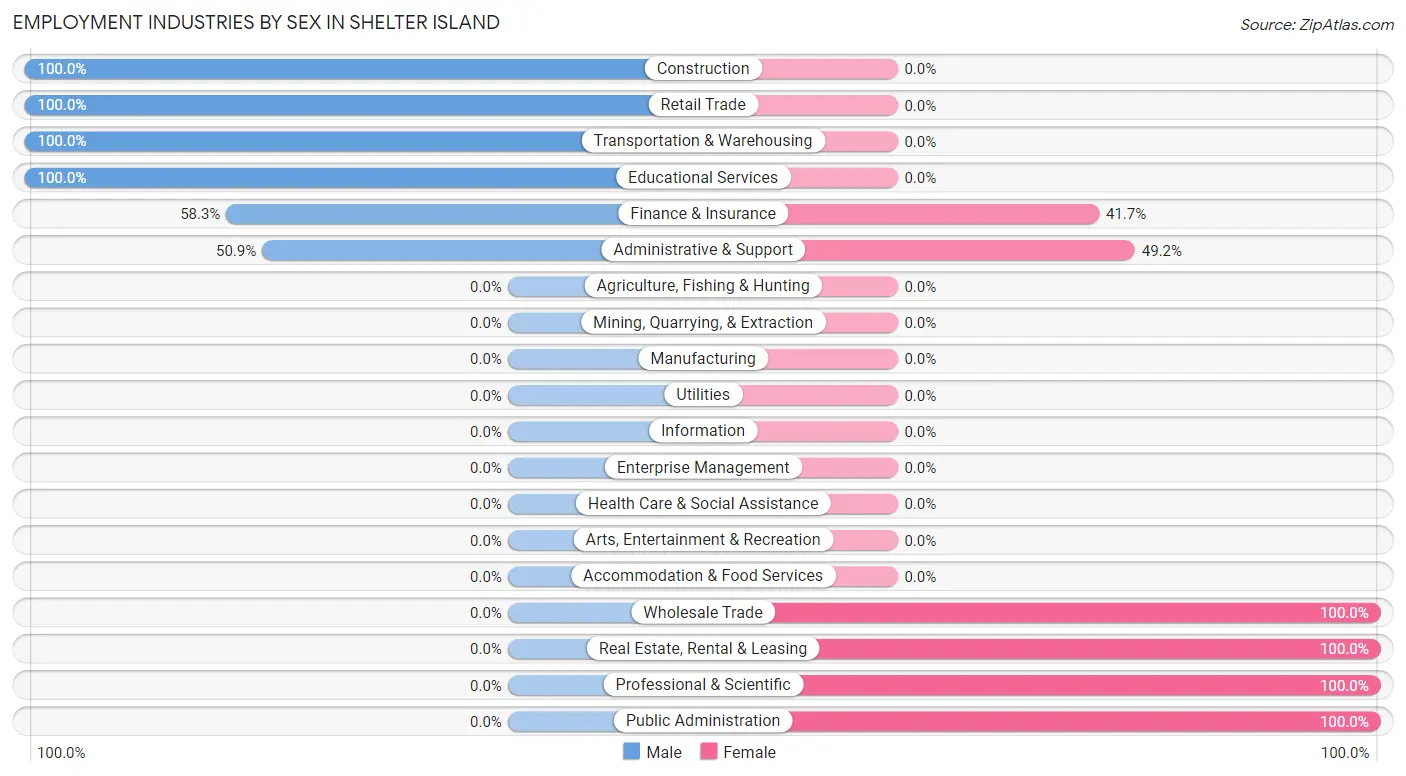
Employment Industries by Sex in Shelter Island
The Shelter Island industries that see more men than women are Construction (100.0%), Retail Trade (100.0%), and Transportation & Warehousing (100.0%), whereas the industries that tend to have a higher number of women are Wholesale Trade (100.0%), Real Estate, Rental & Leasing (100.0%), and Professional & Scientific (100.0%).
| Industry | Male | Female |
| Agriculture, Fishing & Hunting | 0 (0.0%) | 0 (0.0%) |
| Mining, Quarrying, & Extraction | 0 (0.0%) | 0 (0.0%) |
| Construction | 83 (100.0%) | 0 (0.0%) |
| Manufacturing | 0 (0.0%) | 0 (0.0%) |
| Wholesale Trade | 0 (0.0%) | 39 (100.0%) |
| Retail Trade | 24 (100.0%) | 0 (0.0%) |
| Transportation & Warehousing | 342 (100.0%) | 0 (0.0%) |
| Utilities | 0 (0.0%) | 0 (0.0%) |
| Information | 0 (0.0%) | 0 (0.0%) |
| Finance & Insurance | 81 (58.3%) | 58 (41.7%) |
| Real Estate, Rental & Leasing | 0 (0.0%) | 23 (100.0%) |
| Professional & Scientific | 0 (0.0%) | 143 (100.0%) |
| Enterprise Management | 0 (0.0%) | 0 (0.0%) |
| Administrative & Support | 90 (50.8%) | 87 (49.1%) |
| Educational Services | 109 (100.0%) | 0 (0.0%) |
| Health Care & Social Assistance | 0 (0.0%) | 0 (0.0%) |
| Arts, Entertainment & Recreation | 0 (0.0%) | 0 (0.0%) |
| Accommodation & Food Services | 0 (0.0%) | 0 (0.0%) |
| Public Administration | 0 (0.0%) | 92 (100.0%) |
| Total | 729 (62.3%) | 442 (37.8%) |
Education in Shelter Island
School Enrollment in Shelter Island
The most common levels of schooling among the 643 students in Shelter Island are middle school (186 | 28.9%), elementary school (122 | 19.0%), and kindergarten (95 | 14.8%).
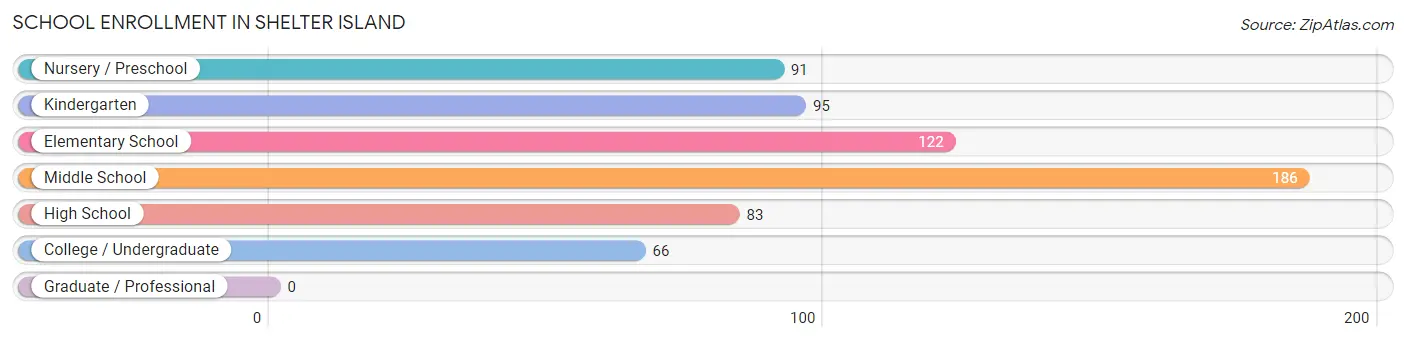
| School Level | # Students | % Students |
| Nursery / Preschool | 91 | 14.1% |
| Kindergarten | 95 | 14.8% |
| Elementary School | 122 | 19.0% |
| Middle School | 186 | 28.9% |
| High School | 83 | 12.9% |
| College / Undergraduate | 66 | 10.3% |
| Graduate / Professional | 0 | 0.0% |
| Total | 643 | 100.0% |
School Enrollment by Age by Funding Source in Shelter Island
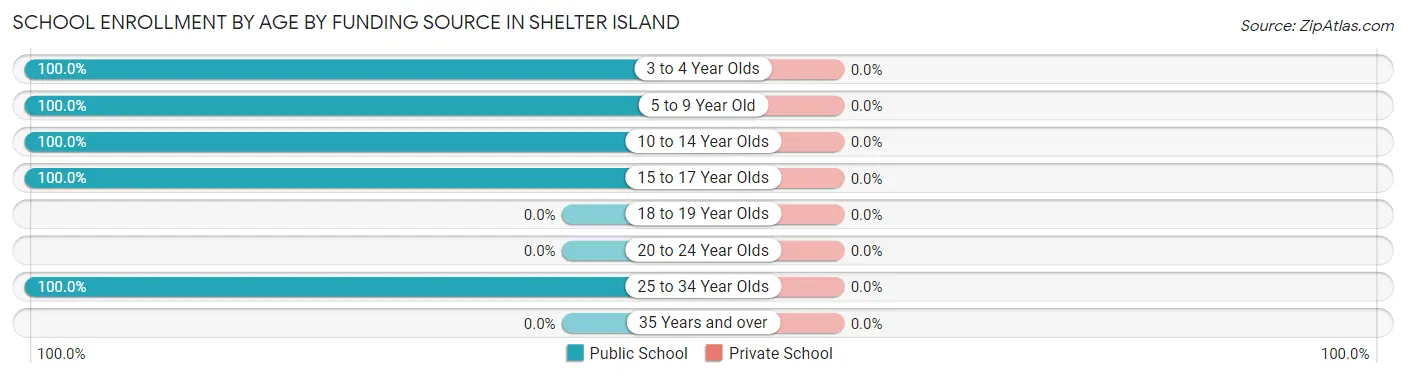
| Age Bracket | Public School | Private School |
| 3 to 4 Year Olds | 186 (100.0%) | 0 (0.0%) |
| 5 to 9 Year Old | 122 (100.0%) | 0 (0.0%) |
| 10 to 14 Year Olds | 186 (100.0%) | 0 (0.0%) |
| 15 to 17 Year Olds | 83 (100.0%) | 0 (0.0%) |
| 18 to 19 Year Olds | 0 (0.0%) | 0 (0.0%) |
| 20 to 24 Year Olds | 0 (0.0%) | 0 (0.0%) |
| 25 to 34 Year Olds | 66 (100.0%) | 0 (0.0%) |
| 35 Years and over | 0 (0.0%) | 0 (0.0%) |
| Total | 643 (100.0%) | 0 (0.0%) |
Educational Attainment by Field of Study in Shelter Island
Business (211 | 22.2%), social sciences (195 | 20.5%), liberal arts & history (122 | 12.8%), education (100 | 10.5%), and science & technology (85 | 8.9%) are the most common fields of study among 950 individuals in Shelter Island who have obtained a bachelor's degree or higher.
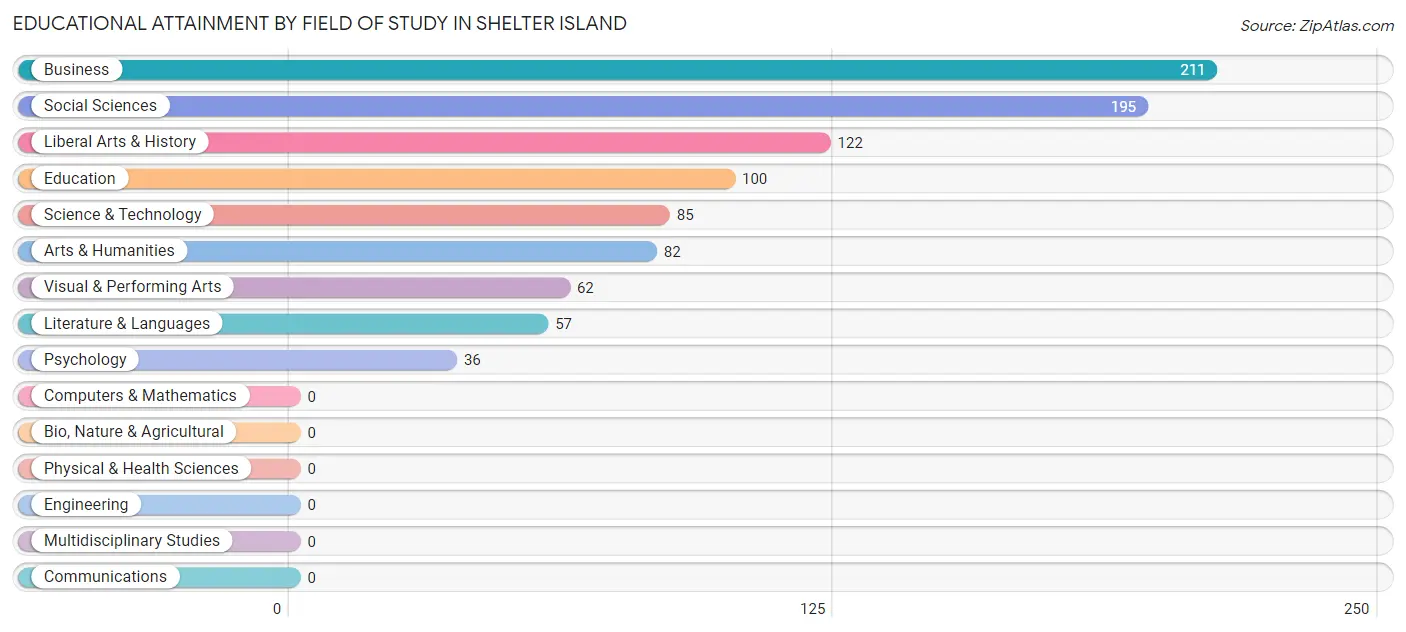
| Field of Study | # Graduates | % Graduates |
| Computers & Mathematics | 0 | 0.0% |
| Bio, Nature & Agricultural | 0 | 0.0% |
| Physical & Health Sciences | 0 | 0.0% |
| Psychology | 36 | 3.8% |
| Social Sciences | 195 | 20.5% |
| Engineering | 0 | 0.0% |
| Multidisciplinary Studies | 0 | 0.0% |
| Science & Technology | 85 | 8.9% |
| Business | 211 | 22.2% |
| Education | 100 | 10.5% |
| Literature & Languages | 57 | 6.0% |
| Liberal Arts & History | 122 | 12.8% |
| Visual & Performing Arts | 62 | 6.5% |
| Communications | 0 | 0.0% |
| Arts & Humanities | 82 | 8.6% |
| Total | 950 | 100.0% |
Transportation & Commute in Shelter Island
Vehicle Availability by Sex in Shelter Island
The most prevalent vehicle ownership categories in Shelter Island are males with 2 vehicles (280, accounting for 38.4%) and females with 2 vehicles (120, making up 63.3%).
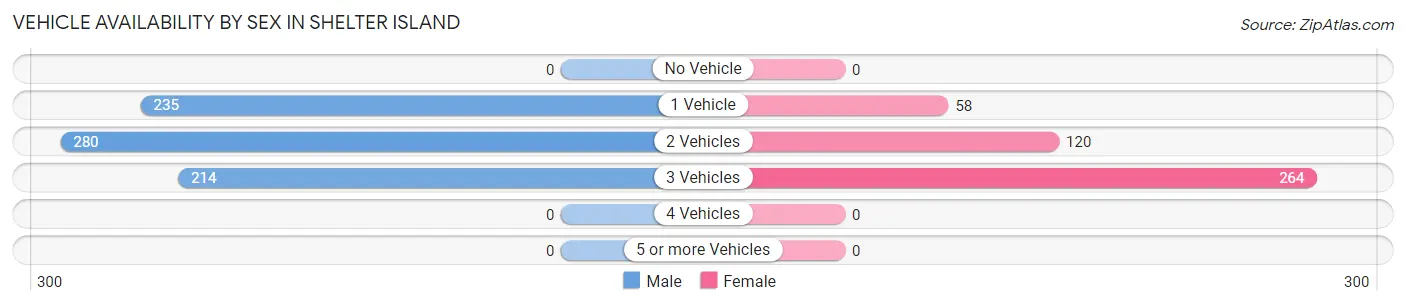
| Vehicles Available | Male | Female |
| No Vehicle | 0 (0.0%) | 0 (0.0%) |
| 1 Vehicle | 235 (32.2%) | 58 (13.1%) |
| 2 Vehicles | 280 (38.4%) | 120 (27.2%) |
| 3 Vehicles | 214 (29.4%) | 264 (59.7%) |
| 4 Vehicles | 0 (0.0%) | 0 (0.0%) |
| 5 or more Vehicles | 0 (0.0%) | 0 (0.0%) |
| Total | 729 (100.0%) | 442 (100.0%) |
Commute Time in Shelter Island
The most frequently occuring commute durations in Shelter Island are 5 to 9 minutes (256 commuters, 31.7%), less than 5 minutes (169 commuters, 20.9%), and 30 to 34 minutes (125 commuters, 15.5%).
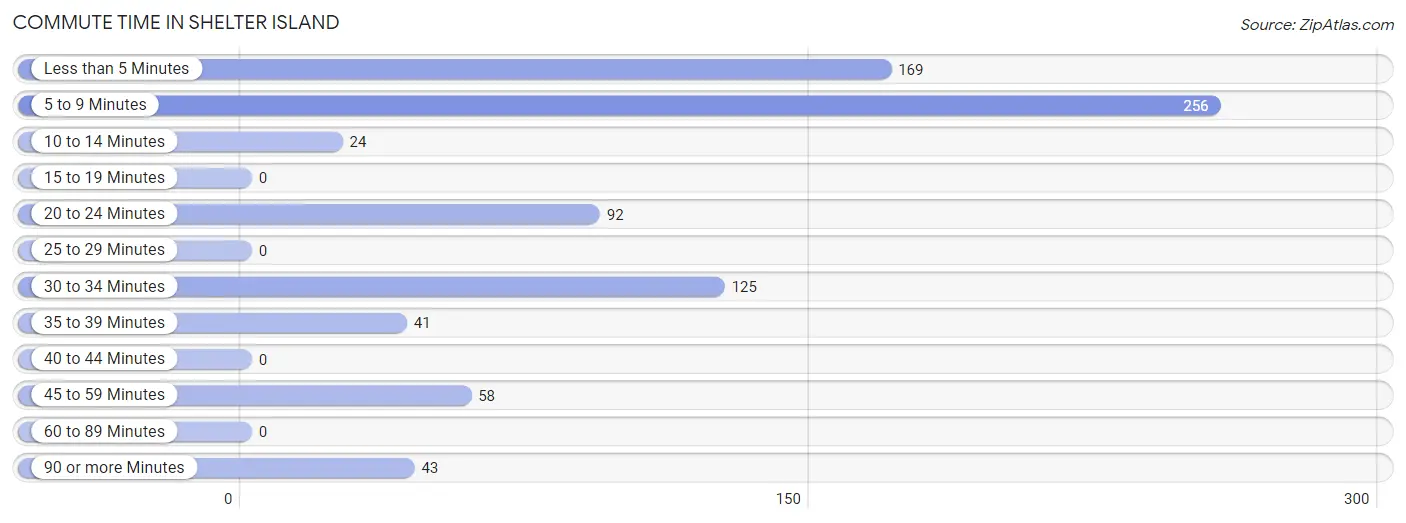
| Commute Time | # Commuters | % Commuters |
| Less than 5 Minutes | 169 | 20.9% |
| 5 to 9 Minutes | 256 | 31.7% |
| 10 to 14 Minutes | 24 | 3.0% |
| 15 to 19 Minutes | 0 | 0.0% |
| 20 to 24 Minutes | 92 | 11.4% |
| 25 to 29 Minutes | 0 | 0.0% |
| 30 to 34 Minutes | 125 | 15.5% |
| 35 to 39 Minutes | 41 | 5.1% |
| 40 to 44 Minutes | 0 | 0.0% |
| 45 to 59 Minutes | 58 | 7.2% |
| 60 to 89 Minutes | 0 | 0.0% |
| 90 or more Minutes | 43 | 5.3% |
Commute Time by Sex in Shelter Island
The most common commute times in Shelter Island are 5 to 9 minutes (256 commuters, 44.7%) for males and 20 to 24 minutes (92 commuters, 39.2%) for females.
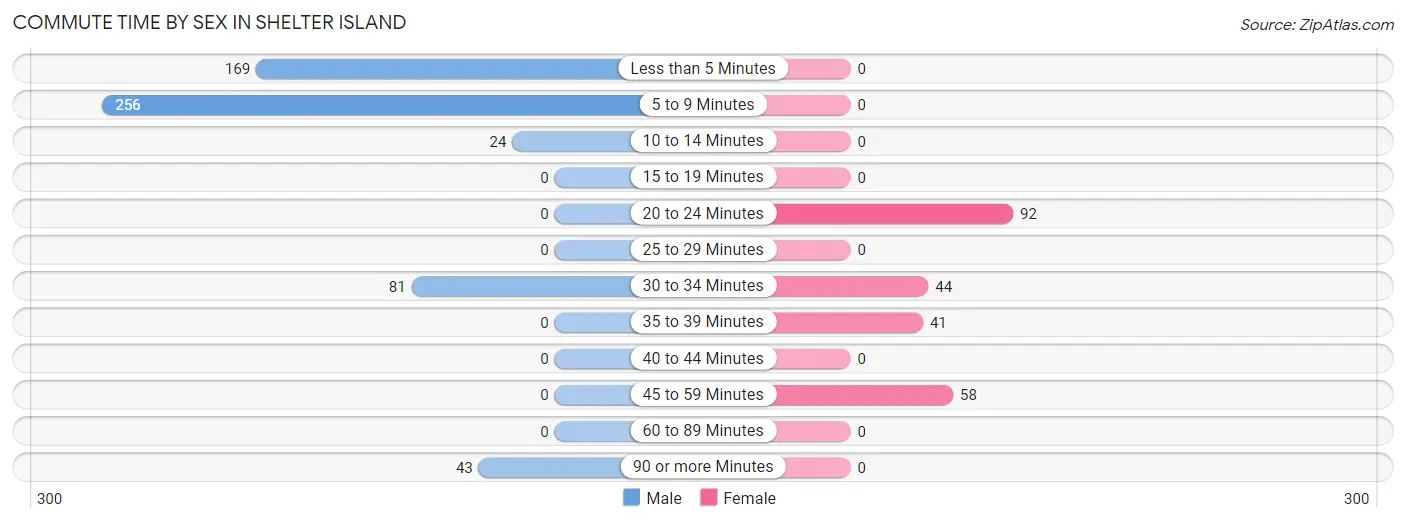
| Commute Time | Male | Female |
| Less than 5 Minutes | 169 (29.5%) | 0 (0.0%) |
| 5 to 9 Minutes | 256 (44.7%) | 0 (0.0%) |
| 10 to 14 Minutes | 24 (4.2%) | 0 (0.0%) |
| 15 to 19 Minutes | 0 (0.0%) | 0 (0.0%) |
| 20 to 24 Minutes | 0 (0.0%) | 92 (39.2%) |
| 25 to 29 Minutes | 0 (0.0%) | 0 (0.0%) |
| 30 to 34 Minutes | 81 (14.1%) | 44 (18.7%) |
| 35 to 39 Minutes | 0 (0.0%) | 41 (17.4%) |
| 40 to 44 Minutes | 0 (0.0%) | 0 (0.0%) |
| 45 to 59 Minutes | 0 (0.0%) | 58 (24.7%) |
| 60 to 89 Minutes | 0 (0.0%) | 0 (0.0%) |
| 90 or more Minutes | 43 (7.5%) | 0 (0.0%) |
Time of Departure to Work by Sex in Shelter Island
The most frequent times of departure to work in Shelter Island are 8:00 AM to 8:29 AM (184, 32.1%) for males and 9:00 AM to 9:59 AM (92, 39.2%) for females.
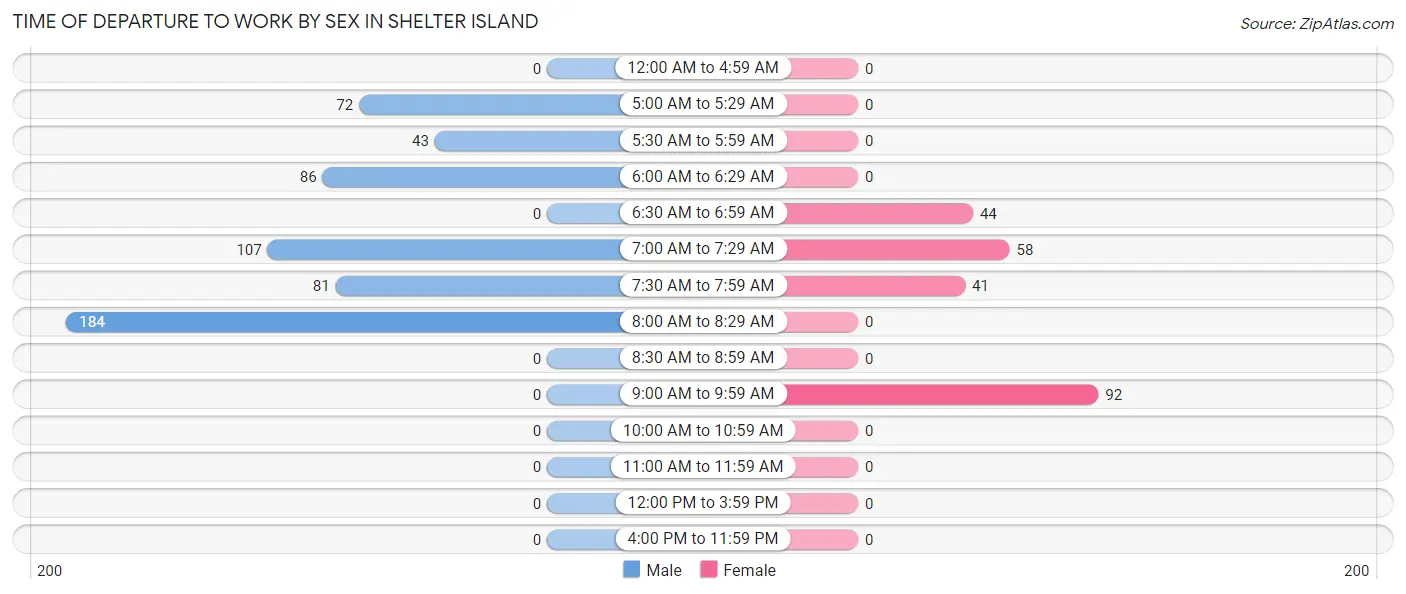
| Time of Departure | Male | Female |
| 12:00 AM to 4:59 AM | 0 (0.0%) | 0 (0.0%) |
| 5:00 AM to 5:29 AM | 72 (12.6%) | 0 (0.0%) |
| 5:30 AM to 5:59 AM | 43 (7.5%) | 0 (0.0%) |
| 6:00 AM to 6:29 AM | 86 (15.0%) | 0 (0.0%) |
| 6:30 AM to 6:59 AM | 0 (0.0%) | 44 (18.7%) |
| 7:00 AM to 7:29 AM | 107 (18.7%) | 58 (24.7%) |
| 7:30 AM to 7:59 AM | 81 (14.1%) | 41 (17.4%) |
| 8:00 AM to 8:29 AM | 184 (32.1%) | 0 (0.0%) |
| 8:30 AM to 8:59 AM | 0 (0.0%) | 0 (0.0%) |
| 9:00 AM to 9:59 AM | 0 (0.0%) | 92 (39.2%) |
| 10:00 AM to 10:59 AM | 0 (0.0%) | 0 (0.0%) |
| 11:00 AM to 11:59 AM | 0 (0.0%) | 0 (0.0%) |
| 12:00 PM to 3:59 PM | 0 (0.0%) | 0 (0.0%) |
| 4:00 PM to 11:59 PM | 0 (0.0%) | 0 (0.0%) |
| Total | 573 (100.0%) | 235 (100.0%) |
Housing Occupancy in Shelter Island
Occupancy by Ownership in Shelter Island
Of the total 926 dwellings in Shelter Island, owner-occupied units account for 699 (75.5%), while renter-occupied units make up 227 (24.5%).
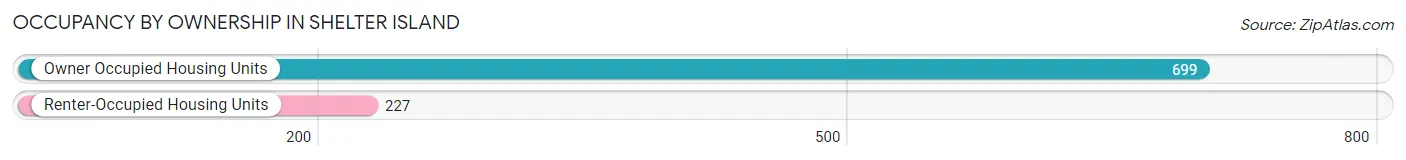
| Occupancy | # Housing Units | % Housing Units |
| Owner Occupied Housing Units | 699 | 75.5% |
| Renter-Occupied Housing Units | 227 | 24.5% |
| Total Occupied Housing Units | 926 | 100.0% |
Occupancy by Household Size in Shelter Island
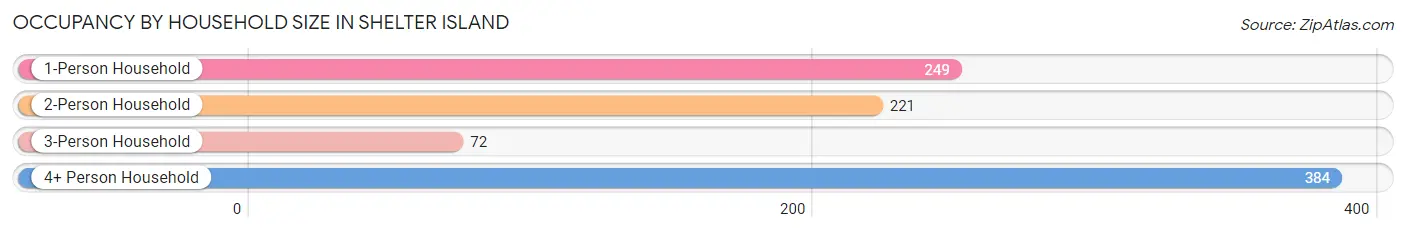
| Household Size | # Housing Units | % Housing Units |
| 1-Person Household | 249 | 26.9% |
| 2-Person Household | 221 | 23.9% |
| 3-Person Household | 72 | 7.8% |
| 4+ Person Household | 384 | 41.5% |
| Total Housing Units | 926 | 100.0% |
Occupancy by Ownership by Household Size in Shelter Island
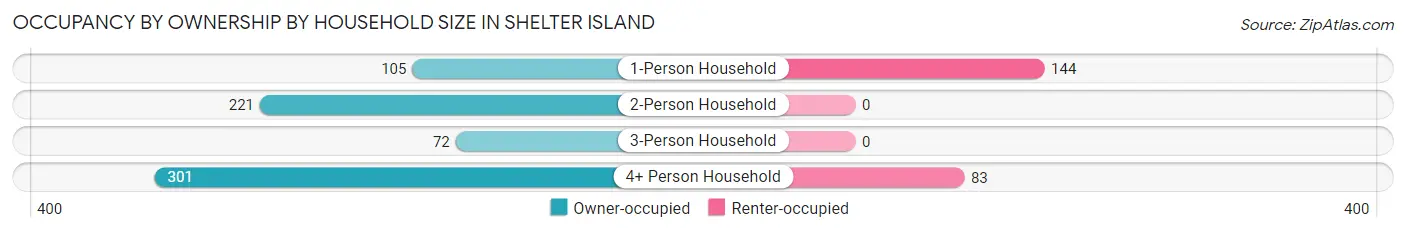
| Household Size | Owner-occupied | Renter-occupied |
| 1-Person Household | 105 (42.2%) | 144 (57.8%) |
| 2-Person Household | 221 (100.0%) | 0 (0.0%) |
| 3-Person Household | 72 (100.0%) | 0 (0.0%) |
| 4+ Person Household | 301 (78.4%) | 83 (21.6%) |
| Total Housing Units | 699 (75.5%) | 227 (24.5%) |
Occupancy by Educational Attainment in Shelter Island
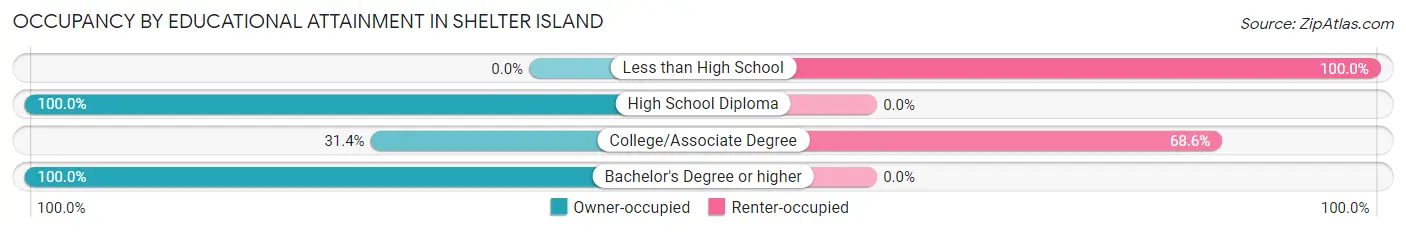
| Household Size | Owner-occupied | Renter-occupied |
| Less than High School | 0 (0.0%) | 83 (100.0%) |
| High School Diploma | 168 (100.0%) | 0 (0.0%) |
| College/Associate Degree | 66 (31.4%) | 144 (68.6%) |
| Bachelor's Degree or higher | 465 (100.0%) | 0 (0.0%) |
Occupancy by Age of Householder in Shelter Island
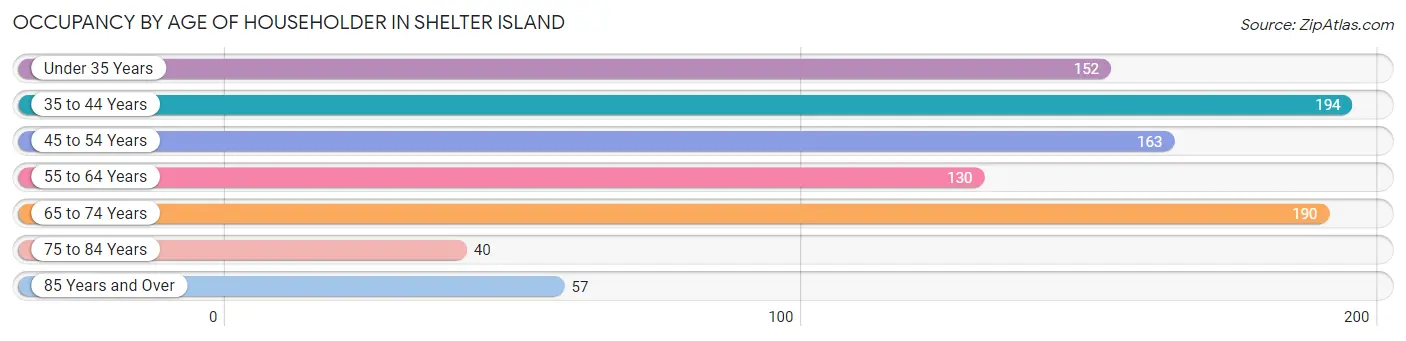
| Age Bracket | # Households | % Households |
| Under 35 Years | 152 | 16.4% |
| 35 to 44 Years | 194 | 20.9% |
| 45 to 54 Years | 163 | 17.6% |
| 55 to 64 Years | 130 | 14.0% |
| 65 to 74 Years | 190 | 20.5% |
| 75 to 84 Years | 40 | 4.3% |
| 85 Years and Over | 57 | 6.2% |
| Total | 926 | 100.0% |
Housing Finances in Shelter Island
Median Income by Occupancy in Shelter Island
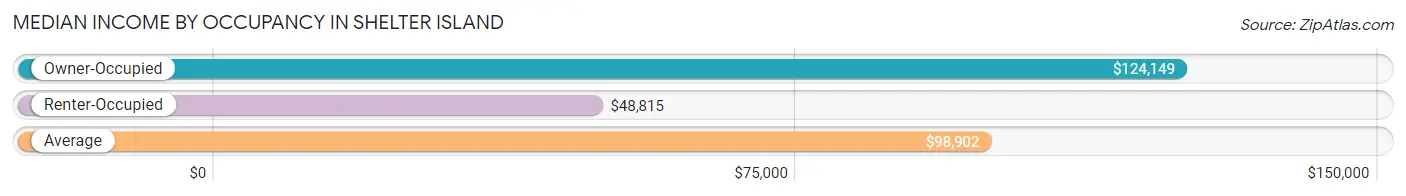
| Occupancy Type | # Households | Median Income |
| Owner-Occupied | 699 (75.5%) | $124,149 |
| Renter-Occupied | 227 (24.5%) | $48,815 |
| Average | 926 (100.0%) | $98,902 |
Occupancy by Householder Income Bracket in Shelter Island
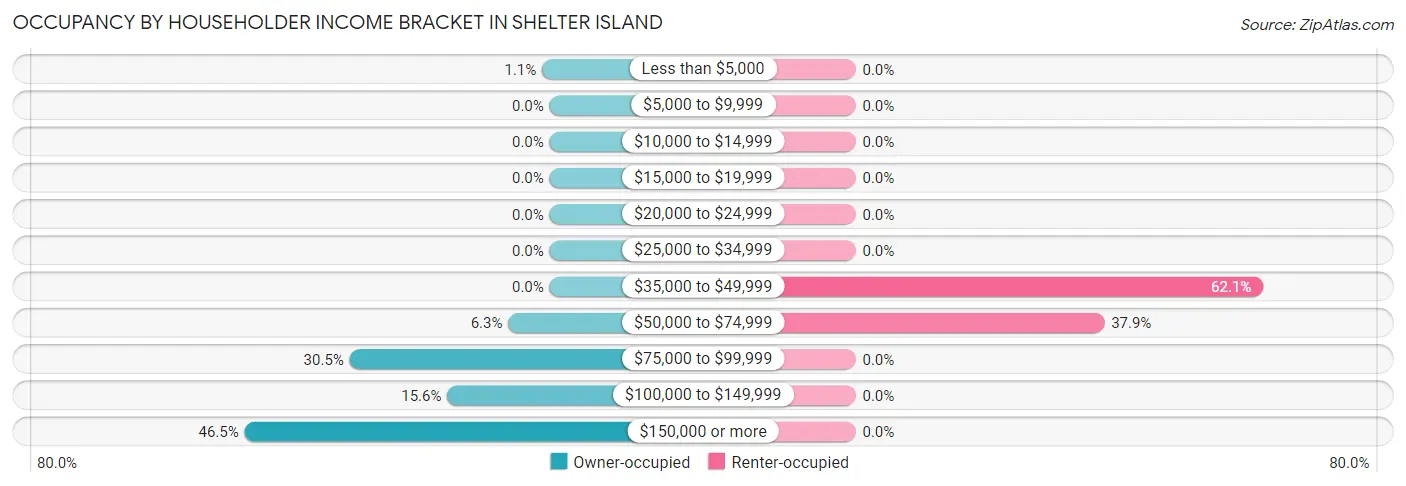
| Income Bracket | Owner-occupied | Renter-occupied |
| Less than $5,000 | 8 (1.1%) | 0 (0.0%) |
| $5,000 to $9,999 | 0 (0.0%) | 0 (0.0%) |
| $10,000 to $14,999 | 0 (0.0%) | 0 (0.0%) |
| $15,000 to $19,999 | 0 (0.0%) | 0 (0.0%) |
| $20,000 to $24,999 | 0 (0.0%) | 0 (0.0%) |
| $25,000 to $34,999 | 0 (0.0%) | 0 (0.0%) |
| $35,000 to $49,999 | 0 (0.0%) | 141 (62.1%) |
| $50,000 to $74,999 | 44 (6.3%) | 86 (37.9%) |
| $75,000 to $99,999 | 213 (30.5%) | 0 (0.0%) |
| $100,000 to $149,999 | 109 (15.6%) | 0 (0.0%) |
| $150,000 or more | 325 (46.5%) | 0 (0.0%) |
| Total | 699 (100.0%) | 227 (100.0%) |
Monthly Housing Cost Tiers in Shelter Island
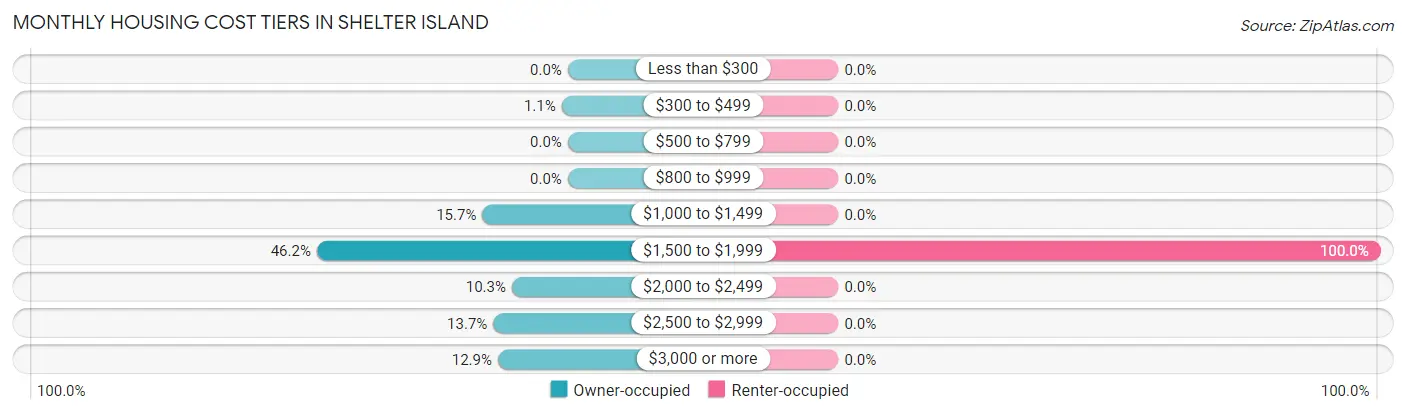
| Monthly Cost | Owner-occupied | Renter-occupied |
| Less than $300 | 0 (0.0%) | 0 (0.0%) |
| $300 to $499 | 8 (1.1%) | 0 (0.0%) |
| $500 to $799 | 0 (0.0%) | 0 (0.0%) |
| $800 to $999 | 0 (0.0%) | 0 (0.0%) |
| $1,000 to $1,499 | 110 (15.7%) | 0 (0.0%) |
| $1,500 to $1,999 | 323 (46.2%) | 227 (100.0%) |
| $2,000 to $2,499 | 72 (10.3%) | 0 (0.0%) |
| $2,500 to $2,999 | 96 (13.7%) | 0 (0.0%) |
| $3,000 or more | 90 (12.9%) | 0 (0.0%) |
| Total | 699 (100.0%) | 227 (100.0%) |
Physical Housing Characteristics in Shelter Island
Housing Structures in Shelter Island
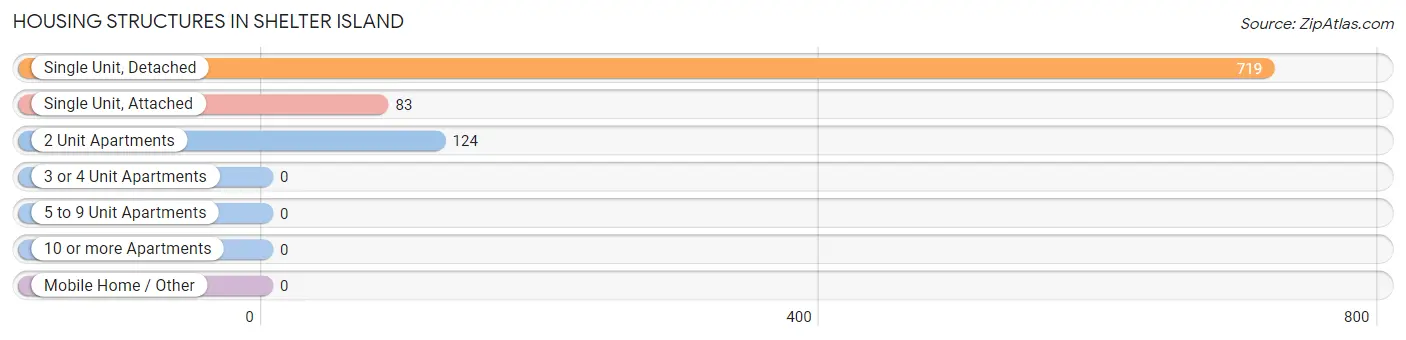
| Structure Type | # Housing Units | % Housing Units |
| Single Unit, Detached | 719 | 77.6% |
| Single Unit, Attached | 83 | 9.0% |
| 2 Unit Apartments | 124 | 13.4% |
| 3 or 4 Unit Apartments | 0 | 0.0% |
| 5 to 9 Unit Apartments | 0 | 0.0% |
| 10 or more Apartments | 0 | 0.0% |
| Mobile Home / Other | 0 | 0.0% |
| Total | 926 | 100.0% |
Housing Structures by Occupancy in Shelter Island
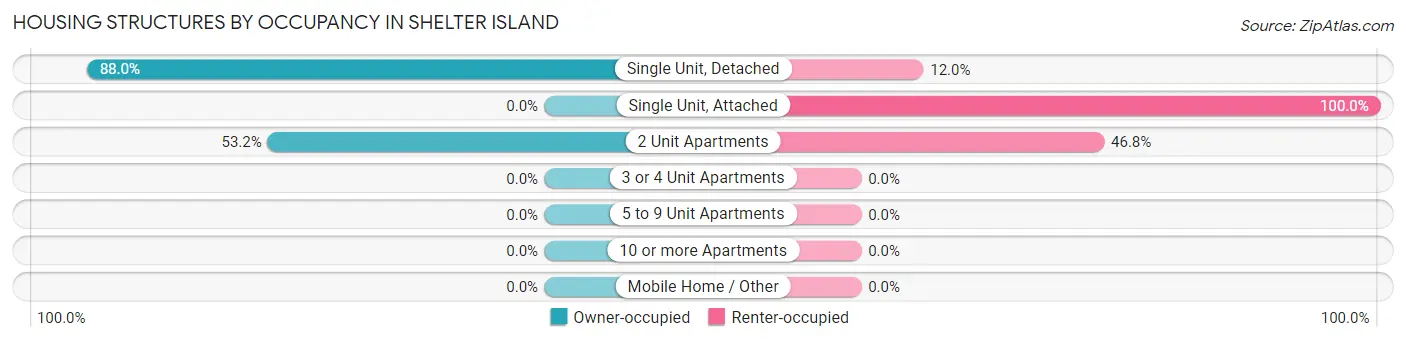
| Structure Type | Owner-occupied | Renter-occupied |
| Single Unit, Detached | 633 (88.0%) | 86 (12.0%) |
| Single Unit, Attached | 0 (0.0%) | 83 (100.0%) |
| 2 Unit Apartments | 66 (53.2%) | 58 (46.8%) |
| 3 or 4 Unit Apartments | 0 (0.0%) | 0 (0.0%) |
| 5 to 9 Unit Apartments | 0 (0.0%) | 0 (0.0%) |
| 10 or more Apartments | 0 (0.0%) | 0 (0.0%) |
| Mobile Home / Other | 0 (0.0%) | 0 (0.0%) |
| Total | 699 (75.5%) | 227 (24.5%) |
Housing Structures by Number of Rooms in Shelter Island
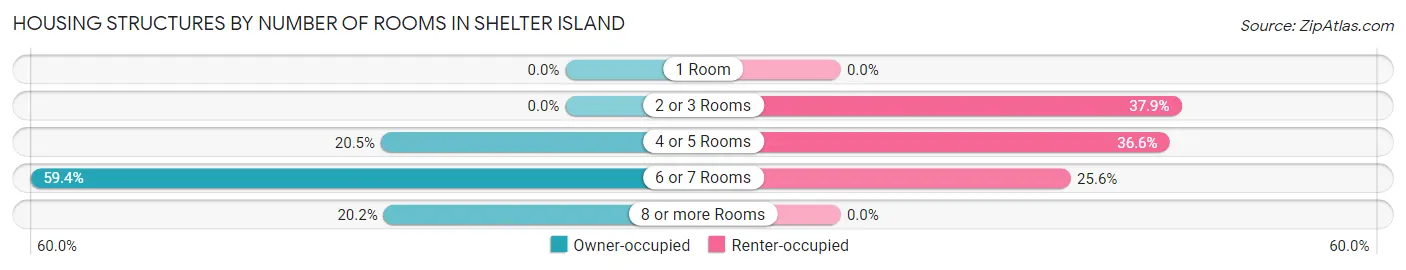
| Number of Rooms | Owner-occupied | Renter-occupied |
| 1 Room | 0 (0.0%) | 0 (0.0%) |
| 2 or 3 Rooms | 0 (0.0%) | 86 (37.9%) |
| 4 or 5 Rooms | 143 (20.5%) | 83 (36.6%) |
| 6 or 7 Rooms | 415 (59.4%) | 58 (25.6%) |
| 8 or more Rooms | 141 (20.2%) | 0 (0.0%) |
| Total | 699 (100.0%) | 227 (100.0%) |
Housing Structure by Heating Type in Shelter Island
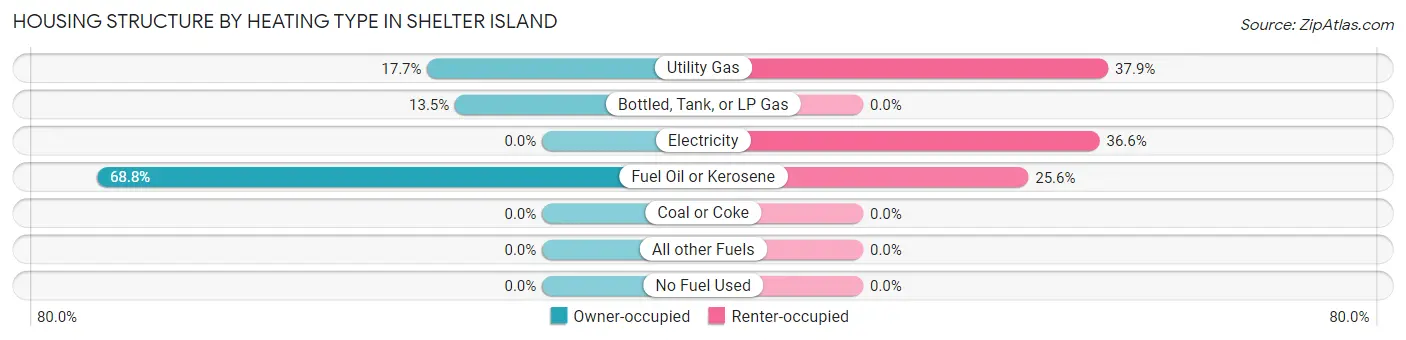
| Heating Type | Owner-occupied | Renter-occupied |
| Utility Gas | 124 (17.7%) | 86 (37.9%) |
| Bottled, Tank, or LP Gas | 94 (13.5%) | 0 (0.0%) |
| Electricity | 0 (0.0%) | 83 (36.6%) |
| Fuel Oil or Kerosene | 481 (68.8%) | 58 (25.6%) |
| Coal or Coke | 0 (0.0%) | 0 (0.0%) |
| All other Fuels | 0 (0.0%) | 0 (0.0%) |
| No Fuel Used | 0 (0.0%) | 0 (0.0%) |
| Total | 699 (100.0%) | 227 (100.0%) |
Household Vehicle Usage in Shelter Island
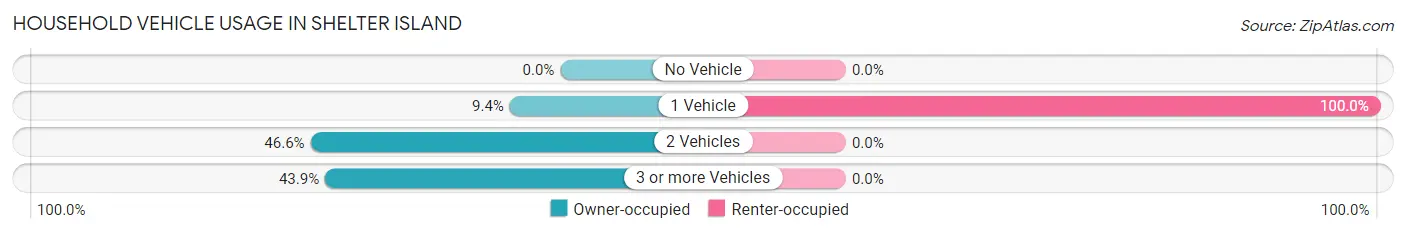
| Vehicles per Household | Owner-occupied | Renter-occupied |
| No Vehicle | 0 (0.0%) | 0 (0.0%) |
| 1 Vehicle | 66 (9.4%) | 227 (100.0%) |
| 2 Vehicles | 326 (46.6%) | 0 (0.0%) |
| 3 or more Vehicles | 307 (43.9%) | 0 (0.0%) |
| Total | 699 (100.0%) | 227 (100.0%) |
Real Estate & Mortgages in Shelter Island
Real Estate and Mortgage Overview in Shelter Island
| Characteristic | Without Mortgage | With Mortgage |
| Housing Units | 230 | 469 |
| Median Property Value | $1,063,700 | $899,900 |
| Median Household Income | $173,534 | $186 |
| Monthly Housing Costs | $1,501 | $90 |
| Real Estate Taxes | $6,133 | $0 |
Property Value by Mortgage Status in Shelter Island
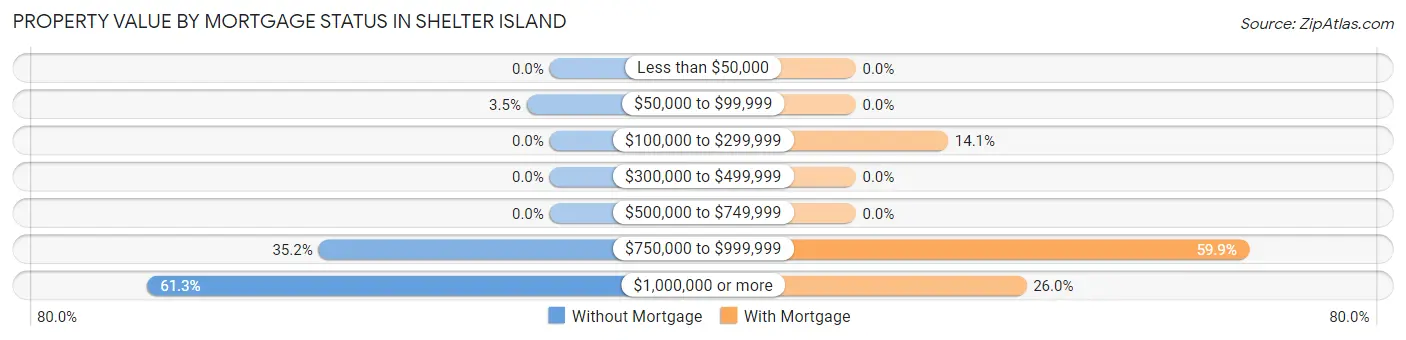
| Property Value | Without Mortgage | With Mortgage |
| Less than $50,000 | 0 (0.0%) | 0 (0.0%) |
| $50,000 to $99,999 | 8 (3.5%) | 0 (0.0%) |
| $100,000 to $299,999 | 0 (0.0%) | 66 (14.1%) |
| $300,000 to $499,999 | 0 (0.0%) | 0 (0.0%) |
| $500,000 to $749,999 | 0 (0.0%) | 0 (0.0%) |
| $750,000 to $999,999 | 81 (35.2%) | 281 (59.9%) |
| $1,000,000 or more | 141 (61.3%) | 122 (26.0%) |
| Total | 230 (100.0%) | 469 (100.0%) |
Household Income by Mortgage Status in Shelter Island
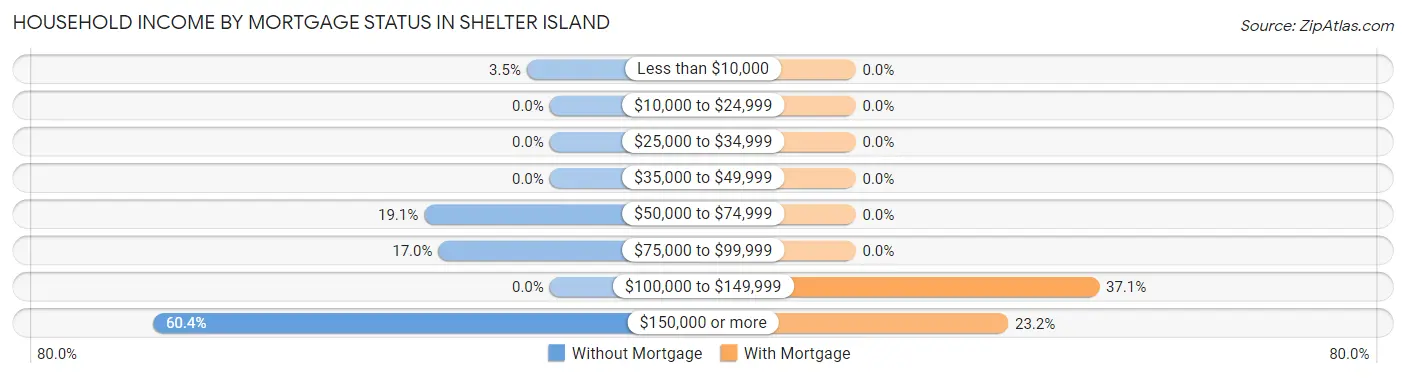
| Household Income | Without Mortgage | With Mortgage |
| Less than $10,000 | 8 (3.5%) | 0 (0.0%) |
| $10,000 to $24,999 | 0 (0.0%) | 0 (0.0%) |
| $25,000 to $34,999 | 0 (0.0%) | 0 (0.0%) |
| $35,000 to $49,999 | 0 (0.0%) | 0 (0.0%) |
| $50,000 to $74,999 | 44 (19.1%) | 0 (0.0%) |
| $75,000 to $99,999 | 39 (17.0%) | 0 (0.0%) |
| $100,000 to $149,999 | 0 (0.0%) | 174 (37.1%) |
| $150,000 or more | 139 (60.4%) | 109 (23.2%) |
| Total | 230 (100.0%) | 469 (100.0%) |
Property Value to Household Income Ratio in Shelter Island
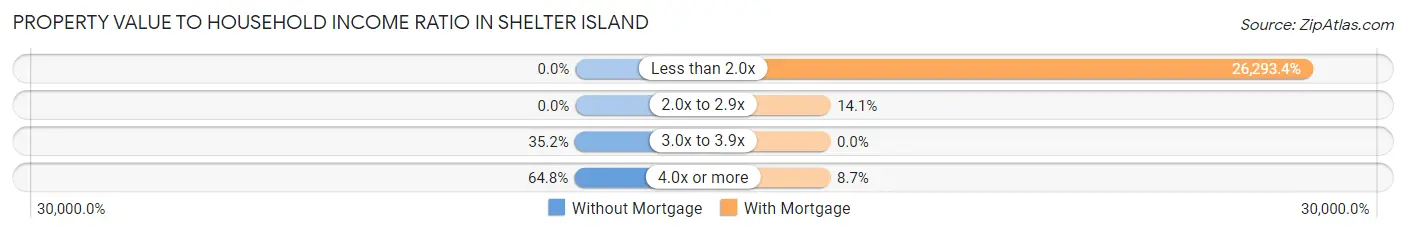
| Value-to-Income Ratio | Without Mortgage | With Mortgage |
| Less than 2.0x | 0 (0.0%) | 123,316 (26,293.4%) |
| 2.0x to 2.9x | 0 (0.0%) | 66 (14.1%) |
| 3.0x to 3.9x | 81 (35.2%) | 0 (0.0%) |
| 4.0x or more | 149 (64.8%) | 41 (8.7%) |
| Total | 230 (100.0%) | 469 (100.0%) |
Real Estate Taxes by Mortgage Status in Shelter Island
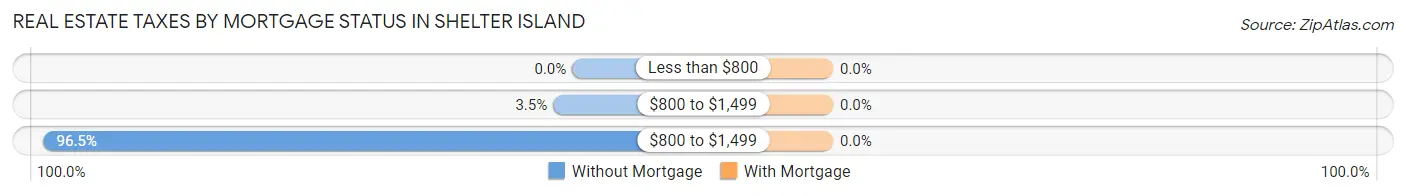
| Property Taxes | Without Mortgage | With Mortgage |
| Less than $800 | 0 (0.0%) | 0 (0.0%) |
| $800 to $1,499 | 8 (3.5%) | 0 (0.0%) |
| $800 to $1,499 | 222 (96.5%) | 0 (0.0%) |
| Total | 230 (100.0%) | 469 (100.0%) |
Health & Disability in Shelter Island
Health Insurance Coverage by Age in Shelter Island
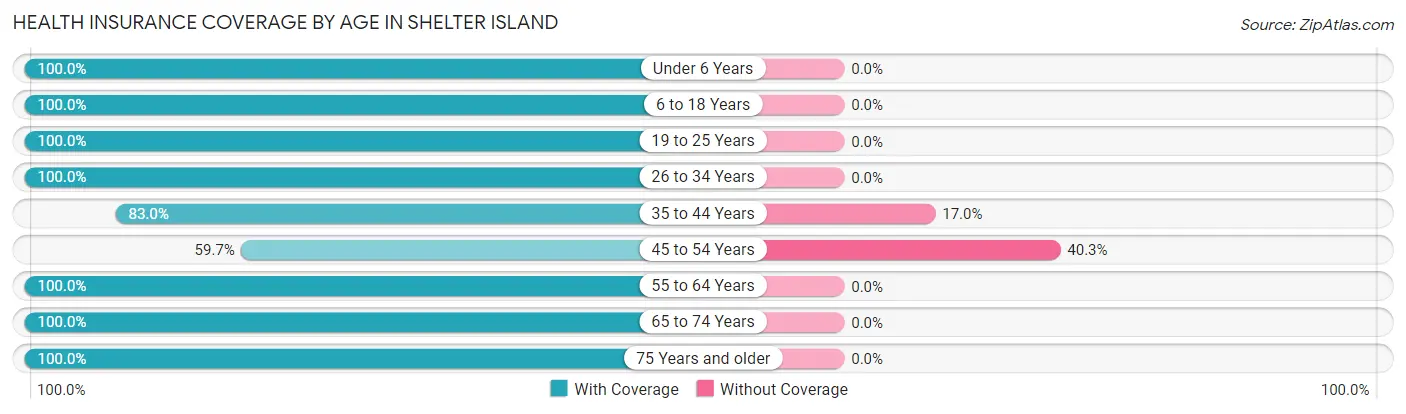
| Age Bracket | With Coverage | Without Coverage |
| Under 6 Years | 379 (100.0%) | 0 (0.0%) |
| 6 to 18 Years | 391 (100.0%) | 0 (0.0%) |
| 19 to 25 Years | 315 (100.0%) | 0 (0.0%) |
| 26 to 34 Years | 66 (100.0%) | 0 (0.0%) |
| 35 to 44 Years | 450 (83.0%) | 92 (17.0%) |
| 45 to 54 Years | 123 (59.7%) | 83 (40.3%) |
| 55 to 64 Years | 130 (100.0%) | 0 (0.0%) |
| 65 to 74 Years | 289 (100.0%) | 0 (0.0%) |
| 75 Years and older | 246 (100.0%) | 0 (0.0%) |
| Total | 2,389 (93.2%) | 175 (6.8%) |
Health Insurance Coverage by Citizenship Status in Shelter Island
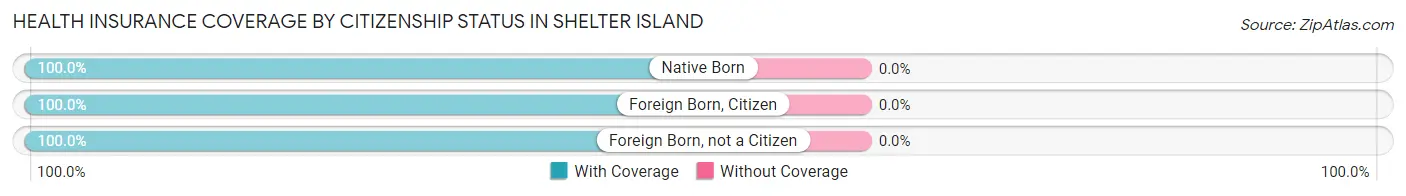
| Citizenship Status | With Coverage | Without Coverage |
| Native Born | 379 (100.0%) | 0 (0.0%) |
| Foreign Born, Citizen | 391 (100.0%) | 0 (0.0%) |
| Foreign Born, not a Citizen | 315 (100.0%) | 0 (0.0%) |
Health Insurance Coverage by Household Income in Shelter Island
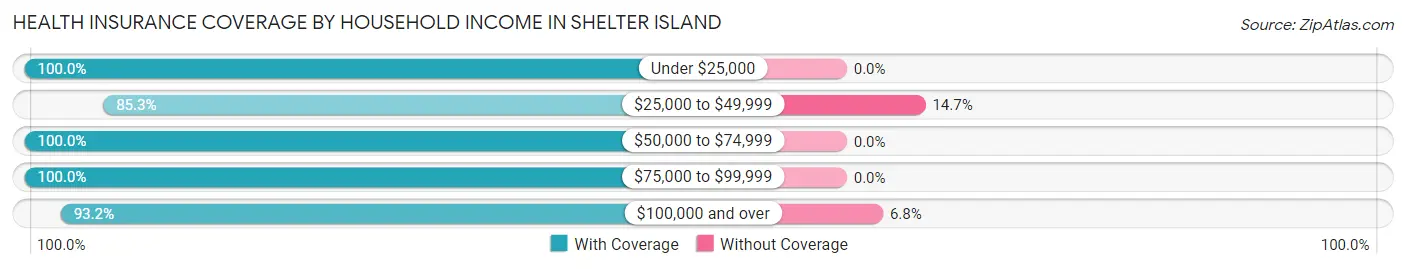
| Household Income | With Coverage | Without Coverage |
| Under $25,000 | 8 (100.0%) | 0 (0.0%) |
| $25,000 to $49,999 | 480 (85.3%) | 83 (14.7%) |
| $50,000 to $74,999 | 167 (100.0%) | 0 (0.0%) |
| $75,000 to $99,999 | 470 (100.0%) | 0 (0.0%) |
| $100,000 and over | 1,264 (93.2%) | 92 (6.8%) |
Public vs Private Health Insurance Coverage by Age in Shelter Island
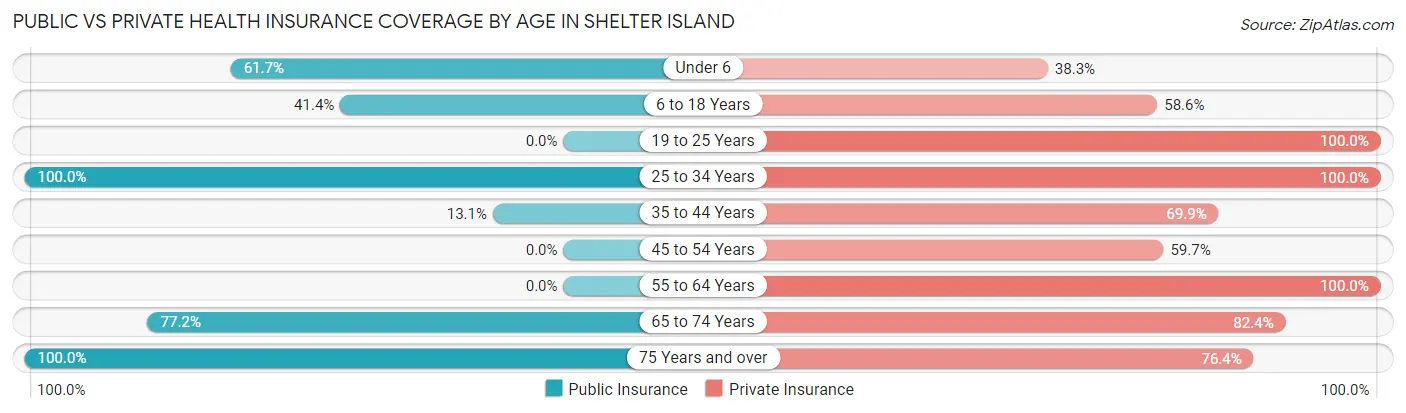
| Age Bracket | Public Insurance | Private Insurance |
| Under 6 | 234 (61.7%) | 145 (38.3%) |
| 6 to 18 Years | 162 (41.4%) | 229 (58.6%) |
| 19 to 25 Years | 0 (0.0%) | 315 (100.0%) |
| 25 to 34 Years | 66 (100.0%) | 66 (100.0%) |
| 35 to 44 Years | 71 (13.1%) | 379 (69.9%) |
| 45 to 54 Years | 0 (0.0%) | 123 (59.7%) |
| 55 to 64 Years | 0 (0.0%) | 130 (100.0%) |
| 65 to 74 Years | 223 (77.2%) | 238 (82.4%) |
| 75 Years and over | 246 (100.0%) | 188 (76.4%) |
| Total | 1,002 (39.1%) | 1,813 (70.7%) |
Disability Status by Sex by Age in Shelter Island
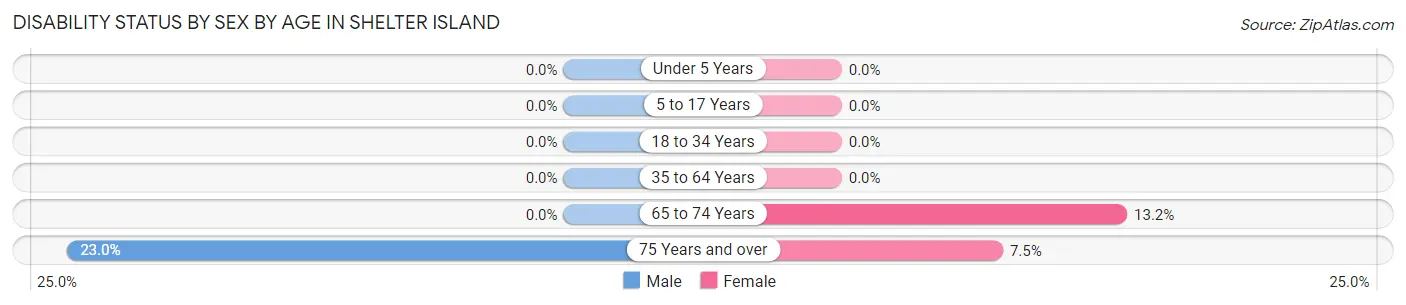
| Age Bracket | Male | Female |
| Under 5 Years | 0 (0.0%) | 0 (0.0%) |
| 5 to 17 Years | 0 (0.0%) | 0 (0.0%) |
| 18 to 34 Years | 0 (0.0%) | 0 (0.0%) |
| 35 to 64 Years | 0 (0.0%) | 0 (0.0%) |
| 65 to 74 Years | 0 (0.0%) | 29 (13.2%) |
| 75 Years and over | 32 (23.0%) | 8 (7.5%) |
Disability Class by Sex by Age in Shelter Island
Disability Class: Hearing Difficulty
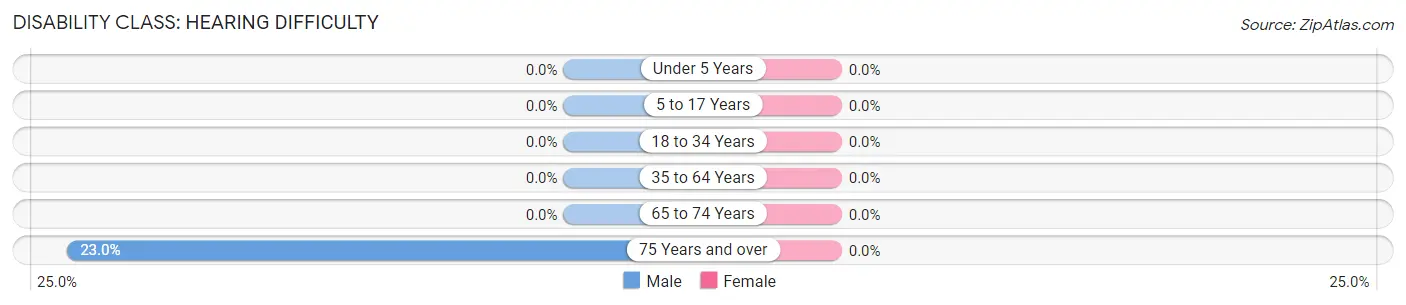
| Age Bracket | Male | Female |
| Under 5 Years | 0 (0.0%) | 0 (0.0%) |
| 5 to 17 Years | 0 (0.0%) | 0 (0.0%) |
| 18 to 34 Years | 0 (0.0%) | 0 (0.0%) |
| 35 to 64 Years | 0 (0.0%) | 0 (0.0%) |
| 65 to 74 Years | 0 (0.0%) | 0 (0.0%) |
| 75 Years and over | 32 (23.0%) | 0 (0.0%) |
Disability Class: Vision Difficulty
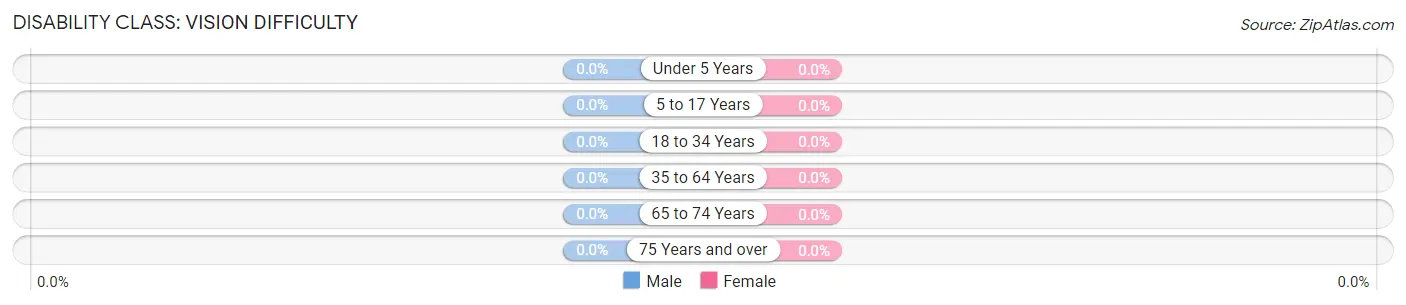
| Age Bracket | Male | Female |
| Under 5 Years | 0 (0.0%) | 0 (0.0%) |
| 5 to 17 Years | 0 (0.0%) | 0 (0.0%) |
| 18 to 34 Years | 0 (0.0%) | 0 (0.0%) |
| 35 to 64 Years | 0 (0.0%) | 0 (0.0%) |
| 65 to 74 Years | 0 (0.0%) | 0 (0.0%) |
| 75 Years and over | 0 (0.0%) | 0 (0.0%) |
Disability Class: Cognitive Difficulty
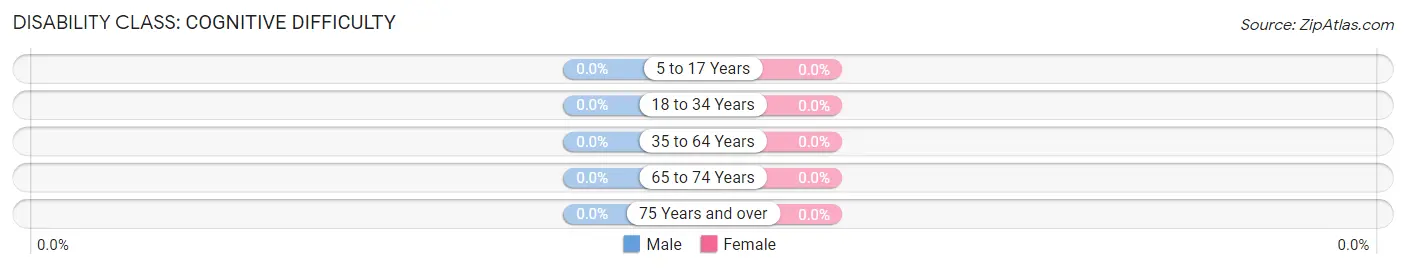
| Age Bracket | Male | Female |
| 5 to 17 Years | 0 (0.0%) | 0 (0.0%) |
| 18 to 34 Years | 0 (0.0%) | 0 (0.0%) |
| 35 to 64 Years | 0 (0.0%) | 0 (0.0%) |
| 65 to 74 Years | 0 (0.0%) | 0 (0.0%) |
| 75 Years and over | 0 (0.0%) | 0 (0.0%) |
Disability Class: Ambulatory Difficulty
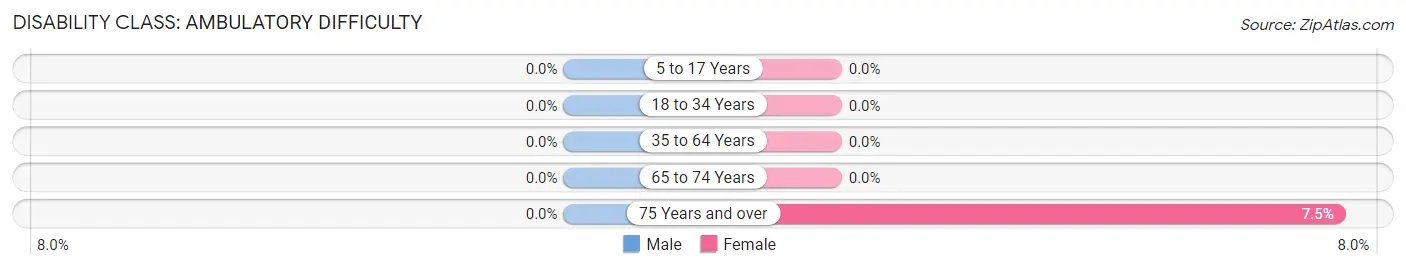
| Age Bracket | Male | Female |
| 5 to 17 Years | 0 (0.0%) | 0 (0.0%) |
| 18 to 34 Years | 0 (0.0%) | 0 (0.0%) |
| 35 to 64 Years | 0 (0.0%) | 0 (0.0%) |
| 65 to 74 Years | 0 (0.0%) | 0 (0.0%) |
| 75 Years and over | 0 (0.0%) | 8 (7.5%) |
Disability Class: Self-Care Difficulty
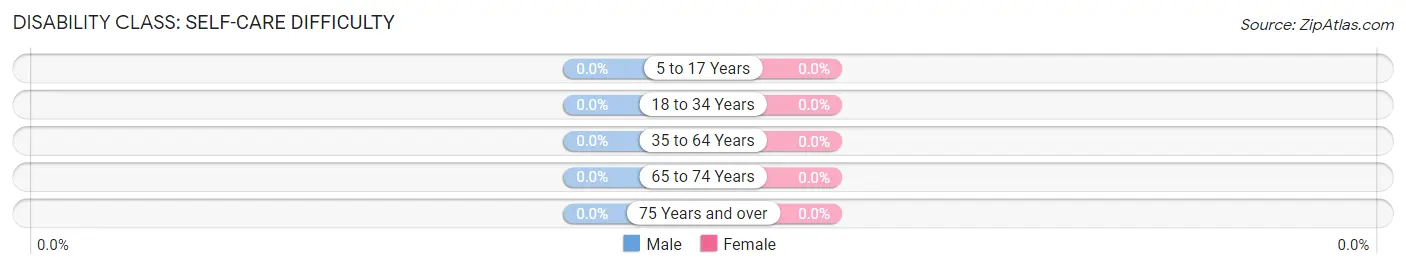
| Age Bracket | Male | Female |
| 5 to 17 Years | 0 (0.0%) | 0 (0.0%) |
| 18 to 34 Years | 0 (0.0%) | 0 (0.0%) |
| 35 to 64 Years | 0 (0.0%) | 0 (0.0%) |
| 65 to 74 Years | 0 (0.0%) | 0 (0.0%) |
| 75 Years and over | 0 (0.0%) | 0 (0.0%) |
Technology Access in Shelter Island
Computing Device Access in Shelter Island
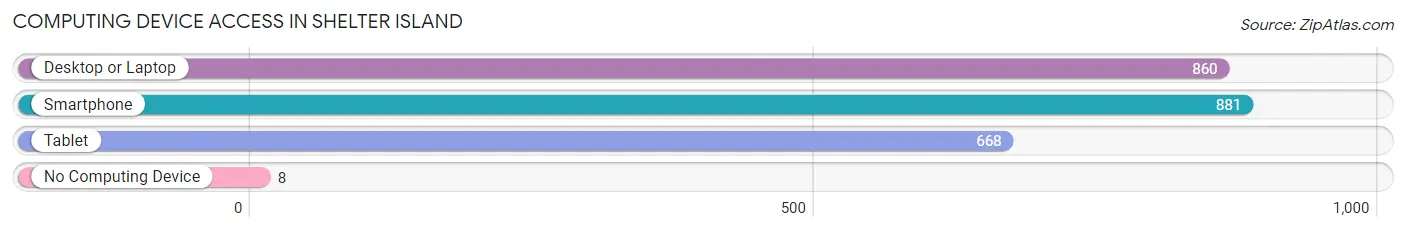
| Device Type | # Households | % Households |
| Desktop or Laptop | 860 | 92.9% |
| Smartphone | 881 | 95.1% |
| Tablet | 668 | 72.1% |
| No Computing Device | 8 | 0.9% |
| Total | 926 | 100.0% |
Internet Access in Shelter Island
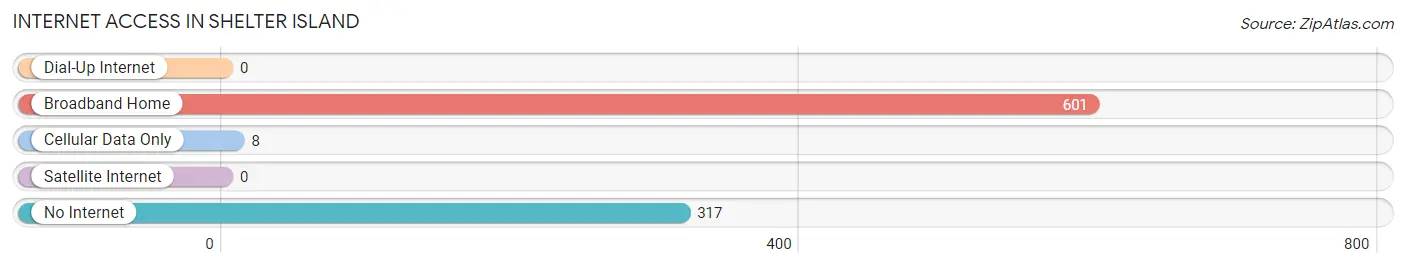
| Internet Type | # Households | % Households |
| Dial-Up Internet | 0 | 0.0% |
| Broadband Home | 601 | 64.9% |
| Cellular Data Only | 8 | 0.9% |
| Satellite Internet | 0 | 0.0% |
| No Internet | 317 | 34.2% |
| Total | 926 | 100.0% |
Shelter Island Summary
Shelter Island is a small island located in the eastern part of Long Island, New York. It is situated between the North and South Forks of Long Island, and is accessible by ferry from both Greenport and North Haven. The island is 8.3 square miles in size and has a population of 2,392 as of the 2010 census.
History
The first inhabitants of Shelter Island were the Manhanset Indians, who lived on the island for centuries before the arrival of Europeans. The island was purchased by English settlers in 1652, and was named Shelter Island by the English governor of New York, Richard Nicolls. The island was used as a refuge for English settlers during the American Revolutionary War, and was the site of a major battle between the British and American forces in 1777.
In the 19th century, Shelter Island became a popular summer destination for wealthy New Yorkers, who built large estates on the island. The island was also home to a number of resorts, including the Hotel Manhanset, which opened in 1878.
Geography
Shelter Island is located in the eastern part of Long Island, between the North and South Forks. The island is 8.3 square miles in size, and is composed of two main sections: the North and South Islands. The North Island is the larger of the two, and is home to the majority of the island's population. The South Island is mostly undeveloped, and is home to a number of nature preserves and wildlife sanctuaries.
The island is surrounded by several bodies of water, including Gardiners Bay, Peconic Bay, and the Long Island Sound. The island is accessible by ferry from both Greenport and North Haven.
Economy
Shelter Island's economy is largely based on tourism and real estate. The island is a popular summer destination for wealthy New Yorkers, and is home to a number of resorts, hotels, and restaurants. The island is also home to a number of marinas, which provide services to boaters and fishermen.
The island is also home to a number of businesses, including a winery, a brewery, and a number of retail stores. The island is also home to a number of art galleries, which showcase the work of local artists.
Demographics
As of the 2010 census, Shelter Island had a population of 2,392. The population is predominantly white (94.3%), with a small minority of African Americans (2.2%) and Hispanics (2.1%). The median household income is $87,917, and the median home value is $845,000.
The island is home to a number of churches, including the Shelter Island Presbyterian Church, the Shelter Island United Methodist Church, and the Shelter Island Congregational Church. The island is also home to a number of private schools, including the Shelter Island School and the Shelter Island Country Day School.
Conclusion
Shelter Island is a small island located in the eastern part of Long Island, New York. It is a popular summer destination for wealthy New Yorkers, and is home to a number of resorts, hotels, and restaurants. The island is also home to a number of businesses, including a winery, a brewery, and a number of retail stores. As of the 2010 census, Shelter Island had a population of 2,392, and the median household income is $87,917. The island is home to a number of churches, private schools, and art galleries, and is accessible by ferry from both Greenport and North Haven.
Common Questions
What is Per Capita Income in Shelter Island?
Per Capita income in Shelter Island is $48,529.
What is the Median Family Income in Shelter Island?
Median Family Income in Shelter Island is $122,517.
What is the Median Household income in Shelter Island?
Median Household Income in Shelter Island is $98,902.
What is Income or Wage Gap in Shelter Island?
Income or Wage Gap in Shelter Island is 25.2%.
Women in Shelter Island earn 74.8 cents for every dollar earned by a man.
What is Inequality or Gini Index in Shelter Island?
Inequality or Gini Index in Shelter Island is 0.33.
What is the Total Population of Shelter Island?
Total Population of Shelter Island is 2,564.
What is the Total Male Population of Shelter Island?
Total Male Population of Shelter Island is 1,173.
What is the Total Female Population of Shelter Island?
Total Female Population of Shelter Island is 1,391.
What is the Ratio of Males per 100 Females in Shelter Island?
There are 84.33 Males per 100 Females in Shelter Island.
What is the Ratio of Females per 100 Males in Shelter Island?
There are 118.58 Females per 100 Males in Shelter Island.
What is the Median Population Age in Shelter Island?
Median Population Age in Shelter Island is 40.5 Years.
What is the Average Family Size in Shelter Island
Average Family Size in Shelter Island is 3.3 People.
What is the Average Household Size in Shelter Island
Average Household Size in Shelter Island is 2.8 People.
How Large is the Labor Force in Shelter Island?
There are 1,243 People in the Labor Forcein in Shelter Island.
What is the Percentage of People in the Labor Force in Shelter Island?
66.2% of People are in the Labor Force in Shelter Island.
What is the Unemployment Rate in Shelter Island?
Unemployment Rate in Shelter Island is 5.7%.