Fowlerville, NY Map & Demographics
Fowlerville Map
Fowlerville Overview
$21,215
PER CAPITA INCOME
$79,125
AVG FAMILY INCOME
$78,000
AVG HOUSEHOLD INCOME
0.45
INEQUALITY / GINI INDEX
267
TOTAL POPULATION
120
MALE POPULATION
147
FEMALE POPULATION
81.63
MALES / 100 FEMALES
122.50
FEMALES / 100 MALES
21.8
MEDIAN AGE
4.2
AVG FAMILY SIZE
3.2
AVG HOUSEHOLD SIZE
67
LABOR FORCE [ PEOPLE ]
46.5%
PERCENT IN LABOR FORCE
10.4%
UNEMPLOYMENT RATE
Income in Fowlerville
Income Overview in Fowlerville
Per Capita Income in Fowlerville is $21,215, while median incomes of families and households are $79,125 and $78,000 respectively.
| Characteristic | Number | Measure |
| Per Capita Income | 267 | $21,215 |
| Median Family Income | 57 | $79,125 |
| Mean Family Income | 57 | $100,275 |
| Median Household Income | 84 | $78,000 |
| Mean Household Income | 84 | $68,044 |
| Income Deficit | 57 | $0 |
| Wage / Income Gap (%) | 267 | 0.00% |
| Wage / Income Gap ($) | 267 | 100.00¢ per $1 |
| Gini / Inequality Index | 267 | 0.45 |
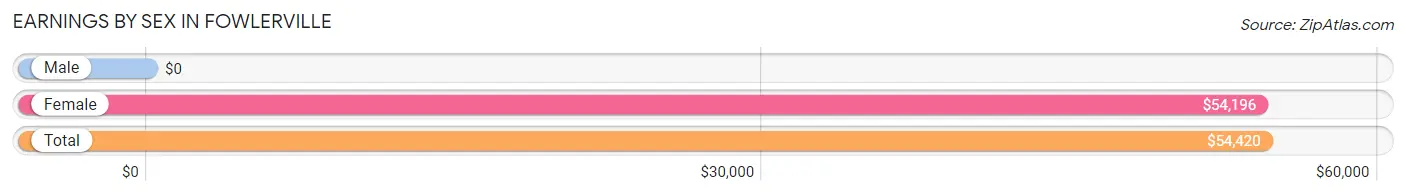
Earnings by Sex in Fowlerville
| Sex | Number | Average Earnings |
| Male | 31 (40.3%) | $0 |
| Female | 46 (59.7%) | $54,196 |
| Total | 77 (100.0%) | $54,420 |
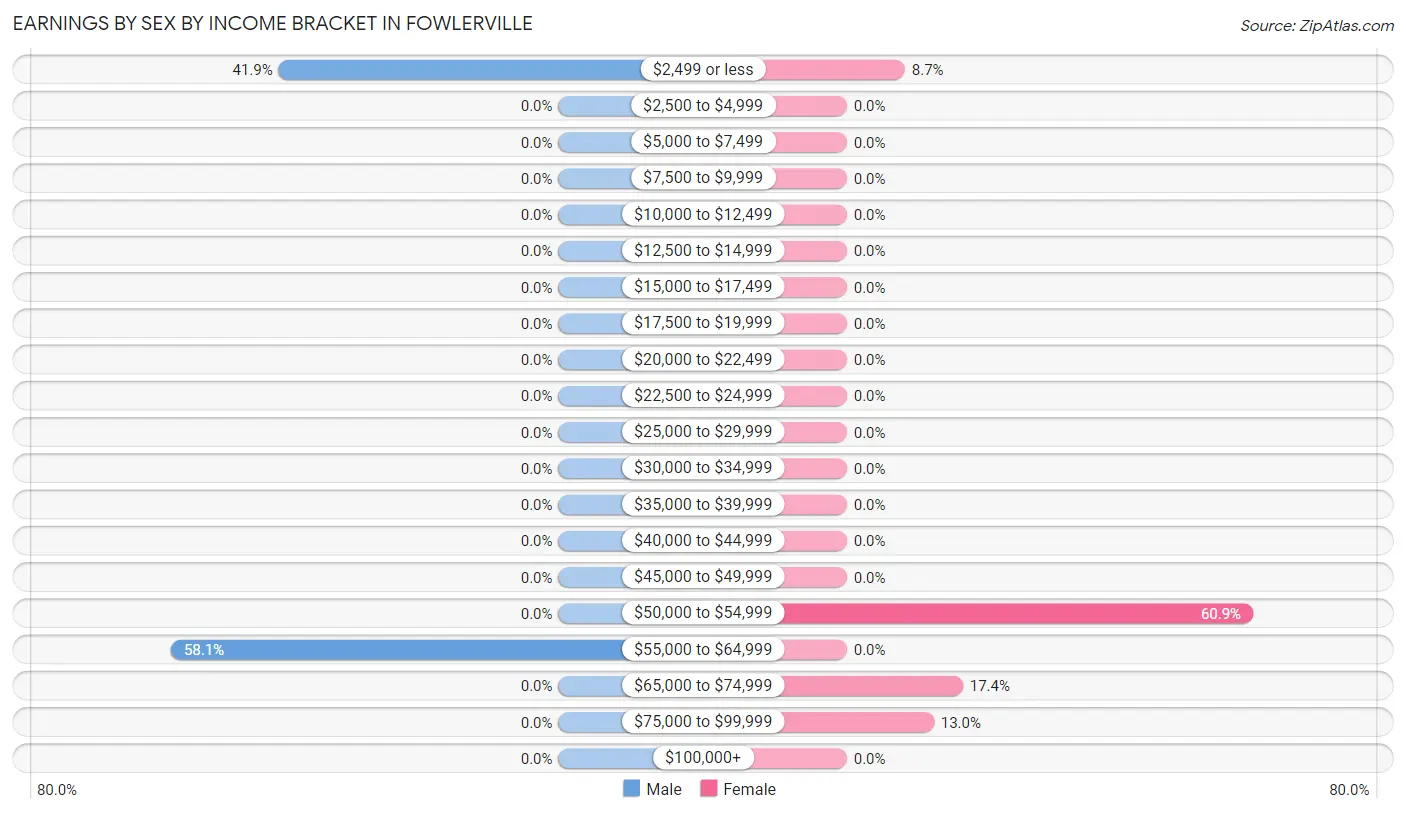
Earnings by Sex by Income Bracket in Fowlerville
The most common earnings brackets in Fowlerville are $55,000 to $64,999 for men (18 | 58.1%) and $50,000 to $54,999 for women (28 | 60.9%).
| Income | Male | Female |
| $2,499 or less | 13 (41.9%) | 4 (8.7%) |
| $2,500 to $4,999 | 0 (0.0%) | 0 (0.0%) |
| $5,000 to $7,499 | 0 (0.0%) | 0 (0.0%) |
| $7,500 to $9,999 | 0 (0.0%) | 0 (0.0%) |
| $10,000 to $12,499 | 0 (0.0%) | 0 (0.0%) |
| $12,500 to $14,999 | 0 (0.0%) | 0 (0.0%) |
| $15,000 to $17,499 | 0 (0.0%) | 0 (0.0%) |
| $17,500 to $19,999 | 0 (0.0%) | 0 (0.0%) |
| $20,000 to $22,499 | 0 (0.0%) | 0 (0.0%) |
| $22,500 to $24,999 | 0 (0.0%) | 0 (0.0%) |
| $25,000 to $29,999 | 0 (0.0%) | 0 (0.0%) |
| $30,000 to $34,999 | 0 (0.0%) | 0 (0.0%) |
| $35,000 to $39,999 | 0 (0.0%) | 0 (0.0%) |
| $40,000 to $44,999 | 0 (0.0%) | 0 (0.0%) |
| $45,000 to $49,999 | 0 (0.0%) | 0 (0.0%) |
| $50,000 to $54,999 | 0 (0.0%) | 28 (60.9%) |
| $55,000 to $64,999 | 18 (58.1%) | 0 (0.0%) |
| $65,000 to $74,999 | 0 (0.0%) | 8 (17.4%) |
| $75,000 to $99,999 | 0 (0.0%) | 6 (13.0%) |
| $100,000+ | 0 (0.0%) | 0 (0.0%) |
| Total | 31 (100.0%) | 46 (100.0%) |
Earnings by Sex by Educational Attainment in Fowlerville
| Educational Attainment | Male Income | Female Income |
| Less than High School | - | - |
| High School Diploma | - | - |
| College or Associate's Degree | - | - |
| Bachelor's Degree | - | - |
| Graduate Degree | - | - |
| Total | - | - |
Family Income in Fowlerville
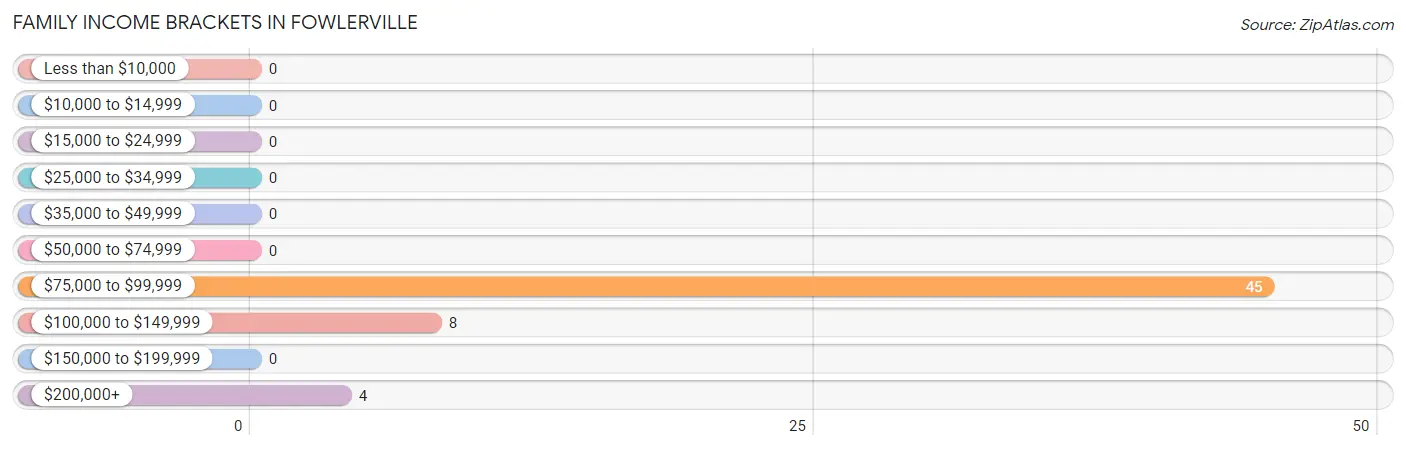
Family Income Brackets in Fowlerville
According to the Fowlerville family income data, there are 45 families falling into the $75,000 to $99,999 income range, which is the most common income bracket and makes up 78.9% of all families.
| Income Bracket | # Families | % Families |
| Less than $10,000 | 0 | 0.0% |
| $10,000 to $14,999 | 0 | 0.0% |
| $15,000 to $24,999 | 0 | 0.0% |
| $25,000 to $34,999 | 0 | 0.0% |
| $35,000 to $49,999 | 0 | 0.0% |
| $50,000 to $74,999 | 0 | 0.0% |
| $75,000 to $99,999 | 45 | 78.9% |
| $100,000 to $149,999 | 8 | 14.0% |
| $150,000 to $199,999 | 0 | 0.0% |
| $200,000+ | 4 | 7.0% |
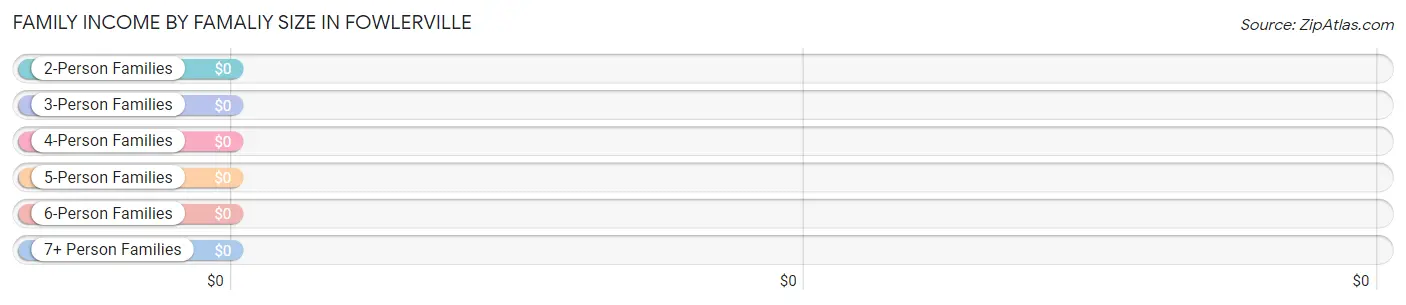
Family Income by Famaliy Size in Fowlerville
| Income Bracket | # Families | Median Income |
| 2-Person Families | 13 (22.8%) | $0 |
| 3-Person Families | 0 (0.0%) | $0 |
| 4-Person Families | 14 (24.6%) | $0 |
| 5-Person Families | 30 (52.6%) | $0 |
| 6-Person Families | 0 (0.0%) | $0 |
| 7+ Person Families | 0 (0.0%) | $0 |
| Total | 57 (100.0%) | $79,125 |
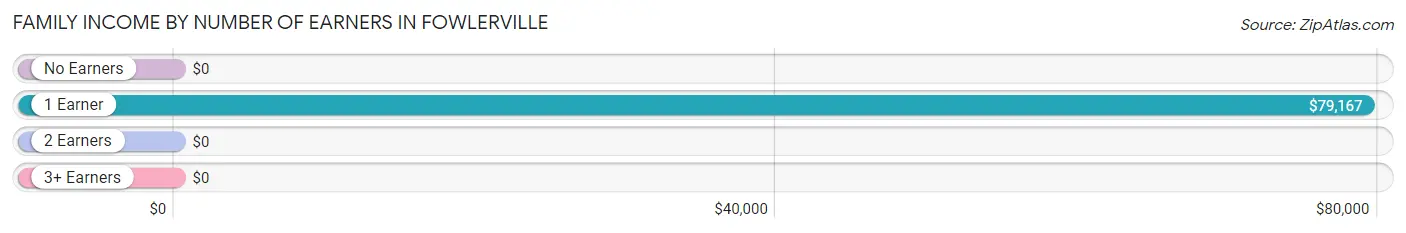
Family Income by Number of Earners in Fowlerville
| Number of Earners | # Families | Median Income |
| No Earners | 0 (0.0%) | $0 |
| 1 Earner | 40 (70.2%) | $79,167 |
| 2 Earners | 17 (29.8%) | $0 |
| 3+ Earners | 0 (0.0%) | $0 |
| Total | 57 (100.0%) | $79,125 |
Household Income in Fowlerville
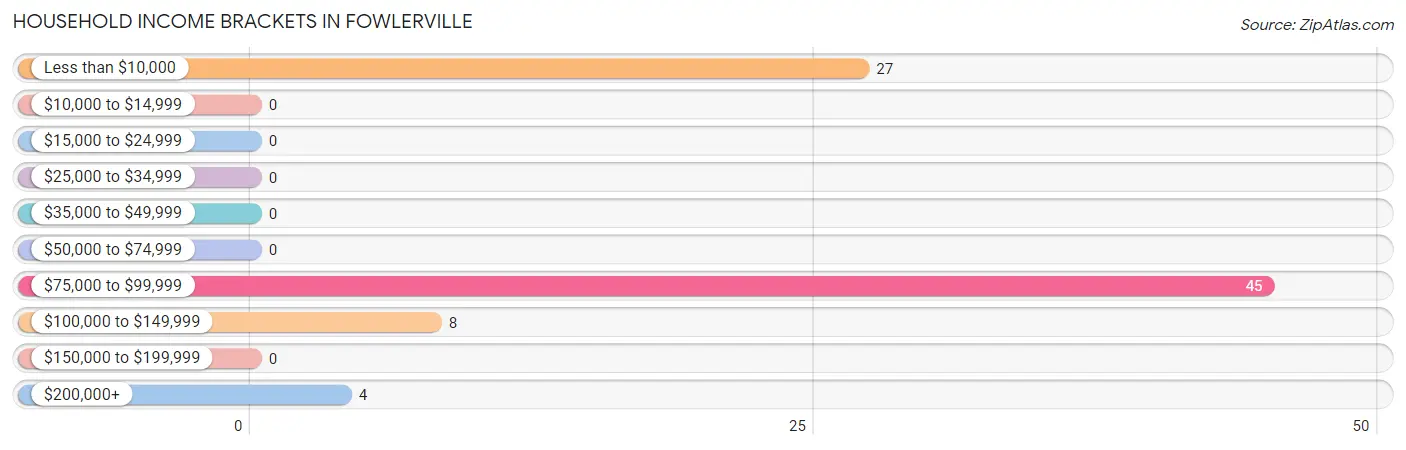
Household Income Brackets in Fowlerville
With 45 households falling in the category, the $75,000 to $99,999 income range is the most frequent in Fowlerville, accounting for 53.6% of all households.
| Income Bracket | # Households | % Households |
| Less than $10,000 | 27 | 32.1% |
| $10,000 to $14,999 | 0 | 0.0% |
| $15,000 to $24,999 | 0 | 0.0% |
| $25,000 to $34,999 | 0 | 0.0% |
| $35,000 to $49,999 | 0 | 0.0% |
| $50,000 to $74,999 | 0 | 0.0% |
| $75,000 to $99,999 | 45 | 53.6% |
| $100,000 to $149,999 | 8 | 9.5% |
| $150,000 to $199,999 | 0 | 0.0% |
| $200,000+ | 4 | 4.8% |
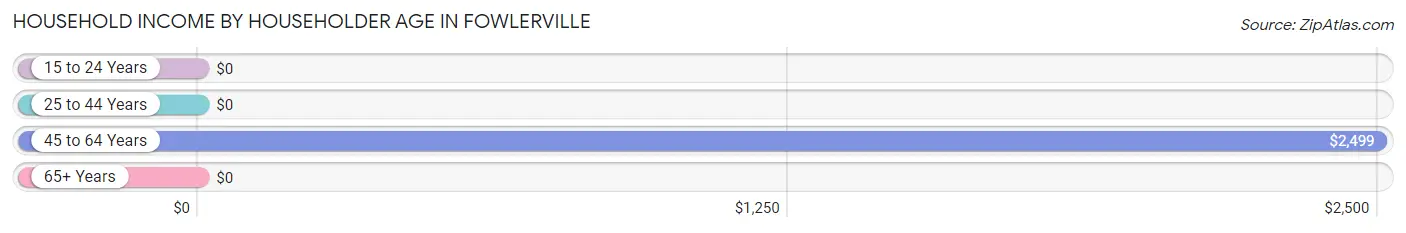
Household Income by Householder Age in Fowlerville
The median household income in Fowlerville is $78,000, with the highest median household income of $2,499 found in the 45 to 64 years age bracket for the primary householder. A total of 40 households (47.6%) fall into this category.
| Income Bracket | # Households | Median Income |
| 15 to 24 Years | 0 (0.0%) | $0 |
| 25 to 44 Years | 14 (16.7%) | $0 |
| 45 to 64 Years | 40 (47.6%) | $2,499 |
| 65+ Years | 30 (35.7%) | $0 |
| Total | 84 (100.0%) | $78,000 |
Poverty in Fowlerville
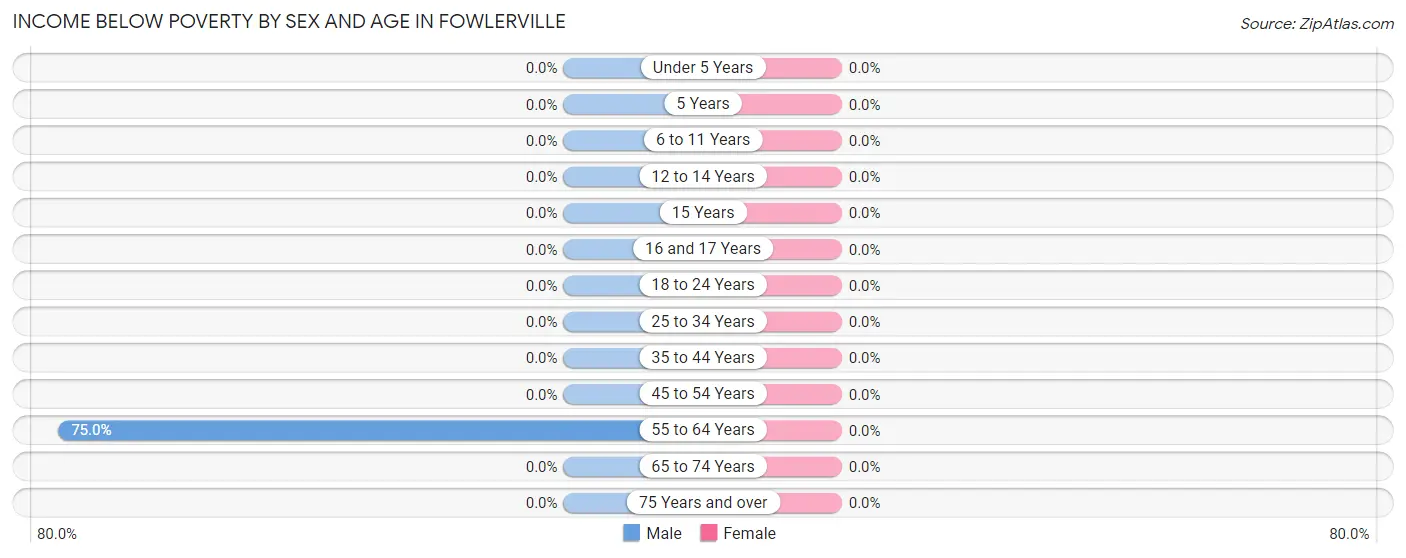
Income Below Poverty by Sex and Age in Fowlerville
| Age Bracket | Male | Female |
| Under 5 Years | 0 (0.0%) | 0 (0.0%) |
| 5 Years | 0 (0.0%) | 0 (0.0%) |
| 6 to 11 Years | 0 (0.0%) | 0 (0.0%) |
| 12 to 14 Years | 0 (0.0%) | 0 (0.0%) |
| 15 Years | 0 (0.0%) | 0 (0.0%) |
| 16 and 17 Years | 0 (0.0%) | 0 (0.0%) |
| 18 to 24 Years | 0 (0.0%) | 0 (0.0%) |
| 25 to 34 Years | 0 (0.0%) | 0 (0.0%) |
| 35 to 44 Years | 0 (0.0%) | 0 (0.0%) |
| 45 to 54 Years | 0 (0.0%) | 0 (0.0%) |
| 55 to 64 Years | 27 (75.0%) | 0 (0.0%) |
| 65 to 74 Years | 0 (0.0%) | 0 (0.0%) |
| 75 Years and over | 0 (0.0%) | 0 (0.0%) |
| Total | 27 (22.5%) | 0 (0.0%) |
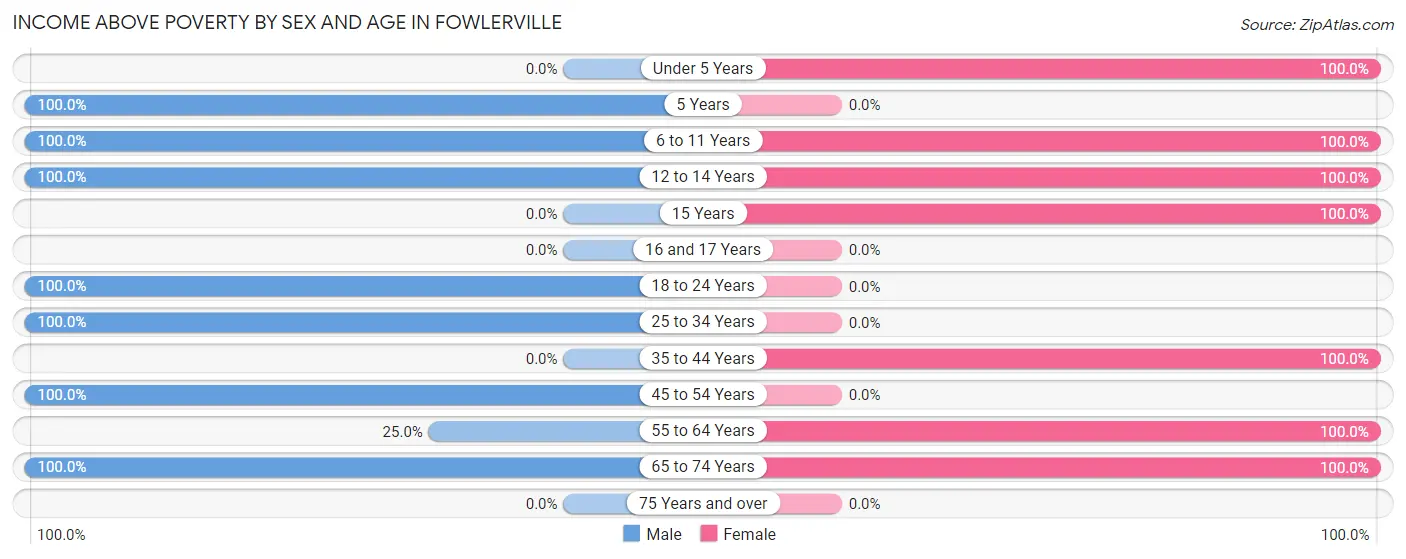
Income Above Poverty by Sex and Age in Fowlerville
According to the poverty statistics in Fowlerville, males aged 5 years and females aged under 5 years are the age groups that are most secure financially, with 100.0% of males and 100.0% of females in these age groups living above the poverty line.
| Age Bracket | Male | Female |
| Under 5 Years | 0 (0.0%) | 7 (100.0%) |
| 5 Years | 34 (100.0%) | 0 (0.0%) |
| 6 to 11 Years | 9 (100.0%) | 7 (100.0%) |
| 12 to 14 Years | 9 (100.0%) | 30 (100.0%) |
| 15 Years | 0 (0.0%) | 27 (100.0%) |
| 16 and 17 Years | 0 (0.0%) | 0 (0.0%) |
| 18 to 24 Years | 13 (100.0%) | 0 (0.0%) |
| 25 to 34 Years | 7 (100.0%) | 0 (0.0%) |
| 35 to 44 Years | 0 (0.0%) | 42 (100.0%) |
| 45 to 54 Years | 9 (100.0%) | 0 (0.0%) |
| 55 to 64 Years | 9 (25.0%) | 4 (100.0%) |
| 65 to 74 Years | 3 (100.0%) | 30 (100.0%) |
| 75 Years and over | 0 (0.0%) | 0 (0.0%) |
| Total | 93 (77.5%) | 147 (100.0%) |
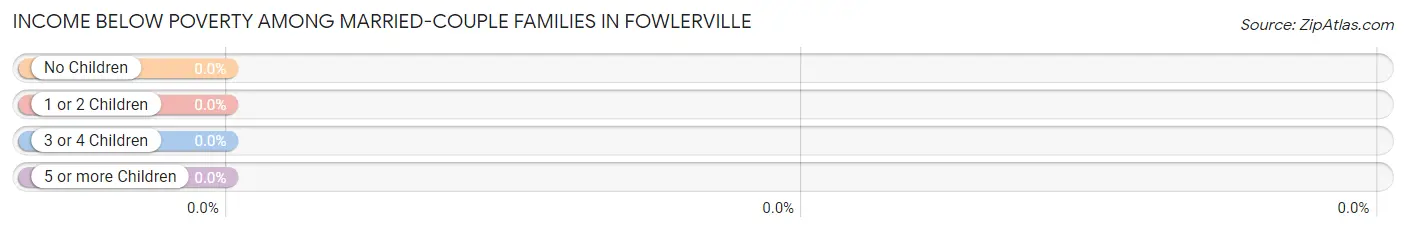
Income Below Poverty Among Married-Couple Families in Fowlerville
| Children | Above Poverty | Below Poverty |
| No Children | 4 (100.0%) | 0 (0.0%) |
| 1 or 2 Children | 14 (100.0%) | 0 (0.0%) |
| 3 or 4 Children | 0 (0.0%) | 0 (0.0%) |
| 5 or more Children | 0 (0.0%) | 0 (0.0%) |
| Total | 18 (100.0%) | 0 (0.0%) |
Income Below Poverty Among Single-Parent Households in Fowlerville
| Children | Single Father | Single Mother |
| No Children | 0 (0.0%) | 0 (0.0%) |
| 1 or 2 Children | 0 (0.0%) | 0 (0.0%) |
| 3 or 4 Children | 0 (0.0%) | 0 (0.0%) |
| 5 or more Children | 0 (0.0%) | 0 (0.0%) |
| Total | 0 (0.0%) | 0 (0.0%) |
Income Below Poverty Among Married-Couple vs Single-Parent Households in Fowlerville
| Children | Married-Couple Families | Single-Parent Households |
| No Children | 0 (0.0%) | 0 (0.0%) |
| 1 or 2 Children | 0 (0.0%) | 0 (0.0%) |
| 3 or 4 Children | 0 (0.0%) | 0 (0.0%) |
| 5 or more Children | 0 (0.0%) | 0 (0.0%) |
| Total | 0 (0.0%) | 0 (0.0%) |
Race in Fowlerville
The most populous races in Fowlerville are White / Caucasian (267 | 100.0%), and Hispanic or Latino (3 | 1.1%).
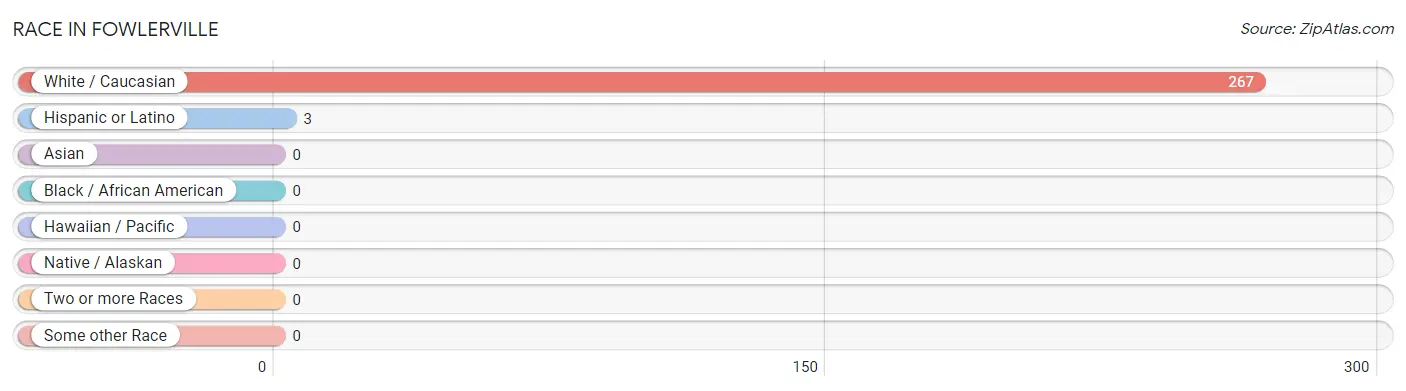
| Race | # Population | % Population |
| Asian | 0 | 0.0% |
| Black / African American | 0 | 0.0% |
| Hawaiian / Pacific | 0 | 0.0% |
| Hispanic or Latino | 3 | 1.1% |
| Native / Alaskan | 0 | 0.0% |
| White / Caucasian | 267 | 100.0% |
| Two or more Races | 0 | 0.0% |
| Some other Race | 0 | 0.0% |
| Total | 267 | 100.0% |
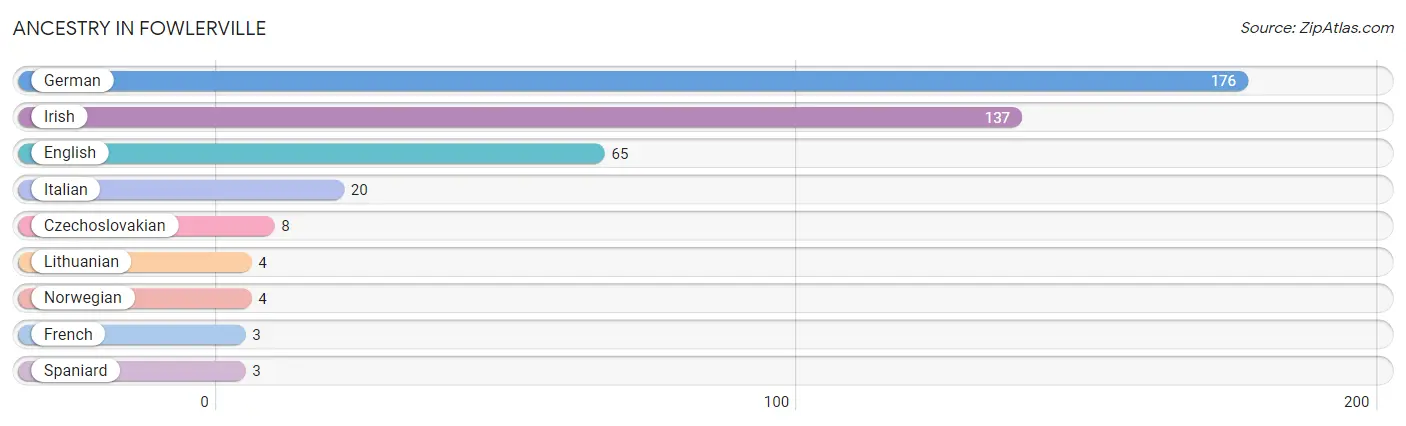
Ancestry in Fowlerville
The most populous ancestries reported in Fowlerville are German (176 | 65.9%), Irish (137 | 51.3%), English (65 | 24.3%), Italian (20 | 7.5%), and Czechoslovakian (8 | 3.0%), together accounting for 152.1% of all Fowlerville residents.
| Ancestry | # Population | % Population |
| Czechoslovakian | 8 | 3.0% |
| English | 65 | 24.3% |
| French | 3 | 1.1% |
| German | 176 | 65.9% |
| Irish | 137 | 51.3% |
| Italian | 20 | 7.5% |
| Lithuanian | 4 | 1.5% |
| Norwegian | 4 | 1.5% |
| Spaniard | 3 | 1.1% | View All 9 Rows |
Immigrants in Fowlerville

| Immigration Origin | # Population | % Population | View All 0 Rows |
Sex and Age in Fowlerville
Sex and Age in Fowlerville
The most populous age groups in Fowlerville are 5 to 9 Years (43 | 35.8%) for men and 40 to 44 Years (36 | 24.5%) for women.
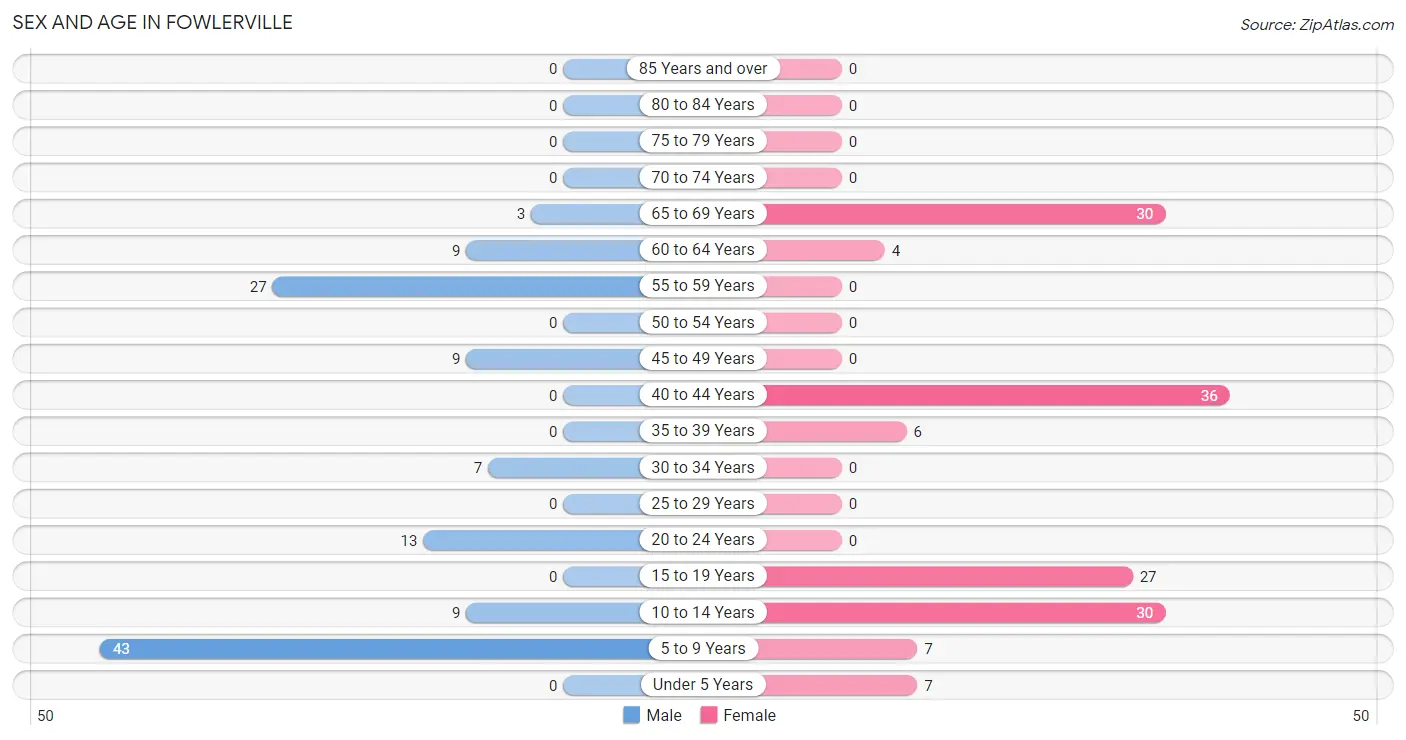
| Age Bracket | Male | Female |
| Under 5 Years | 0 (0.0%) | 7 (4.8%) |
| 5 to 9 Years | 43 (35.8%) | 7 (4.8%) |
| 10 to 14 Years | 9 (7.5%) | 30 (20.4%) |
| 15 to 19 Years | 0 (0.0%) | 27 (18.4%) |
| 20 to 24 Years | 13 (10.8%) | 0 (0.0%) |
| 25 to 29 Years | 0 (0.0%) | 0 (0.0%) |
| 30 to 34 Years | 7 (5.8%) | 0 (0.0%) |
| 35 to 39 Years | 0 (0.0%) | 6 (4.1%) |
| 40 to 44 Years | 0 (0.0%) | 36 (24.5%) |
| 45 to 49 Years | 9 (7.5%) | 0 (0.0%) |
| 50 to 54 Years | 0 (0.0%) | 0 (0.0%) |
| 55 to 59 Years | 27 (22.5%) | 0 (0.0%) |
| 60 to 64 Years | 9 (7.5%) | 4 (2.7%) |
| 65 to 69 Years | 3 (2.5%) | 30 (20.4%) |
| 70 to 74 Years | 0 (0.0%) | 0 (0.0%) |
| 75 to 79 Years | 0 (0.0%) | 0 (0.0%) |
| 80 to 84 Years | 0 (0.0%) | 0 (0.0%) |
| 85 Years and over | 0 (0.0%) | 0 (0.0%) |
| Total | 120 (100.0%) | 147 (100.0%) |
Families and Households in Fowlerville
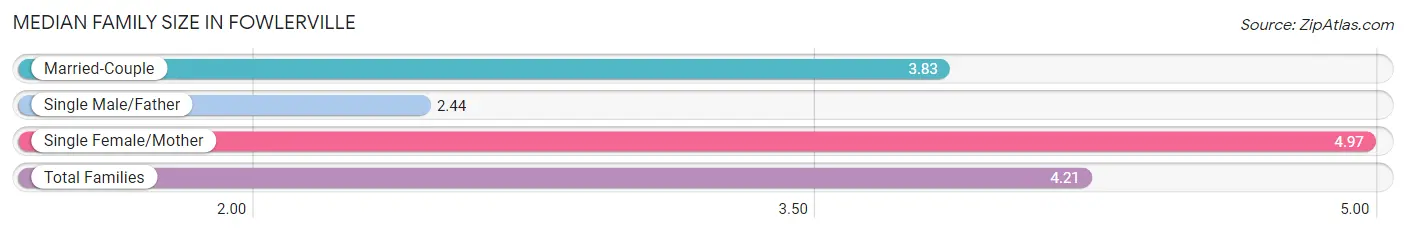
Median Family Size in Fowlerville
The median family size in Fowlerville is 4.21 persons per family, with single female/mother families (30 | 52.6%) accounting for the largest median family size of 4.97 persons per family. On the other hand, single male/father families (9 | 15.8%) represent the smallest median family size with 2.44 persons per family.
| Family Type | # Families | Family Size |
| Married-Couple | 18 (31.6%) | 3.83 |
| Single Male/Father | 9 (15.8%) | 2.44 |
| Single Female/Mother | 30 (52.6%) | 4.97 |
| Total Families | 57 (100.0%) | 4.21 |
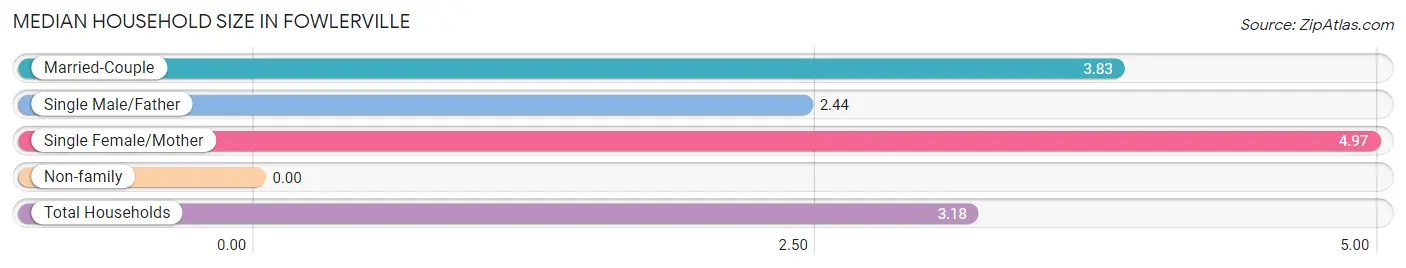
Median Household Size in Fowlerville
| Household Type | # Households | Household Size |
| Married-Couple | 18 (21.4%) | 3.83 |
| Single Male/Father | 9 (10.7%) | 2.44 |
| Single Female/Mother | 30 (35.7%) | 4.97 |
| Non-family | 27 (32.1%) | - |
| Total Households | 84 (100.0%) | 3.18 |
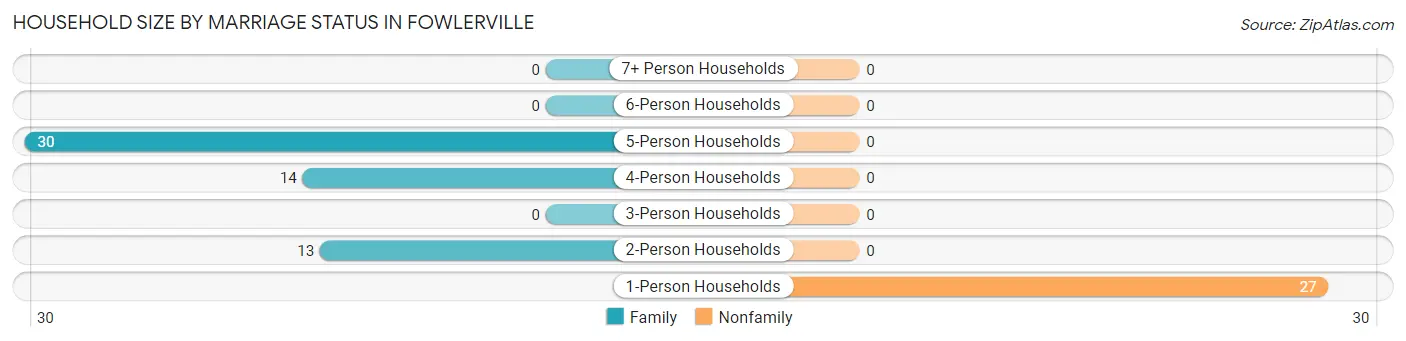
Household Size by Marriage Status in Fowlerville
Out of a total of 84 households in Fowlerville, 57 (67.9%) are family households, while 27 (32.1%) are nonfamily households. The most numerous type of family households are 5-person households, comprising 30, and the most common type of nonfamily households are 1-person households, comprising 27.
| Household Size | Family Households | Nonfamily Households |
| 1-Person Households | - | 27 (32.1%) |
| 2-Person Households | 13 (15.5%) | 0 (0.0%) |
| 3-Person Households | 0 (0.0%) | 0 (0.0%) |
| 4-Person Households | 14 (16.7%) | 0 (0.0%) |
| 5-Person Households | 30 (35.7%) | 0 (0.0%) |
| 6-Person Households | 0 (0.0%) | 0 (0.0%) |
| 7+ Person Households | 0 (0.0%) | 0 (0.0%) |
| Total | 57 (67.9%) | 27 (32.1%) |
Female Fertility in Fowlerville
Fertility by Age in Fowlerville
| Age Bracket | Women with Births | Births / 1,000 Women |
| 15 to 19 years | 0 (0.0%) | 0.0 |
| 20 to 34 years | 0 (0.0%) | 0.0 |
| 35 to 50 years | 0 (0.0%) | 0.0 |
| Total | 0 (0.0%) | 0.0 |
Fertility by Age by Marriage Status in Fowlerville
| Age Bracket | Married | Unmarried |
| 15 to 19 years | 0 (0.0%) | 0 (0.0%) |
| 20 to 34 years | 0 (0.0%) | 0 (0.0%) |
| 35 to 50 years | 0 (0.0%) | 0 (0.0%) |
| Total | 0 (0.0%) | 0 (0.0%) |
Fertility by Education in Fowlerville
| Educational Attainment | Women with Births | Births / 1,000 Women |
| Less than High School | 0 (0.0%) | 0.0 |
| High School Diploma | 0 (0.0%) | 0.0 |
| College or Associate's Degree | 0 (0.0%) | 0.0 |
| Bachelor's Degree | 0 (0.0%) | 0.0 |
| Graduate Degree | 0 (0.0%) | 0.0 |
| Total | 0 (0.0%) | 0.0 |
Fertility by Education by Marriage Status in Fowlerville
| Educational Attainment | Married | Unmarried |
| Less than High School | 0 (0.0%) | 0 (0.0%) |
| High School Diploma | 0 (0.0%) | 0 (0.0%) |
| College or Associate's Degree | 0 (0.0%) | 0 (0.0%) |
| Bachelor's Degree | 0 (0.0%) | 0 (0.0%) |
| Graduate Degree | 0 (0.0%) | 0 (0.0%) |
| Total | 0 (0.0%) | 0 (0.0%) |
Employment Characteristics in Fowlerville
Employment by Class of Employer in Fowlerville
Among the 60 employed individuals in Fowlerville, not-for-profit organizations (36 | 60.0%), self-employed (not incorporated) (9 | 15.0%), and local government employees (9 | 15.0%) make up the most common classes of employment.
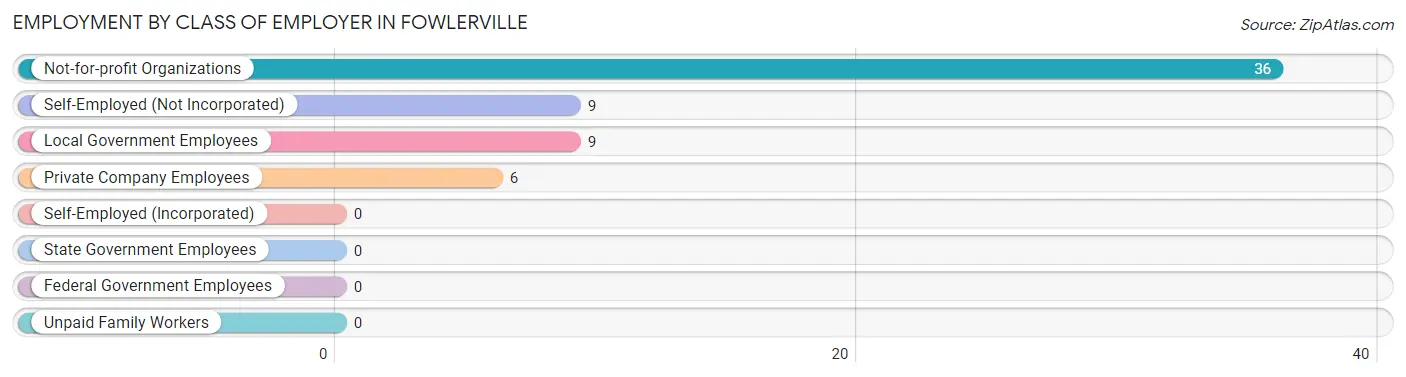
| Employer Class | # Employees | % Employees |
| Private Company Employees | 6 | 10.0% |
| Self-Employed (Incorporated) | 0 | 0.0% |
| Self-Employed (Not Incorporated) | 9 | 15.0% |
| Not-for-profit Organizations | 36 | 60.0% |
| Local Government Employees | 9 | 15.0% |
| State Government Employees | 0 | 0.0% |
| Federal Government Employees | 0 | 0.0% |
| Unpaid Family Workers | 0 | 0.0% |
| Total | 60 | 100.0% |
Employment Status by Age in Fowlerville
According to the labor force statistics for Fowlerville, out of the total population over 16 years of age (144), 46.5% or 67 individuals are in the labor force, with 10.4% or 7 of them unemployed. The age group with the highest labor force participation rate is 30 to 34 years, with 100.0% or 7 individuals in the labor force. Within the labor force, the 30 to 34 years age range has the highest percentage of unemployed individuals, with 100.0% or 7 of them being unemployed.
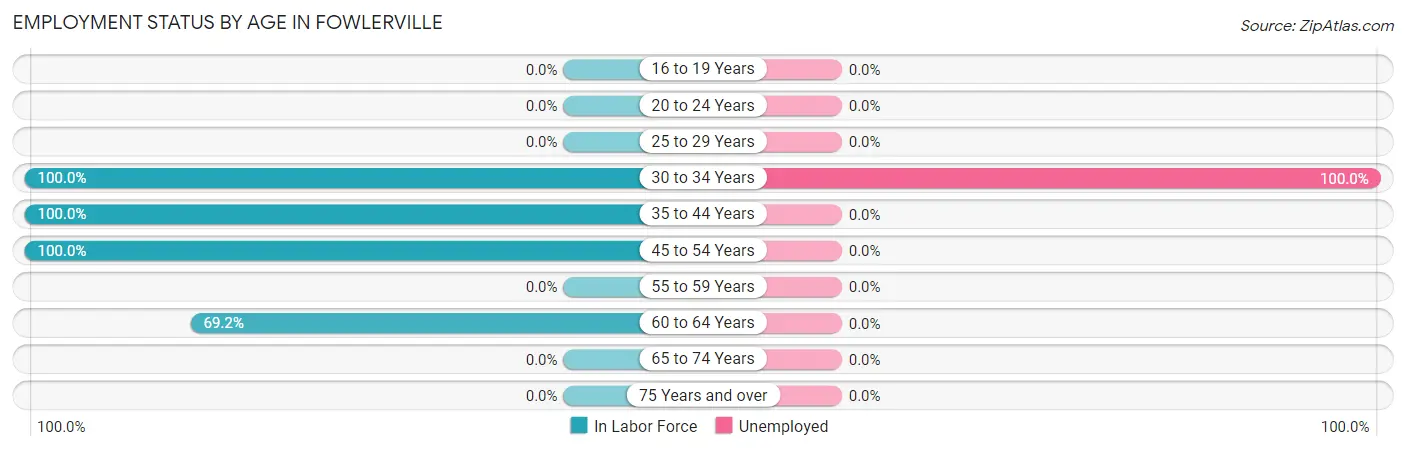
| Age Bracket | In Labor Force | Unemployed |
| 16 to 19 Years | 0 (0.0%) | 0 (0.0%) |
| 20 to 24 Years | 0 (0.0%) | 0 (0.0%) |
| 25 to 29 Years | 0 (0.0%) | 0 (0.0%) |
| 30 to 34 Years | 7 (100.0%) | 7 (100.0%) |
| 35 to 44 Years | 42 (100.0%) | 0 (0.0%) |
| 45 to 54 Years | 9 (100.0%) | 0 (0.0%) |
| 55 to 59 Years | 0 (0.0%) | 0 (0.0%) |
| 60 to 64 Years | 9 (69.2%) | 0 (0.0%) |
| 65 to 74 Years | 0 (0.0%) | 0 (0.0%) |
| 75 Years and over | 0 (0.0%) | 0 (0.0%) |
| Total | 67 (46.5%) | 7 (10.4%) |
Employment Status by Educational Attainment in Fowlerville
According to labor force statistics for Fowlerville, 68.4% of individuals (67) out of the total population between 25 and 64 years of age (98) are in the labor force, with 10.4% or 7 of them being unemployed. The group with the highest labor force participation rate are those with the educational attainment of college / associate degree, with 100.0% or 45 individuals in the labor force. Within the labor force, individuals with high school diploma education have the highest percentage of unemployment, with 100.0% or 7 of them being unemployed.
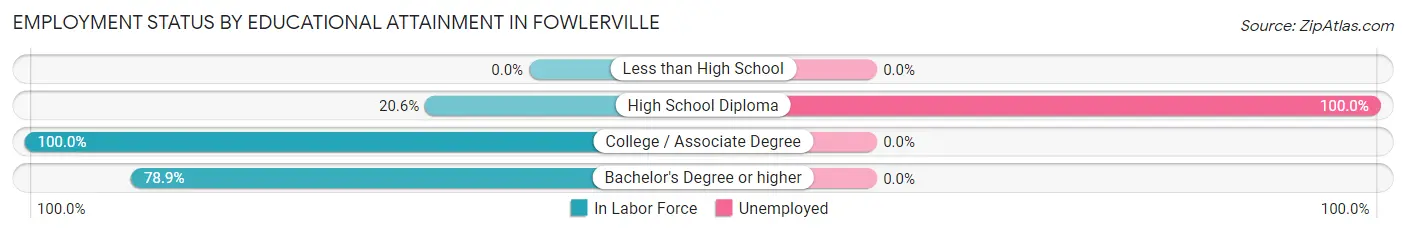
| Educational Attainment | In Labor Force | Unemployed |
| Less than High School | 0 (0.0%) | 0 (0.0%) |
| High School Diploma | 7 (20.6%) | 34 (100.0%) |
| College / Associate Degree | 45 (100.0%) | 0 (0.0%) |
| Bachelor's Degree or higher | 15 (78.9%) | 0 (0.0%) |
| Total | 67 (68.4%) | 10 (10.4%) |
Employment Occupations by Sex in Fowlerville
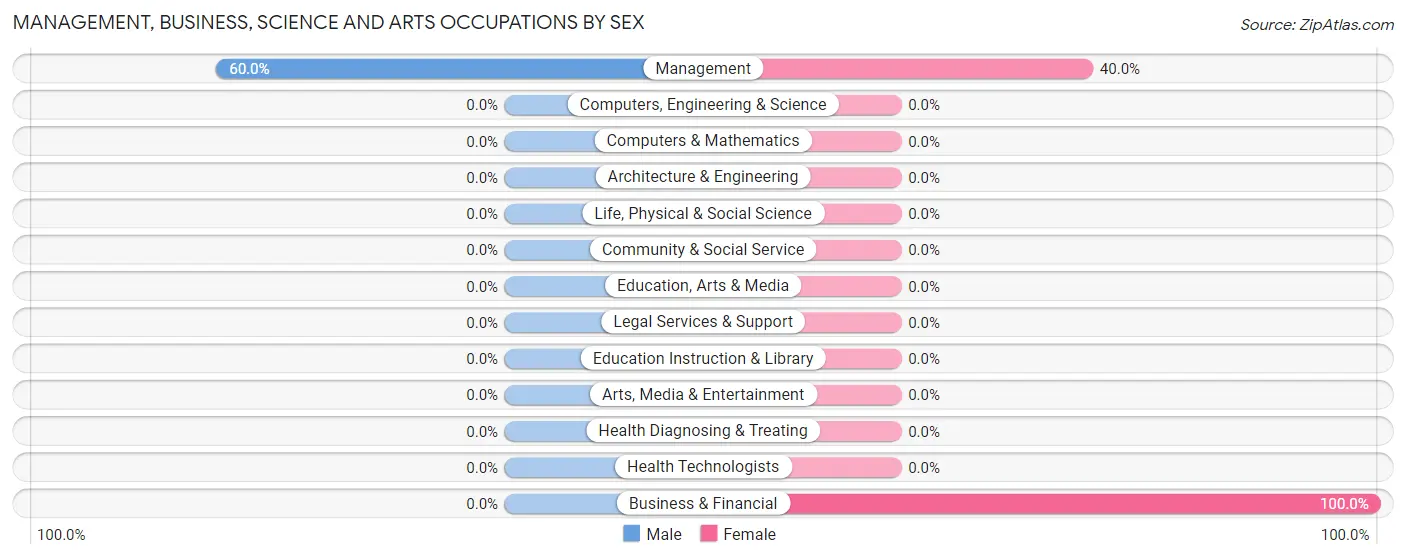
Management, Business, Science and Arts Occupations
The most common Management, Business, Science and Arts occupations in Fowlerville are Management (15 | 25.0%), and Business & Financial (8 | 13.3%).
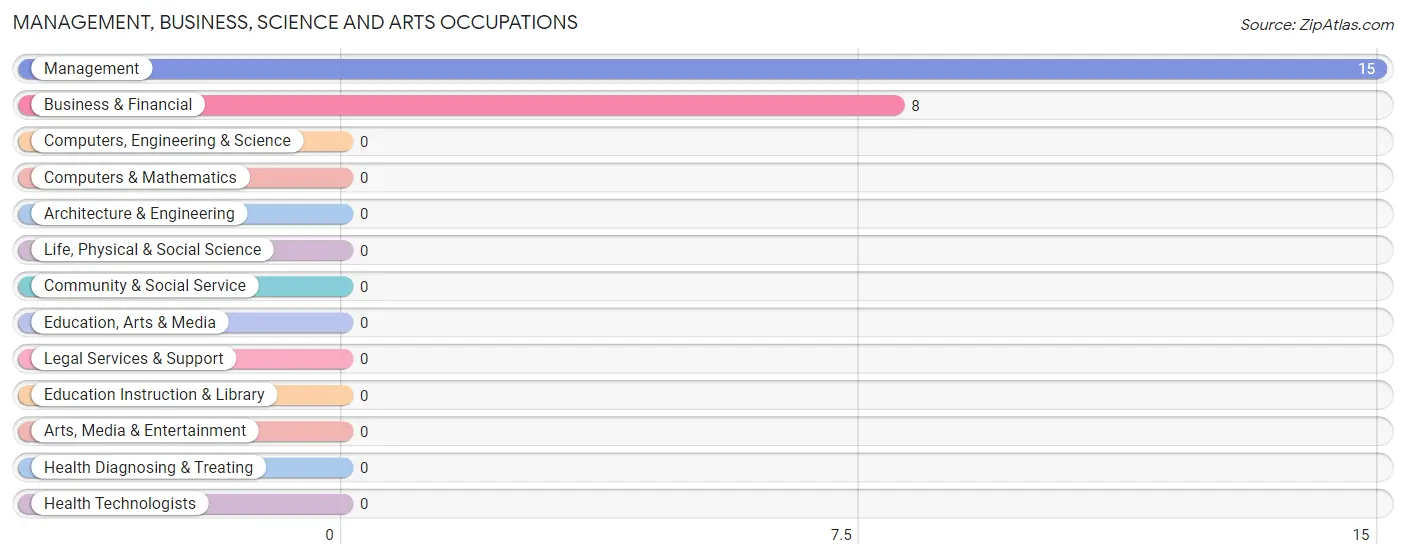
Management, Business, Science and Arts Occupations by Sex
| Occupation | Male | Female |
| Management | 9 (60.0%) | 6 (40.0%) |
| Business & Financial | 0 (0.0%) | 8 (100.0%) |
| Computers, Engineering & Science | 0 (0.0%) | 0 (0.0%) |
| Computers & Mathematics | 0 (0.0%) | 0 (0.0%) |
| Architecture & Engineering | 0 (0.0%) | 0 (0.0%) |
| Life, Physical & Social Science | 0 (0.0%) | 0 (0.0%) |
| Community & Social Service | 0 (0.0%) | 0 (0.0%) |
| Education, Arts & Media | 0 (0.0%) | 0 (0.0%) |
| Legal Services & Support | 0 (0.0%) | 0 (0.0%) |
| Education Instruction & Library | 0 (0.0%) | 0 (0.0%) |
| Arts, Media & Entertainment | 0 (0.0%) | 0 (0.0%) |
| Health Diagnosing & Treating | 0 (0.0%) | 0 (0.0%) |
| Health Technologists | 0 (0.0%) | 0 (0.0%) |
| Total (Category) | 9 (39.1%) | 14 (60.9%) |
| Total (Overall) | 18 (30.0%) | 42 (70.0%) |
Services Occupations
The most common Services occupations in Fowlerville are , and Healthcare Support (28 | 46.7%).
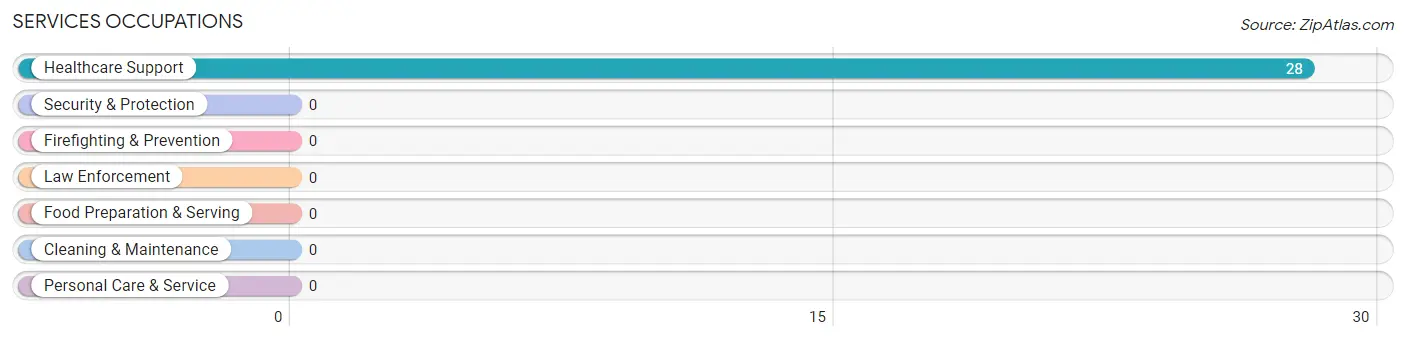
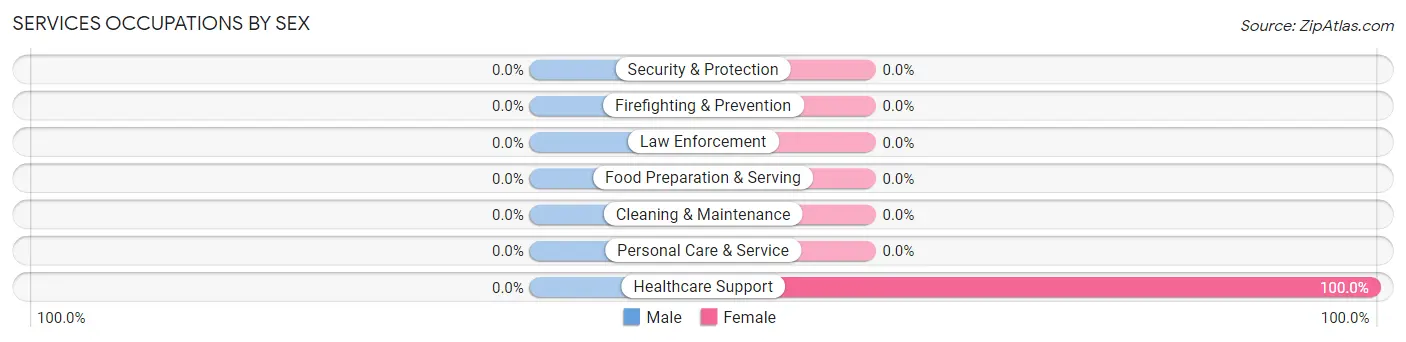
Services Occupations by Sex
| Occupation | Male | Female |
| Healthcare Support | 0 (0.0%) | 28 (100.0%) |
| Security & Protection | 0 (0.0%) | 0 (0.0%) |
| Firefighting & Prevention | 0 (0.0%) | 0 (0.0%) |
| Law Enforcement | 0 (0.0%) | 0 (0.0%) |
| Food Preparation & Serving | 0 (0.0%) | 0 (0.0%) |
| Cleaning & Maintenance | 0 (0.0%) | 0 (0.0%) |
| Personal Care & Service | 0 (0.0%) | 0 (0.0%) |
| Total (Category) | 0 (0.0%) | 28 (100.0%) |
| Total (Overall) | 18 (30.0%) | 42 (70.0%) |
Sales and Office Occupations
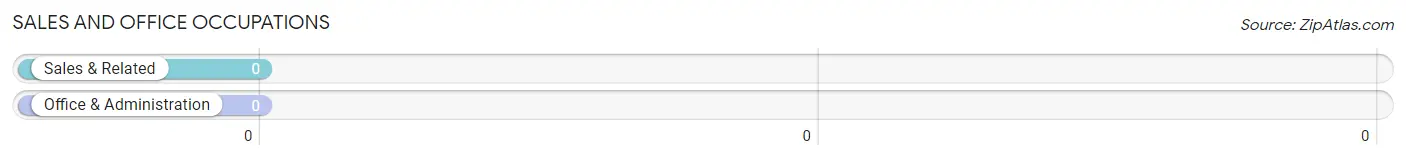
Sales and Office Occupations by Sex
| Occupation | Male | Female |
| Sales & Related | 0 (0.0%) | 0 (0.0%) |
| Office & Administration | 0 (0.0%) | 0 (0.0%) |
| Total (Category) | 0 (0.0%) | 0 (0.0%) |
| Total (Overall) | 18 (30.0%) | 42 (70.0%) |
Natural Resources, Construction and Maintenance Occupations
The most common Natural Resources, Construction and Maintenance occupations in Fowlerville are , and Construction & Extraction (9 | 15.0%).
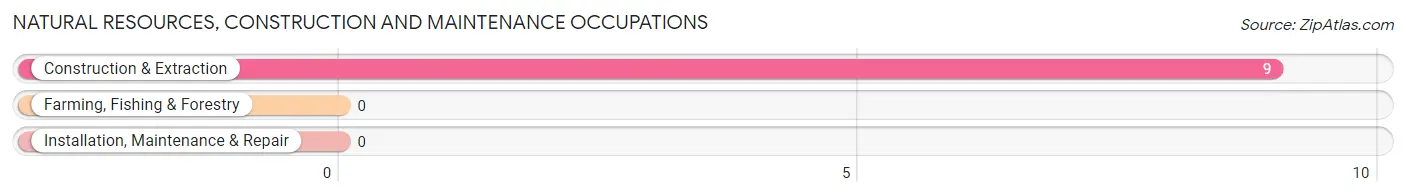
Natural Resources, Construction and Maintenance Occupations by Sex
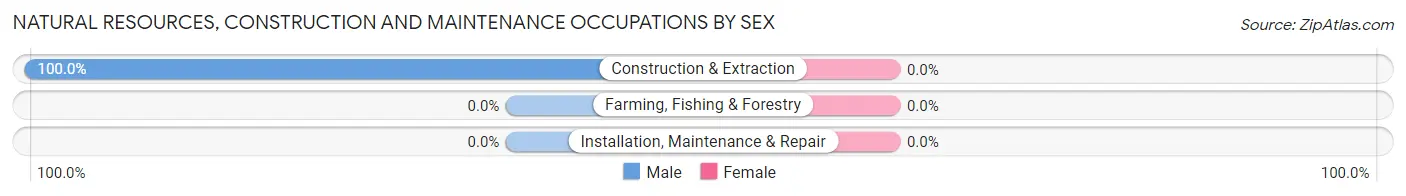
| Occupation | Male | Female |
| Farming, Fishing & Forestry | 0 (0.0%) | 0 (0.0%) |
| Construction & Extraction | 9 (100.0%) | 0 (0.0%) |
| Installation, Maintenance & Repair | 0 (0.0%) | 0 (0.0%) |
| Total (Category) | 9 (100.0%) | 0 (0.0%) |
| Total (Overall) | 18 (30.0%) | 42 (70.0%) |
Production, Transportation and Moving Occupations
Production, Transportation and Moving Occupations by Sex
| Occupation | Male | Female |
| Production | 0 (0.0%) | 0 (0.0%) |
| Transportation | 0 (0.0%) | 0 (0.0%) |
| Material Moving | 0 (0.0%) | 0 (0.0%) |
| Total (Category) | 0 (0.0%) | 0 (0.0%) |
| Total (Overall) | 18 (30.0%) | 42 (70.0%) |
Employment Industries by Sex in Fowlerville
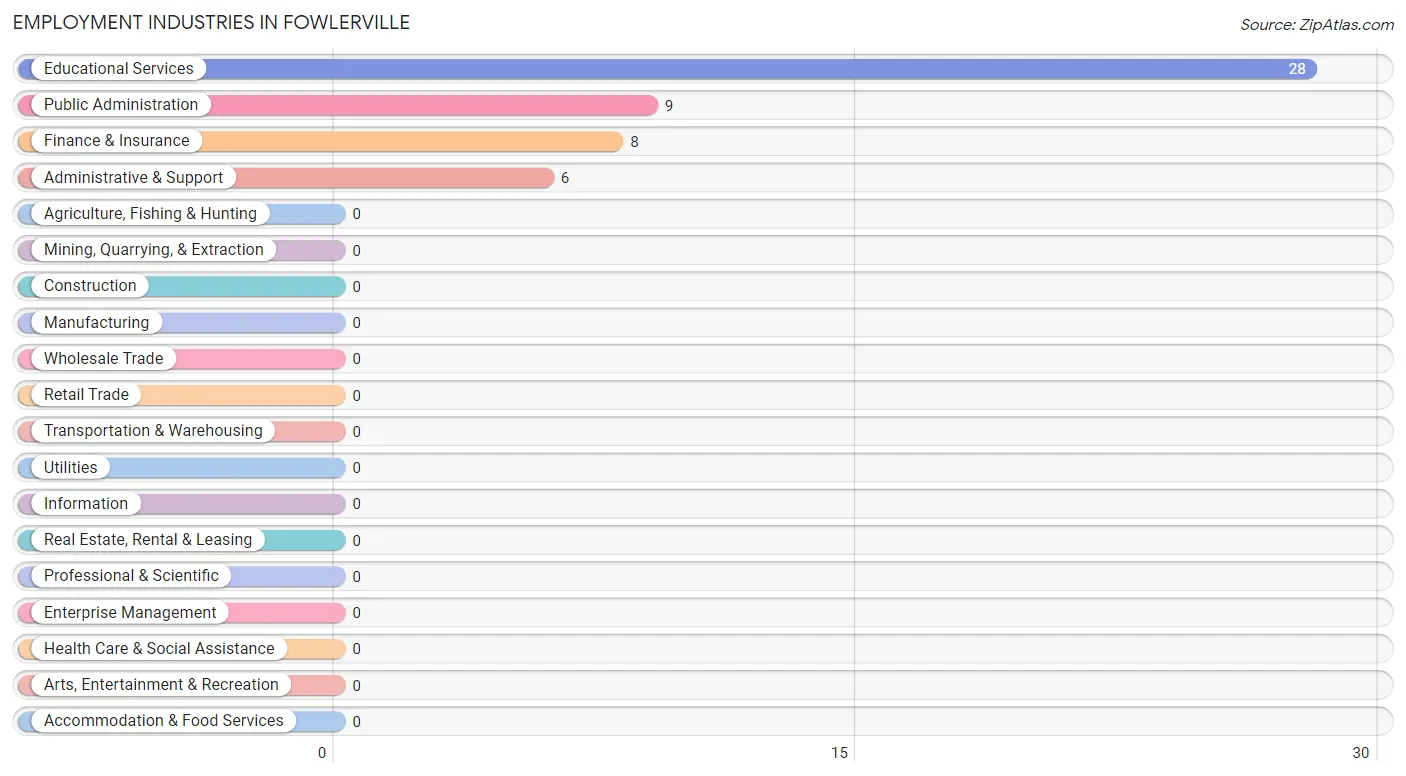
Employment Industries in Fowlerville
The major employment industries in Fowlerville include Educational Services (28 | 46.7%), Public Administration (9 | 15.0%), Finance & Insurance (8 | 13.3%), and Administrative & Support (6 | 10.0%).
Employment Industries by Sex in Fowlerville
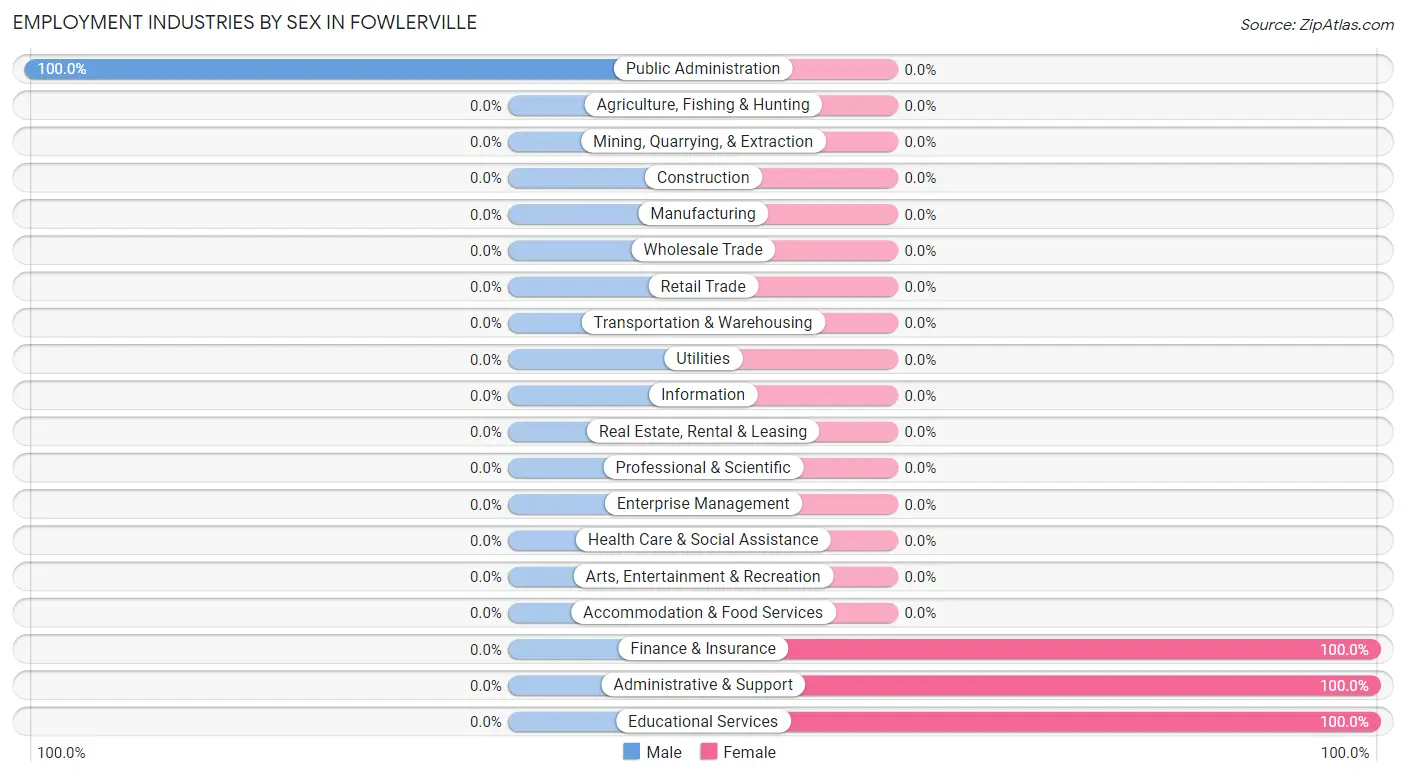
| Industry | Male | Female |
| Agriculture, Fishing & Hunting | 0 (0.0%) | 0 (0.0%) |
| Mining, Quarrying, & Extraction | 0 (0.0%) | 0 (0.0%) |
| Construction | 0 (0.0%) | 0 (0.0%) |
| Manufacturing | 0 (0.0%) | 0 (0.0%) |
| Wholesale Trade | 0 (0.0%) | 0 (0.0%) |
| Retail Trade | 0 (0.0%) | 0 (0.0%) |
| Transportation & Warehousing | 0 (0.0%) | 0 (0.0%) |
| Utilities | 0 (0.0%) | 0 (0.0%) |
| Information | 0 (0.0%) | 0 (0.0%) |
| Finance & Insurance | 0 (0.0%) | 8 (100.0%) |
| Real Estate, Rental & Leasing | 0 (0.0%) | 0 (0.0%) |
| Professional & Scientific | 0 (0.0%) | 0 (0.0%) |
| Enterprise Management | 0 (0.0%) | 0 (0.0%) |
| Administrative & Support | 0 (0.0%) | 6 (100.0%) |
| Educational Services | 0 (0.0%) | 28 (100.0%) |
| Health Care & Social Assistance | 0 (0.0%) | 0 (0.0%) |
| Arts, Entertainment & Recreation | 0 (0.0%) | 0 (0.0%) |
| Accommodation & Food Services | 0 (0.0%) | 0 (0.0%) |
| Public Administration | 9 (100.0%) | 0 (0.0%) |
| Total | 18 (30.0%) | 42 (70.0%) |
Education in Fowlerville
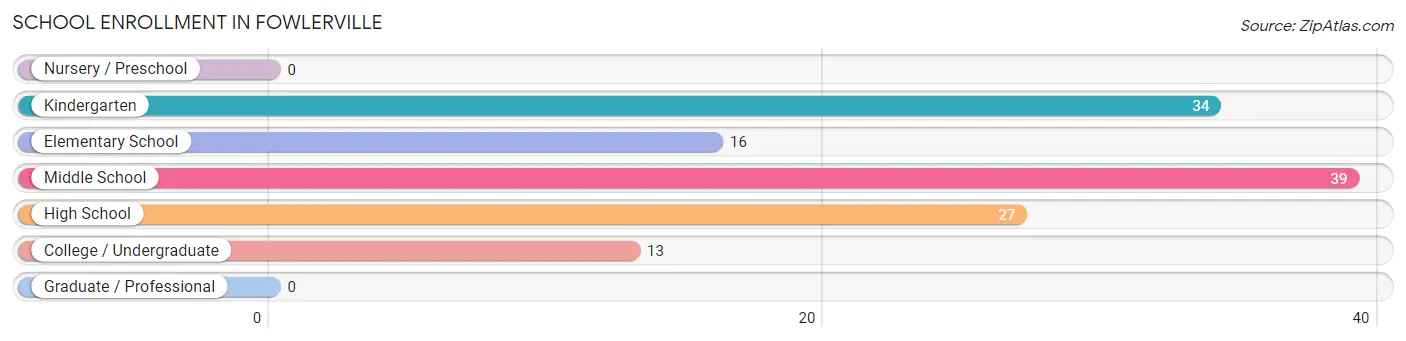
School Enrollment in Fowlerville
The most common levels of schooling among the 129 students in Fowlerville are middle school (39 | 30.2%), kindergarten (34 | 26.4%), and high school (27 | 20.9%).
| School Level | # Students | % Students |
| Nursery / Preschool | 0 | 0.0% |
| Kindergarten | 34 | 26.4% |
| Elementary School | 16 | 12.4% |
| Middle School | 39 | 30.2% |
| High School | 27 | 20.9% |
| College / Undergraduate | 13 | 10.1% |
| Graduate / Professional | 0 | 0.0% |
| Total | 129 | 100.0% |
School Enrollment by Age by Funding Source in Fowlerville
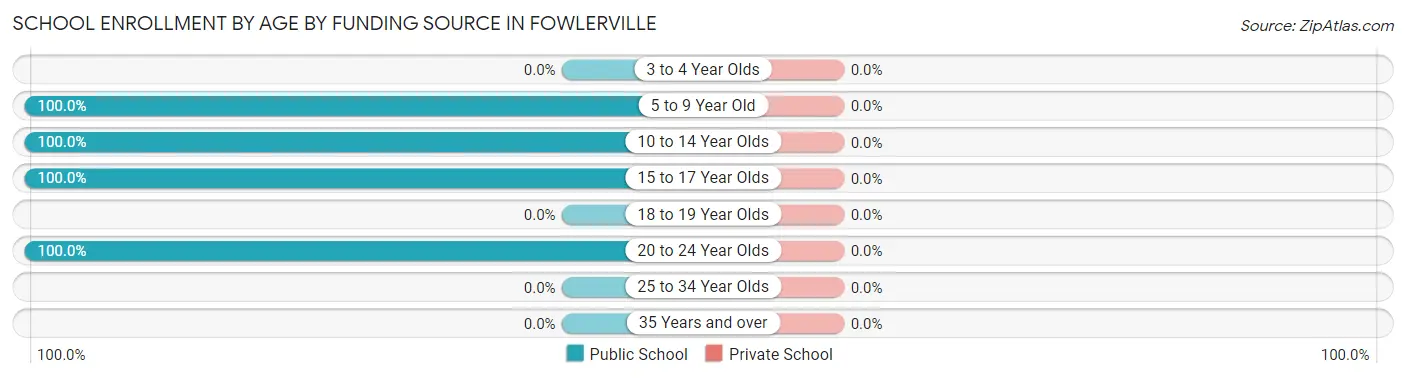
| Age Bracket | Public School | Private School |
| 3 to 4 Year Olds | 0 (0.0%) | 0 (0.0%) |
| 5 to 9 Year Old | 50 (100.0%) | 0 (0.0%) |
| 10 to 14 Year Olds | 39 (100.0%) | 0 (0.0%) |
| 15 to 17 Year Olds | 27 (100.0%) | 0 (0.0%) |
| 18 to 19 Year Olds | 0 (0.0%) | 0 (0.0%) |
| 20 to 24 Year Olds | 13 (100.0%) | 0 (0.0%) |
| 25 to 34 Year Olds | 0 (0.0%) | 0 (0.0%) |
| 35 Years and over | 0 (0.0%) | 0 (0.0%) |
| Total | 129 (100.0%) | 0 (0.0%) |
Educational Attainment by Field of Study in Fowlerville
Education (9 | 40.9%), computers & mathematics (6 | 27.3%), liberal arts & history (4 | 18.2%), and arts & humanities (3 | 13.6%) are the most common fields of study among 22 individuals in Fowlerville who have obtained a bachelor's degree or higher.
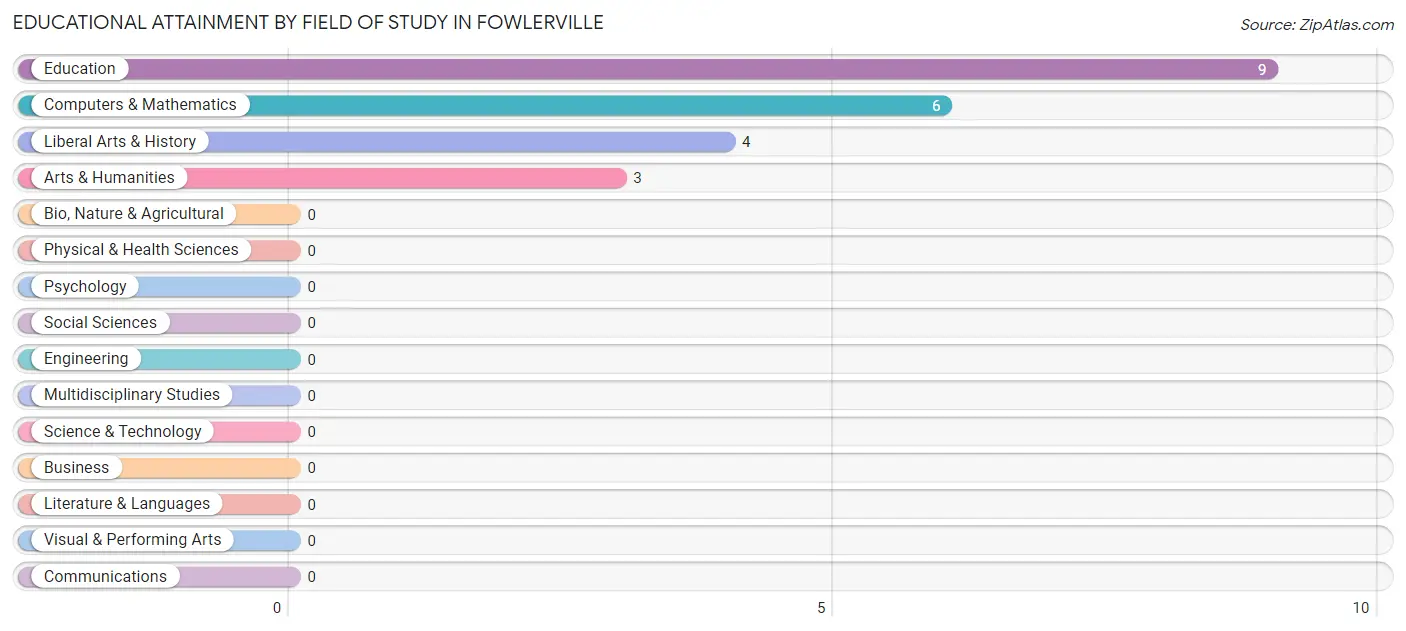
| Field of Study | # Graduates | % Graduates |
| Computers & Mathematics | 6 | 27.3% |
| Bio, Nature & Agricultural | 0 | 0.0% |
| Physical & Health Sciences | 0 | 0.0% |
| Psychology | 0 | 0.0% |
| Social Sciences | 0 | 0.0% |
| Engineering | 0 | 0.0% |
| Multidisciplinary Studies | 0 | 0.0% |
| Science & Technology | 0 | 0.0% |
| Business | 0 | 0.0% |
| Education | 9 | 40.9% |
| Literature & Languages | 0 | 0.0% |
| Liberal Arts & History | 4 | 18.2% |
| Visual & Performing Arts | 0 | 0.0% |
| Communications | 0 | 0.0% |
| Arts & Humanities | 3 | 13.6% |
| Total | 22 | 100.0% |
Transportation & Commute in Fowlerville
Vehicle Availability by Sex in Fowlerville
The most prevalent vehicle ownership categories in Fowlerville are males with 2 vehicles (18, accounting for 100.0%) and females with 2 vehicles (42, making up 42.9%).
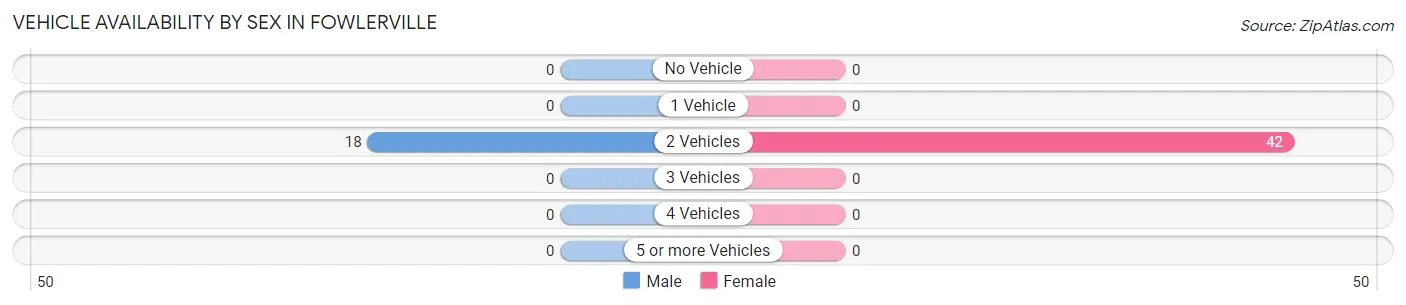
| Vehicles Available | Male | Female |
| No Vehicle | 0 (0.0%) | 0 (0.0%) |
| 1 Vehicle | 0 (0.0%) | 0 (0.0%) |
| 2 Vehicles | 18 (100.0%) | 42 (100.0%) |
| 3 Vehicles | 0 (0.0%) | 0 (0.0%) |
| 4 Vehicles | 0 (0.0%) | 0 (0.0%) |
| 5 or more Vehicles | 0 (0.0%) | 0 (0.0%) |
| Total | 18 (100.0%) | 42 (100.0%) |
Commute Time in Fowlerville
The most frequently occuring commute durations in Fowlerville are 15 to 19 minutes (28 commuters, 51.8%), less than 5 minutes (9 commuters, 16.7%), and 60 to 89 minutes (9 commuters, 16.7%).
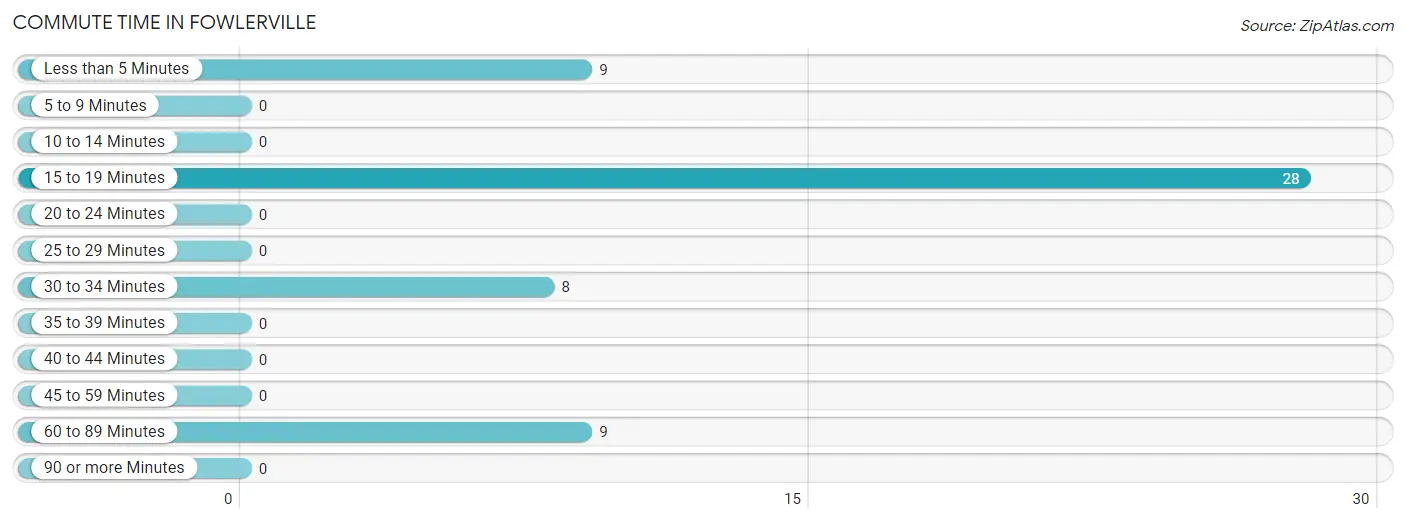
| Commute Time | # Commuters | % Commuters |
| Less than 5 Minutes | 9 | 16.7% |
| 5 to 9 Minutes | 0 | 0.0% |
| 10 to 14 Minutes | 0 | 0.0% |
| 15 to 19 Minutes | 28 | 51.8% |
| 20 to 24 Minutes | 0 | 0.0% |
| 25 to 29 Minutes | 0 | 0.0% |
| 30 to 34 Minutes | 8 | 14.8% |
| 35 to 39 Minutes | 0 | 0.0% |
| 40 to 44 Minutes | 0 | 0.0% |
| 45 to 59 Minutes | 0 | 0.0% |
| 60 to 89 Minutes | 9 | 16.7% |
| 90 or more Minutes | 0 | 0.0% |
Commute Time by Sex in Fowlerville
The most common commute times in Fowlerville are less than 5 minutes (9 commuters, 50.0%) for males and 15 to 19 minutes (28 commuters, 77.8%) for females.
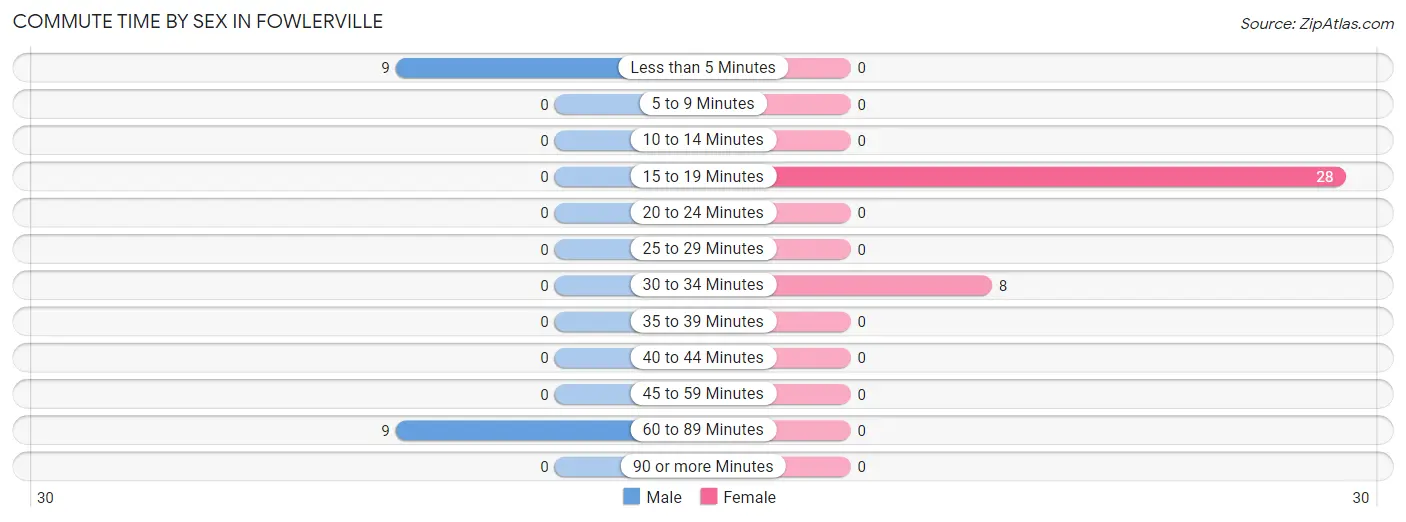
| Commute Time | Male | Female |
| Less than 5 Minutes | 9 (50.0%) | 0 (0.0%) |
| 5 to 9 Minutes | 0 (0.0%) | 0 (0.0%) |
| 10 to 14 Minutes | 0 (0.0%) | 0 (0.0%) |
| 15 to 19 Minutes | 0 (0.0%) | 28 (77.8%) |
| 20 to 24 Minutes | 0 (0.0%) | 0 (0.0%) |
| 25 to 29 Minutes | 0 (0.0%) | 0 (0.0%) |
| 30 to 34 Minutes | 0 (0.0%) | 8 (22.2%) |
| 35 to 39 Minutes | 0 (0.0%) | 0 (0.0%) |
| 40 to 44 Minutes | 0 (0.0%) | 0 (0.0%) |
| 45 to 59 Minutes | 0 (0.0%) | 0 (0.0%) |
| 60 to 89 Minutes | 9 (50.0%) | 0 (0.0%) |
| 90 or more Minutes | 0 (0.0%) | 0 (0.0%) |
Time of Departure to Work by Sex in Fowlerville
The most frequent times of departure to work in Fowlerville are 7:00 AM to 7:29 AM (9, 50.0%) for males and 7:00 AM to 7:29 AM (28, 77.8%) for females.
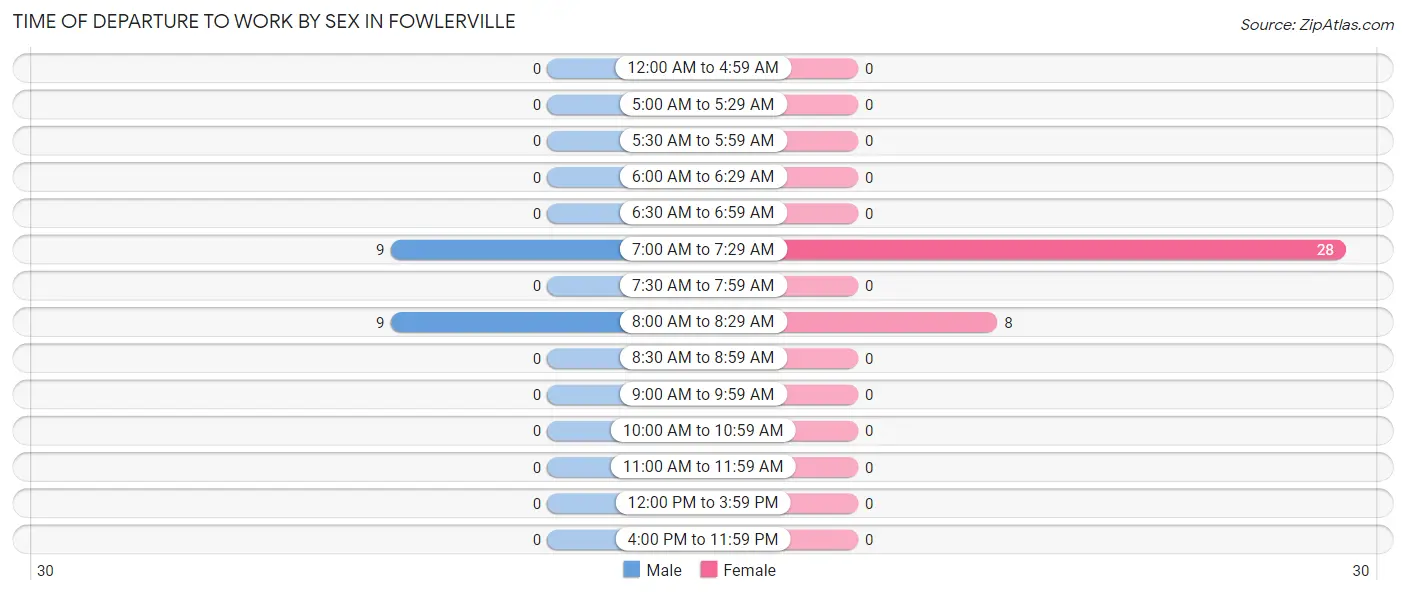
| Time of Departure | Male | Female |
| 12:00 AM to 4:59 AM | 0 (0.0%) | 0 (0.0%) |
| 5:00 AM to 5:29 AM | 0 (0.0%) | 0 (0.0%) |
| 5:30 AM to 5:59 AM | 0 (0.0%) | 0 (0.0%) |
| 6:00 AM to 6:29 AM | 0 (0.0%) | 0 (0.0%) |
| 6:30 AM to 6:59 AM | 0 (0.0%) | 0 (0.0%) |
| 7:00 AM to 7:29 AM | 9 (50.0%) | 28 (77.8%) |
| 7:30 AM to 7:59 AM | 0 (0.0%) | 0 (0.0%) |
| 8:00 AM to 8:29 AM | 9 (50.0%) | 8 (22.2%) |
| 8:30 AM to 8:59 AM | 0 (0.0%) | 0 (0.0%) |
| 9:00 AM to 9:59 AM | 0 (0.0%) | 0 (0.0%) |
| 10:00 AM to 10:59 AM | 0 (0.0%) | 0 (0.0%) |
| 11:00 AM to 11:59 AM | 0 (0.0%) | 0 (0.0%) |
| 12:00 PM to 3:59 PM | 0 (0.0%) | 0 (0.0%) |
| 4:00 PM to 11:59 PM | 0 (0.0%) | 0 (0.0%) |
| Total | 18 (100.0%) | 36 (100.0%) |
Housing Occupancy in Fowlerville
Occupancy by Ownership in Fowlerville
Of the total 84 dwellings in Fowlerville, owner-occupied units account for 57 (67.9%), while renter-occupied units make up 27 (32.1%).
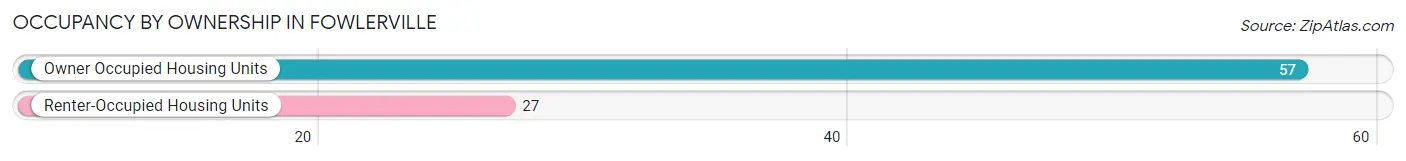
| Occupancy | # Housing Units | % Housing Units |
| Owner Occupied Housing Units | 57 | 67.9% |
| Renter-Occupied Housing Units | 27 | 32.1% |
| Total Occupied Housing Units | 84 | 100.0% |
Occupancy by Household Size in Fowlerville
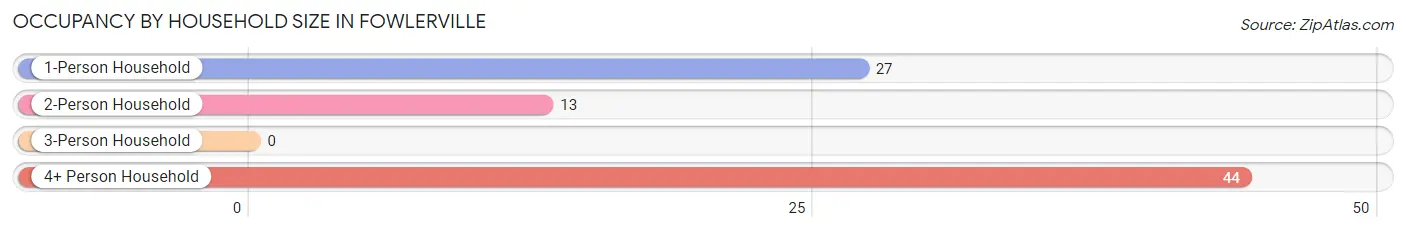
| Household Size | # Housing Units | % Housing Units |
| 1-Person Household | 27 | 32.1% |
| 2-Person Household | 13 | 15.5% |
| 3-Person Household | 0 | 0.0% |
| 4+ Person Household | 44 | 52.4% |
| Total Housing Units | 84 | 100.0% |
Occupancy by Ownership by Household Size in Fowlerville
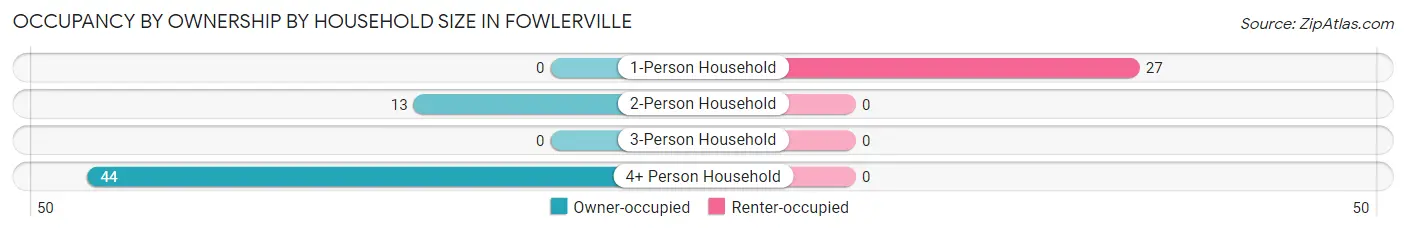
| Household Size | Owner-occupied | Renter-occupied |
| 1-Person Household | 0 (0.0%) | 27 (100.0%) |
| 2-Person Household | 13 (100.0%) | 0 (0.0%) |
| 3-Person Household | 0 (0.0%) | 0 (0.0%) |
| 4+ Person Household | 44 (100.0%) | 0 (0.0%) |
| Total Housing Units | 57 (67.9%) | 27 (32.1%) |
Occupancy by Educational Attainment in Fowlerville
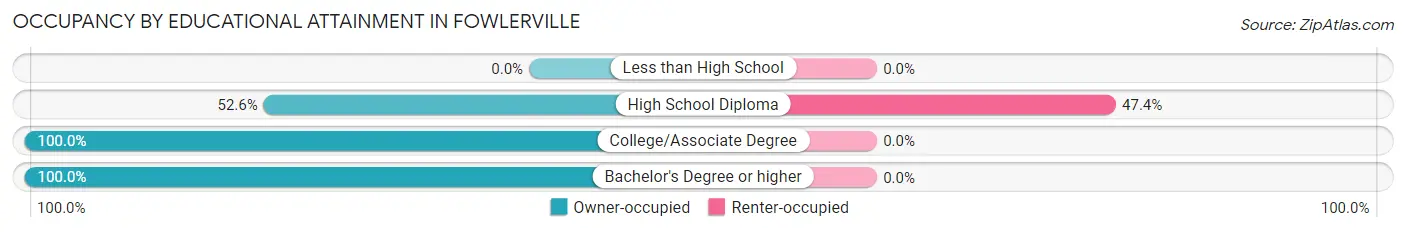
| Household Size | Owner-occupied | Renter-occupied |
| Less than High School | 0 (0.0%) | 0 (0.0%) |
| High School Diploma | 30 (52.6%) | 27 (47.4%) |
| College/Associate Degree | 8 (100.0%) | 0 (0.0%) |
| Bachelor's Degree or higher | 19 (100.0%) | 0 (0.0%) |
Occupancy by Age of Householder in Fowlerville
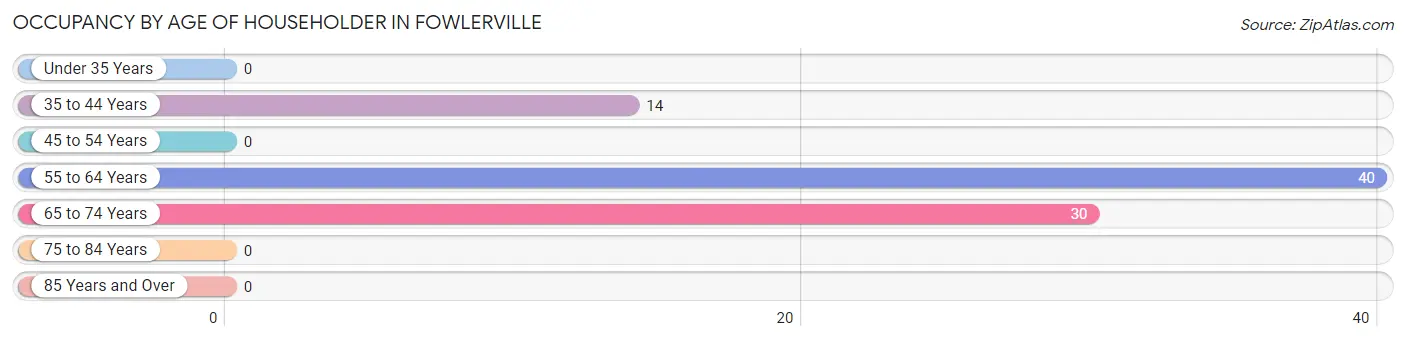
| Age Bracket | # Households | % Households |
| Under 35 Years | 0 | 0.0% |
| 35 to 44 Years | 14 | 16.7% |
| 45 to 54 Years | 0 | 0.0% |
| 55 to 64 Years | 40 | 47.6% |
| 65 to 74 Years | 30 | 35.7% |
| 75 to 84 Years | 0 | 0.0% |
| 85 Years and Over | 0 | 0.0% |
| Total | 84 | 100.0% |
Housing Finances in Fowlerville
Median Income by Occupancy in Fowlerville
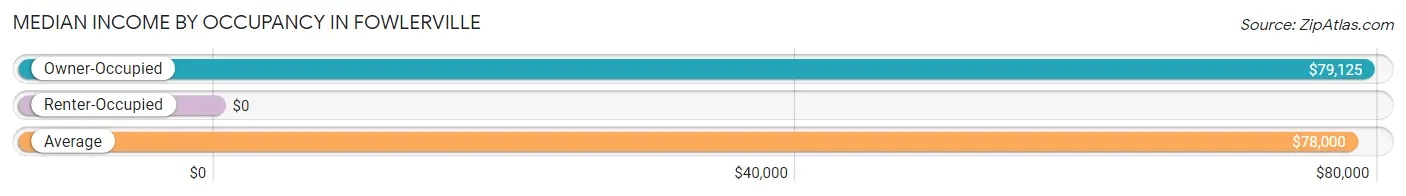
| Occupancy Type | # Households | Median Income |
| Owner-Occupied | 57 (67.9%) | $79,125 |
| Renter-Occupied | 27 (32.1%) | $0 |
| Average | 84 (100.0%) | $78,000 |
Occupancy by Householder Income Bracket in Fowlerville
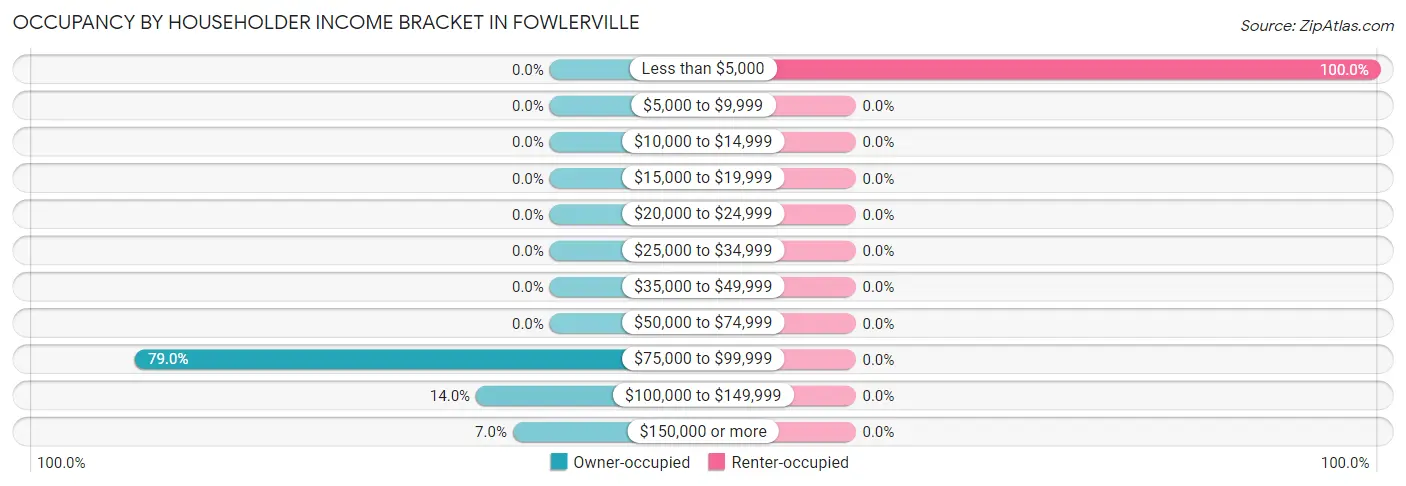
| Income Bracket | Owner-occupied | Renter-occupied |
| Less than $5,000 | 0 (0.0%) | 27 (100.0%) |
| $5,000 to $9,999 | 0 (0.0%) | 0 (0.0%) |
| $10,000 to $14,999 | 0 (0.0%) | 0 (0.0%) |
| $15,000 to $19,999 | 0 (0.0%) | 0 (0.0%) |
| $20,000 to $24,999 | 0 (0.0%) | 0 (0.0%) |
| $25,000 to $34,999 | 0 (0.0%) | 0 (0.0%) |
| $35,000 to $49,999 | 0 (0.0%) | 0 (0.0%) |
| $50,000 to $74,999 | 0 (0.0%) | 0 (0.0%) |
| $75,000 to $99,999 | 45 (78.9%) | 0 (0.0%) |
| $100,000 to $149,999 | 8 (14.0%) | 0 (0.0%) |
| $150,000 or more | 4 (7.0%) | 0 (0.0%) |
| Total | 57 (100.0%) | 27 (100.0%) |
Monthly Housing Cost Tiers in Fowlerville
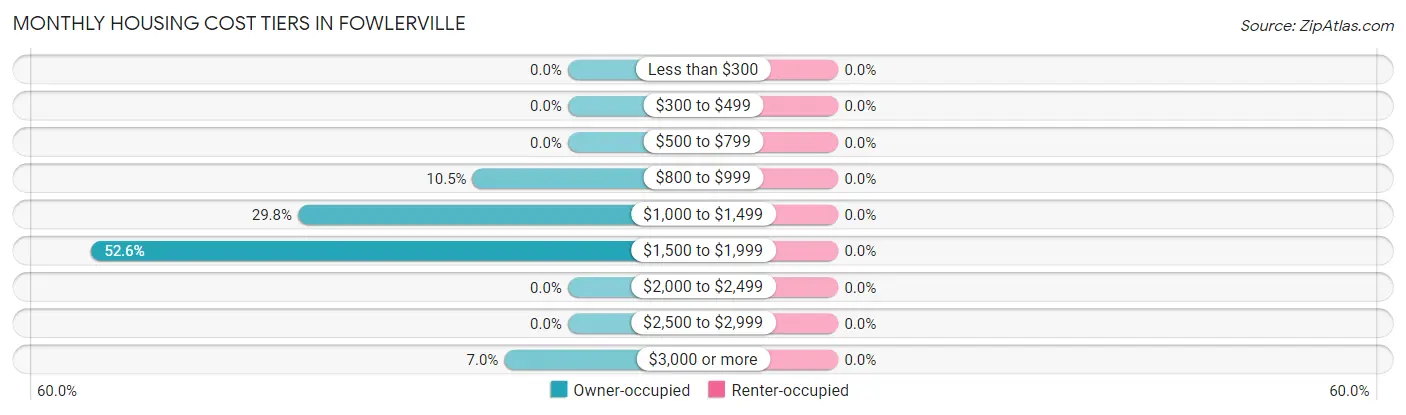
| Monthly Cost | Owner-occupied | Renter-occupied |
| Less than $300 | 0 (0.0%) | 0 (0.0%) |
| $300 to $499 | 0 (0.0%) | 0 (0.0%) |
| $500 to $799 | 0 (0.0%) | 0 (0.0%) |
| $800 to $999 | 6 (10.5%) | 0 (0.0%) |
| $1,000 to $1,499 | 17 (29.8%) | 0 (0.0%) |
| $1,500 to $1,999 | 30 (52.6%) | 0 (0.0%) |
| $2,000 to $2,499 | 0 (0.0%) | 0 (0.0%) |
| $2,500 to $2,999 | 0 (0.0%) | 0 (0.0%) |
| $3,000 or more | 4 (7.0%) | 0 (0.0%) |
| Total | 57 (100.0%) | 27 (100.0%) |
Physical Housing Characteristics in Fowlerville
Housing Structures in Fowlerville
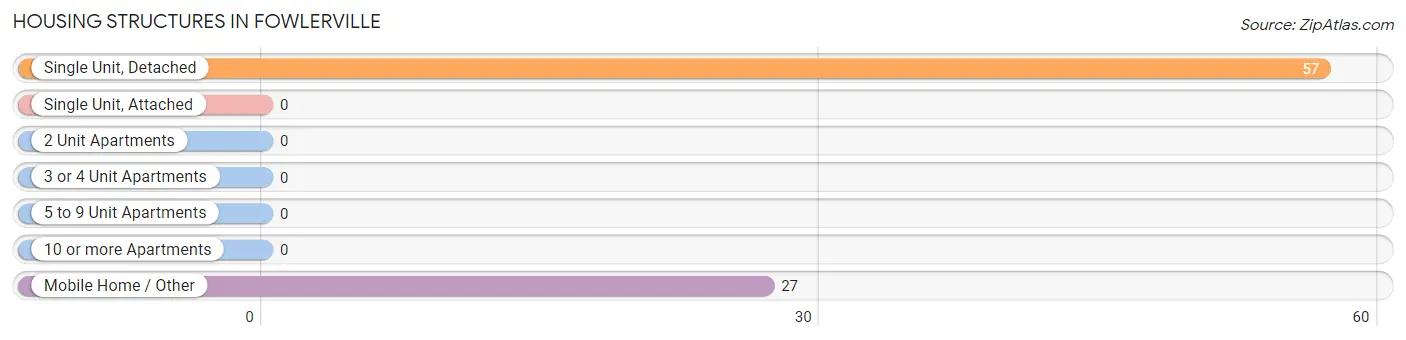
| Structure Type | # Housing Units | % Housing Units |
| Single Unit, Detached | 57 | 67.9% |
| Single Unit, Attached | 0 | 0.0% |
| 2 Unit Apartments | 0 | 0.0% |
| 3 or 4 Unit Apartments | 0 | 0.0% |
| 5 to 9 Unit Apartments | 0 | 0.0% |
| 10 or more Apartments | 0 | 0.0% |
| Mobile Home / Other | 27 | 32.1% |
| Total | 84 | 100.0% |
Housing Structures by Occupancy in Fowlerville
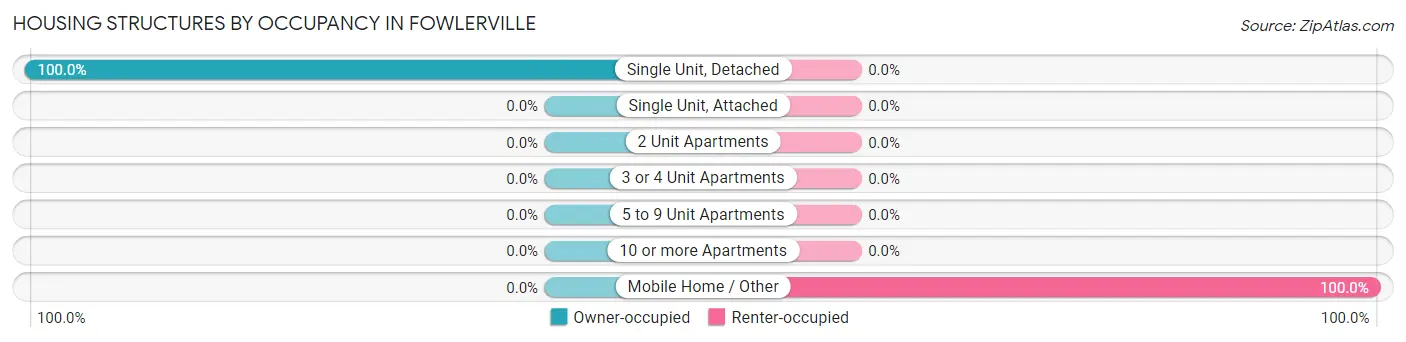
| Structure Type | Owner-occupied | Renter-occupied |
| Single Unit, Detached | 57 (100.0%) | 0 (0.0%) |
| Single Unit, Attached | 0 (0.0%) | 0 (0.0%) |
| 2 Unit Apartments | 0 (0.0%) | 0 (0.0%) |
| 3 or 4 Unit Apartments | 0 (0.0%) | 0 (0.0%) |
| 5 to 9 Unit Apartments | 0 (0.0%) | 0 (0.0%) |
| 10 or more Apartments | 0 (0.0%) | 0 (0.0%) |
| Mobile Home / Other | 0 (0.0%) | 27 (100.0%) |
| Total | 57 (67.9%) | 27 (32.1%) |
Housing Structures by Number of Rooms in Fowlerville
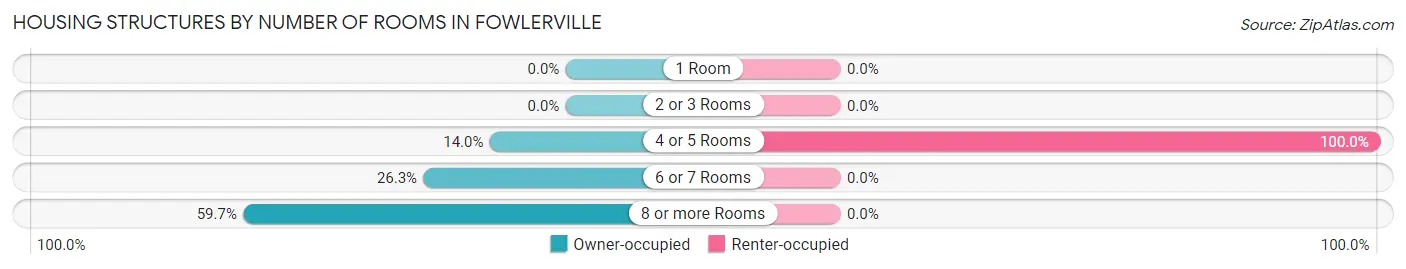
| Number of Rooms | Owner-occupied | Renter-occupied |
| 1 Room | 0 (0.0%) | 0 (0.0%) |
| 2 or 3 Rooms | 0 (0.0%) | 0 (0.0%) |
| 4 or 5 Rooms | 8 (14.0%) | 27 (100.0%) |
| 6 or 7 Rooms | 15 (26.3%) | 0 (0.0%) |
| 8 or more Rooms | 34 (59.7%) | 0 (0.0%) |
| Total | 57 (100.0%) | 27 (100.0%) |
Housing Structure by Heating Type in Fowlerville
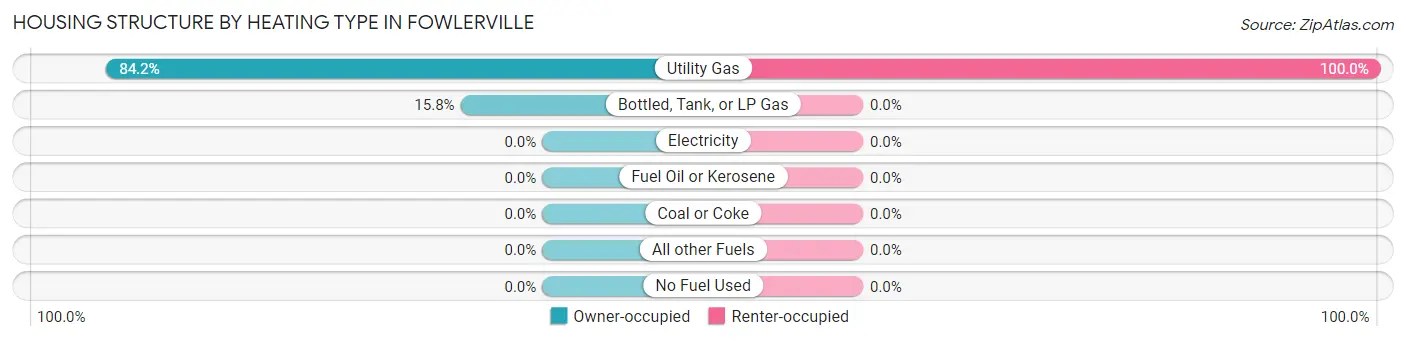
| Heating Type | Owner-occupied | Renter-occupied |
| Utility Gas | 48 (84.2%) | 27 (100.0%) |
| Bottled, Tank, or LP Gas | 9 (15.8%) | 0 (0.0%) |
| Electricity | 0 (0.0%) | 0 (0.0%) |
| Fuel Oil or Kerosene | 0 (0.0%) | 0 (0.0%) |
| Coal or Coke | 0 (0.0%) | 0 (0.0%) |
| All other Fuels | 0 (0.0%) | 0 (0.0%) |
| No Fuel Used | 0 (0.0%) | 0 (0.0%) |
| Total | 57 (100.0%) | 27 (100.0%) |
Household Vehicle Usage in Fowlerville
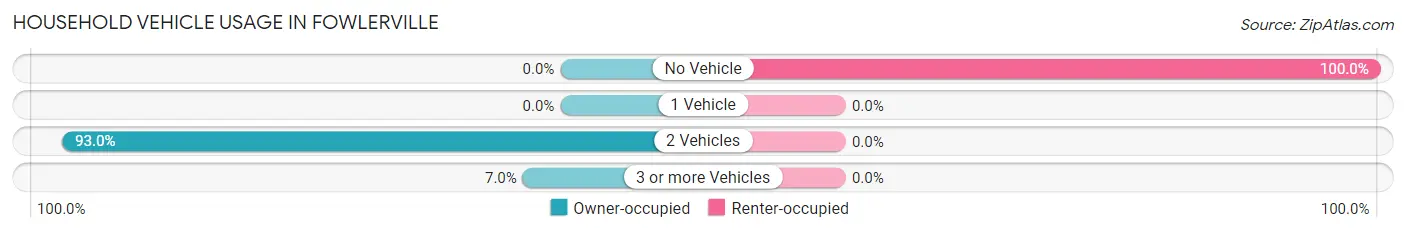
| Vehicles per Household | Owner-occupied | Renter-occupied |
| No Vehicle | 0 (0.0%) | 27 (100.0%) |
| 1 Vehicle | 0 (0.0%) | 0 (0.0%) |
| 2 Vehicles | 53 (93.0%) | 0 (0.0%) |
| 3 or more Vehicles | 4 (7.0%) | 0 (0.0%) |
| Total | 57 (100.0%) | 27 (100.0%) |
Real Estate & Mortgages in Fowlerville
Real Estate and Mortgage Overview in Fowlerville
| Characteristic | Without Mortgage | With Mortgage |
| Housing Units | 4 | 53 |
| Median Property Value | - | - |
| Median Household Income | - | - |
| Monthly Housing Costs | - | - |
| Real Estate Taxes | - | - |
Property Value by Mortgage Status in Fowlerville
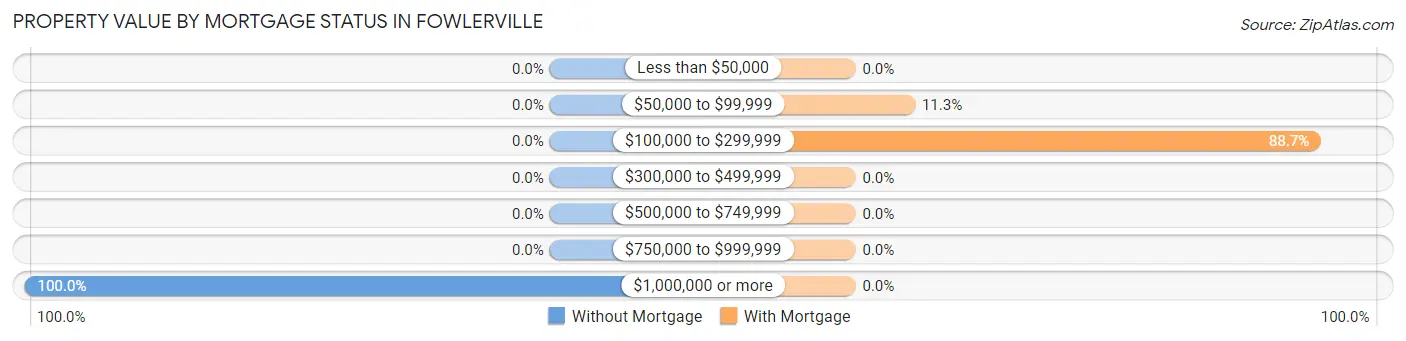
| Property Value | Without Mortgage | With Mortgage |
| Less than $50,000 | 0 (0.0%) | 0 (0.0%) |
| $50,000 to $99,999 | 0 (0.0%) | 6 (11.3%) |
| $100,000 to $299,999 | 0 (0.0%) | 47 (88.7%) |
| $300,000 to $499,999 | 0 (0.0%) | 0 (0.0%) |
| $500,000 to $749,999 | 0 (0.0%) | 0 (0.0%) |
| $750,000 to $999,999 | 0 (0.0%) | 0 (0.0%) |
| $1,000,000 or more | 4 (100.0%) | 0 (0.0%) |
| Total | 4 (100.0%) | 53 (100.0%) |
Household Income by Mortgage Status in Fowlerville
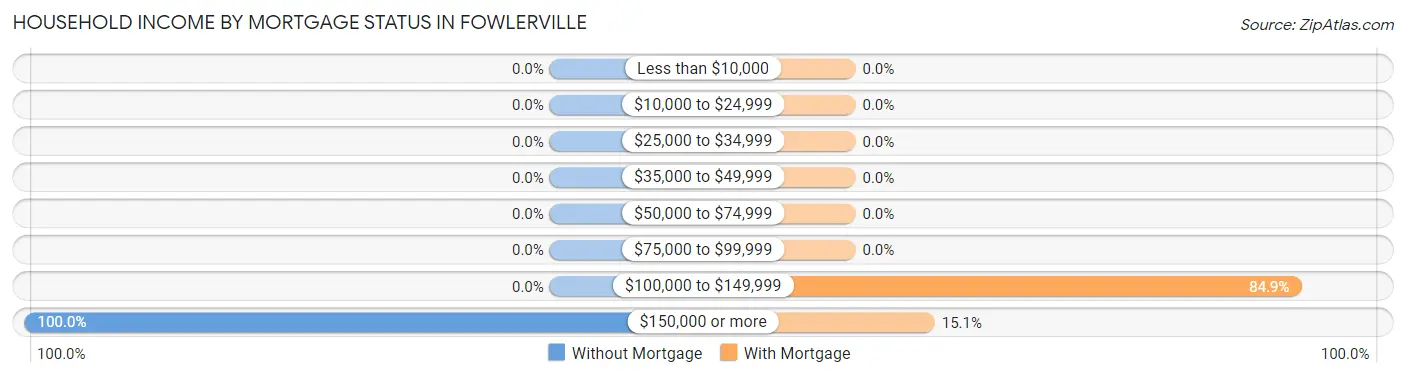
| Household Income | Without Mortgage | With Mortgage |
| Less than $10,000 | 0 (0.0%) | 0 (0.0%) |
| $10,000 to $24,999 | 0 (0.0%) | 0 (0.0%) |
| $25,000 to $34,999 | 0 (0.0%) | 0 (0.0%) |
| $35,000 to $49,999 | 0 (0.0%) | 0 (0.0%) |
| $50,000 to $74,999 | 0 (0.0%) | 0 (0.0%) |
| $75,000 to $99,999 | 0 (0.0%) | 0 (0.0%) |
| $100,000 to $149,999 | 0 (0.0%) | 45 (84.9%) |
| $150,000 or more | 4 (100.0%) | 8 (15.1%) |
| Total | 4 (100.0%) | 53 (100.0%) |
Property Value to Household Income Ratio in Fowlerville
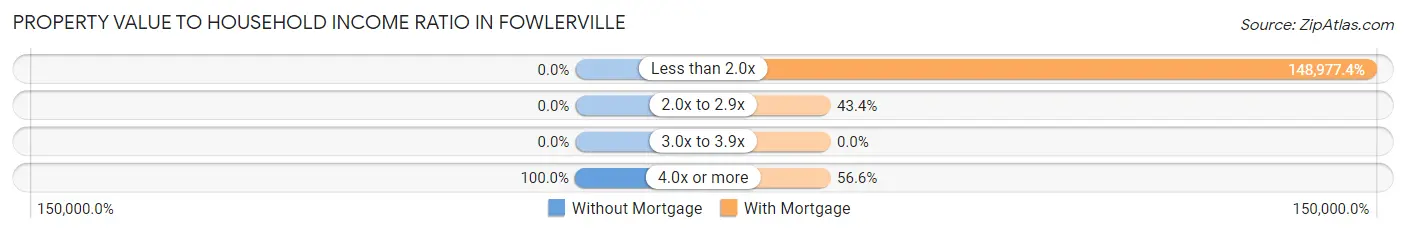
| Value-to-Income Ratio | Without Mortgage | With Mortgage |
| Less than 2.0x | 0 (0.0%) | 78,958 (148,977.4%) |
| 2.0x to 2.9x | 0 (0.0%) | 23 (43.4%) |
| 3.0x to 3.9x | 0 (0.0%) | 0 (0.0%) |
| 4.0x or more | 4 (100.0%) | 30 (56.6%) |
| Total | 4 (100.0%) | 53 (100.0%) |
Real Estate Taxes by Mortgage Status in Fowlerville
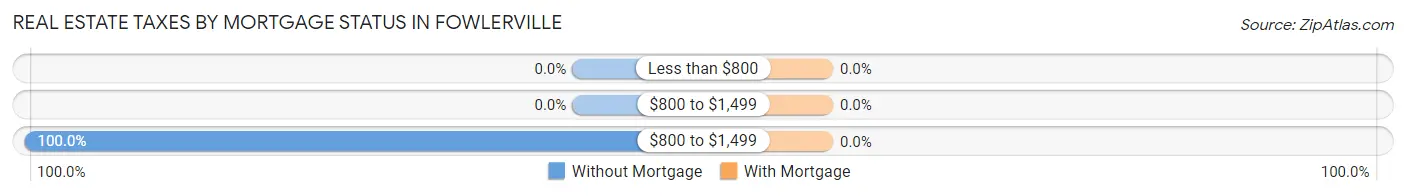
| Property Taxes | Without Mortgage | With Mortgage |
| Less than $800 | 0 (0.0%) | 0 (0.0%) |
| $800 to $1,499 | 0 (0.0%) | 0 (0.0%) |
| $800 to $1,499 | 4 (100.0%) | 0 (0.0%) |
| Total | 4 (100.0%) | 53 (100.0%) |
Health & Disability in Fowlerville
Health Insurance Coverage by Age in Fowlerville
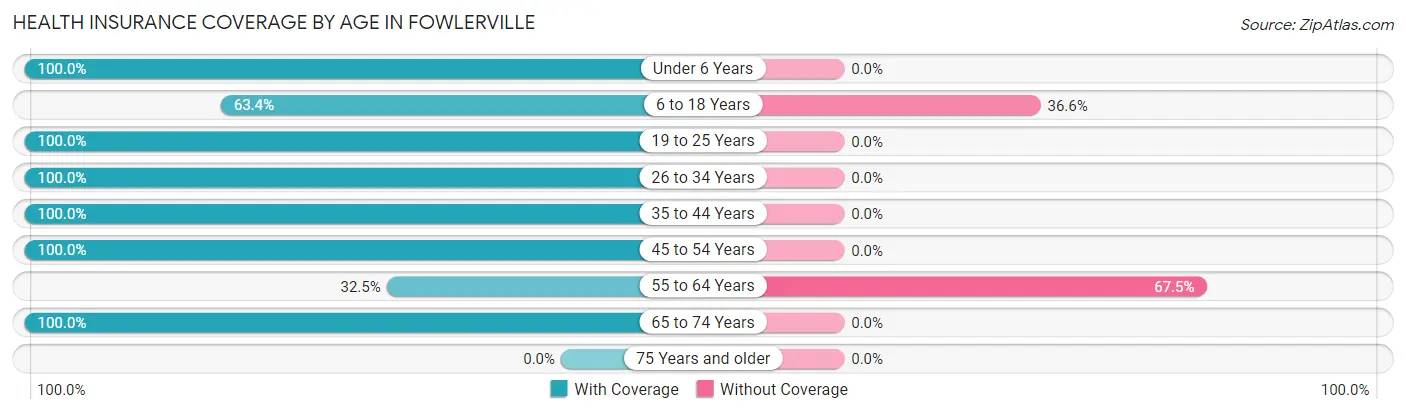
| Age Bracket | With Coverage | Without Coverage |
| Under 6 Years | 41 (100.0%) | 0 (0.0%) |
| 6 to 18 Years | 52 (63.4%) | 30 (36.6%) |
| 19 to 25 Years | 13 (100.0%) | 0 (0.0%) |
| 26 to 34 Years | 7 (100.0%) | 0 (0.0%) |
| 35 to 44 Years | 42 (100.0%) | 0 (0.0%) |
| 45 to 54 Years | 9 (100.0%) | 0 (0.0%) |
| 55 to 64 Years | 13 (32.5%) | 27 (67.5%) |
| 65 to 74 Years | 33 (100.0%) | 0 (0.0%) |
| 75 Years and older | 0 (0.0%) | 0 (0.0%) |
| Total | 210 (78.6%) | 57 (21.3%) |
Health Insurance Coverage by Citizenship Status in Fowlerville
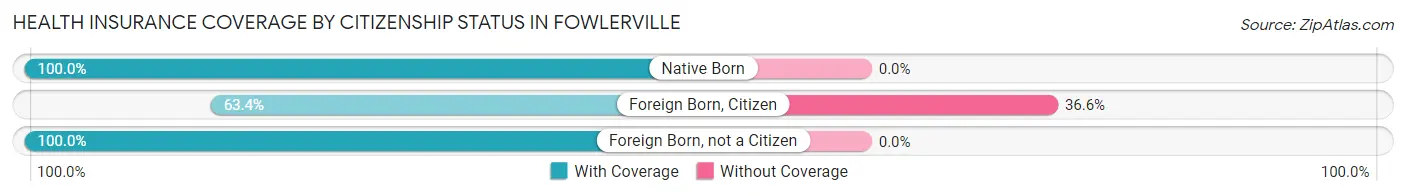
| Citizenship Status | With Coverage | Without Coverage |
| Native Born | 41 (100.0%) | 0 (0.0%) |
| Foreign Born, Citizen | 52 (63.4%) | 30 (36.6%) |
| Foreign Born, not a Citizen | 13 (100.0%) | 0 (0.0%) |
Health Insurance Coverage by Household Income in Fowlerville
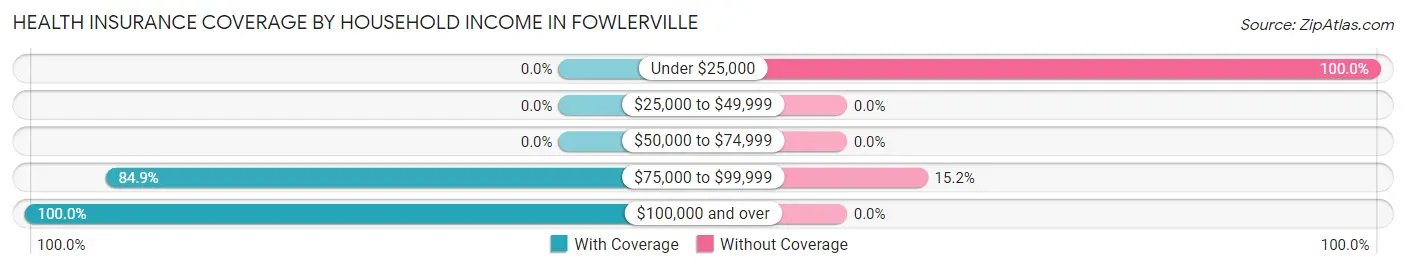
| Household Income | With Coverage | Without Coverage |
| Under $25,000 | 0 (0.0%) | 27 (100.0%) |
| $25,000 to $49,999 | 0 (0.0%) | 0 (0.0%) |
| $50,000 to $74,999 | 0 (0.0%) | 0 (0.0%) |
| $75,000 to $99,999 | 168 (84.9%) | 30 (15.1%) |
| $100,000 and over | 42 (100.0%) | 0 (0.0%) |
Public vs Private Health Insurance Coverage by Age in Fowlerville
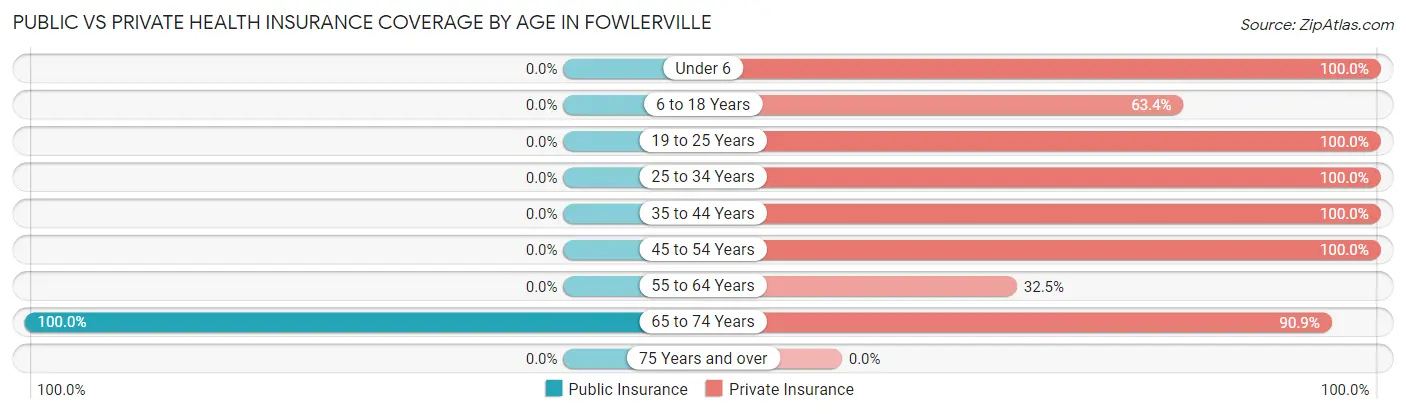
| Age Bracket | Public Insurance | Private Insurance |
| Under 6 | 0 (0.0%) | 41 (100.0%) |
| 6 to 18 Years | 0 (0.0%) | 52 (63.4%) |
| 19 to 25 Years | 0 (0.0%) | 13 (100.0%) |
| 25 to 34 Years | 0 (0.0%) | 7 (100.0%) |
| 35 to 44 Years | 0 (0.0%) | 42 (100.0%) |
| 45 to 54 Years | 0 (0.0%) | 9 (100.0%) |
| 55 to 64 Years | 0 (0.0%) | 13 (32.5%) |
| 65 to 74 Years | 33 (100.0%) | 30 (90.9%) |
| 75 Years and over | 0 (0.0%) | 0 (0.0%) |
| Total | 33 (12.4%) | 207 (77.5%) |
Disability Status by Sex by Age in Fowlerville
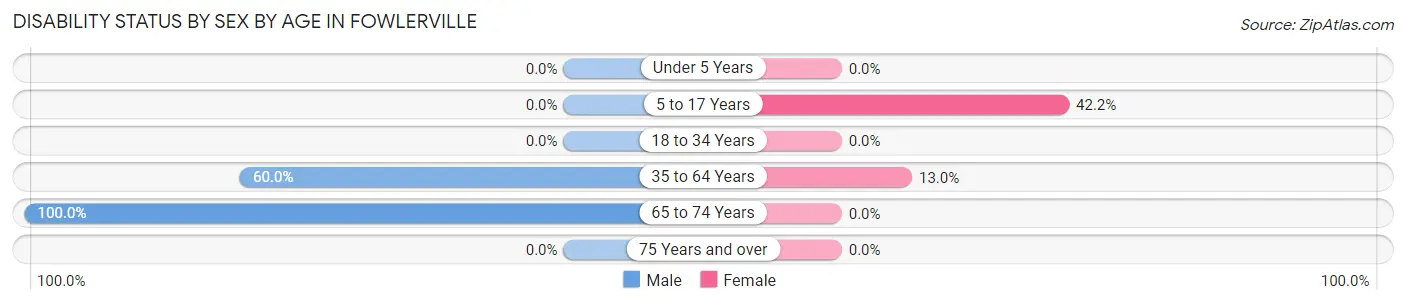
| Age Bracket | Male | Female |
| Under 5 Years | 0 (0.0%) | 0 (0.0%) |
| 5 to 17 Years | 0 (0.0%) | 27 (42.2%) |
| 18 to 34 Years | 0 (0.0%) | 0 (0.0%) |
| 35 to 64 Years | 27 (60.0%) | 6 (13.0%) |
| 65 to 74 Years | 3 (100.0%) | 0 (0.0%) |
| 75 Years and over | 0 (0.0%) | 0 (0.0%) |
Disability Class by Sex by Age in Fowlerville
Disability Class: Hearing Difficulty
| Age Bracket | Male | Female |
| Under 5 Years | 0 (0.0%) | 0 (0.0%) |
| 5 to 17 Years | 0 (0.0%) | 0 (0.0%) |
| 18 to 34 Years | 0 (0.0%) | 0 (0.0%) |
| 35 to 64 Years | 0 (0.0%) | 0 (0.0%) |
| 65 to 74 Years | 0 (0.0%) | 0 (0.0%) |
| 75 Years and over | 0 (0.0%) | 0 (0.0%) |
Disability Class: Vision Difficulty
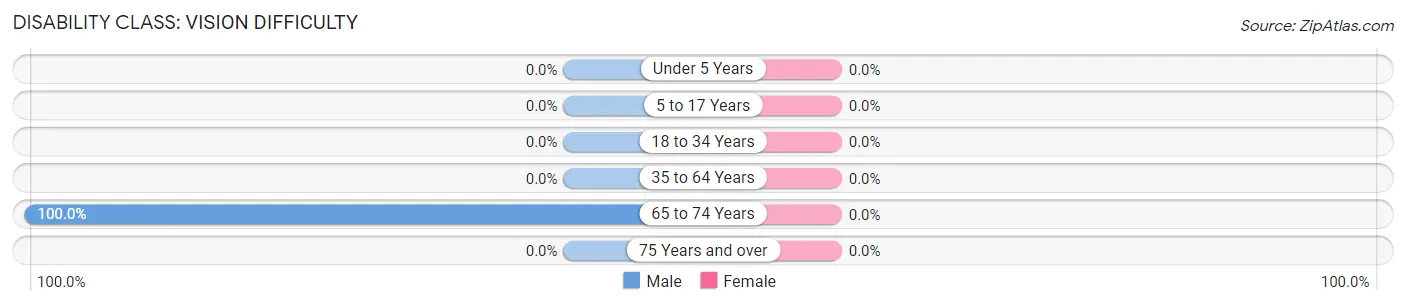
| Age Bracket | Male | Female |
| Under 5 Years | 0 (0.0%) | 0 (0.0%) |
| 5 to 17 Years | 0 (0.0%) | 0 (0.0%) |
| 18 to 34 Years | 0 (0.0%) | 0 (0.0%) |
| 35 to 64 Years | 0 (0.0%) | 0 (0.0%) |
| 65 to 74 Years | 3 (100.0%) | 0 (0.0%) |
| 75 Years and over | 0 (0.0%) | 0 (0.0%) |
Disability Class: Cognitive Difficulty
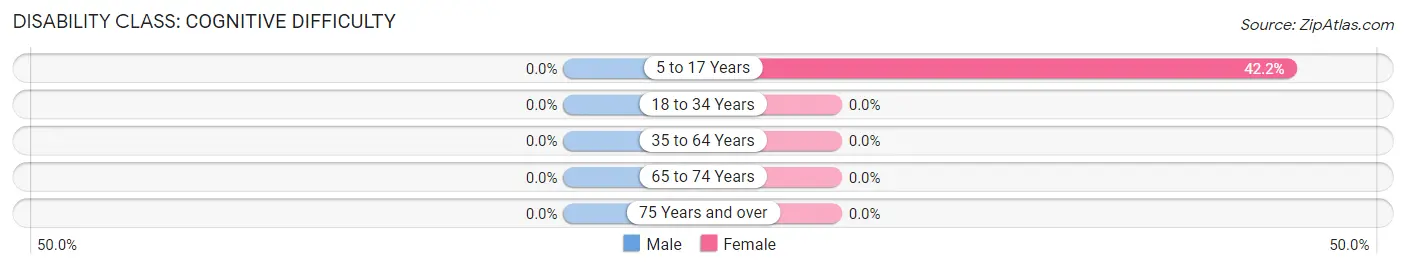
| Age Bracket | Male | Female |
| 5 to 17 Years | 0 (0.0%) | 27 (42.2%) |
| 18 to 34 Years | 0 (0.0%) | 0 (0.0%) |
| 35 to 64 Years | 0 (0.0%) | 0 (0.0%) |
| 65 to 74 Years | 0 (0.0%) | 0 (0.0%) |
| 75 Years and over | 0 (0.0%) | 0 (0.0%) |
Disability Class: Ambulatory Difficulty
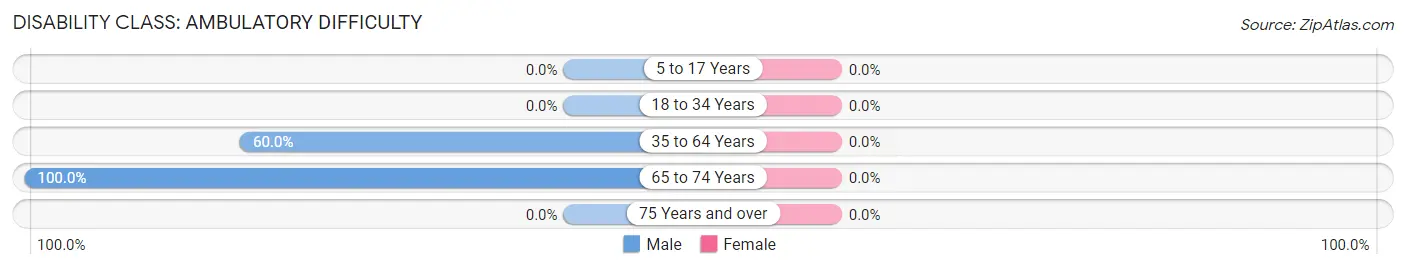
| Age Bracket | Male | Female |
| 5 to 17 Years | 0 (0.0%) | 0 (0.0%) |
| 18 to 34 Years | 0 (0.0%) | 0 (0.0%) |
| 35 to 64 Years | 27 (60.0%) | 0 (0.0%) |
| 65 to 74 Years | 3 (100.0%) | 0 (0.0%) |
| 75 Years and over | 0 (0.0%) | 0 (0.0%) |
Disability Class: Self-Care Difficulty
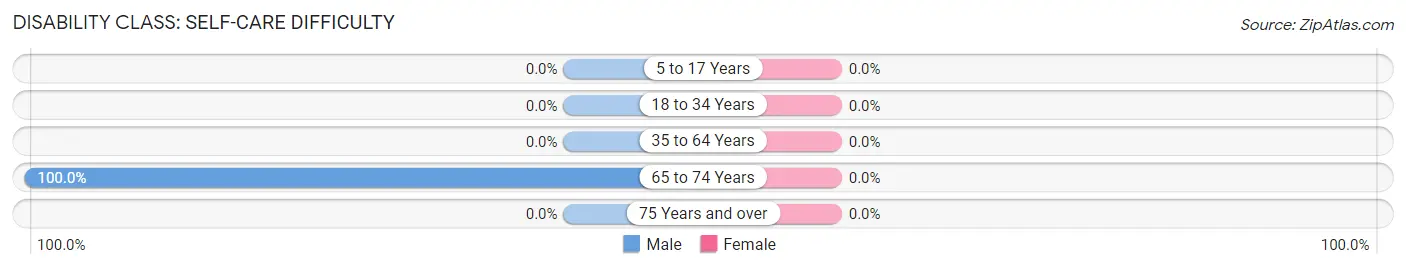
| Age Bracket | Male | Female |
| 5 to 17 Years | 0 (0.0%) | 0 (0.0%) |
| 18 to 34 Years | 0 (0.0%) | 0 (0.0%) |
| 35 to 64 Years | 0 (0.0%) | 0 (0.0%) |
| 65 to 74 Years | 3 (100.0%) | 0 (0.0%) |
| 75 Years and over | 0 (0.0%) | 0 (0.0%) |
Technology Access in Fowlerville
Computing Device Access in Fowlerville
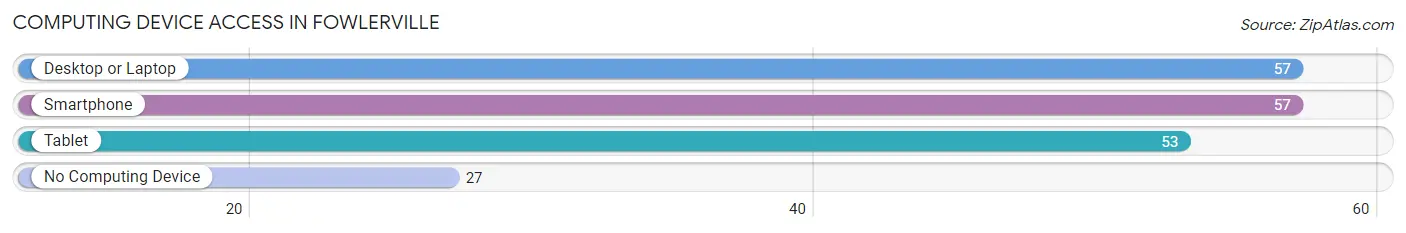
| Device Type | # Households | % Households |
| Desktop or Laptop | 57 | 67.9% |
| Smartphone | 57 | 67.9% |
| Tablet | 53 | 63.1% |
| No Computing Device | 27 | 32.1% |
| Total | 84 | 100.0% |
Internet Access in Fowlerville
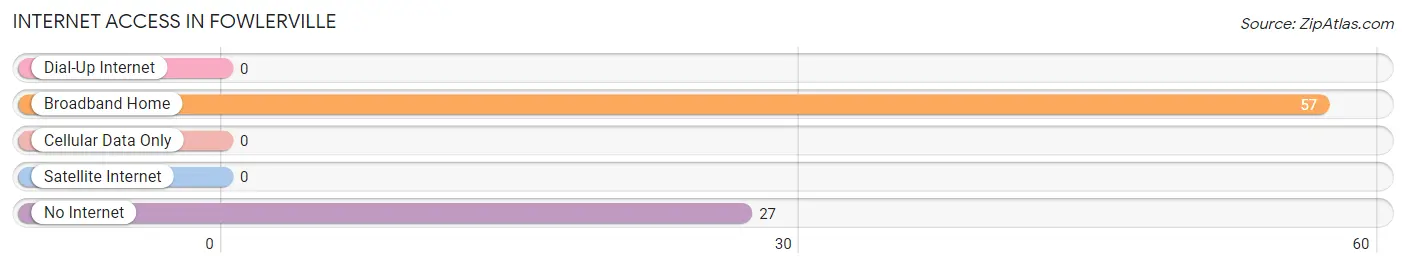
| Internet Type | # Households | % Households |
| Dial-Up Internet | 0 | 0.0% |
| Broadband Home | 57 | 67.9% |
| Cellular Data Only | 0 | 0.0% |
| Satellite Internet | 0 | 0.0% |
| No Internet | 27 | 32.1% |
| Total | 84 | 100.0% |
Fowlerville Summary
Fowlerville is a small hamlet located in the town of Genoa in Cayuga County, New York. It is situated on the east side of Cayuga Lake, about 10 miles south of Auburn. The hamlet is home to a population of about 500 people and is known for its rural charm and small-town atmosphere.
History
Fowlerville was first settled in the early 1800s by a group of settlers from Connecticut. The hamlet was originally known as “Fowler’s Corners” after the first settler, John Fowler. The name was later changed to Fowlerville in 1837.
The hamlet was an important stop on the Auburn and Syracuse Railroad, which ran through the area in the mid-1800s. The railroad brought increased economic activity to the area, and the hamlet grew in size and importance.
In the late 1800s, Fowlerville was home to a number of businesses, including a hotel, a general store, a blacksmith shop, and a sawmill. The hamlet also had a post office, which opened in 1876.
Geography
Fowlerville is located in the Finger Lakes region of New York, about 10 miles south of Auburn. The hamlet is situated on the east side of Cayuga Lake, and is surrounded by rolling hills and farmland. The hamlet is located in the town of Genoa, which is part of Cayuga County.
The hamlet has a total area of 0.3 square miles, all of which is land. The terrain is mostly flat, with some rolling hills in the surrounding area. The hamlet is located at an elevation of about 600 feet above sea level.
Economy
Fowlerville’s economy is largely based on agriculture and tourism. The hamlet is home to several farms, which produce a variety of crops, including corn, soybeans, and hay. The hamlet is also home to several wineries, which attract tourists from all over the region.
The hamlet is also home to a number of small businesses, including a general store, a hardware store, and a few restaurants. The hamlet is also home to a number of bed and breakfasts, which attract tourists from all over the region.
Demographics
As of the 2010 census, Fowlerville had a population of 498 people. The racial makeup of the hamlet was 97.2% White, 0.6% African American, 0.2% Native American, 0.2% Asian, 0.2% from other races, and 1.8% from two or more races. Hispanic or Latino of any race were 1.2% of the population.
The median household income in Fowlerville was $45,833, and the median family income was $50,000. The per capita income for the hamlet was $20,845. About 8.3% of families and 10.2% of the population were below the poverty line, including 14.3% of those under age 18 and none of those age 65 or over.
Fowlerville is a small hamlet with a rich history and a unique rural charm. The hamlet is home to a population of about 500 people, and is largely supported by agriculture and tourism. The hamlet is also home to a number of small businesses, which provide employment opportunities for the local population.
Common Questions
What is Per Capita Income in Fowlerville?
Per Capita income in Fowlerville is $21,215.
What is the Median Family Income in Fowlerville?
Median Family Income in Fowlerville is $79,125.
What is the Median Household income in Fowlerville?
Median Household Income in Fowlerville is $78,000.
What is Inequality or Gini Index in Fowlerville?
Inequality or Gini Index in Fowlerville is 0.45.
What is the Total Population of Fowlerville?
Total Population of Fowlerville is 267.
What is the Total Male Population of Fowlerville?
Total Male Population of Fowlerville is 120.
What is the Total Female Population of Fowlerville?
Total Female Population of Fowlerville is 147.
What is the Ratio of Males per 100 Females in Fowlerville?
There are 81.63 Males per 100 Females in Fowlerville.
What is the Ratio of Females per 100 Males in Fowlerville?
There are 122.50 Females per 100 Males in Fowlerville.
What is the Median Population Age in Fowlerville?
Median Population Age in Fowlerville is 21.8 Years.
What is the Average Family Size in Fowlerville
Average Family Size in Fowlerville is 4.2 People.
What is the Average Household Size in Fowlerville
Average Household Size in Fowlerville is 3.2 People.
How Large is the Labor Force in Fowlerville?
There are 67 People in the Labor Forcein in Fowlerville.
What is the Percentage of People in the Labor Force in Fowlerville?
46.5% of People are in the Labor Force in Fowlerville.
What is the Unemployment Rate in Fowlerville?
Unemployment Rate in Fowlerville is 10.4%.