Websters Crossing, NY Map & Demographics
Websters Crossing Map
Websters Crossing Overview
$27,388
PER CAPITA INCOME
$95,192
AVG FAMILY INCOME
$76,250
AVG HOUSEHOLD INCOME
0.27
INEQUALITY / GINI INDEX
124
TOTAL POPULATION
59
MALE POPULATION
65
FEMALE POPULATION
90.77
MALES / 100 FEMALES
110.17
FEMALES / 100 MALES
60.0
MEDIAN AGE
2.5
AVG FAMILY SIZE
2.4
AVG HOUSEHOLD SIZE
91
LABOR FORCE [ PEOPLE ]
73.4%
PERCENT IN LABOR FORCE
Income in Websters Crossing
Income Overview in Websters Crossing
Per Capita Income in Websters Crossing is $27,388, while median incomes of families and households are $95,192 and $76,250 respectively.
| Characteristic | Number | Measure |
| Per Capita Income | 124 | $27,388 |
| Median Family Income | 48 | $95,192 |
| Mean Family Income | 48 | $72,340 |
| Median Household Income | 52 | $76,250 |
| Mean Household Income | 52 | $66,998 |
| Income Deficit | 48 | $0 |
| Wage / Income Gap (%) | 124 | 0.00% |
| Wage / Income Gap ($) | 124 | 100.00¢ per $1 |
| Gini / Inequality Index | 124 | 0.27 |
Earnings by Sex in Websters Crossing
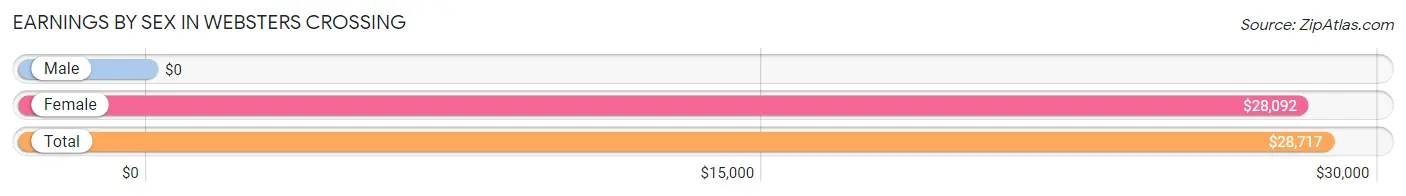
| Sex | Number | Average Earnings |
| Male | 33 (36.3%) | $0 |
| Female | 58 (63.7%) | $28,092 |
| Total | 91 (100.0%) | $28,717 |
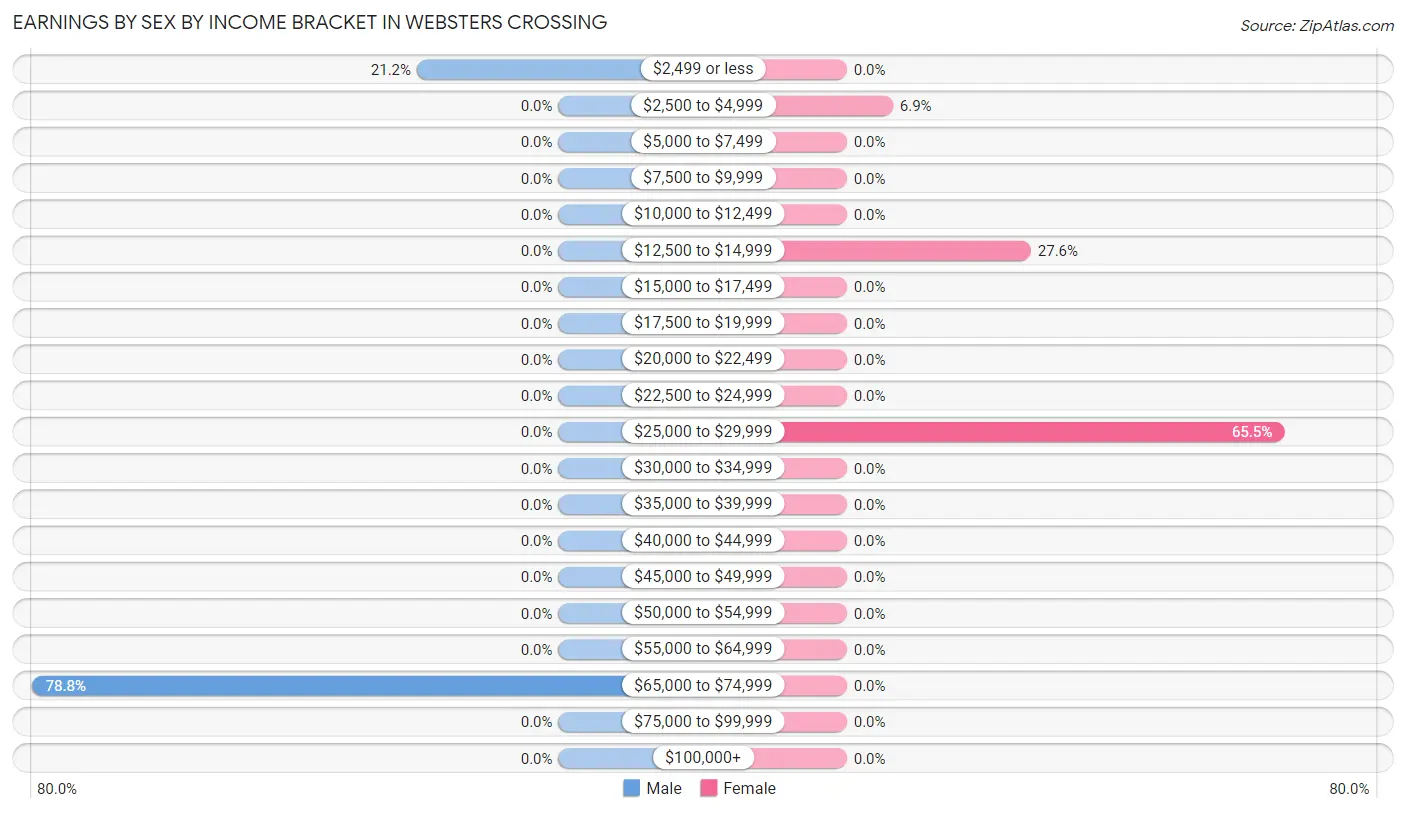
Earnings by Sex by Income Bracket in Websters Crossing
The most common earnings brackets in Websters Crossing are $65,000 to $74,999 for men (26 | 78.8%) and $25,000 to $29,999 for women (38 | 65.5%).
| Income | Male | Female |
| $2,499 or less | 7 (21.2%) | 0 (0.0%) |
| $2,500 to $4,999 | 0 (0.0%) | 4 (6.9%) |
| $5,000 to $7,499 | 0 (0.0%) | 0 (0.0%) |
| $7,500 to $9,999 | 0 (0.0%) | 0 (0.0%) |
| $10,000 to $12,499 | 0 (0.0%) | 0 (0.0%) |
| $12,500 to $14,999 | 0 (0.0%) | 16 (27.6%) |
| $15,000 to $17,499 | 0 (0.0%) | 0 (0.0%) |
| $17,500 to $19,999 | 0 (0.0%) | 0 (0.0%) |
| $20,000 to $22,499 | 0 (0.0%) | 0 (0.0%) |
| $22,500 to $24,999 | 0 (0.0%) | 0 (0.0%) |
| $25,000 to $29,999 | 0 (0.0%) | 38 (65.5%) |
| $30,000 to $34,999 | 0 (0.0%) | 0 (0.0%) |
| $35,000 to $39,999 | 0 (0.0%) | 0 (0.0%) |
| $40,000 to $44,999 | 0 (0.0%) | 0 (0.0%) |
| $45,000 to $49,999 | 0 (0.0%) | 0 (0.0%) |
| $50,000 to $54,999 | 0 (0.0%) | 0 (0.0%) |
| $55,000 to $64,999 | 0 (0.0%) | 0 (0.0%) |
| $65,000 to $74,999 | 26 (78.8%) | 0 (0.0%) |
| $75,000 to $99,999 | 0 (0.0%) | 0 (0.0%) |
| $100,000+ | 0 (0.0%) | 0 (0.0%) |
| Total | 33 (100.0%) | 58 (100.0%) |
Earnings by Sex by Educational Attainment in Websters Crossing
| Educational Attainment | Male Income | Female Income |
| Less than High School | - | - |
| High School Diploma | - | - |
| College or Associate's Degree | - | - |
| Bachelor's Degree | - | - |
| Graduate Degree | - | - |
| Total | - | - |
Family Income in Websters Crossing
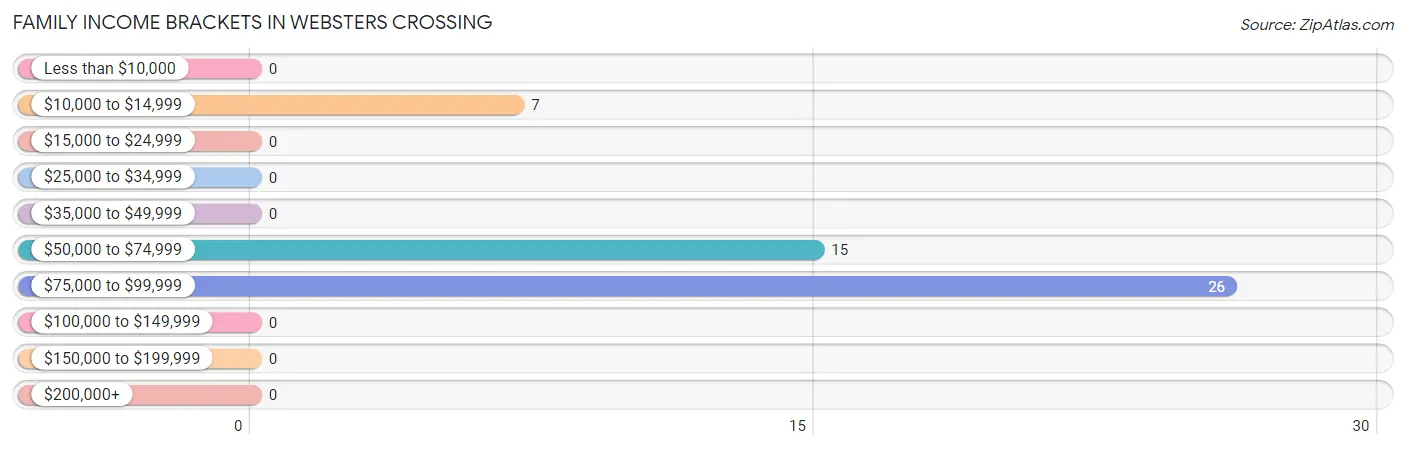
Family Income Brackets in Websters Crossing
According to the Websters Crossing family income data, there are 26 families falling into the $75,000 to $99,999 income range, which is the most common income bracket and makes up 54.2% of all families.
| Income Bracket | # Families | % Families |
| Less than $10,000 | 0 | 0.0% |
| $10,000 to $14,999 | 7 | 14.6% |
| $15,000 to $24,999 | 0 | 0.0% |
| $25,000 to $34,999 | 0 | 0.0% |
| $35,000 to $49,999 | 0 | 0.0% |
| $50,000 to $74,999 | 15 | 31.3% |
| $75,000 to $99,999 | 26 | 54.2% |
| $100,000 to $149,999 | 0 | 0.0% |
| $150,000 to $199,999 | 0 | 0.0% |
| $200,000+ | 0 | 0.0% |
Family Income by Famaliy Size in Websters Crossing
| Income Bracket | # Families | Median Income |
| 2-Person Families | 26 (54.2%) | $0 |
| 3-Person Families | 22 (45.8%) | $0 |
| 4-Person Families | 0 (0.0%) | $0 |
| 5-Person Families | 0 (0.0%) | $0 |
| 6-Person Families | 0 (0.0%) | $0 |
| 7+ Person Families | 0 (0.0%) | $0 |
| Total | 48 (100.0%) | $95,192 |
Family Income by Number of Earners in Websters Crossing
| Number of Earners | # Families | Median Income |
| No Earners | 0 (0.0%) | $0 |
| 1 Earner | 7 (14.6%) | $0 |
| 2 Earners | 41 (85.4%) | $0 |
| 3+ Earners | 0 (0.0%) | $0 |
| Total | 48 (100.0%) | $95,192 |
Household Income in Websters Crossing
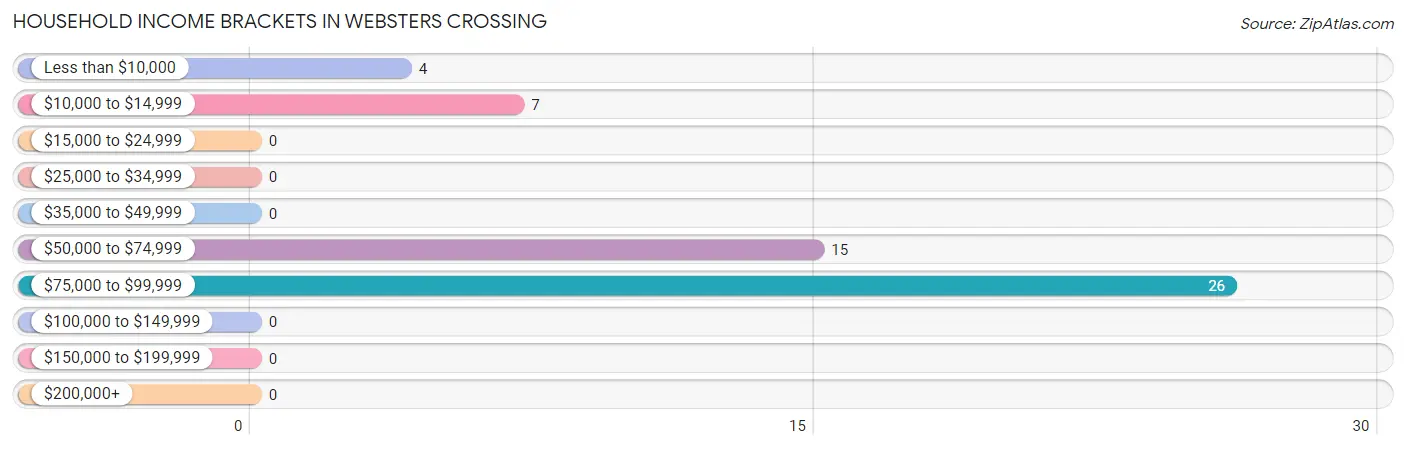
Household Income Brackets in Websters Crossing
With 26 households falling in the category, the $75,000 to $99,999 income range is the most frequent in Websters Crossing, accounting for 50.0% of all households.
| Income Bracket | # Households | % Households |
| Less than $10,000 | 4 | 7.7% |
| $10,000 to $14,999 | 7 | 13.5% |
| $15,000 to $24,999 | 0 | 0.0% |
| $25,000 to $34,999 | 0 | 0.0% |
| $35,000 to $49,999 | 0 | 0.0% |
| $50,000 to $74,999 | 15 | 28.8% |
| $75,000 to $99,999 | 26 | 50.0% |
| $100,000 to $149,999 | 0 | 0.0% |
| $150,000 to $199,999 | 0 | 0.0% |
| $200,000+ | 0 | 0.0% |
Household Income by Householder Age in Websters Crossing
The median household income in Websters Crossing is $76,250, with the highest median household income of $95,192 found in the 45 to 64 years age bracket for the primary householder. A total of 48 households (92.3%) fall into this category. Meanwhile, the 15 to 24 years age bracket for the primary householder has the lowest median household income of $0, with 4 households (7.7%) in this group.
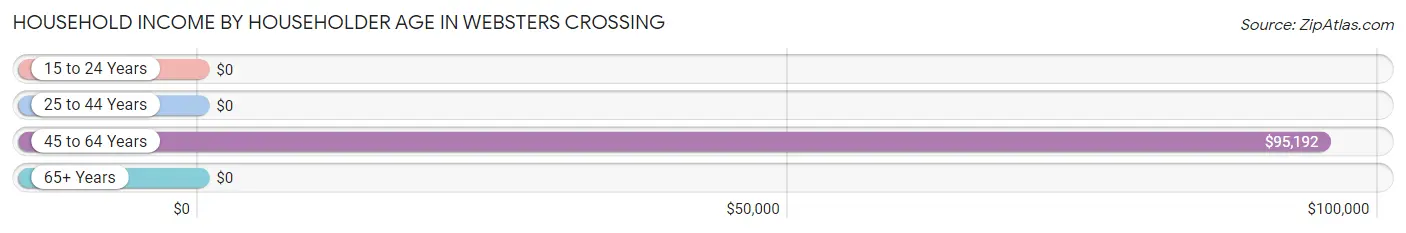
| Income Bracket | # Households | Median Income |
| 15 to 24 Years | 4 (7.7%) | $0 |
| 25 to 44 Years | 0 (0.0%) | $0 |
| 45 to 64 Years | 48 (92.3%) | $95,192 |
| 65+ Years | 0 (0.0%) | $0 |
| Total | 52 (100.0%) | $76,250 |
Poverty in Websters Crossing
Income Below Poverty by Sex and Age in Websters Crossing
With 32.2% poverty level for males and 16.9% for females among the residents of Websters Crossing, 18 to 24 year old males and 45 to 54 year old females are the most vulnerable to poverty, with 12 males (100.0%) and 7 females (31.8%) in their respective age groups living below the poverty level.
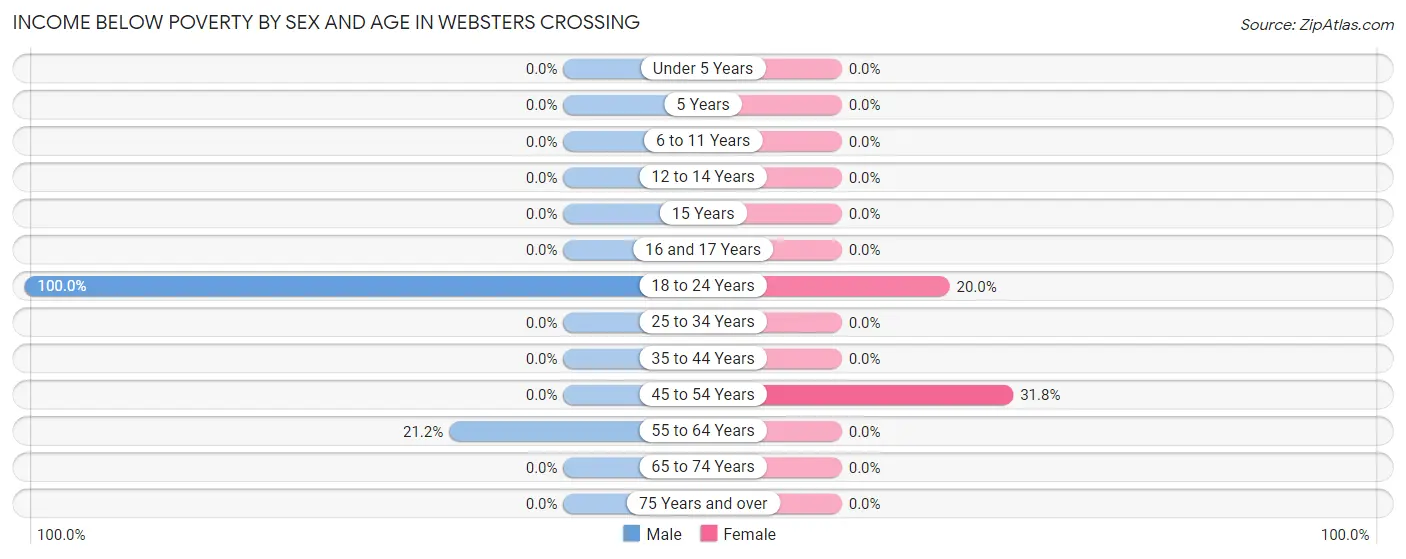
| Age Bracket | Male | Female |
| Under 5 Years | 0 (0.0%) | 0 (0.0%) |
| 5 Years | 0 (0.0%) | 0 (0.0%) |
| 6 to 11 Years | 0 (0.0%) | 0 (0.0%) |
| 12 to 14 Years | 0 (0.0%) | 0 (0.0%) |
| 15 Years | 0 (0.0%) | 0 (0.0%) |
| 16 and 17 Years | 0 (0.0%) | 0 (0.0%) |
| 18 to 24 Years | 12 (100.0%) | 4 (20.0%) |
| 25 to 34 Years | 0 (0.0%) | 0 (0.0%) |
| 35 to 44 Years | 0 (0.0%) | 0 (0.0%) |
| 45 to 54 Years | 0 (0.0%) | 7 (31.8%) |
| 55 to 64 Years | 7 (21.2%) | 0 (0.0%) |
| 65 to 74 Years | 0 (0.0%) | 0 (0.0%) |
| 75 Years and over | 0 (0.0%) | 0 (0.0%) |
| Total | 19 (32.2%) | 11 (16.9%) |
Income Above Poverty by Sex and Age in Websters Crossing
According to the poverty statistics in Websters Crossing, males aged 65 to 74 years and females aged 55 to 64 years are the age groups that are most secure financially, with 100.0% of males and 100.0% of females in these age groups living above the poverty line.
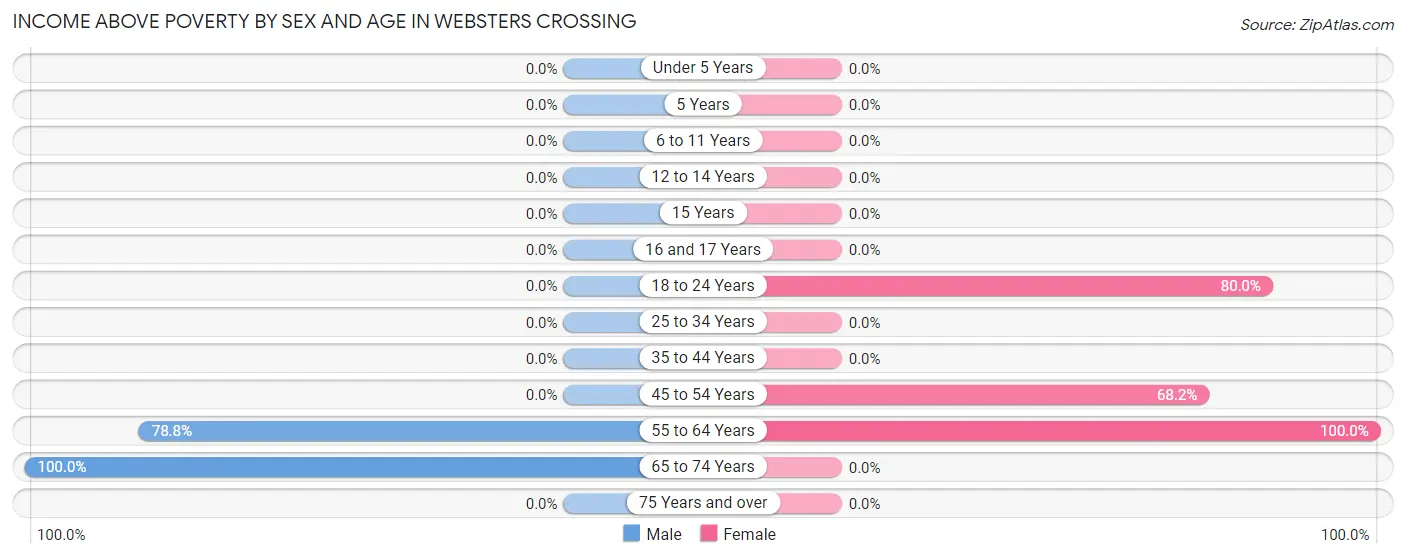
| Age Bracket | Male | Female |
| Under 5 Years | 0 (0.0%) | 0 (0.0%) |
| 5 Years | 0 (0.0%) | 0 (0.0%) |
| 6 to 11 Years | 0 (0.0%) | 0 (0.0%) |
| 12 to 14 Years | 0 (0.0%) | 0 (0.0%) |
| 15 Years | 0 (0.0%) | 0 (0.0%) |
| 16 and 17 Years | 0 (0.0%) | 0 (0.0%) |
| 18 to 24 Years | 0 (0.0%) | 16 (80.0%) |
| 25 to 34 Years | 0 (0.0%) | 0 (0.0%) |
| 35 to 44 Years | 0 (0.0%) | 0 (0.0%) |
| 45 to 54 Years | 0 (0.0%) | 15 (68.2%) |
| 55 to 64 Years | 26 (78.8%) | 23 (100.0%) |
| 65 to 74 Years | 14 (100.0%) | 0 (0.0%) |
| 75 Years and over | 0 (0.0%) | 0 (0.0%) |
| Total | 40 (67.8%) | 54 (83.1%) |
Income Below Poverty Among Married-Couple Families in Websters Crossing
The poverty statistics for married-couple families in Websters Crossing show that 21.2% or 7 of the total 33 families live below the poverty line. Families with no children have the highest poverty rate of 21.2%, comprising of 7 families. On the other hand, families with no children have the lowest poverty rate of 21.2%, which includes 7 families.
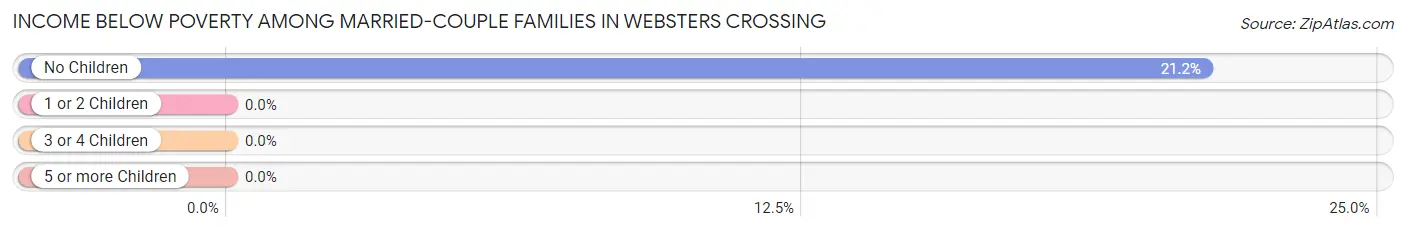
| Children | Above Poverty | Below Poverty |
| No Children | 26 (78.8%) | 7 (21.2%) |
| 1 or 2 Children | 0 (0.0%) | 0 (0.0%) |
| 3 or 4 Children | 0 (0.0%) | 0 (0.0%) |
| 5 or more Children | 0 (0.0%) | 0 (0.0%) |
| Total | 26 (78.8%) | 7 (21.2%) |
Income Below Poverty Among Single-Parent Households in Websters Crossing
| Children | Single Father | Single Mother |
| No Children | 0 (0.0%) | 0 (0.0%) |
| 1 or 2 Children | 0 (0.0%) | 0 (0.0%) |
| 3 or 4 Children | 0 (0.0%) | 0 (0.0%) |
| 5 or more Children | 0 (0.0%) | 0 (0.0%) |
| Total | 0 (0.0%) | 0 (0.0%) |
Income Below Poverty Among Married-Couple vs Single-Parent Households in Websters Crossing
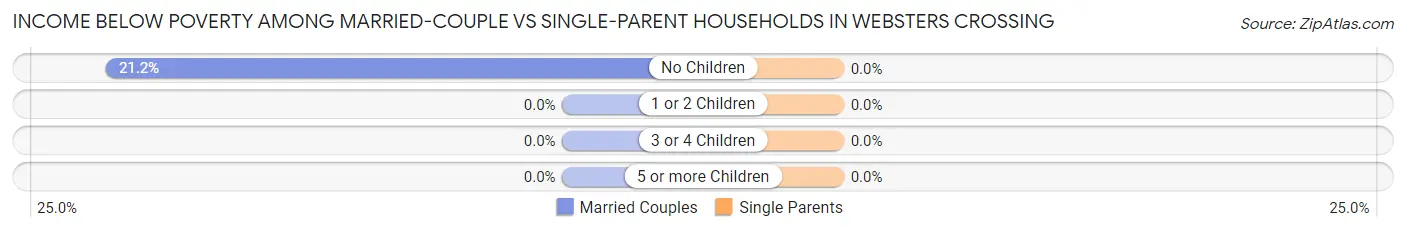
| Children | Married-Couple Families | Single-Parent Households |
| No Children | 7 (21.2%) | 0 (0.0%) |
| 1 or 2 Children | 0 (0.0%) | 0 (0.0%) |
| 3 or 4 Children | 0 (0.0%) | 0 (0.0%) |
| 5 or more Children | 0 (0.0%) | 0 (0.0%) |
| Total | 7 (21.2%) | 0 (0.0%) |
Race in Websters Crossing
The most populous races in Websters Crossing are White / Caucasian (75 | 60.5%), and Two or more Races (49 | 39.5%).
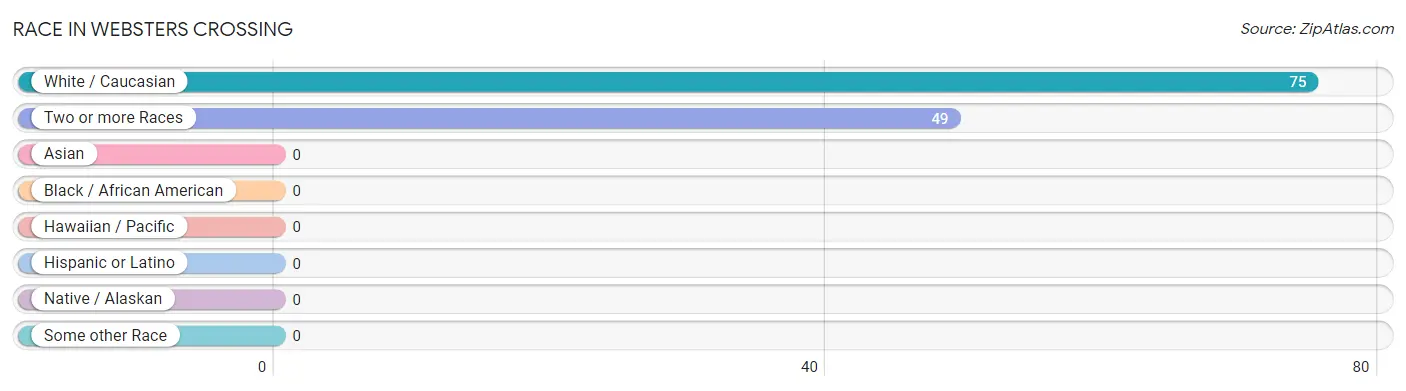
| Race | # Population | % Population |
| Asian | 0 | 0.0% |
| Black / African American | 0 | 0.0% |
| Hawaiian / Pacific | 0 | 0.0% |
| Hispanic or Latino | 0 | 0.0% |
| Native / Alaskan | 0 | 0.0% |
| White / Caucasian | 75 | 60.5% |
| Two or more Races | 49 | 39.5% |
| Some other Race | 0 | 0.0% |
| Total | 124 | 100.0% |
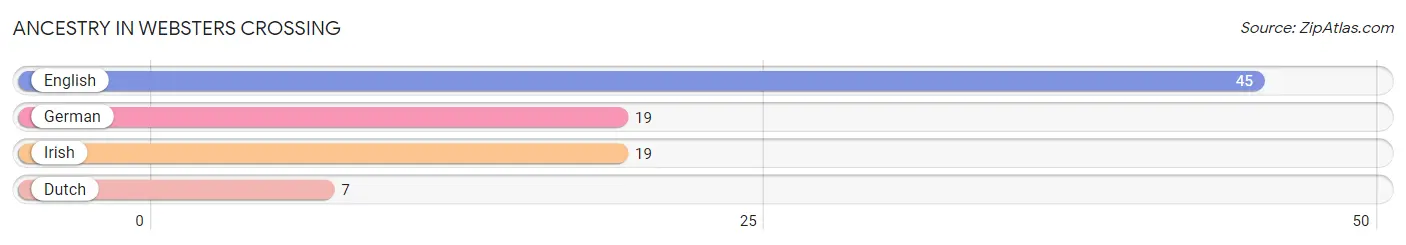
Ancestry in Websters Crossing
The most populous ancestries reported in Websters Crossing are English (45 | 36.3%), German (19 | 15.3%), Irish (19 | 15.3%), and Dutch (7 | 5.7%), together accounting for 72.6% of all Websters Crossing residents.
| Ancestry | # Population | % Population |
| Dutch | 7 | 5.7% |
| English | 45 | 36.3% |
| German | 19 | 15.3% |
| Irish | 19 | 15.3% | View All 4 Rows |
Immigrants in Websters Crossing

| Immigration Origin | # Population | % Population | View All 0 Rows |
Sex and Age in Websters Crossing
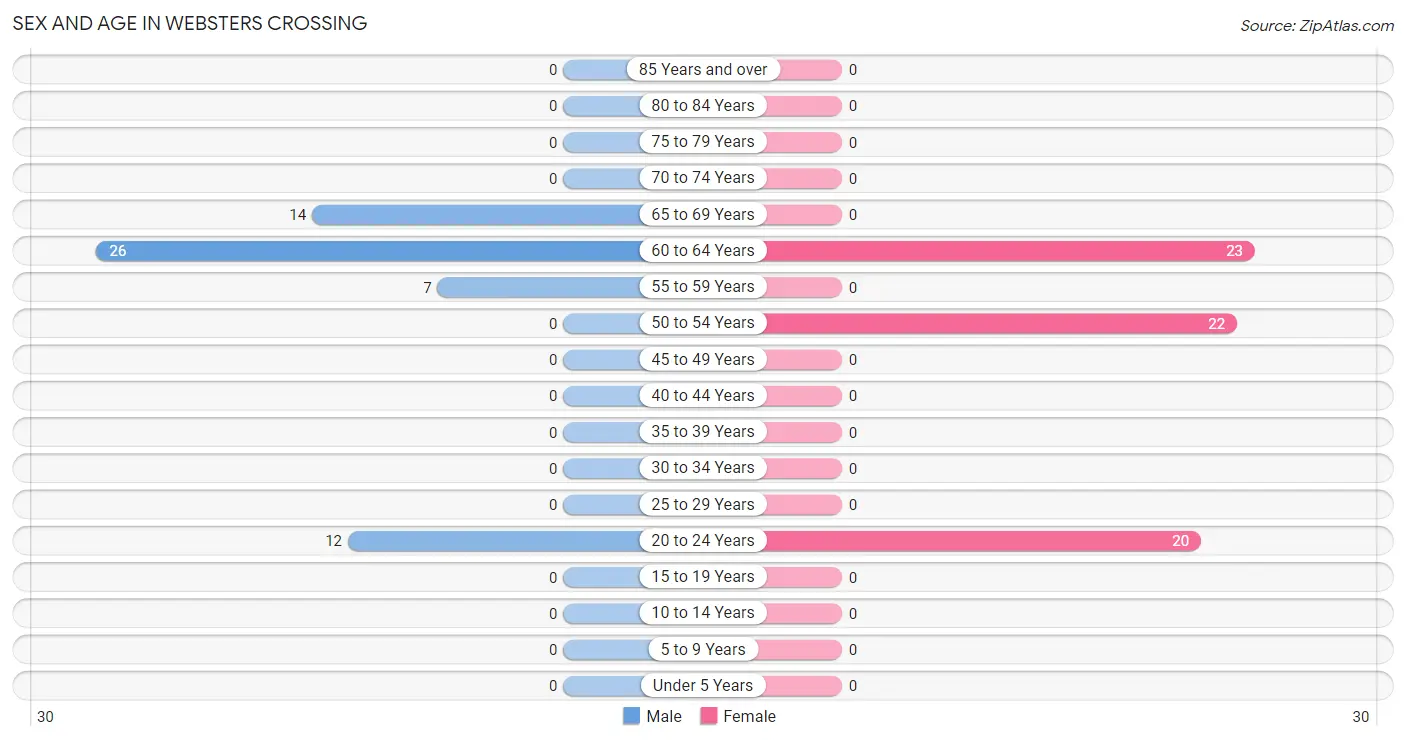
Sex and Age in Websters Crossing
The most populous age groups in Websters Crossing are 60 to 64 Years (26 | 44.1%) for men and 60 to 64 Years (23 | 35.4%) for women.
| Age Bracket | Male | Female |
| Under 5 Years | 0 (0.0%) | 0 (0.0%) |
| 5 to 9 Years | 0 (0.0%) | 0 (0.0%) |
| 10 to 14 Years | 0 (0.0%) | 0 (0.0%) |
| 15 to 19 Years | 0 (0.0%) | 0 (0.0%) |
| 20 to 24 Years | 12 (20.3%) | 20 (30.8%) |
| 25 to 29 Years | 0 (0.0%) | 0 (0.0%) |
| 30 to 34 Years | 0 (0.0%) | 0 (0.0%) |
| 35 to 39 Years | 0 (0.0%) | 0 (0.0%) |
| 40 to 44 Years | 0 (0.0%) | 0 (0.0%) |
| 45 to 49 Years | 0 (0.0%) | 0 (0.0%) |
| 50 to 54 Years | 0 (0.0%) | 22 (33.9%) |
| 55 to 59 Years | 7 (11.9%) | 0 (0.0%) |
| 60 to 64 Years | 26 (44.1%) | 23 (35.4%) |
| 65 to 69 Years | 14 (23.7%) | 0 (0.0%) |
| 70 to 74 Years | 0 (0.0%) | 0 (0.0%) |
| 75 to 79 Years | 0 (0.0%) | 0 (0.0%) |
| 80 to 84 Years | 0 (0.0%) | 0 (0.0%) |
| 85 Years and over | 0 (0.0%) | 0 (0.0%) |
| Total | 59 (100.0%) | 65 (100.0%) |
Families and Households in Websters Crossing
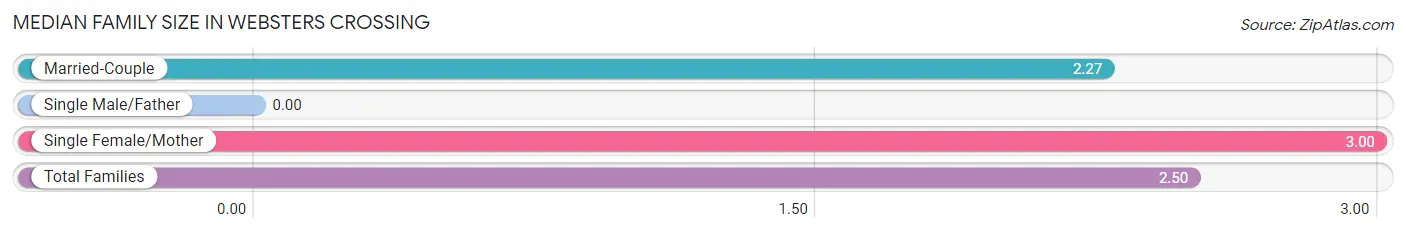
Median Family Size in Websters Crossing
| Family Type | # Families | Family Size |
| Married-Couple | 33 (68.8%) | 2.27 |
| Single Male/Father | 0 (0.0%) | - |
| Single Female/Mother | 15 (31.2%) | 3.00 |
| Total Families | 48 (100.0%) | 2.50 |
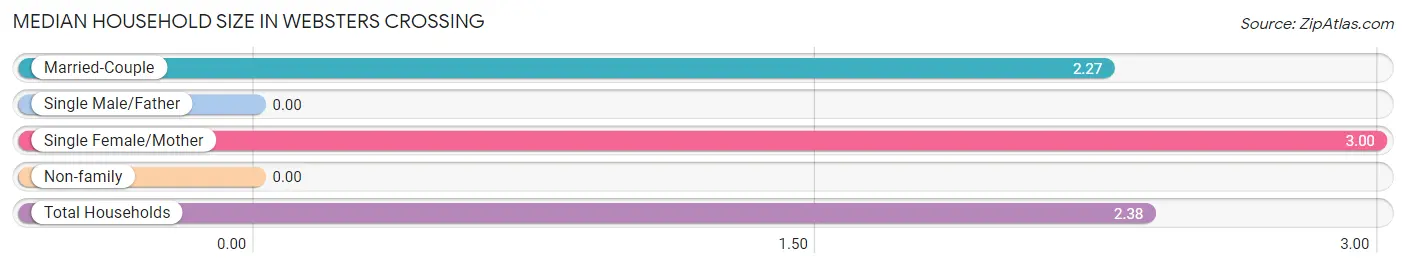
Median Household Size in Websters Crossing
| Household Type | # Households | Household Size |
| Married-Couple | 33 (63.5%) | 2.27 |
| Single Male/Father | 0 (0.0%) | - |
| Single Female/Mother | 15 (28.8%) | 3.00 |
| Non-family | 4 (7.7%) | - |
| Total Households | 52 (100.0%) | 2.38 |
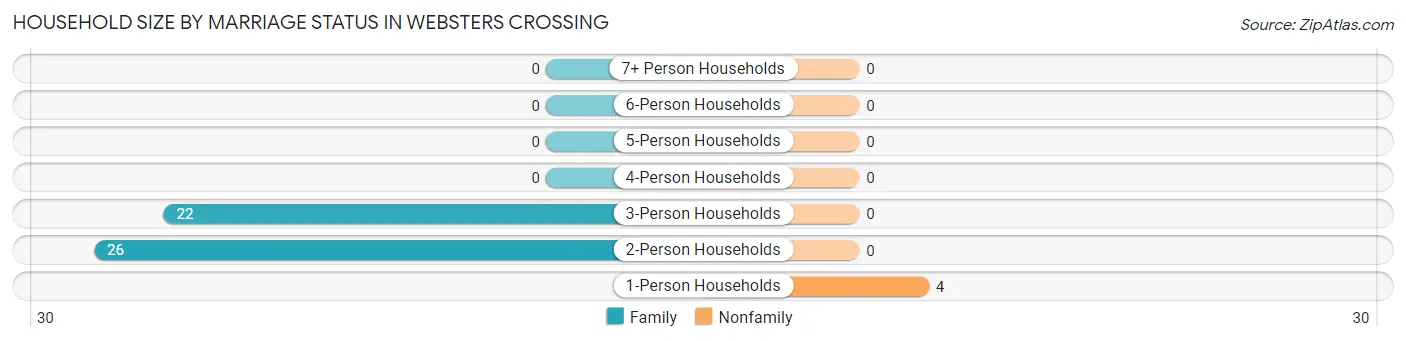
Household Size by Marriage Status in Websters Crossing
Out of a total of 52 households in Websters Crossing, 48 (92.3%) are family households, while 4 (7.7%) are nonfamily households. The most numerous type of family households are 2-person households, comprising 26, and the most common type of nonfamily households are 1-person households, comprising 4.
| Household Size | Family Households | Nonfamily Households |
| 1-Person Households | - | 4 (7.7%) |
| 2-Person Households | 26 (50.0%) | 0 (0.0%) |
| 3-Person Households | 22 (42.3%) | 0 (0.0%) |
| 4-Person Households | 0 (0.0%) | 0 (0.0%) |
| 5-Person Households | 0 (0.0%) | 0 (0.0%) |
| 6-Person Households | 0 (0.0%) | 0 (0.0%) |
| 7+ Person Households | 0 (0.0%) | 0 (0.0%) |
| Total | 48 (92.3%) | 4 (7.7%) |
Female Fertility in Websters Crossing
Fertility by Age in Websters Crossing
| Age Bracket | Women with Births | Births / 1,000 Women |
| 15 to 19 years | 0 (0.0%) | 0.0 |
| 20 to 34 years | 0 (0.0%) | 0.0 |
| 35 to 50 years | 0 (0.0%) | 0.0 |
| Total | 0 (0.0%) | 0.0 |
Fertility by Age by Marriage Status in Websters Crossing
| Age Bracket | Married | Unmarried |
| 15 to 19 years | 0 (0.0%) | 0 (0.0%) |
| 20 to 34 years | 0 (0.0%) | 0 (0.0%) |
| 35 to 50 years | 0 (0.0%) | 0 (0.0%) |
| Total | 0 (0.0%) | 0 (0.0%) |
Fertility by Education in Websters Crossing
| Educational Attainment | Women with Births | Births / 1,000 Women |
| Less than High School | 0 (0.0%) | 0.0 |
| High School Diploma | 0 (0.0%) | 0.0 |
| College or Associate's Degree | 0 (0.0%) | 0.0 |
| Bachelor's Degree | 0 (0.0%) | 0.0 |
| Graduate Degree | 0 (0.0%) | 0.0 |
| Total | 0 (0.0%) | 0.0 |
Fertility by Education by Marriage Status in Websters Crossing
| Educational Attainment | Married | Unmarried |
| Less than High School | 0 (0.0%) | 0 (0.0%) |
| High School Diploma | 0 (0.0%) | 0 (0.0%) |
| College or Associate's Degree | 0 (0.0%) | 0 (0.0%) |
| Bachelor's Degree | 0 (0.0%) | 0 (0.0%) |
| Graduate Degree | 0 (0.0%) | 0 (0.0%) |
| Total | 0 (0.0%) | 0 (0.0%) |
Employment Characteristics in Websters Crossing
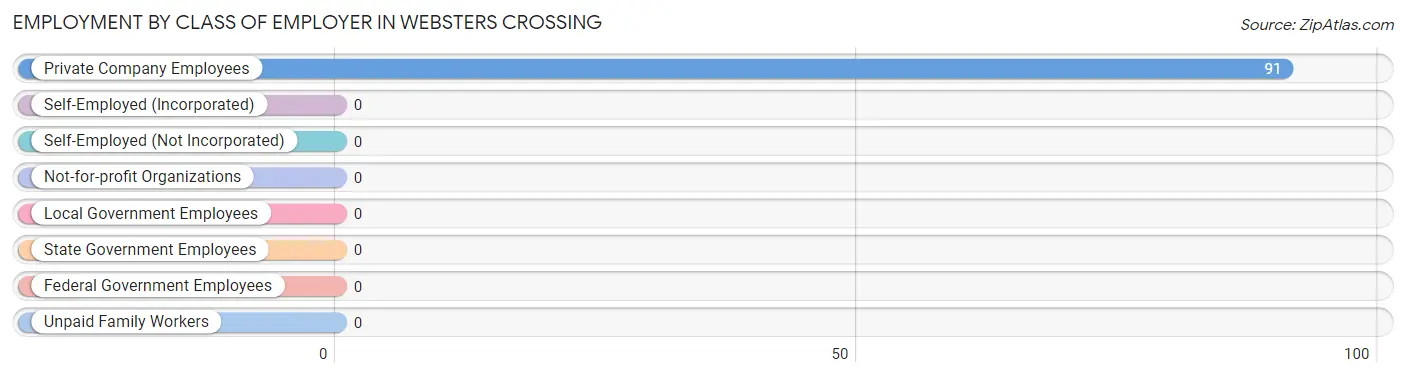
Employment by Class of Employer in Websters Crossing
Among the 91 employed individuals in Websters Crossing, , and private company employees (91 | 100.0%) make up the most common classes of employment.
| Employer Class | # Employees | % Employees |
| Private Company Employees | 91 | 100.0% |
| Self-Employed (Incorporated) | 0 | 0.0% |
| Self-Employed (Not Incorporated) | 0 | 0.0% |
| Not-for-profit Organizations | 0 | 0.0% |
| Local Government Employees | 0 | 0.0% |
| State Government Employees | 0 | 0.0% |
| Federal Government Employees | 0 | 0.0% |
| Unpaid Family Workers | 0 | 0.0% |
| Total | 91 | 100.0% |
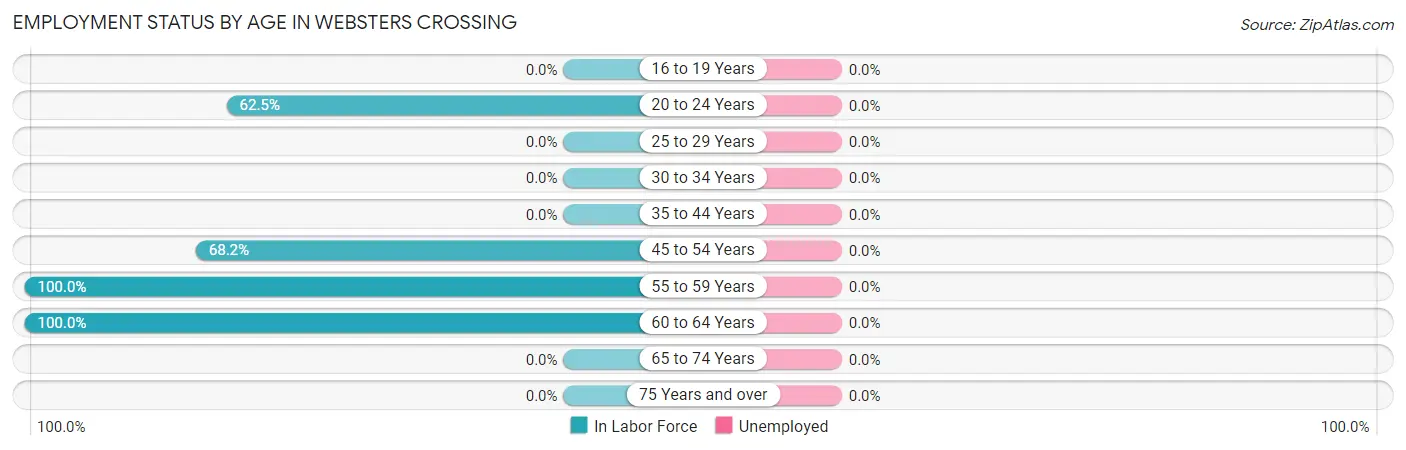
Employment Status by Age in Websters Crossing
| Age Bracket | In Labor Force | Unemployed |
| 16 to 19 Years | 0 (0.0%) | 0 (0.0%) |
| 20 to 24 Years | 20 (62.5%) | 0 (0.0%) |
| 25 to 29 Years | 0 (0.0%) | 0 (0.0%) |
| 30 to 34 Years | 0 (0.0%) | 0 (0.0%) |
| 35 to 44 Years | 0 (0.0%) | 0 (0.0%) |
| 45 to 54 Years | 15 (68.2%) | 0 (0.0%) |
| 55 to 59 Years | 7 (100.0%) | 0 (0.0%) |
| 60 to 64 Years | 49 (100.0%) | 0 (0.0%) |
| 65 to 74 Years | 0 (0.0%) | 0 (0.0%) |
| 75 Years and over | 0 (0.0%) | 0 (0.0%) |
| Total | 91 (73.4%) | 0 (0.0%) |
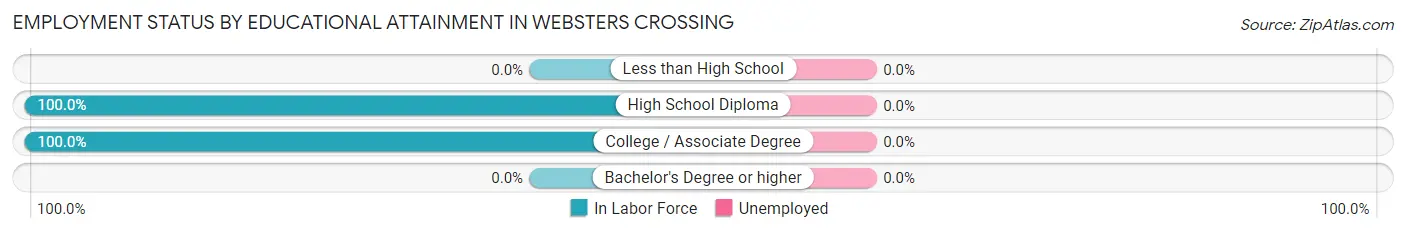
Employment Status by Educational Attainment in Websters Crossing
| Educational Attainment | In Labor Force | Unemployed |
| Less than High School | 0 (0.0%) | 0 (0.0%) |
| High School Diploma | 64 (100.0%) | 0 (0.0%) |
| College / Associate Degree | 7 (100.0%) | 0 (0.0%) |
| Bachelor's Degree or higher | 0 (0.0%) | 0 (0.0%) |
| Total | 71 (91.0%) | 0 (0.0%) |
Employment Occupations by Sex in Websters Crossing
Management, Business, Science and Arts Occupations
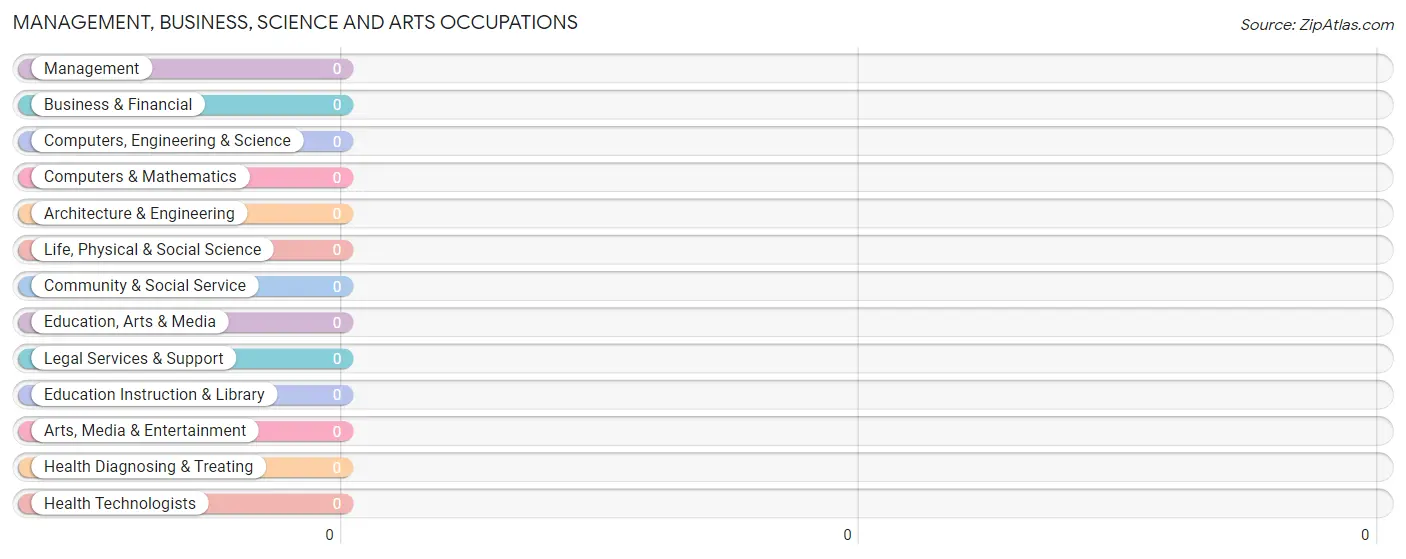
Management, Business, Science and Arts Occupations by Sex
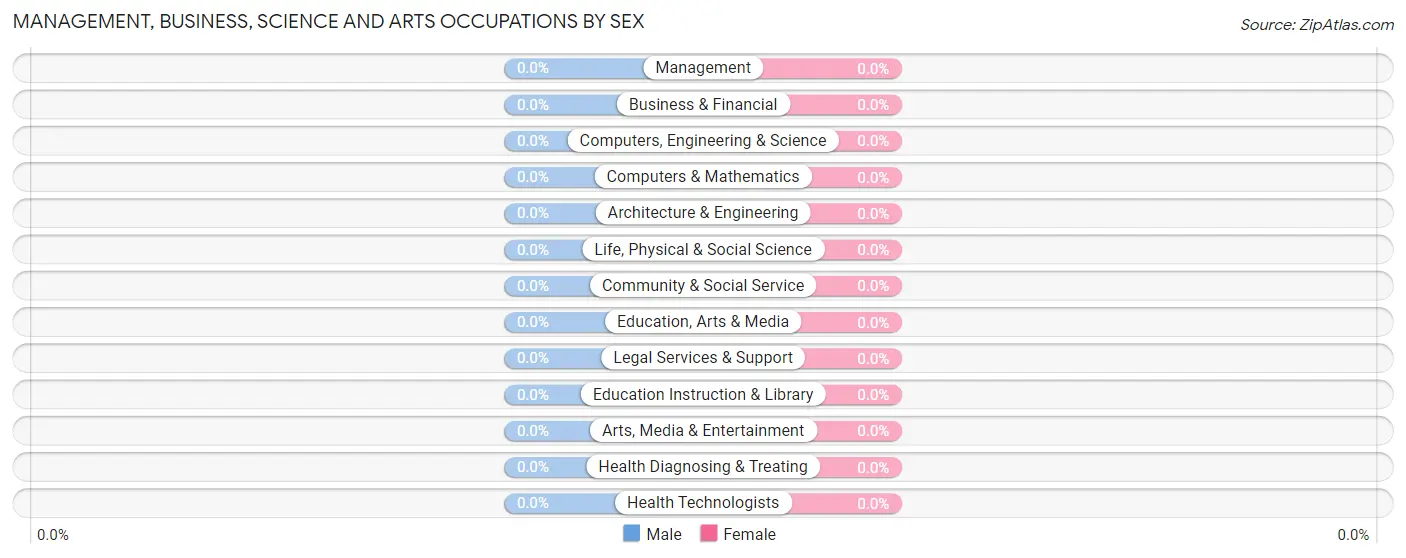
| Occupation | Male | Female |
| Management | 0 (0.0%) | 0 (0.0%) |
| Business & Financial | 0 (0.0%) | 0 (0.0%) |
| Computers, Engineering & Science | 0 (0.0%) | 0 (0.0%) |
| Computers & Mathematics | 0 (0.0%) | 0 (0.0%) |
| Architecture & Engineering | 0 (0.0%) | 0 (0.0%) |
| Life, Physical & Social Science | 0 (0.0%) | 0 (0.0%) |
| Community & Social Service | 0 (0.0%) | 0 (0.0%) |
| Education, Arts & Media | 0 (0.0%) | 0 (0.0%) |
| Legal Services & Support | 0 (0.0%) | 0 (0.0%) |
| Education Instruction & Library | 0 (0.0%) | 0 (0.0%) |
| Arts, Media & Entertainment | 0 (0.0%) | 0 (0.0%) |
| Health Diagnosing & Treating | 0 (0.0%) | 0 (0.0%) |
| Health Technologists | 0 (0.0%) | 0 (0.0%) |
| Total (Category) | 0 (0.0%) | 0 (0.0%) |
| Total (Overall) | 33 (36.3%) | 58 (63.7%) |
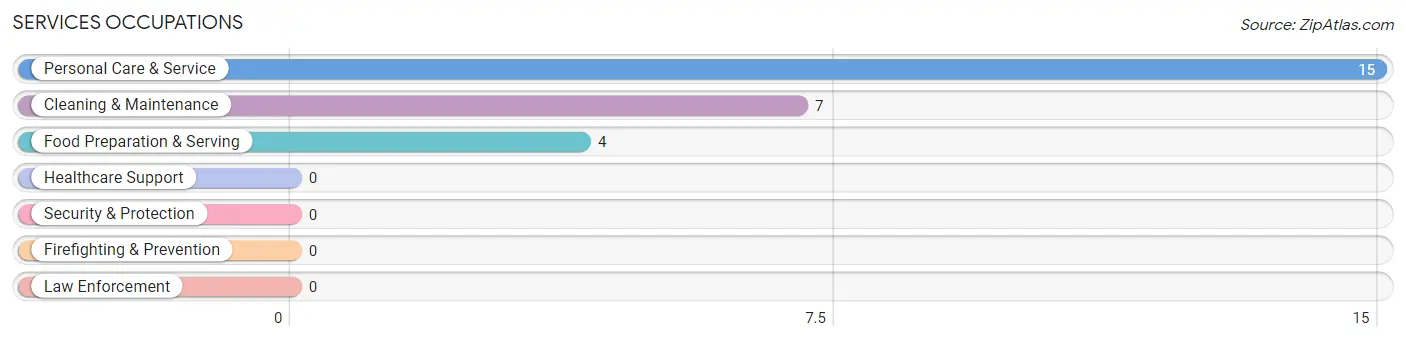
Services Occupations
The most common Services occupations in Websters Crossing are Personal Care & Service (15 | 16.5%), Cleaning & Maintenance (7 | 7.7%), and Food Preparation & Serving (4 | 4.4%).
Services Occupations by Sex
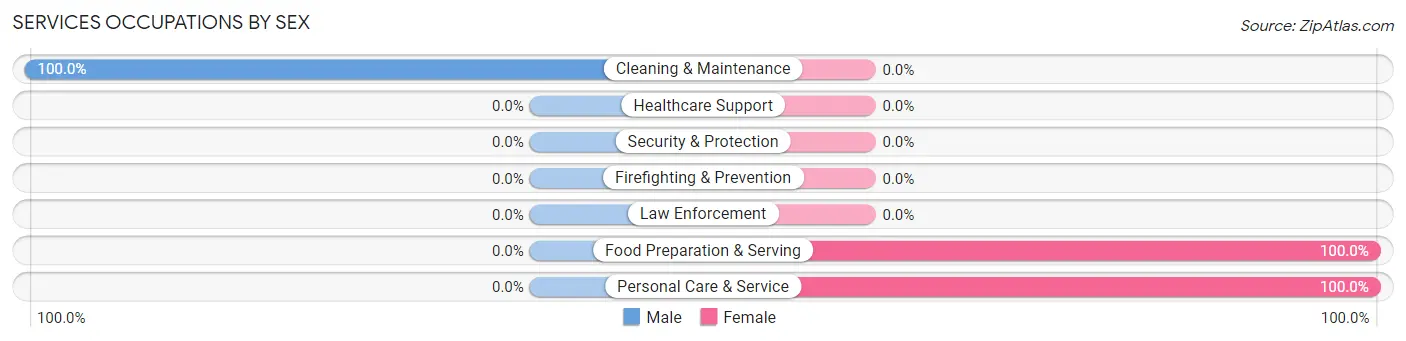
| Occupation | Male | Female |
| Healthcare Support | 0 (0.0%) | 0 (0.0%) |
| Security & Protection | 0 (0.0%) | 0 (0.0%) |
| Firefighting & Prevention | 0 (0.0%) | 0 (0.0%) |
| Law Enforcement | 0 (0.0%) | 0 (0.0%) |
| Food Preparation & Serving | 0 (0.0%) | 4 (100.0%) |
| Cleaning & Maintenance | 7 (100.0%) | 0 (0.0%) |
| Personal Care & Service | 0 (0.0%) | 15 (100.0%) |
| Total (Category) | 7 (26.9%) | 19 (73.1%) |
| Total (Overall) | 33 (36.3%) | 58 (63.7%) |
Sales and Office Occupations
The most common Sales and Office occupations in Websters Crossing are , and Office & Administration (39 | 42.9%).
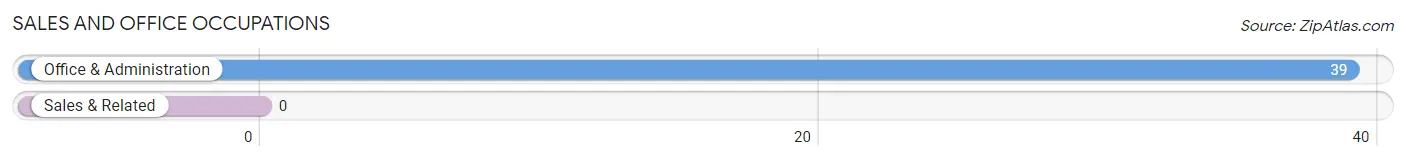
Sales and Office Occupations by Sex
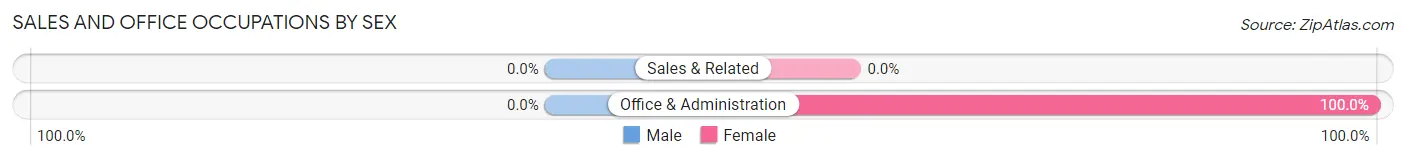
| Occupation | Male | Female |
| Sales & Related | 0 (0.0%) | 0 (0.0%) |
| Office & Administration | 0 (0.0%) | 39 (100.0%) |
| Total (Category) | 0 (0.0%) | 39 (100.0%) |
| Total (Overall) | 33 (36.3%) | 58 (63.7%) |
Natural Resources, Construction and Maintenance Occupations
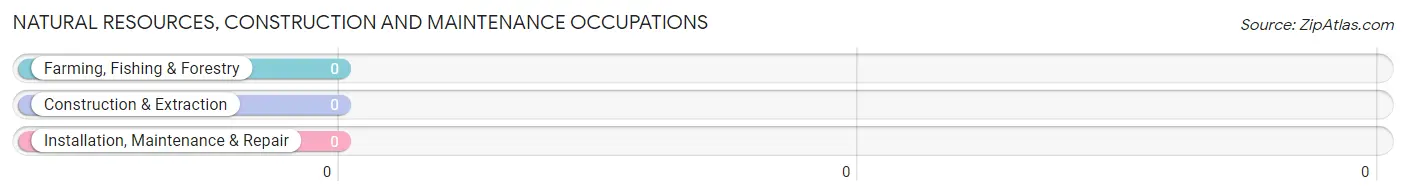
Natural Resources, Construction and Maintenance Occupations by Sex
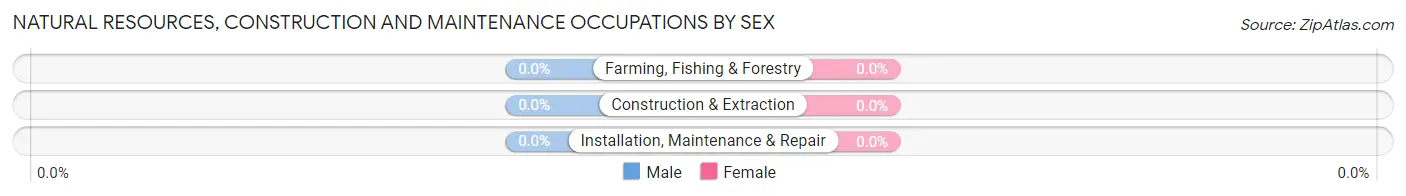
| Occupation | Male | Female |
| Farming, Fishing & Forestry | 0 (0.0%) | 0 (0.0%) |
| Construction & Extraction | 0 (0.0%) | 0 (0.0%) |
| Installation, Maintenance & Repair | 0 (0.0%) | 0 (0.0%) |
| Total (Category) | 0 (0.0%) | 0 (0.0%) |
| Total (Overall) | 33 (36.3%) | 58 (63.7%) |
Production, Transportation and Moving Occupations
The most common Production, Transportation and Moving occupations in Websters Crossing are , and Transportation (26 | 28.6%).
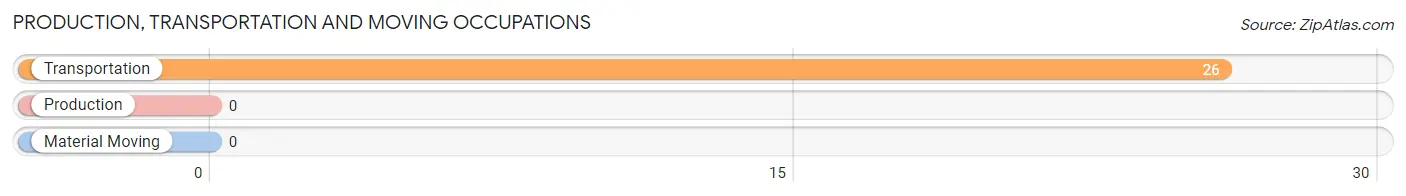
Production, Transportation and Moving Occupations by Sex
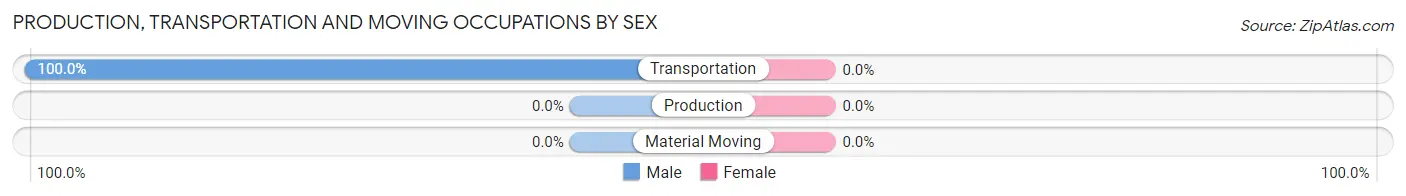
| Occupation | Male | Female |
| Production | 0 (0.0%) | 0 (0.0%) |
| Transportation | 26 (100.0%) | 0 (0.0%) |
| Material Moving | 0 (0.0%) | 0 (0.0%) |
| Total (Category) | 26 (100.0%) | 0 (0.0%) |
| Total (Overall) | 33 (36.3%) | 58 (63.7%) |
Employment Industries by Sex in Websters Crossing
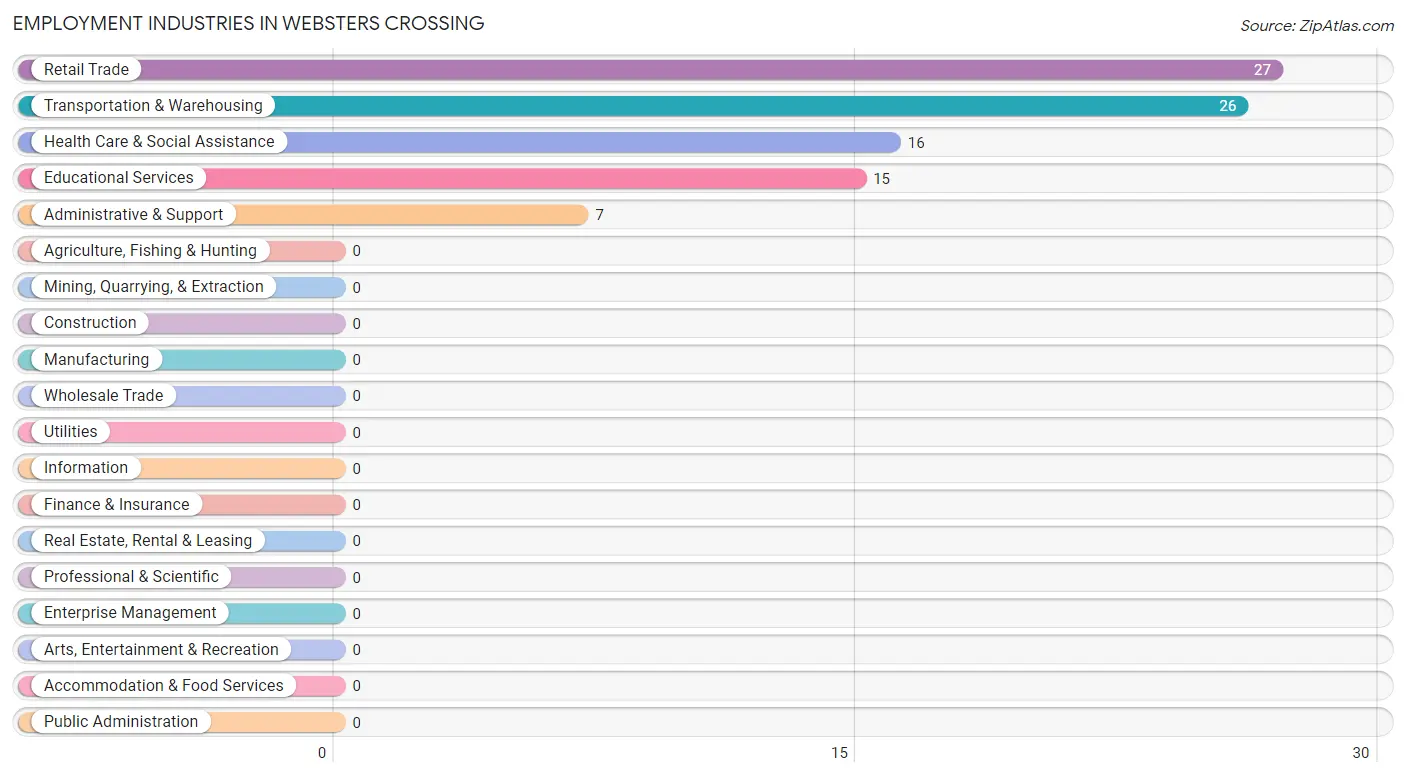
Employment Industries in Websters Crossing
The major employment industries in Websters Crossing include Retail Trade (27 | 29.7%), Transportation & Warehousing (26 | 28.6%), Health Care & Social Assistance (16 | 17.6%), Educational Services (15 | 16.5%), and Administrative & Support (7 | 7.7%).
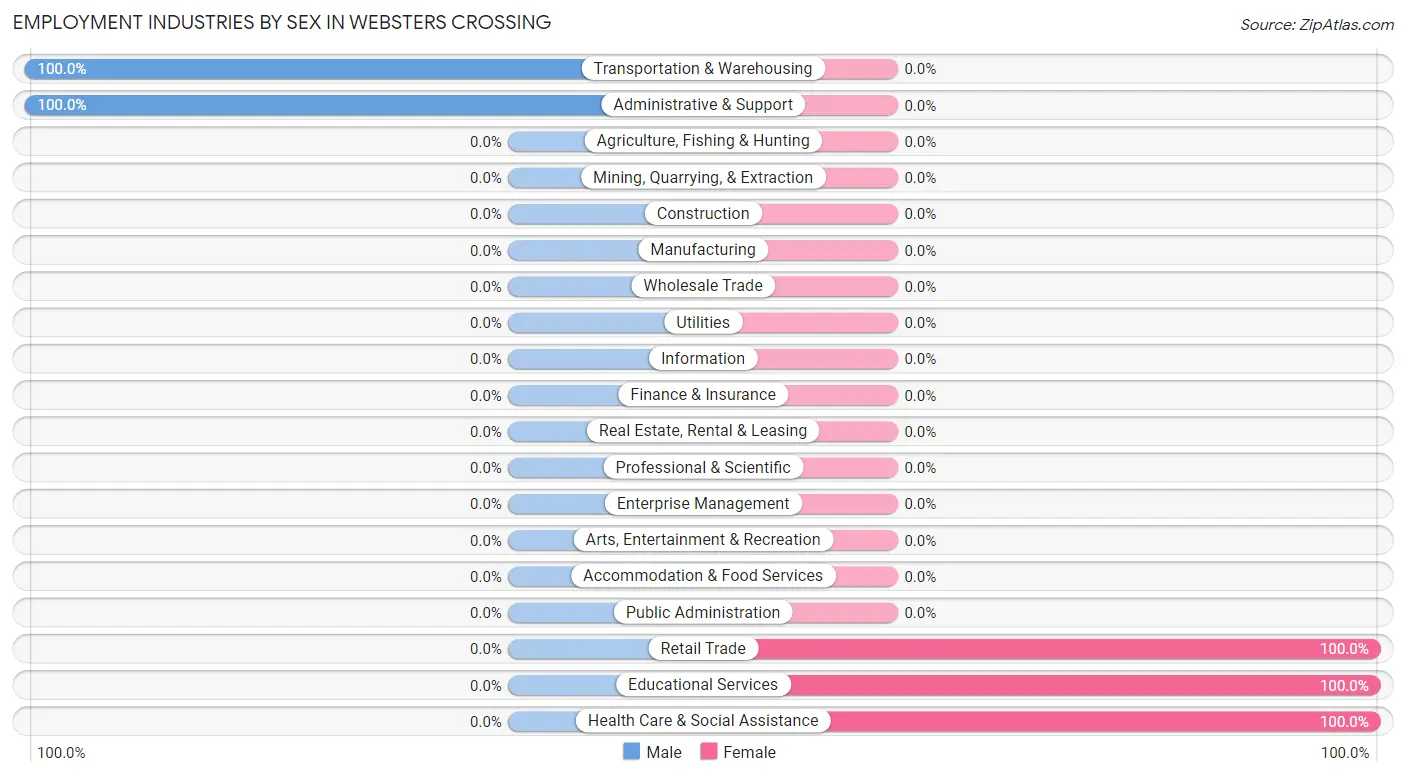
Employment Industries by Sex in Websters Crossing
The Websters Crossing industries that see more men than women are Transportation & Warehousing (100.0%), and Administrative & Support (100.0%), whereas the industries that tend to have a higher number of women are Retail Trade (100.0%), Educational Services (100.0%), and Health Care & Social Assistance (100.0%).
| Industry | Male | Female |
| Agriculture, Fishing & Hunting | 0 (0.0%) | 0 (0.0%) |
| Mining, Quarrying, & Extraction | 0 (0.0%) | 0 (0.0%) |
| Construction | 0 (0.0%) | 0 (0.0%) |
| Manufacturing | 0 (0.0%) | 0 (0.0%) |
| Wholesale Trade | 0 (0.0%) | 0 (0.0%) |
| Retail Trade | 0 (0.0%) | 27 (100.0%) |
| Transportation & Warehousing | 26 (100.0%) | 0 (0.0%) |
| Utilities | 0 (0.0%) | 0 (0.0%) |
| Information | 0 (0.0%) | 0 (0.0%) |
| Finance & Insurance | 0 (0.0%) | 0 (0.0%) |
| Real Estate, Rental & Leasing | 0 (0.0%) | 0 (0.0%) |
| Professional & Scientific | 0 (0.0%) | 0 (0.0%) |
| Enterprise Management | 0 (0.0%) | 0 (0.0%) |
| Administrative & Support | 7 (100.0%) | 0 (0.0%) |
| Educational Services | 0 (0.0%) | 15 (100.0%) |
| Health Care & Social Assistance | 0 (0.0%) | 16 (100.0%) |
| Arts, Entertainment & Recreation | 0 (0.0%) | 0 (0.0%) |
| Accommodation & Food Services | 0 (0.0%) | 0 (0.0%) |
| Public Administration | 0 (0.0%) | 0 (0.0%) |
| Total | 33 (36.3%) | 58 (63.7%) |
Education in Websters Crossing
School Enrollment in Websters Crossing
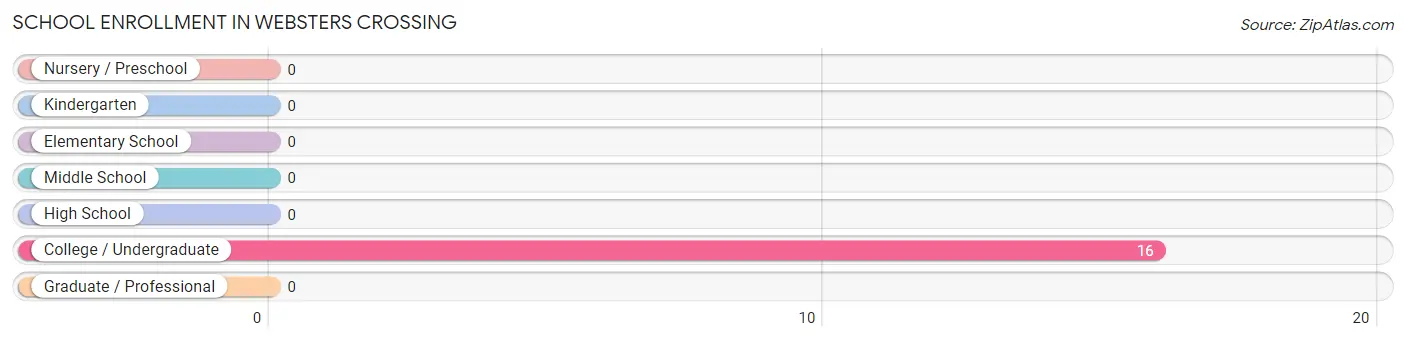
| School Level | # Students | % Students |
| Nursery / Preschool | 0 | 0.0% |
| Kindergarten | 0 | 0.0% |
| Elementary School | 0 | 0.0% |
| Middle School | 0 | 0.0% |
| High School | 0 | 0.0% |
| College / Undergraduate | 16 | 100.0% |
| Graduate / Professional | 0 | 0.0% |
| Total | 16 | 100.0% |
School Enrollment by Age by Funding Source in Websters Crossing
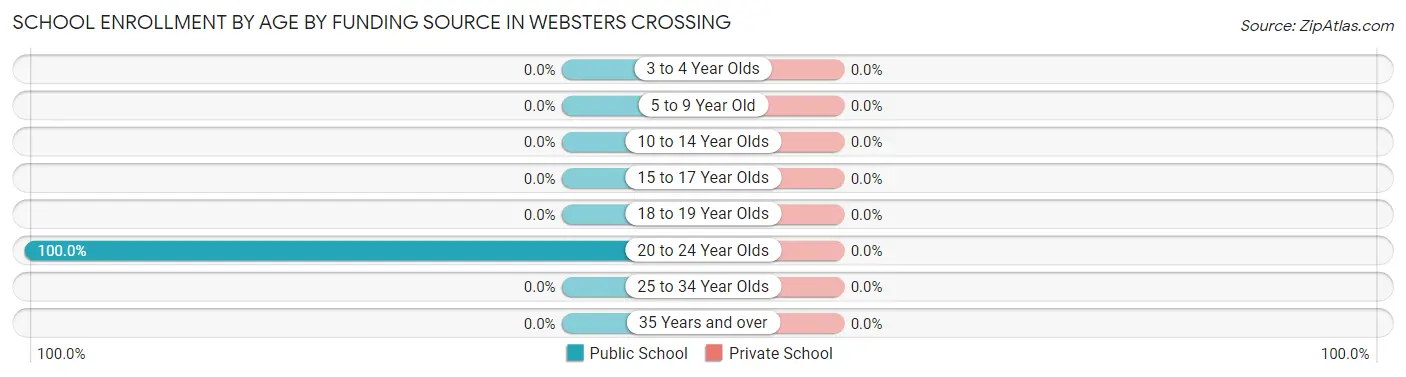
| Age Bracket | Public School | Private School |
| 3 to 4 Year Olds | 0 (0.0%) | 0 (0.0%) |
| 5 to 9 Year Old | 0 (0.0%) | 0 (0.0%) |
| 10 to 14 Year Olds | 0 (0.0%) | 0 (0.0%) |
| 15 to 17 Year Olds | 0 (0.0%) | 0 (0.0%) |
| 18 to 19 Year Olds | 0 (0.0%) | 0 (0.0%) |
| 20 to 24 Year Olds | 16 (100.0%) | 0 (0.0%) |
| 25 to 34 Year Olds | 0 (0.0%) | 0 (0.0%) |
| 35 Years and over | 0 (0.0%) | 0 (0.0%) |
| Total | 16 (100.0%) | 0 (0.0%) |
Educational Attainment by Field of Study in Websters Crossing
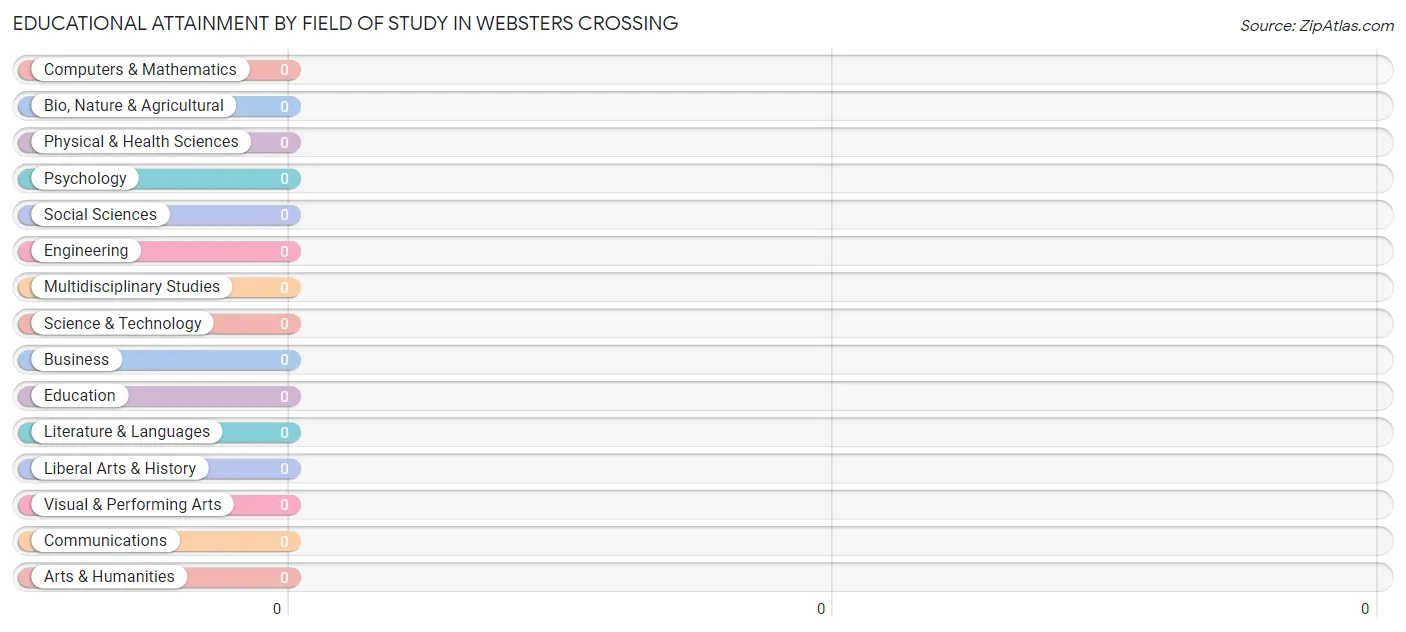
| Field of Study | # Graduates | % Graduates |
| Computers & Mathematics | 0 | 0.0% |
| Bio, Nature & Agricultural | 0 | 0.0% |
| Physical & Health Sciences | 0 | 0.0% |
| Psychology | 0 | 0.0% |
| Social Sciences | 0 | 0.0% |
| Engineering | 0 | 0.0% |
| Multidisciplinary Studies | 0 | 0.0% |
| Science & Technology | 0 | 0.0% |
| Business | 0 | 0.0% |
| Education | 0 | 0.0% |
| Literature & Languages | 0 | 0.0% |
| Liberal Arts & History | 0 | 0.0% |
| Visual & Performing Arts | 0 | 0.0% |
| Communications | 0 | 0.0% |
| Arts & Humanities | 0 | 0.0% |
| Total | 0 | 0.0% |
Transportation & Commute in Websters Crossing
Vehicle Availability by Sex in Websters Crossing
The most prevalent vehicle ownership categories in Websters Crossing are males with 2 vehicles (26, accounting for 78.8%) and females with 2 vehicles (27, making up 44.8%).
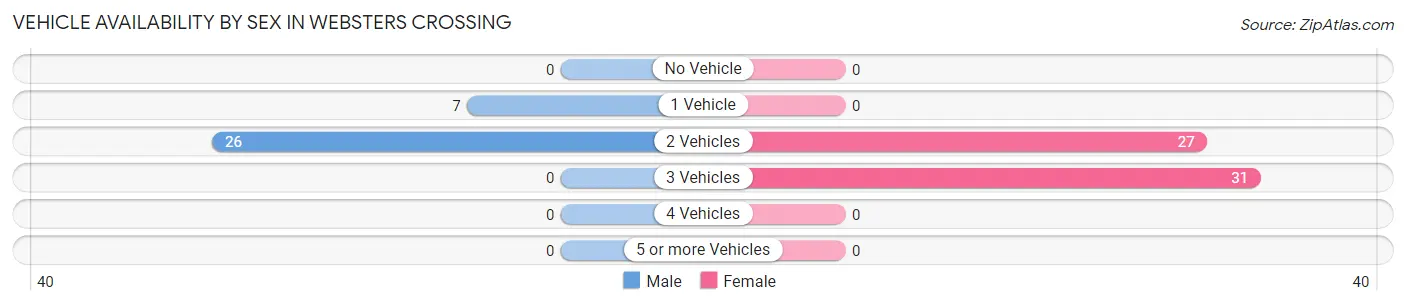
| Vehicles Available | Male | Female |
| No Vehicle | 0 (0.0%) | 0 (0.0%) |
| 1 Vehicle | 7 (21.2%) | 0 (0.0%) |
| 2 Vehicles | 26 (78.8%) | 27 (46.6%) |
| 3 Vehicles | 0 (0.0%) | 31 (53.4%) |
| 4 Vehicles | 0 (0.0%) | 0 (0.0%) |
| 5 or more Vehicles | 0 (0.0%) | 0 (0.0%) |
| Total | 33 (100.0%) | 58 (100.0%) |
Commute Time in Websters Crossing
The most frequently occuring commute durations in Websters Crossing are 10 to 14 minutes (31 commuters, 34.1%), 25 to 29 minutes (26 commuters, 28.6%), and 20 to 24 minutes (23 commuters, 25.3%).
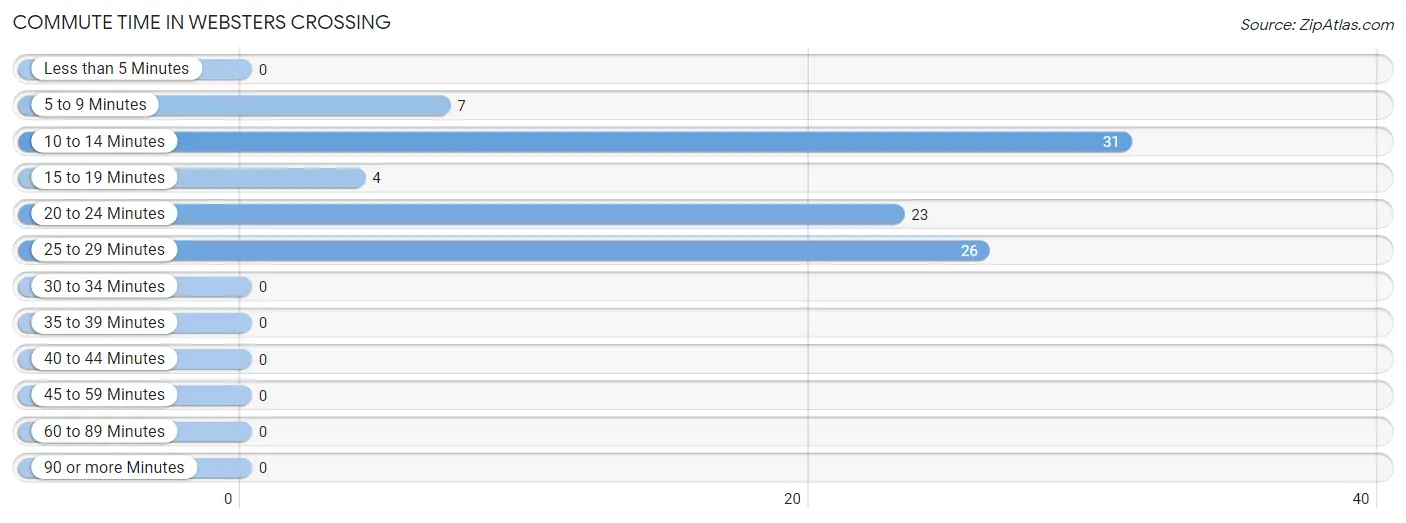
| Commute Time | # Commuters | % Commuters |
| Less than 5 Minutes | 0 | 0.0% |
| 5 to 9 Minutes | 7 | 7.7% |
| 10 to 14 Minutes | 31 | 34.1% |
| 15 to 19 Minutes | 4 | 4.4% |
| 20 to 24 Minutes | 23 | 25.3% |
| 25 to 29 Minutes | 26 | 28.6% |
| 30 to 34 Minutes | 0 | 0.0% |
| 35 to 39 Minutes | 0 | 0.0% |
| 40 to 44 Minutes | 0 | 0.0% |
| 45 to 59 Minutes | 0 | 0.0% |
| 60 to 89 Minutes | 0 | 0.0% |
| 90 or more Minutes | 0 | 0.0% |
Commute Time by Sex in Websters Crossing
The most common commute times in Websters Crossing are 25 to 29 minutes (26 commuters, 78.8%) for males and 10 to 14 minutes (31 commuters, 53.4%) for females.
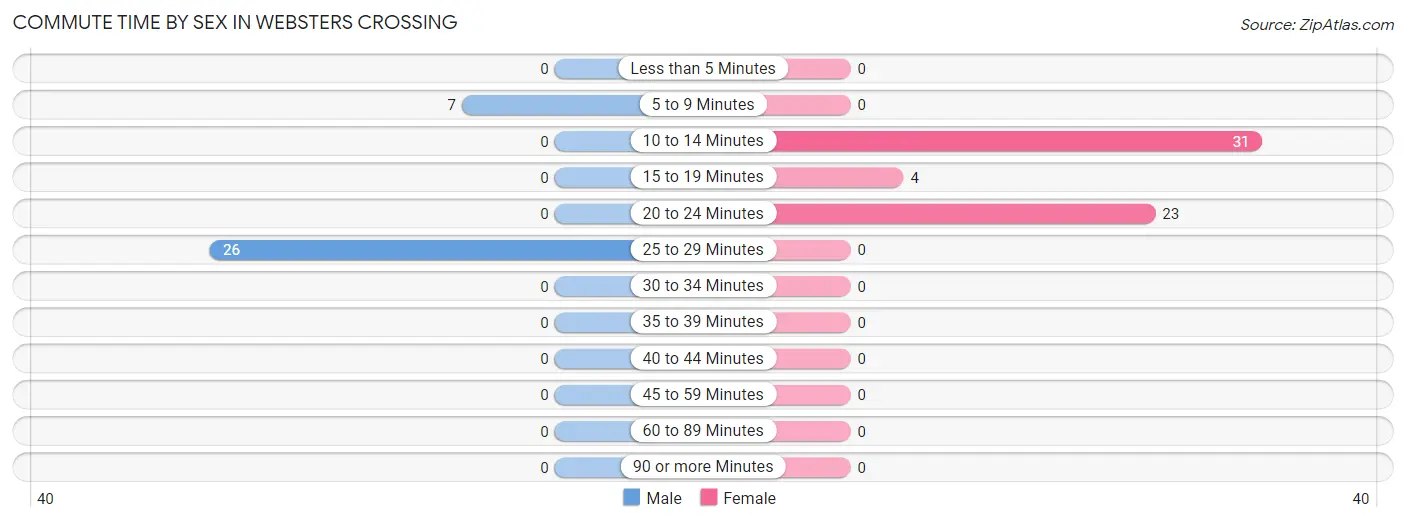
| Commute Time | Male | Female |
| Less than 5 Minutes | 0 (0.0%) | 0 (0.0%) |
| 5 to 9 Minutes | 7 (21.2%) | 0 (0.0%) |
| 10 to 14 Minutes | 0 (0.0%) | 31 (53.4%) |
| 15 to 19 Minutes | 0 (0.0%) | 4 (6.9%) |
| 20 to 24 Minutes | 0 (0.0%) | 23 (39.7%) |
| 25 to 29 Minutes | 26 (78.8%) | 0 (0.0%) |
| 30 to 34 Minutes | 0 (0.0%) | 0 (0.0%) |
| 35 to 39 Minutes | 0 (0.0%) | 0 (0.0%) |
| 40 to 44 Minutes | 0 (0.0%) | 0 (0.0%) |
| 45 to 59 Minutes | 0 (0.0%) | 0 (0.0%) |
| 60 to 89 Minutes | 0 (0.0%) | 0 (0.0%) |
| 90 or more Minutes | 0 (0.0%) | 0 (0.0%) |
Time of Departure to Work by Sex in Websters Crossing
The most frequent times of departure to work in Websters Crossing are 5:00 AM to 5:29 AM (26, 78.8%) for males and 7:00 AM to 7:29 AM (23, 39.7%) for females.
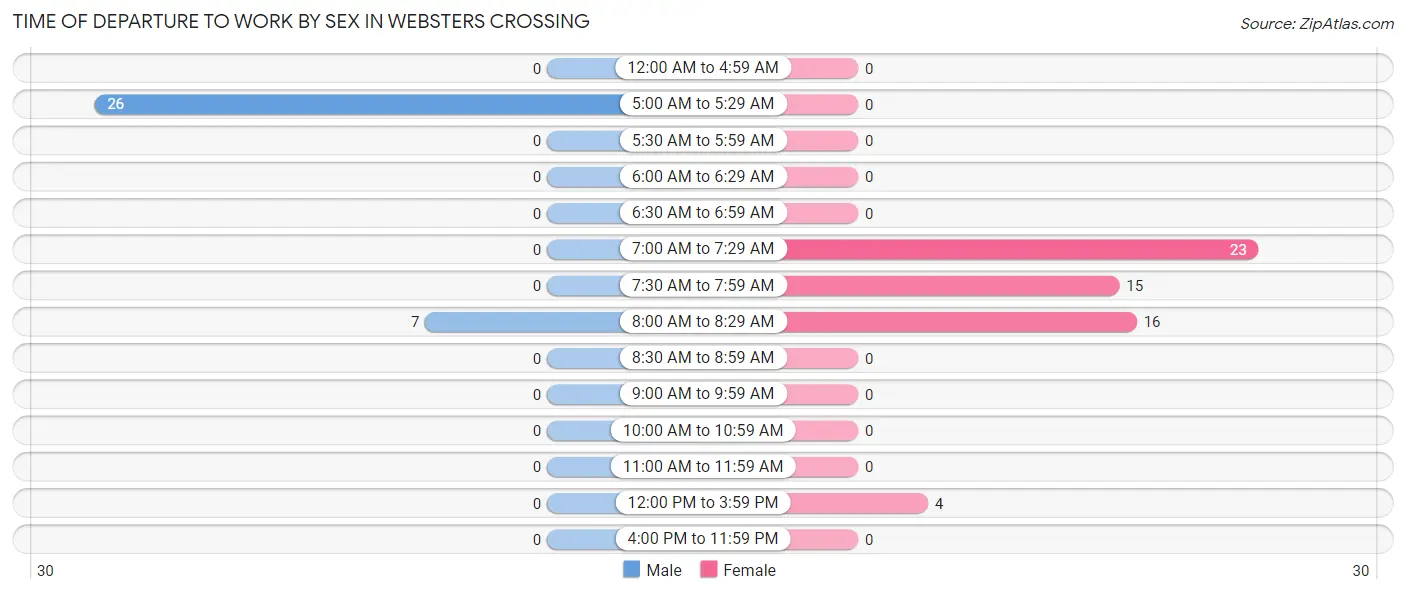
| Time of Departure | Male | Female |
| 12:00 AM to 4:59 AM | 0 (0.0%) | 0 (0.0%) |
| 5:00 AM to 5:29 AM | 26 (78.8%) | 0 (0.0%) |
| 5:30 AM to 5:59 AM | 0 (0.0%) | 0 (0.0%) |
| 6:00 AM to 6:29 AM | 0 (0.0%) | 0 (0.0%) |
| 6:30 AM to 6:59 AM | 0 (0.0%) | 0 (0.0%) |
| 7:00 AM to 7:29 AM | 0 (0.0%) | 23 (39.7%) |
| 7:30 AM to 7:59 AM | 0 (0.0%) | 15 (25.9%) |
| 8:00 AM to 8:29 AM | 7 (21.2%) | 16 (27.6%) |
| 8:30 AM to 8:59 AM | 0 (0.0%) | 0 (0.0%) |
| 9:00 AM to 9:59 AM | 0 (0.0%) | 0 (0.0%) |
| 10:00 AM to 10:59 AM | 0 (0.0%) | 0 (0.0%) |
| 11:00 AM to 11:59 AM | 0 (0.0%) | 0 (0.0%) |
| 12:00 PM to 3:59 PM | 0 (0.0%) | 4 (6.9%) |
| 4:00 PM to 11:59 PM | 0 (0.0%) | 0 (0.0%) |
| Total | 33 (100.0%) | 58 (100.0%) |
Housing Occupancy in Websters Crossing
Occupancy by Ownership in Websters Crossing
Of the total 52 dwellings in Websters Crossing, owner-occupied units account for 52 (100.0%), while renter-occupied units make up 0 (0.0%).
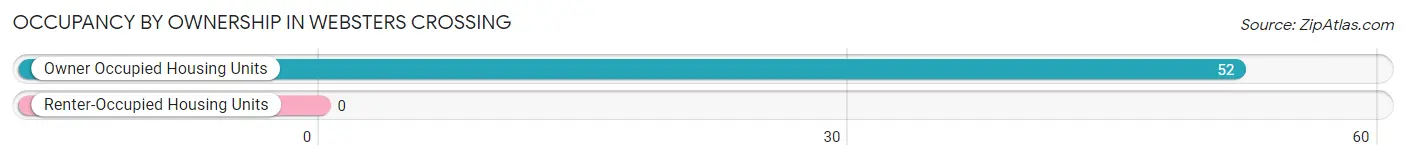
| Occupancy | # Housing Units | % Housing Units |
| Owner Occupied Housing Units | 52 | 100.0% |
| Renter-Occupied Housing Units | 0 | 0.0% |
| Total Occupied Housing Units | 52 | 100.0% |
Occupancy by Household Size in Websters Crossing
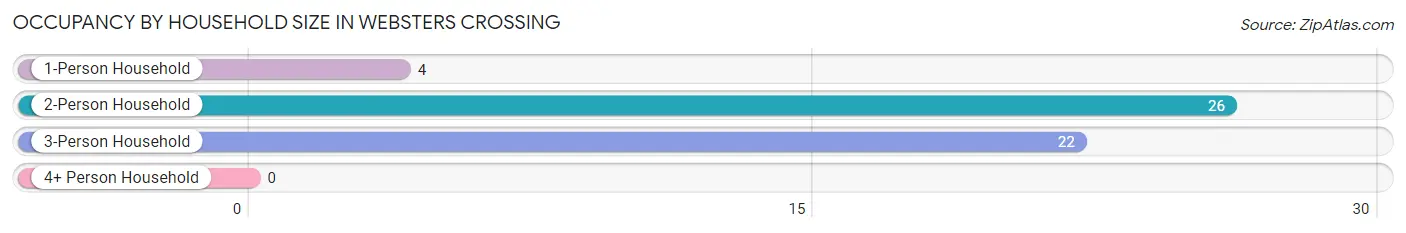
| Household Size | # Housing Units | % Housing Units |
| 1-Person Household | 4 | 7.7% |
| 2-Person Household | 26 | 50.0% |
| 3-Person Household | 22 | 42.3% |
| 4+ Person Household | 0 | 0.0% |
| Total Housing Units | 52 | 100.0% |
Occupancy by Ownership by Household Size in Websters Crossing
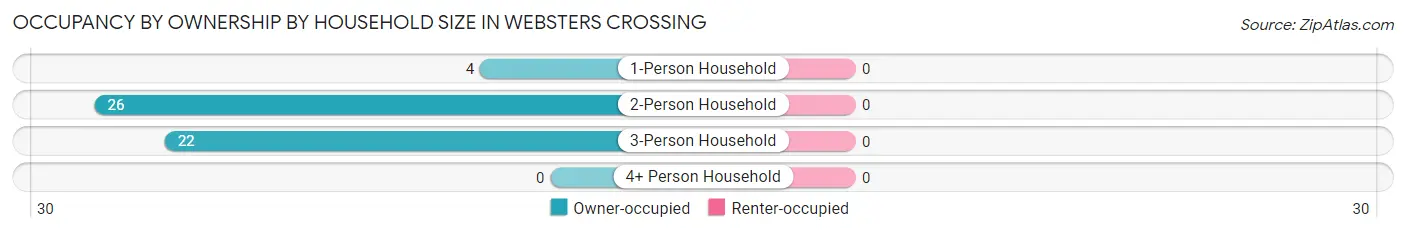
| Household Size | Owner-occupied | Renter-occupied |
| 1-Person Household | 4 (100.0%) | 0 (0.0%) |
| 2-Person Household | 26 (100.0%) | 0 (0.0%) |
| 3-Person Household | 22 (100.0%) | 0 (0.0%) |
| 4+ Person Household | 0 (0.0%) | 0 (0.0%) |
| Total Housing Units | 52 (100.0%) | 0 (0.0%) |
Occupancy by Educational Attainment in Websters Crossing
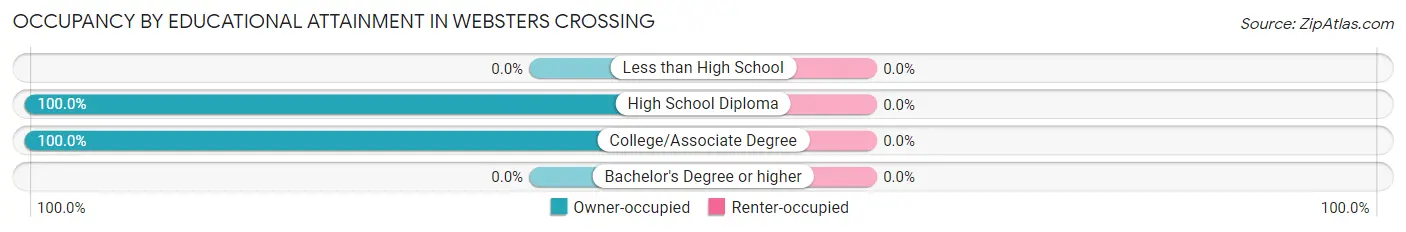
| Household Size | Owner-occupied | Renter-occupied |
| Less than High School | 0 (0.0%) | 0 (0.0%) |
| High School Diploma | 41 (100.0%) | 0 (0.0%) |
| College/Associate Degree | 11 (100.0%) | 0 (0.0%) |
| Bachelor's Degree or higher | 0 (0.0%) | 0 (0.0%) |
Occupancy by Age of Householder in Websters Crossing
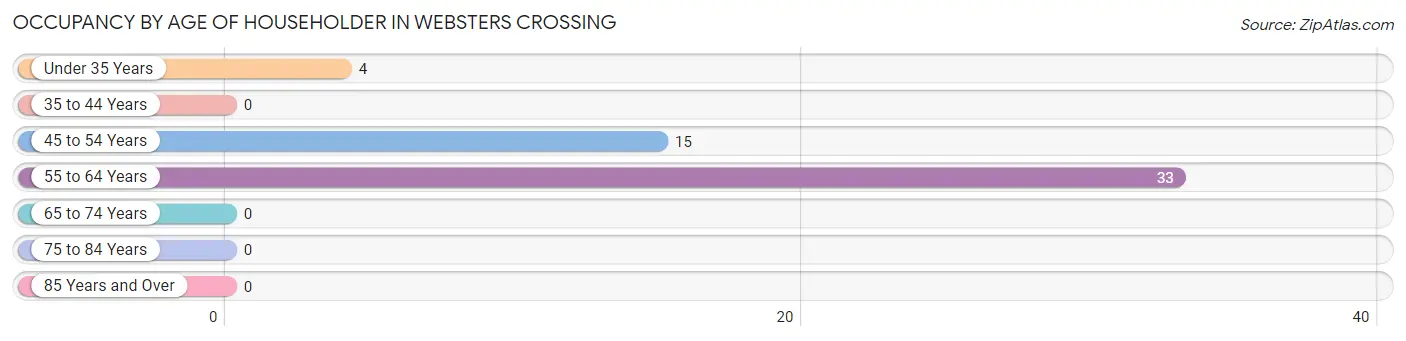
| Age Bracket | # Households | % Households |
| Under 35 Years | 4 | 7.7% |
| 35 to 44 Years | 0 | 0.0% |
| 45 to 54 Years | 15 | 28.8% |
| 55 to 64 Years | 33 | 63.5% |
| 65 to 74 Years | 0 | 0.0% |
| 75 to 84 Years | 0 | 0.0% |
| 85 Years and Over | 0 | 0.0% |
| Total | 52 | 100.0% |
Housing Finances in Websters Crossing
Median Income by Occupancy in Websters Crossing
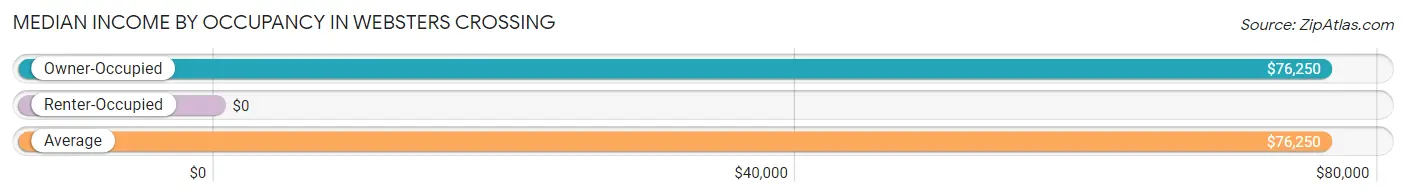
| Occupancy Type | # Households | Median Income |
| Owner-Occupied | 52 (100.0%) | $76,250 |
| Renter-Occupied | 0 (0.0%) | $0 |
| Average | 52 (100.0%) | $76,250 |
Occupancy by Householder Income Bracket in Websters Crossing
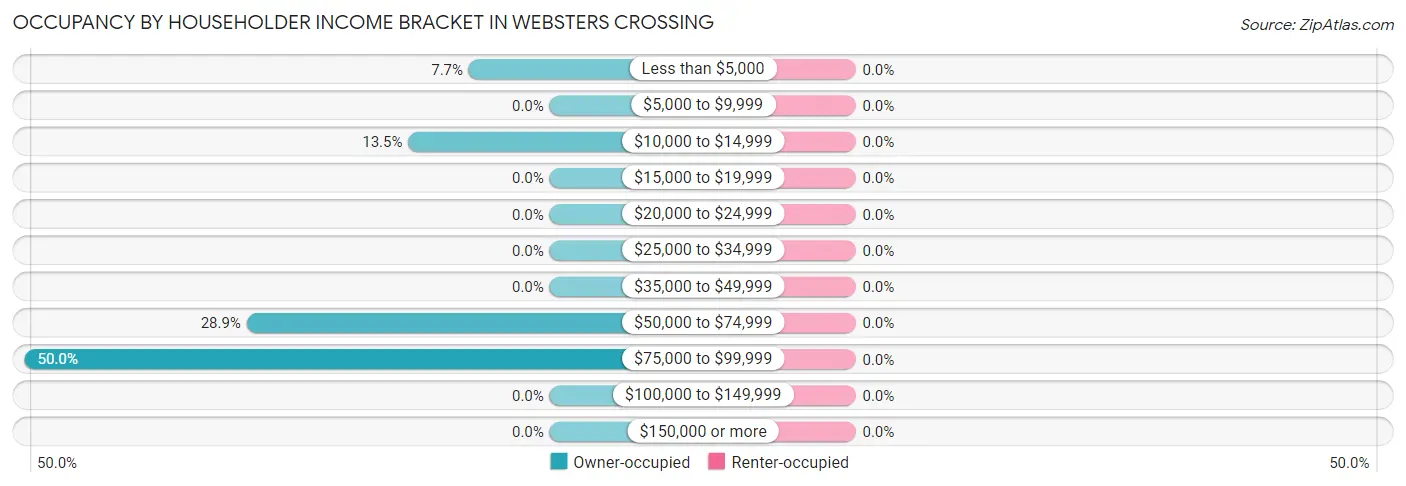
| Income Bracket | Owner-occupied | Renter-occupied |
| Less than $5,000 | 4 (7.7%) | 0 (0.0%) |
| $5,000 to $9,999 | 0 (0.0%) | 0 (0.0%) |
| $10,000 to $14,999 | 7 (13.5%) | 0 (0.0%) |
| $15,000 to $19,999 | 0 (0.0%) | 0 (0.0%) |
| $20,000 to $24,999 | 0 (0.0%) | 0 (0.0%) |
| $25,000 to $34,999 | 0 (0.0%) | 0 (0.0%) |
| $35,000 to $49,999 | 0 (0.0%) | 0 (0.0%) |
| $50,000 to $74,999 | 15 (28.8%) | 0 (0.0%) |
| $75,000 to $99,999 | 26 (50.0%) | 0 (0.0%) |
| $100,000 to $149,999 | 0 (0.0%) | 0 (0.0%) |
| $150,000 or more | 0 (0.0%) | 0 (0.0%) |
| Total | 52 (100.0%) | 0 (0.0%) |
Monthly Housing Cost Tiers in Websters Crossing
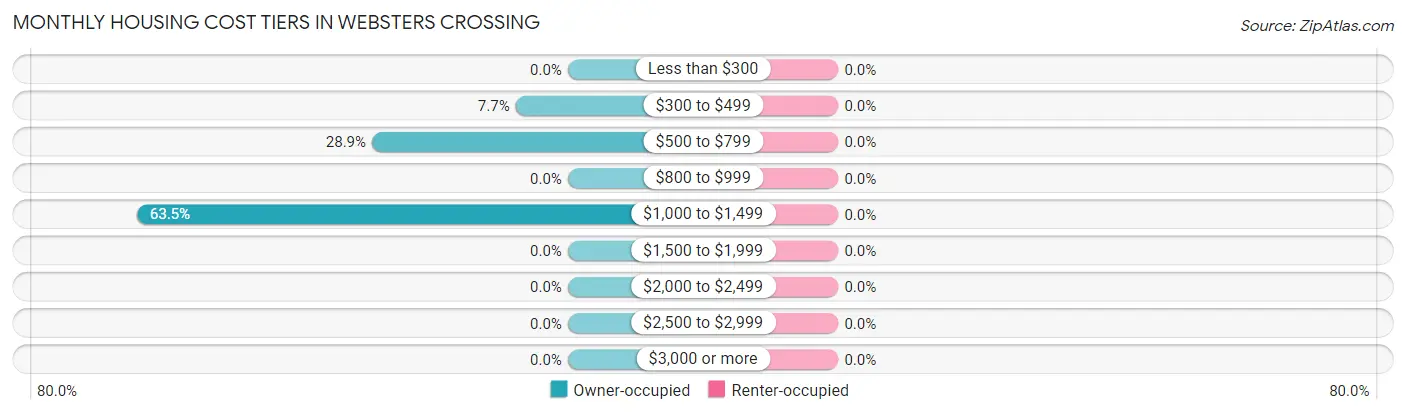
| Monthly Cost | Owner-occupied | Renter-occupied |
| Less than $300 | 0 (0.0%) | 0 (0.0%) |
| $300 to $499 | 4 (7.7%) | 0 (0.0%) |
| $500 to $799 | 15 (28.8%) | 0 (0.0%) |
| $800 to $999 | 0 (0.0%) | 0 (0.0%) |
| $1,000 to $1,499 | 33 (63.5%) | 0 (0.0%) |
| $1,500 to $1,999 | 0 (0.0%) | 0 (0.0%) |
| $2,000 to $2,499 | 0 (0.0%) | 0 (0.0%) |
| $2,500 to $2,999 | 0 (0.0%) | 0 (0.0%) |
| $3,000 or more | 0 (0.0%) | 0 (0.0%) |
| Total | 52 (100.0%) | 0 (0.0%) |
Physical Housing Characteristics in Websters Crossing
Housing Structures in Websters Crossing
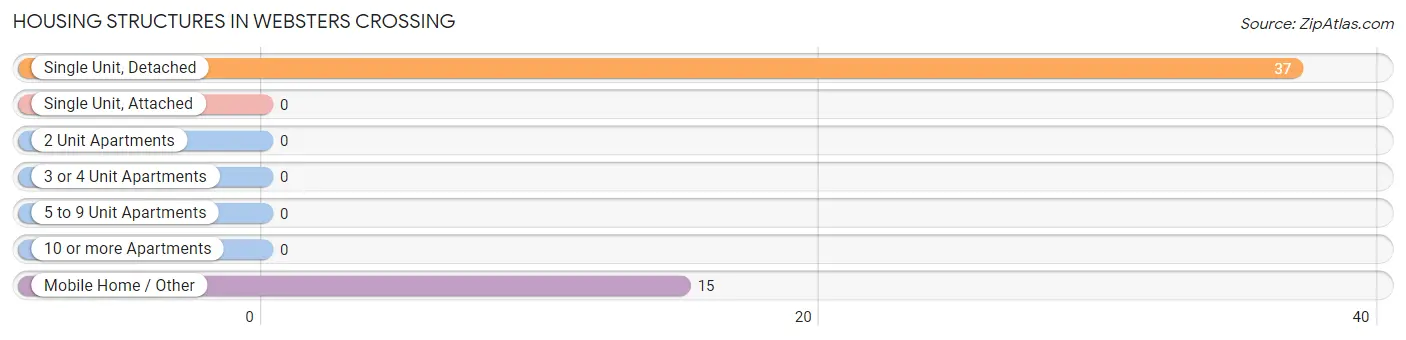
| Structure Type | # Housing Units | % Housing Units |
| Single Unit, Detached | 37 | 71.2% |
| Single Unit, Attached | 0 | 0.0% |
| 2 Unit Apartments | 0 | 0.0% |
| 3 or 4 Unit Apartments | 0 | 0.0% |
| 5 to 9 Unit Apartments | 0 | 0.0% |
| 10 or more Apartments | 0 | 0.0% |
| Mobile Home / Other | 15 | 28.8% |
| Total | 52 | 100.0% |
Housing Structures by Occupancy in Websters Crossing
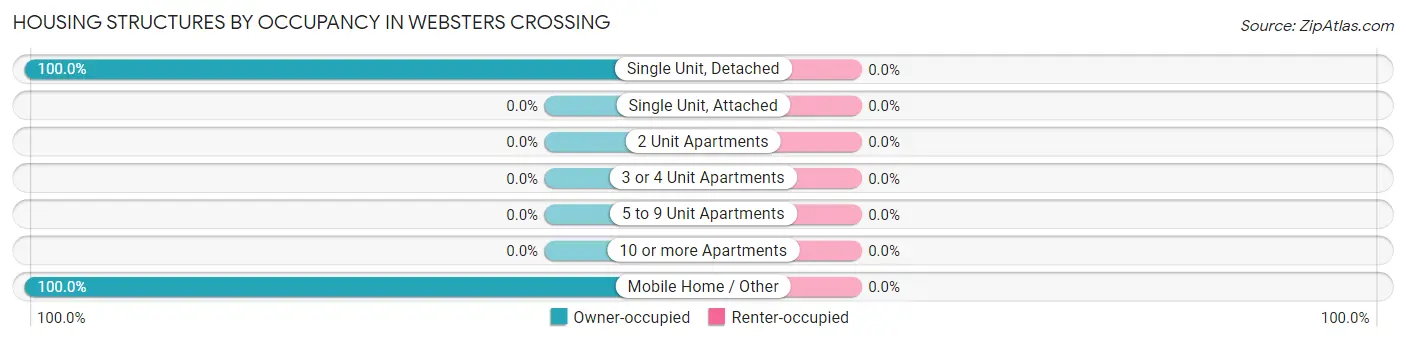
| Structure Type | Owner-occupied | Renter-occupied |
| Single Unit, Detached | 37 (100.0%) | 0 (0.0%) |
| Single Unit, Attached | 0 (0.0%) | 0 (0.0%) |
| 2 Unit Apartments | 0 (0.0%) | 0 (0.0%) |
| 3 or 4 Unit Apartments | 0 (0.0%) | 0 (0.0%) |
| 5 to 9 Unit Apartments | 0 (0.0%) | 0 (0.0%) |
| 10 or more Apartments | 0 (0.0%) | 0 (0.0%) |
| Mobile Home / Other | 15 (100.0%) | 0 (0.0%) |
| Total | 52 (100.0%) | 0 (0.0%) |
Housing Structures by Number of Rooms in Websters Crossing
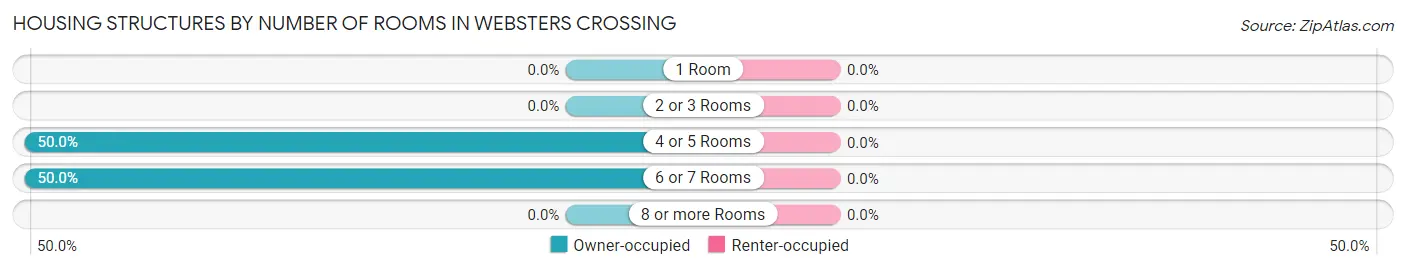
| Number of Rooms | Owner-occupied | Renter-occupied |
| 1 Room | 0 (0.0%) | 0 (0.0%) |
| 2 or 3 Rooms | 0 (0.0%) | 0 (0.0%) |
| 4 or 5 Rooms | 26 (50.0%) | 0 (0.0%) |
| 6 or 7 Rooms | 26 (50.0%) | 0 (0.0%) |
| 8 or more Rooms | 0 (0.0%) | 0 (0.0%) |
| Total | 52 (100.0%) | 0 (0.0%) |
Housing Structure by Heating Type in Websters Crossing
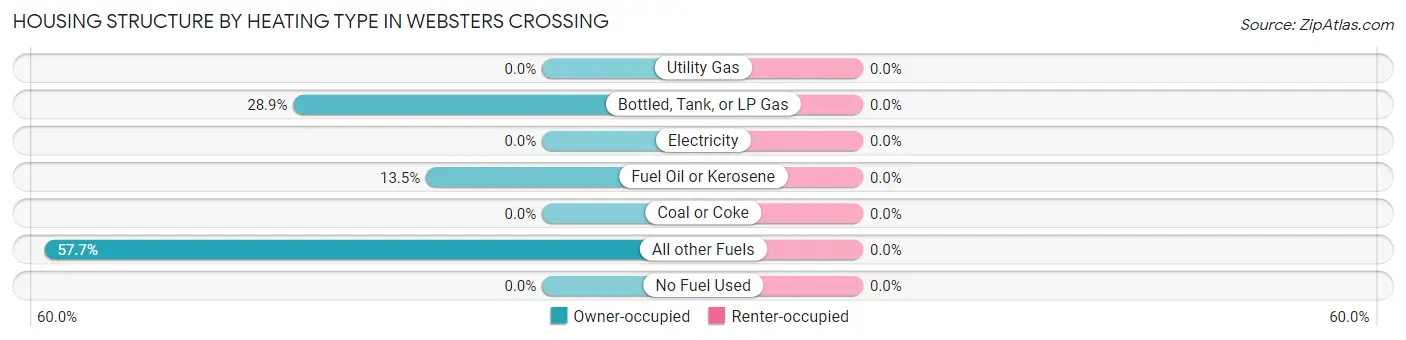
| Heating Type | Owner-occupied | Renter-occupied |
| Utility Gas | 0 (0.0%) | 0 (0.0%) |
| Bottled, Tank, or LP Gas | 15 (28.8%) | 0 (0.0%) |
| Electricity | 0 (0.0%) | 0 (0.0%) |
| Fuel Oil or Kerosene | 7 (13.5%) | 0 (0.0%) |
| Coal or Coke | 0 (0.0%) | 0 (0.0%) |
| All other Fuels | 30 (57.7%) | 0 (0.0%) |
| No Fuel Used | 0 (0.0%) | 0 (0.0%) |
| Total | 52 (100.0%) | 0 (0.0%) |
Household Vehicle Usage in Websters Crossing
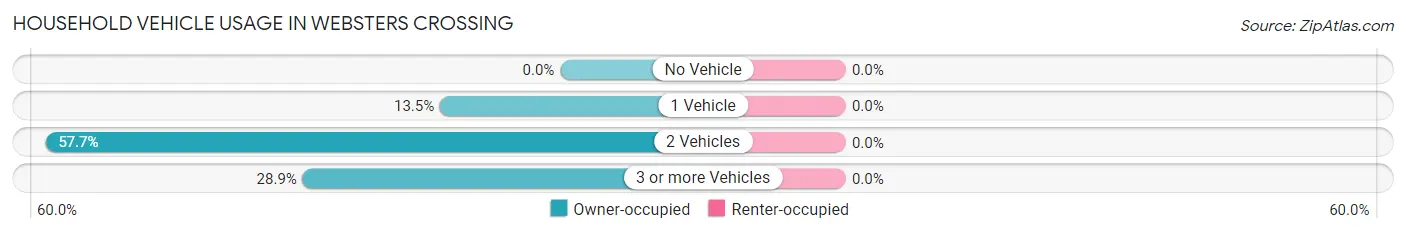
| Vehicles per Household | Owner-occupied | Renter-occupied |
| No Vehicle | 0 (0.0%) | 0 (0.0%) |
| 1 Vehicle | 7 (13.5%) | 0 (0.0%) |
| 2 Vehicles | 30 (57.7%) | 0 (0.0%) |
| 3 or more Vehicles | 15 (28.8%) | 0 (0.0%) |
| Total | 52 (100.0%) | 0 (0.0%) |
Real Estate & Mortgages in Websters Crossing
Real Estate and Mortgage Overview in Websters Crossing
| Characteristic | Without Mortgage | With Mortgage |
| Housing Units | 19 | 33 |
| Median Property Value | - | - |
| Median Household Income | - | - |
| Monthly Housing Costs | - | - |
| Real Estate Taxes | - | - |
Property Value by Mortgage Status in Websters Crossing
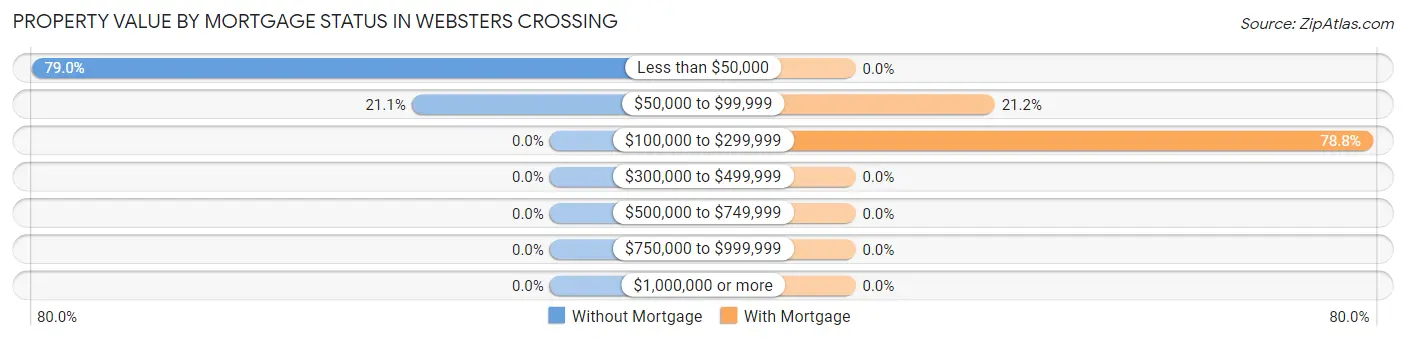
| Property Value | Without Mortgage | With Mortgage |
| Less than $50,000 | 15 (78.9%) | 0 (0.0%) |
| $50,000 to $99,999 | 4 (21.0%) | 7 (21.2%) |
| $100,000 to $299,999 | 0 (0.0%) | 26 (78.8%) |
| $300,000 to $499,999 | 0 (0.0%) | 0 (0.0%) |
| $500,000 to $749,999 | 0 (0.0%) | 0 (0.0%) |
| $750,000 to $999,999 | 0 (0.0%) | 0 (0.0%) |
| $1,000,000 or more | 0 (0.0%) | 0 (0.0%) |
| Total | 19 (100.0%) | 33 (100.0%) |
Household Income by Mortgage Status in Websters Crossing
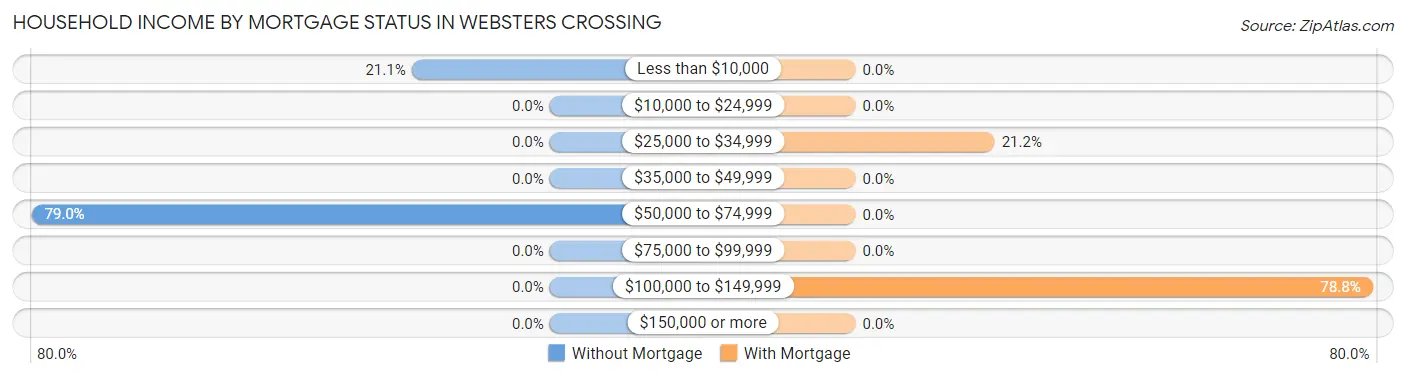
| Household Income | Without Mortgage | With Mortgage |
| Less than $10,000 | 4 (21.0%) | 0 (0.0%) |
| $10,000 to $24,999 | 0 (0.0%) | 0 (0.0%) |
| $25,000 to $34,999 | 0 (0.0%) | 7 (21.2%) |
| $35,000 to $49,999 | 0 (0.0%) | 0 (0.0%) |
| $50,000 to $74,999 | 15 (78.9%) | 0 (0.0%) |
| $75,000 to $99,999 | 0 (0.0%) | 0 (0.0%) |
| $100,000 to $149,999 | 0 (0.0%) | 26 (78.8%) |
| $150,000 or more | 0 (0.0%) | 0 (0.0%) |
| Total | 19 (100.0%) | 33 (100.0%) |
Property Value to Household Income Ratio in Websters Crossing
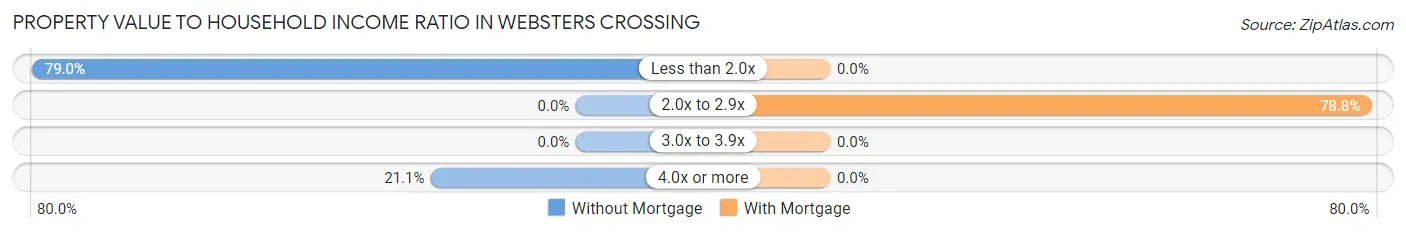
| Value-to-Income Ratio | Without Mortgage | With Mortgage |
| Less than 2.0x | 15 (78.9%) | 0 (0.0%) |
| 2.0x to 2.9x | 0 (0.0%) | 26 (78.8%) |
| 3.0x to 3.9x | 0 (0.0%) | 0 (0.0%) |
| 4.0x or more | 4 (21.0%) | 0 (0.0%) |
| Total | 19 (100.0%) | 33 (100.0%) |
Real Estate Taxes by Mortgage Status in Websters Crossing
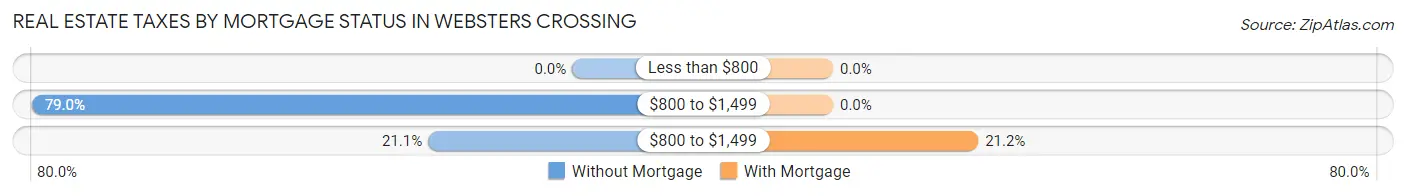
| Property Taxes | Without Mortgage | With Mortgage |
| Less than $800 | 0 (0.0%) | 0 (0.0%) |
| $800 to $1,499 | 15 (78.9%) | 0 (0.0%) |
| $800 to $1,499 | 4 (21.0%) | 7 (21.2%) |
| Total | 19 (100.0%) | 33 (100.0%) |
Health & Disability in Websters Crossing
Health Insurance Coverage by Age in Websters Crossing
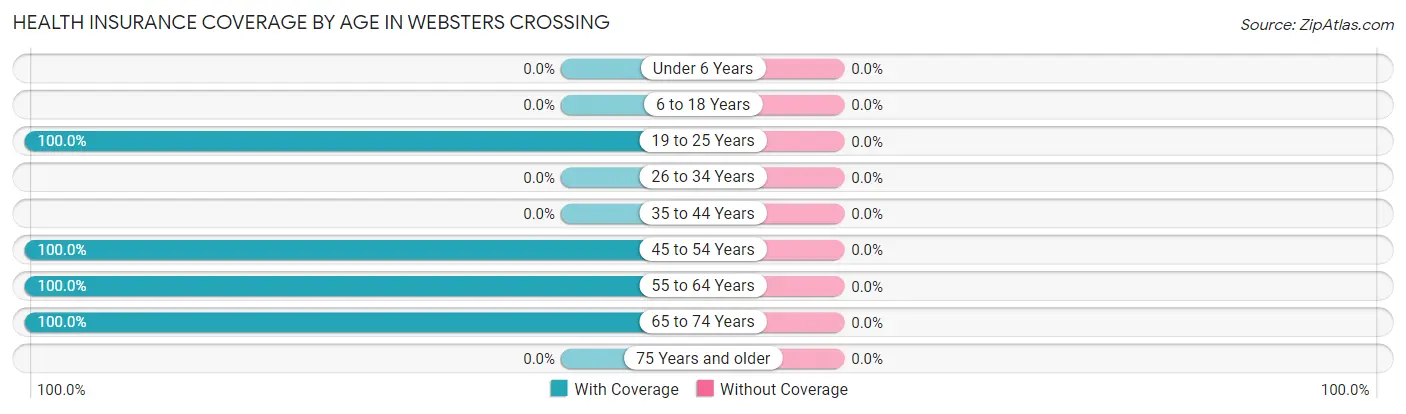
| Age Bracket | With Coverage | Without Coverage |
| Under 6 Years | 0 (0.0%) | 0 (0.0%) |
| 6 to 18 Years | 0 (0.0%) | 0 (0.0%) |
| 19 to 25 Years | 32 (100.0%) | 0 (0.0%) |
| 26 to 34 Years | 0 (0.0%) | 0 (0.0%) |
| 35 to 44 Years | 0 (0.0%) | 0 (0.0%) |
| 45 to 54 Years | 22 (100.0%) | 0 (0.0%) |
| 55 to 64 Years | 56 (100.0%) | 0 (0.0%) |
| 65 to 74 Years | 14 (100.0%) | 0 (0.0%) |
| 75 Years and older | 0 (0.0%) | 0 (0.0%) |
| Total | 124 (100.0%) | 0 (0.0%) |
Health Insurance Coverage by Citizenship Status in Websters Crossing
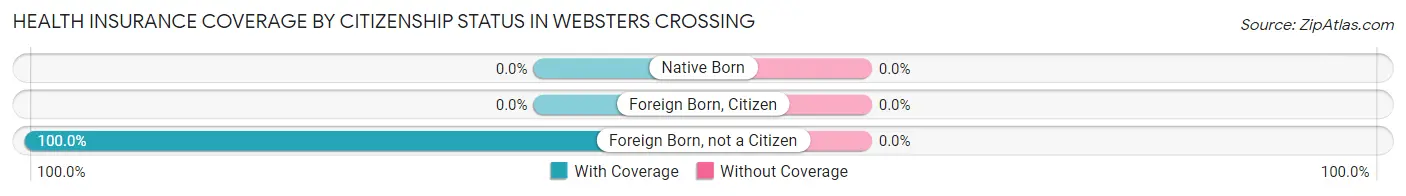
| Citizenship Status | With Coverage | Without Coverage |
| Native Born | 0 (0.0%) | 0 (0.0%) |
| Foreign Born, Citizen | 0 (0.0%) | 0 (0.0%) |
| Foreign Born, not a Citizen | 32 (100.0%) | 0 (0.0%) |
Health Insurance Coverage by Household Income in Websters Crossing
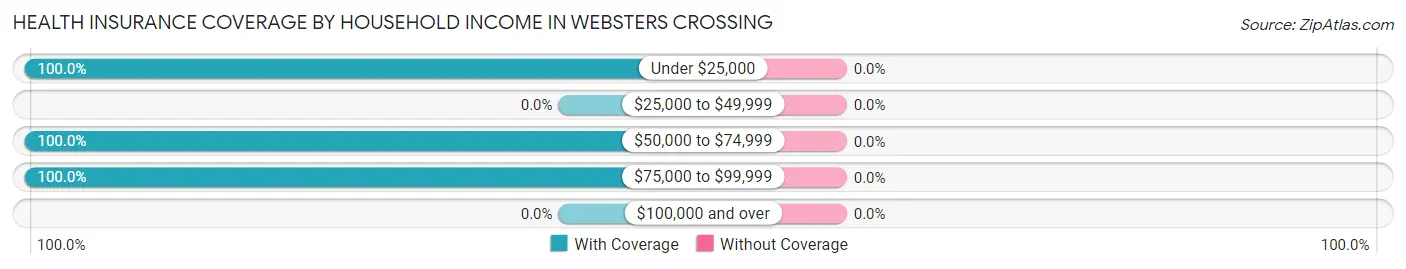
| Household Income | With Coverage | Without Coverage |
| Under $25,000 | 30 (100.0%) | 0 (0.0%) |
| $25,000 to $49,999 | 0 (0.0%) | 0 (0.0%) |
| $50,000 to $74,999 | 45 (100.0%) | 0 (0.0%) |
| $75,000 to $99,999 | 49 (100.0%) | 0 (0.0%) |
| $100,000 and over | 0 (0.0%) | 0 (0.0%) |
Public vs Private Health Insurance Coverage by Age in Websters Crossing
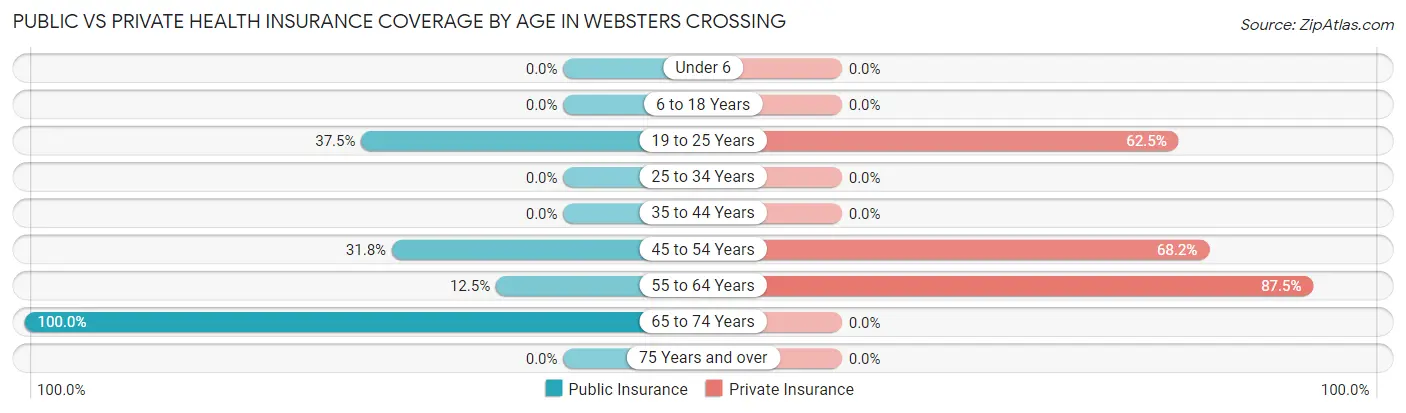
| Age Bracket | Public Insurance | Private Insurance |
| Under 6 | 0 (0.0%) | 0 (0.0%) |
| 6 to 18 Years | 0 (0.0%) | 0 (0.0%) |
| 19 to 25 Years | 12 (37.5%) | 20 (62.5%) |
| 25 to 34 Years | 0 (0.0%) | 0 (0.0%) |
| 35 to 44 Years | 0 (0.0%) | 0 (0.0%) |
| 45 to 54 Years | 7 (31.8%) | 15 (68.2%) |
| 55 to 64 Years | 7 (12.5%) | 49 (87.5%) |
| 65 to 74 Years | 14 (100.0%) | 0 (0.0%) |
| 75 Years and over | 0 (0.0%) | 0 (0.0%) |
| Total | 40 (32.3%) | 84 (67.7%) |
Disability Status by Sex by Age in Websters Crossing
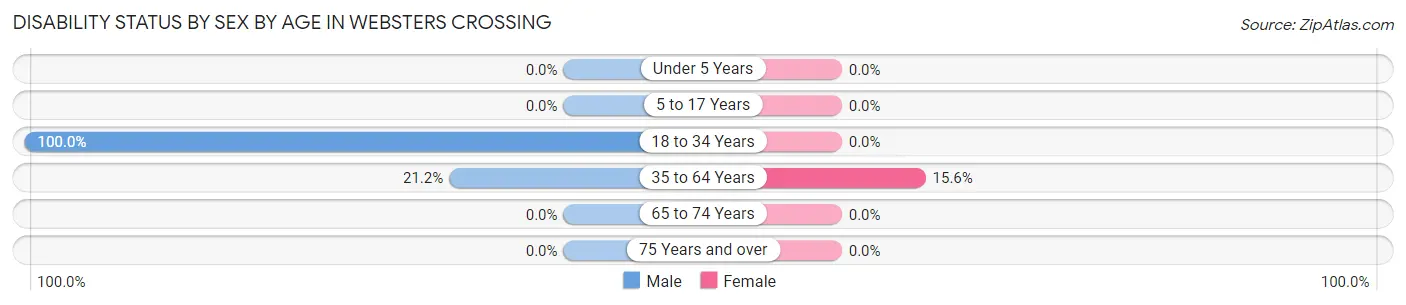
| Age Bracket | Male | Female |
| Under 5 Years | 0 (0.0%) | 0 (0.0%) |
| 5 to 17 Years | 0 (0.0%) | 0 (0.0%) |
| 18 to 34 Years | 12 (100.0%) | 0 (0.0%) |
| 35 to 64 Years | 7 (21.2%) | 7 (15.6%) |
| 65 to 74 Years | 0 (0.0%) | 0 (0.0%) |
| 75 Years and over | 0 (0.0%) | 0 (0.0%) |
Disability Class by Sex by Age in Websters Crossing
Disability Class: Hearing Difficulty
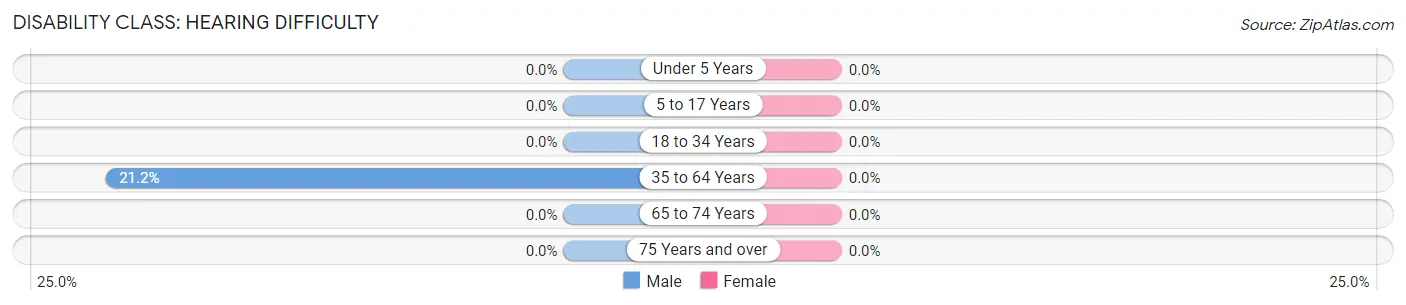
| Age Bracket | Male | Female |
| Under 5 Years | 0 (0.0%) | 0 (0.0%) |
| 5 to 17 Years | 0 (0.0%) | 0 (0.0%) |
| 18 to 34 Years | 0 (0.0%) | 0 (0.0%) |
| 35 to 64 Years | 7 (21.2%) | 0 (0.0%) |
| 65 to 74 Years | 0 (0.0%) | 0 (0.0%) |
| 75 Years and over | 0 (0.0%) | 0 (0.0%) |
Disability Class: Vision Difficulty
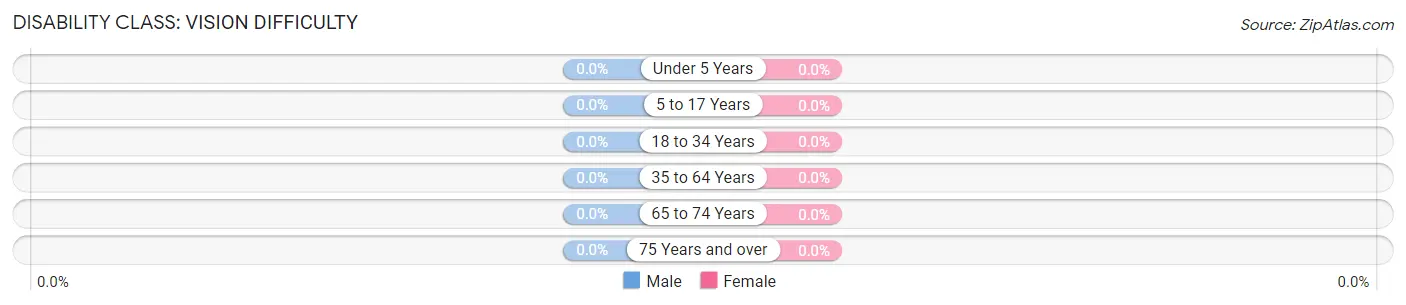
| Age Bracket | Male | Female |
| Under 5 Years | 0 (0.0%) | 0 (0.0%) |
| 5 to 17 Years | 0 (0.0%) | 0 (0.0%) |
| 18 to 34 Years | 0 (0.0%) | 0 (0.0%) |
| 35 to 64 Years | 0 (0.0%) | 0 (0.0%) |
| 65 to 74 Years | 0 (0.0%) | 0 (0.0%) |
| 75 Years and over | 0 (0.0%) | 0 (0.0%) |
Disability Class: Cognitive Difficulty
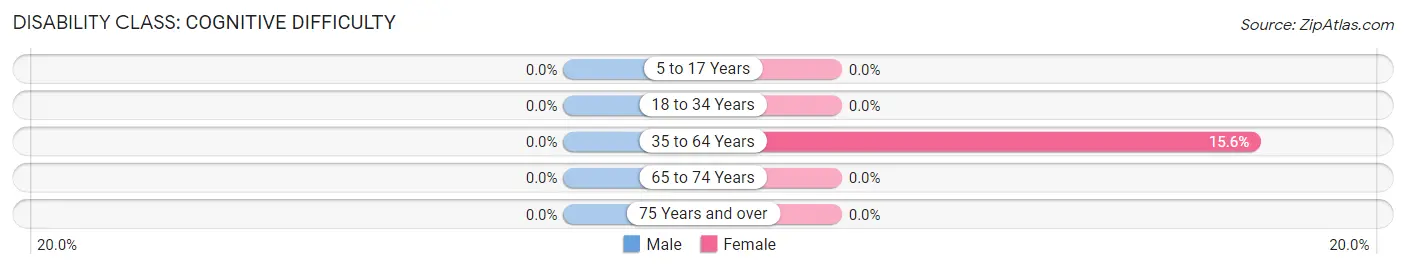
| Age Bracket | Male | Female |
| 5 to 17 Years | 0 (0.0%) | 0 (0.0%) |
| 18 to 34 Years | 0 (0.0%) | 0 (0.0%) |
| 35 to 64 Years | 0 (0.0%) | 7 (15.6%) |
| 65 to 74 Years | 0 (0.0%) | 0 (0.0%) |
| 75 Years and over | 0 (0.0%) | 0 (0.0%) |
Disability Class: Ambulatory Difficulty
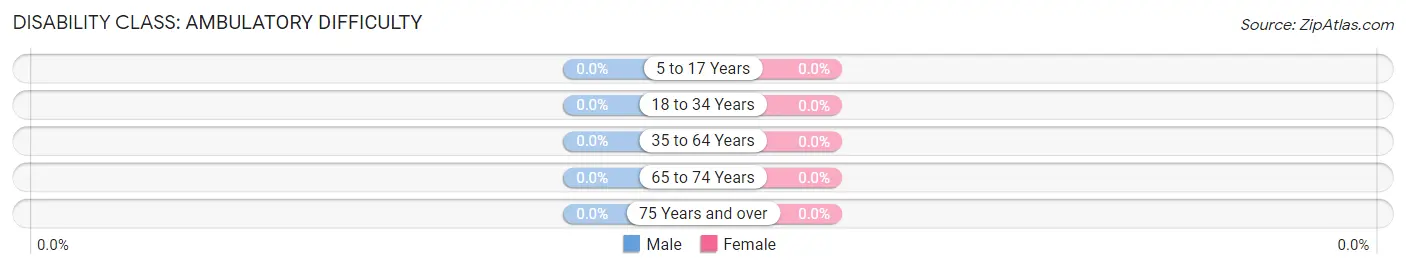
| Age Bracket | Male | Female |
| 5 to 17 Years | 0 (0.0%) | 0 (0.0%) |
| 18 to 34 Years | 0 (0.0%) | 0 (0.0%) |
| 35 to 64 Years | 0 (0.0%) | 0 (0.0%) |
| 65 to 74 Years | 0 (0.0%) | 0 (0.0%) |
| 75 Years and over | 0 (0.0%) | 0 (0.0%) |
Disability Class: Self-Care Difficulty
| Age Bracket | Male | Female |
| 5 to 17 Years | 0 (0.0%) | 0 (0.0%) |
| 18 to 34 Years | 0 (0.0%) | 0 (0.0%) |
| 35 to 64 Years | 0 (0.0%) | 0 (0.0%) |
| 65 to 74 Years | 0 (0.0%) | 0 (0.0%) |
| 75 Years and over | 0 (0.0%) | 0 (0.0%) |
Technology Access in Websters Crossing
Computing Device Access in Websters Crossing
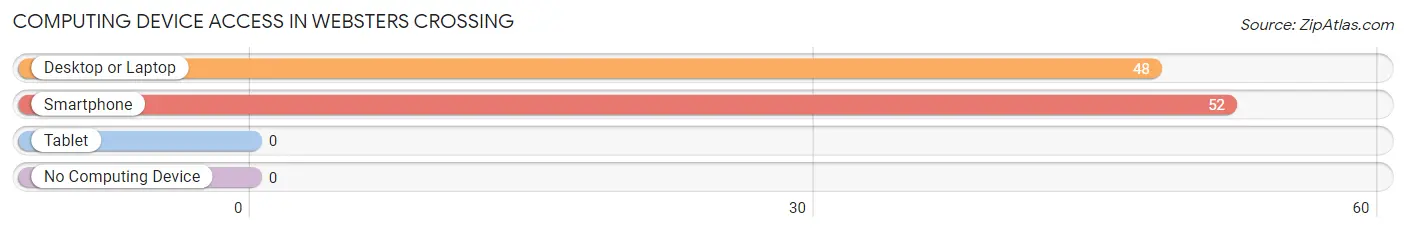
| Device Type | # Households | % Households |
| Desktop or Laptop | 48 | 92.3% |
| Smartphone | 52 | 100.0% |
| Tablet | 0 | 0.0% |
| No Computing Device | 0 | 0.0% |
| Total | 52 | 100.0% |
Internet Access in Websters Crossing
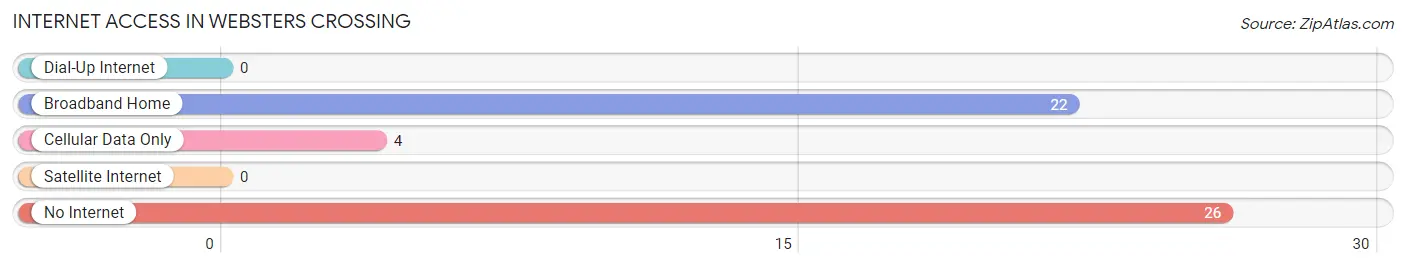
| Internet Type | # Households | % Households |
| Dial-Up Internet | 0 | 0.0% |
| Broadband Home | 22 | 42.3% |
| Cellular Data Only | 4 | 7.7% |
| Satellite Internet | 0 | 0.0% |
| No Internet | 26 | 50.0% |
| Total | 52 | 100.0% |
Websters Crossing Summary
Websters Crossing is a small hamlet located in the town of Yorktown in Westchester County, New York. It is situated on the east side of the Croton River, about two miles south of the Taconic State Parkway. The hamlet is home to a population of approximately 1,000 people.
History
Websters Crossing was first settled in the late 1700s by a man named John Webster. He purchased a large tract of land from the local Native Americans and established a farm. The area was known as Websters Crossing for many years, and the name was officially adopted in 1845.
The hamlet was a rural farming community for many years, but in the early 1900s, the area began to experience a population boom. This was due to the construction of the Taconic State Parkway, which provided easy access to New York City. The population of Websters Crossing grew steadily throughout the 20th century, and by the 2000 census, the population had reached 1,000.
Geography
Websters Crossing is located in the town of Yorktown in Westchester County, New York. It is situated on the east side of the Croton River, about two miles south of the Taconic State Parkway. The hamlet is bordered by the hamlets of Granite Springs to the north, Crompond to the east, and Amawalk to the south.
The terrain of Websters Crossing is mostly flat, with some rolling hills. The area is heavily wooded, with a mix of deciduous and evergreen trees. The hamlet is home to several small lakes, including Lake Oscawana and Lake Peekskill.
Economy
The economy of Websters Crossing is largely based on agriculture and tourism. The hamlet is home to several small farms, which produce a variety of fruits and vegetables. The area is also popular with tourists, who come to enjoy the scenic views and outdoor activities.
The hamlet is home to several small businesses, including a grocery store, a hardware store, and a few restaurants. There is also a post office and a library.
Demographics
As of the 2000 census, the population of Websters Crossing was 1,000. The racial makeup of the hamlet was 94.2% White, 2.2% African American, 0.7% Asian, 0.3% Native American, and 2.6% from other races. Hispanic or Latino of any race were 4.2% of the population.
The median household income in Websters Crossing was $60,000, and the median family income was $68,000. The per capita income was $25,000. About 4.2% of families and 5.2% of the population were below the poverty line.
Common Questions
What is Per Capita Income in Websters Crossing?
Per Capita income in Websters Crossing is $27,388.
What is the Median Family Income in Websters Crossing?
Median Family Income in Websters Crossing is $95,192.
What is the Median Household income in Websters Crossing?
Median Household Income in Websters Crossing is $76,250.
What is Inequality or Gini Index in Websters Crossing?
Inequality or Gini Index in Websters Crossing is 0.27.
What is the Total Population of Websters Crossing?
Total Population of Websters Crossing is 124.
What is the Total Male Population of Websters Crossing?
Total Male Population of Websters Crossing is 59.
What is the Total Female Population of Websters Crossing?
Total Female Population of Websters Crossing is 65.
What is the Ratio of Males per 100 Females in Websters Crossing?
There are 90.77 Males per 100 Females in Websters Crossing.
What is the Ratio of Females per 100 Males in Websters Crossing?
There are 110.17 Females per 100 Males in Websters Crossing.
What is the Median Population Age in Websters Crossing?
Median Population Age in Websters Crossing is 60.0 Years.
What is the Average Family Size in Websters Crossing
Average Family Size in Websters Crossing is 2.5 People.
What is the Average Household Size in Websters Crossing
Average Household Size in Websters Crossing is 2.4 People.
How Large is the Labor Force in Websters Crossing?
There are 91 People in the Labor Forcein in Websters Crossing.
What is the Percentage of People in the Labor Force in Websters Crossing?
73.4% of People are in the Labor Force in Websters Crossing.