Hammond, NY Map & Demographics
Hammond Map
Hammond Overview
$31,015
PER CAPITA INCOME
$51,797
AVG FAMILY INCOME
$50,859
AVG HOUSEHOLD INCOME
0.47
INEQUALITY / GINI INDEX
269
TOTAL POPULATION
134
MALE POPULATION
135
FEMALE POPULATION
99.26
MALES / 100 FEMALES
100.75
FEMALES / 100 MALES
46.9
MEDIAN AGE
2.6
AVG FAMILY SIZE
2.4
AVG HOUSEHOLD SIZE
94
LABOR FORCE [ PEOPLE ]
44.5%
PERCENT IN LABOR FORCE
2.1%
UNEMPLOYMENT RATE
Hammond Zip Codes
Hammond Area Codes
Income in Hammond
Income Overview in Hammond
Per Capita Income in Hammond is $31,015, while median incomes of families and households are $51,797 and $50,859 respectively.
| Characteristic | Number | Measure |
| Per Capita Income | 269 | $31,015 |
| Median Family Income | 81 | $51,797 |
| Mean Family Income | 81 | $81,759 |
| Median Household Income | 111 | $50,859 |
| Mean Household Income | 111 | $76,112 |
| Income Deficit | 81 | $0 |
| Wage / Income Gap (%) | 269 | 0.00% |
| Wage / Income Gap ($) | 269 | 100.00¢ per $1 |
| Gini / Inequality Index | 269 | 0.47 |
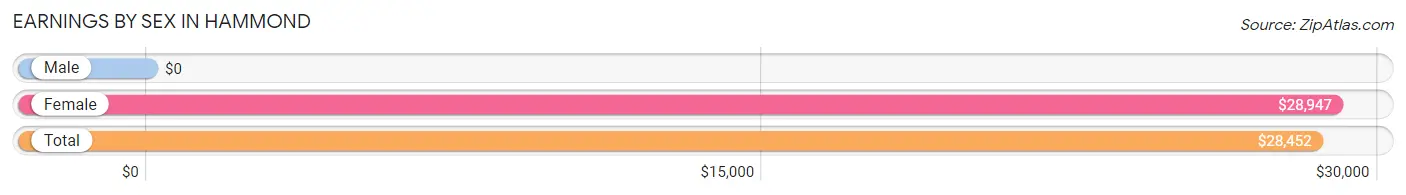
Earnings by Sex in Hammond
| Sex | Number | Average Earnings |
| Male | 56 (45.2%) | $0 |
| Female | 68 (54.8%) | $28,947 |
| Total | 124 (100.0%) | $28,452 |
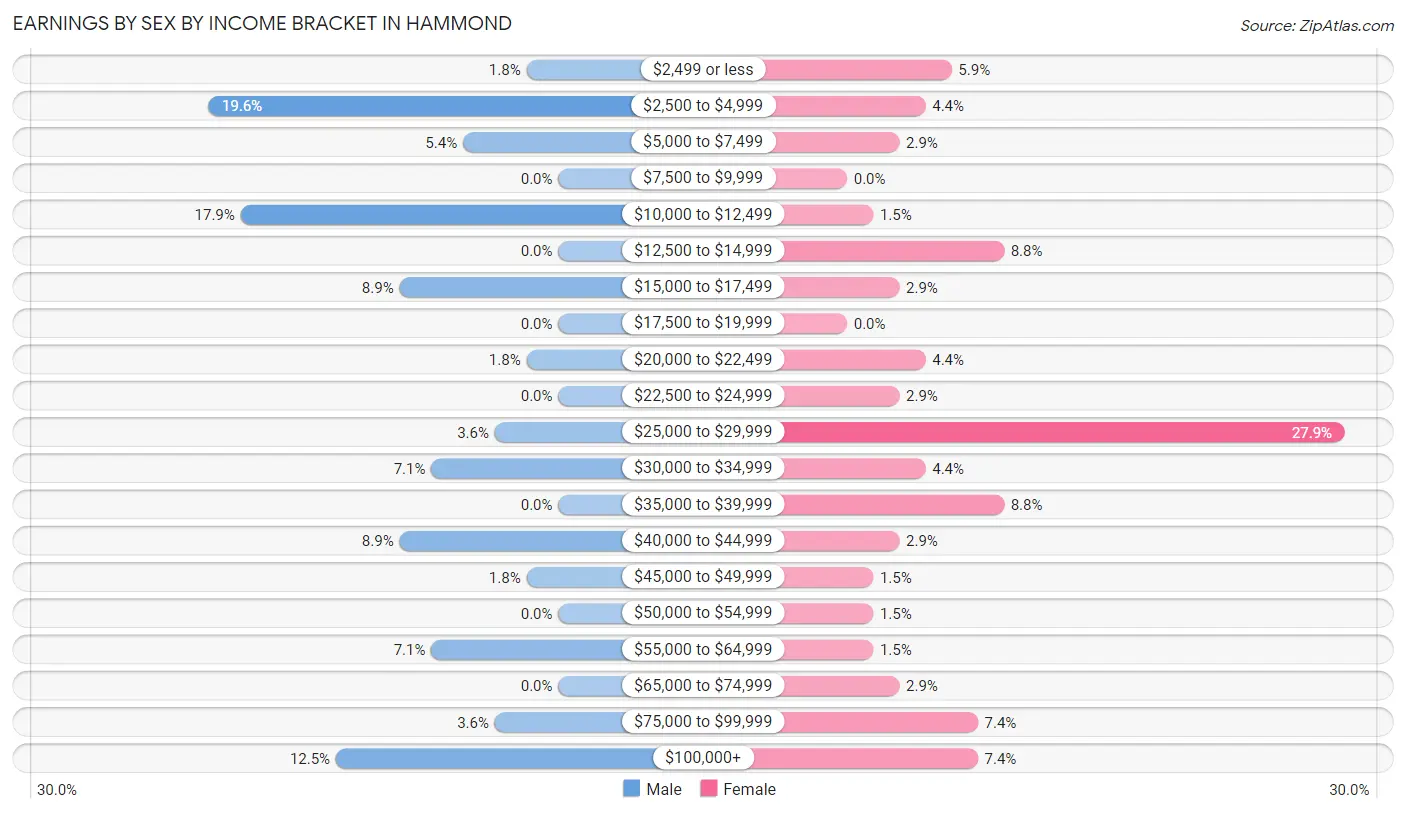
Earnings by Sex by Income Bracket in Hammond
The most common earnings brackets in Hammond are $2,500 to $4,999 for men (11 | 19.6%) and $25,000 to $29,999 for women (19 | 27.9%).
| Income | Male | Female |
| $2,499 or less | 1 (1.8%) | 4 (5.9%) |
| $2,500 to $4,999 | 11 (19.6%) | 3 (4.4%) |
| $5,000 to $7,499 | 3 (5.4%) | 2 (2.9%) |
| $7,500 to $9,999 | 0 (0.0%) | 0 (0.0%) |
| $10,000 to $12,499 | 10 (17.9%) | 1 (1.5%) |
| $12,500 to $14,999 | 0 (0.0%) | 6 (8.8%) |
| $15,000 to $17,499 | 5 (8.9%) | 2 (2.9%) |
| $17,500 to $19,999 | 0 (0.0%) | 0 (0.0%) |
| $20,000 to $22,499 | 1 (1.8%) | 3 (4.4%) |
| $22,500 to $24,999 | 0 (0.0%) | 2 (2.9%) |
| $25,000 to $29,999 | 2 (3.6%) | 19 (27.9%) |
| $30,000 to $34,999 | 4 (7.1%) | 3 (4.4%) |
| $35,000 to $39,999 | 0 (0.0%) | 6 (8.8%) |
| $40,000 to $44,999 | 5 (8.9%) | 2 (2.9%) |
| $45,000 to $49,999 | 1 (1.8%) | 1 (1.5%) |
| $50,000 to $54,999 | 0 (0.0%) | 1 (1.5%) |
| $55,000 to $64,999 | 4 (7.1%) | 1 (1.5%) |
| $65,000 to $74,999 | 0 (0.0%) | 2 (2.9%) |
| $75,000 to $99,999 | 2 (3.6%) | 5 (7.3%) |
| $100,000+ | 7 (12.5%) | 5 (7.3%) |
| Total | 56 (100.0%) | 68 (100.0%) |
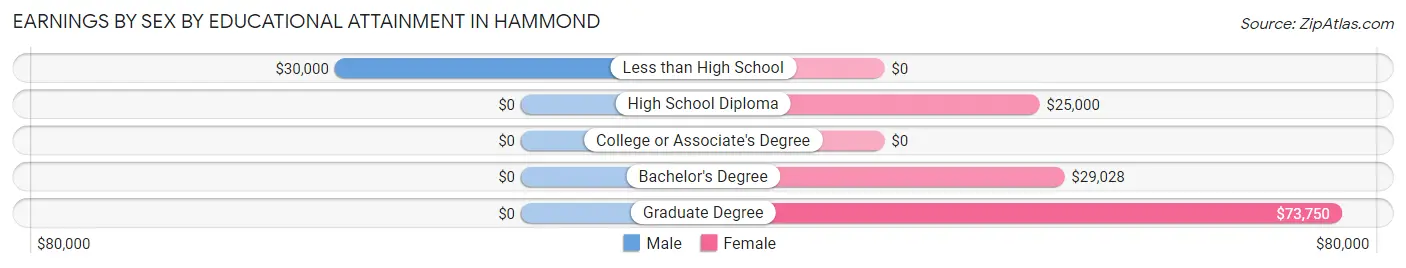
Earnings by Sex by Educational Attainment in Hammond
Average earnings in Hammond are $28,125 for men and $29,342 for women, a difference of 4.2%. Men with an educational attainment of less than high school enjoy the highest average annual earnings of $30,000, while those with less than high school education earn the least with $30,000. Women with an educational attainment of graduate degree earn the most with the average annual earnings of $73,750, while those with high school diploma education have the smallest earnings of $25,000.
| Educational Attainment | Male Income | Female Income |
| Less than High School | $30,000 | $0 |
| High School Diploma | - | - |
| College or Associate's Degree | - | - |
| Bachelor's Degree | - | - |
| Graduate Degree | - | - |
| Total | $28,125 | $29,342 |
Family Income in Hammond
Family Income Brackets in Hammond
According to the Hammond family income data, there are 19 families falling into the $50,000 to $74,999 income range, which is the most common income bracket and makes up 23.5% of all families. Conversely, the less than $10,000 income bracket is the least frequent group with only 1 families (1.2%) belonging to this category.
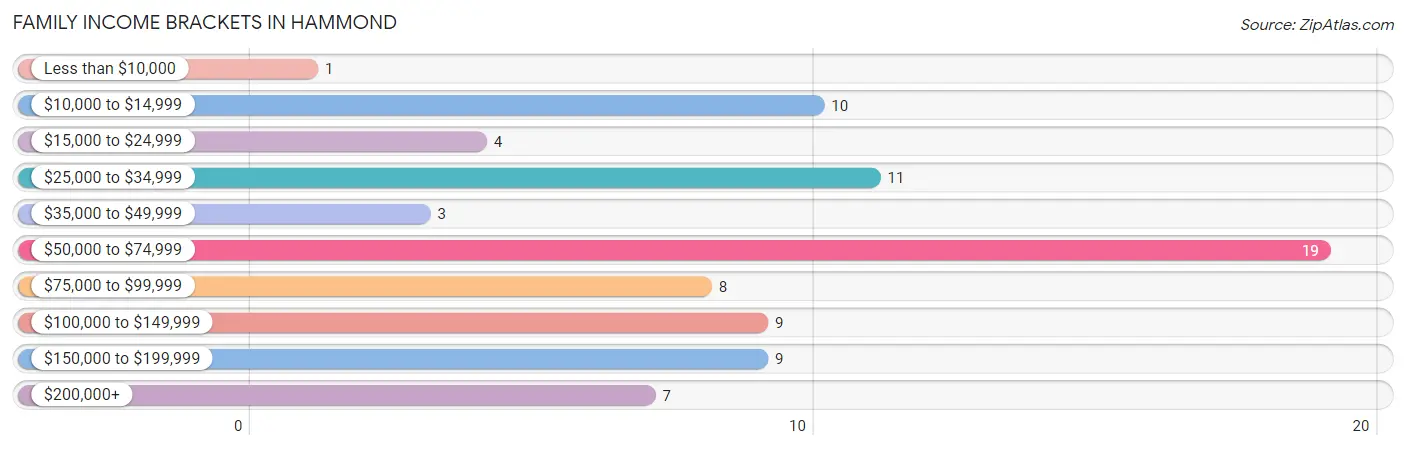
| Income Bracket | # Families | % Families |
| Less than $10,000 | 1 | 1.2% |
| $10,000 to $14,999 | 10 | 12.3% |
| $15,000 to $24,999 | 4 | 4.9% |
| $25,000 to $34,999 | 11 | 13.6% |
| $35,000 to $49,999 | 3 | 3.7% |
| $50,000 to $74,999 | 19 | 23.5% |
| $75,000 to $99,999 | 8 | 9.9% |
| $100,000 to $149,999 | 9 | 11.1% |
| $150,000 to $199,999 | 9 | 11.1% |
| $200,000+ | 7 | 8.6% |
Family Income by Famaliy Size in Hammond
2-person families (41 | 50.6%) account for the highest median family income in Hammond with $106,250 per family, while 2-person families (41 | 50.6%) have the highest median income of $53,125 per family member.
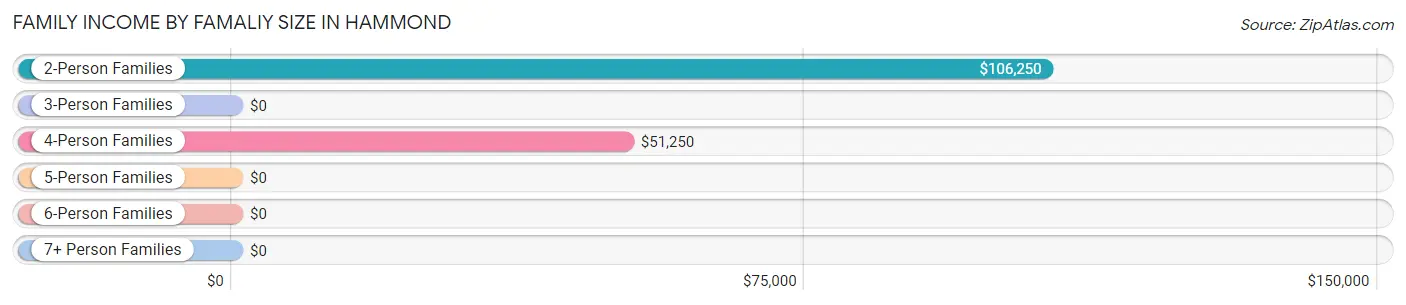
| Income Bracket | # Families | Median Income |
| 2-Person Families | 41 (50.6%) | $106,250 |
| 3-Person Families | 12 (14.8%) | $0 |
| 4-Person Families | 26 (32.1%) | $51,250 |
| 5-Person Families | 1 (1.2%) | $0 |
| 6-Person Families | 1 (1.2%) | $0 |
| 7+ Person Families | 0 (0.0%) | $0 |
| Total | 81 (100.0%) | $51,797 |
Family Income by Number of Earners in Hammond
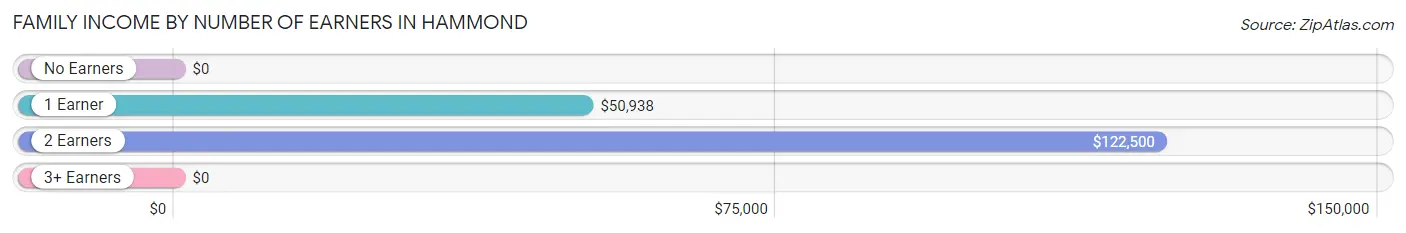
| Number of Earners | # Families | Median Income |
| No Earners | 11 (13.6%) | $0 |
| 1 Earner | 48 (59.3%) | $50,938 |
| 2 Earners | 18 (22.2%) | $122,500 |
| 3+ Earners | 4 (4.9%) | $0 |
| Total | 81 (100.0%) | $51,797 |
Household Income in Hammond
Household Income Brackets in Hammond
With 21 households falling in the category, the $50,000 to $74,999 income range is the most frequent in Hammond, accounting for 18.9% of all households. In contrast, only 3 households (2.7%) fall into the $15,000 to $24,999 income bracket, making it the least populous group.
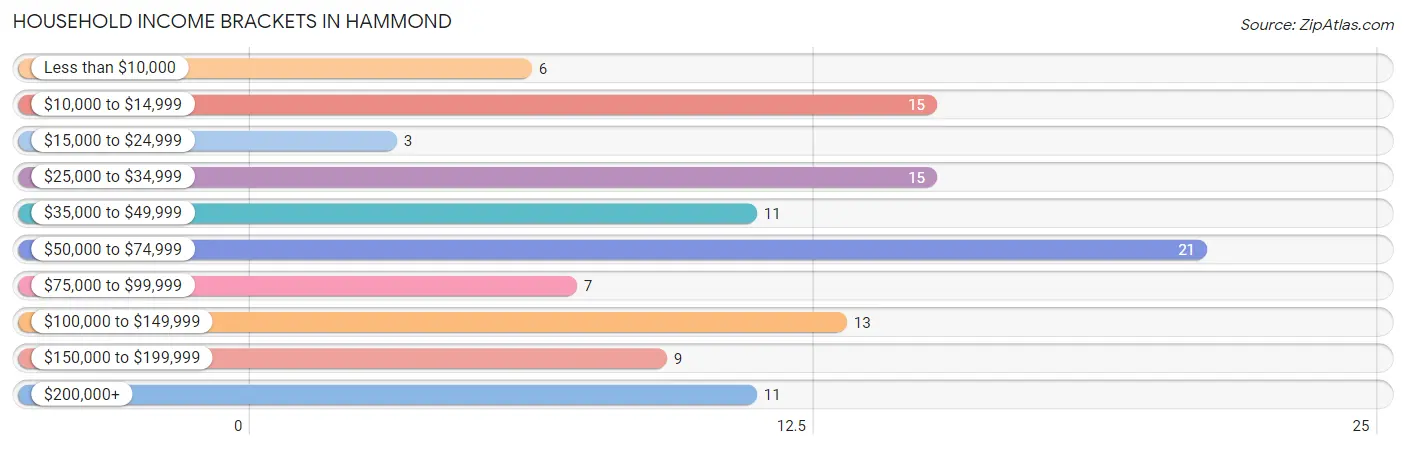
| Income Bracket | # Households | % Households |
| Less than $10,000 | 6 | 5.4% |
| $10,000 to $14,999 | 15 | 13.5% |
| $15,000 to $24,999 | 3 | 2.7% |
| $25,000 to $34,999 | 15 | 13.5% |
| $35,000 to $49,999 | 11 | 9.9% |
| $50,000 to $74,999 | 21 | 18.9% |
| $75,000 to $99,999 | 7 | 6.3% |
| $100,000 to $149,999 | 13 | 11.7% |
| $150,000 to $199,999 | 9 | 8.1% |
| $200,000+ | 11 | 9.9% |
Household Income by Householder Age in Hammond
The median household income in Hammond is $50,859, with the highest median household income of $51,172 found in the 45 to 64 years age bracket for the primary householder. A total of 41 households (36.9%) fall into this category. Meanwhile, the 15 to 24 years age bracket for the primary householder has the lowest median household income of $0, with 2 households (1.8%) in this group.
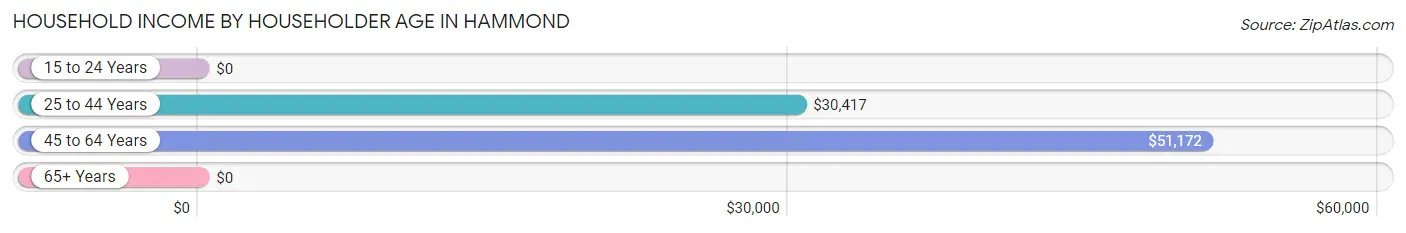
| Income Bracket | # Households | Median Income |
| 15 to 24 Years | 2 (1.8%) | $0 |
| 25 to 44 Years | 23 (20.7%) | $30,417 |
| 45 to 64 Years | 41 (36.9%) | $51,172 |
| 65+ Years | 45 (40.5%) | $0 |
| Total | 111 (100.0%) | $50,859 |
Poverty in Hammond
Income Below Poverty by Sex and Age in Hammond
With 31.5% poverty level for males and 22.1% for females among the residents of Hammond, 6 to 11 year old males and 6 to 11 year old females are the most vulnerable to poverty, with 5 males (100.0%) and 2 females (66.7%) in their respective age groups living below the poverty level.
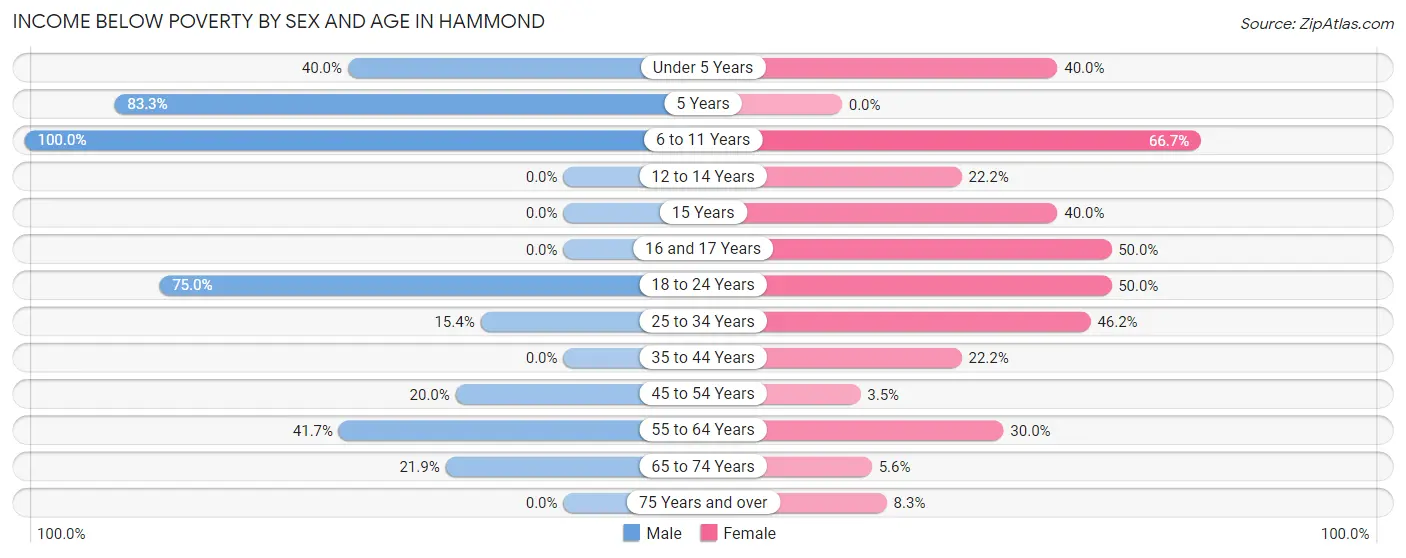
| Age Bracket | Male | Female |
| Under 5 Years | 6 (40.0%) | 2 (40.0%) |
| 5 Years | 5 (83.3%) | 0 (0.0%) |
| 6 to 11 Years | 5 (100.0%) | 2 (66.7%) |
| 12 to 14 Years | 0 (0.0%) | 2 (22.2%) |
| 15 Years | 0 (0.0%) | 2 (40.0%) |
| 16 and 17 Years | 0 (0.0%) | 2 (50.0%) |
| 18 to 24 Years | 6 (75.0%) | 2 (50.0%) |
| 25 to 34 Years | 2 (15.4%) | 6 (46.2%) |
| 35 to 44 Years | 0 (0.0%) | 2 (22.2%) |
| 45 to 54 Years | 5 (20.0%) | 1 (3.5%) |
| 55 to 64 Years | 5 (41.7%) | 6 (30.0%) |
| 65 to 74 Years | 7 (21.9%) | 1 (5.6%) |
| 75 Years and over | 0 (0.0%) | 1 (8.3%) |
| Total | 41 (31.5%) | 29 (22.1%) |
Income Above Poverty by Sex and Age in Hammond
According to the poverty statistics in Hammond, males aged 12 to 14 years and females aged 45 to 54 years are the age groups that are most secure financially, with 100.0% of males and 96.6% of females in these age groups living above the poverty line.
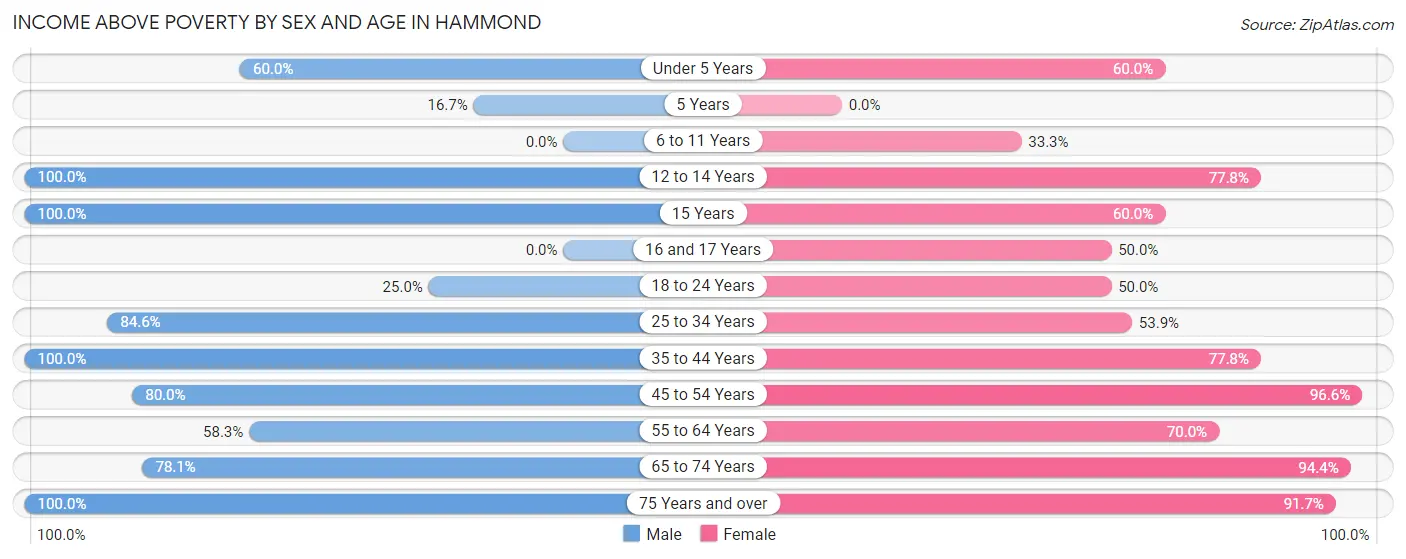
| Age Bracket | Male | Female |
| Under 5 Years | 9 (60.0%) | 3 (60.0%) |
| 5 Years | 1 (16.7%) | 0 (0.0%) |
| 6 to 11 Years | 0 (0.0%) | 1 (33.3%) |
| 12 to 14 Years | 1 (100.0%) | 7 (77.8%) |
| 15 Years | 1 (100.0%) | 3 (60.0%) |
| 16 and 17 Years | 0 (0.0%) | 2 (50.0%) |
| 18 to 24 Years | 2 (25.0%) | 2 (50.0%) |
| 25 to 34 Years | 11 (84.6%) | 7 (53.8%) |
| 35 to 44 Years | 5 (100.0%) | 7 (77.8%) |
| 45 to 54 Years | 20 (80.0%) | 28 (96.6%) |
| 55 to 64 Years | 7 (58.3%) | 14 (70.0%) |
| 65 to 74 Years | 25 (78.1%) | 17 (94.4%) |
| 75 Years and over | 7 (100.0%) | 11 (91.7%) |
| Total | 89 (68.5%) | 102 (77.9%) |
Income Below Poverty Among Married-Couple Families in Hammond
The poverty statistics for married-couple families in Hammond show that 12.5% or 8 of the total 64 families live below the poverty line. Families with 3 or 4 children have the highest poverty rate of 100.0%, comprising of 1 families. On the other hand, families with no children have the lowest poverty rate of 0.0%, which includes 0 families.
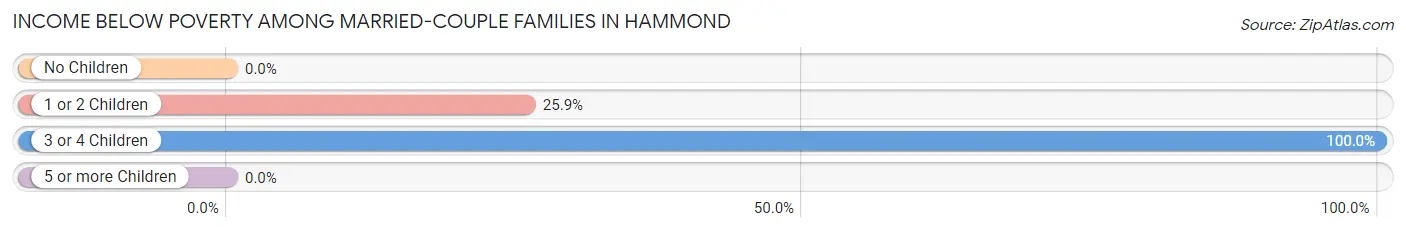
| Children | Above Poverty | Below Poverty |
| No Children | 36 (100.0%) | 0 (0.0%) |
| 1 or 2 Children | 20 (74.1%) | 7 (25.9%) |
| 3 or 4 Children | 0 (0.0%) | 1 (100.0%) |
| 5 or more Children | 0 (0.0%) | 0 (0.0%) |
| Total | 56 (87.5%) | 8 (12.5%) |
Income Below Poverty Among Single-Parent Households in Hammond
According to the poverty data in Hammond, 33.3% or 1 single-father households and 35.7% or 5 single-mother households are living below the poverty line. Among single-father households, those with no children have the highest poverty rate, with 1 households (100.0%) experiencing poverty. Likewise, among single-mother households, those with no children have the highest poverty rate, with 2 households (50.0%) falling below the poverty line.
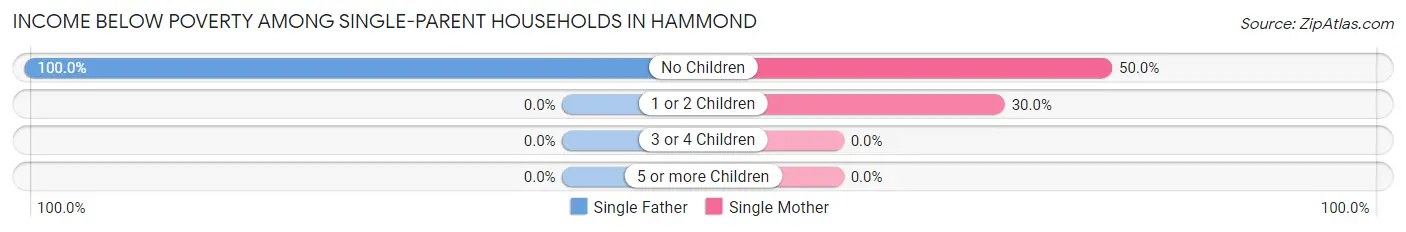
| Children | Single Father | Single Mother |
| No Children | 1 (100.0%) | 2 (50.0%) |
| 1 or 2 Children | 0 (0.0%) | 3 (30.0%) |
| 3 or 4 Children | 0 (0.0%) | 0 (0.0%) |
| 5 or more Children | 0 (0.0%) | 0 (0.0%) |
| Total | 1 (33.3%) | 5 (35.7%) |
Income Below Poverty Among Married-Couple vs Single-Parent Households in Hammond
The poverty data for Hammond shows that 8 of the married-couple family households (12.5%) and 6 of the single-parent households (35.3%) are living below the poverty level. Within the married-couple family households, those with 3 or 4 children have the highest poverty rate, with 1 households (100.0%) falling below the poverty line. Among the single-parent households, those with no children have the highest poverty rate, with 3 household (60.0%) living below poverty.
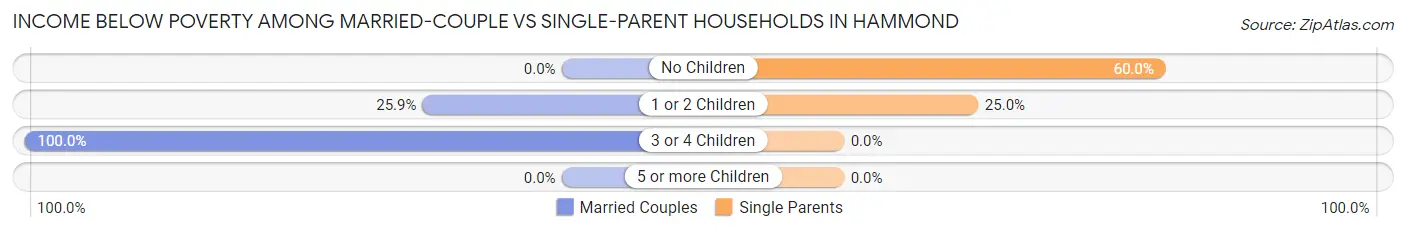
| Children | Married-Couple Families | Single-Parent Households |
| No Children | 0 (0.0%) | 3 (60.0%) |
| 1 or 2 Children | 7 (25.9%) | 3 (25.0%) |
| 3 or 4 Children | 1 (100.0%) | 0 (0.0%) |
| 5 or more Children | 0 (0.0%) | 0 (0.0%) |
| Total | 8 (12.5%) | 6 (35.3%) |
Race in Hammond
The most populous races in Hammond are White / Caucasian (250 | 92.9%), Two or more Races (13 | 4.8%), and Hispanic or Latino (7 | 2.6%).
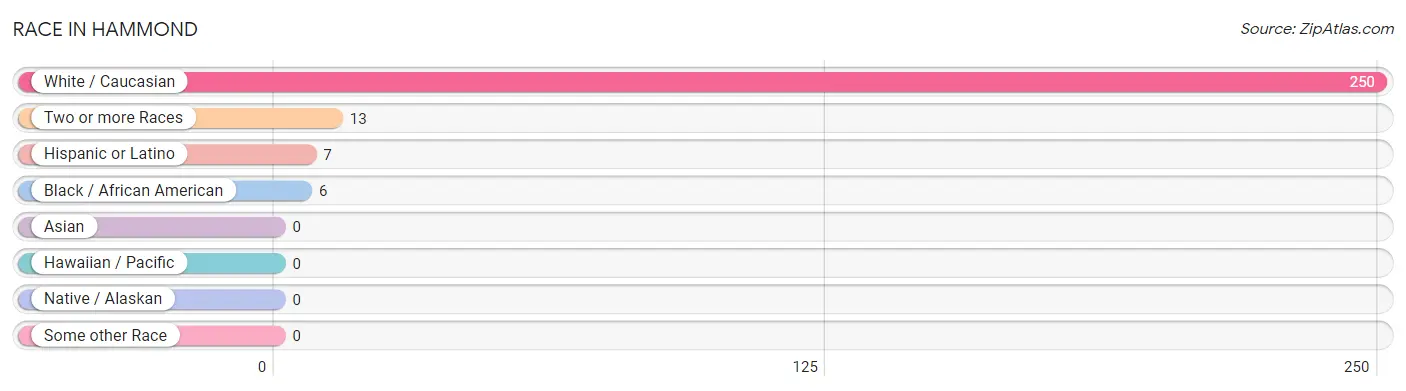
| Race | # Population | % Population |
| Asian | 0 | 0.0% |
| Black / African American | 6 | 2.2% |
| Hawaiian / Pacific | 0 | 0.0% |
| Hispanic or Latino | 7 | 2.6% |
| Native / Alaskan | 0 | 0.0% |
| White / Caucasian | 250 | 92.9% |
| Two or more Races | 13 | 4.8% |
| Some other Race | 0 | 0.0% |
| Total | 269 | 100.0% |
Ancestry in Hammond
The most populous ancestries reported in Hammond are English (78 | 29.0%), Greek (23 | 8.6%), Scottish (21 | 7.8%), Italian (20 | 7.4%), and German (19 | 7.1%), together accounting for 59.9% of all Hammond residents.
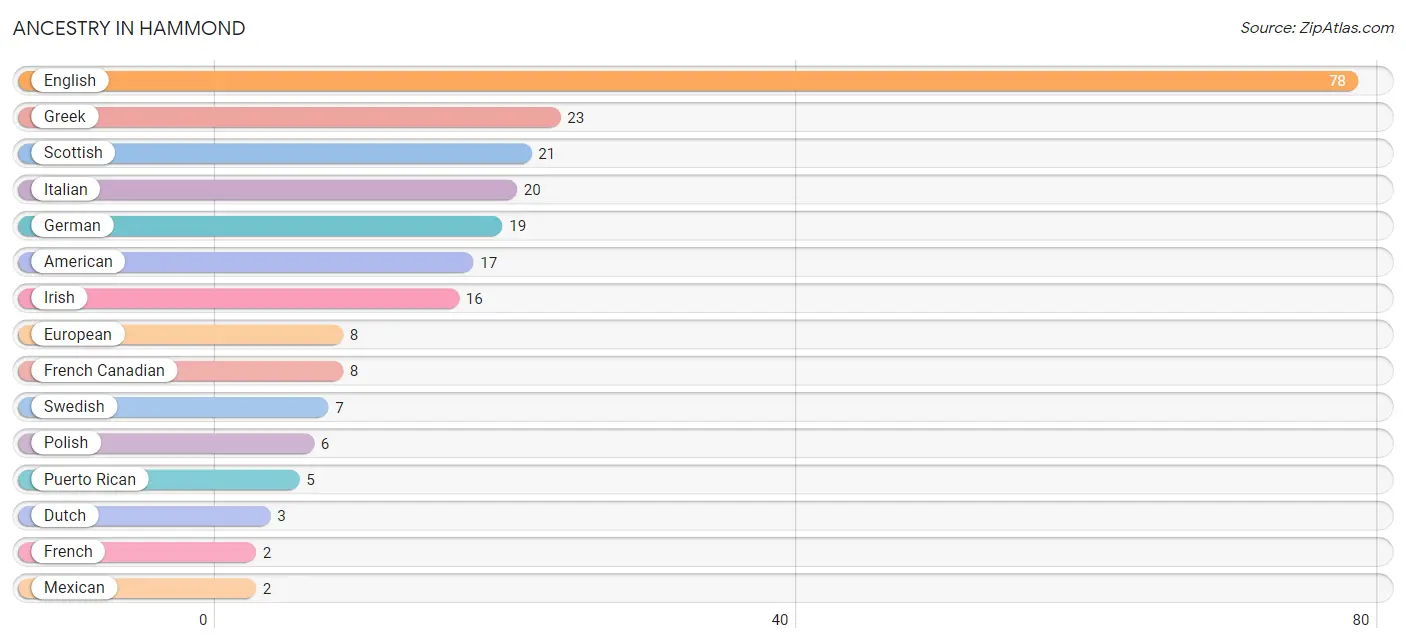
| Ancestry | # Population | % Population |
| Albanian | 1 | 0.4% |
| American | 17 | 6.3% |
| Burmese | 1 | 0.4% |
| Dutch | 3 | 1.1% |
| English | 78 | 29.0% |
| European | 8 | 3.0% |
| French | 2 | 0.7% |
| French Canadian | 8 | 3.0% |
| German | 19 | 7.1% |
| Greek | 23 | 8.6% |
| Irish | 16 | 5.9% |
| Italian | 20 | 7.4% |
| Mexican | 2 | 0.7% |
| Polish | 6 | 2.2% |
| Puerto Rican | 5 | 1.9% |
| Scottish | 21 | 7.8% |
| Swedish | 7 | 2.6% | View All 17 Rows |
Immigrants in Hammond
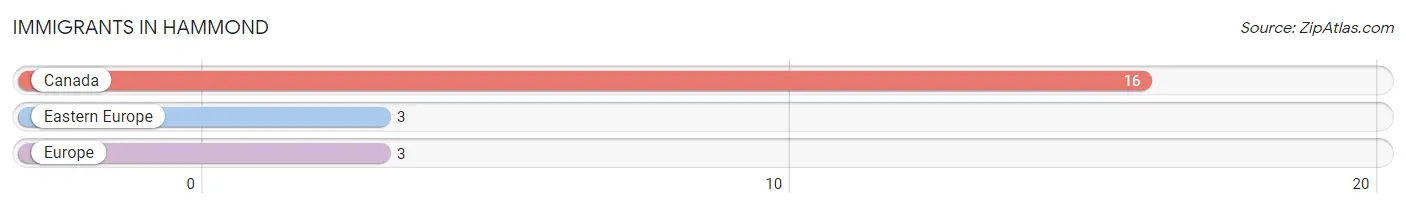
The most numerous immigrant groups reported in Hammond came from Canada (16 | 5.9%), Eastern Europe (3 | 1.1%), and Europe (3 | 1.1%), together accounting for 8.2% of all Hammond residents.
| Immigration Origin | # Population | % Population |
| Canada | 16 | 5.9% |
| Eastern Europe | 3 | 1.1% |
| Europe | 3 | 1.1% | View All 3 Rows |
Sex and Age in Hammond
Sex and Age in Hammond
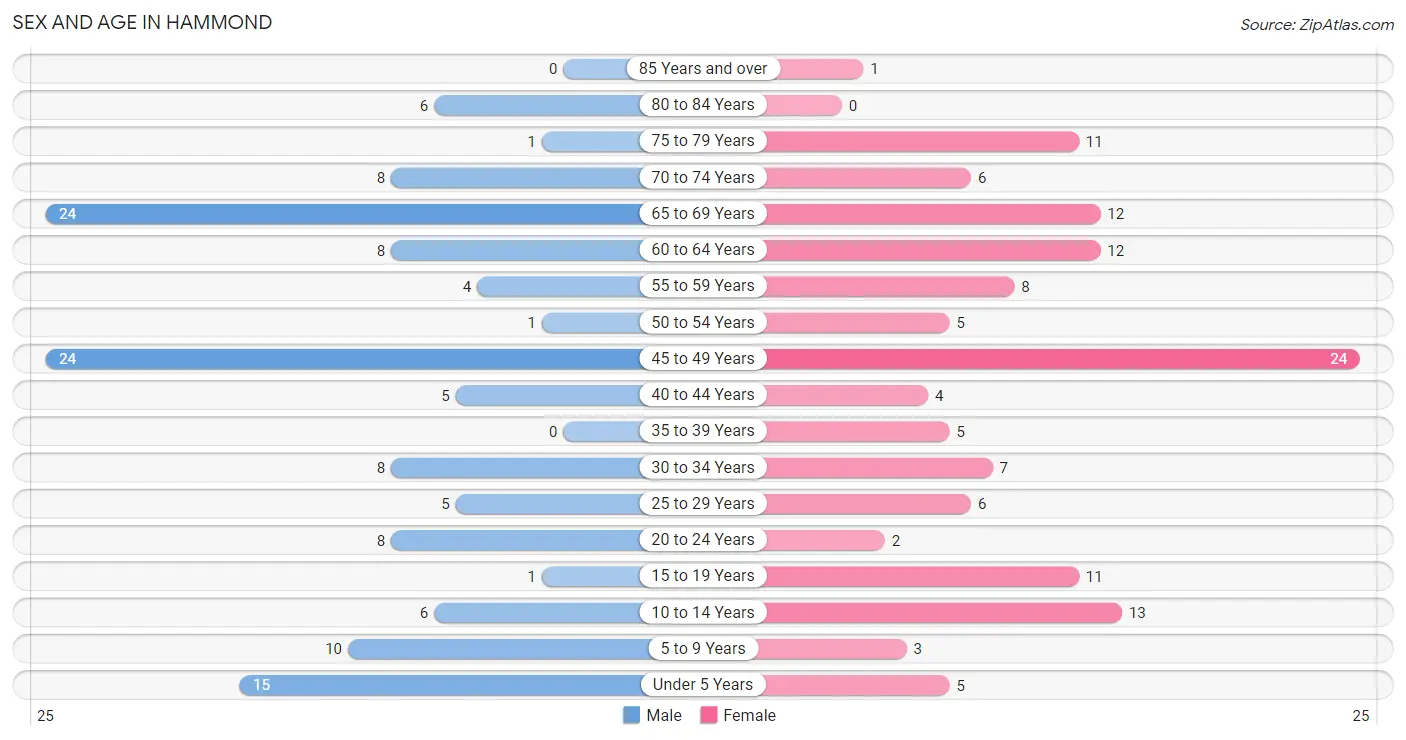
The most populous age groups in Hammond are 45 to 49 Years (24 | 17.9%) for men and 45 to 49 Years (24 | 17.8%) for women.
| Age Bracket | Male | Female |
| Under 5 Years | 15 (11.2%) | 5 (3.7%) |
| 5 to 9 Years | 10 (7.5%) | 3 (2.2%) |
| 10 to 14 Years | 6 (4.5%) | 13 (9.6%) |
| 15 to 19 Years | 1 (0.7%) | 11 (8.2%) |
| 20 to 24 Years | 8 (6.0%) | 2 (1.5%) |
| 25 to 29 Years | 5 (3.7%) | 6 (4.4%) |
| 30 to 34 Years | 8 (6.0%) | 7 (5.2%) |
| 35 to 39 Years | 0 (0.0%) | 5 (3.7%) |
| 40 to 44 Years | 5 (3.7%) | 4 (3.0%) |
| 45 to 49 Years | 24 (17.9%) | 24 (17.8%) |
| 50 to 54 Years | 1 (0.7%) | 5 (3.7%) |
| 55 to 59 Years | 4 (3.0%) | 8 (5.9%) |
| 60 to 64 Years | 8 (6.0%) | 12 (8.9%) |
| 65 to 69 Years | 24 (17.9%) | 12 (8.9%) |
| 70 to 74 Years | 8 (6.0%) | 6 (4.4%) |
| 75 to 79 Years | 1 (0.7%) | 11 (8.2%) |
| 80 to 84 Years | 6 (4.5%) | 0 (0.0%) |
| 85 Years and over | 0 (0.0%) | 1 (0.7%) |
| Total | 134 (100.0%) | 135 (100.0%) |
Families and Households in Hammond
Median Family Size in Hammond
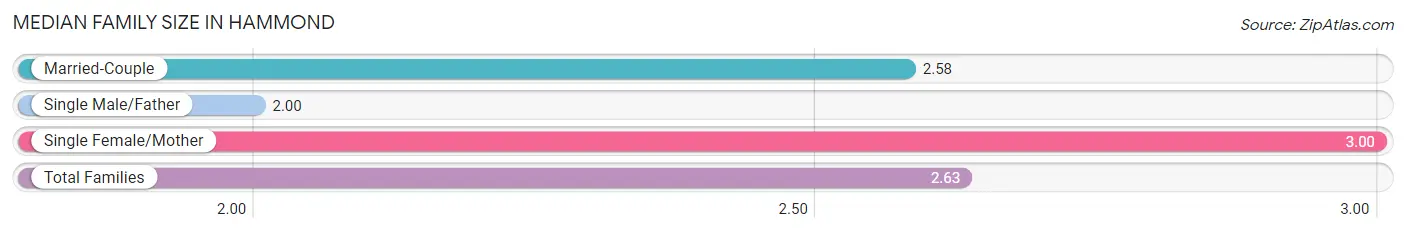
The median family size in Hammond is 2.63 persons per family, with single female/mother families (14 | 17.3%) accounting for the largest median family size of 3 persons per family. On the other hand, single male/father families (3 | 3.7%) represent the smallest median family size with 2.00 persons per family.
| Family Type | # Families | Family Size |
| Married-Couple | 64 (79.0%) | 2.58 |
| Single Male/Father | 3 (3.7%) | 2.00 |
| Single Female/Mother | 14 (17.3%) | 3.00 |
| Total Families | 81 (100.0%) | 2.63 |
Median Household Size in Hammond
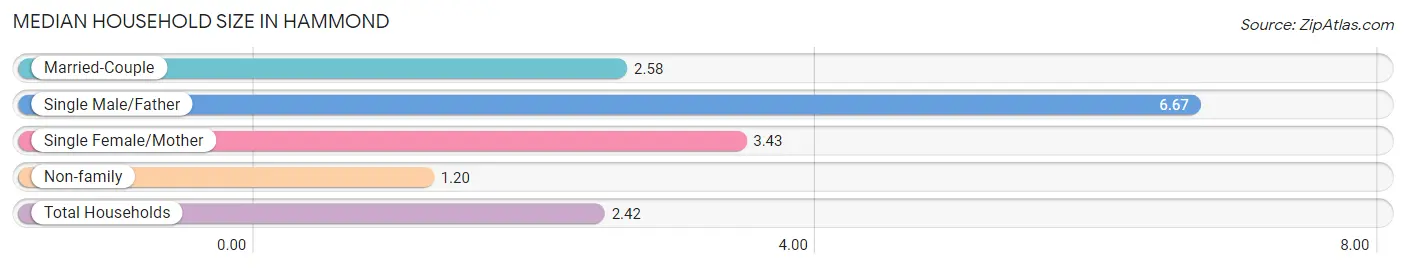
The median household size in Hammond is 2.42 persons per household, with single male/father households (3 | 2.7%) accounting for the largest median household size of 6.67 persons per household. non-family households (30 | 27.0%) represent the smallest median household size with 1.20 persons per household.
| Household Type | # Households | Household Size |
| Married-Couple | 64 (57.7%) | 2.58 |
| Single Male/Father | 3 (2.7%) | 6.67 |
| Single Female/Mother | 14 (12.6%) | 3.43 |
| Non-family | 30 (27.0%) | 1.20 |
| Total Households | 111 (100.0%) | 2.42 |
Household Size by Marriage Status in Hammond
Out of a total of 111 households in Hammond, 81 (73.0%) are family households, while 30 (27.0%) are nonfamily households. The most numerous type of family households are 2-person households, comprising 38, and the most common type of nonfamily households are 1-person households, comprising 25.
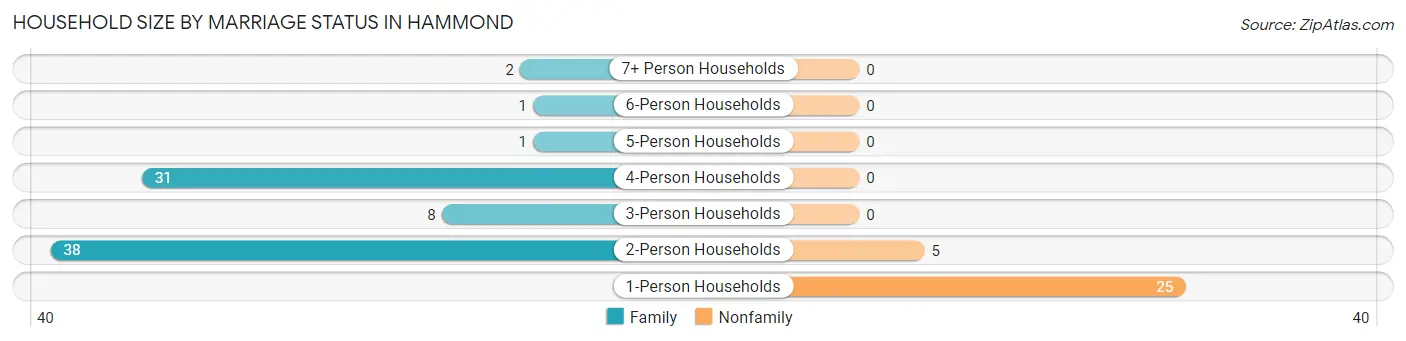
| Household Size | Family Households | Nonfamily Households |
| 1-Person Households | - | 25 (22.5%) |
| 2-Person Households | 38 (34.2%) | 5 (4.5%) |
| 3-Person Households | 8 (7.2%) | 0 (0.0%) |
| 4-Person Households | 31 (27.9%) | 0 (0.0%) |
| 5-Person Households | 1 (0.9%) | 0 (0.0%) |
| 6-Person Households | 1 (0.9%) | 0 (0.0%) |
| 7+ Person Households | 2 (1.8%) | 0 (0.0%) |
| Total | 81 (73.0%) | 30 (27.0%) |
Female Fertility in Hammond
Fertility by Age in Hammond
Average fertility rate in Hammond is 16.0 births per 1,000 women. Women in the age bracket of 35 to 50 years have the highest fertility rate with 27.0 births per 1,000 women. Women in the age bracket of 35 to 50 years acount for 100.0% of all women with births.
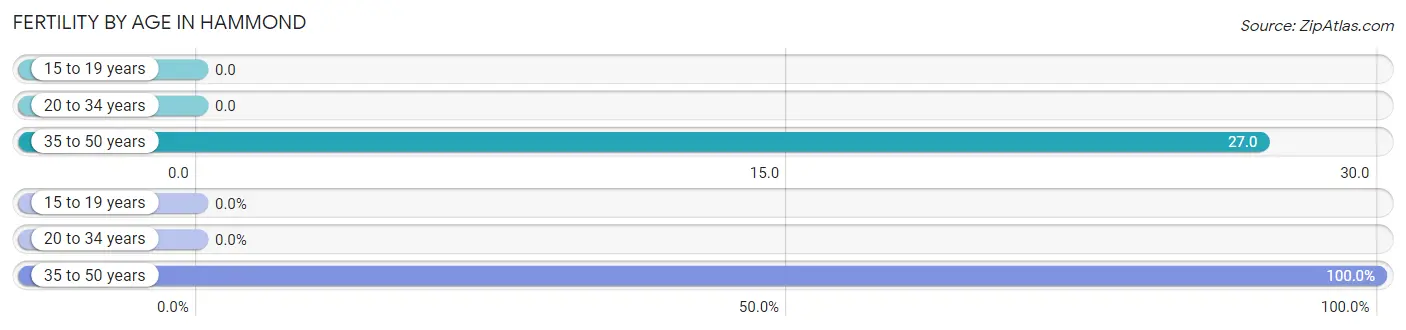
| Age Bracket | Women with Births | Births / 1,000 Women |
| 15 to 19 years | 0 (0.0%) | 0.0 |
| 20 to 34 years | 0 (0.0%) | 0.0 |
| 35 to 50 years | 1 (100.0%) | 27.0 |
| Total | 1 (100.0%) | 16.0 |
Fertility by Age by Marriage Status in Hammond
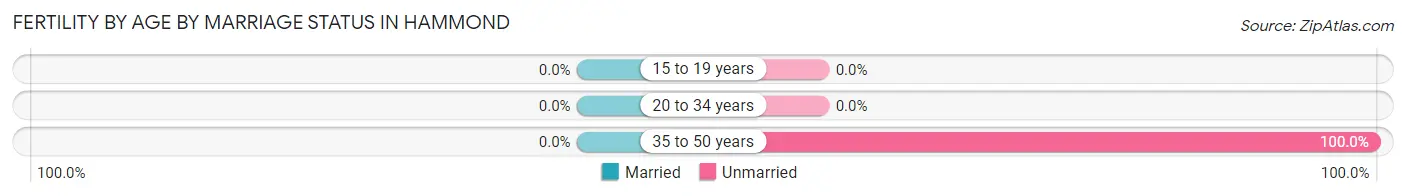
| Age Bracket | Married | Unmarried |
| 15 to 19 years | 0 (0.0%) | 0 (0.0%) |
| 20 to 34 years | 0 (0.0%) | 0 (0.0%) |
| 35 to 50 years | 0 (0.0%) | 1 (100.0%) |
| Total | 0 (0.0%) | 1 (100.0%) |
Fertility by Education in Hammond
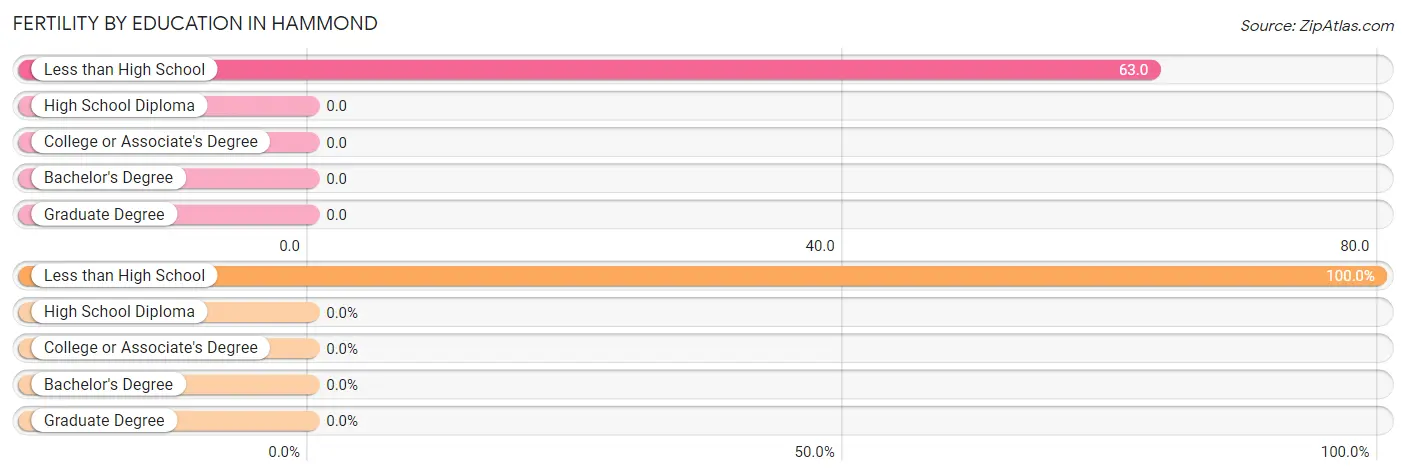
| Educational Attainment | Women with Births | Births / 1,000 Women |
| Less than High School | 1 (100.0%) | 63.0 |
| High School Diploma | 0 (0.0%) | 0.0 |
| College or Associate's Degree | 0 (0.0%) | 0.0 |
| Bachelor's Degree | 0 (0.0%) | 0.0 |
| Graduate Degree | 0 (0.0%) | 0.0 |
| Total | 1 (100.0%) | 16.0 |
Fertility by Education by Marriage Status in Hammond
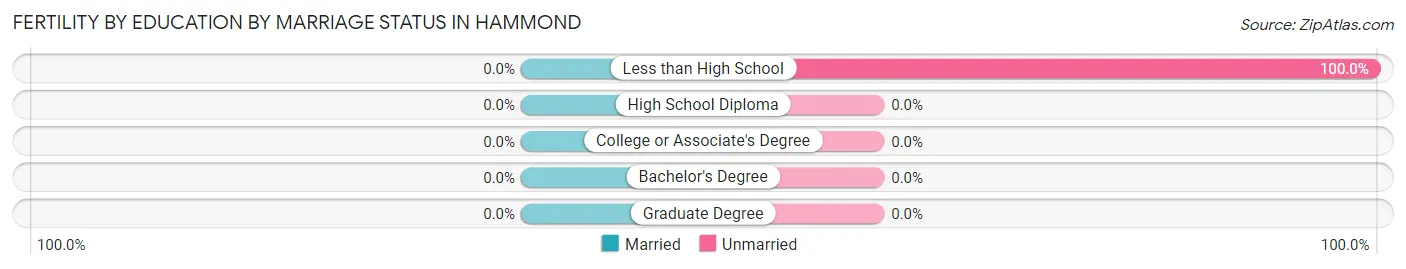
| Educational Attainment | Married | Unmarried |
| Less than High School | 0 (0.0%) | 1 (100.0%) |
| High School Diploma | 0 (0.0%) | 0 (0.0%) |
| College or Associate's Degree | 0 (0.0%) | 0 (0.0%) |
| Bachelor's Degree | 0 (0.0%) | 0 (0.0%) |
| Graduate Degree | 0 (0.0%) | 0 (0.0%) |
| Total | 0 (0.0%) | 1 (100.0%) |
Employment Characteristics in Hammond
Employment by Class of Employer in Hammond
Among the 92 employed individuals in Hammond, private company employees (44 | 47.8%), local government employees (18 | 19.6%), and not-for-profit organizations (13 | 14.1%) make up the most common classes of employment.
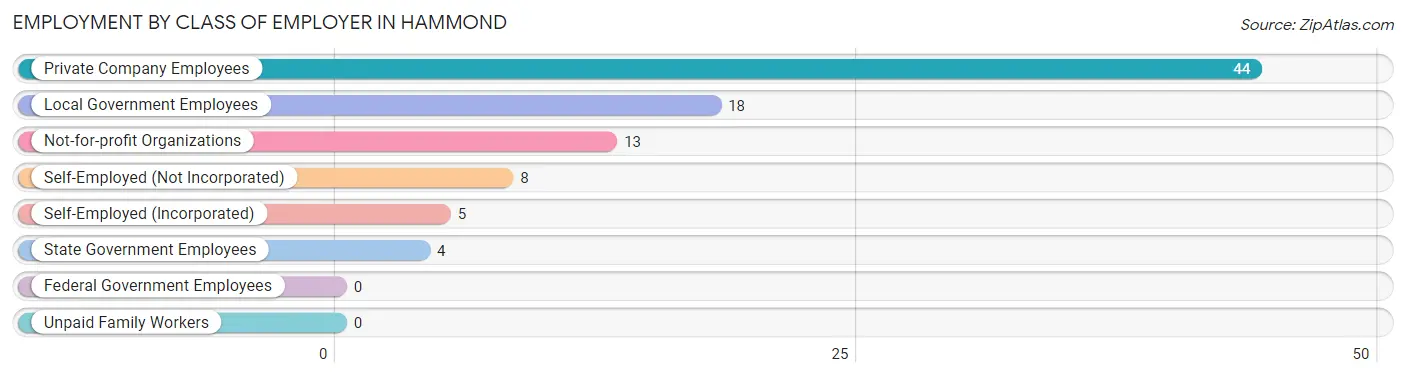
| Employer Class | # Employees | % Employees |
| Private Company Employees | 44 | 47.8% |
| Self-Employed (Incorporated) | 5 | 5.4% |
| Self-Employed (Not Incorporated) | 8 | 8.7% |
| Not-for-profit Organizations | 13 | 14.1% |
| Local Government Employees | 18 | 19.6% |
| State Government Employees | 4 | 4.3% |
| Federal Government Employees | 0 | 0.0% |
| Unpaid Family Workers | 0 | 0.0% |
| Total | 92 | 100.0% |
Employment Status by Age in Hammond
According to the labor force statistics for Hammond, out of the total population over 16 years of age (211), 44.5% or 94 individuals are in the labor force, with 2.1% or 2 of them unemployed. The age group with the highest labor force participation rate is 30 to 34 years, with 100.0% or 15 individuals in the labor force. Within the labor force, the 20 to 24 years age range has the highest percentage of unemployed individuals, with 22.2% or 2 of them being unemployed.
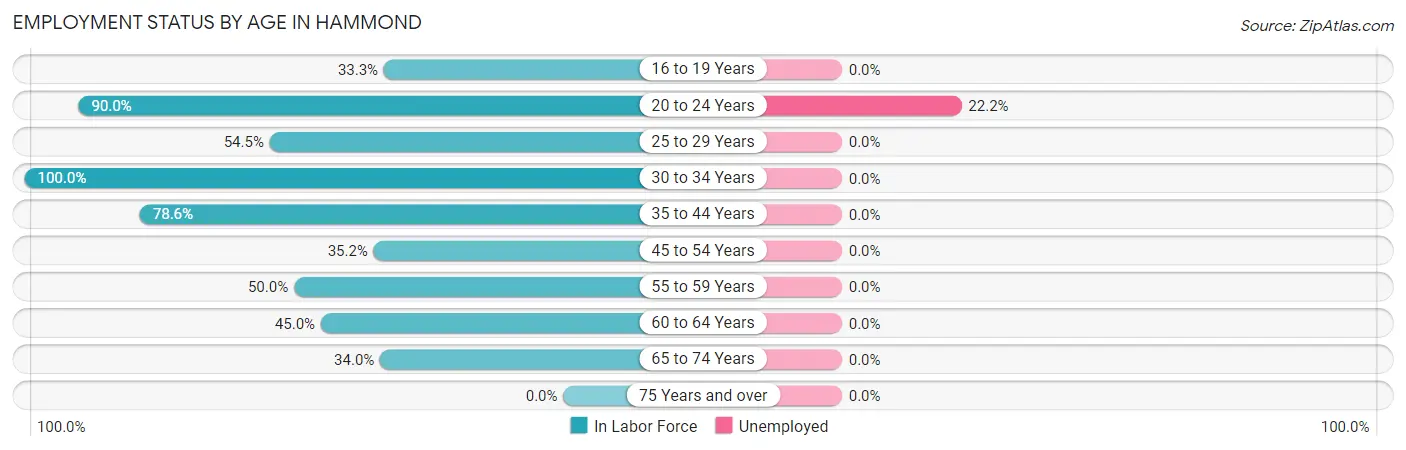
| Age Bracket | In Labor Force | Unemployed |
| 16 to 19 Years | 2 (33.3%) | 0 (0.0%) |
| 20 to 24 Years | 9 (90.0%) | 2 (22.2%) |
| 25 to 29 Years | 6 (54.5%) | 0 (0.0%) |
| 30 to 34 Years | 15 (100.0%) | 0 (0.0%) |
| 35 to 44 Years | 11 (78.6%) | 0 (0.0%) |
| 45 to 54 Years | 19 (35.2%) | 0 (0.0%) |
| 55 to 59 Years | 6 (50.0%) | 0 (0.0%) |
| 60 to 64 Years | 9 (45.0%) | 0 (0.0%) |
| 65 to 74 Years | 17 (34.0%) | 0 (0.0%) |
| 75 Years and over | 0 (0.0%) | 0 (0.0%) |
| Total | 94 (44.5%) | 2 (2.1%) |
Employment Status by Educational Attainment in Hammond
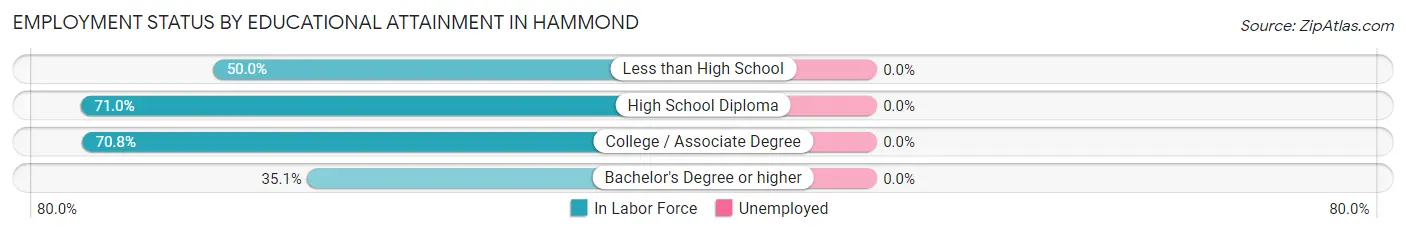
| Educational Attainment | In Labor Force | Unemployed |
| Less than High School | 7 (50.0%) | 0 (0.0%) |
| High School Diploma | 22 (71.0%) | 0 (0.0%) |
| College / Associate Degree | 17 (70.8%) | 0 (0.0%) |
| Bachelor's Degree or higher | 20 (35.1%) | 0 (0.0%) |
| Total | 66 (52.4%) | 0 (0.0%) |
Employment Occupations by Sex in Hammond
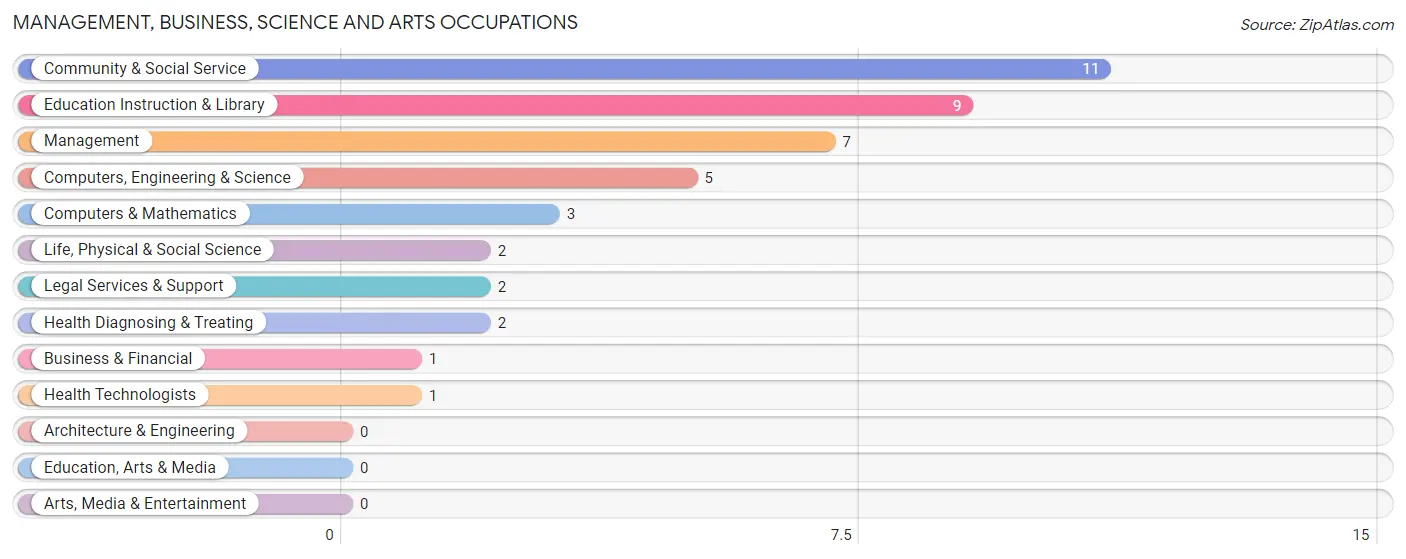
Management, Business, Science and Arts Occupations
The most common Management, Business, Science and Arts occupations in Hammond are Community & Social Service (11 | 12.0%), Education Instruction & Library (9 | 9.8%), Management (7 | 7.6%), Computers, Engineering & Science (5 | 5.4%), and Computers & Mathematics (3 | 3.3%).
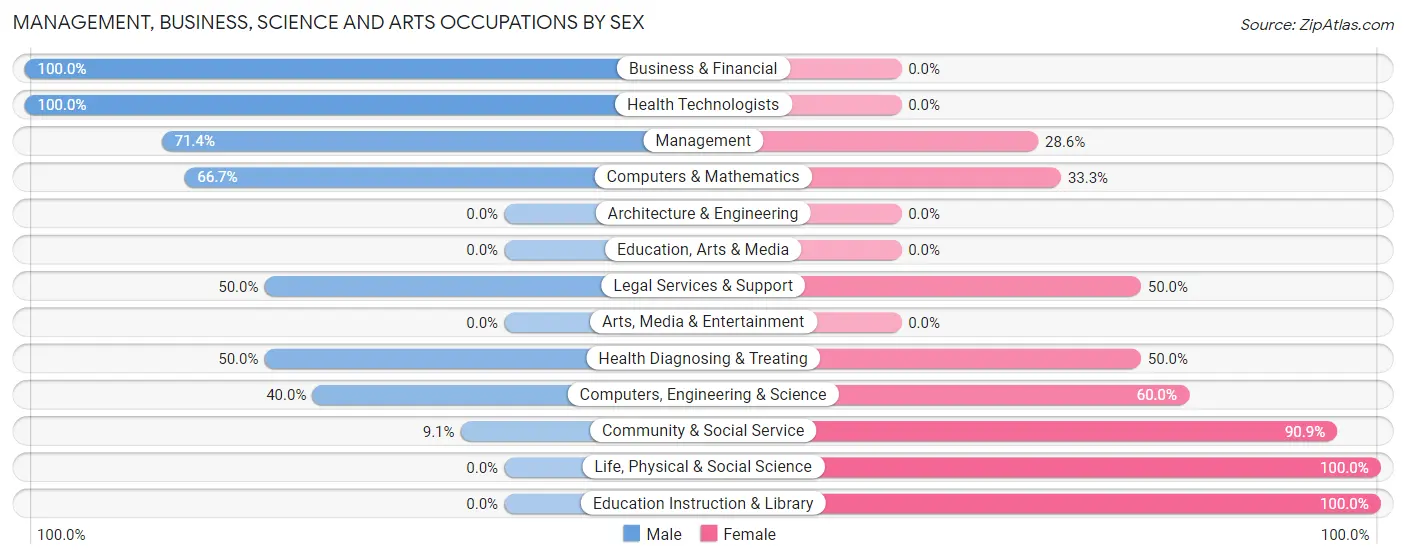
Management, Business, Science and Arts Occupations by Sex
Within the Management, Business, Science and Arts occupations in Hammond, the most male-oriented occupations are Business & Financial (100.0%), Health Technologists (100.0%), and Management (71.4%), while the most female-oriented occupations are Life, Physical & Social Science (100.0%), Education Instruction & Library (100.0%), and Community & Social Service (90.9%).
| Occupation | Male | Female |
| Management | 5 (71.4%) | 2 (28.6%) |
| Business & Financial | 1 (100.0%) | 0 (0.0%) |
| Computers, Engineering & Science | 2 (40.0%) | 3 (60.0%) |
| Computers & Mathematics | 2 (66.7%) | 1 (33.3%) |
| Architecture & Engineering | 0 (0.0%) | 0 (0.0%) |
| Life, Physical & Social Science | 0 (0.0%) | 2 (100.0%) |
| Community & Social Service | 1 (9.1%) | 10 (90.9%) |
| Education, Arts & Media | 0 (0.0%) | 0 (0.0%) |
| Legal Services & Support | 1 (50.0%) | 1 (50.0%) |
| Education Instruction & Library | 0 (0.0%) | 9 (100.0%) |
| Arts, Media & Entertainment | 0 (0.0%) | 0 (0.0%) |
| Health Diagnosing & Treating | 1 (50.0%) | 1 (50.0%) |
| Health Technologists | 1 (100.0%) | 0 (0.0%) |
| Total (Category) | 10 (38.5%) | 16 (61.5%) |
| Total (Overall) | 46 (50.0%) | 46 (50.0%) |
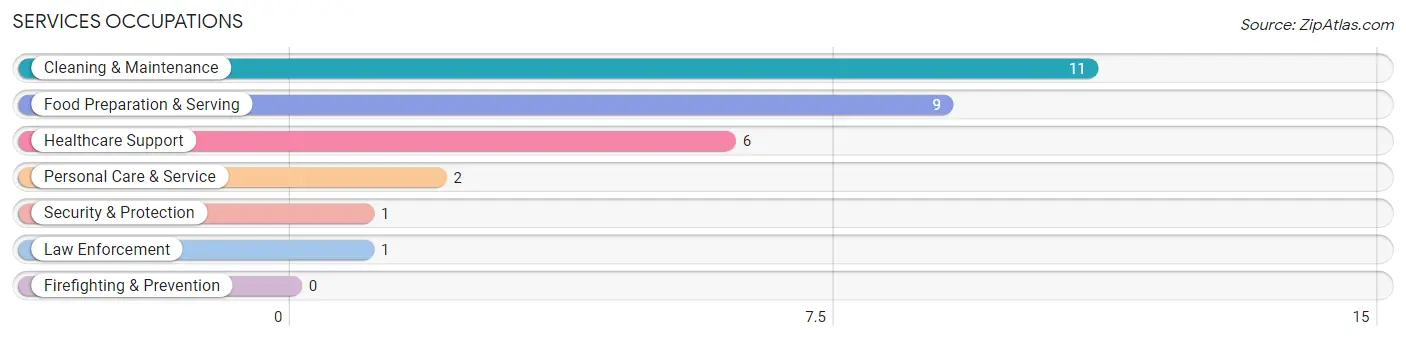
Services Occupations
The most common Services occupations in Hammond are Cleaning & Maintenance (11 | 12.0%), Food Preparation & Serving (9 | 9.8%), Healthcare Support (6 | 6.5%), Personal Care & Service (2 | 2.2%), and Security & Protection (1 | 1.1%).
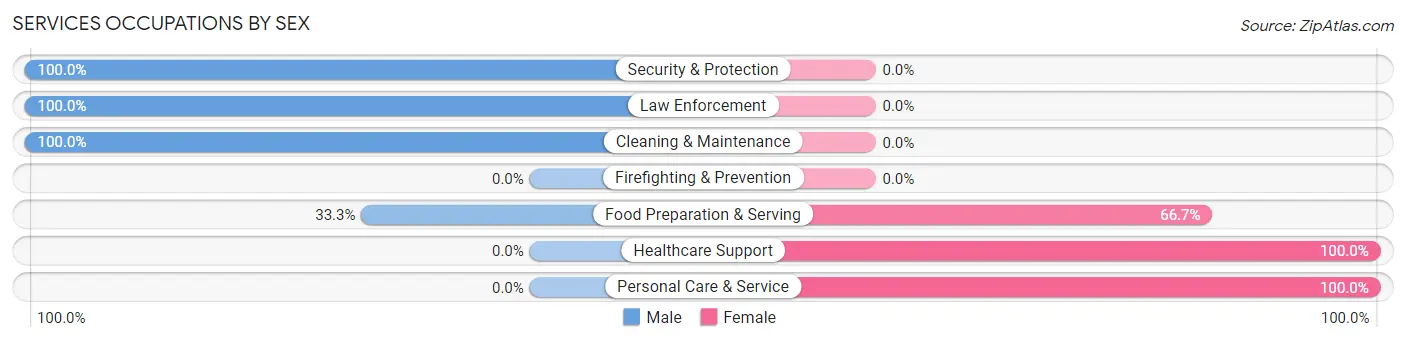
Services Occupations by Sex
Within the Services occupations in Hammond, the most male-oriented occupations are Security & Protection (100.0%), Law Enforcement (100.0%), and Cleaning & Maintenance (100.0%), while the most female-oriented occupations are Healthcare Support (100.0%), Personal Care & Service (100.0%), and Food Preparation & Serving (66.7%).
| Occupation | Male | Female |
| Healthcare Support | 0 (0.0%) | 6 (100.0%) |
| Security & Protection | 1 (100.0%) | 0 (0.0%) |
| Firefighting & Prevention | 0 (0.0%) | 0 (0.0%) |
| Law Enforcement | 1 (100.0%) | 0 (0.0%) |
| Food Preparation & Serving | 3 (33.3%) | 6 (66.7%) |
| Cleaning & Maintenance | 11 (100.0%) | 0 (0.0%) |
| Personal Care & Service | 0 (0.0%) | 2 (100.0%) |
| Total (Category) | 15 (51.7%) | 14 (48.3%) |
| Total (Overall) | 46 (50.0%) | 46 (50.0%) |
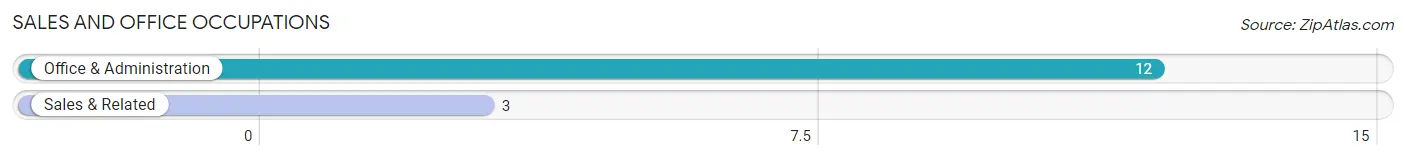
Sales and Office Occupations
The most common Sales and Office occupations in Hammond are Office & Administration (12 | 13.0%), and Sales & Related (3 | 3.3%).
Sales and Office Occupations by Sex
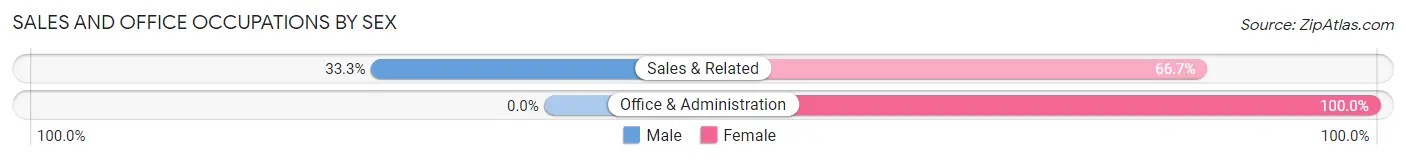
| Occupation | Male | Female |
| Sales & Related | 1 (33.3%) | 2 (66.7%) |
| Office & Administration | 0 (0.0%) | 12 (100.0%) |
| Total (Category) | 1 (6.7%) | 14 (93.3%) |
| Total (Overall) | 46 (50.0%) | 46 (50.0%) |
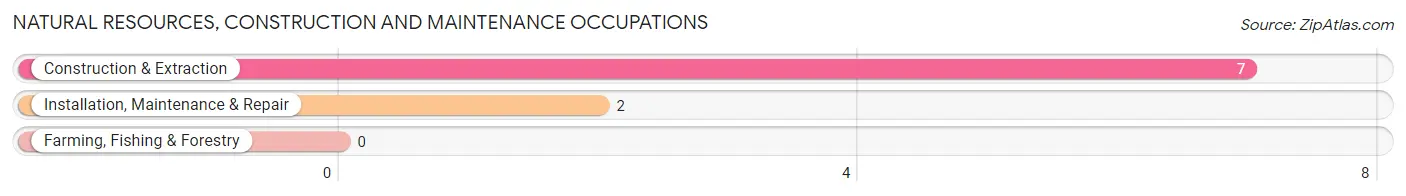
Natural Resources, Construction and Maintenance Occupations
The most common Natural Resources, Construction and Maintenance occupations in Hammond are Construction & Extraction (7 | 7.6%), and Installation, Maintenance & Repair (2 | 2.2%).
Natural Resources, Construction and Maintenance Occupations by Sex
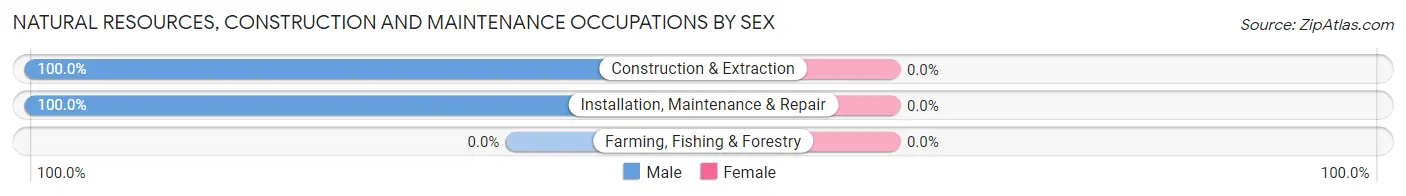
| Occupation | Male | Female |
| Farming, Fishing & Forestry | 0 (0.0%) | 0 (0.0%) |
| Construction & Extraction | 7 (100.0%) | 0 (0.0%) |
| Installation, Maintenance & Repair | 2 (100.0%) | 0 (0.0%) |
| Total (Category) | 9 (100.0%) | 0 (0.0%) |
| Total (Overall) | 46 (50.0%) | 46 (50.0%) |
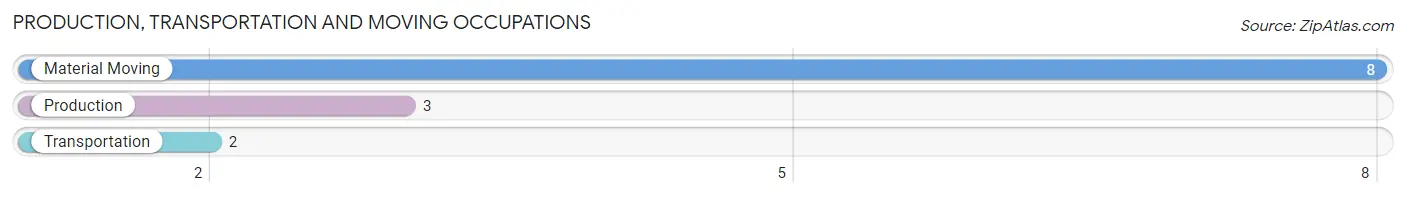
Production, Transportation and Moving Occupations
The most common Production, Transportation and Moving occupations in Hammond are Material Moving (8 | 8.7%), Production (3 | 3.3%), and Transportation (2 | 2.2%).
Production, Transportation and Moving Occupations by Sex
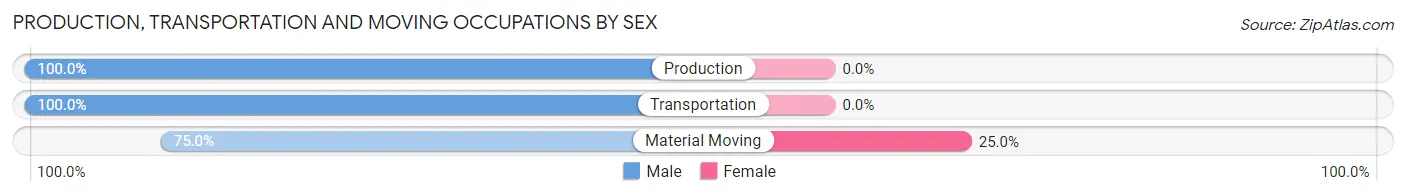
| Occupation | Male | Female |
| Production | 3 (100.0%) | 0 (0.0%) |
| Transportation | 2 (100.0%) | 0 (0.0%) |
| Material Moving | 6 (75.0%) | 2 (25.0%) |
| Total (Category) | 11 (84.6%) | 2 (15.4%) |
| Total (Overall) | 46 (50.0%) | 46 (50.0%) |
Employment Industries by Sex in Hammond
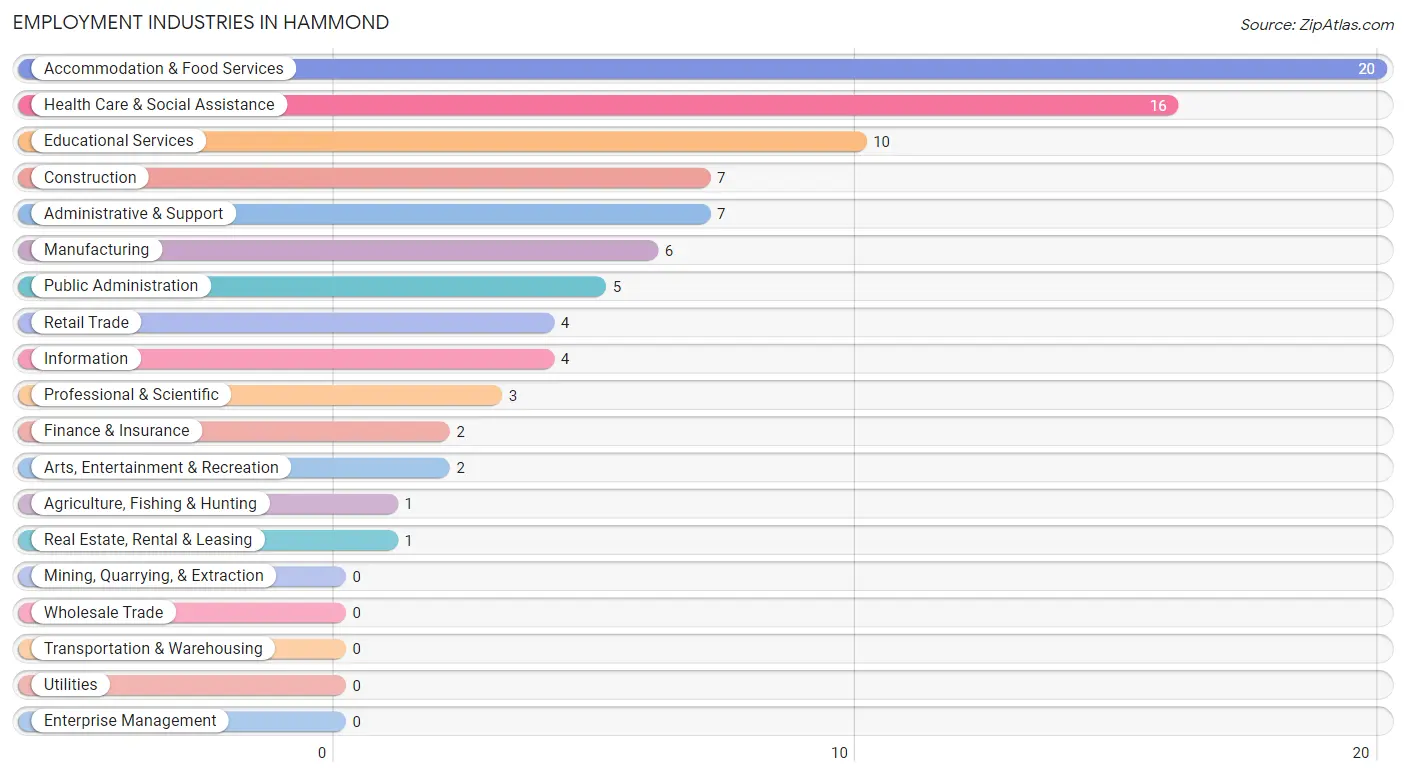
Employment Industries in Hammond
The major employment industries in Hammond include Accommodation & Food Services (20 | 21.7%), Health Care & Social Assistance (16 | 17.4%), Educational Services (10 | 10.9%), Construction (7 | 7.6%), and Administrative & Support (7 | 7.6%).
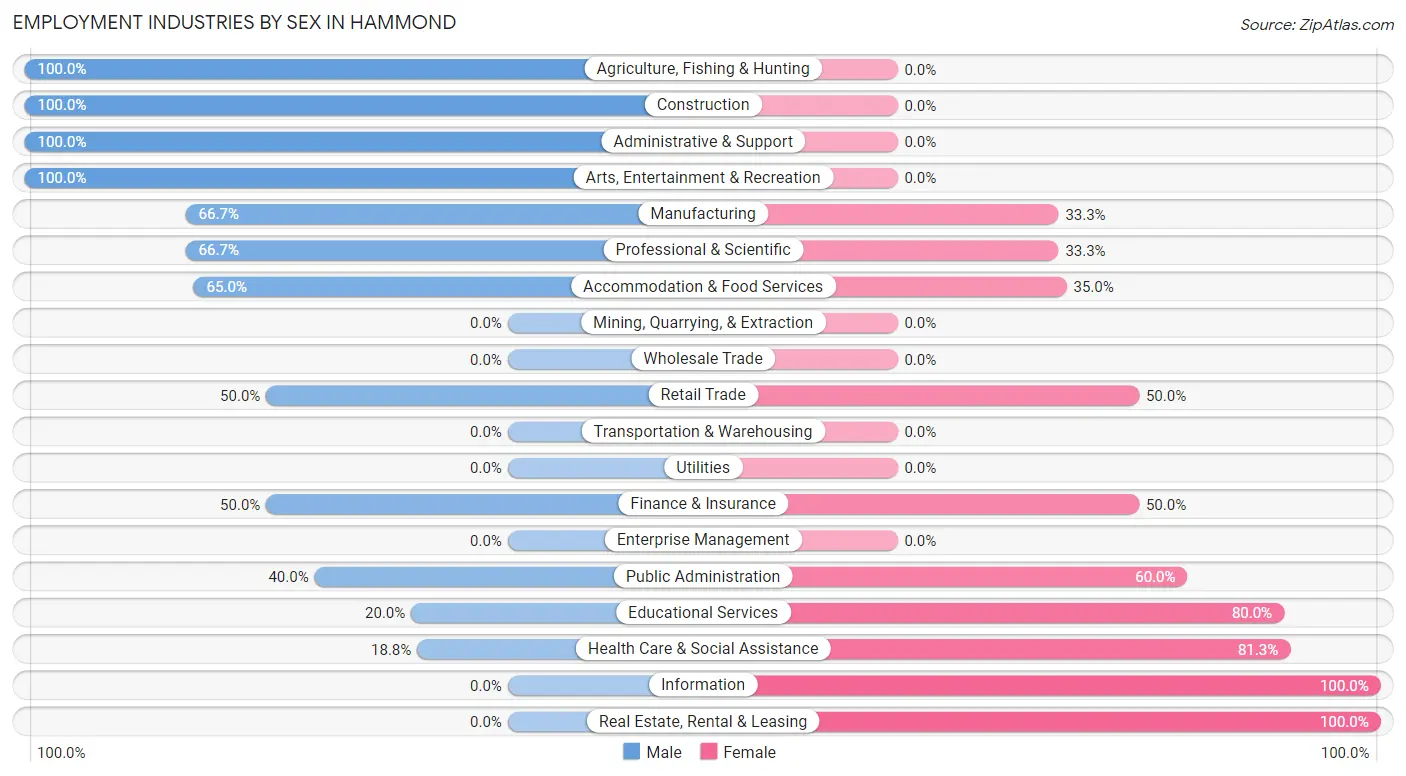
Employment Industries by Sex in Hammond
The Hammond industries that see more men than women are Agriculture, Fishing & Hunting (100.0%), Construction (100.0%), and Administrative & Support (100.0%), whereas the industries that tend to have a higher number of women are Information (100.0%), Real Estate, Rental & Leasing (100.0%), and Health Care & Social Assistance (81.2%).
| Industry | Male | Female |
| Agriculture, Fishing & Hunting | 1 (100.0%) | 0 (0.0%) |
| Mining, Quarrying, & Extraction | 0 (0.0%) | 0 (0.0%) |
| Construction | 7 (100.0%) | 0 (0.0%) |
| Manufacturing | 4 (66.7%) | 2 (33.3%) |
| Wholesale Trade | 0 (0.0%) | 0 (0.0%) |
| Retail Trade | 2 (50.0%) | 2 (50.0%) |
| Transportation & Warehousing | 0 (0.0%) | 0 (0.0%) |
| Utilities | 0 (0.0%) | 0 (0.0%) |
| Information | 0 (0.0%) | 4 (100.0%) |
| Finance & Insurance | 1 (50.0%) | 1 (50.0%) |
| Real Estate, Rental & Leasing | 0 (0.0%) | 1 (100.0%) |
| Professional & Scientific | 2 (66.7%) | 1 (33.3%) |
| Enterprise Management | 0 (0.0%) | 0 (0.0%) |
| Administrative & Support | 7 (100.0%) | 0 (0.0%) |
| Educational Services | 2 (20.0%) | 8 (80.0%) |
| Health Care & Social Assistance | 3 (18.8%) | 13 (81.2%) |
| Arts, Entertainment & Recreation | 2 (100.0%) | 0 (0.0%) |
| Accommodation & Food Services | 13 (65.0%) | 7 (35.0%) |
| Public Administration | 2 (40.0%) | 3 (60.0%) |
| Total | 46 (50.0%) | 46 (50.0%) |
Education in Hammond
School Enrollment in Hammond
The most common levels of schooling among the 45 students in Hammond are middle school (14 | 31.1%), high school (14 | 31.1%), and elementary school (7 | 15.6%).
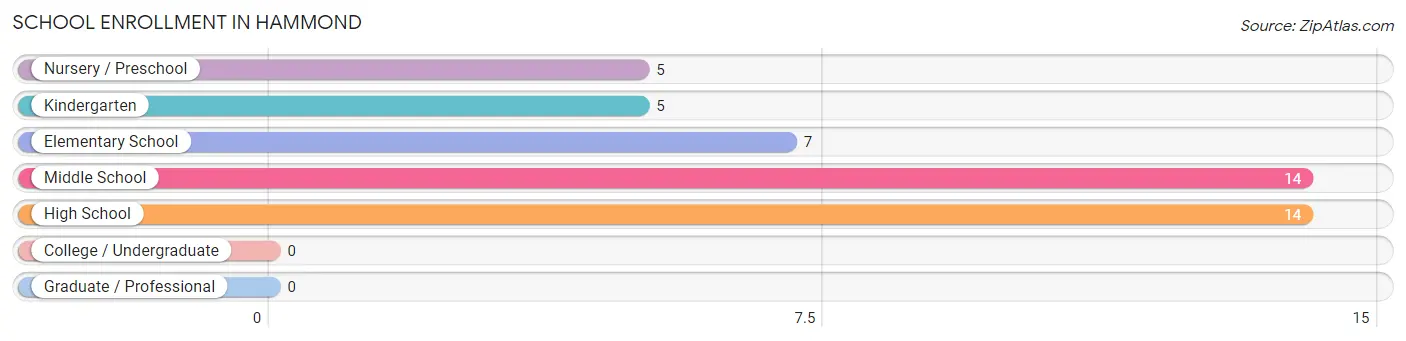
| School Level | # Students | % Students |
| Nursery / Preschool | 5 | 11.1% |
| Kindergarten | 5 | 11.1% |
| Elementary School | 7 | 15.6% |
| Middle School | 14 | 31.1% |
| High School | 14 | 31.1% |
| College / Undergraduate | 0 | 0.0% |
| Graduate / Professional | 0 | 0.0% |
| Total | 45 | 100.0% |
School Enrollment by Age by Funding Source in Hammond
Out of a total of 45 students who are enrolled in schools in Hammond, 3 (6.7%) attend a private institution, while the remaining 42 (93.3%) are enrolled in public schools. The age group of 3 to 4 year olds has the highest likelihood of being enrolled in private schools, with 1 (20.0% in the age bracket) enrolled. Conversely, the age group of 5 to 9 year old has the lowest likelihood of being enrolled in a private school, with 12 (100.0% in the age bracket) attending a public institution.
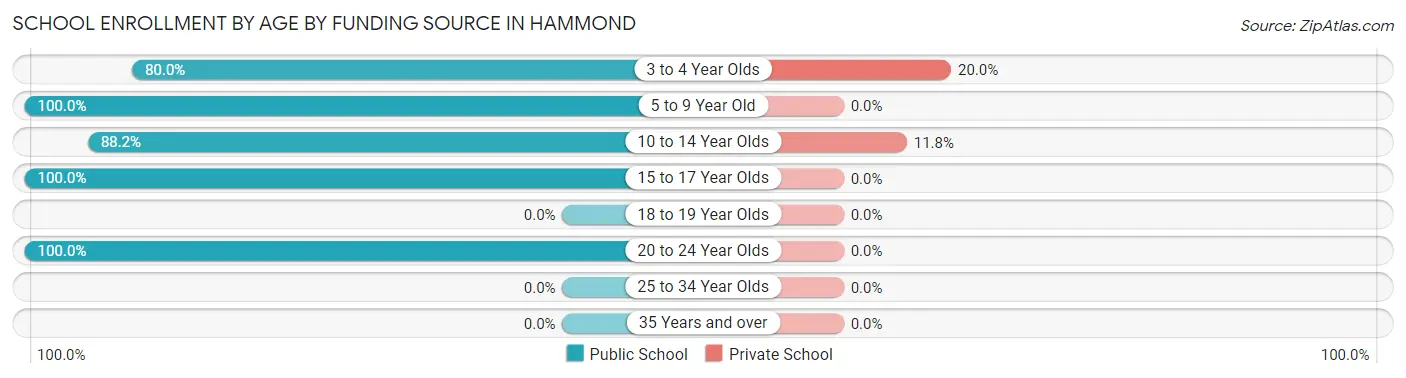
| Age Bracket | Public School | Private School |
| 3 to 4 Year Olds | 4 (80.0%) | 1 (20.0%) |
| 5 to 9 Year Old | 12 (100.0%) | 0 (0.0%) |
| 10 to 14 Year Olds | 15 (88.2%) | 2 (11.8%) |
| 15 to 17 Year Olds | 10 (100.0%) | 0 (0.0%) |
| 18 to 19 Year Olds | 0 (0.0%) | 0 (0.0%) |
| 20 to 24 Year Olds | 1 (100.0%) | 0 (0.0%) |
| 25 to 34 Year Olds | 0 (0.0%) | 0 (0.0%) |
| 35 Years and over | 0 (0.0%) | 0 (0.0%) |
| Total | 42 (93.3%) | 3 (6.7%) |
Educational Attainment by Field of Study in Hammond
Science & technology (20 | 29.0%), education (17 | 24.6%), engineering (16 | 23.2%), social sciences (4 | 5.8%), and arts & humanities (4 | 5.8%) are the most common fields of study among 69 individuals in Hammond who have obtained a bachelor's degree or higher.
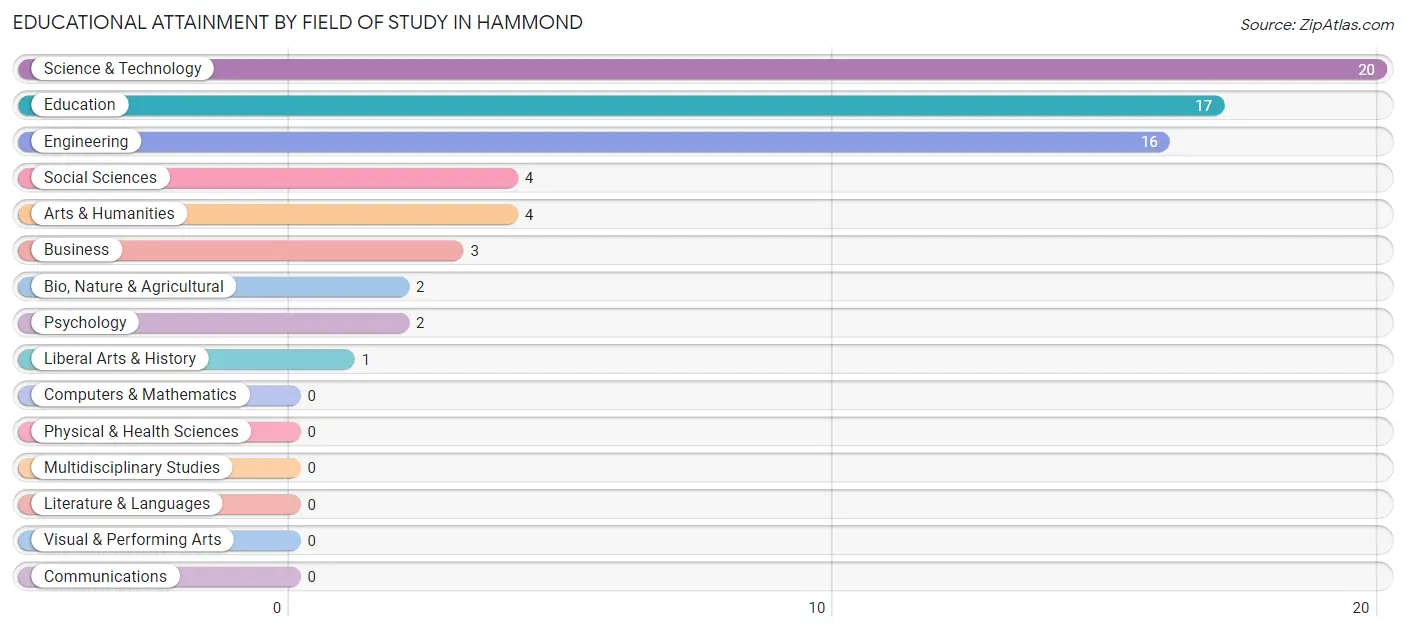
| Field of Study | # Graduates | % Graduates |
| Computers & Mathematics | 0 | 0.0% |
| Bio, Nature & Agricultural | 2 | 2.9% |
| Physical & Health Sciences | 0 | 0.0% |
| Psychology | 2 | 2.9% |
| Social Sciences | 4 | 5.8% |
| Engineering | 16 | 23.2% |
| Multidisciplinary Studies | 0 | 0.0% |
| Science & Technology | 20 | 29.0% |
| Business | 3 | 4.3% |
| Education | 17 | 24.6% |
| Literature & Languages | 0 | 0.0% |
| Liberal Arts & History | 1 | 1.5% |
| Visual & Performing Arts | 0 | 0.0% |
| Communications | 0 | 0.0% |
| Arts & Humanities | 4 | 5.8% |
| Total | 69 | 100.0% |
Transportation & Commute in Hammond
Vehicle Availability by Sex in Hammond
The most prevalent vehicle ownership categories in Hammond are males with 2 vehicles (20, accounting for 43.5%) and females with 2 vehicles (25, making up 43.5%).
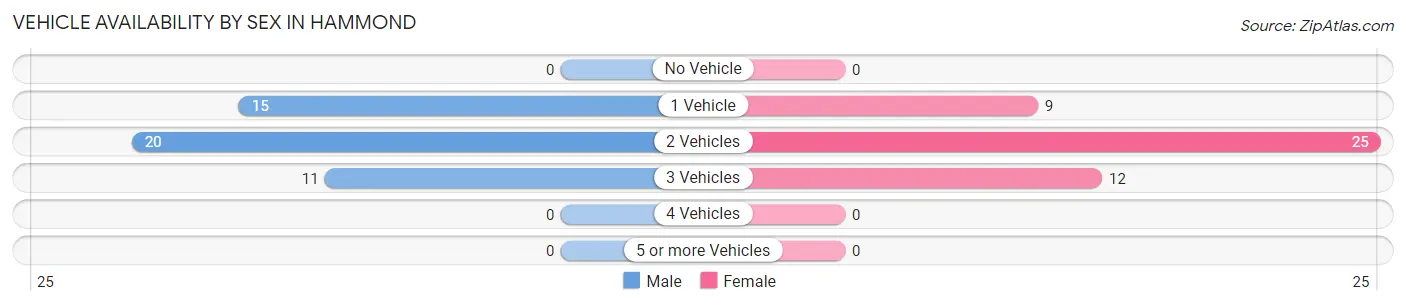
| Vehicles Available | Male | Female |
| No Vehicle | 0 (0.0%) | 0 (0.0%) |
| 1 Vehicle | 15 (32.6%) | 9 (19.6%) |
| 2 Vehicles | 20 (43.5%) | 25 (54.3%) |
| 3 Vehicles | 11 (23.9%) | 12 (26.1%) |
| 4 Vehicles | 0 (0.0%) | 0 (0.0%) |
| 5 or more Vehicles | 0 (0.0%) | 0 (0.0%) |
| Total | 46 (100.0%) | 46 (100.0%) |
Commute Time in Hammond
The most frequently occuring commute durations in Hammond are less than 5 minutes (16 commuters, 19.5%), 15 to 19 minutes (11 commuters, 13.4%), and 25 to 29 minutes (9 commuters, 11.0%).
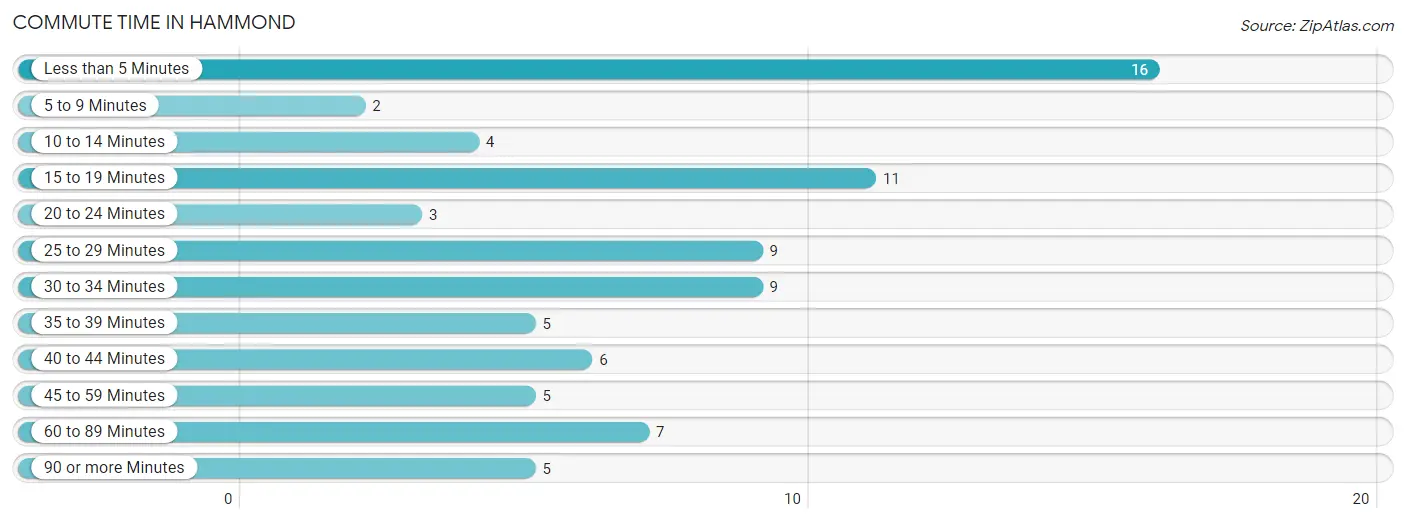
| Commute Time | # Commuters | % Commuters |
| Less than 5 Minutes | 16 | 19.5% |
| 5 to 9 Minutes | 2 | 2.4% |
| 10 to 14 Minutes | 4 | 4.9% |
| 15 to 19 Minutes | 11 | 13.4% |
| 20 to 24 Minutes | 3 | 3.7% |
| 25 to 29 Minutes | 9 | 11.0% |
| 30 to 34 Minutes | 9 | 11.0% |
| 35 to 39 Minutes | 5 | 6.1% |
| 40 to 44 Minutes | 6 | 7.3% |
| 45 to 59 Minutes | 5 | 6.1% |
| 60 to 89 Minutes | 7 | 8.5% |
| 90 or more Minutes | 5 | 6.1% |
Commute Time by Sex in Hammond
The most common commute times in Hammond are 25 to 29 minutes (7 commuters, 15.6%) for males and less than 5 minutes (13 commuters, 35.1%) for females.
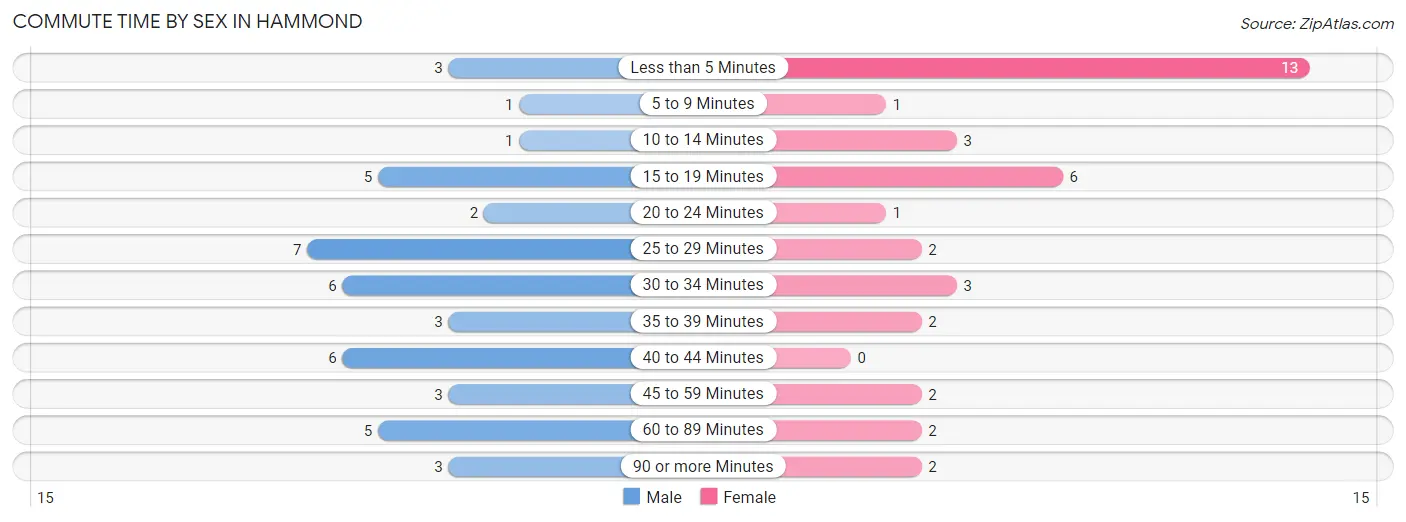
| Commute Time | Male | Female |
| Less than 5 Minutes | 3 (6.7%) | 13 (35.1%) |
| 5 to 9 Minutes | 1 (2.2%) | 1 (2.7%) |
| 10 to 14 Minutes | 1 (2.2%) | 3 (8.1%) |
| 15 to 19 Minutes | 5 (11.1%) | 6 (16.2%) |
| 20 to 24 Minutes | 2 (4.4%) | 1 (2.7%) |
| 25 to 29 Minutes | 7 (15.6%) | 2 (5.4%) |
| 30 to 34 Minutes | 6 (13.3%) | 3 (8.1%) |
| 35 to 39 Minutes | 3 (6.7%) | 2 (5.4%) |
| 40 to 44 Minutes | 6 (13.3%) | 0 (0.0%) |
| 45 to 59 Minutes | 3 (6.7%) | 2 (5.4%) |
| 60 to 89 Minutes | 5 (11.1%) | 2 (5.4%) |
| 90 or more Minutes | 3 (6.7%) | 2 (5.4%) |
Time of Departure to Work by Sex in Hammond
The most frequent times of departure to work in Hammond are 6:00 AM to 6:29 AM (24, 53.3%) for males and 7:30 AM to 7:59 AM (12, 32.4%) for females.
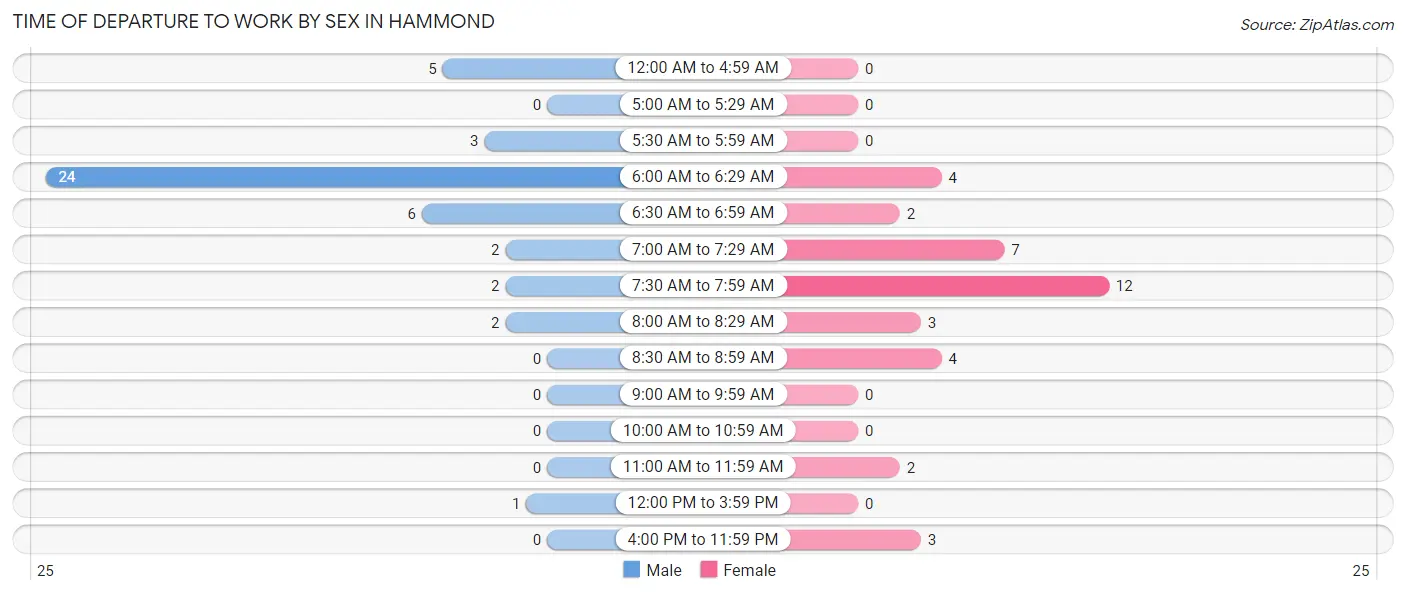
| Time of Departure | Male | Female |
| 12:00 AM to 4:59 AM | 5 (11.1%) | 0 (0.0%) |
| 5:00 AM to 5:29 AM | 0 (0.0%) | 0 (0.0%) |
| 5:30 AM to 5:59 AM | 3 (6.7%) | 0 (0.0%) |
| 6:00 AM to 6:29 AM | 24 (53.3%) | 4 (10.8%) |
| 6:30 AM to 6:59 AM | 6 (13.3%) | 2 (5.4%) |
| 7:00 AM to 7:29 AM | 2 (4.4%) | 7 (18.9%) |
| 7:30 AM to 7:59 AM | 2 (4.4%) | 12 (32.4%) |
| 8:00 AM to 8:29 AM | 2 (4.4%) | 3 (8.1%) |
| 8:30 AM to 8:59 AM | 0 (0.0%) | 4 (10.8%) |
| 9:00 AM to 9:59 AM | 0 (0.0%) | 0 (0.0%) |
| 10:00 AM to 10:59 AM | 0 (0.0%) | 0 (0.0%) |
| 11:00 AM to 11:59 AM | 0 (0.0%) | 2 (5.4%) |
| 12:00 PM to 3:59 PM | 1 (2.2%) | 0 (0.0%) |
| 4:00 PM to 11:59 PM | 0 (0.0%) | 3 (8.1%) |
| Total | 45 (100.0%) | 37 (100.0%) |
Housing Occupancy in Hammond
Occupancy by Ownership in Hammond
Of the total 111 dwellings in Hammond, owner-occupied units account for 62 (55.9%), while renter-occupied units make up 49 (44.1%).
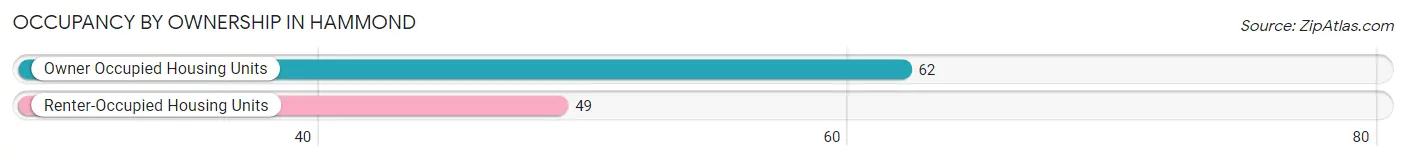
| Occupancy | # Housing Units | % Housing Units |
| Owner Occupied Housing Units | 62 | 55.9% |
| Renter-Occupied Housing Units | 49 | 44.1% |
| Total Occupied Housing Units | 111 | 100.0% |
Occupancy by Household Size in Hammond
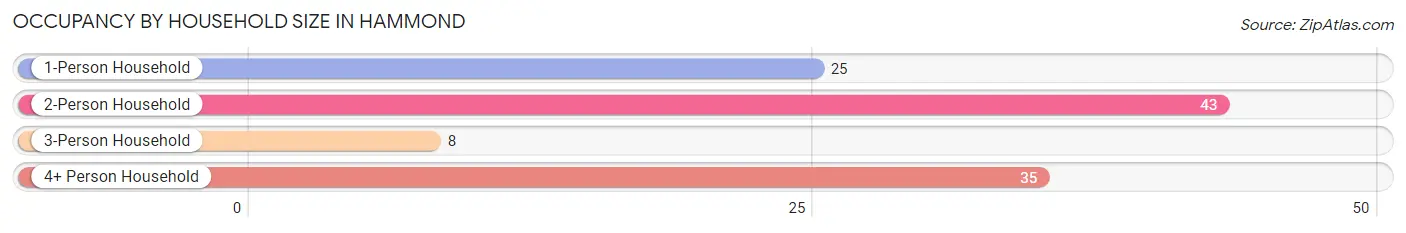
| Household Size | # Housing Units | % Housing Units |
| 1-Person Household | 25 | 22.5% |
| 2-Person Household | 43 | 38.7% |
| 3-Person Household | 8 | 7.2% |
| 4+ Person Household | 35 | 31.5% |
| Total Housing Units | 111 | 100.0% |
Occupancy by Ownership by Household Size in Hammond
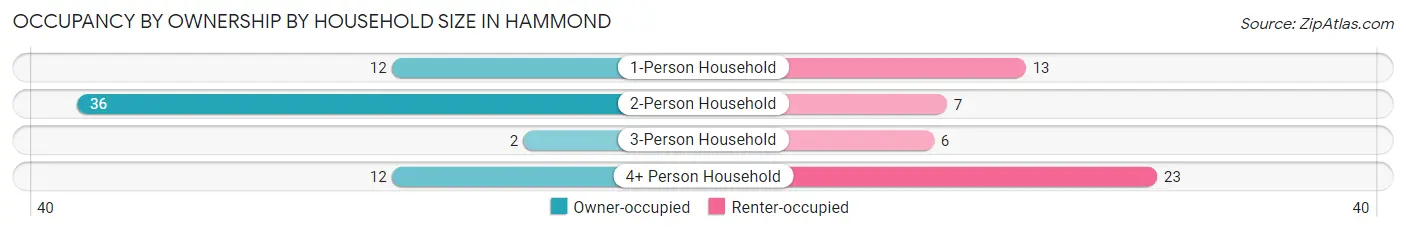
| Household Size | Owner-occupied | Renter-occupied |
| 1-Person Household | 12 (48.0%) | 13 (52.0%) |
| 2-Person Household | 36 (83.7%) | 7 (16.3%) |
| 3-Person Household | 2 (25.0%) | 6 (75.0%) |
| 4+ Person Household | 12 (34.3%) | 23 (65.7%) |
| Total Housing Units | 62 (55.9%) | 49 (44.1%) |
Occupancy by Educational Attainment in Hammond
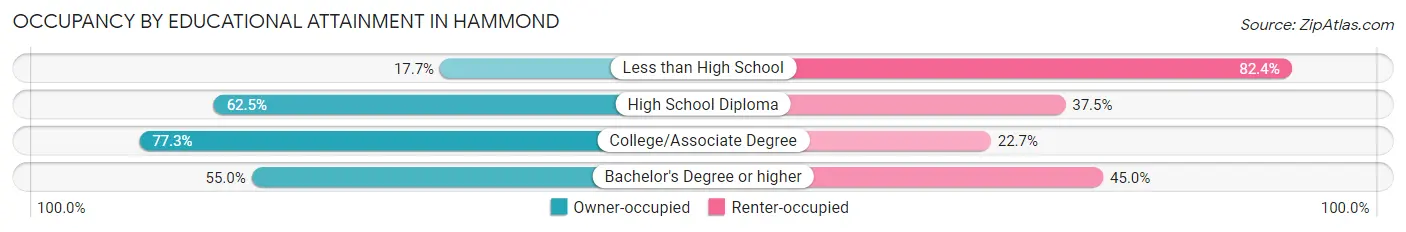
| Household Size | Owner-occupied | Renter-occupied |
| Less than High School | 3 (17.6%) | 14 (82.4%) |
| High School Diploma | 20 (62.5%) | 12 (37.5%) |
| College/Associate Degree | 17 (77.3%) | 5 (22.7%) |
| Bachelor's Degree or higher | 22 (55.0%) | 18 (45.0%) |
Occupancy by Age of Householder in Hammond
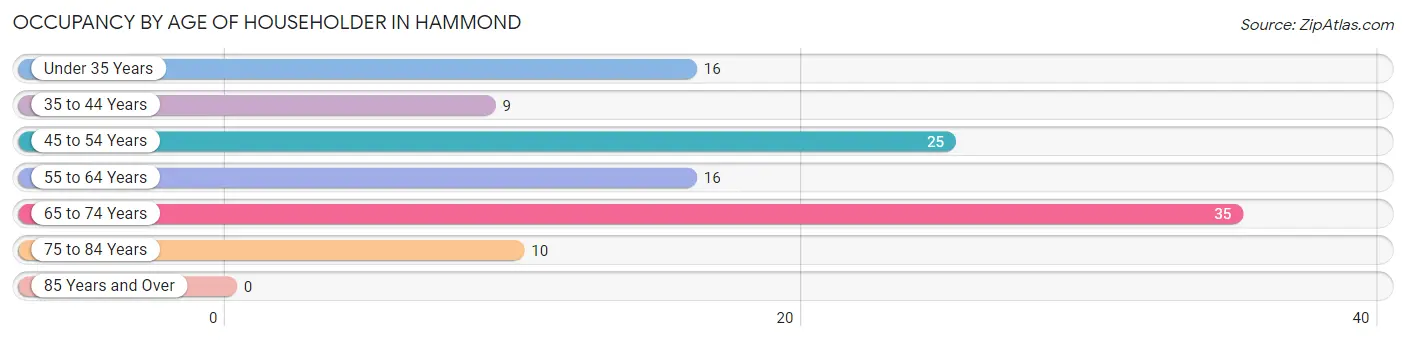
| Age Bracket | # Households | % Households |
| Under 35 Years | 16 | 14.4% |
| 35 to 44 Years | 9 | 8.1% |
| 45 to 54 Years | 25 | 22.5% |
| 55 to 64 Years | 16 | 14.4% |
| 65 to 74 Years | 35 | 31.5% |
| 75 to 84 Years | 10 | 9.0% |
| 85 Years and Over | 0 | 0.0% |
| Total | 111 | 100.0% |
Housing Finances in Hammond
Median Income by Occupancy in Hammond
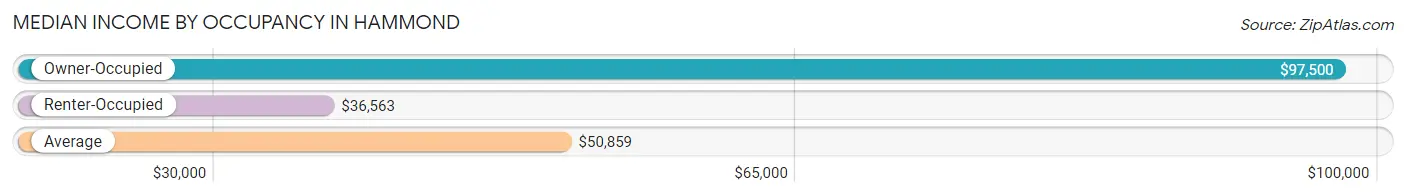
| Occupancy Type | # Households | Median Income |
| Owner-Occupied | 62 (55.9%) | $97,500 |
| Renter-Occupied | 49 (44.1%) | $36,563 |
| Average | 111 (100.0%) | $50,859 |
Occupancy by Householder Income Bracket in Hammond
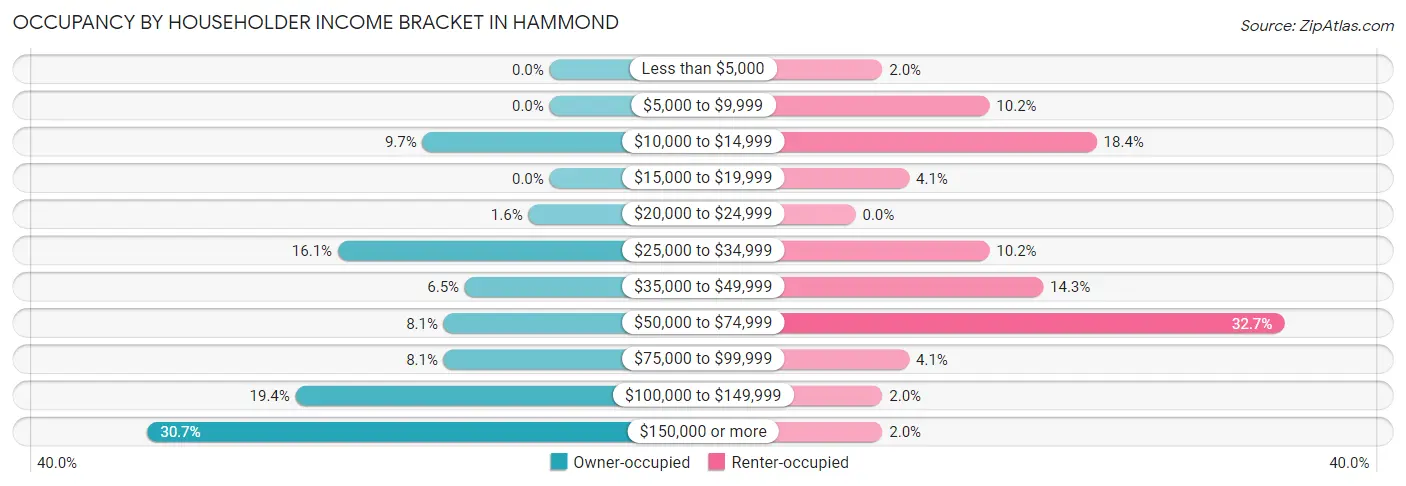
| Income Bracket | Owner-occupied | Renter-occupied |
| Less than $5,000 | 0 (0.0%) | 1 (2.0%) |
| $5,000 to $9,999 | 0 (0.0%) | 5 (10.2%) |
| $10,000 to $14,999 | 6 (9.7%) | 9 (18.4%) |
| $15,000 to $19,999 | 0 (0.0%) | 2 (4.1%) |
| $20,000 to $24,999 | 1 (1.6%) | 0 (0.0%) |
| $25,000 to $34,999 | 10 (16.1%) | 5 (10.2%) |
| $35,000 to $49,999 | 4 (6.5%) | 7 (14.3%) |
| $50,000 to $74,999 | 5 (8.1%) | 16 (32.7%) |
| $75,000 to $99,999 | 5 (8.1%) | 2 (4.1%) |
| $100,000 to $149,999 | 12 (19.4%) | 1 (2.0%) |
| $150,000 or more | 19 (30.6%) | 1 (2.0%) |
| Total | 62 (100.0%) | 49 (100.0%) |
Monthly Housing Cost Tiers in Hammond
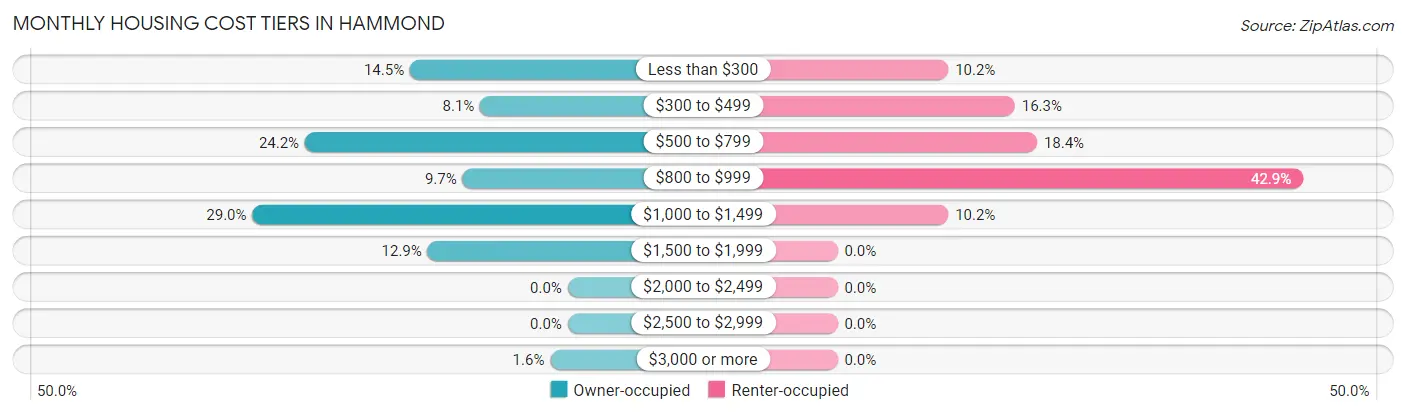
| Monthly Cost | Owner-occupied | Renter-occupied |
| Less than $300 | 9 (14.5%) | 5 (10.2%) |
| $300 to $499 | 5 (8.1%) | 8 (16.3%) |
| $500 to $799 | 15 (24.2%) | 9 (18.4%) |
| $800 to $999 | 6 (9.7%) | 21 (42.9%) |
| $1,000 to $1,499 | 18 (29.0%) | 5 (10.2%) |
| $1,500 to $1,999 | 8 (12.9%) | 0 (0.0%) |
| $2,000 to $2,499 | 0 (0.0%) | 0 (0.0%) |
| $2,500 to $2,999 | 0 (0.0%) | 0 (0.0%) |
| $3,000 or more | 1 (1.6%) | 0 (0.0%) |
| Total | 62 (100.0%) | 49 (100.0%) |
Physical Housing Characteristics in Hammond
Housing Structures in Hammond
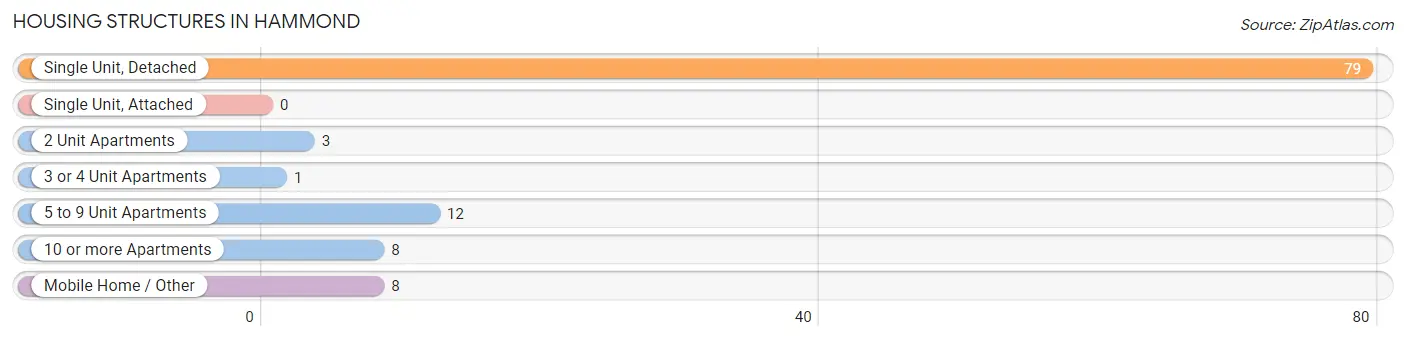
| Structure Type | # Housing Units | % Housing Units |
| Single Unit, Detached | 79 | 71.2% |
| Single Unit, Attached | 0 | 0.0% |
| 2 Unit Apartments | 3 | 2.7% |
| 3 or 4 Unit Apartments | 1 | 0.9% |
| 5 to 9 Unit Apartments | 12 | 10.8% |
| 10 or more Apartments | 8 | 7.2% |
| Mobile Home / Other | 8 | 7.2% |
| Total | 111 | 100.0% |
Housing Structures by Occupancy in Hammond
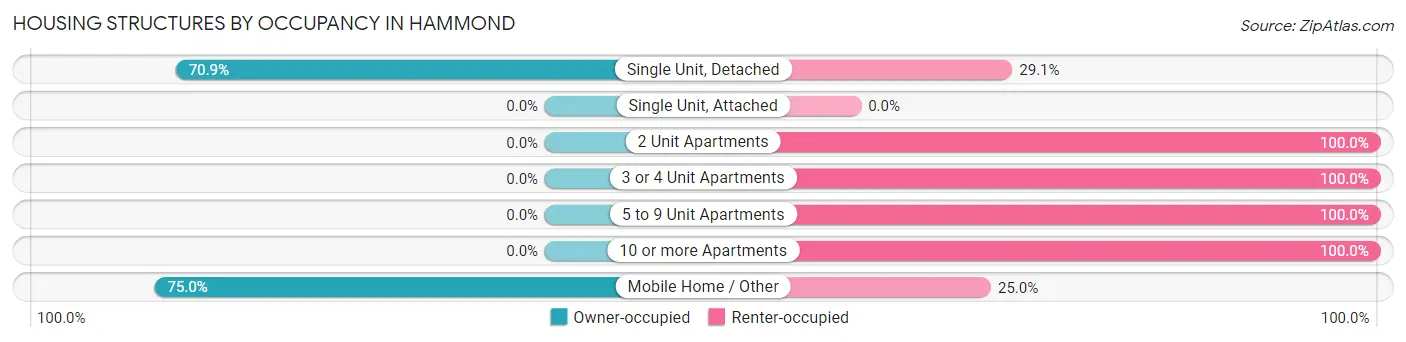
| Structure Type | Owner-occupied | Renter-occupied |
| Single Unit, Detached | 56 (70.9%) | 23 (29.1%) |
| Single Unit, Attached | 0 (0.0%) | 0 (0.0%) |
| 2 Unit Apartments | 0 (0.0%) | 3 (100.0%) |
| 3 or 4 Unit Apartments | 0 (0.0%) | 1 (100.0%) |
| 5 to 9 Unit Apartments | 0 (0.0%) | 12 (100.0%) |
| 10 or more Apartments | 0 (0.0%) | 8 (100.0%) |
| Mobile Home / Other | 6 (75.0%) | 2 (25.0%) |
| Total | 62 (55.9%) | 49 (44.1%) |
Housing Structures by Number of Rooms in Hammond
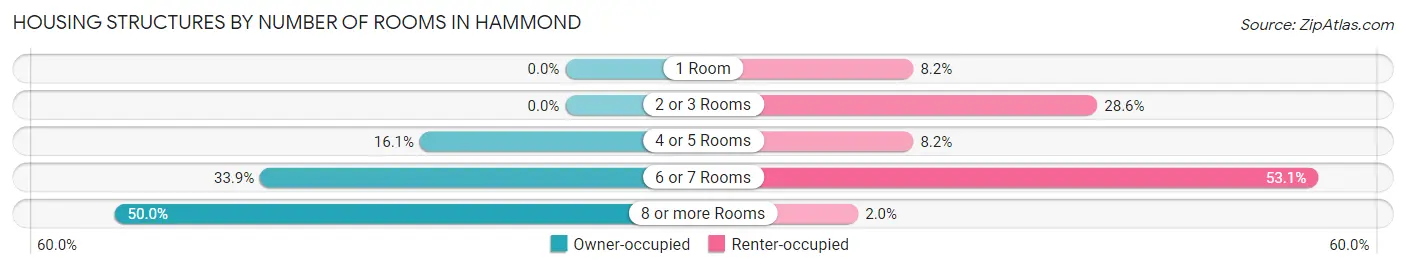
| Number of Rooms | Owner-occupied | Renter-occupied |
| 1 Room | 0 (0.0%) | 4 (8.2%) |
| 2 or 3 Rooms | 0 (0.0%) | 14 (28.6%) |
| 4 or 5 Rooms | 10 (16.1%) | 4 (8.2%) |
| 6 or 7 Rooms | 21 (33.9%) | 26 (53.1%) |
| 8 or more Rooms | 31 (50.0%) | 1 (2.0%) |
| Total | 62 (100.0%) | 49 (100.0%) |
Housing Structure by Heating Type in Hammond
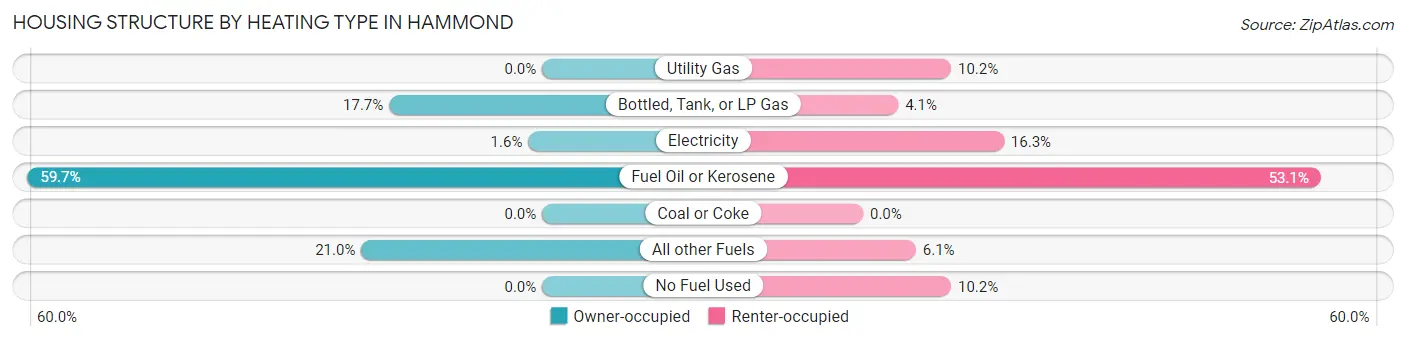
| Heating Type | Owner-occupied | Renter-occupied |
| Utility Gas | 0 (0.0%) | 5 (10.2%) |
| Bottled, Tank, or LP Gas | 11 (17.7%) | 2 (4.1%) |
| Electricity | 1 (1.6%) | 8 (16.3%) |
| Fuel Oil or Kerosene | 37 (59.7%) | 26 (53.1%) |
| Coal or Coke | 0 (0.0%) | 0 (0.0%) |
| All other Fuels | 13 (21.0%) | 3 (6.1%) |
| No Fuel Used | 0 (0.0%) | 5 (10.2%) |
| Total | 62 (100.0%) | 49 (100.0%) |
Household Vehicle Usage in Hammond
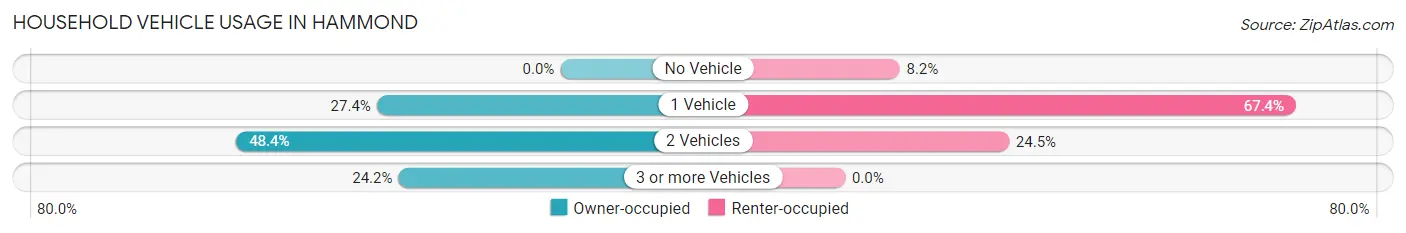
| Vehicles per Household | Owner-occupied | Renter-occupied |
| No Vehicle | 0 (0.0%) | 4 (8.2%) |
| 1 Vehicle | 17 (27.4%) | 33 (67.3%) |
| 2 Vehicles | 30 (48.4%) | 12 (24.5%) |
| 3 or more Vehicles | 15 (24.2%) | 0 (0.0%) |
| Total | 62 (100.0%) | 49 (100.0%) |
Real Estate & Mortgages in Hammond
Real Estate and Mortgage Overview in Hammond
| Characteristic | Without Mortgage | With Mortgage |
| Housing Units | 38 | 24 |
| Median Property Value | $80,000 | $92,500 |
| Median Household Income | $103,333 | $8 |
| Monthly Housing Costs | $663 | $1 |
| Real Estate Taxes | $1,750 | $0 |
Property Value by Mortgage Status in Hammond
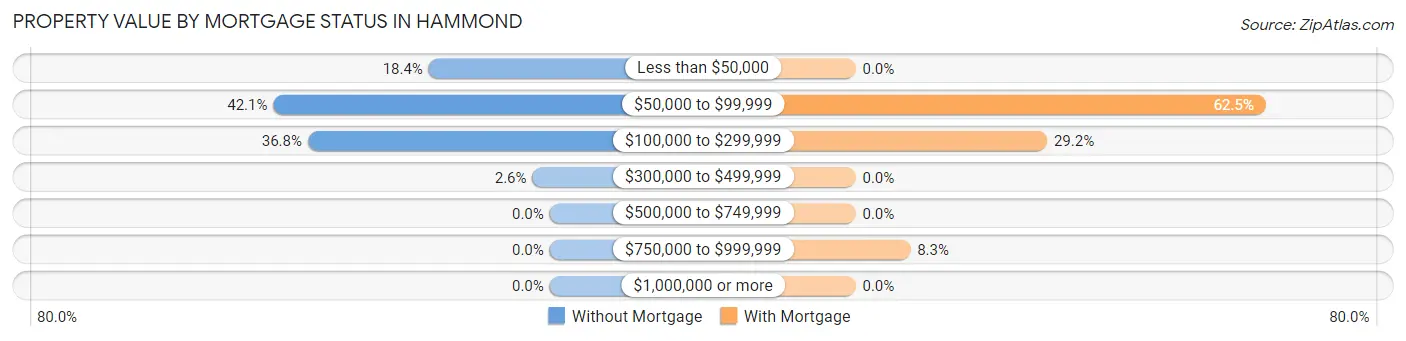
| Property Value | Without Mortgage | With Mortgage |
| Less than $50,000 | 7 (18.4%) | 0 (0.0%) |
| $50,000 to $99,999 | 16 (42.1%) | 15 (62.5%) |
| $100,000 to $299,999 | 14 (36.8%) | 7 (29.2%) |
| $300,000 to $499,999 | 1 (2.6%) | 0 (0.0%) |
| $500,000 to $749,999 | 0 (0.0%) | 0 (0.0%) |
| $750,000 to $999,999 | 0 (0.0%) | 2 (8.3%) |
| $1,000,000 or more | 0 (0.0%) | 0 (0.0%) |
| Total | 38 (100.0%) | 24 (100.0%) |
Household Income by Mortgage Status in Hammond
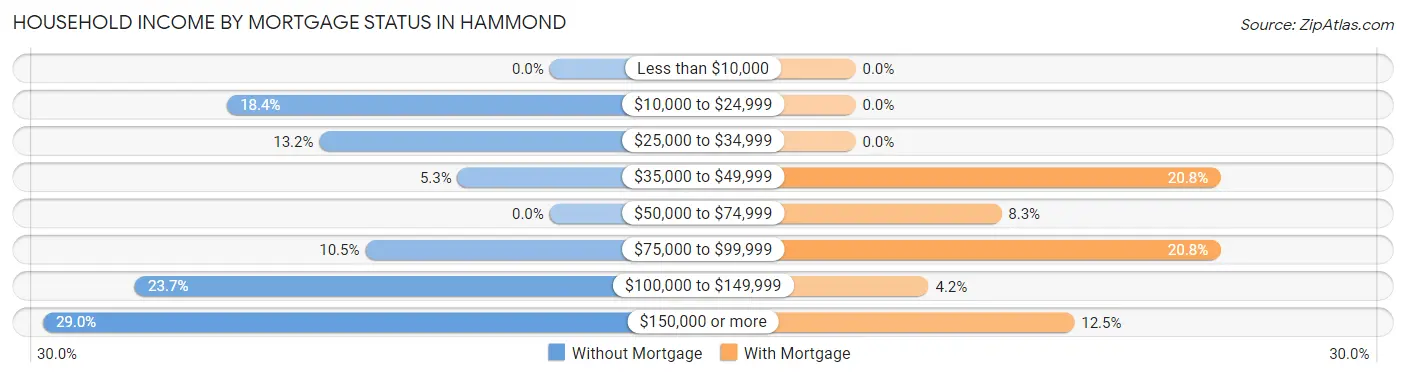
| Household Income | Without Mortgage | With Mortgage |
| Less than $10,000 | 0 (0.0%) | 0 (0.0%) |
| $10,000 to $24,999 | 7 (18.4%) | 0 (0.0%) |
| $25,000 to $34,999 | 5 (13.2%) | 0 (0.0%) |
| $35,000 to $49,999 | 2 (5.3%) | 5 (20.8%) |
| $50,000 to $74,999 | 0 (0.0%) | 2 (8.3%) |
| $75,000 to $99,999 | 4 (10.5%) | 5 (20.8%) |
| $100,000 to $149,999 | 9 (23.7%) | 1 (4.2%) |
| $150,000 or more | 11 (28.9%) | 3 (12.5%) |
| Total | 38 (100.0%) | 24 (100.0%) |
Property Value to Household Income Ratio in Hammond
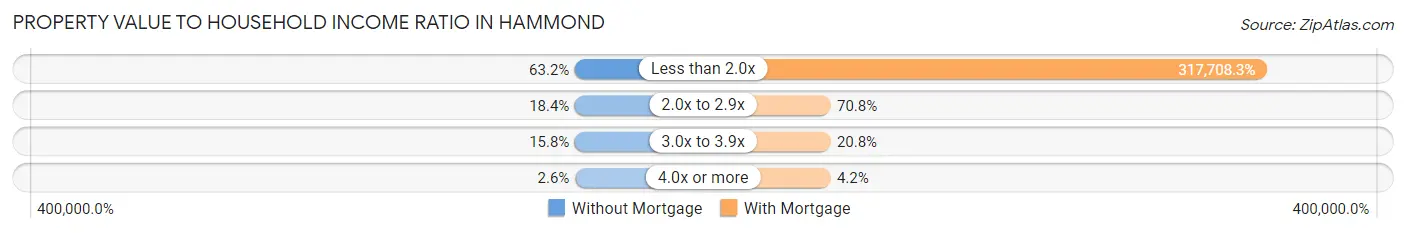
| Value-to-Income Ratio | Without Mortgage | With Mortgage |
| Less than 2.0x | 24 (63.2%) | 76,250 (317,708.3%) |
| 2.0x to 2.9x | 7 (18.4%) | 17 (70.8%) |
| 3.0x to 3.9x | 6 (15.8%) | 5 (20.8%) |
| 4.0x or more | 1 (2.6%) | 1 (4.2%) |
| Total | 38 (100.0%) | 24 (100.0%) |
Real Estate Taxes by Mortgage Status in Hammond
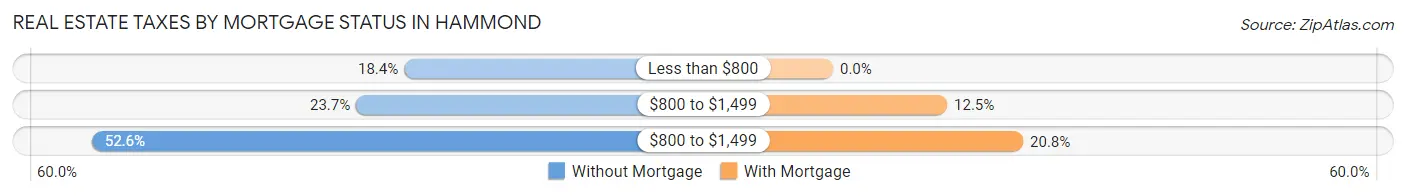
| Property Taxes | Without Mortgage | With Mortgage |
| Less than $800 | 7 (18.4%) | 0 (0.0%) |
| $800 to $1,499 | 9 (23.7%) | 3 (12.5%) |
| $800 to $1,499 | 20 (52.6%) | 5 (20.8%) |
| Total | 38 (100.0%) | 24 (100.0%) |
Health & Disability in Hammond
Health Insurance Coverage by Age in Hammond
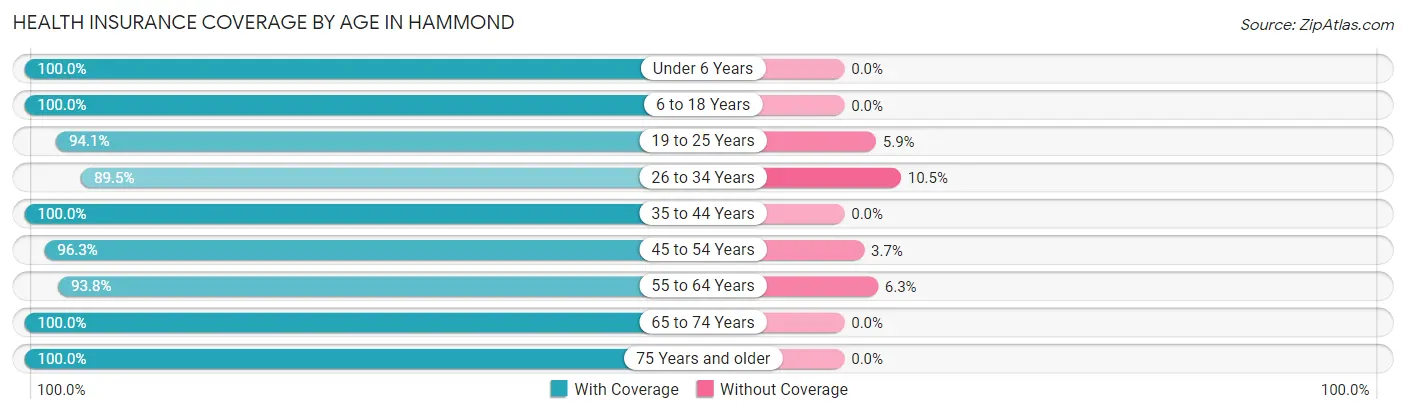
| Age Bracket | With Coverage | Without Coverage |
| Under 6 Years | 26 (100.0%) | 0 (0.0%) |
| 6 to 18 Years | 38 (100.0%) | 0 (0.0%) |
| 19 to 25 Years | 16 (94.1%) | 1 (5.9%) |
| 26 to 34 Years | 17 (89.5%) | 2 (10.5%) |
| 35 to 44 Years | 14 (100.0%) | 0 (0.0%) |
| 45 to 54 Years | 52 (96.3%) | 2 (3.7%) |
| 55 to 64 Years | 30 (93.8%) | 2 (6.2%) |
| 65 to 74 Years | 50 (100.0%) | 0 (0.0%) |
| 75 Years and older | 19 (100.0%) | 0 (0.0%) |
| Total | 262 (97.4%) | 7 (2.6%) |
Health Insurance Coverage by Citizenship Status in Hammond
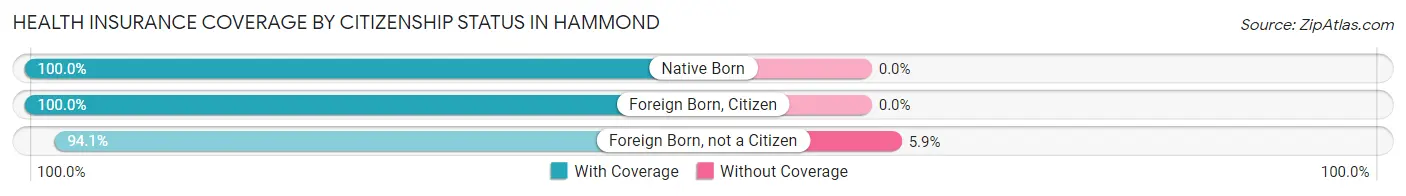
| Citizenship Status | With Coverage | Without Coverage |
| Native Born | 26 (100.0%) | 0 (0.0%) |
| Foreign Born, Citizen | 38 (100.0%) | 0 (0.0%) |
| Foreign Born, not a Citizen | 16 (94.1%) | 1 (5.9%) |
Health Insurance Coverage by Household Income in Hammond
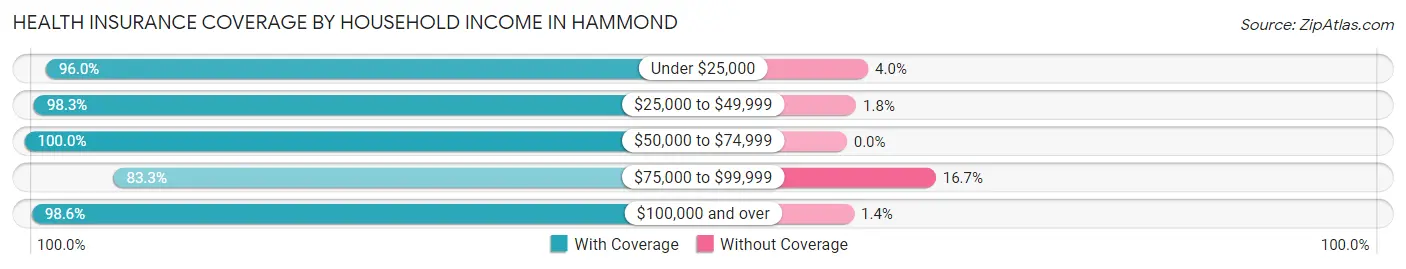
| Household Income | With Coverage | Without Coverage |
| Under $25,000 | 48 (96.0%) | 2 (4.0%) |
| $25,000 to $49,999 | 56 (98.3%) | 1 (1.8%) |
| $50,000 to $74,999 | 71 (100.0%) | 0 (0.0%) |
| $75,000 to $99,999 | 15 (83.3%) | 3 (16.7%) |
| $100,000 and over | 72 (98.6%) | 1 (1.4%) |
Public vs Private Health Insurance Coverage by Age in Hammond
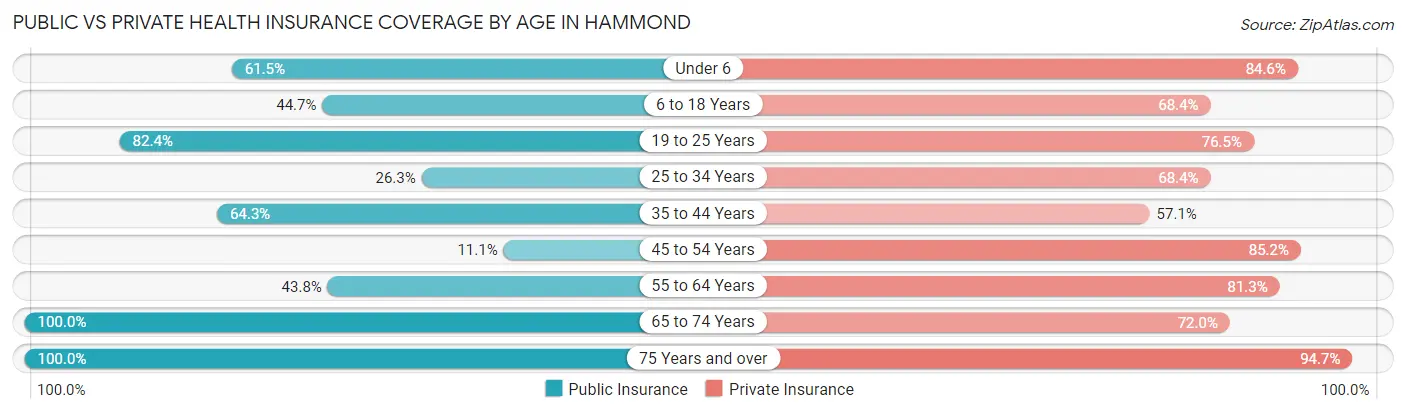
| Age Bracket | Public Insurance | Private Insurance |
| Under 6 | 16 (61.5%) | 22 (84.6%) |
| 6 to 18 Years | 17 (44.7%) | 26 (68.4%) |
| 19 to 25 Years | 14 (82.4%) | 13 (76.5%) |
| 25 to 34 Years | 5 (26.3%) | 13 (68.4%) |
| 35 to 44 Years | 9 (64.3%) | 8 (57.1%) |
| 45 to 54 Years | 6 (11.1%) | 46 (85.2%) |
| 55 to 64 Years | 14 (43.8%) | 26 (81.2%) |
| 65 to 74 Years | 50 (100.0%) | 36 (72.0%) |
| 75 Years and over | 19 (100.0%) | 18 (94.7%) |
| Total | 150 (55.8%) | 208 (77.3%) |
Disability Status by Sex by Age in Hammond
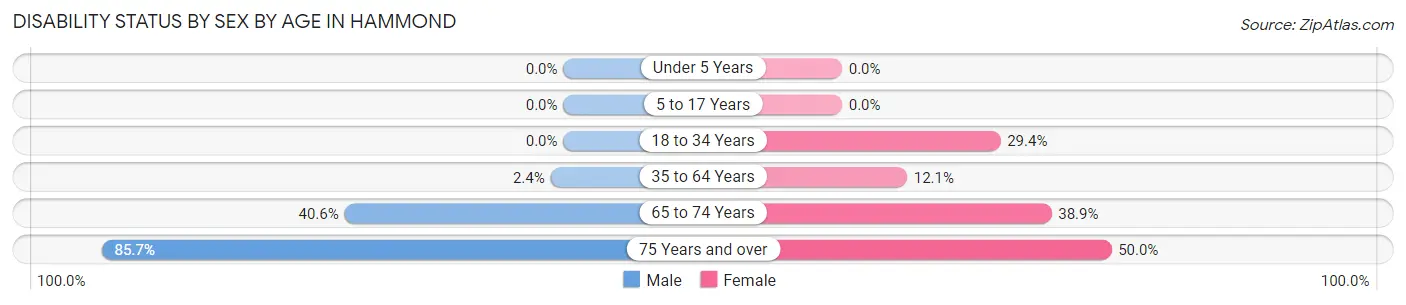
| Age Bracket | Male | Female |
| Under 5 Years | 0 (0.0%) | 0 (0.0%) |
| 5 to 17 Years | 0 (0.0%) | 0 (0.0%) |
| 18 to 34 Years | 0 (0.0%) | 5 (29.4%) |
| 35 to 64 Years | 1 (2.4%) | 7 (12.1%) |
| 65 to 74 Years | 13 (40.6%) | 7 (38.9%) |
| 75 Years and over | 6 (85.7%) | 6 (50.0%) |
Disability Class by Sex by Age in Hammond
Disability Class: Hearing Difficulty
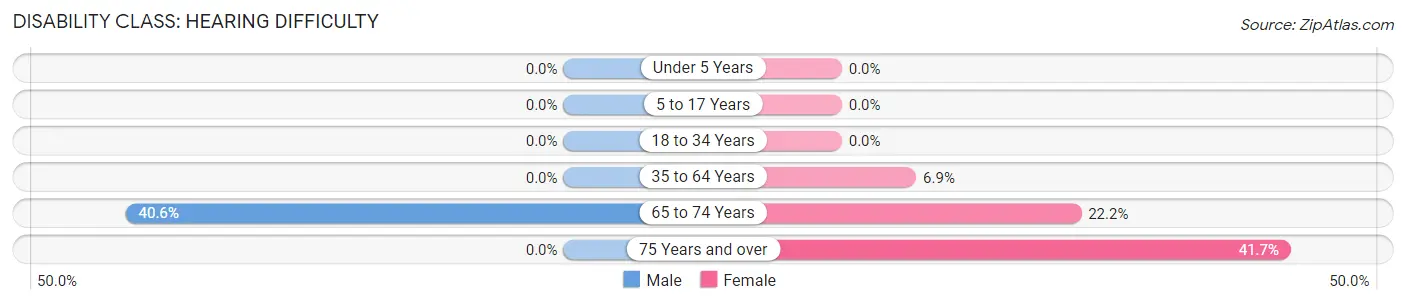
| Age Bracket | Male | Female |
| Under 5 Years | 0 (0.0%) | 0 (0.0%) |
| 5 to 17 Years | 0 (0.0%) | 0 (0.0%) |
| 18 to 34 Years | 0 (0.0%) | 0 (0.0%) |
| 35 to 64 Years | 0 (0.0%) | 4 (6.9%) |
| 65 to 74 Years | 13 (40.6%) | 4 (22.2%) |
| 75 Years and over | 0 (0.0%) | 5 (41.7%) |
Disability Class: Vision Difficulty
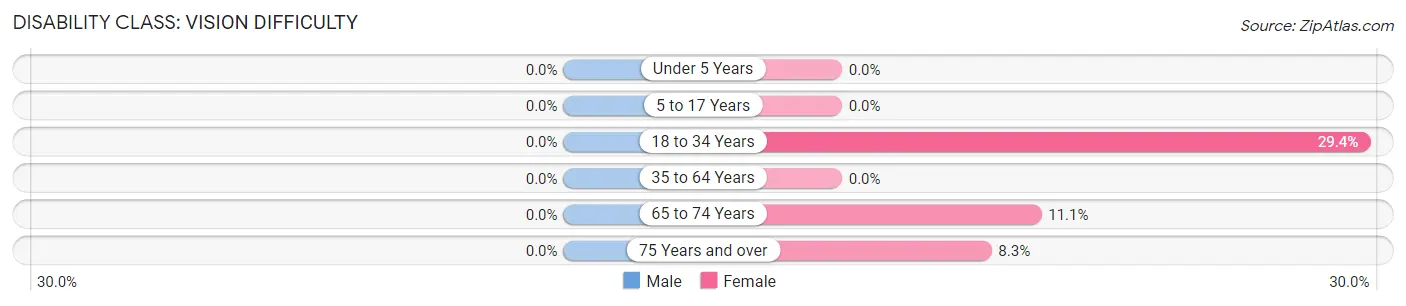
| Age Bracket | Male | Female |
| Under 5 Years | 0 (0.0%) | 0 (0.0%) |
| 5 to 17 Years | 0 (0.0%) | 0 (0.0%) |
| 18 to 34 Years | 0 (0.0%) | 5 (29.4%) |
| 35 to 64 Years | 0 (0.0%) | 0 (0.0%) |
| 65 to 74 Years | 0 (0.0%) | 2 (11.1%) |
| 75 Years and over | 0 (0.0%) | 1 (8.3%) |
Disability Class: Cognitive Difficulty
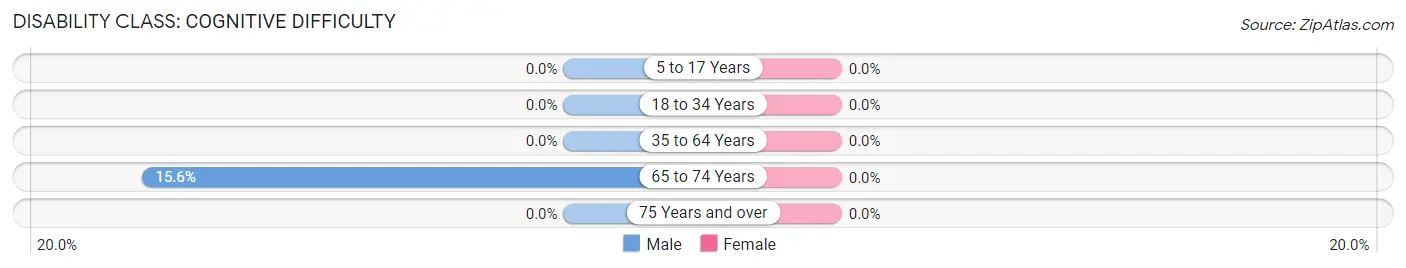
| Age Bracket | Male | Female |
| 5 to 17 Years | 0 (0.0%) | 0 (0.0%) |
| 18 to 34 Years | 0 (0.0%) | 0 (0.0%) |
| 35 to 64 Years | 0 (0.0%) | 0 (0.0%) |
| 65 to 74 Years | 5 (15.6%) | 0 (0.0%) |
| 75 Years and over | 0 (0.0%) | 0 (0.0%) |
Disability Class: Ambulatory Difficulty
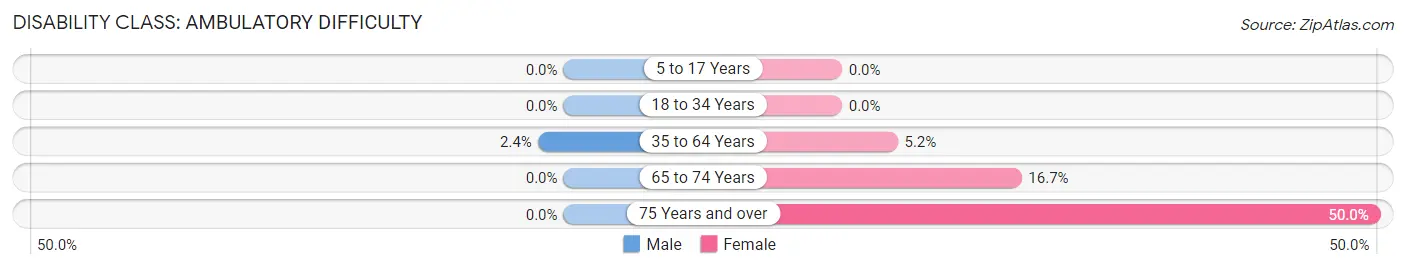
| Age Bracket | Male | Female |
| 5 to 17 Years | 0 (0.0%) | 0 (0.0%) |
| 18 to 34 Years | 0 (0.0%) | 0 (0.0%) |
| 35 to 64 Years | 1 (2.4%) | 3 (5.2%) |
| 65 to 74 Years | 0 (0.0%) | 3 (16.7%) |
| 75 Years and over | 0 (0.0%) | 6 (50.0%) |
Disability Class: Self-Care Difficulty
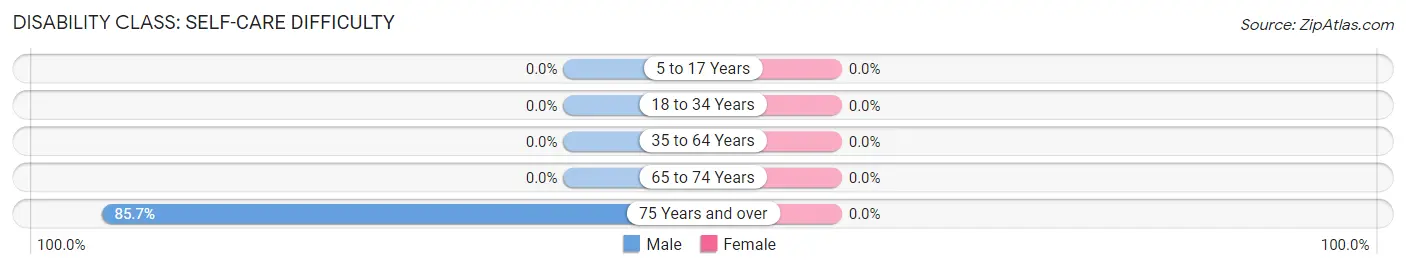
| Age Bracket | Male | Female |
| 5 to 17 Years | 0 (0.0%) | 0 (0.0%) |
| 18 to 34 Years | 0 (0.0%) | 0 (0.0%) |
| 35 to 64 Years | 0 (0.0%) | 0 (0.0%) |
| 65 to 74 Years | 0 (0.0%) | 0 (0.0%) |
| 75 Years and over | 6 (85.7%) | 0 (0.0%) |
Technology Access in Hammond
Computing Device Access in Hammond
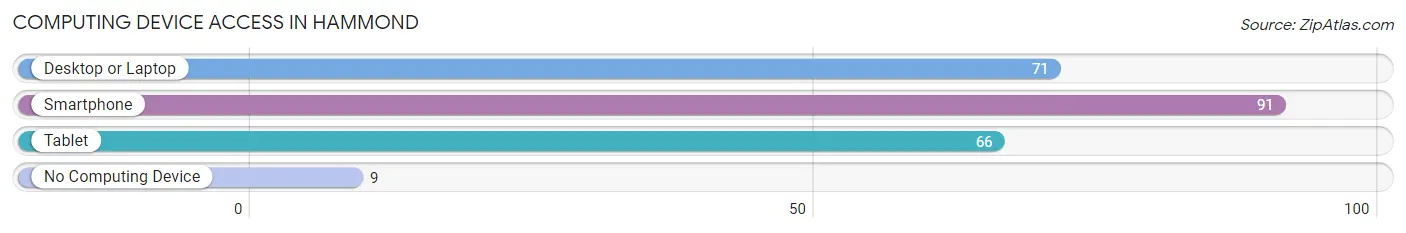
| Device Type | # Households | % Households |
| Desktop or Laptop | 71 | 64.0% |
| Smartphone | 91 | 82.0% |
| Tablet | 66 | 59.5% |
| No Computing Device | 9 | 8.1% |
| Total | 111 | 100.0% |
Internet Access in Hammond
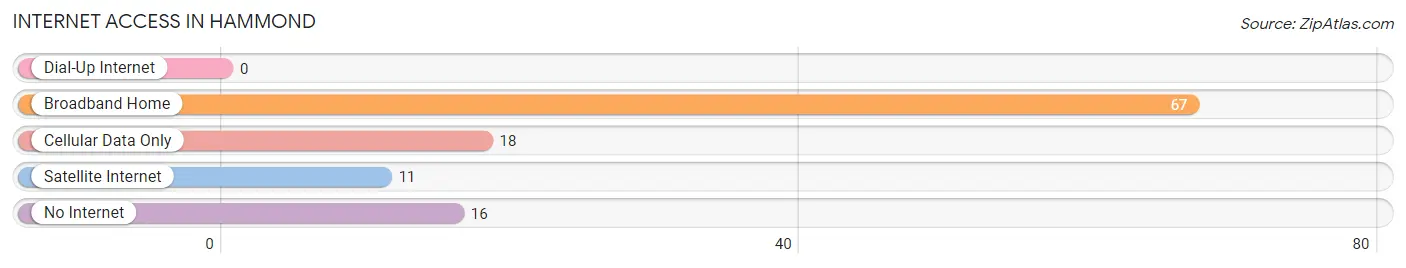
| Internet Type | # Households | % Households |
| Dial-Up Internet | 0 | 0.0% |
| Broadband Home | 67 | 60.4% |
| Cellular Data Only | 18 | 16.2% |
| Satellite Internet | 11 | 9.9% |
| No Internet | 16 | 14.4% |
| Total | 111 | 100.0% |
Hammond Summary
Hammond, New York is a small town located in St. Lawrence County, in the northern part of the state. It is situated on the banks of the Oswegatchie River, and is part of the larger Ogdensburg-Massena metropolitan area. The town has a population of approximately 1,400 people, and is known for its rural charm and small-town atmosphere.
History
The area that is now Hammond was first settled in the late 1700s by a group of French-Canadian immigrants. The town was originally known as “La Petite Chute”, or “Little Falls”, due to the presence of a small waterfall on the Oswegatchie River. The town was officially incorporated in 1817, and was named after the Hammond family, who were prominent landowners in the area.
In the 19th century, Hammond was a thriving agricultural community, with a variety of crops being grown in the area. The town was also home to several mills, which provided employment for many of the town’s residents. In the late 1800s, Hammond was connected to the rest of the state by the Ogdensburg and Lake Champlain Railroad, which allowed for the transportation of goods and people.
Geography
Hammond is located in the northern part of St. Lawrence County, in the northern part of New York State. It is situated on the banks of the Oswegatchie River, and is part of the larger Ogdensburg-Massena metropolitan area. The town covers an area of approximately 11.5 square miles, and is bordered by the towns of Oswegatchie, Lisbon, and Madrid.
The terrain of Hammond is mostly flat, with some rolling hills in the northern part of the town. The town is home to several small lakes, including Lake Ozonia, which is a popular spot for fishing and swimming. The town is also home to several small streams, which provide a source of water for the town’s residents.
Economy
The economy of Hammond is largely based on agriculture and tourism. The town is home to several farms, which produce a variety of crops, including corn, soybeans, and hay. The town is also home to several small businesses, including restaurants, shops, and other services.
Tourism is also an important part of the town’s economy. Hammond is home to several popular attractions, including the Hammond Museum, which features a variety of exhibits related to the town’s history. The town is also home to several parks, which provide a variety of recreational activities, such as hiking, fishing, and camping.
Demographics
As of the 2010 census, the population of Hammond was 1,400 people. The town has a population density of approximately 122 people per square mile. The racial makeup of the town is 97.4% White, 0.7% African American, 0.3% Native American, 0.3% Asian, and 1.3% from other races.
The median household income in Hammond is $41,250, and the median family income is $50,000. The town has a poverty rate of 11.3%, which is slightly higher than the national average. The town’s population is largely made up of families, with approximately 33% of households having children under the age of 18.
Conclusion
Hammond, New York is a small town located in St. Lawrence County, in the northern part of the state. It is situated on the banks of the Oswegatchie River, and is part of the larger Ogdensburg-Massena metropolitan area. The town has a population of approximately 1,400 people, and is known for its rural charm and small-town atmosphere. The economy of Hammond is largely based on agriculture and tourism, and the town is home to several popular attractions, including the Hammond Museum. The town has a population that is largely made up of families, with a median household income of $41,250.
Common Questions
What is Per Capita Income in Hammond?
Per Capita income in Hammond is $31,015.
What is the Median Family Income in Hammond?
Median Family Income in Hammond is $51,797.
What is the Median Household income in Hammond?
Median Household Income in Hammond is $50,859.
What is Inequality or Gini Index in Hammond?
Inequality or Gini Index in Hammond is 0.47.
What is the Total Population of Hammond?
Total Population of Hammond is 269.
What is the Total Male Population of Hammond?
Total Male Population of Hammond is 134.
What is the Total Female Population of Hammond?
Total Female Population of Hammond is 135.
What is the Ratio of Males per 100 Females in Hammond?
There are 99.26 Males per 100 Females in Hammond.
What is the Ratio of Females per 100 Males in Hammond?
There are 100.75 Females per 100 Males in Hammond.
What is the Median Population Age in Hammond?
Median Population Age in Hammond is 46.9 Years.
What is the Average Family Size in Hammond
Average Family Size in Hammond is 2.6 People.
What is the Average Household Size in Hammond
Average Household Size in Hammond is 2.4 People.
How Large is the Labor Force in Hammond?
There are 94 People in the Labor Forcein in Hammond.
What is the Percentage of People in the Labor Force in Hammond?
44.5% of People are in the Labor Force in Hammond.
What is the Unemployment Rate in Hammond?
Unemployment Rate in Hammond is 2.1%.