Nelliston, NY Map & Demographics
Nelliston Map
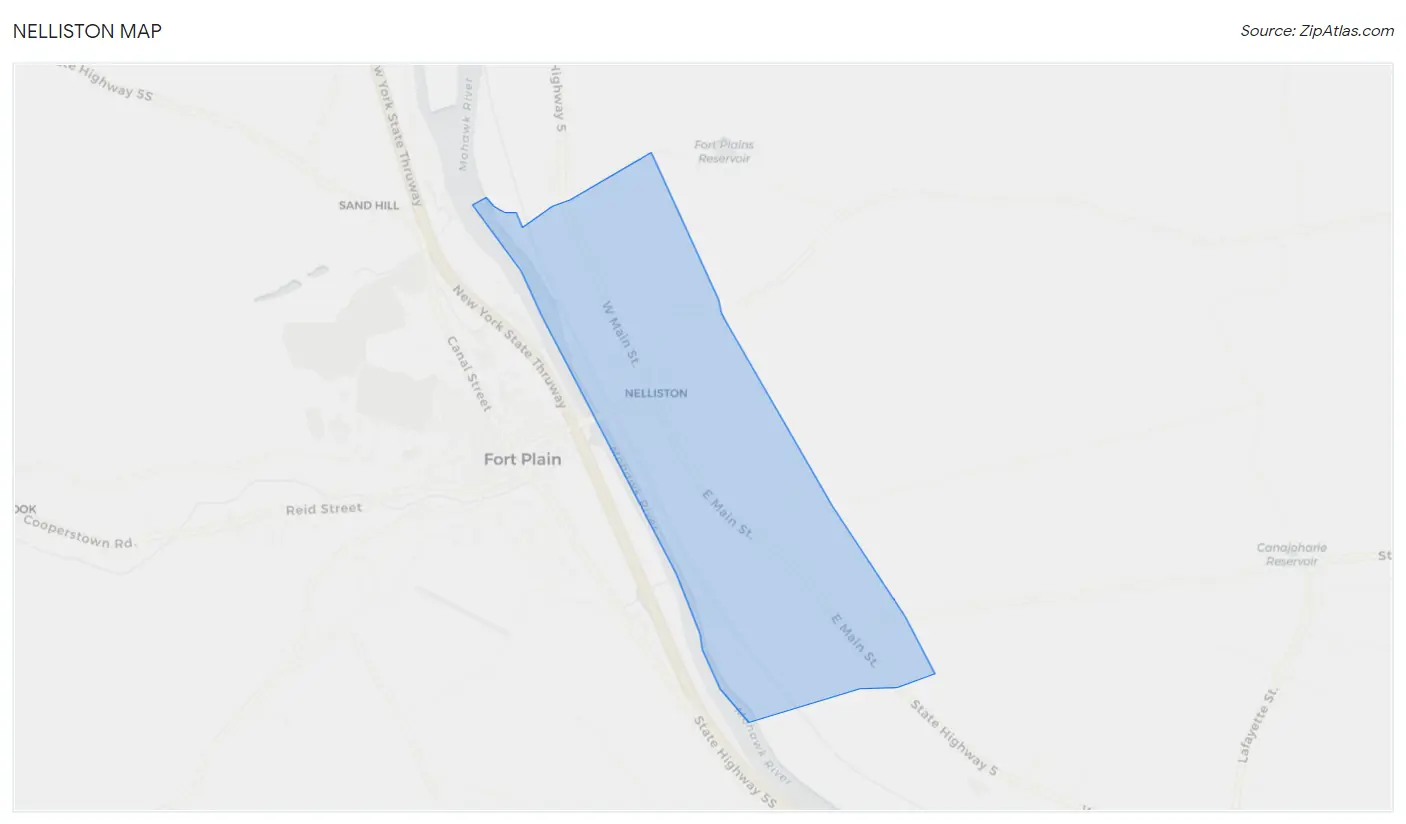
Nelliston Overview
$27,505
PER CAPITA INCOME
$67,404
AVG FAMILY INCOME
$38,264
AVG HOUSEHOLD INCOME
22.8%
WAGE / INCOME GAP [ % ]
77.2¢/ $1
WAGE / INCOME GAP [ $ ]
0.52
INEQUALITY / GINI INDEX
693
TOTAL POPULATION
298
MALE POPULATION
395
FEMALE POPULATION
75.44
MALES / 100 FEMALES
132.55
FEMALES / 100 MALES
61.1
MEDIAN AGE
2.7
AVG FAMILY SIZE
1.9
AVG HOUSEHOLD SIZE
280
LABOR FORCE [ PEOPLE ]
43.8%
PERCENT IN LABOR FORCE
5.7%
UNEMPLOYMENT RATE
Nelliston Zip Codes
Nelliston Area Codes
Income in Nelliston
Income Overview in Nelliston
Per Capita Income in Nelliston is $27,505, while median incomes of families and households are $67,404 and $38,264 respectively.
| Characteristic | Number | Measure |
| Per Capita Income | 693 | $27,505 |
| Median Family Income | 173 | $67,404 |
| Mean Family Income | 173 | $84,636 |
| Median Household Income | 375 | $38,264 |
| Mean Household Income | 375 | $50,363 |
| Income Deficit | 173 | $0 |
| Wage / Income Gap (%) | 693 | 22.76% |
| Wage / Income Gap ($) | 693 | 77.24¢ per $1 |
| Gini / Inequality Index | 693 | 0.52 |
Earnings by Sex in Nelliston
Average Earnings in Nelliston are $33,750, $36,111 for men and $27,891 for women, a difference of 22.8%.
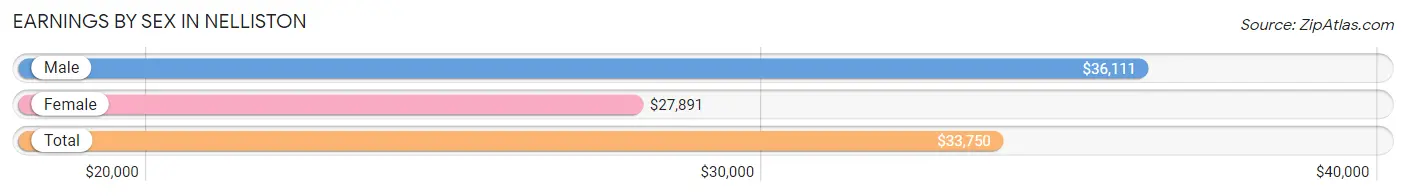
| Sex | Number | Average Earnings |
| Male | 160 (55.4%) | $36,111 |
| Female | 129 (44.6%) | $27,891 |
| Total | 289 (100.0%) | $33,750 |
Earnings by Sex by Income Bracket in Nelliston
The most common earnings brackets in Nelliston are $100,000+ for men (29 | 18.1%) and $25,000 to $29,999 for women (35 | 27.1%).
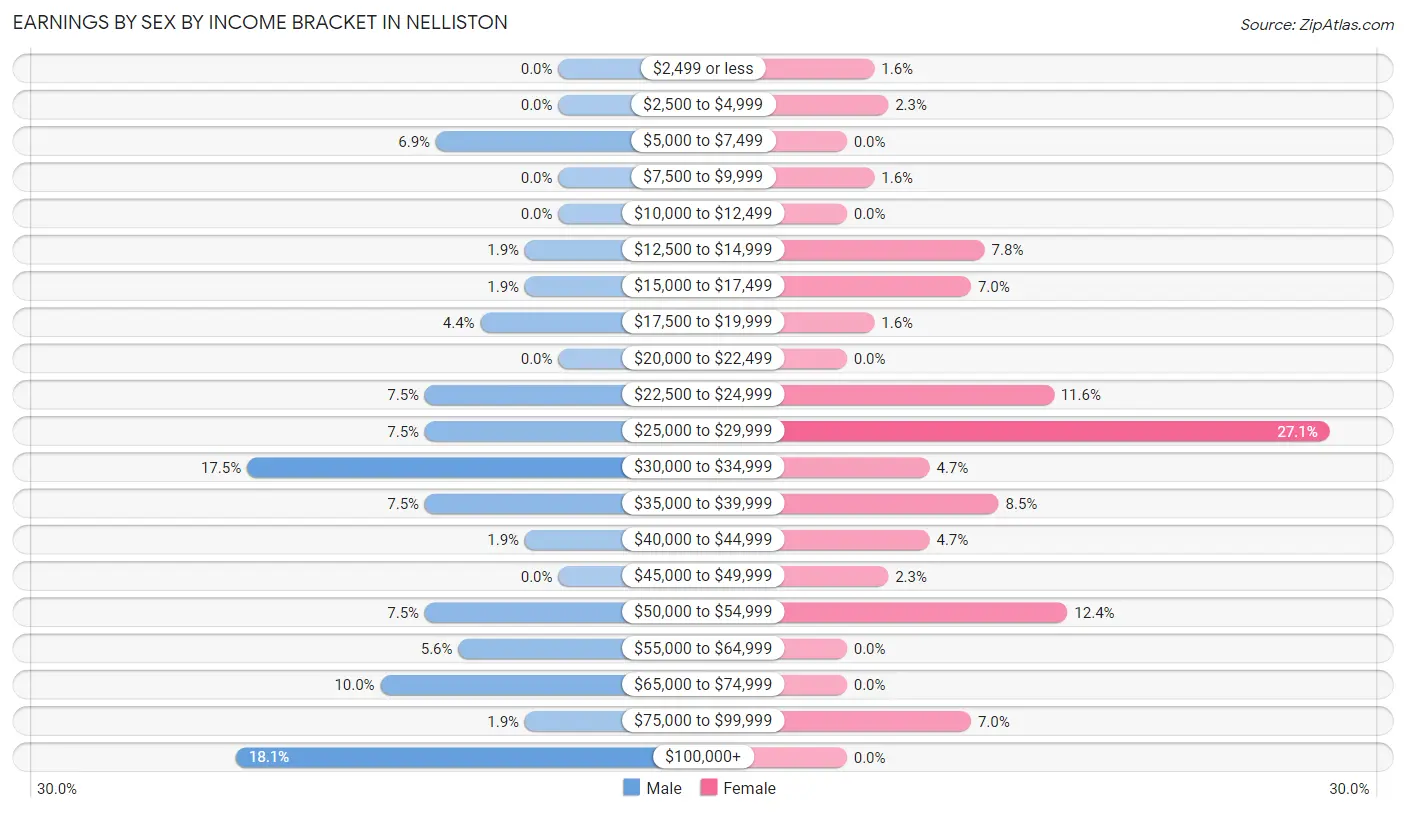
| Income | Male | Female |
| $2,499 or less | 0 (0.0%) | 2 (1.5%) |
| $2,500 to $4,999 | 0 (0.0%) | 3 (2.3%) |
| $5,000 to $7,499 | 11 (6.9%) | 0 (0.0%) |
| $7,500 to $9,999 | 0 (0.0%) | 2 (1.5%) |
| $10,000 to $12,499 | 0 (0.0%) | 0 (0.0%) |
| $12,500 to $14,999 | 3 (1.9%) | 10 (7.7%) |
| $15,000 to $17,499 | 3 (1.9%) | 9 (7.0%) |
| $17,500 to $19,999 | 7 (4.4%) | 2 (1.5%) |
| $20,000 to $22,499 | 0 (0.0%) | 0 (0.0%) |
| $22,500 to $24,999 | 12 (7.5%) | 15 (11.6%) |
| $25,000 to $29,999 | 12 (7.5%) | 35 (27.1%) |
| $30,000 to $34,999 | 28 (17.5%) | 6 (4.6%) |
| $35,000 to $39,999 | 12 (7.5%) | 11 (8.5%) |
| $40,000 to $44,999 | 3 (1.9%) | 6 (4.6%) |
| $45,000 to $49,999 | 0 (0.0%) | 3 (2.3%) |
| $50,000 to $54,999 | 12 (7.5%) | 16 (12.4%) |
| $55,000 to $64,999 | 9 (5.6%) | 0 (0.0%) |
| $65,000 to $74,999 | 16 (10.0%) | 0 (0.0%) |
| $75,000 to $99,999 | 3 (1.9%) | 9 (7.0%) |
| $100,000+ | 29 (18.1%) | 0 (0.0%) |
| Total | 160 (100.0%) | 129 (100.0%) |
Earnings by Sex by Educational Attainment in Nelliston
Average earnings in Nelliston are $50,833 for men and $27,891 for women, a difference of 45.1%. Men with an educational attainment of high school diploma enjoy the highest average annual earnings of $56,000, while those with bachelor's degree education earn the least with $37,143. Women with an educational attainment of college or associate's degree earn the most with the average annual earnings of $27,734, while those with high school diploma education have the smallest earnings of $24,286.
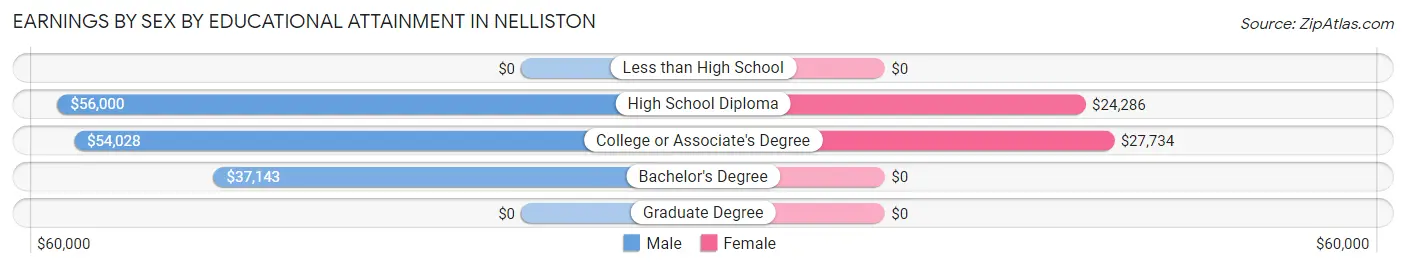
| Educational Attainment | Male Income | Female Income |
| Less than High School | - | - |
| High School Diploma | $56,000 | $24,286 |
| College or Associate's Degree | $54,028 | $27,734 |
| Bachelor's Degree | $37,143 | $0 |
| Graduate Degree | - | - |
| Total | $50,833 | $27,891 |
Family Income in Nelliston
Family Income Brackets in Nelliston
According to the Nelliston family income data, there are 58 families falling into the $50,000 to $74,999 income range, which is the most common income bracket and makes up 33.5% of all families.
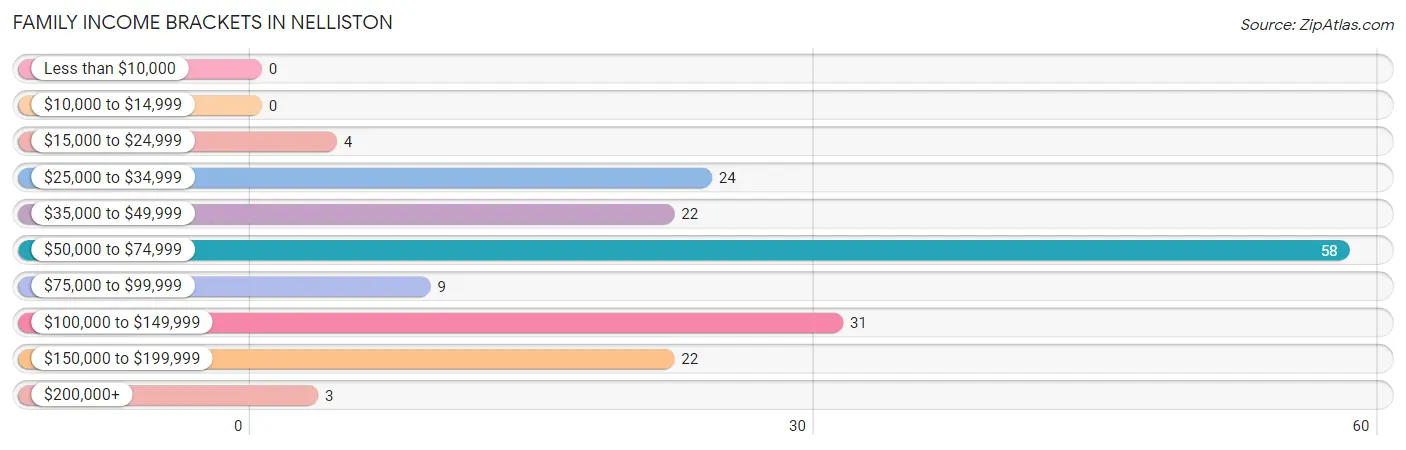
| Income Bracket | # Families | % Families |
| Less than $10,000 | 0 | 0.0% |
| $10,000 to $14,999 | 0 | 0.0% |
| $15,000 to $24,999 | 4 | 2.3% |
| $25,000 to $34,999 | 24 | 13.9% |
| $35,000 to $49,999 | 22 | 12.7% |
| $50,000 to $74,999 | 58 | 33.5% |
| $75,000 to $99,999 | 9 | 5.2% |
| $100,000 to $149,999 | 31 | 17.9% |
| $150,000 to $199,999 | 22 | 12.7% |
| $200,000+ | 3 | 1.7% |
Family Income by Famaliy Size in Nelliston
3-person families (33 | 19.1%) account for the highest median family income in Nelliston with $155,515 per family, while 3-person families (33 | 19.1%) have the highest median income of $51,838 per family member.
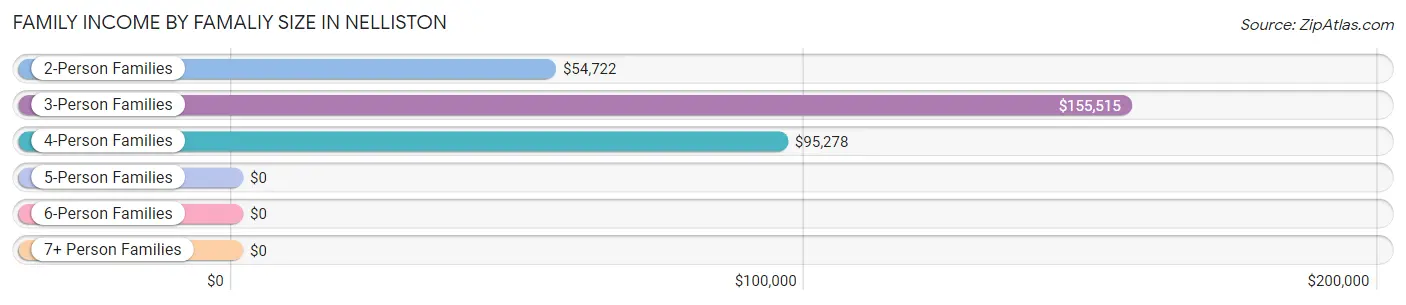
| Income Bracket | # Families | Median Income |
| 2-Person Families | 118 (68.2%) | $54,722 |
| 3-Person Families | 33 (19.1%) | $155,515 |
| 4-Person Families | 22 (12.7%) | $95,278 |
| 5-Person Families | 0 (0.0%) | $0 |
| 6-Person Families | 0 (0.0%) | $0 |
| 7+ Person Families | 0 (0.0%) | $0 |
| Total | 173 (100.0%) | $67,404 |
Family Income by Number of Earners in Nelliston
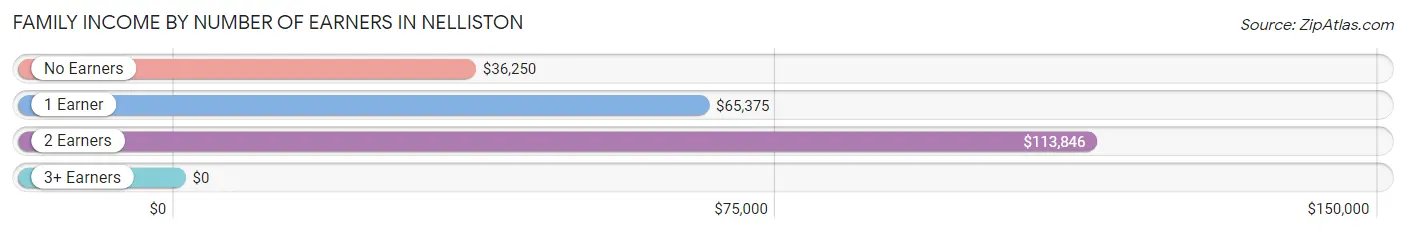
| Number of Earners | # Families | Median Income |
| No Earners | 32 (18.5%) | $36,250 |
| 1 Earner | 73 (42.2%) | $65,375 |
| 2 Earners | 58 (33.5%) | $113,846 |
| 3+ Earners | 10 (5.8%) | $0 |
| Total | 173 (100.0%) | $67,404 |
Household Income in Nelliston
Household Income Brackets in Nelliston
With 112 households falling in the category, the less than $10,000 income range is the most frequent in Nelliston, accounting for 29.9% of all households. In contrast, only 3 households (0.8%) fall into the $200,000+ income bracket, making it the least populous group.
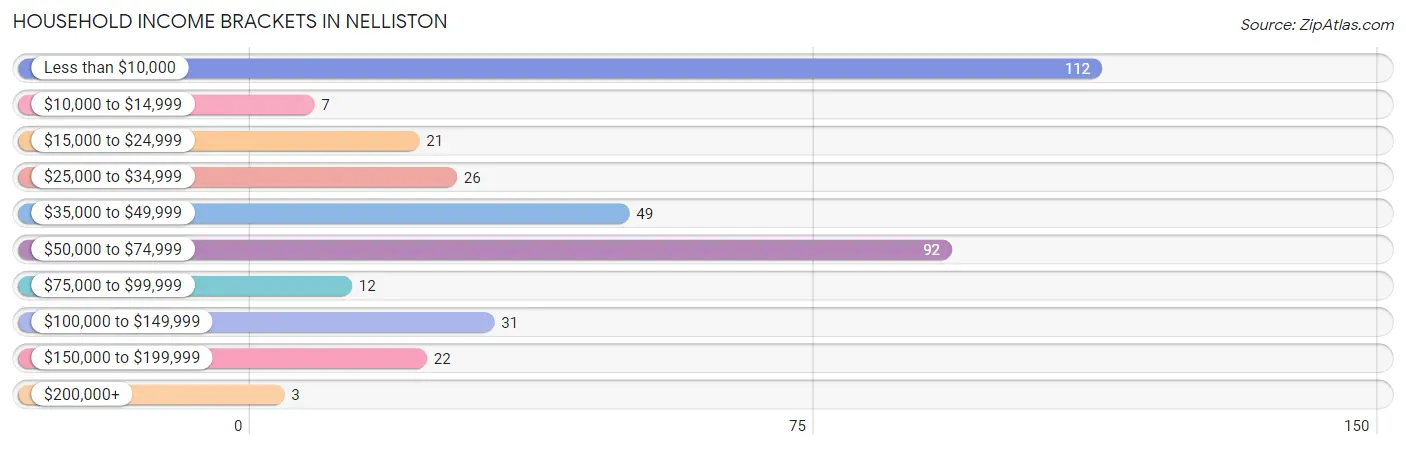
| Income Bracket | # Households | % Households |
| Less than $10,000 | 112 | 29.9% |
| $10,000 to $14,999 | 7 | 1.9% |
| $15,000 to $24,999 | 21 | 5.6% |
| $25,000 to $34,999 | 26 | 6.9% |
| $35,000 to $49,999 | 49 | 13.1% |
| $50,000 to $74,999 | 92 | 24.5% |
| $75,000 to $99,999 | 12 | 3.2% |
| $100,000 to $149,999 | 31 | 8.3% |
| $150,000 to $199,999 | 22 | 5.9% |
| $200,000+ | 3 | 0.8% |
Household Income by Householder Age in Nelliston
The median household income in Nelliston is $38,264, with the highest median household income of $69,063 found in the 25 to 44 years age bracket for the primary householder. A total of 33 households (8.8%) fall into this category. Meanwhile, the 15 to 24 years age bracket for the primary householder has the lowest median household income of $0, with 11 households (2.9%) in this group.
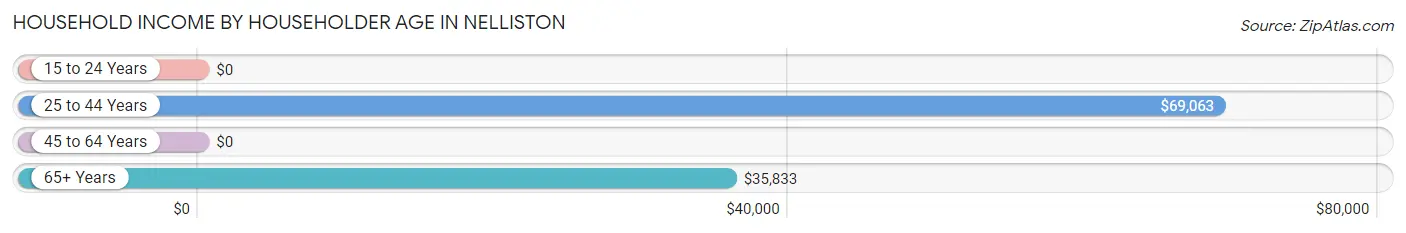
| Income Bracket | # Households | Median Income |
| 15 to 24 Years | 11 (2.9%) | $0 |
| 25 to 44 Years | 33 (8.8%) | $69,063 |
| 45 to 64 Years | 181 (48.3%) | $0 |
| 65+ Years | 150 (40.0%) | $35,833 |
| Total | 375 (100.0%) | $38,264 |
Poverty in Nelliston
Income Below Poverty by Sex and Age in Nelliston
With 3.4% poverty level for males and 29.6% for females among the residents of Nelliston, 55 to 64 year old males and 55 to 64 year old females are the most vulnerable to poverty, with 7 males (18.4%) and 71 females (57.3%) in their respective age groups living below the poverty level.
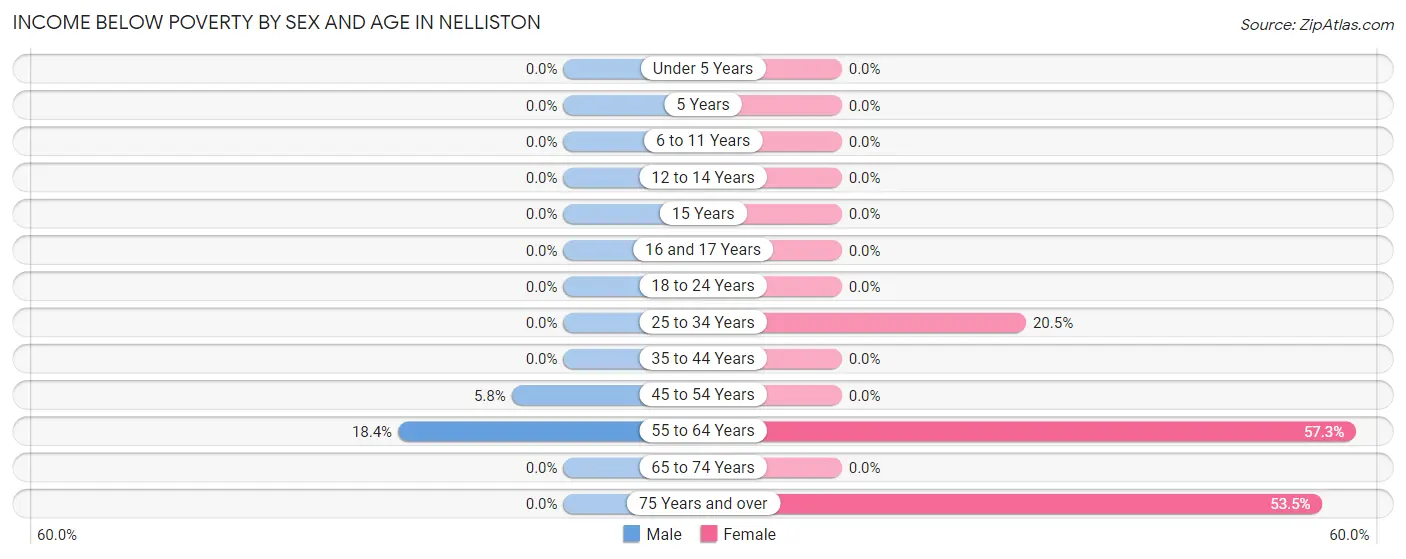
| Age Bracket | Male | Female |
| Under 5 Years | 0 (0.0%) | 0 (0.0%) |
| 5 Years | 0 (0.0%) | 0 (0.0%) |
| 6 to 11 Years | 0 (0.0%) | 0 (0.0%) |
| 12 to 14 Years | 0 (0.0%) | 0 (0.0%) |
| 15 Years | 0 (0.0%) | 0 (0.0%) |
| 16 and 17 Years | 0 (0.0%) | 0 (0.0%) |
| 18 to 24 Years | 0 (0.0%) | 0 (0.0%) |
| 25 to 34 Years | 0 (0.0%) | 8 (20.5%) |
| 35 to 44 Years | 0 (0.0%) | 0 (0.0%) |
| 45 to 54 Years | 3 (5.8%) | 0 (0.0%) |
| 55 to 64 Years | 7 (18.4%) | 71 (57.3%) |
| 65 to 74 Years | 0 (0.0%) | 0 (0.0%) |
| 75 Years and over | 0 (0.0%) | 38 (53.5%) |
| Total | 10 (3.4%) | 117 (29.6%) |
Income Above Poverty by Sex and Age in Nelliston
According to the poverty statistics in Nelliston, males aged under 5 years and females aged under 5 years are the age groups that are most secure financially, with 100.0% of males and 100.0% of females in these age groups living above the poverty line.
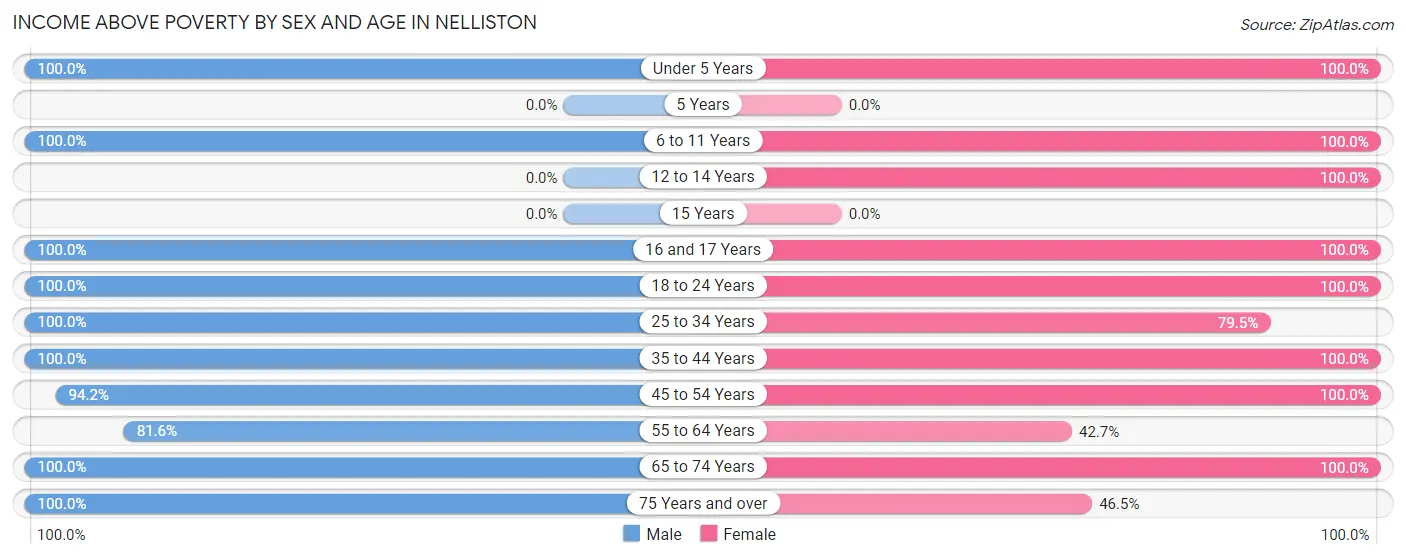
| Age Bracket | Male | Female |
| Under 5 Years | 16 (100.0%) | 11 (100.0%) |
| 5 Years | 0 (0.0%) | 0 (0.0%) |
| 6 to 11 Years | 1 (100.0%) | 17 (100.0%) |
| 12 to 14 Years | 0 (0.0%) | 9 (100.0%) |
| 15 Years | 0 (0.0%) | 0 (0.0%) |
| 16 and 17 Years | 23 (100.0%) | 10 (100.0%) |
| 18 to 24 Years | 24 (100.0%) | 4 (100.0%) |
| 25 to 34 Years | 36 (100.0%) | 31 (79.5%) |
| 35 to 44 Years | 6 (100.0%) | 9 (100.0%) |
| 45 to 54 Years | 49 (94.2%) | 48 (100.0%) |
| 55 to 64 Years | 31 (81.6%) | 53 (42.7%) |
| 65 to 74 Years | 82 (100.0%) | 53 (100.0%) |
| 75 Years and over | 20 (100.0%) | 33 (46.5%) |
| Total | 288 (96.6%) | 278 (70.4%) |
Income Below Poverty Among Married-Couple Families in Nelliston
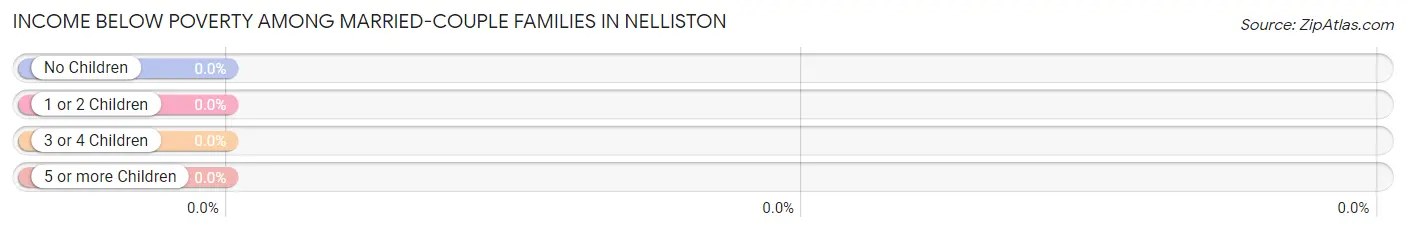
| Children | Above Poverty | Below Poverty |
| No Children | 102 (100.0%) | 0 (0.0%) |
| 1 or 2 Children | 25 (100.0%) | 0 (0.0%) |
| 3 or 4 Children | 0 (0.0%) | 0 (0.0%) |
| 5 or more Children | 0 (0.0%) | 0 (0.0%) |
| Total | 127 (100.0%) | 0 (0.0%) |
Income Below Poverty Among Single-Parent Households in Nelliston
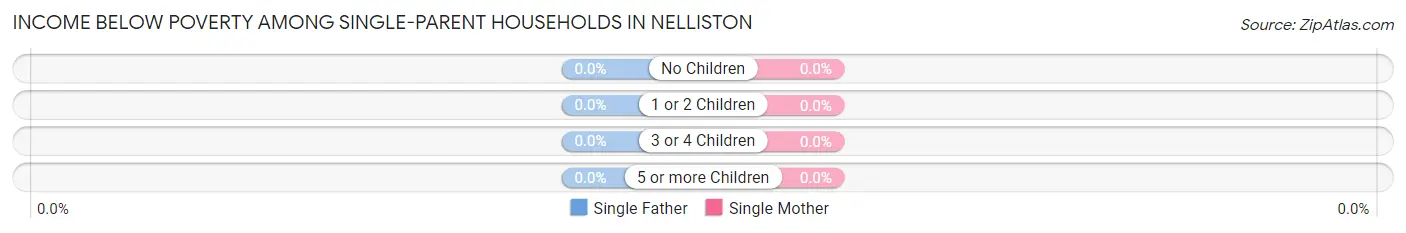
| Children | Single Father | Single Mother |
| No Children | 0 (0.0%) | 0 (0.0%) |
| 1 or 2 Children | 0 (0.0%) | 0 (0.0%) |
| 3 or 4 Children | 0 (0.0%) | 0 (0.0%) |
| 5 or more Children | 0 (0.0%) | 0 (0.0%) |
| Total | 0 (0.0%) | 0 (0.0%) |
Income Below Poverty Among Married-Couple vs Single-Parent Households in Nelliston
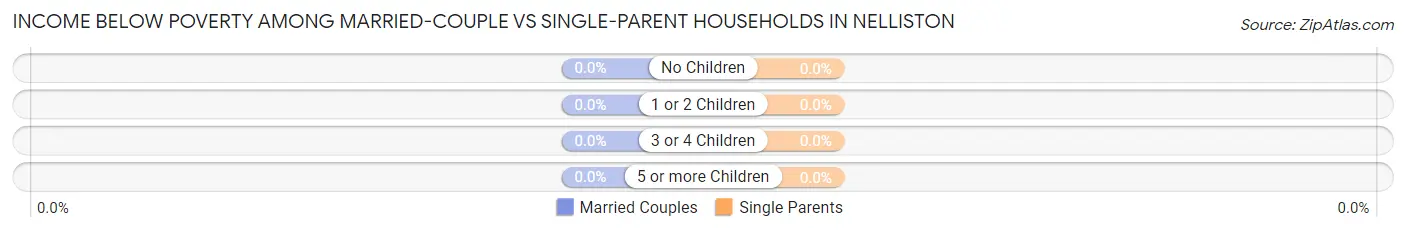
| Children | Married-Couple Families | Single-Parent Households |
| No Children | 0 (0.0%) | 0 (0.0%) |
| 1 or 2 Children | 0 (0.0%) | 0 (0.0%) |
| 3 or 4 Children | 0 (0.0%) | 0 (0.0%) |
| 5 or more Children | 0 (0.0%) | 0 (0.0%) |
| Total | 0 (0.0%) | 0 (0.0%) |
Race in Nelliston
The most populous races in Nelliston are White / Caucasian (606 | 87.5%), Two or more Races (79 | 11.4%), and Hispanic or Latino (32 | 4.6%).
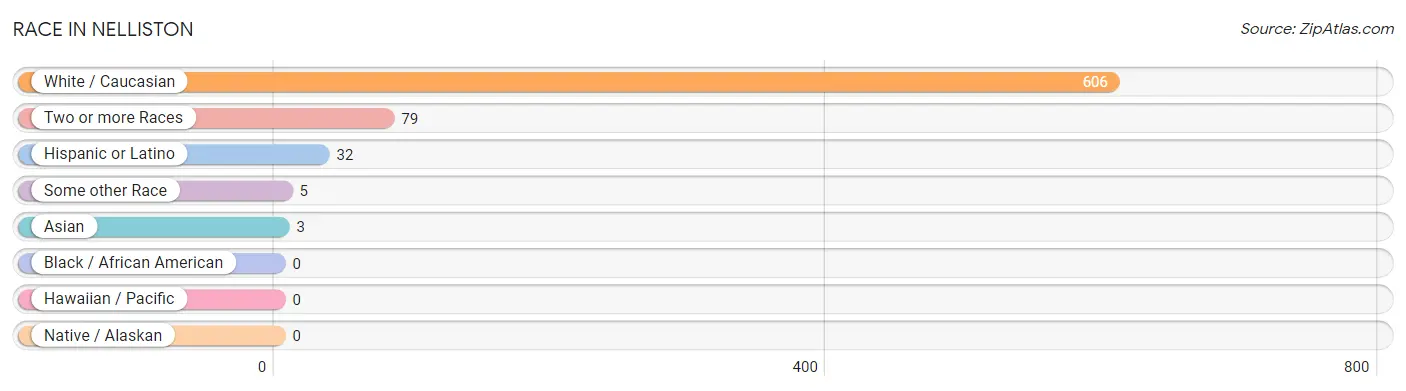
| Race | # Population | % Population |
| Asian | 3 | 0.4% |
| Black / African American | 0 | 0.0% |
| Hawaiian / Pacific | 0 | 0.0% |
| Hispanic or Latino | 32 | 4.6% |
| Native / Alaskan | 0 | 0.0% |
| White / Caucasian | 606 | 87.5% |
| Two or more Races | 79 | 11.4% |
| Some other Race | 5 | 0.7% |
| Total | 693 | 100.0% |
Ancestry in Nelliston
The most populous ancestries reported in Nelliston are German (242 | 34.9%), English (136 | 19.6%), Italian (89 | 12.8%), American (80 | 11.5%), and Dutch (56 | 8.1%), together accounting for 87.0% of all Nelliston residents.
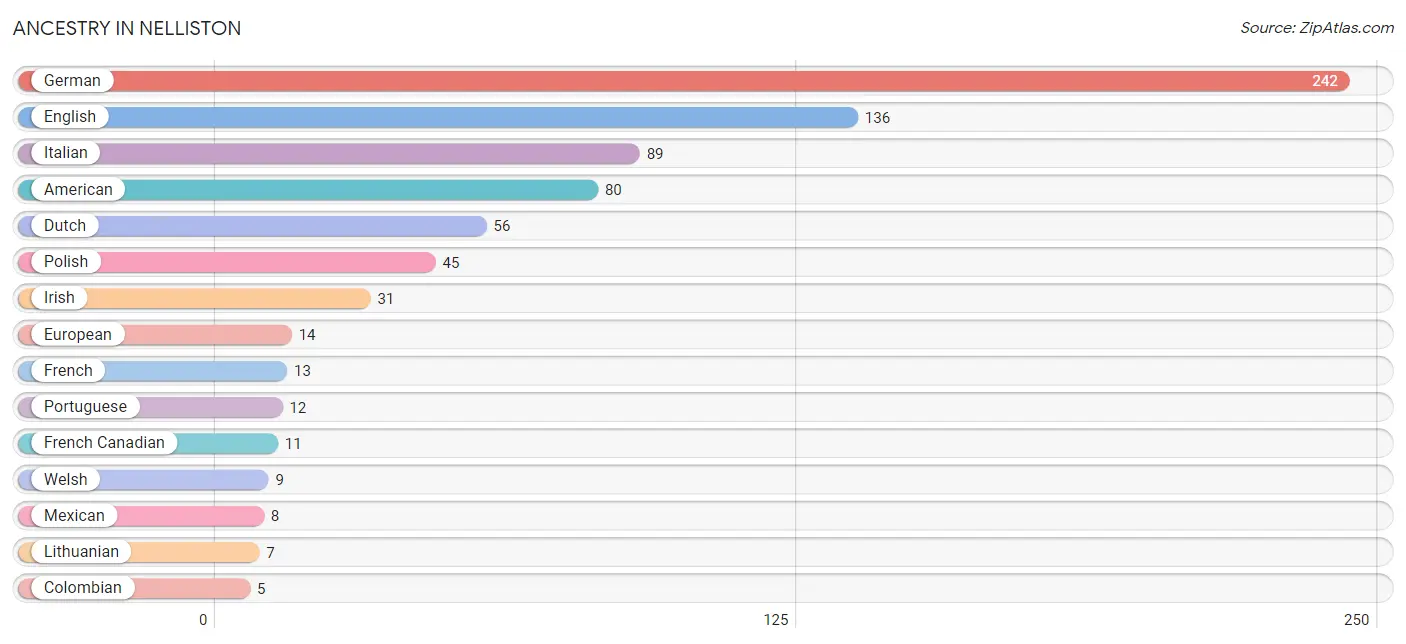
| Ancestry | # Population | % Population |
| American | 80 | 11.5% |
| Arab | 3 | 0.4% |
| Colombian | 5 | 0.7% |
| Dominican | 5 | 0.7% |
| Dutch | 56 | 8.1% |
| English | 136 | 19.6% |
| European | 14 | 2.0% |
| French | 13 | 1.9% |
| French Canadian | 11 | 1.6% |
| German | 242 | 34.9% |
| Indian (Asian) | 3 | 0.4% |
| Irish | 31 | 4.5% |
| Italian | 89 | 12.8% |
| Lithuanian | 7 | 1.0% |
| Mexican | 8 | 1.1% |
| Norwegian | 3 | 0.4% |
| Polish | 45 | 6.5% |
| Portuguese | 12 | 1.7% |
| Scottish | 2 | 0.3% |
| South American | 5 | 0.7% |
| Sri Lankan | 3 | 0.4% |
| Swedish | 2 | 0.3% |
| Welsh | 9 | 1.3% | View All 23 Rows |
Immigrants in Nelliston
The most numerous immigrant groups reported in Nelliston came from Europe (8 | 1.1%), Western Europe (5 | 0.7%), Eastern Europe (3 | 0.4%), France (3 | 0.4%), and Netherlands (2 | 0.3%), together accounting for 3.0% of all Nelliston residents.
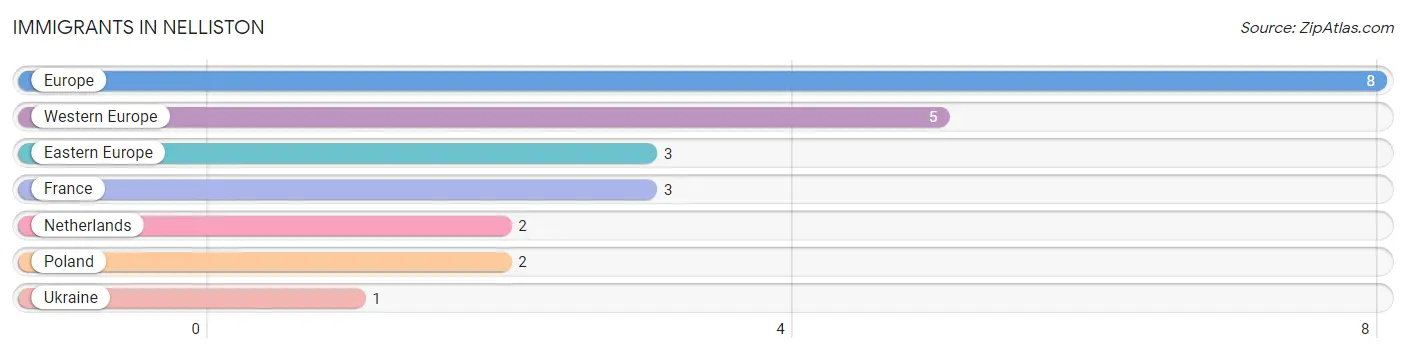
| Immigration Origin | # Population | % Population |
| Eastern Europe | 3 | 0.4% |
| Europe | 8 | 1.1% |
| France | 3 | 0.4% |
| Netherlands | 2 | 0.3% |
| Poland | 2 | 0.3% |
| Ukraine | 1 | 0.1% |
| Western Europe | 5 | 0.7% | View All 7 Rows |
Sex and Age in Nelliston
Sex and Age in Nelliston
The most populous age groups in Nelliston are 65 to 69 Years (52 | 17.4%) for men and 60 to 64 Years (106 | 26.8%) for women.
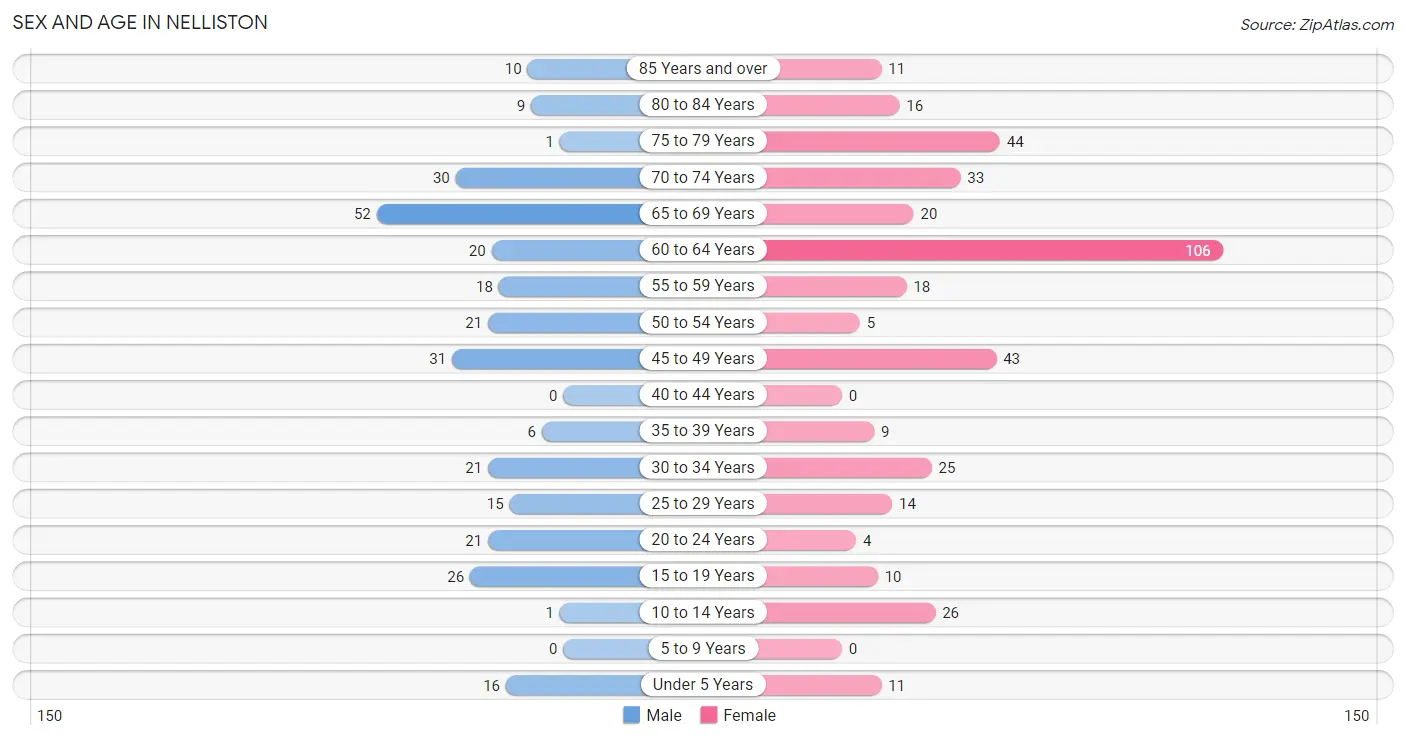
| Age Bracket | Male | Female |
| Under 5 Years | 16 (5.4%) | 11 (2.8%) |
| 5 to 9 Years | 0 (0.0%) | 0 (0.0%) |
| 10 to 14 Years | 1 (0.3%) | 26 (6.6%) |
| 15 to 19 Years | 26 (8.7%) | 10 (2.5%) |
| 20 to 24 Years | 21 (7.0%) | 4 (1.0%) |
| 25 to 29 Years | 15 (5.0%) | 14 (3.5%) |
| 30 to 34 Years | 21 (7.0%) | 25 (6.3%) |
| 35 to 39 Years | 6 (2.0%) | 9 (2.3%) |
| 40 to 44 Years | 0 (0.0%) | 0 (0.0%) |
| 45 to 49 Years | 31 (10.4%) | 43 (10.9%) |
| 50 to 54 Years | 21 (7.0%) | 5 (1.3%) |
| 55 to 59 Years | 18 (6.0%) | 18 (4.6%) |
| 60 to 64 Years | 20 (6.7%) | 106 (26.8%) |
| 65 to 69 Years | 52 (17.4%) | 20 (5.1%) |
| 70 to 74 Years | 30 (10.1%) | 33 (8.4%) |
| 75 to 79 Years | 1 (0.3%) | 44 (11.1%) |
| 80 to 84 Years | 9 (3.0%) | 16 (4.1%) |
| 85 Years and over | 10 (3.4%) | 11 (2.8%) |
| Total | 298 (100.0%) | 395 (100.0%) |
Families and Households in Nelliston
Median Family Size in Nelliston
The median family size in Nelliston is 2.72 persons per family, with single female/mother families (18 | 10.4%) accounting for the largest median family size of 4.11 persons per family. On the other hand, single male/father families (28 | 16.2%) represent the smallest median family size with 2.50 persons per family.
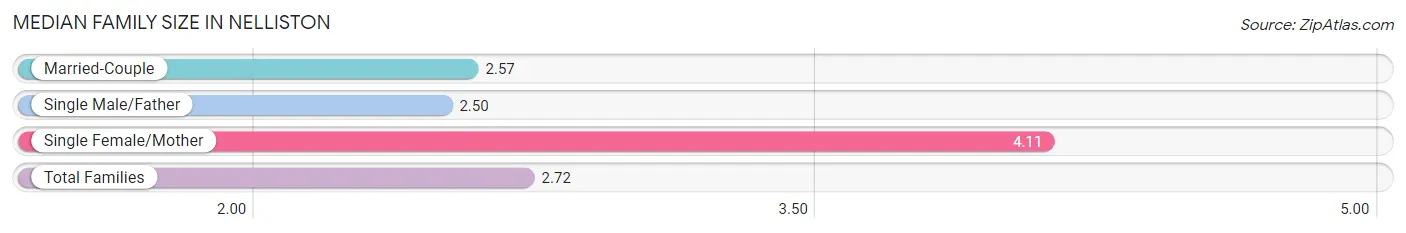
| Family Type | # Families | Family Size |
| Married-Couple | 127 (73.4%) | 2.57 |
| Single Male/Father | 28 (16.2%) | 2.50 |
| Single Female/Mother | 18 (10.4%) | 4.11 |
| Total Families | 173 (100.0%) | 2.72 |
Median Household Size in Nelliston
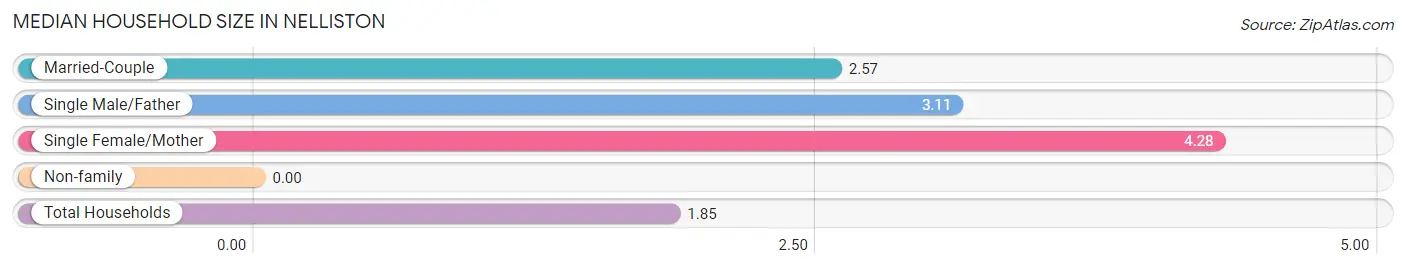
| Household Type | # Households | Household Size |
| Married-Couple | 127 (33.9%) | 2.57 |
| Single Male/Father | 28 (7.5%) | 3.11 |
| Single Female/Mother | 18 (4.8%) | 4.28 |
| Non-family | 202 (53.9%) | - |
| Total Households | 375 (100.0%) | 1.85 |
Household Size by Marriage Status in Nelliston
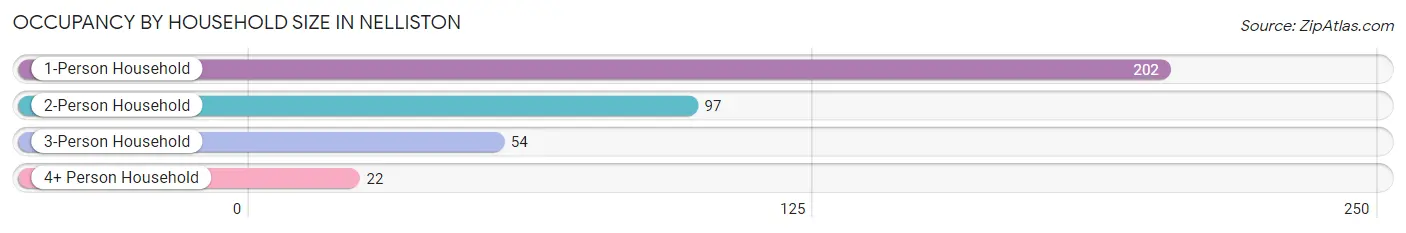
Out of a total of 375 households in Nelliston, 173 (46.1%) are family households, while 202 (53.9%) are nonfamily households. The most numerous type of family households are 2-person households, comprising 97, and the most common type of nonfamily households are 1-person households, comprising 202.
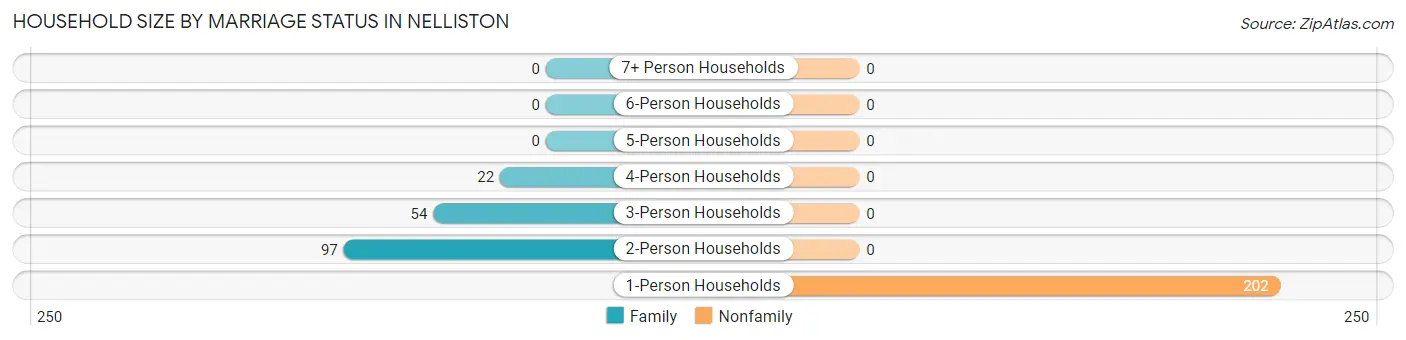
| Household Size | Family Households | Nonfamily Households |
| 1-Person Households | - | 202 (53.9%) |
| 2-Person Households | 97 (25.9%) | 0 (0.0%) |
| 3-Person Households | 54 (14.4%) | 0 (0.0%) |
| 4-Person Households | 22 (5.9%) | 0 (0.0%) |
| 5-Person Households | 0 (0.0%) | 0 (0.0%) |
| 6-Person Households | 0 (0.0%) | 0 (0.0%) |
| 7+ Person Households | 0 (0.0%) | 0 (0.0%) |
| Total | 173 (46.1%) | 202 (53.9%) |
Female Fertility in Nelliston
Fertility by Age in Nelliston
Average fertility rate in Nelliston is 84.0 births per 1,000 women. Women in the age bracket of 20 to 34 years have the highest fertility rate with 209.0 births per 1,000 women. Women in the age bracket of 20 to 34 years acount for 100.0% of all women with births.
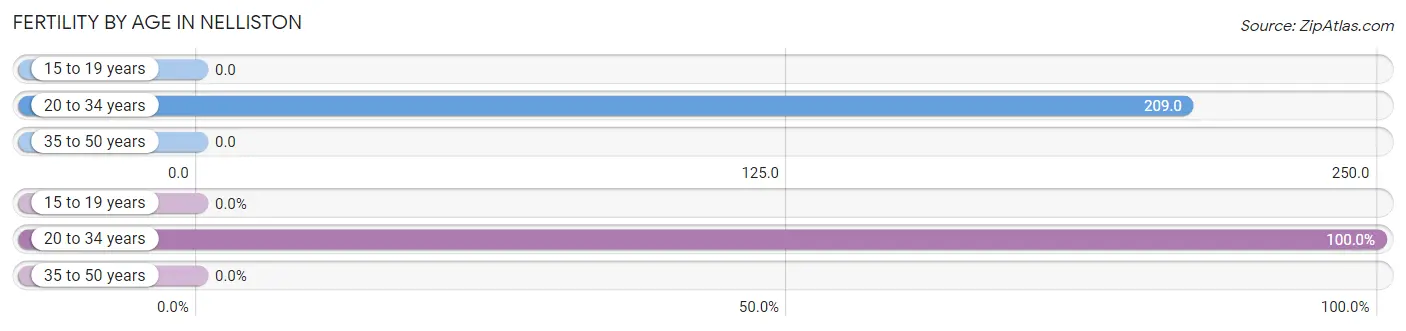
| Age Bracket | Women with Births | Births / 1,000 Women |
| 15 to 19 years | 0 (0.0%) | 0.0 |
| 20 to 34 years | 9 (100.0%) | 209.0 |
| 35 to 50 years | 0 (0.0%) | 0.0 |
| Total | 9 (100.0%) | 84.0 |
Fertility by Age by Marriage Status in Nelliston
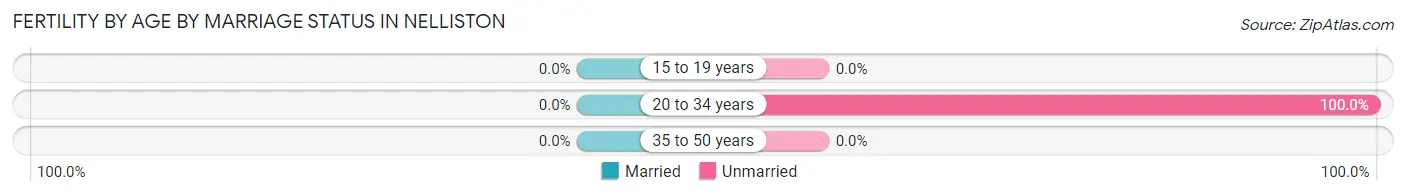
| Age Bracket | Married | Unmarried |
| 15 to 19 years | 0 (0.0%) | 0 (0.0%) |
| 20 to 34 years | 0 (0.0%) | 9 (100.0%) |
| 35 to 50 years | 0 (0.0%) | 0 (0.0%) |
| Total | 0 (0.0%) | 9 (100.0%) |
Fertility by Education in Nelliston
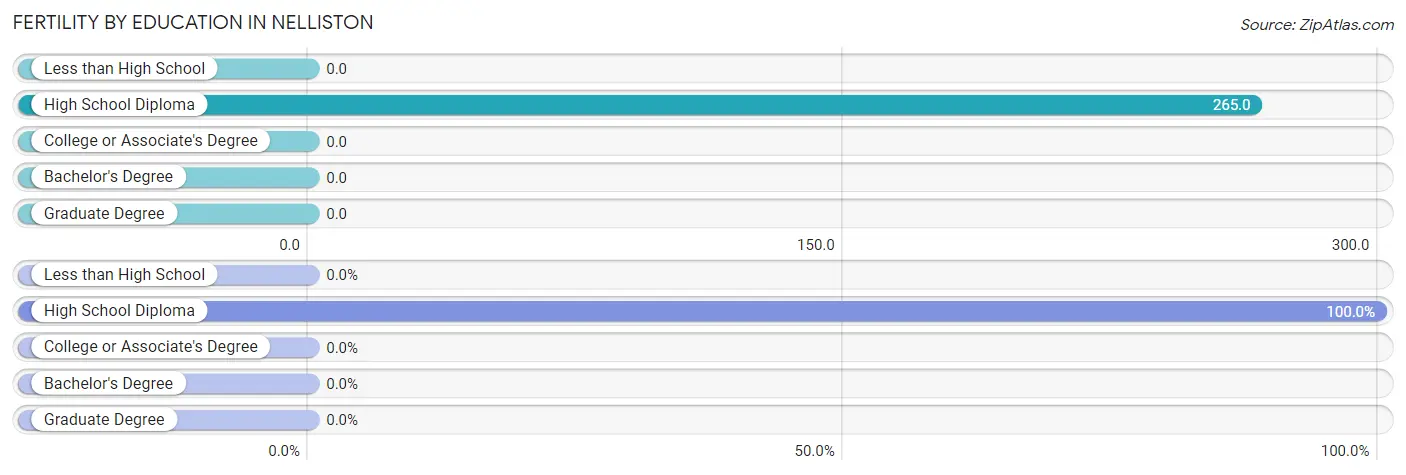
| Educational Attainment | Women with Births | Births / 1,000 Women |
| Less than High School | 0 (0.0%) | 0.0 |
| High School Diploma | 9 (100.0%) | 265.0 |
| College or Associate's Degree | 0 (0.0%) | 0.0 |
| Bachelor's Degree | 0 (0.0%) | 0.0 |
| Graduate Degree | 0 (0.0%) | 0.0 |
| Total | 9 (100.0%) | 84.0 |
Fertility by Education by Marriage Status in Nelliston
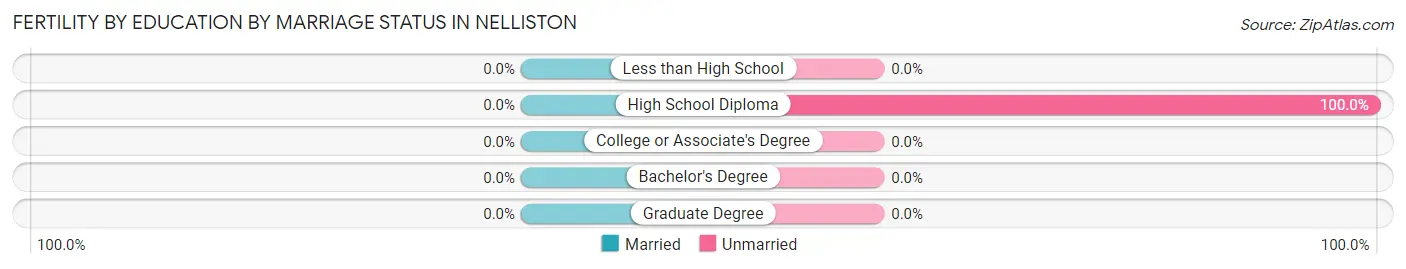
| Educational Attainment | Married | Unmarried |
| Less than High School | 0 (0.0%) | 0 (0.0%) |
| High School Diploma | 0 (0.0%) | 9 (100.0%) |
| College or Associate's Degree | 0 (0.0%) | 0 (0.0%) |
| Bachelor's Degree | 0 (0.0%) | 0 (0.0%) |
| Graduate Degree | 0 (0.0%) | 0 (0.0%) |
| Total | 0 (0.0%) | 9 (100.0%) |
Employment Characteristics in Nelliston
Employment by Class of Employer in Nelliston
Among the 264 employed individuals in Nelliston, private company employees (145 | 54.9%), self-employed (not incorporated) (38 | 14.4%), and state government employees (30 | 11.4%) make up the most common classes of employment.
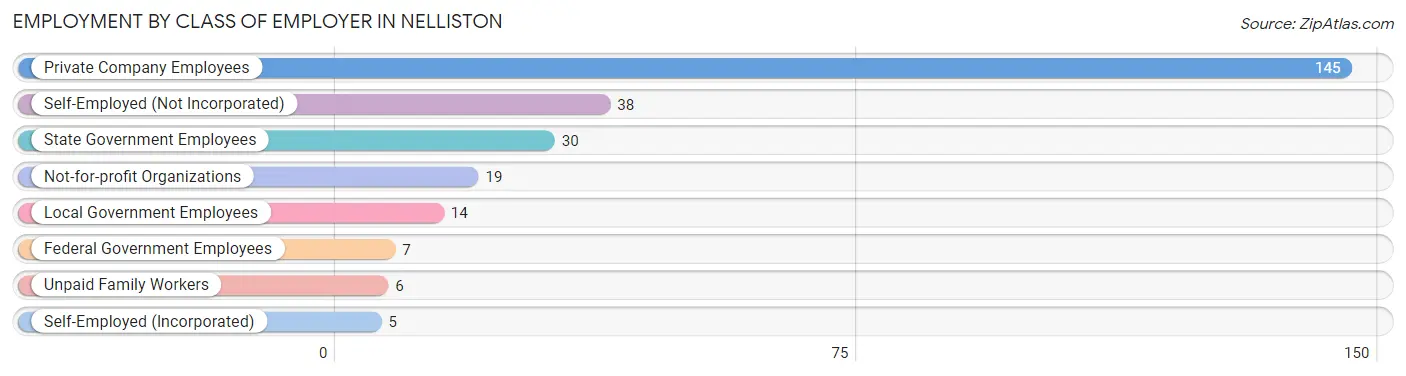
| Employer Class | # Employees | % Employees |
| Private Company Employees | 145 | 54.9% |
| Self-Employed (Incorporated) | 5 | 1.9% |
| Self-Employed (Not Incorporated) | 38 | 14.4% |
| Not-for-profit Organizations | 19 | 7.2% |
| Local Government Employees | 14 | 5.3% |
| State Government Employees | 30 | 11.4% |
| Federal Government Employees | 7 | 2.6% |
| Unpaid Family Workers | 6 | 2.3% |
| Total | 264 | 100.0% |
Employment Status by Age in Nelliston
According to the labor force statistics for Nelliston, out of the total population over 16 years of age (639), 43.8% or 280 individuals are in the labor force, with 5.7% or 16 of them unemployed. The age group with the highest labor force participation rate is 45 to 54 years, with 89.0% or 89 individuals in the labor force. Within the labor force, the 65 to 74 years age range has the highest percentage of unemployed individuals, with 16.9% or 11 of them being unemployed.
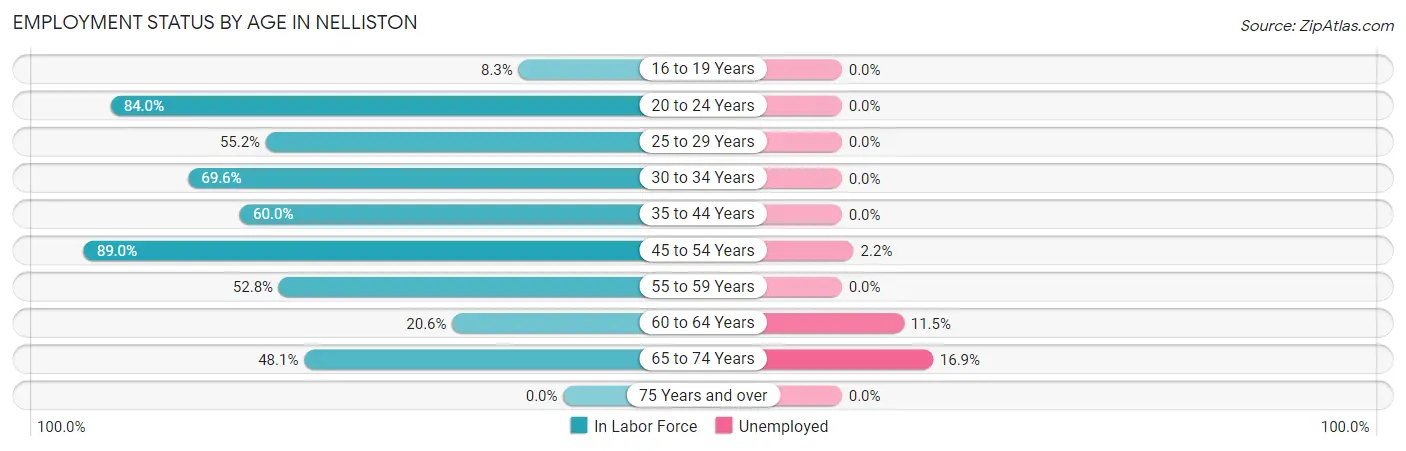
| Age Bracket | In Labor Force | Unemployed |
| 16 to 19 Years | 3 (8.3%) | 0 (0.0%) |
| 20 to 24 Years | 21 (84.0%) | 0 (0.0%) |
| 25 to 29 Years | 16 (55.2%) | 0 (0.0%) |
| 30 to 34 Years | 32 (69.6%) | 0 (0.0%) |
| 35 to 44 Years | 9 (60.0%) | 0 (0.0%) |
| 45 to 54 Years | 89 (89.0%) | 2 (2.2%) |
| 55 to 59 Years | 19 (52.8%) | 0 (0.0%) |
| 60 to 64 Years | 26 (20.6%) | 3 (11.5%) |
| 65 to 74 Years | 65 (48.1%) | 11 (16.9%) |
| 75 Years and over | 0 (0.0%) | 0 (0.0%) |
| Total | 280 (43.8%) | 16 (5.7%) |
Employment Status by Educational Attainment in Nelliston
According to labor force statistics for Nelliston, 54.3% of individuals (191) out of the total population between 25 and 64 years of age (352) are in the labor force, with 2.6% or 5 of them being unemployed. The group with the highest labor force participation rate are those with the educational attainment of bachelor's degree or higher, with 100.0% or 83 individuals in the labor force. Within the labor force, individuals with less than high school education have the highest percentage of unemployment, with 25.0% or 3 of them being unemployed.
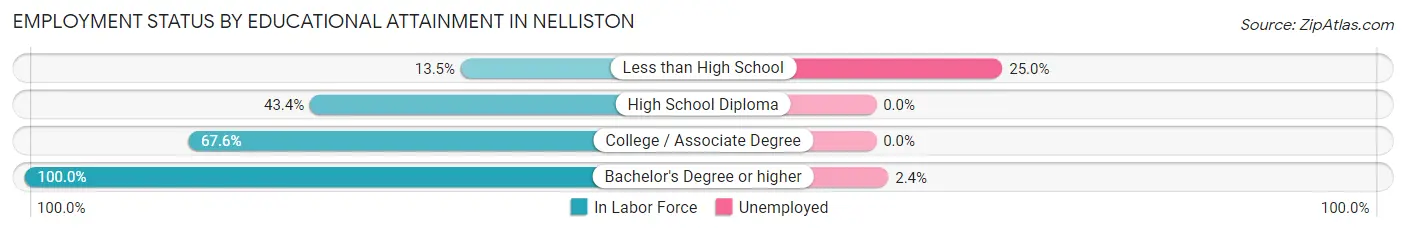
| Educational Attainment | In Labor Force | Unemployed |
| Less than High School | 12 (13.5%) | 22 (25.0%) |
| High School Diploma | 46 (43.4%) | 0 (0.0%) |
| College / Associate Degree | 50 (67.6%) | 0 (0.0%) |
| Bachelor's Degree or higher | 83 (100.0%) | 2 (2.4%) |
| Total | 191 (54.3%) | 9 (2.6%) |
Employment Occupations by Sex in Nelliston
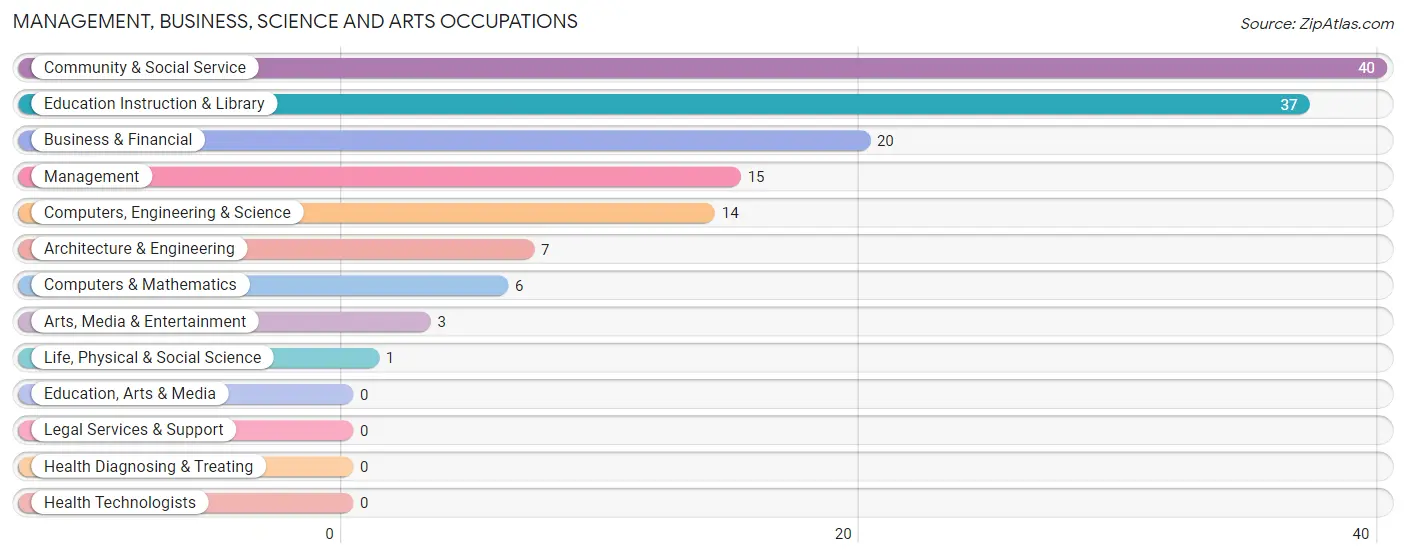
Management, Business, Science and Arts Occupations
The most common Management, Business, Science and Arts occupations in Nelliston are Community & Social Service (40 | 15.1%), Education Instruction & Library (37 | 14.0%), Business & Financial (20 | 7.6%), Management (15 | 5.7%), and Computers, Engineering & Science (14 | 5.3%).
Management, Business, Science and Arts Occupations by Sex
Within the Management, Business, Science and Arts occupations in Nelliston, the most male-oriented occupations are Management (100.0%), Computers, Engineering & Science (100.0%), and Computers & Mathematics (100.0%), while the most female-oriented occupations are Community & Social Service (100.0%), Education Instruction & Library (100.0%), and Arts, Media & Entertainment (100.0%).
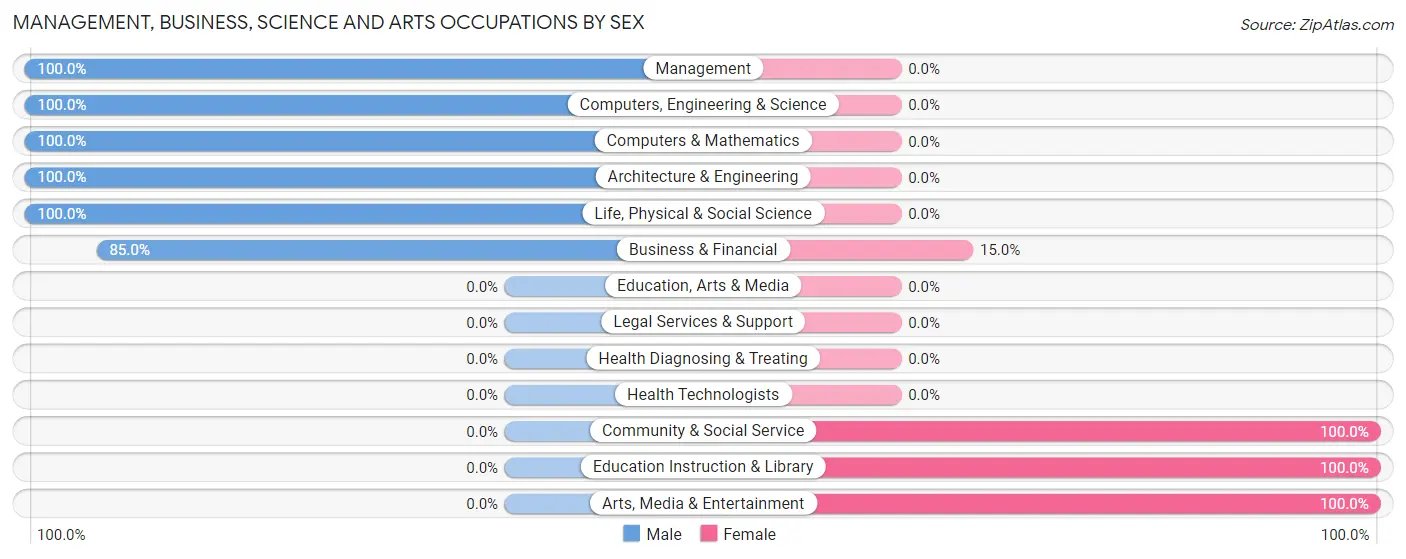
| Occupation | Male | Female |
| Management | 15 (100.0%) | 0 (0.0%) |
| Business & Financial | 17 (85.0%) | 3 (15.0%) |
| Computers, Engineering & Science | 14 (100.0%) | 0 (0.0%) |
| Computers & Mathematics | 6 (100.0%) | 0 (0.0%) |
| Architecture & Engineering | 7 (100.0%) | 0 (0.0%) |
| Life, Physical & Social Science | 1 (100.0%) | 0 (0.0%) |
| Community & Social Service | 0 (0.0%) | 40 (100.0%) |
| Education, Arts & Media | 0 (0.0%) | 0 (0.0%) |
| Legal Services & Support | 0 (0.0%) | 0 (0.0%) |
| Education Instruction & Library | 0 (0.0%) | 37 (100.0%) |
| Arts, Media & Entertainment | 0 (0.0%) | 3 (100.0%) |
| Health Diagnosing & Treating | 0 (0.0%) | 0 (0.0%) |
| Health Technologists | 0 (0.0%) | 0 (0.0%) |
| Total (Category) | 46 (51.7%) | 43 (48.3%) |
| Total (Overall) | 146 (55.3%) | 118 (44.7%) |
Services Occupations
The most common Services occupations in Nelliston are Cleaning & Maintenance (19 | 7.2%), Security & Protection (7 | 2.6%), Law Enforcement (5 | 1.9%), Food Preparation & Serving (5 | 1.9%), and Healthcare Support (3 | 1.1%).
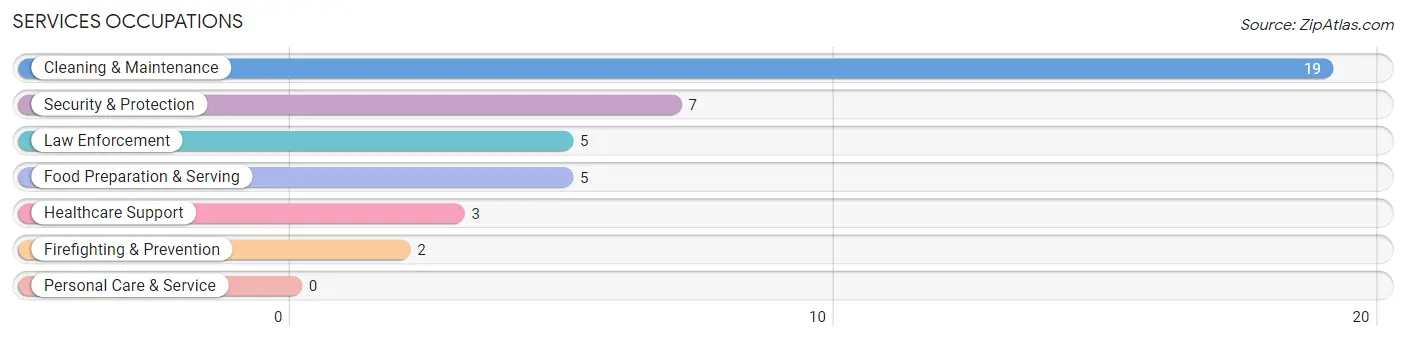
Services Occupations by Sex
Within the Services occupations in Nelliston, the most male-oriented occupations are Law Enforcement (100.0%), and Security & Protection (71.4%), while the most female-oriented occupations are Healthcare Support (100.0%), Firefighting & Prevention (100.0%), and Food Preparation & Serving (100.0%).
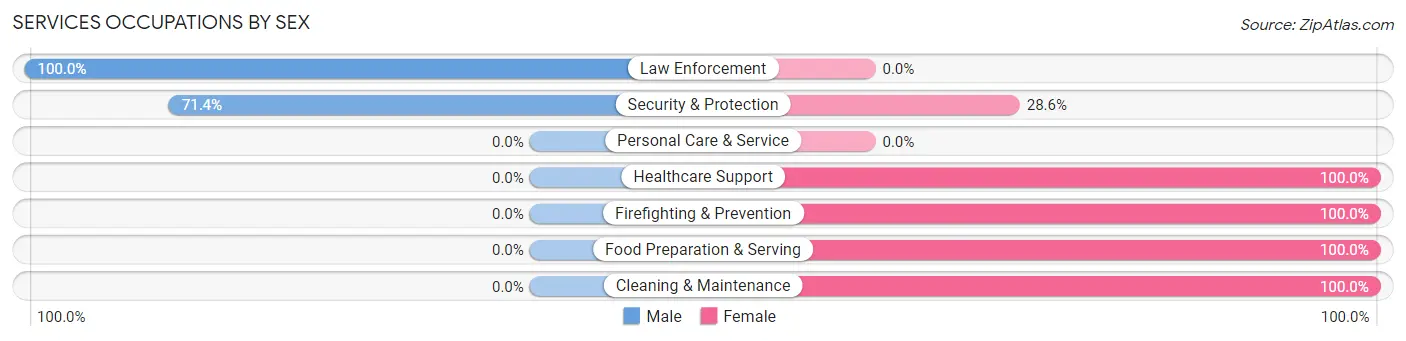
| Occupation | Male | Female |
| Healthcare Support | 0 (0.0%) | 3 (100.0%) |
| Security & Protection | 5 (71.4%) | 2 (28.6%) |
| Firefighting & Prevention | 0 (0.0%) | 2 (100.0%) |
| Law Enforcement | 5 (100.0%) | 0 (0.0%) |
| Food Preparation & Serving | 0 (0.0%) | 5 (100.0%) |
| Cleaning & Maintenance | 0 (0.0%) | 19 (100.0%) |
| Personal Care & Service | 0 (0.0%) | 0 (0.0%) |
| Total (Category) | 5 (14.7%) | 29 (85.3%) |
| Total (Overall) | 146 (55.3%) | 118 (44.7%) |
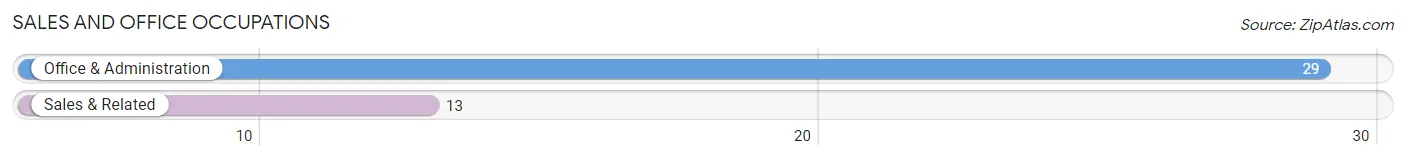
Sales and Office Occupations
The most common Sales and Office occupations in Nelliston are Office & Administration (29 | 11.0%), and Sales & Related (13 | 4.9%).
Sales and Office Occupations by Sex
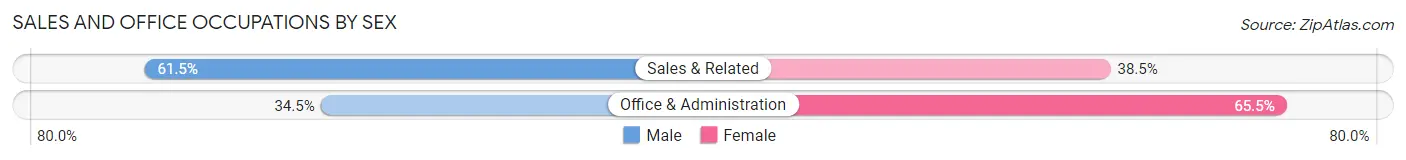
| Occupation | Male | Female |
| Sales & Related | 8 (61.5%) | 5 (38.5%) |
| Office & Administration | 10 (34.5%) | 19 (65.5%) |
| Total (Category) | 18 (42.9%) | 24 (57.1%) |
| Total (Overall) | 146 (55.3%) | 118 (44.7%) |
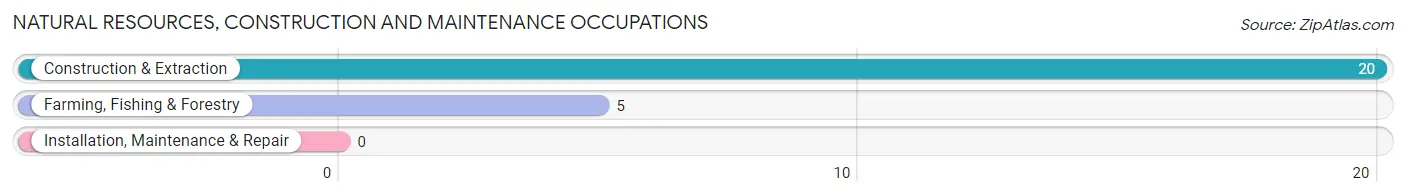
Natural Resources, Construction and Maintenance Occupations
The most common Natural Resources, Construction and Maintenance occupations in Nelliston are Construction & Extraction (20 | 7.6%), and Farming, Fishing & Forestry (5 | 1.9%).
Natural Resources, Construction and Maintenance Occupations by Sex
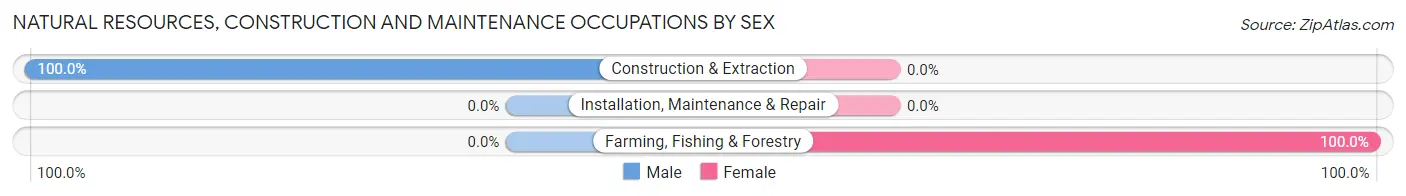
| Occupation | Male | Female |
| Farming, Fishing & Forestry | 0 (0.0%) | 5 (100.0%) |
| Construction & Extraction | 20 (100.0%) | 0 (0.0%) |
| Installation, Maintenance & Repair | 0 (0.0%) | 0 (0.0%) |
| Total (Category) | 20 (80.0%) | 5 (20.0%) |
| Total (Overall) | 146 (55.3%) | 118 (44.7%) |
Production, Transportation and Moving Occupations
The most common Production, Transportation and Moving occupations in Nelliston are Material Moving (47 | 17.8%), Transportation (21 | 8.0%), and Production (6 | 2.3%).
Production, Transportation and Moving Occupations by Sex
| Occupation | Male | Female |
| Production | 6 (100.0%) | 0 (0.0%) |
| Transportation | 21 (100.0%) | 0 (0.0%) |
| Material Moving | 30 (63.8%) | 17 (36.2%) |
| Total (Category) | 57 (77.0%) | 17 (23.0%) |
| Total (Overall) | 146 (55.3%) | 118 (44.7%) |
Employment Industries by Sex in Nelliston
Employment Industries in Nelliston
The major employment industries in Nelliston include Retail Trade (61 | 23.1%), Educational Services (33 | 12.5%), Manufacturing (30 | 11.4%), Construction (29 | 11.0%), and Administrative & Support (24 | 9.1%).
Employment Industries by Sex in Nelliston
The Nelliston industries that see more men than women are Transportation & Warehousing (100.0%), Construction (89.7%), and Retail Trade (78.7%), whereas the industries that tend to have a higher number of women are Administrative & Support (100.0%), Arts, Entertainment & Recreation (100.0%), and Accommodation & Food Services (100.0%).
| Industry | Male | Female |
| Agriculture, Fishing & Hunting | 1 (25.0%) | 3 (75.0%) |
| Mining, Quarrying, & Extraction | 0 (0.0%) | 0 (0.0%) |
| Construction | 26 (89.7%) | 3 (10.3%) |
| Manufacturing | 20 (66.7%) | 10 (33.3%) |
| Wholesale Trade | 0 (0.0%) | 0 (0.0%) |
| Retail Trade | 48 (78.7%) | 13 (21.3%) |
| Transportation & Warehousing | 14 (100.0%) | 0 (0.0%) |
| Utilities | 0 (0.0%) | 0 (0.0%) |
| Information | 9 (52.9%) | 8 (47.1%) |
| Finance & Insurance | 3 (60.0%) | 2 (40.0%) |
| Real Estate, Rental & Leasing | 0 (0.0%) | 0 (0.0%) |
| Professional & Scientific | 7 (70.0%) | 3 (30.0%) |
| Enterprise Management | 0 (0.0%) | 0 (0.0%) |
| Administrative & Support | 0 (0.0%) | 24 (100.0%) |
| Educational Services | 3 (9.1%) | 30 (90.9%) |
| Health Care & Social Assistance | 7 (77.8%) | 2 (22.2%) |
| Arts, Entertainment & Recreation | 0 (0.0%) | 9 (100.0%) |
| Accommodation & Food Services | 0 (0.0%) | 3 (100.0%) |
| Public Administration | 8 (72.7%) | 3 (27.3%) |
| Total | 146 (55.3%) | 118 (44.7%) |
Education in Nelliston
School Enrollment in Nelliston
The most common levels of schooling among the 91 students in Nelliston are high school (36 | 39.6%), middle school (27 | 29.7%), and nursery / preschool (11 | 12.1%).
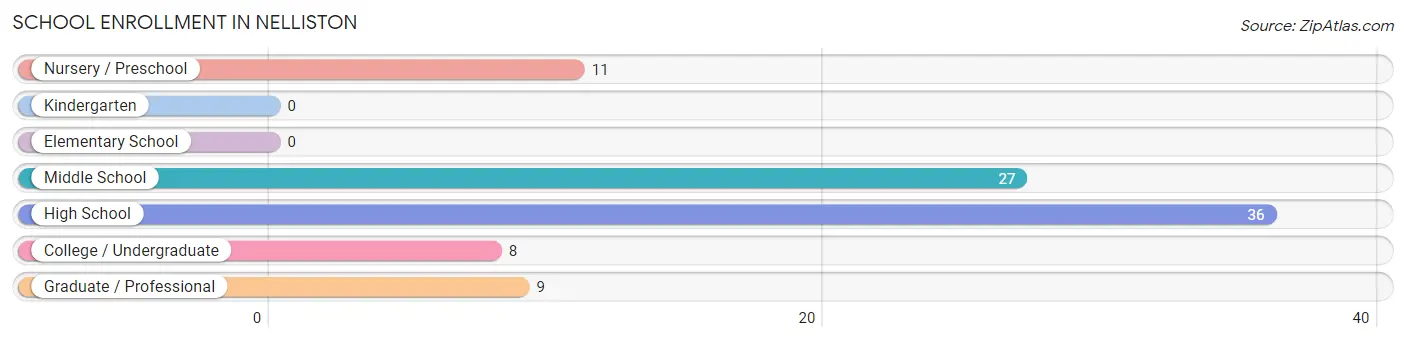
| School Level | # Students | % Students |
| Nursery / Preschool | 11 | 12.1% |
| Kindergarten | 0 | 0.0% |
| Elementary School | 0 | 0.0% |
| Middle School | 27 | 29.7% |
| High School | 36 | 39.6% |
| College / Undergraduate | 8 | 8.8% |
| Graduate / Professional | 9 | 9.9% |
| Total | 91 | 100.0% |
School Enrollment by Age by Funding Source in Nelliston
Out of a total of 91 students who are enrolled in schools in Nelliston, 3 (3.3%) attend a private institution, while the remaining 88 (96.7%) are enrolled in public schools. The age group of 15 to 17 year olds has the highest likelihood of being enrolled in private schools, with 3 (9.1% in the age bracket) enrolled. Conversely, the age group of 3 to 4 year olds has the lowest likelihood of being enrolled in a private school, with 11 (100.0% in the age bracket) attending a public institution.
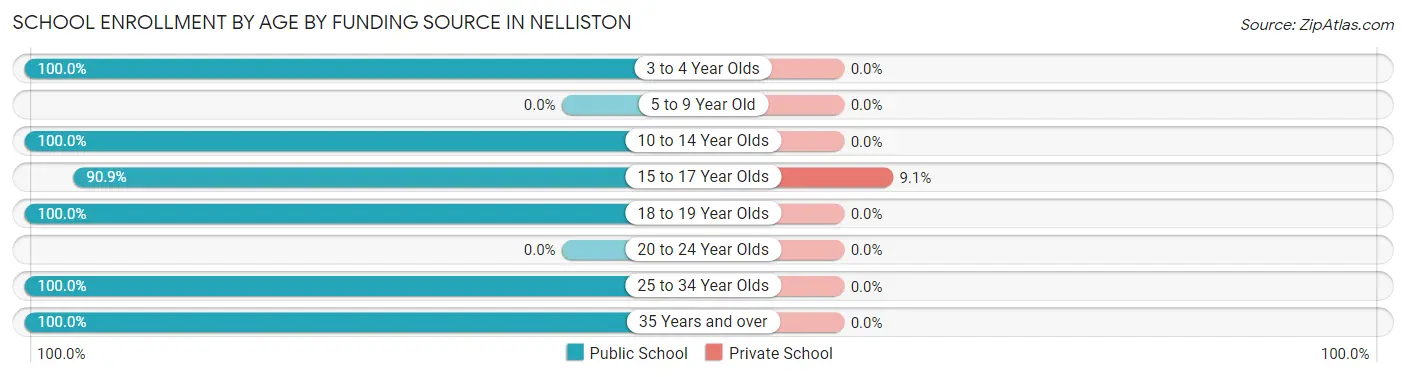
| Age Bracket | Public School | Private School |
| 3 to 4 Year Olds | 11 (100.0%) | 0 (0.0%) |
| 5 to 9 Year Old | 0 (0.0%) | 0 (0.0%) |
| 10 to 14 Year Olds | 27 (100.0%) | 0 (0.0%) |
| 15 to 17 Year Olds | 30 (90.9%) | 3 (9.1%) |
| 18 to 19 Year Olds | 3 (100.0%) | 0 (0.0%) |
| 20 to 24 Year Olds | 0 (0.0%) | 0 (0.0%) |
| 25 to 34 Year Olds | 4 (100.0%) | 0 (0.0%) |
| 35 Years and over | 13 (100.0%) | 0 (0.0%) |
| Total | 88 (96.7%) | 3 (3.3%) |
Educational Attainment by Field of Study in Nelliston
Science & technology (26 | 24.1%), education (20 | 18.5%), psychology (19 | 17.6%), business (18 | 16.7%), and liberal arts & history (14 | 13.0%) are the most common fields of study among 108 individuals in Nelliston who have obtained a bachelor's degree or higher.
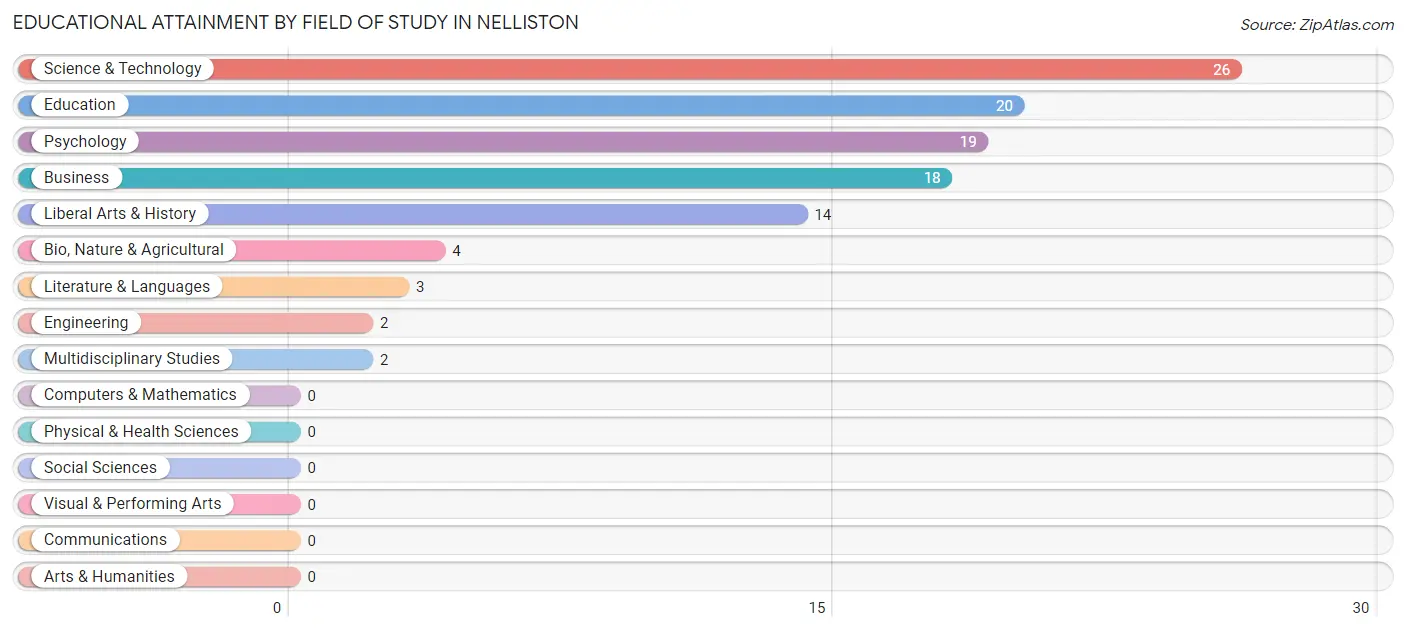
| Field of Study | # Graduates | % Graduates |
| Computers & Mathematics | 0 | 0.0% |
| Bio, Nature & Agricultural | 4 | 3.7% |
| Physical & Health Sciences | 0 | 0.0% |
| Psychology | 19 | 17.6% |
| Social Sciences | 0 | 0.0% |
| Engineering | 2 | 1.8% |
| Multidisciplinary Studies | 2 | 1.8% |
| Science & Technology | 26 | 24.1% |
| Business | 18 | 16.7% |
| Education | 20 | 18.5% |
| Literature & Languages | 3 | 2.8% |
| Liberal Arts & History | 14 | 13.0% |
| Visual & Performing Arts | 0 | 0.0% |
| Communications | 0 | 0.0% |
| Arts & Humanities | 0 | 0.0% |
| Total | 108 | 100.0% |
Transportation & Commute in Nelliston
Vehicle Availability by Sex in Nelliston
The most prevalent vehicle ownership categories in Nelliston are males with 2 vehicles (50, accounting for 34.3%) and females with 2 vehicles (52, making up 42.4%).
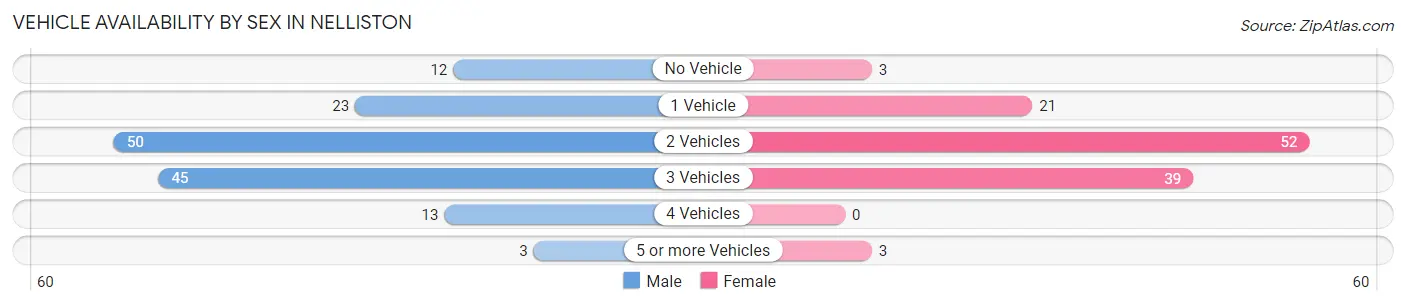
| Vehicles Available | Male | Female |
| No Vehicle | 12 (8.2%) | 3 (2.5%) |
| 1 Vehicle | 23 (15.8%) | 21 (17.8%) |
| 2 Vehicles | 50 (34.3%) | 52 (44.1%) |
| 3 Vehicles | 45 (30.8%) | 39 (33.1%) |
| 4 Vehicles | 13 (8.9%) | 0 (0.0%) |
| 5 or more Vehicles | 3 (2.1%) | 3 (2.5%) |
| Total | 146 (100.0%) | 118 (100.0%) |
Commute Time in Nelliston
The most frequently occuring commute durations in Nelliston are 5 to 9 minutes (101 commuters, 41.4%), 45 to 59 minutes (35 commuters, 14.3%), and 60 to 89 minutes (34 commuters, 13.9%).
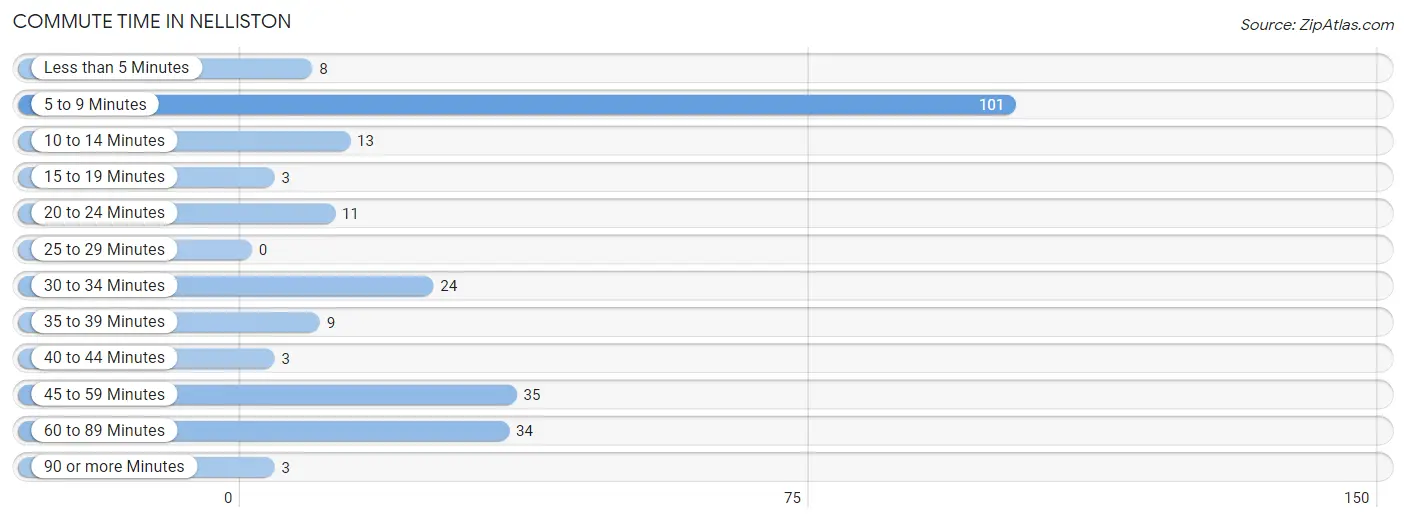
| Commute Time | # Commuters | % Commuters |
| Less than 5 Minutes | 8 | 3.3% |
| 5 to 9 Minutes | 101 | 41.4% |
| 10 to 14 Minutes | 13 | 5.3% |
| 15 to 19 Minutes | 3 | 1.2% |
| 20 to 24 Minutes | 11 | 4.5% |
| 25 to 29 Minutes | 0 | 0.0% |
| 30 to 34 Minutes | 24 | 9.8% |
| 35 to 39 Minutes | 9 | 3.7% |
| 40 to 44 Minutes | 3 | 1.2% |
| 45 to 59 Minutes | 35 | 14.3% |
| 60 to 89 Minutes | 34 | 13.9% |
| 90 or more Minutes | 3 | 1.2% |
Commute Time by Sex in Nelliston
The most common commute times in Nelliston are 5 to 9 minutes (34 commuters, 26.4%) for males and 5 to 9 minutes (67 commuters, 58.3%) for females.
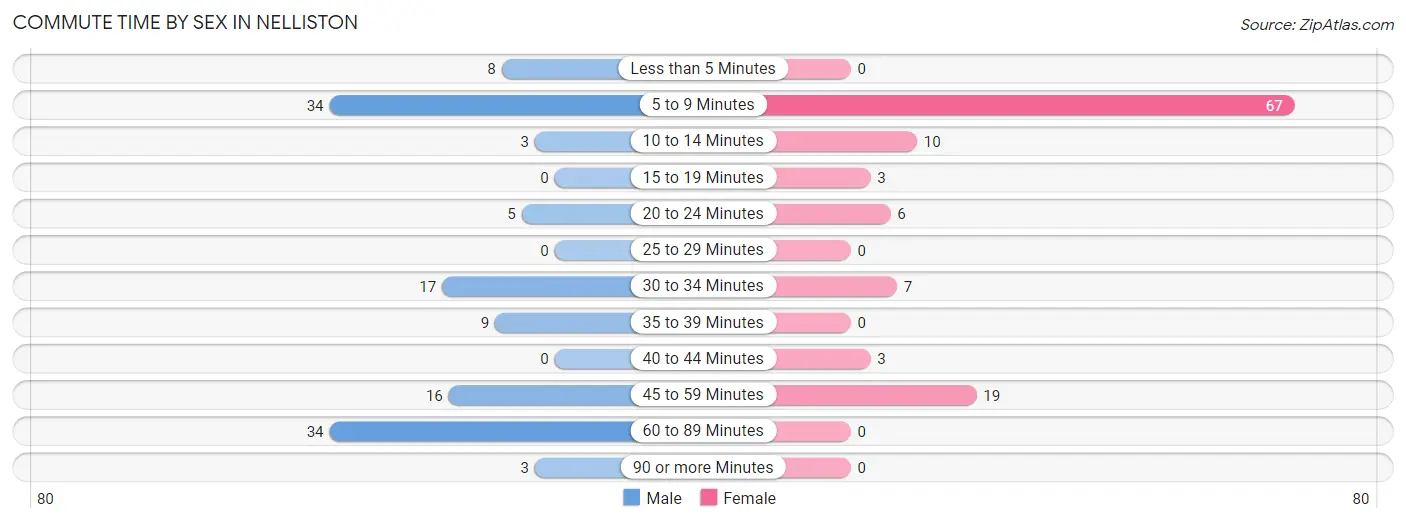
| Commute Time | Male | Female |
| Less than 5 Minutes | 8 (6.2%) | 0 (0.0%) |
| 5 to 9 Minutes | 34 (26.4%) | 67 (58.3%) |
| 10 to 14 Minutes | 3 (2.3%) | 10 (8.7%) |
| 15 to 19 Minutes | 0 (0.0%) | 3 (2.6%) |
| 20 to 24 Minutes | 5 (3.9%) | 6 (5.2%) |
| 25 to 29 Minutes | 0 (0.0%) | 0 (0.0%) |
| 30 to 34 Minutes | 17 (13.2%) | 7 (6.1%) |
| 35 to 39 Minutes | 9 (7.0%) | 0 (0.0%) |
| 40 to 44 Minutes | 0 (0.0%) | 3 (2.6%) |
| 45 to 59 Minutes | 16 (12.4%) | 19 (16.5%) |
| 60 to 89 Minutes | 34 (26.4%) | 0 (0.0%) |
| 90 or more Minutes | 3 (2.3%) | 0 (0.0%) |
Time of Departure to Work by Sex in Nelliston
The most frequent times of departure to work in Nelliston are 12:00 AM to 4:59 AM (27, 20.9%) for males and 7:00 AM to 7:29 AM (27, 23.5%) for females.
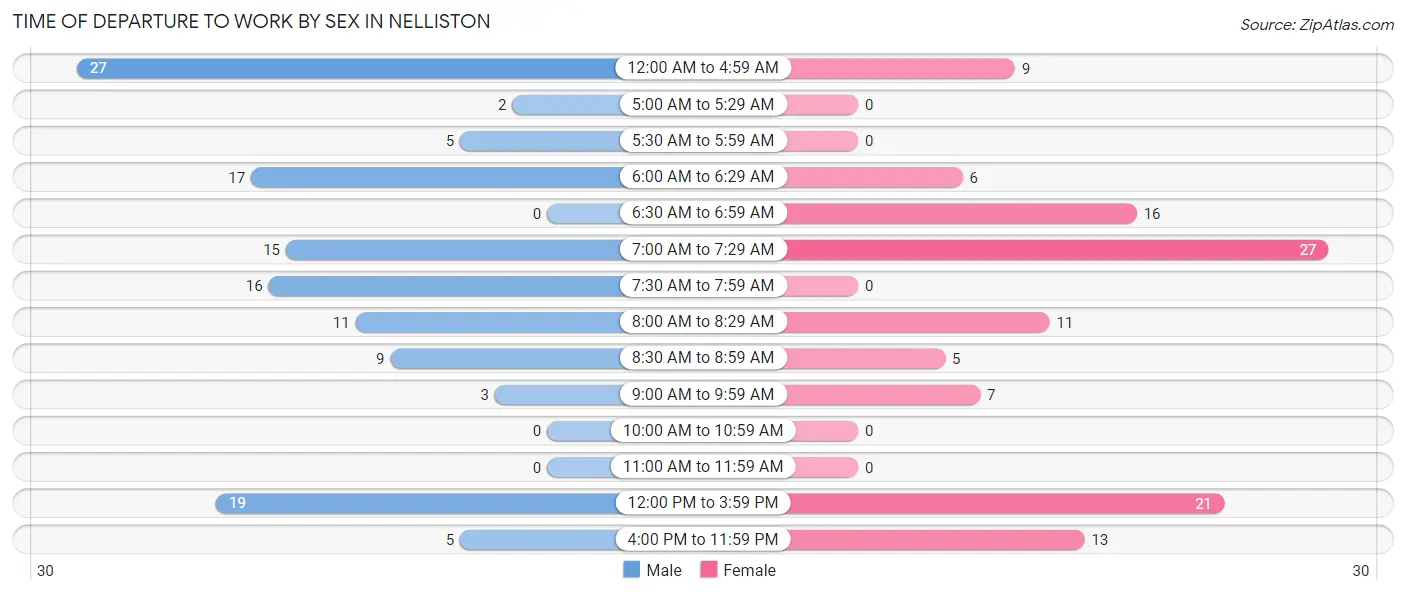
| Time of Departure | Male | Female |
| 12:00 AM to 4:59 AM | 27 (20.9%) | 9 (7.8%) |
| 5:00 AM to 5:29 AM | 2 (1.5%) | 0 (0.0%) |
| 5:30 AM to 5:59 AM | 5 (3.9%) | 0 (0.0%) |
| 6:00 AM to 6:29 AM | 17 (13.2%) | 6 (5.2%) |
| 6:30 AM to 6:59 AM | 0 (0.0%) | 16 (13.9%) |
| 7:00 AM to 7:29 AM | 15 (11.6%) | 27 (23.5%) |
| 7:30 AM to 7:59 AM | 16 (12.4%) | 0 (0.0%) |
| 8:00 AM to 8:29 AM | 11 (8.5%) | 11 (9.6%) |
| 8:30 AM to 8:59 AM | 9 (7.0%) | 5 (4.3%) |
| 9:00 AM to 9:59 AM | 3 (2.3%) | 7 (6.1%) |
| 10:00 AM to 10:59 AM | 0 (0.0%) | 0 (0.0%) |
| 11:00 AM to 11:59 AM | 0 (0.0%) | 0 (0.0%) |
| 12:00 PM to 3:59 PM | 19 (14.7%) | 21 (18.3%) |
| 4:00 PM to 11:59 PM | 5 (3.9%) | 13 (11.3%) |
| Total | 129 (100.0%) | 115 (100.0%) |
Housing Occupancy in Nelliston
Occupancy by Ownership in Nelliston
Of the total 375 dwellings in Nelliston, owner-occupied units account for 262 (69.9%), while renter-occupied units make up 113 (30.1%).
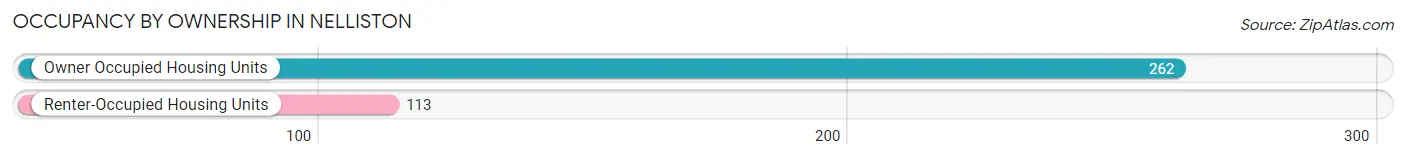
| Occupancy | # Housing Units | % Housing Units |
| Owner Occupied Housing Units | 262 | 69.9% |
| Renter-Occupied Housing Units | 113 | 30.1% |
| Total Occupied Housing Units | 375 | 100.0% |
Occupancy by Household Size in Nelliston
| Household Size | # Housing Units | % Housing Units |
| 1-Person Household | 202 | 53.9% |
| 2-Person Household | 97 | 25.9% |
| 3-Person Household | 54 | 14.4% |
| 4+ Person Household | 22 | 5.9% |
| Total Housing Units | 375 | 100.0% |
Occupancy by Ownership by Household Size in Nelliston
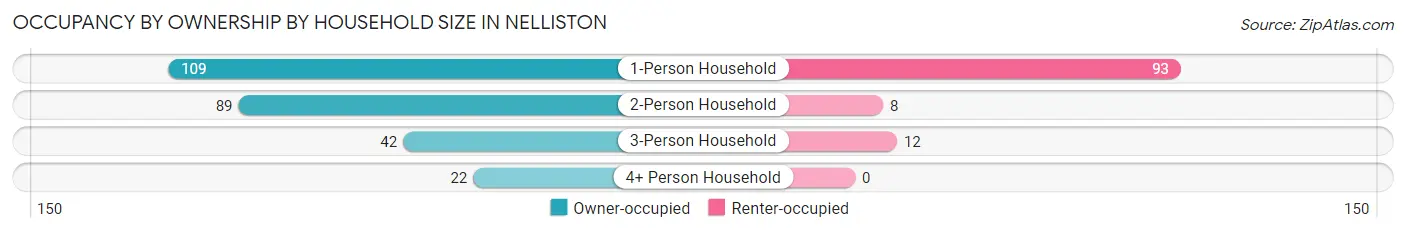
| Household Size | Owner-occupied | Renter-occupied |
| 1-Person Household | 109 (54.0%) | 93 (46.0%) |
| 2-Person Household | 89 (91.7%) | 8 (8.3%) |
| 3-Person Household | 42 (77.8%) | 12 (22.2%) |
| 4+ Person Household | 22 (100.0%) | 0 (0.0%) |
| Total Housing Units | 262 (69.9%) | 113 (30.1%) |
Occupancy by Educational Attainment in Nelliston
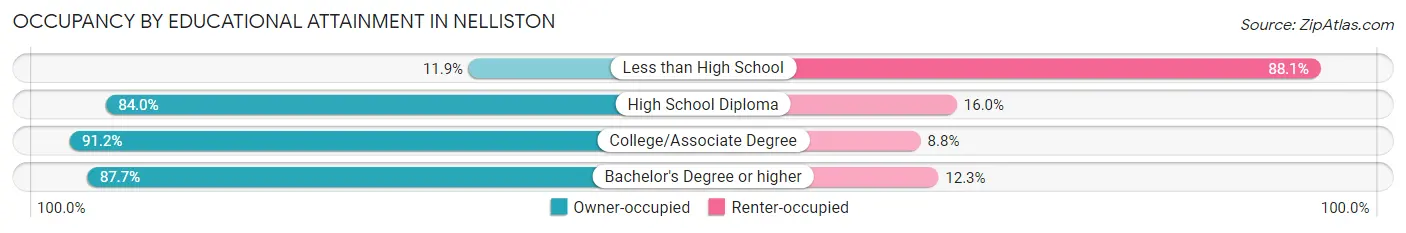
| Household Size | Owner-occupied | Renter-occupied |
| Less than High School | 10 (11.9%) | 74 (88.1%) |
| High School Diploma | 126 (84.0%) | 24 (16.0%) |
| College/Associate Degree | 62 (91.2%) | 6 (8.8%) |
| Bachelor's Degree or higher | 64 (87.7%) | 9 (12.3%) |
Occupancy by Age of Householder in Nelliston
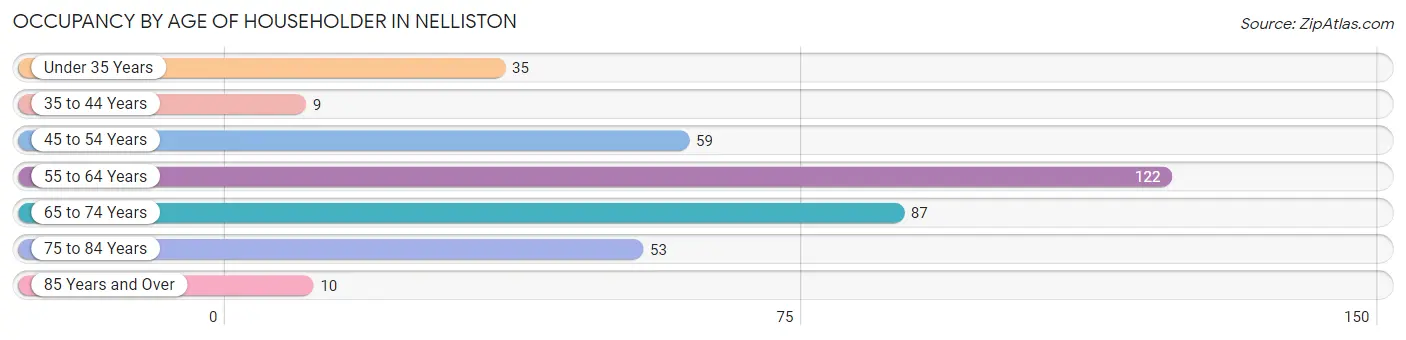
| Age Bracket | # Households | % Households |
| Under 35 Years | 35 | 9.3% |
| 35 to 44 Years | 9 | 2.4% |
| 45 to 54 Years | 59 | 15.7% |
| 55 to 64 Years | 122 | 32.5% |
| 65 to 74 Years | 87 | 23.2% |
| 75 to 84 Years | 53 | 14.1% |
| 85 Years and Over | 10 | 2.7% |
| Total | 375 | 100.0% |
Housing Finances in Nelliston
Median Income by Occupancy in Nelliston
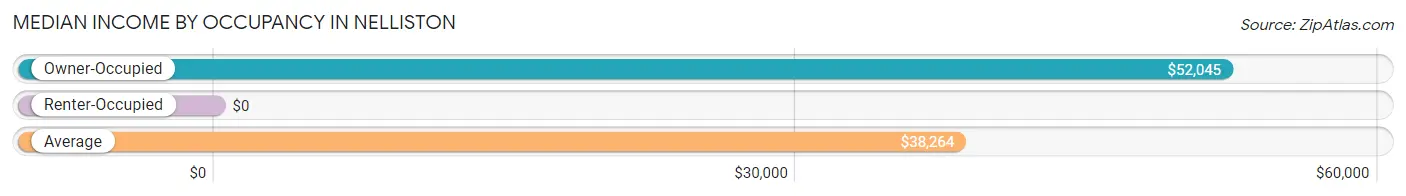
| Occupancy Type | # Households | Median Income |
| Owner-Occupied | 262 (69.9%) | $52,045 |
| Renter-Occupied | 113 (30.1%) | $0 |
| Average | 375 (100.0%) | $38,264 |
Occupancy by Householder Income Bracket in Nelliston
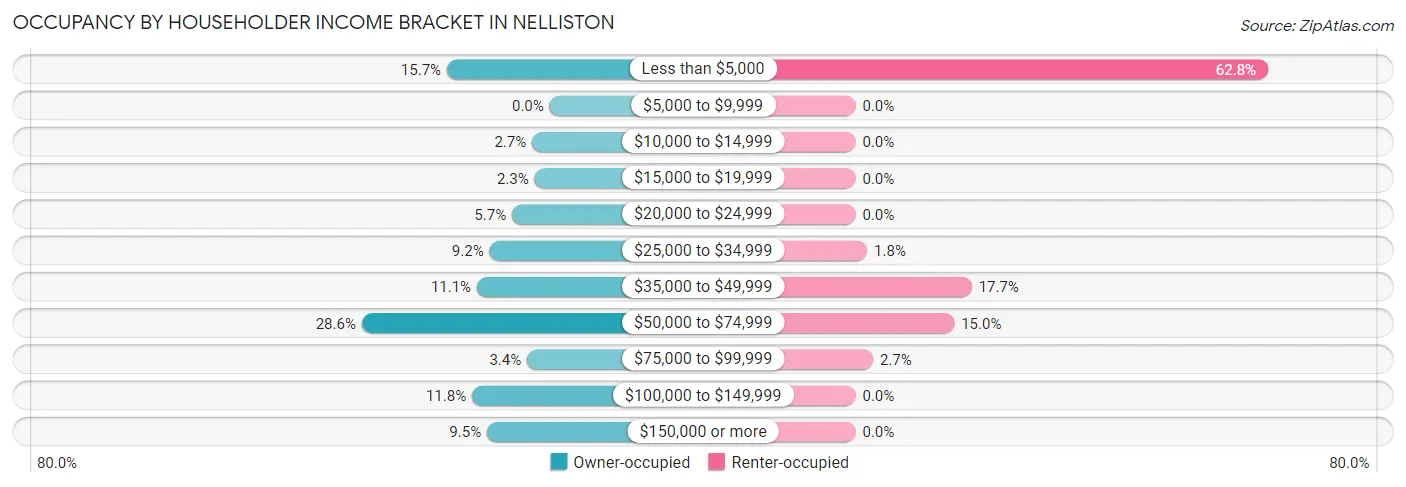
| Income Bracket | Owner-occupied | Renter-occupied |
| Less than $5,000 | 41 (15.7%) | 71 (62.8%) |
| $5,000 to $9,999 | 0 (0.0%) | 0 (0.0%) |
| $10,000 to $14,999 | 7 (2.7%) | 0 (0.0%) |
| $15,000 to $19,999 | 6 (2.3%) | 0 (0.0%) |
| $20,000 to $24,999 | 15 (5.7%) | 0 (0.0%) |
| $25,000 to $34,999 | 24 (9.2%) | 2 (1.8%) |
| $35,000 to $49,999 | 29 (11.1%) | 20 (17.7%) |
| $50,000 to $74,999 | 75 (28.6%) | 17 (15.0%) |
| $75,000 to $99,999 | 9 (3.4%) | 3 (2.6%) |
| $100,000 to $149,999 | 31 (11.8%) | 0 (0.0%) |
| $150,000 or more | 25 (9.5%) | 0 (0.0%) |
| Total | 262 (100.0%) | 113 (100.0%) |
Monthly Housing Cost Tiers in Nelliston
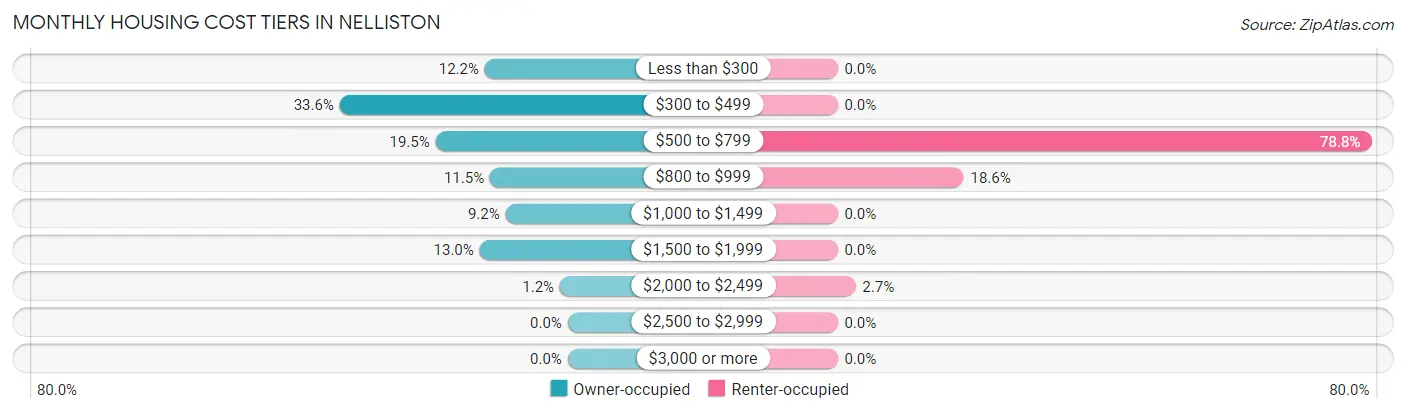
| Monthly Cost | Owner-occupied | Renter-occupied |
| Less than $300 | 32 (12.2%) | 0 (0.0%) |
| $300 to $499 | 88 (33.6%) | 0 (0.0%) |
| $500 to $799 | 51 (19.5%) | 89 (78.8%) |
| $800 to $999 | 30 (11.5%) | 21 (18.6%) |
| $1,000 to $1,499 | 24 (9.2%) | 0 (0.0%) |
| $1,500 to $1,999 | 34 (13.0%) | 0 (0.0%) |
| $2,000 to $2,499 | 3 (1.1%) | 3 (2.6%) |
| $2,500 to $2,999 | 0 (0.0%) | 0 (0.0%) |
| $3,000 or more | 0 (0.0%) | 0 (0.0%) |
| Total | 262 (100.0%) | 113 (100.0%) |
Physical Housing Characteristics in Nelliston
Housing Structures in Nelliston
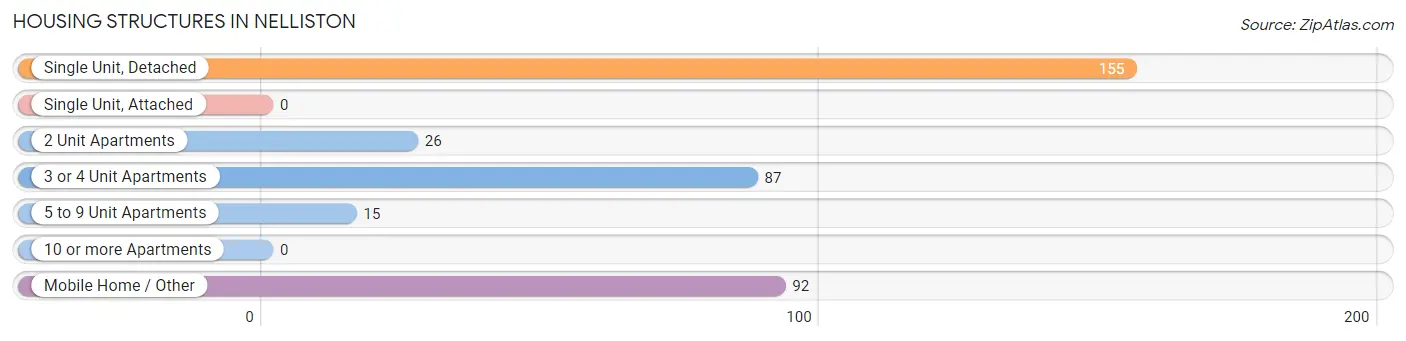
| Structure Type | # Housing Units | % Housing Units |
| Single Unit, Detached | 155 | 41.3% |
| Single Unit, Attached | 0 | 0.0% |
| 2 Unit Apartments | 26 | 6.9% |
| 3 or 4 Unit Apartments | 87 | 23.2% |
| 5 to 9 Unit Apartments | 15 | 4.0% |
| 10 or more Apartments | 0 | 0.0% |
| Mobile Home / Other | 92 | 24.5% |
| Total | 375 | 100.0% |
Housing Structures by Occupancy in Nelliston
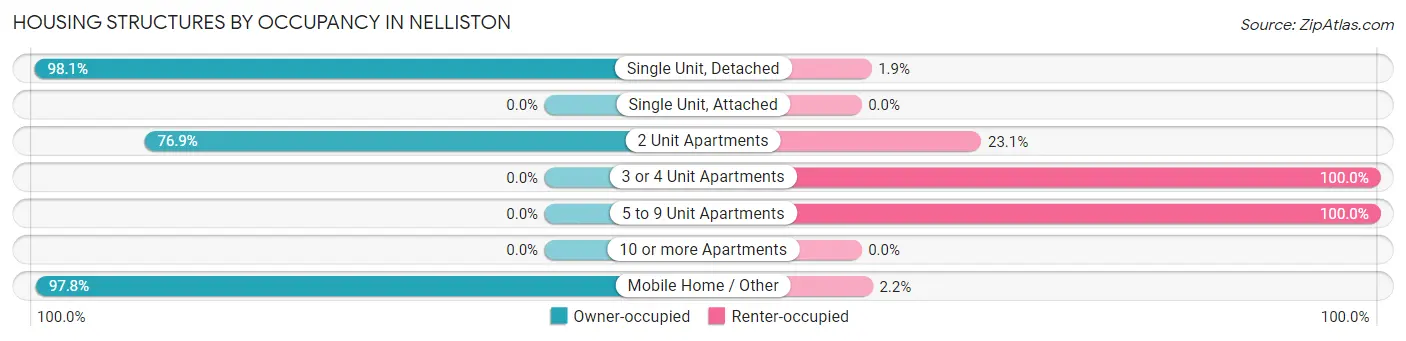
| Structure Type | Owner-occupied | Renter-occupied |
| Single Unit, Detached | 152 (98.1%) | 3 (1.9%) |
| Single Unit, Attached | 0 (0.0%) | 0 (0.0%) |
| 2 Unit Apartments | 20 (76.9%) | 6 (23.1%) |
| 3 or 4 Unit Apartments | 0 (0.0%) | 87 (100.0%) |
| 5 to 9 Unit Apartments | 0 (0.0%) | 15 (100.0%) |
| 10 or more Apartments | 0 (0.0%) | 0 (0.0%) |
| Mobile Home / Other | 90 (97.8%) | 2 (2.2%) |
| Total | 262 (69.9%) | 113 (30.1%) |
Housing Structures by Number of Rooms in Nelliston
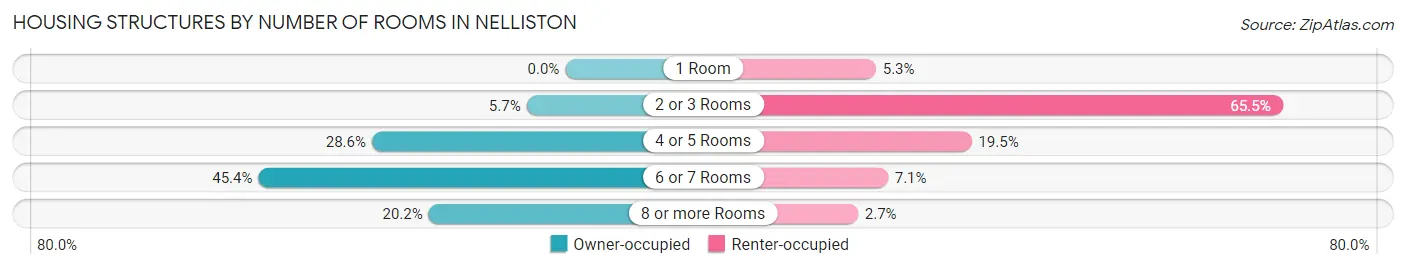
| Number of Rooms | Owner-occupied | Renter-occupied |
| 1 Room | 0 (0.0%) | 6 (5.3%) |
| 2 or 3 Rooms | 15 (5.7%) | 74 (65.5%) |
| 4 or 5 Rooms | 75 (28.6%) | 22 (19.5%) |
| 6 or 7 Rooms | 119 (45.4%) | 8 (7.1%) |
| 8 or more Rooms | 53 (20.2%) | 3 (2.6%) |
| Total | 262 (100.0%) | 113 (100.0%) |
Housing Structure by Heating Type in Nelliston
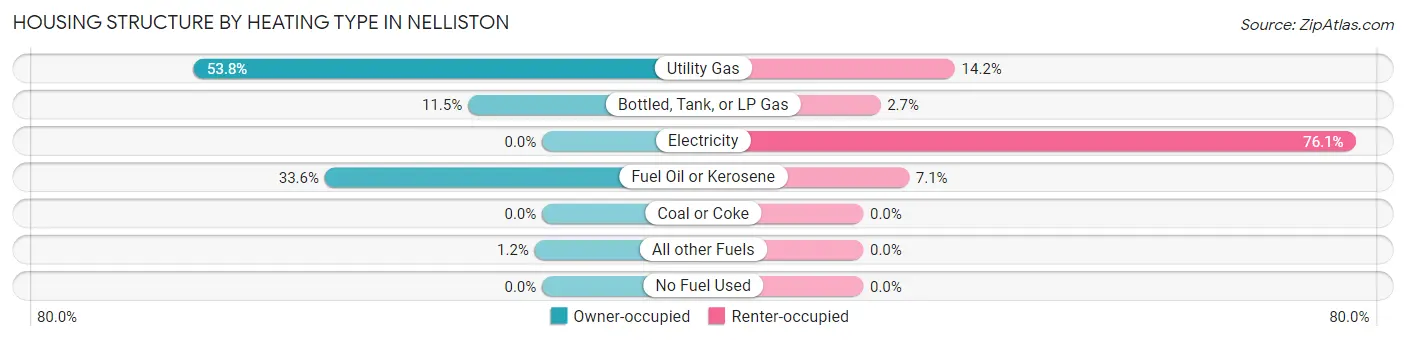
| Heating Type | Owner-occupied | Renter-occupied |
| Utility Gas | 141 (53.8%) | 16 (14.2%) |
| Bottled, Tank, or LP Gas | 30 (11.5%) | 3 (2.6%) |
| Electricity | 0 (0.0%) | 86 (76.1%) |
| Fuel Oil or Kerosene | 88 (33.6%) | 8 (7.1%) |
| Coal or Coke | 0 (0.0%) | 0 (0.0%) |
| All other Fuels | 3 (1.1%) | 0 (0.0%) |
| No Fuel Used | 0 (0.0%) | 0 (0.0%) |
| Total | 262 (100.0%) | 113 (100.0%) |
Household Vehicle Usage in Nelliston
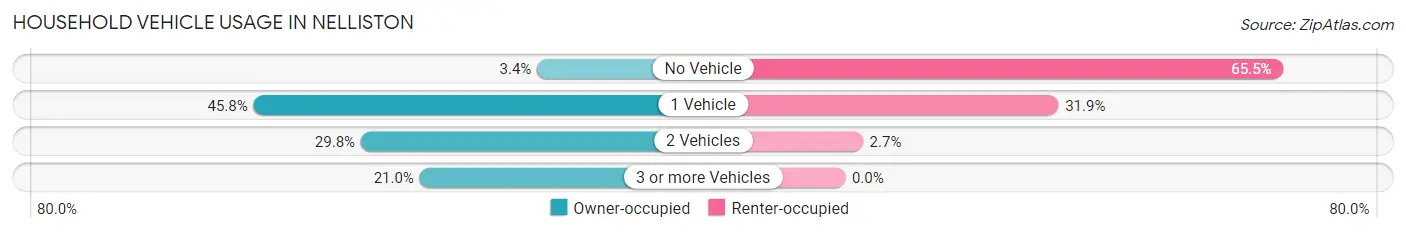
| Vehicles per Household | Owner-occupied | Renter-occupied |
| No Vehicle | 9 (3.4%) | 74 (65.5%) |
| 1 Vehicle | 120 (45.8%) | 36 (31.9%) |
| 2 Vehicles | 78 (29.8%) | 3 (2.6%) |
| 3 or more Vehicles | 55 (21.0%) | 0 (0.0%) |
| Total | 262 (100.0%) | 113 (100.0%) |
Real Estate & Mortgages in Nelliston
Real Estate and Mortgage Overview in Nelliston
| Characteristic | Without Mortgage | With Mortgage |
| Housing Units | 170 | 92 |
| Median Property Value | $41,100 | $0 |
| Median Household Income | $38,750 | $20 |
| Monthly Housing Costs | $436 | $0 |
| Real Estate Taxes | $1,145 | $6 |
Property Value by Mortgage Status in Nelliston
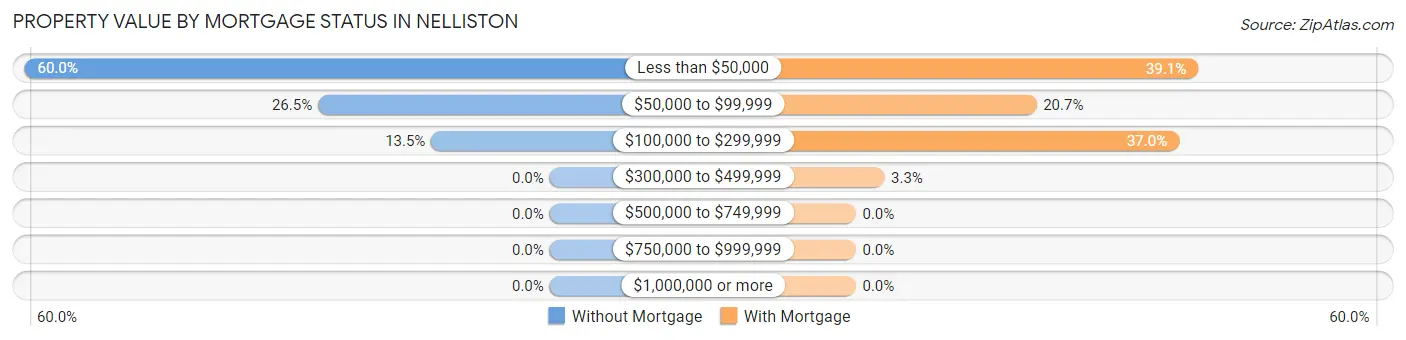
| Property Value | Without Mortgage | With Mortgage |
| Less than $50,000 | 102 (60.0%) | 36 (39.1%) |
| $50,000 to $99,999 | 45 (26.5%) | 19 (20.6%) |
| $100,000 to $299,999 | 23 (13.5%) | 34 (37.0%) |
| $300,000 to $499,999 | 0 (0.0%) | 3 (3.3%) |
| $500,000 to $749,999 | 0 (0.0%) | 0 (0.0%) |
| $750,000 to $999,999 | 0 (0.0%) | 0 (0.0%) |
| $1,000,000 or more | 0 (0.0%) | 0 (0.0%) |
| Total | 170 (100.0%) | 92 (100.0%) |
Household Income by Mortgage Status in Nelliston
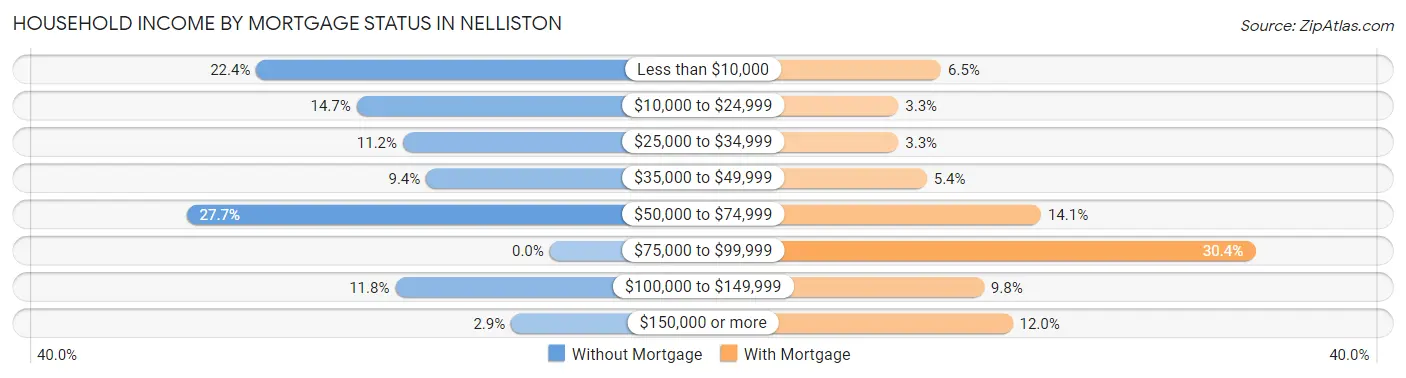
| Household Income | Without Mortgage | With Mortgage |
| Less than $10,000 | 38 (22.4%) | 6 (6.5%) |
| $10,000 to $24,999 | 25 (14.7%) | 3 (3.3%) |
| $25,000 to $34,999 | 19 (11.2%) | 3 (3.3%) |
| $35,000 to $49,999 | 16 (9.4%) | 5 (5.4%) |
| $50,000 to $74,999 | 47 (27.7%) | 13 (14.1%) |
| $75,000 to $99,999 | 0 (0.0%) | 28 (30.4%) |
| $100,000 to $149,999 | 20 (11.8%) | 9 (9.8%) |
| $150,000 or more | 5 (2.9%) | 11 (12.0%) |
| Total | 170 (100.0%) | 92 (100.0%) |
Property Value to Household Income Ratio in Nelliston
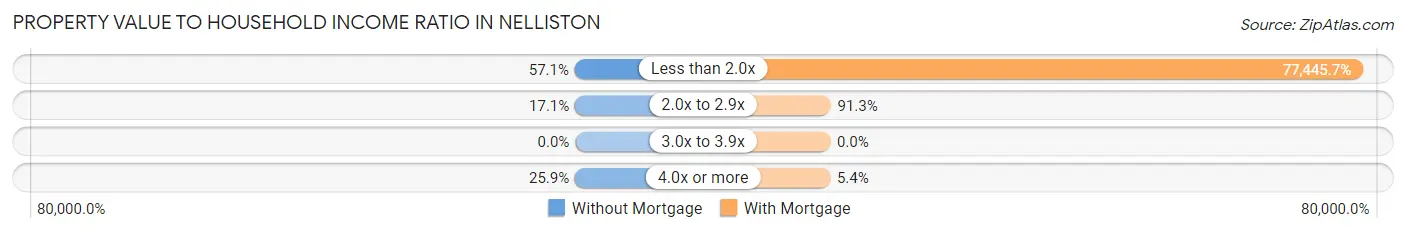
| Value-to-Income Ratio | Without Mortgage | With Mortgage |
| Less than 2.0x | 97 (57.1%) | 71,250 (77,445.7%) |
| 2.0x to 2.9x | 29 (17.1%) | 84 (91.3%) |
| 3.0x to 3.9x | 0 (0.0%) | 0 (0.0%) |
| 4.0x or more | 44 (25.9%) | 5 (5.4%) |
| Total | 170 (100.0%) | 92 (100.0%) |
Real Estate Taxes by Mortgage Status in Nelliston
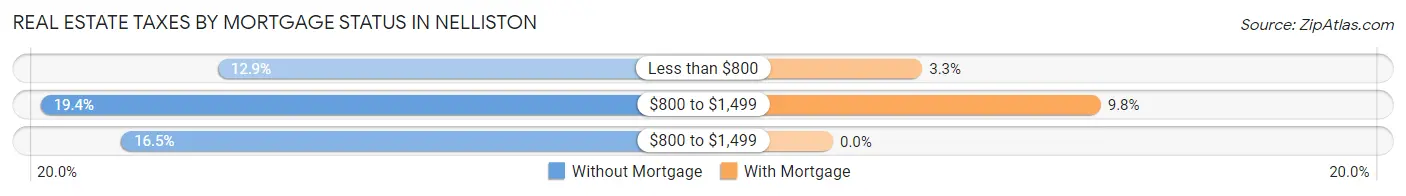
| Property Taxes | Without Mortgage | With Mortgage |
| Less than $800 | 22 (12.9%) | 3 (3.3%) |
| $800 to $1,499 | 33 (19.4%) | 9 (9.8%) |
| $800 to $1,499 | 28 (16.5%) | 0 (0.0%) |
| Total | 170 (100.0%) | 92 (100.0%) |
Health & Disability in Nelliston
Health Insurance Coverage by Age in Nelliston
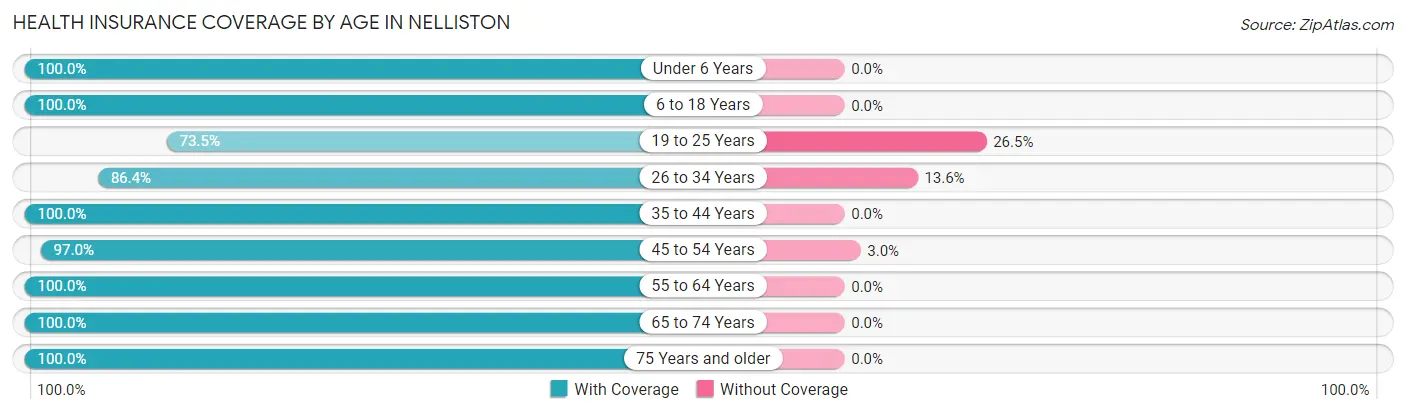
| Age Bracket | With Coverage | Without Coverage |
| Under 6 Years | 27 (100.0%) | 0 (0.0%) |
| 6 to 18 Years | 63 (100.0%) | 0 (0.0%) |
| 19 to 25 Years | 25 (73.5%) | 9 (26.5%) |
| 26 to 34 Years | 57 (86.4%) | 9 (13.6%) |
| 35 to 44 Years | 15 (100.0%) | 0 (0.0%) |
| 45 to 54 Years | 97 (97.0%) | 3 (3.0%) |
| 55 to 64 Years | 162 (100.0%) | 0 (0.0%) |
| 65 to 74 Years | 135 (100.0%) | 0 (0.0%) |
| 75 Years and older | 91 (100.0%) | 0 (0.0%) |
| Total | 672 (97.0%) | 21 (3.0%) |
Health Insurance Coverage by Citizenship Status in Nelliston
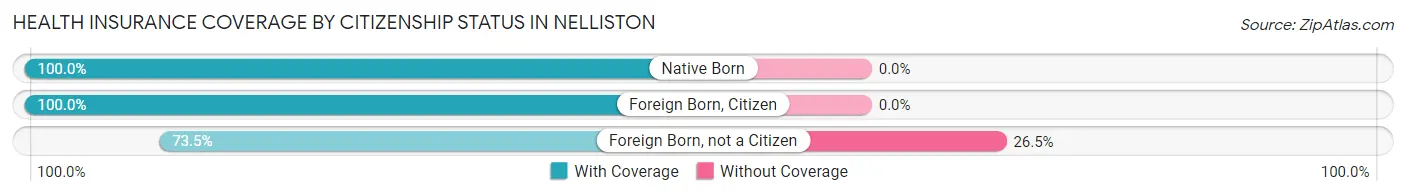
| Citizenship Status | With Coverage | Without Coverage |
| Native Born | 27 (100.0%) | 0 (0.0%) |
| Foreign Born, Citizen | 63 (100.0%) | 0 (0.0%) |
| Foreign Born, not a Citizen | 25 (73.5%) | 9 (26.5%) |
Health Insurance Coverage by Household Income in Nelliston
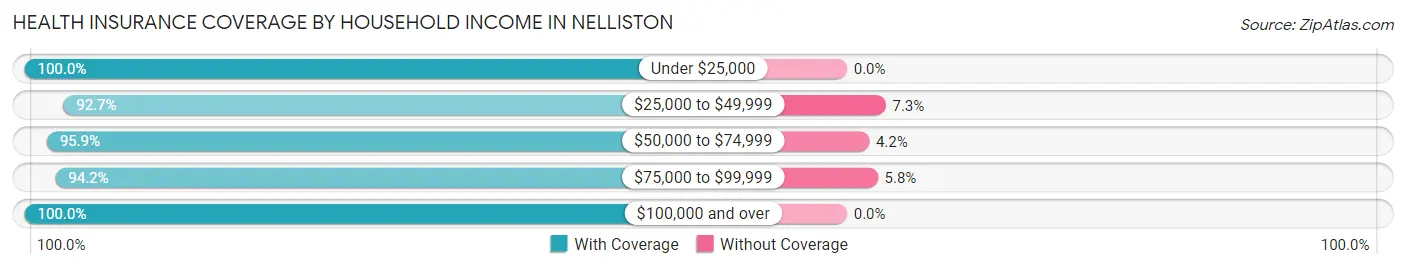
| Household Income | With Coverage | Without Coverage |
| Under $25,000 | 142 (100.0%) | 0 (0.0%) |
| $25,000 to $49,999 | 115 (92.7%) | 9 (7.3%) |
| $50,000 to $74,999 | 208 (95.9%) | 9 (4.2%) |
| $75,000 to $99,999 | 49 (94.2%) | 3 (5.8%) |
| $100,000 and over | 158 (100.0%) | 0 (0.0%) |
Public vs Private Health Insurance Coverage by Age in Nelliston
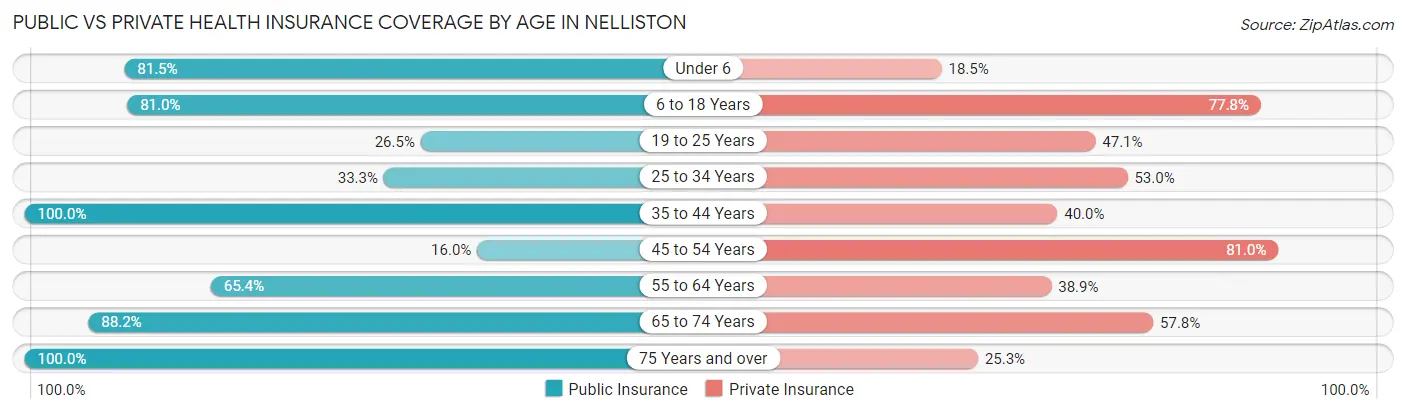
| Age Bracket | Public Insurance | Private Insurance |
| Under 6 | 22 (81.5%) | 5 (18.5%) |
| 6 to 18 Years | 51 (80.9%) | 49 (77.8%) |
| 19 to 25 Years | 9 (26.5%) | 16 (47.1%) |
| 25 to 34 Years | 22 (33.3%) | 35 (53.0%) |
| 35 to 44 Years | 15 (100.0%) | 6 (40.0%) |
| 45 to 54 Years | 16 (16.0%) | 81 (81.0%) |
| 55 to 64 Years | 106 (65.4%) | 63 (38.9%) |
| 65 to 74 Years | 119 (88.1%) | 78 (57.8%) |
| 75 Years and over | 91 (100.0%) | 23 (25.3%) |
| Total | 451 (65.1%) | 356 (51.4%) |
Disability Status by Sex by Age in Nelliston
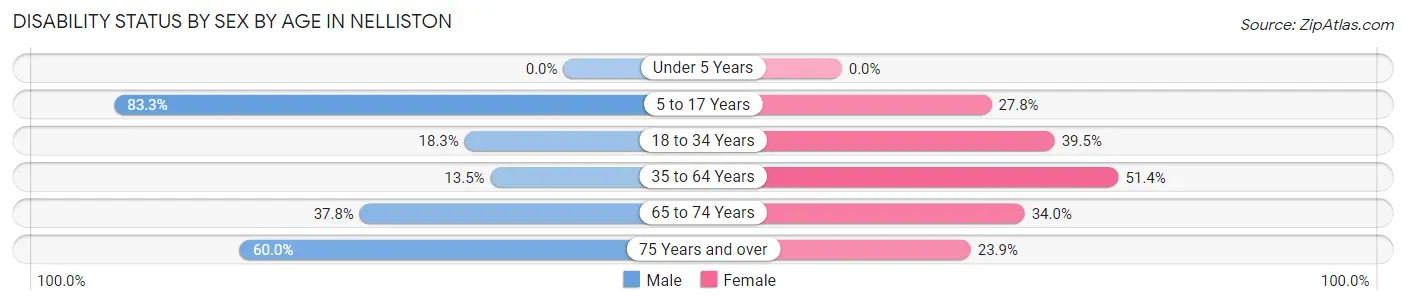
| Age Bracket | Male | Female |
| Under 5 Years | 0 (0.0%) | 0 (0.0%) |
| 5 to 17 Years | 20 (83.3%) | 10 (27.8%) |
| 18 to 34 Years | 11 (18.3%) | 17 (39.5%) |
| 35 to 64 Years | 13 (13.5%) | 93 (51.4%) |
| 65 to 74 Years | 31 (37.8%) | 18 (34.0%) |
| 75 Years and over | 12 (60.0%) | 17 (23.9%) |
Disability Class by Sex by Age in Nelliston
Disability Class: Hearing Difficulty
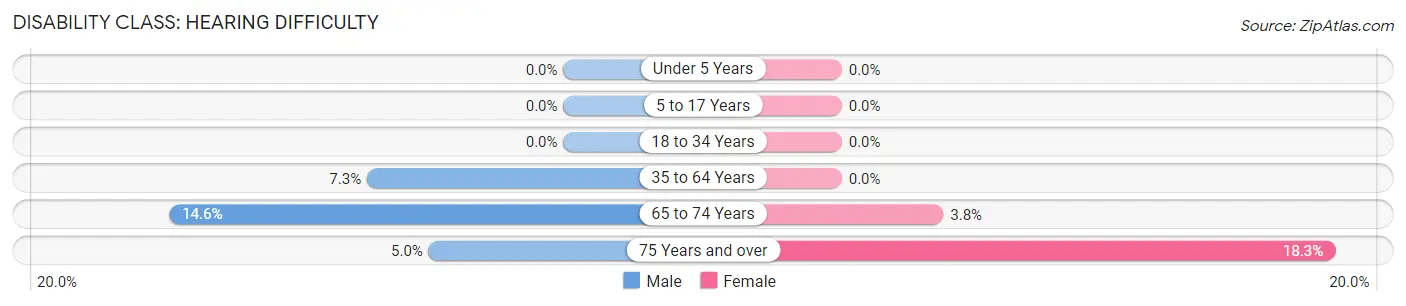
| Age Bracket | Male | Female |
| Under 5 Years | 0 (0.0%) | 0 (0.0%) |
| 5 to 17 Years | 0 (0.0%) | 0 (0.0%) |
| 18 to 34 Years | 0 (0.0%) | 0 (0.0%) |
| 35 to 64 Years | 7 (7.3%) | 0 (0.0%) |
| 65 to 74 Years | 12 (14.6%) | 2 (3.8%) |
| 75 Years and over | 1 (5.0%) | 13 (18.3%) |
Disability Class: Vision Difficulty
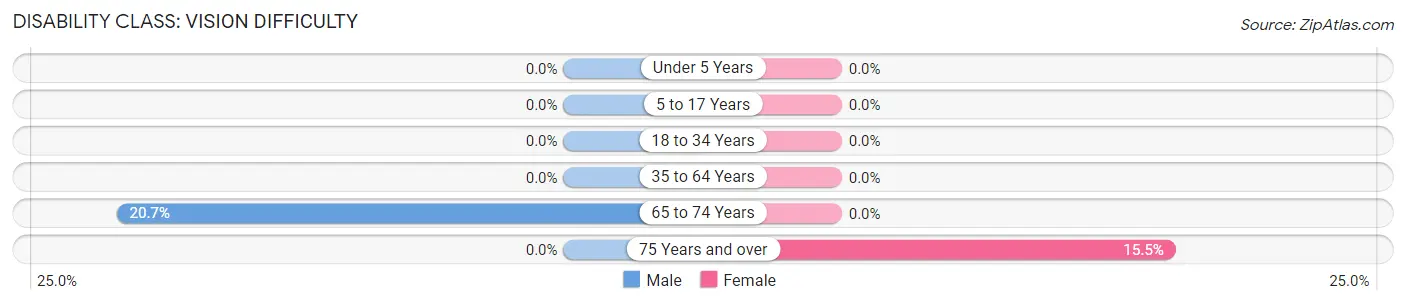
| Age Bracket | Male | Female |
| Under 5 Years | 0 (0.0%) | 0 (0.0%) |
| 5 to 17 Years | 0 (0.0%) | 0 (0.0%) |
| 18 to 34 Years | 0 (0.0%) | 0 (0.0%) |
| 35 to 64 Years | 0 (0.0%) | 0 (0.0%) |
| 65 to 74 Years | 17 (20.7%) | 0 (0.0%) |
| 75 Years and over | 0 (0.0%) | 11 (15.5%) |
Disability Class: Cognitive Difficulty
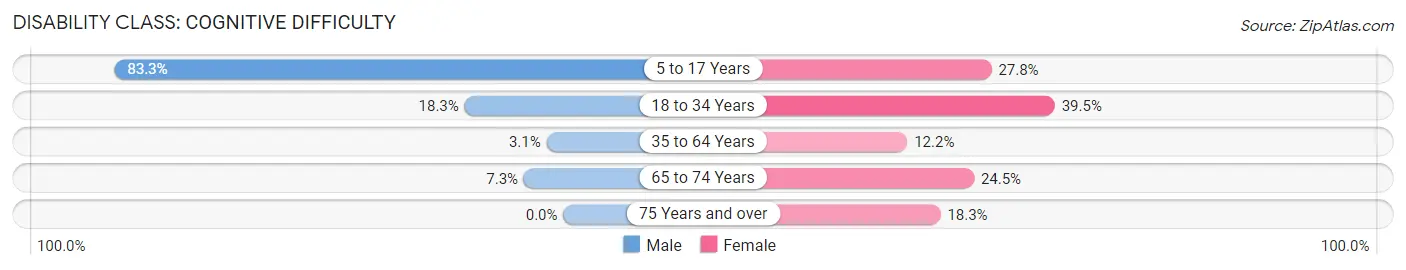
| Age Bracket | Male | Female |
| 5 to 17 Years | 20 (83.3%) | 10 (27.8%) |
| 18 to 34 Years | 11 (18.3%) | 17 (39.5%) |
| 35 to 64 Years | 3 (3.1%) | 22 (12.1%) |
| 65 to 74 Years | 6 (7.3%) | 13 (24.5%) |
| 75 Years and over | 0 (0.0%) | 13 (18.3%) |
Disability Class: Ambulatory Difficulty
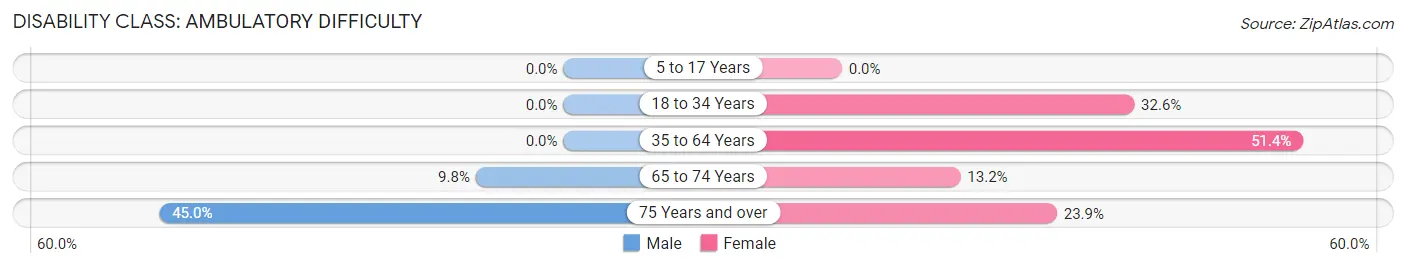
| Age Bracket | Male | Female |
| 5 to 17 Years | 0 (0.0%) | 0 (0.0%) |
| 18 to 34 Years | 0 (0.0%) | 14 (32.6%) |
| 35 to 64 Years | 0 (0.0%) | 93 (51.4%) |
| 65 to 74 Years | 8 (9.8%) | 7 (13.2%) |
| 75 Years and over | 9 (45.0%) | 17 (23.9%) |
Disability Class: Self-Care Difficulty
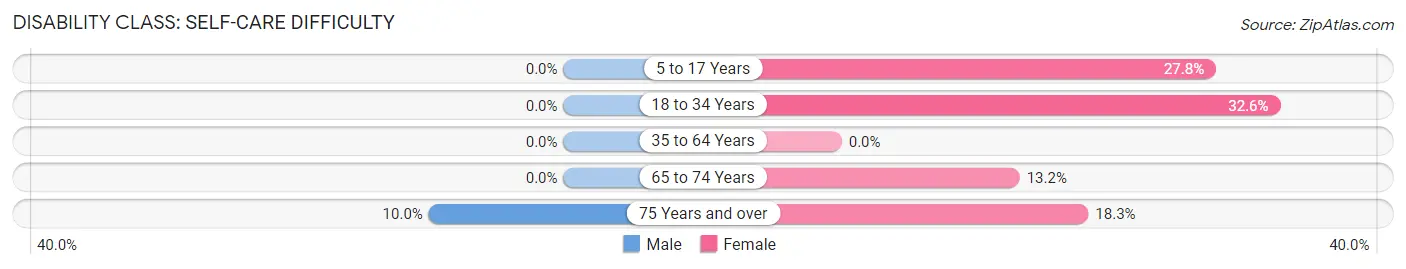
| Age Bracket | Male | Female |
| 5 to 17 Years | 0 (0.0%) | 10 (27.8%) |
| 18 to 34 Years | 0 (0.0%) | 14 (32.6%) |
| 35 to 64 Years | 0 (0.0%) | 0 (0.0%) |
| 65 to 74 Years | 0 (0.0%) | 7 (13.2%) |
| 75 Years and over | 2 (10.0%) | 13 (18.3%) |
Technology Access in Nelliston
Computing Device Access in Nelliston
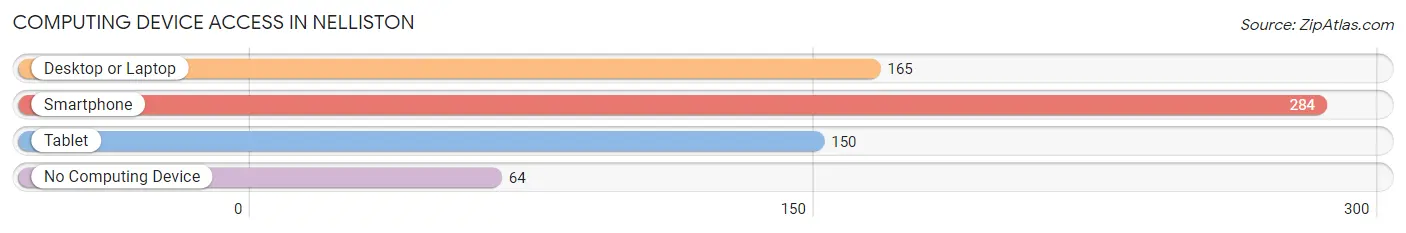
| Device Type | # Households | % Households |
| Desktop or Laptop | 165 | 44.0% |
| Smartphone | 284 | 75.7% |
| Tablet | 150 | 40.0% |
| No Computing Device | 64 | 17.1% |
| Total | 375 | 100.0% |
Internet Access in Nelliston
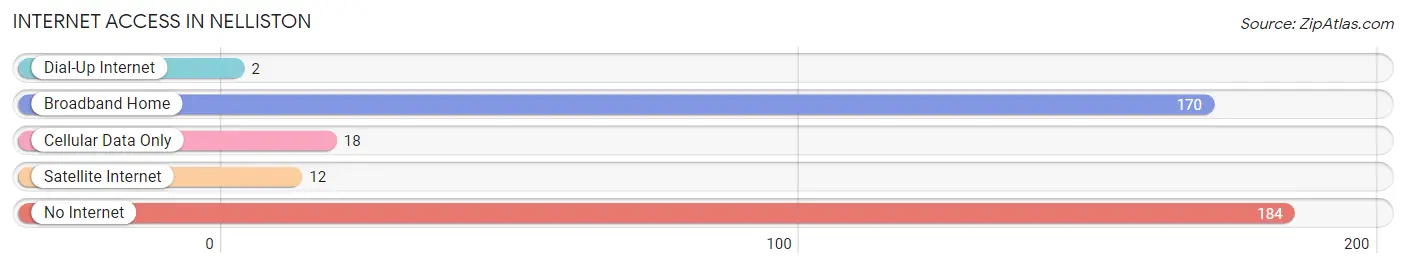
| Internet Type | # Households | % Households |
| Dial-Up Internet | 2 | 0.5% |
| Broadband Home | 170 | 45.3% |
| Cellular Data Only | 18 | 4.8% |
| Satellite Internet | 12 | 3.2% |
| No Internet | 184 | 49.1% |
| Total | 375 | 100.0% |
Nelliston Summary
Nelliston is a small village located in the town of Palatine in Montgomery County, New York. It is situated on the Mohawk River, about 20 miles northwest of the city of Amsterdam. The village has a population of approximately 1,000 people and is part of the Amsterdam-Gloversville-Johnstown Metropolitan Statistical Area.
History
The area that is now Nelliston was first settled in 1725 by Dutch settlers. The village was originally known as “Nellis Town” after the Nellis family, who were among the first settlers. The village was officially incorporated in 1848.
In the late 19th century, Nelliston was a thriving industrial center. It was home to several factories, including a paper mill, a tannery, a grist mill, and a sawmill. The village also had a railroad station, which connected it to the rest of the region.
In the early 20th century, the village began to decline as the factories closed and the railroad station was abandoned. The population of the village decreased significantly, and by the 1950s, the village was largely abandoned.
In the late 20th century, the village began to experience a resurgence. The population began to increase, and new businesses began to open. Today, Nelliston is a small but vibrant village.
Geography
Nelliston is located in the town of Palatine in Montgomery County, New York. It is situated on the Mohawk River, about 20 miles northwest of the city of Amsterdam. The village has a total area of 0.6 square miles, all of which is land.
The village is located in a rural area, surrounded by farmland and forests. The terrain is mostly flat, with some rolling hills. The climate is humid continental, with cold winters and warm summers.
Economy
The economy of Nelliston is largely based on agriculture and tourism. The village is home to several farms, which produce a variety of crops, including corn, soybeans, and hay. The village also has several small businesses, including restaurants, shops, and a bed and breakfast.
Tourism is an important part of the local economy. The village is home to several historic sites, including the Nelliston Historic District, which is listed on the National Register of Historic Places. The village also has several parks and recreational areas, including the Nelliston Nature Preserve.
Demographics
As of the 2010 census, the population of Nelliston was 1,000. The racial makeup of the village was 97.2% White, 0.7% African American, 0.3% Native American, 0.3% Asian, and 1.5% from other races. Hispanic or Latino of any race were 1.5% of the population.
The median household income in Nelliston was $41,250, and the median family income was $50,000. The per capita income was $20,000. About 10.3% of families and 13.2% of the population were below the poverty line.
Common Questions
What is Per Capita Income in Nelliston?
Per Capita income in Nelliston is $27,505.
What is the Median Family Income in Nelliston?
Median Family Income in Nelliston is $67,404.
What is the Median Household income in Nelliston?
Median Household Income in Nelliston is $38,264.
What is Income or Wage Gap in Nelliston?
Income or Wage Gap in Nelliston is 22.8%.
Women in Nelliston earn 77.2 cents for every dollar earned by a man.
What is Inequality or Gini Index in Nelliston?
Inequality or Gini Index in Nelliston is 0.52.
What is the Total Population of Nelliston?
Total Population of Nelliston is 693.
What is the Total Male Population of Nelliston?
Total Male Population of Nelliston is 298.
What is the Total Female Population of Nelliston?
Total Female Population of Nelliston is 395.
What is the Ratio of Males per 100 Females in Nelliston?
There are 75.44 Males per 100 Females in Nelliston.
What is the Ratio of Females per 100 Males in Nelliston?
There are 132.55 Females per 100 Males in Nelliston.
What is the Median Population Age in Nelliston?
Median Population Age in Nelliston is 61.1 Years.
What is the Average Family Size in Nelliston
Average Family Size in Nelliston is 2.7 People.
What is the Average Household Size in Nelliston
Average Household Size in Nelliston is 1.9 People.
How Large is the Labor Force in Nelliston?
There are 280 People in the Labor Forcein in Nelliston.
What is the Percentage of People in the Labor Force in Nelliston?
43.8% of People are in the Labor Force in Nelliston.
What is the Unemployment Rate in Nelliston?
Unemployment Rate in Nelliston is 5.7%.