Zip Codes with the Highest Percentage of Population Employed in Administrative & Support Services in Rome, NY
RELATED REPORTS & OPTIONS
Administrative & Support Services
Rome
Compare Zip Codes
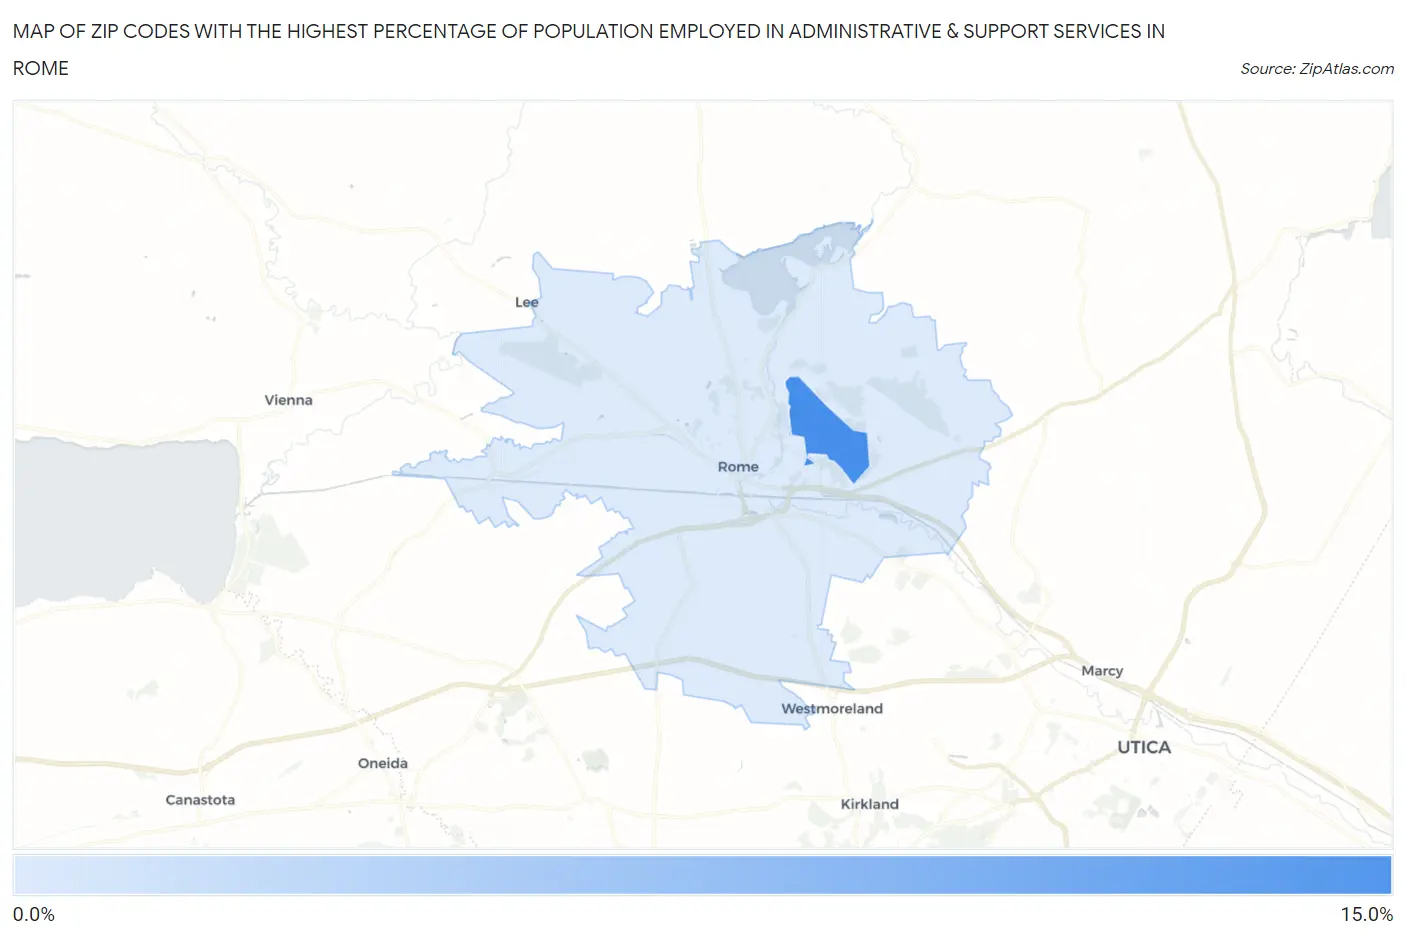
Map of Zip Codes with the Highest Percentage of Population Employed in Administrative & Support Services in Rome
3.1%
14.5%
Zip Codes with the Highest Percentage of Population Employed in Administrative & Support Services in Rome, NY
| Zip Code | % Employed | vs State | vs National | |
| 1. | 13441 | 14.5% | 3.7%(+10.8)#21 | 4.1%(+10.4)#570 |
| 2. | 13440 | 3.1% | 3.7%(-0.568)#727 | 4.1%(-1.03)#14,886 |
1
Common Questions
What are the Top Zip Codes with the Highest Percentage of Population Employed in Administrative & Support Services in Rome, NY?
Top Zip Codes with the Highest Percentage of Population Employed in Administrative & Support Services in Rome, NY are:
What zip code has the Highest Percentage of Population Employed in Administrative & Support Services in Rome, NY?
13441 has the Highest Percentage of Population Employed in Administrative & Support Services in Rome, NY with 14.5%.
What is the Percentage of Population Employed in Administrative & Support Services in Rome, NY?
Percentage of Population Employed in Administrative & Support Services in Rome is 3.3%.
What is the Percentage of Population Employed in Administrative & Support Services in New York?
Percentage of Population Employed in Administrative & Support Services in New York is 3.7%.
What is the Percentage of Population Employed in Administrative & Support Services in the United States?
Percentage of Population Employed in Administrative & Support Services in the United States is 4.1%.