Zip Codes with the Highest Percentage of Families with Income Above $100,000 in Illinois
RELATED REPORTS & OPTIONS
Family Income | $100k+
Illinois
Compare Zip Codes
Map of Zip Codes with the Highest Percentage of Families with Income Above $100,000 in Illinois
60.0%
100.0%
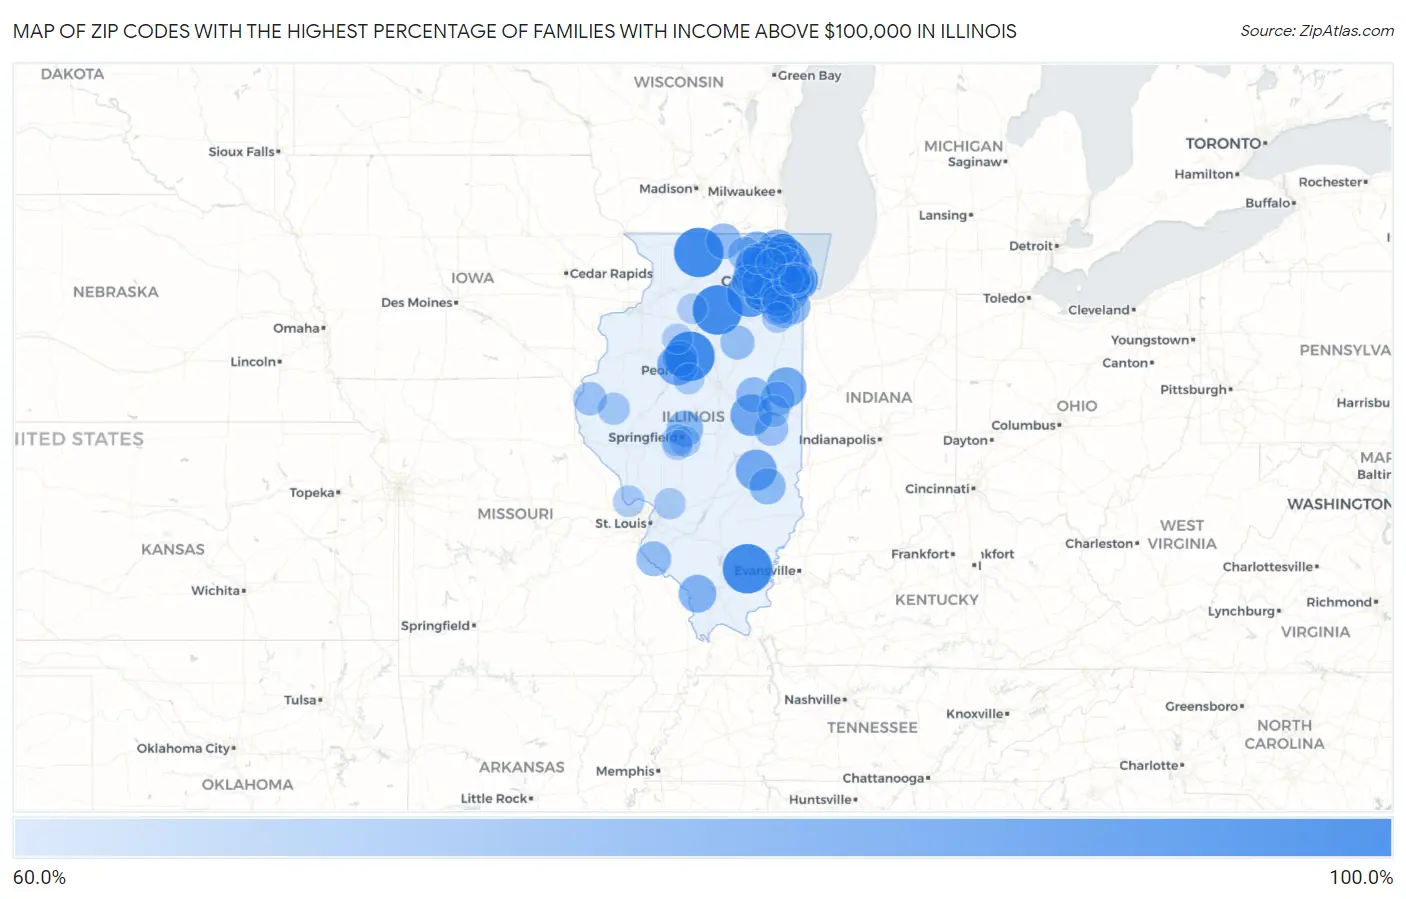
Zip Codes with the Highest Percentage of Families with Income Above $100,000 in Illinois
| Zip Code | Families with Income > $100k | vs State | vs National | |
| 1. | 62829 | 100.0% | 49.7% (+50.3)#1 | 46.1% (+53.9)#103 |
| 2. | 61077 | 100.0% | 49.7% (+50.3)#2 | 46.1% (+53.9)#117 |
| 3. | 61562 | 100.0% | 49.7% (+50.3)#3 | 46.1% (+53.9)#148 |
| 4. | 61371 | 100.0% | 49.7% (+50.3)#4 | 46.1% (+53.9)#155 |
| 5. | 60512 | 94.9% | 49.7% (+45.2)#5 | 46.1% (+48.8)#290 |
| 6. | 60029 | 91.3% | 49.7% (+41.6)#6 | 46.1% (+45.2)#335 |
| 7. | 60603 | 90.5% | 49.7% (+40.8)#7 | 46.1% (+44.4)#351 |
| 8. | 60606 | 88.2% | 49.7% (+38.5)#8 | 46.1% (+42.1)#417 |
| 9. | 60043 | 87.6% | 49.7% (+37.9)#9 | 46.1% (+41.5)#450 |
| 10. | 61875 | 87.3% | 49.7% (+37.6)#10 | 46.1% (+41.2)#464 |
| 11. | 60654 | 87.1% | 49.7% (+37.4)#11 | 46.1% (+41.0)#470 |
| 12. | 60022 | 87.0% | 49.7% (+37.3)#12 | 46.1% (+40.9)#473 |
| 13. | 60184 | 86.7% | 49.7% (+37.0)#13 | 46.1% (+40.6)#488 |
| 14. | 62469 | 86.4% | 49.7% (+36.7)#14 | 46.1% (+40.3)#507 |
| 15. | 60611 | 85.9% | 49.7% (+36.2)#15 | 46.1% (+39.8)#538 |
| 16. | 60661 | 85.9% | 49.7% (+36.2)#16 | 46.1% (+39.8)#540 |
| 17. | 61528 | 85.8% | 49.7% (+36.1)#17 | 46.1% (+39.7)#549 |
| 18. | 60932 | 85.3% | 49.7% (+35.6)#18 | 46.1% (+39.2)#576 |
| 19. | 60558 | 85.0% | 49.7% (+35.3)#19 | 46.1% (+38.9)#590 |
| 20. | 60614 | 84.3% | 49.7% (+34.6)#20 | 46.1% (+38.2)#642 |
| 21. | 60521 | 83.8% | 49.7% (+34.1)#21 | 46.1% (+37.7)#684 |
| 22. | 60069 | 83.5% | 49.7% (+33.8)#22 | 46.1% (+37.4)#704 |
| 23. | 60048 | 82.4% | 49.7% (+32.7)#23 | 46.1% (+36.3)#777 |
| 24. | 60015 | 81.7% | 49.7% (+32.0)#24 | 46.1% (+35.6)#834 |
| 25. | 60091 | 81.7% | 49.7% (+32.0)#25 | 46.1% (+35.6)#835 |
| 26. | 60175 | 81.6% | 49.7% (+31.9)#26 | 46.1% (+35.5)#852 |
| 27. | 60305 | 81.6% | 49.7% (+31.9)#27 | 46.1% (+35.5)#854 |
| 28. | 60045 | 81.5% | 49.7% (+31.8)#28 | 46.1% (+35.4)#859 |
| 29. | 62975 | 81.3% | 49.7% (+31.6)#29 | 46.1% (+35.2)#892 |
| 30. | 60035 | 81.2% | 49.7% (+31.5)#30 | 46.1% (+35.1)#899 |
| 31. | 60657 | 81.0% | 49.7% (+31.3)#31 | 46.1% (+34.9)#911 |
| 32. | 60601 | 81.0% | 49.7% (+31.3)#32 | 46.1% (+34.9)#914 |
| 33. | 60093 | 80.8% | 49.7% (+31.1)#33 | 46.1% (+34.7)#936 |
| 34. | 60564 | 80.7% | 49.7% (+31.0)#34 | 46.1% (+34.6)#948 |
| 35. | 60012 | 80.2% | 49.7% (+30.5)#35 | 46.1% (+34.1)#1,007 |
| 36. | 60203 | 80.2% | 49.7% (+30.5)#36 | 46.1% (+34.1)#1,012 |
| 37. | 60540 | 79.9% | 49.7% (+30.2)#37 | 46.1% (+33.8)#1,041 |
| 38. | 60047 | 79.8% | 49.7% (+30.1)#38 | 46.1% (+33.7)#1,045 |
| 39. | 60605 | 79.8% | 49.7% (+30.1)#39 | 46.1% (+33.7)#1,046 |
| 40. | 60464 | 79.7% | 49.7% (+30.0)#40 | 46.1% (+33.6)#1,058 |
| 41. | 60010 | 79.4% | 49.7% (+29.7)#41 | 46.1% (+33.3)#1,087 |
| 42. | 60124 | 79.4% | 49.7% (+29.7)#42 | 46.1% (+33.3)#1,089 |
| 43. | 62684 | 79.2% | 49.7% (+29.5)#43 | 46.1% (+33.1)#1,119 |
| 44. | 62432 | 79.1% | 49.7% (+29.4)#44 | 46.1% (+33.0)#1,136 |
| 45. | 60304 | 78.5% | 49.7% (+28.8)#45 | 46.1% (+32.4)#1,205 |
| 46. | 60422 | 78.5% | 49.7% (+28.8)#46 | 46.1% (+32.4)#1,209 |
| 47. | 60192 | 78.1% | 49.7% (+28.4)#47 | 46.1% (+32.0)#1,247 |
| 48. | 60585 | 77.9% | 49.7% (+28.2)#48 | 46.1% (+31.8)#1,269 |
| 49. | 61525 | 77.7% | 49.7% (+28.0)#49 | 46.1% (+31.6)#1,305 |
| 50. | 61011 | 77.7% | 49.7% (+28.0)#50 | 46.1% (+31.6)#1,308 |
| 51. | 61845 | 77.6% | 49.7% (+27.9)#51 | 46.1% (+31.5)#1,333 |
| 52. | 60490 | 77.5% | 49.7% (+27.8)#52 | 46.1% (+31.4)#1,337 |
| 53. | 60026 | 77.0% | 49.7% (+27.3)#53 | 46.1% (+30.9)#1,403 |
| 54. | 60134 | 76.9% | 49.7% (+27.2)#54 | 46.1% (+30.8)#1,410 |
| 55. | 62279 | 76.9% | 49.7% (+27.2)#55 | 46.1% (+30.8)#1,423 |
| 56. | 60565 | 76.7% | 49.7% (+27.0)#56 | 46.1% (+30.6)#1,448 |
| 57. | 61862 | 76.4% | 49.7% (+26.7)#57 | 46.1% (+30.3)#1,495 |
| 58. | 60515 | 76.1% | 49.7% (+26.4)#58 | 46.1% (+30.0)#1,544 |
| 59. | 60502 | 76.0% | 49.7% (+26.3)#59 | 46.1% (+29.9)#1,558 |
| 60. | 60190 | 76.0% | 49.7% (+26.3)#60 | 46.1% (+29.9)#1,562 |
| 61. | 61313 | 75.8% | 49.7% (+26.1)#61 | 46.1% (+29.7)#1,599 |
| 62. | 60180 | 75.5% | 49.7% (+25.8)#62 | 46.1% (+29.4)#1,633 |
| 63. | 61852 | 75.5% | 49.7% (+25.8)#63 | 46.1% (+29.4)#1,636 |
| 64. | 60136 | 74.8% | 49.7% (+25.1)#64 | 46.1% (+28.7)#1,741 |
| 65. | 60126 | 74.6% | 49.7% (+24.9)#65 | 46.1% (+28.5)#1,754 |
| 66. | 62313 | 74.6% | 49.7% (+24.9)#66 | 46.1% (+28.5)#1,773 |
| 67. | 60655 | 74.5% | 49.7% (+24.8)#67 | 46.1% (+28.4)#1,778 |
| 68. | 60137 | 74.4% | 49.7% (+24.7)#68 | 46.1% (+28.3)#1,794 |
| 69. | 60423 | 74.4% | 49.7% (+24.7)#69 | 46.1% (+28.3)#1,795 |
| 70. | 60526 | 74.4% | 49.7% (+24.7)#70 | 46.1% (+28.3)#1,801 |
| 71. | 60062 | 74.2% | 49.7% (+24.5)#71 | 46.1% (+28.1)#1,836 |
| 72. | 60068 | 74.2% | 49.7% (+24.5)#72 | 46.1% (+28.1)#1,838 |
| 73. | 60451 | 73.5% | 49.7% (+23.8)#73 | 46.1% (+27.4)#1,944 |
| 74. | 60503 | 73.2% | 49.7% (+23.5)#74 | 46.1% (+27.1)#2,010 |
| 75. | 60610 | 73.1% | 49.7% (+23.4)#75 | 46.1% (+27.0)#2,018 |
| 76. | 62344 | 72.7% | 49.7% (+23.0)#76 | 46.1% (+26.6)#2,112 |
| 77. | 60089 | 72.5% | 49.7% (+22.8)#77 | 46.1% (+26.4)#2,130 |
| 78. | 60448 | 72.5% | 49.7% (+22.8)#78 | 46.1% (+26.4)#2,135 |
| 79. | 61873 | 72.3% | 49.7% (+22.6)#79 | 46.1% (+26.2)#2,177 |
| 80. | 60189 | 71.9% | 49.7% (+22.2)#80 | 46.1% (+25.8)#2,236 |
| 81. | 62711 | 71.9% | 49.7% (+22.2)#81 | 46.1% (+25.8)#2,240 |
| 82. | 60119 | 71.8% | 49.7% (+22.1)#82 | 46.1% (+25.7)#2,263 |
| 83. | 60201 | 71.7% | 49.7% (+22.0)#83 | 46.1% (+25.6)#2,271 |
| 84. | 60510 | 71.7% | 49.7% (+22.0)#84 | 46.1% (+25.6)#2,275 |
| 85. | 62036 | 71.7% | 49.7% (+22.0)#85 | 46.1% (+25.6)#2,288 |
| 86. | 60439 | 71.3% | 49.7% (+21.6)#86 | 46.1% (+25.2)#2,347 |
| 87. | 62046 | 71.3% | 49.7% (+21.6)#87 | 46.1% (+25.2)#2,353 |
| 88. | 60607 | 71.1% | 49.7% (+21.4)#88 | 46.1% (+25.0)#2,381 |
| 89. | 60491 | 70.9% | 49.7% (+21.2)#89 | 46.1% (+24.8)#2,425 |
| 90. | 61535 | 70.8% | 49.7% (+21.1)#90 | 46.1% (+24.7)#2,447 |
| 91. | 60302 | 70.7% | 49.7% (+21.0)#91 | 46.1% (+24.6)#2,457 |
| 92. | 62712 | 70.7% | 49.7% (+21.0)#92 | 46.1% (+24.6)#2,465 |
| 93. | 60642 | 70.4% | 49.7% (+20.7)#93 | 46.1% (+24.3)#2,521 |
| 94. | 60442 | 70.4% | 49.7% (+20.7)#94 | 46.1% (+24.3)#2,525 |
| 95. | 60102 | 70.2% | 49.7% (+20.5)#95 | 46.1% (+24.1)#2,556 |
| 96. | 61426 | 70.0% | 49.7% (+20.3)#96 | 46.1% (+23.9)#2,607 |
| 97. | 61328 | 70.0% | 49.7% (+20.3)#97 | 46.1% (+23.9)#2,609 |
| 98. | 62629 | 69.9% | 49.7% (+20.2)#98 | 46.1% (+23.8)#2,624 |
| 99. | 60044 | 69.9% | 49.7% (+20.2)#99 | 46.1% (+23.8)#2,626 |
| 100. | 60067 | 69.8% | 49.7% (+20.1)#100 | 46.1% (+23.7)#2,639 |
Common Questions
What are the Top 10 Zip Codes with the Highest Percentage of Families with Income Above $100,000 in Illinois?
Top 10 Zip Codes with the Highest Percentage of Families with Income Above $100,000 in Illinois are:
What zip code has the Highest Percentage of Families with Income Above $100,000 in Illinois?
62829 has the Highest Percentage of Families with Income Above $100,000 in Illinois with 100.0%.
What is the Percentage of Families with Income Above $100,000 in the State of Illinois?
Percentage of Families with Income Above $100,000 in Illinois is 49.7%.
What is the Percentage of Families with Income Above $100,000 in the United States?
Percentage of Families with Income Above $100,000 in the United States is 46.1%.