Mokena, IL Map & Demographics
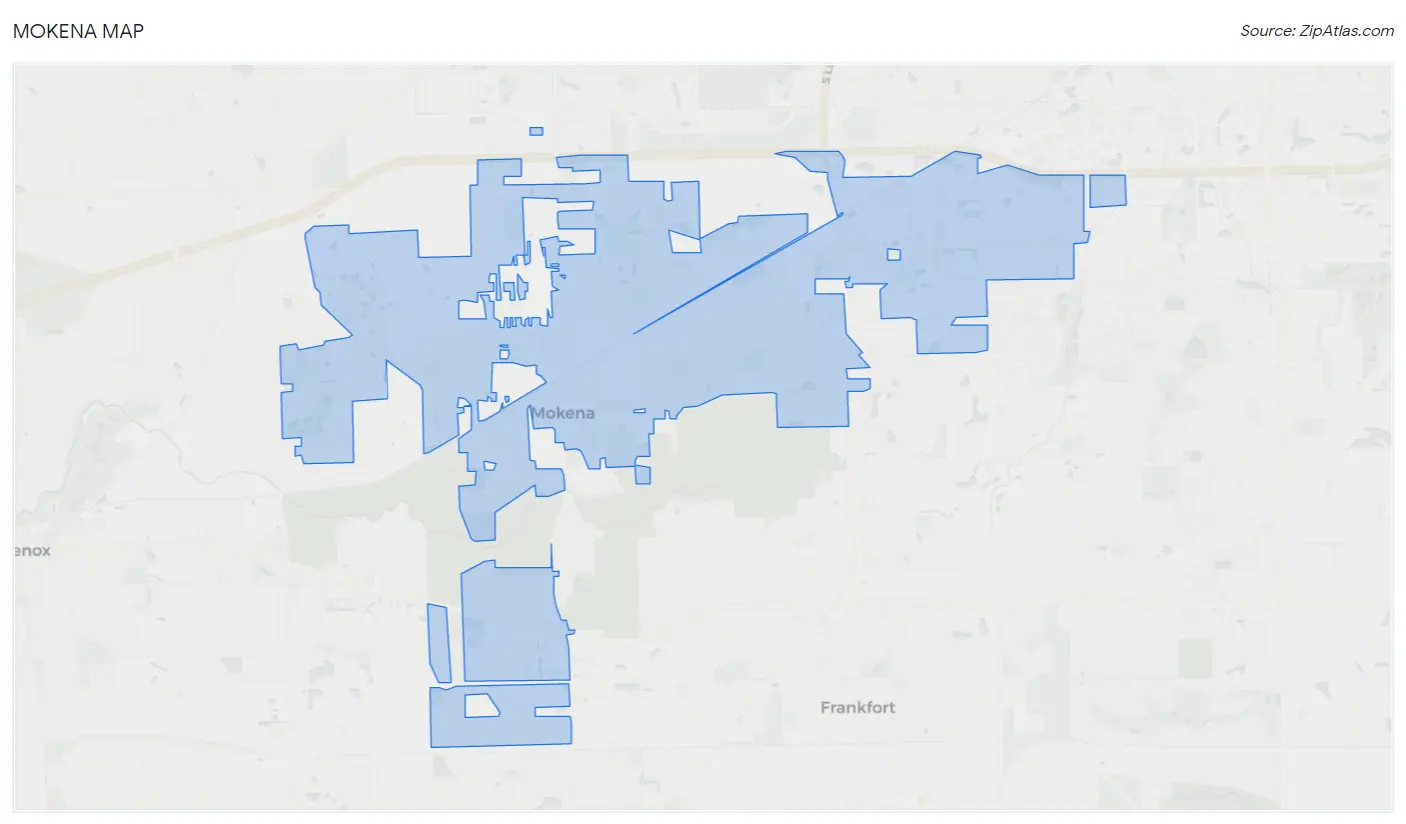
Mokena Map
Mokena Overview
$52,631
PER CAPITA INCOME
$147,826
AVG FAMILY INCOME
$122,235
AVG HOUSEHOLD INCOME
27.8%
WAGE / INCOME GAP [ % ]
72.2¢/ $1
WAGE / INCOME GAP [ $ ]
$9,417
FAMILY INCOME DEFICIT
0.37
INEQUALITY / GINI INDEX
19,886
TOTAL POPULATION
9,930
MALE POPULATION
9,956
FEMALE POPULATION
99.74
MALES / 100 FEMALES
100.26
FEMALES / 100 MALES
43.1
MEDIAN AGE
3.2
AVG FAMILY SIZE
2.7
AVG HOUSEHOLD SIZE
11,446
LABOR FORCE [ PEOPLE ]
70.7%
PERCENT IN LABOR FORCE
3.4%
UNEMPLOYMENT RATE
Mokena Zip Codes
Mokena Area Codes
Income in Mokena
Income Overview in Mokena
Per Capita Income in Mokena is $52,631, while median incomes of families and households are $147,826 and $122,235 respectively.
| Characteristic | Number | Measure |
| Per Capita Income | 19,886 | $52,631 |
| Median Family Income | 5,556 | $147,826 |
| Mean Family Income | 5,556 | $162,808 |
| Median Household Income | 7,299 | $122,235 |
| Mean Household Income | 7,299 | $141,678 |
| Income Deficit | 5,556 | $9,417 |
| Wage / Income Gap (%) | 19,886 | 27.76% |
| Wage / Income Gap ($) | 19,886 | 72.24¢ per $1 |
| Gini / Inequality Index | 19,886 | 0.37 |
Earnings by Sex in Mokena
Average Earnings in Mokena are $55,929, $63,883 for men and $46,152 for women, a difference of 27.8%.
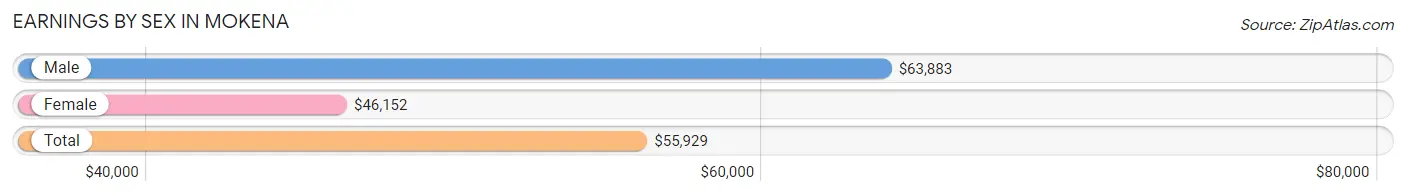
| Sex | Number | Average Earnings |
| Male | 6,199 (52.6%) | $63,883 |
| Female | 5,591 (47.4%) | $46,152 |
| Total | 11,790 (100.0%) | $55,929 |
Earnings by Sex by Income Bracket in Mokena
The most common earnings brackets in Mokena are $100,000+ for men (2,191 | 35.3%) and $100,000+ for women (850 | 15.2%).
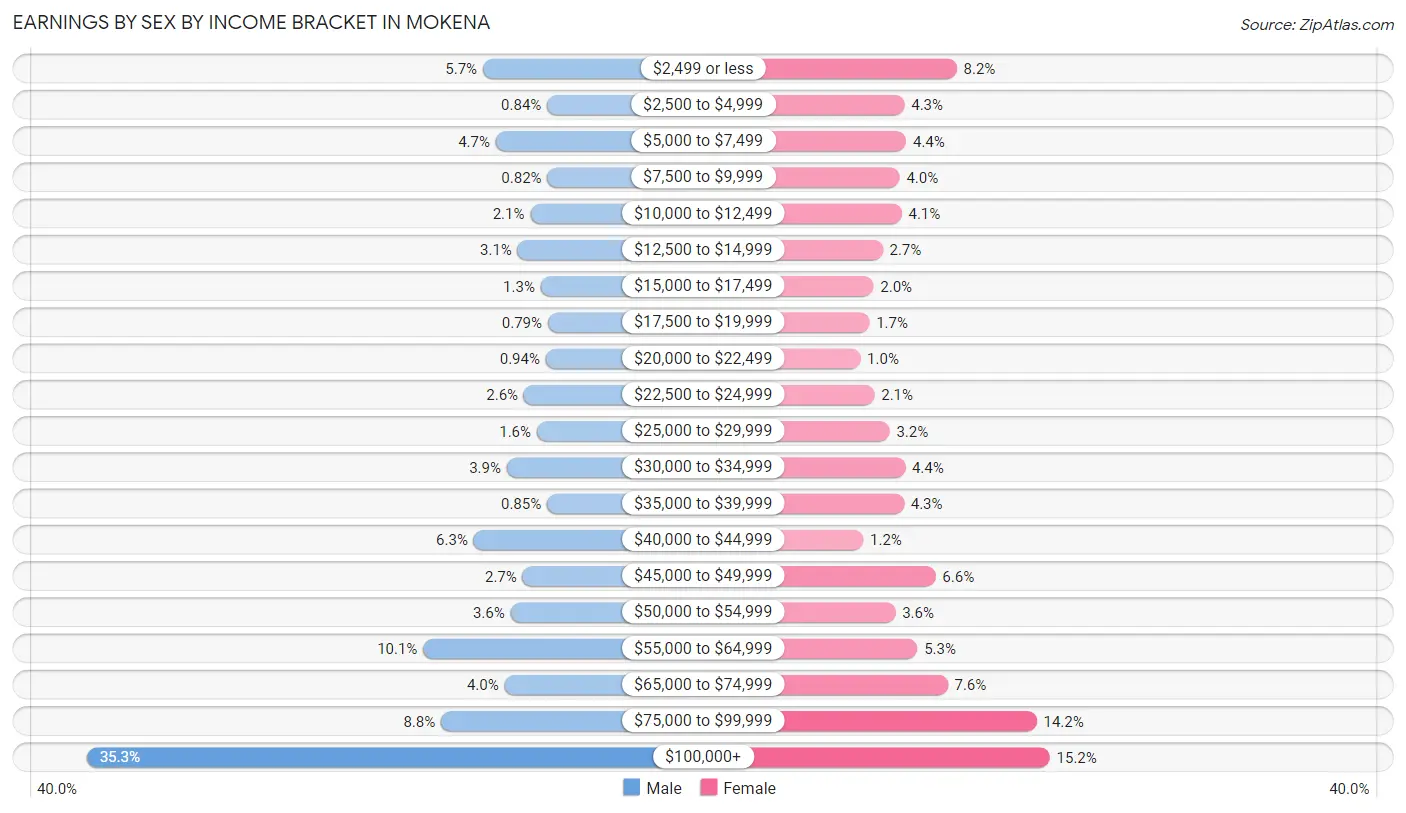
| Income | Male | Female |
| $2,499 or less | 350 (5.7%) | 460 (8.2%) |
| $2,500 to $4,999 | 52 (0.8%) | 241 (4.3%) |
| $5,000 to $7,499 | 291 (4.7%) | 248 (4.4%) |
| $7,500 to $9,999 | 51 (0.8%) | 221 (4.0%) |
| $10,000 to $12,499 | 130 (2.1%) | 229 (4.1%) |
| $12,500 to $14,999 | 189 (3.0%) | 150 (2.7%) |
| $15,000 to $17,499 | 82 (1.3%) | 111 (2.0%) |
| $17,500 to $19,999 | 49 (0.8%) | 94 (1.7%) |
| $20,000 to $22,499 | 58 (0.9%) | 56 (1.0%) |
| $22,500 to $24,999 | 160 (2.6%) | 115 (2.1%) |
| $25,000 to $29,999 | 100 (1.6%) | 179 (3.2%) |
| $30,000 to $34,999 | 239 (3.9%) | 244 (4.4%) |
| $35,000 to $39,999 | 53 (0.9%) | 239 (4.3%) |
| $40,000 to $44,999 | 393 (6.3%) | 68 (1.2%) |
| $45,000 to $49,999 | 166 (2.7%) | 371 (6.6%) |
| $50,000 to $54,999 | 222 (3.6%) | 203 (3.6%) |
| $55,000 to $64,999 | 628 (10.1%) | 295 (5.3%) |
| $65,000 to $74,999 | 250 (4.0%) | 422 (7.5%) |
| $75,000 to $99,999 | 545 (8.8%) | 795 (14.2%) |
| $100,000+ | 2,191 (35.3%) | 850 (15.2%) |
| Total | 6,199 (100.0%) | 5,591 (100.0%) |
Earnings by Sex by Educational Attainment in Mokena
Average earnings in Mokena are $76,952 for men and $54,335 for women, a difference of 29.4%. Men with an educational attainment of graduate degree enjoy the highest average annual earnings of $132,031, while those with high school diploma education earn the least with $58,167. Women with an educational attainment of graduate degree earn the most with the average annual earnings of $77,457, while those with less than high school education have the smallest earnings of $9,489.
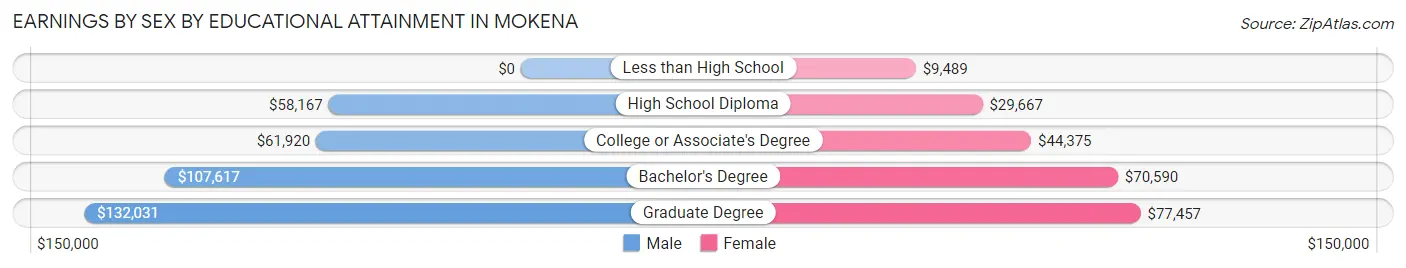
| Educational Attainment | Male Income | Female Income |
| Less than High School | - | - |
| High School Diploma | $58,167 | $29,667 |
| College or Associate's Degree | $61,920 | $44,375 |
| Bachelor's Degree | $107,617 | $70,590 |
| Graduate Degree | $132,031 | $77,457 |
| Total | $76,952 | $54,335 |
Family Income in Mokena
Family Income Brackets in Mokena
According to the Mokena family income data, there are 1,461 families falling into the $100,000 to $149,999 income range, which is the most common income bracket and makes up 26.3% of all families. Conversely, the $10,000 to $14,999 income bracket is the least frequent group with only 11 families (0.2%) belonging to this category.
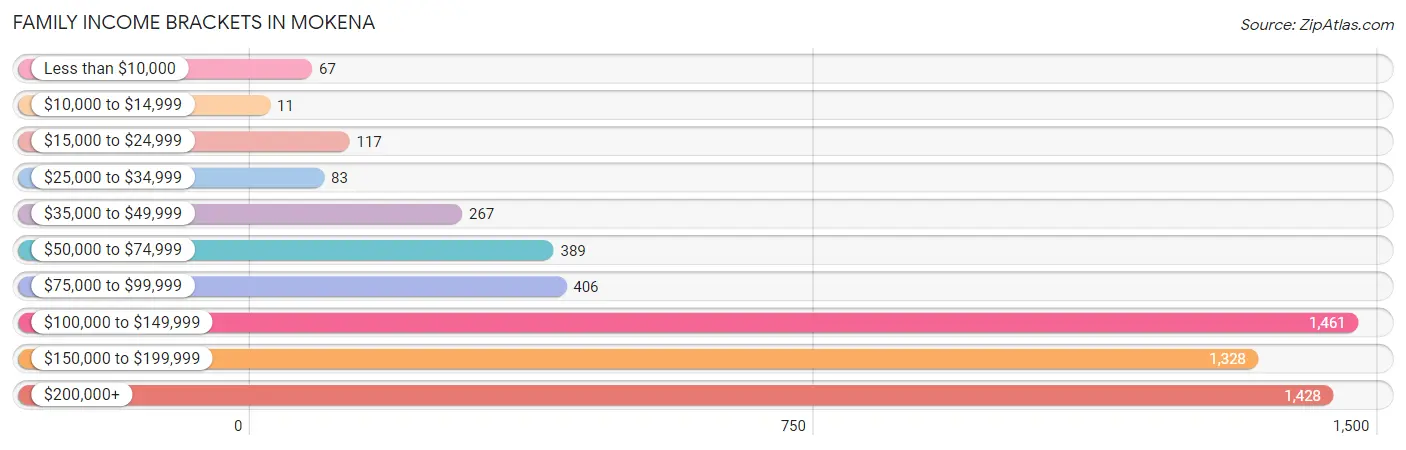
| Income Bracket | # Families | % Families |
| Less than $10,000 | 67 | 1.2% |
| $10,000 to $14,999 | 11 | 0.2% |
| $15,000 to $24,999 | 117 | 2.1% |
| $25,000 to $34,999 | 83 | 1.5% |
| $35,000 to $49,999 | 267 | 4.8% |
| $50,000 to $74,999 | 389 | 7.0% |
| $75,000 to $99,999 | 406 | 7.3% |
| $100,000 to $149,999 | 1,461 | 26.3% |
| $150,000 to $199,999 | 1,328 | 23.9% |
| $200,000+ | 1,428 | 25.7% |
Family Income by Famaliy Size in Mokena
5-person families (401 | 7.2%) account for the highest median family income in Mokena with $186,354 per family, while 2-person families (2,212 | 39.8%) have the highest median income of $59,890 per family member.
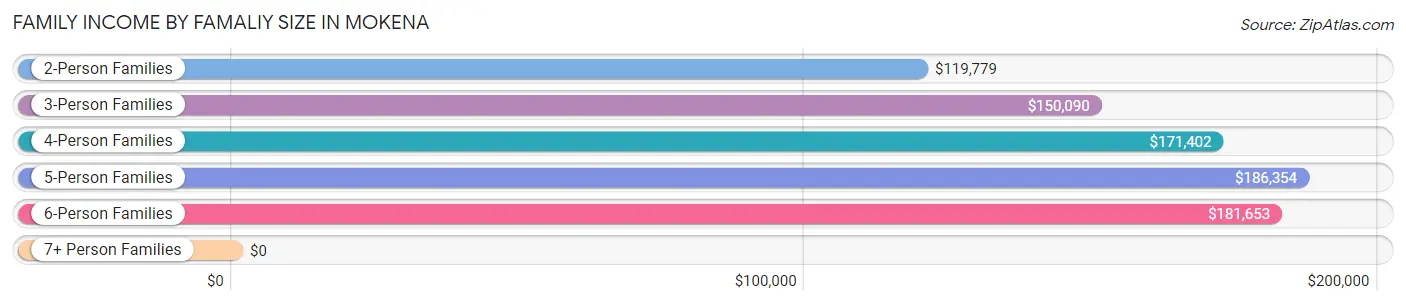
| Income Bracket | # Families | Median Income |
| 2-Person Families | 2,212 (39.8%) | $119,779 |
| 3-Person Families | 1,547 (27.8%) | $150,090 |
| 4-Person Families | 1,169 (21.0%) | $171,402 |
| 5-Person Families | 401 (7.2%) | $186,354 |
| 6-Person Families | 184 (3.3%) | $181,653 |
| 7+ Person Families | 43 (0.8%) | $0 |
| Total | 5,556 (100.0%) | $147,826 |
Family Income by Number of Earners in Mokena
The median family income in Mokena is $147,826, with families comprising 3+ earners (1,205) having the highest median family income of $165,858, while families with no earners (696) have the lowest median family income of $107,375, accounting for 21.7% and 12.5% of families, respectively.
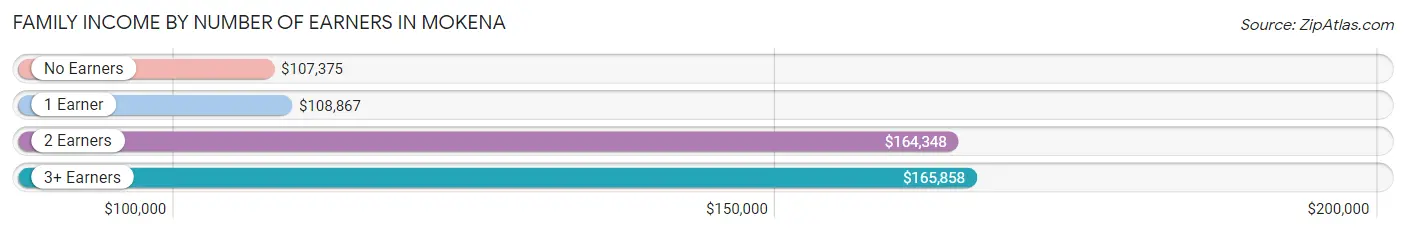
| Number of Earners | # Families | Median Income |
| No Earners | 696 (12.5%) | $107,375 |
| 1 Earner | 1,219 (21.9%) | $108,867 |
| 2 Earners | 2,436 (43.8%) | $164,348 |
| 3+ Earners | 1,205 (21.7%) | $165,858 |
| Total | 5,556 (100.0%) | $147,826 |
Household Income in Mokena
Household Income Brackets in Mokena
With 1,796 households falling in the category, the $100,000 to $149,999 income range is the most frequent in Mokena, accounting for 24.6% of all households. In contrast, only 66 households (0.9%) fall into the $10,000 to $14,999 income bracket, making it the least populous group.
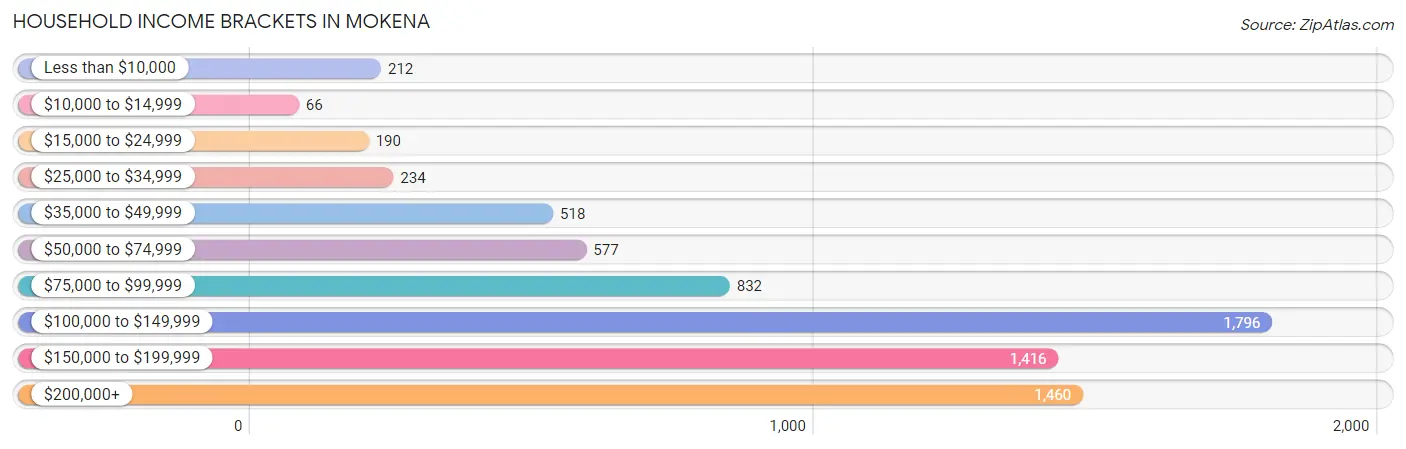
| Income Bracket | # Households | % Households |
| Less than $10,000 | 212 | 2.9% |
| $10,000 to $14,999 | 66 | 0.9% |
| $15,000 to $24,999 | 190 | 2.6% |
| $25,000 to $34,999 | 234 | 3.2% |
| $35,000 to $49,999 | 518 | 7.1% |
| $50,000 to $74,999 | 577 | 7.9% |
| $75,000 to $99,999 | 832 | 11.4% |
| $100,000 to $149,999 | 1,796 | 24.6% |
| $150,000 to $199,999 | 1,416 | 19.4% |
| $200,000+ | 1,460 | 20.0% |
Household Income by Householder Age in Mokena
The median household income in Mokena is $122,235, with the highest median household income of $150,358 found in the 45 to 64 years age bracket for the primary householder. A total of 3,379 households (46.3%) fall into this category. Meanwhile, the 15 to 24 years age bracket for the primary householder has the lowest median household income of $0, with 36 households (0.5%) in this group.
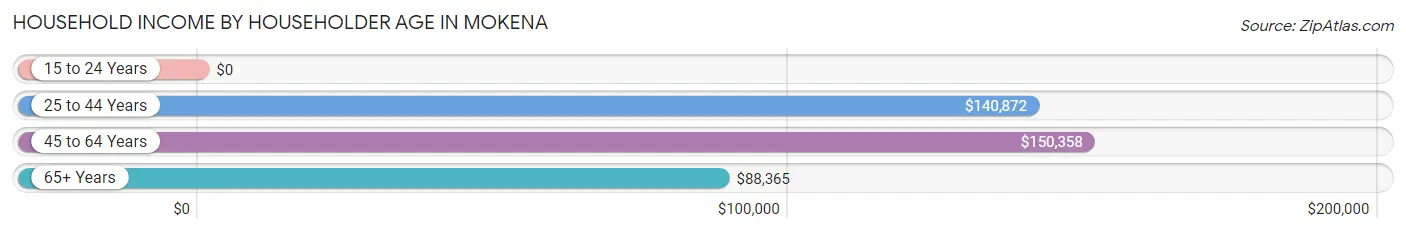
| Income Bracket | # Households | Median Income |
| 15 to 24 Years | 36 (0.5%) | $0 |
| 25 to 44 Years | 1,858 (25.5%) | $140,872 |
| 45 to 64 Years | 3,379 (46.3%) | $150,358 |
| 65+ Years | 2,026 (27.8%) | $88,365 |
| Total | 7,299 (100.0%) | $122,235 |
Poverty in Mokena
Income Below Poverty by Sex and Age in Mokena
With 3.9% poverty level for males and 5.2% for females among the residents of Mokena, 16 and 17 year old males and 5 year old females are the most vulnerable to poverty, with 56 males (13.9%) and 20 females (14.6%) in their respective age groups living below the poverty level.
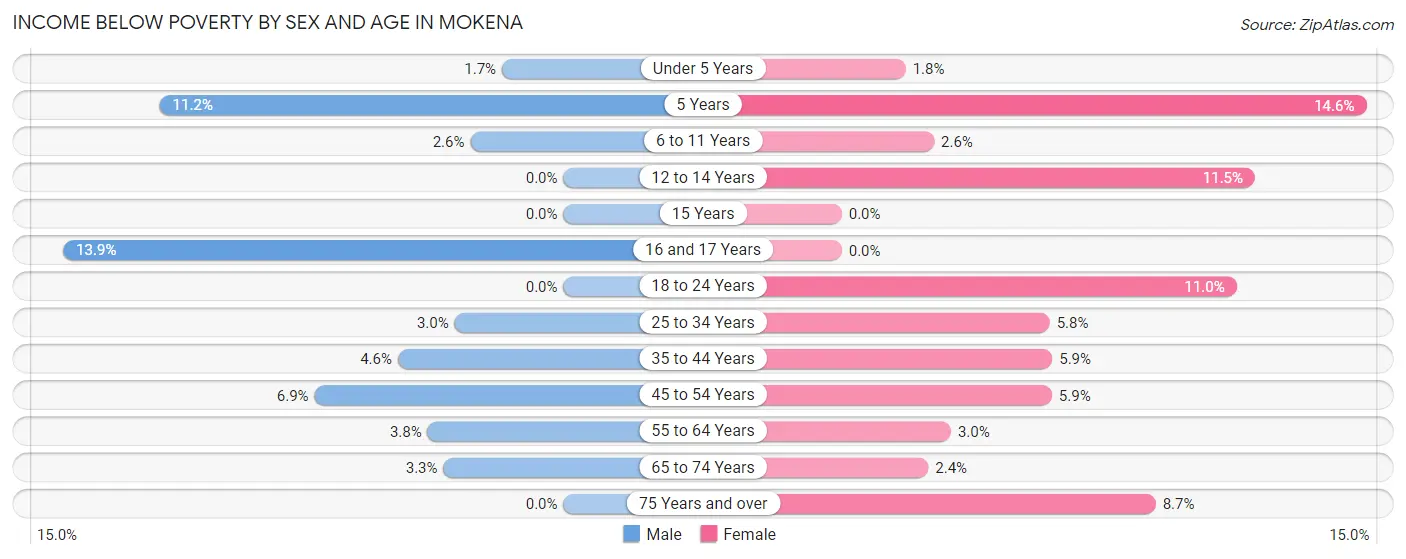
| Age Bracket | Male | Female |
| Under 5 Years | 8 (1.7%) | 11 (1.8%) |
| 5 Years | 20 (11.2%) | 20 (14.6%) |
| 6 to 11 Years | 17 (2.6%) | 18 (2.6%) |
| 12 to 14 Years | 0 (0.0%) | 43 (11.5%) |
| 15 Years | 0 (0.0%) | 0 (0.0%) |
| 16 and 17 Years | 56 (13.9%) | 0 (0.0%) |
| 18 to 24 Years | 0 (0.0%) | 73 (11.0%) |
| 25 to 34 Years | 37 (3.0%) | 59 (5.8%) |
| 35 to 44 Years | 53 (4.6%) | 64 (5.9%) |
| 45 to 54 Years | 96 (6.9%) | 88 (5.9%) |
| 55 to 64 Years | 68 (3.8%) | 49 (3.0%) |
| 65 to 74 Years | 30 (3.3%) | 29 (2.4%) |
| 75 Years and over | 0 (0.0%) | 62 (8.7%) |
| Total | 385 (3.9%) | 516 (5.2%) |
Income Above Poverty by Sex and Age in Mokena
According to the poverty statistics in Mokena, males aged 12 to 14 years and females aged 15 years are the age groups that are most secure financially, with 100.0% of males and 100.0% of females in these age groups living above the poverty line.
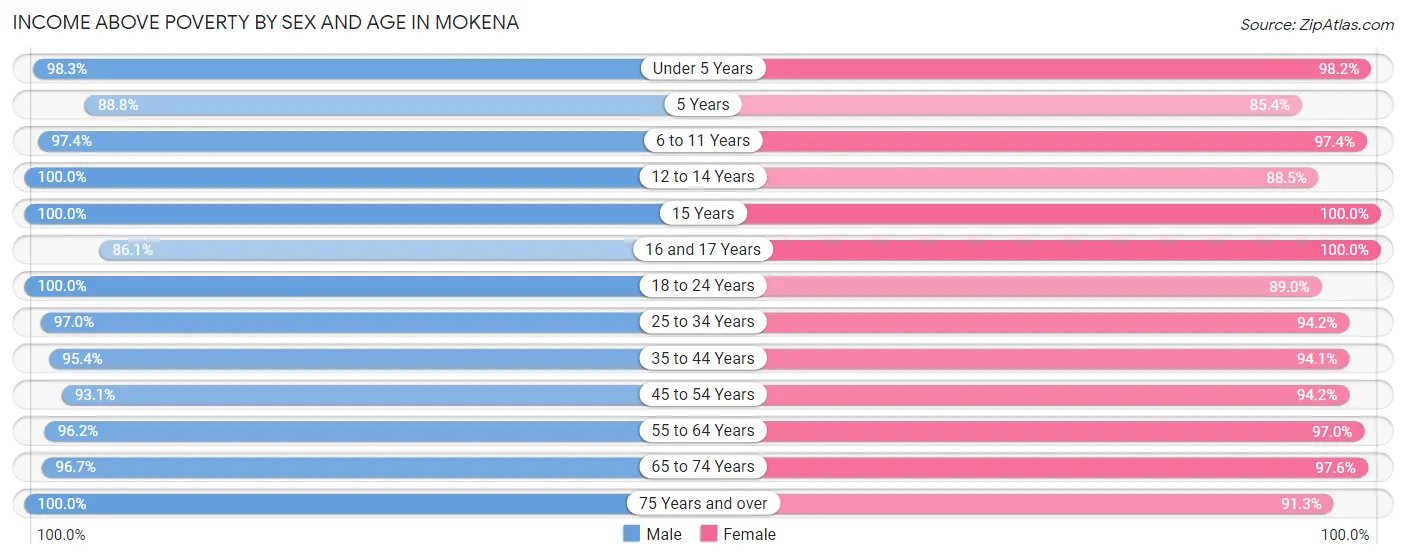
| Age Bracket | Male | Female |
| Under 5 Years | 459 (98.3%) | 608 (98.2%) |
| 5 Years | 158 (88.8%) | 117 (85.4%) |
| 6 to 11 Years | 640 (97.4%) | 682 (97.4%) |
| 12 to 14 Years | 424 (100.0%) | 331 (88.5%) |
| 15 Years | 96 (100.0%) | 44 (100.0%) |
| 16 and 17 Years | 346 (86.1%) | 277 (100.0%) |
| 18 to 24 Years | 758 (100.0%) | 591 (89.0%) |
| 25 to 34 Years | 1,185 (97.0%) | 960 (94.2%) |
| 35 to 44 Years | 1,097 (95.4%) | 1,029 (94.1%) |
| 45 to 54 Years | 1,290 (93.1%) | 1,417 (94.2%) |
| 55 to 64 Years | 1,729 (96.2%) | 1,562 (97.0%) |
| 65 to 74 Years | 869 (96.7%) | 1,175 (97.6%) |
| 75 Years and over | 494 (100.0%) | 647 (91.3%) |
| Total | 9,545 (96.1%) | 9,440 (94.8%) |
Income Below Poverty Among Married-Couple Families in Mokena
The poverty statistics for married-couple families in Mokena show that 2.4% or 120 of the total 4,969 families live below the poverty line. Families with 1 or 2 children have the highest poverty rate of 2.6%, comprising of 41 families. On the other hand, families with 3 or 4 children have the lowest poverty rate of 0.0%, which includes 0 families.
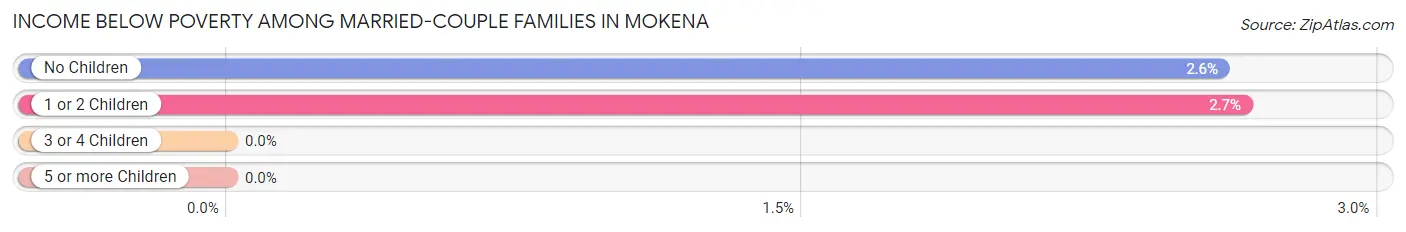
| Children | Above Poverty | Below Poverty |
| No Children | 2,966 (97.4%) | 79 (2.6%) |
| 1 or 2 Children | 1,508 (97.4%) | 41 (2.6%) |
| 3 or 4 Children | 375 (100.0%) | 0 (0.0%) |
| 5 or more Children | 0 (0.0%) | 0 (0.0%) |
| Total | 4,849 (97.6%) | 120 (2.4%) |
Income Below Poverty Among Single-Parent Households in Mokena
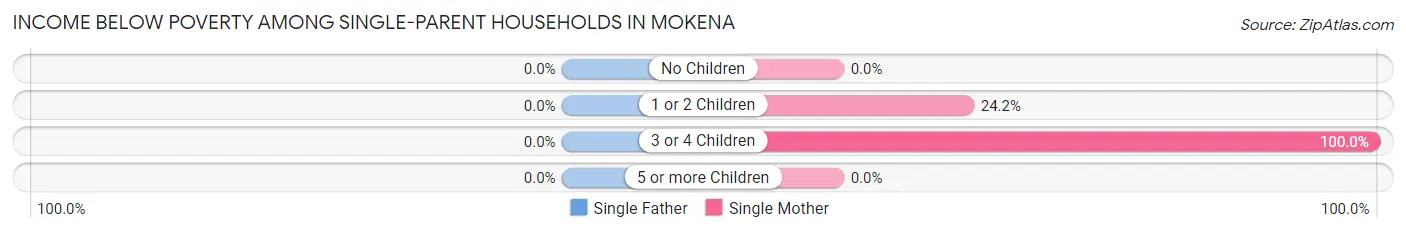
| Children | Single Father | Single Mother |
| No Children | 0 (0.0%) | 0 (0.0%) |
| 1 or 2 Children | 0 (0.0%) | 47 (24.2%) |
| 3 or 4 Children | 0 (0.0%) | 16 (100.0%) |
| 5 or more Children | 0 (0.0%) | 0 (0.0%) |
| Total | 0 (0.0%) | 63 (16.3%) |
Income Below Poverty Among Married-Couple vs Single-Parent Households in Mokena
The poverty data for Mokena shows that 120 of the married-couple family households (2.4%) and 63 of the single-parent households (10.7%) are living below the poverty level. Within the married-couple family households, those with 1 or 2 children have the highest poverty rate, with 41 households (2.6%) falling below the poverty line. Among the single-parent households, those with 3 or 4 children have the highest poverty rate, with 16 household (20.0%) living below poverty.
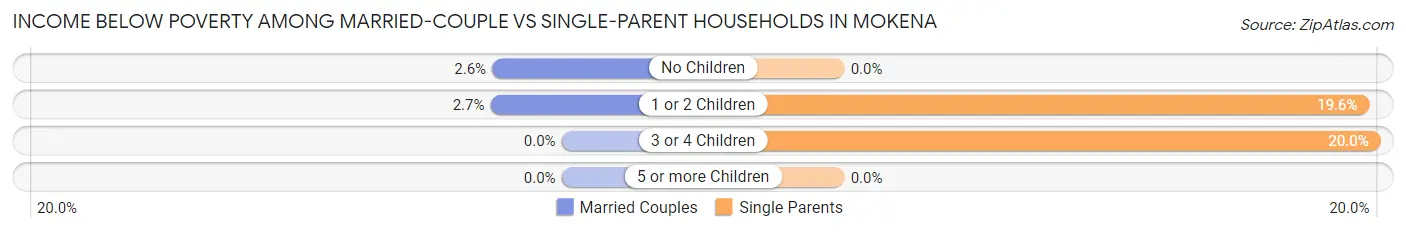
| Children | Married-Couple Families | Single-Parent Households |
| No Children | 79 (2.6%) | 0 (0.0%) |
| 1 or 2 Children | 41 (2.6%) | 47 (19.6%) |
| 3 or 4 Children | 0 (0.0%) | 16 (20.0%) |
| 5 or more Children | 0 (0.0%) | 0 (0.0%) |
| Total | 120 (2.4%) | 63 (10.7%) |
Race in Mokena
The most populous races in Mokena are White / Caucasian (18,526 | 93.2%), Hispanic or Latino (935 | 4.7%), and Two or more Races (778 | 3.9%).
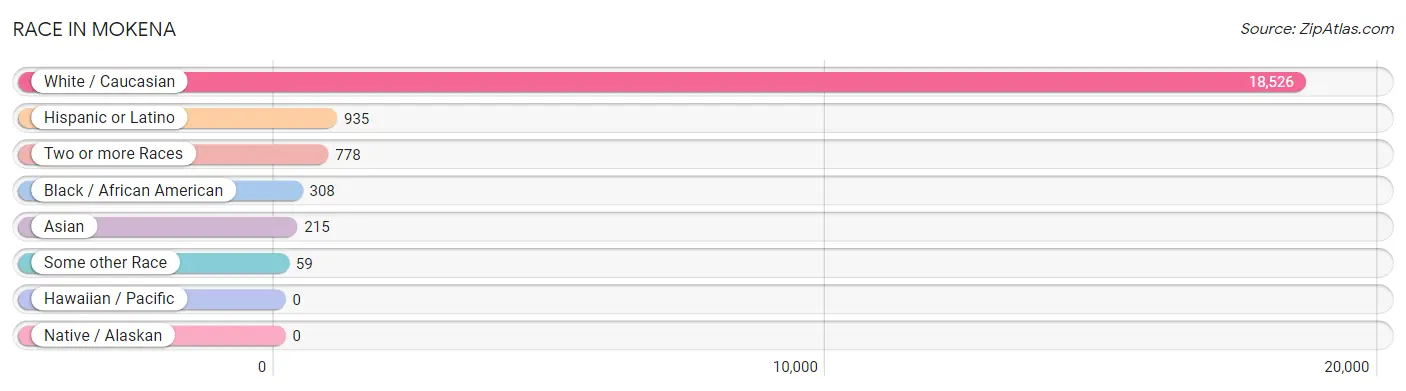
| Race | # Population | % Population |
| Asian | 215 | 1.1% |
| Black / African American | 308 | 1.5% |
| Hawaiian / Pacific | 0 | 0.0% |
| Hispanic or Latino | 935 | 4.7% |
| Native / Alaskan | 0 | 0.0% |
| White / Caucasian | 18,526 | 93.2% |
| Two or more Races | 778 | 3.9% |
| Some other Race | 59 | 0.3% |
| Total | 19,886 | 100.0% |
Ancestry in Mokena
The most populous ancestries reported in Mokena are German (5,443 | 27.4%), Polish (5,007 | 25.2%), Irish (4,653 | 23.4%), Italian (2,505 | 12.6%), and English (1,610 | 8.1%), together accounting for 96.7% of all Mokena residents.
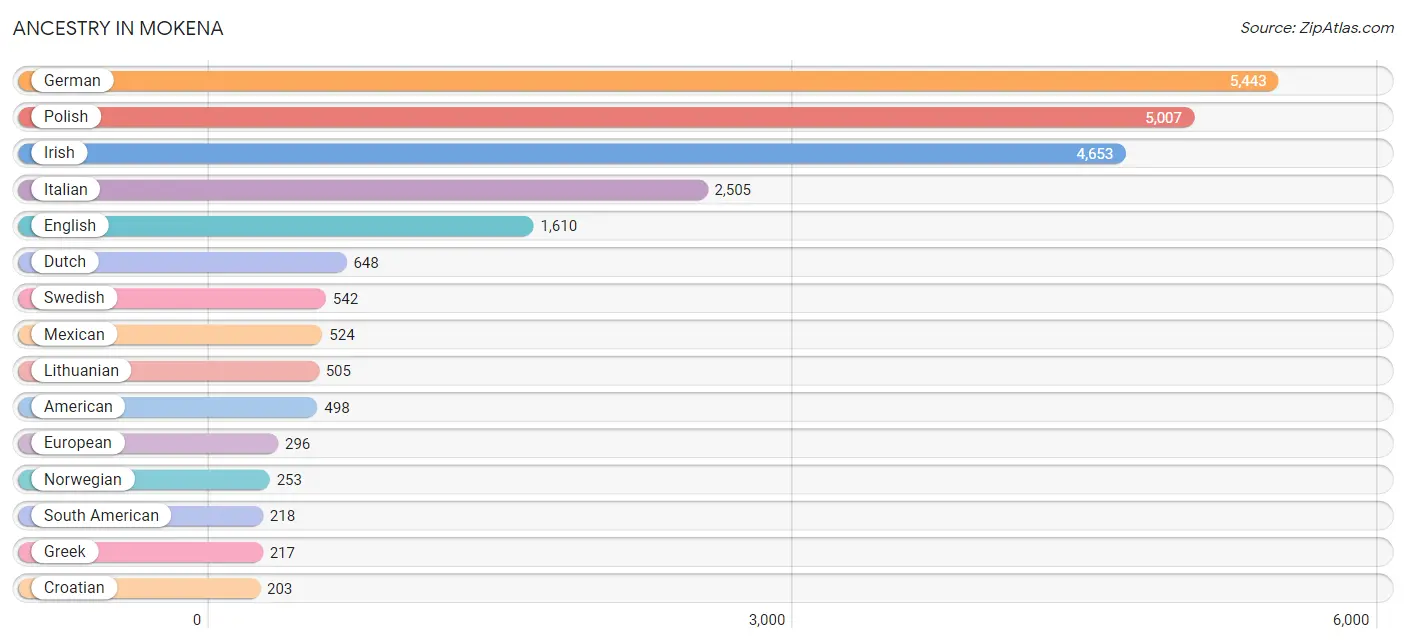
| Ancestry | # Population | % Population |
| African | 26 | 0.1% |
| Alsatian | 8 | 0.0% |
| American | 498 | 2.5% |
| Arab | 20 | 0.1% |
| Armenian | 12 | 0.1% |
| Austrian | 90 | 0.4% |
| Belgian | 1 | 0.0% |
| Bhutanese | 151 | 0.8% |
| British | 104 | 0.5% |
| Canadian | 9 | 0.1% |
| Celtic | 17 | 0.1% |
| Central American | 58 | 0.3% |
| Central American Indian | 29 | 0.2% |
| Chippewa | 5 | 0.0% |
| Colombian | 35 | 0.2% |
| Croatian | 203 | 1.0% |
| Czech | 194 | 1.0% |
| Czechoslovakian | 34 | 0.2% |
| Dutch | 648 | 3.3% |
| Dutch West Indian | 35 | 0.2% |
| Eastern European | 67 | 0.3% |
| Ecuadorian | 29 | 0.2% |
| English | 1,610 | 8.1% |
| European | 296 | 1.5% |
| Finnish | 17 | 0.1% |
| French | 162 | 0.8% |
| French Canadian | 56 | 0.3% |
| German | 5,443 | 27.4% |
| Greek | 217 | 1.1% |
| Guamanian / Chamorro | 36 | 0.2% |
| Guatemalan | 22 | 0.1% |
| Haitian | 21 | 0.1% |
| Hungarian | 60 | 0.3% |
| Indian (Asian) | 13 | 0.1% |
| Irish | 4,653 | 23.4% |
| Italian | 2,505 | 12.6% |
| Korean | 141 | 0.7% |
| Lithuanian | 505 | 2.5% |
| Luxembourger | 8 | 0.0% |
| Mexican | 524 | 2.6% |
| Mexican American Indian | 29 | 0.2% |
| Northern European | 38 | 0.2% |
| Norwegian | 253 | 1.3% |
| Panamanian | 36 | 0.2% |
| Polish | 5,007 | 25.2% |
| Puerto Rican | 43 | 0.2% |
| Russian | 157 | 0.8% |
| Samoan | 21 | 0.1% |
| Scandinavian | 19 | 0.1% |
| Scotch-Irish | 23 | 0.1% |
| Scottish | 180 | 0.9% |
| Serbian | 21 | 0.1% |
| Slavic | 61 | 0.3% |
| Slovak | 85 | 0.4% |
| Slovene | 22 | 0.1% |
| South American | 218 | 1.1% |
| Spaniard | 92 | 0.5% |
| Sri Lankan | 109 | 0.5% |
| Subsaharan African | 27 | 0.1% |
| Swedish | 542 | 2.7% |
| Swiss | 17 | 0.1% |
| Thai | 65 | 0.3% |
| Ugandan | 1 | 0.0% |
| Ukrainian | 128 | 0.6% |
| Venezuelan | 154 | 0.8% |
| Vietnamese | 27 | 0.1% |
| Welsh | 28 | 0.1% | View All 67 Rows |
Immigrants in Mokena
The most numerous immigrant groups reported in Mokena came from Europe (211 | 1.1%), Asia (143 | 0.7%), Eastern Europe (140 | 0.7%), Poland (108 | 0.5%), and Latin America (102 | 0.5%), together accounting for 3.5% of all Mokena residents.
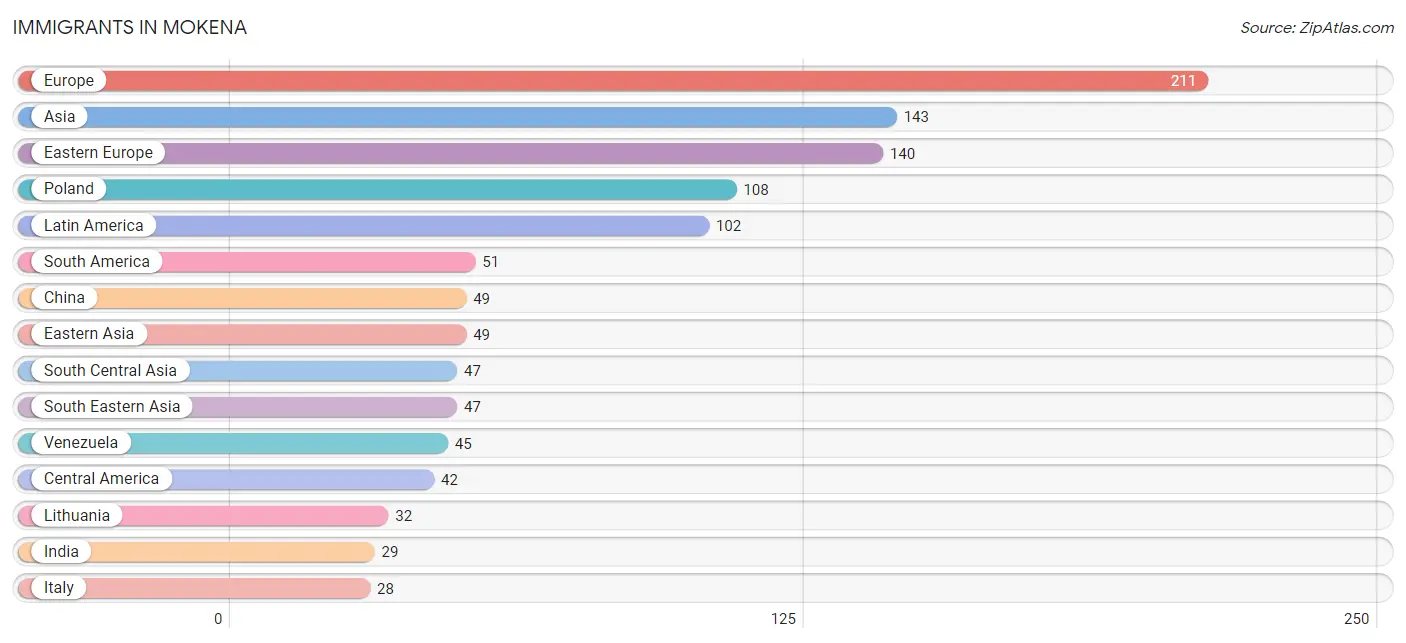
| Immigration Origin | # Population | % Population |
| Africa | 1 | 0.0% |
| Asia | 143 | 0.7% |
| Bangladesh | 18 | 0.1% |
| Caribbean | 9 | 0.1% |
| Central America | 42 | 0.2% |
| China | 49 | 0.3% |
| Colombia | 6 | 0.0% |
| Cuba | 9 | 0.1% |
| Eastern Africa | 1 | 0.0% |
| Eastern Asia | 49 | 0.3% |
| Eastern Europe | 140 | 0.7% |
| England | 7 | 0.0% |
| Europe | 211 | 1.1% |
| Germany | 20 | 0.1% |
| Guatemala | 13 | 0.1% |
| Honduras | 13 | 0.1% |
| India | 29 | 0.2% |
| Italy | 28 | 0.1% |
| Latin America | 102 | 0.5% |
| Lithuania | 32 | 0.2% |
| Mexico | 16 | 0.1% |
| Northern Europe | 23 | 0.1% |
| Philippines | 26 | 0.1% |
| Poland | 108 | 0.5% |
| South America | 51 | 0.3% |
| South Central Asia | 47 | 0.2% |
| South Eastern Asia | 47 | 0.2% |
| Southern Europe | 28 | 0.1% |
| Uganda | 1 | 0.0% |
| Venezuela | 45 | 0.2% |
| Vietnam | 21 | 0.1% |
| Western Europe | 20 | 0.1% | View All 32 Rows |
Sex and Age in Mokena
Sex and Age in Mokena
The most populous age groups in Mokena are 50 to 54 Years (918 | 9.2%) for men and 50 to 54 Years (912 | 9.2%) for women.
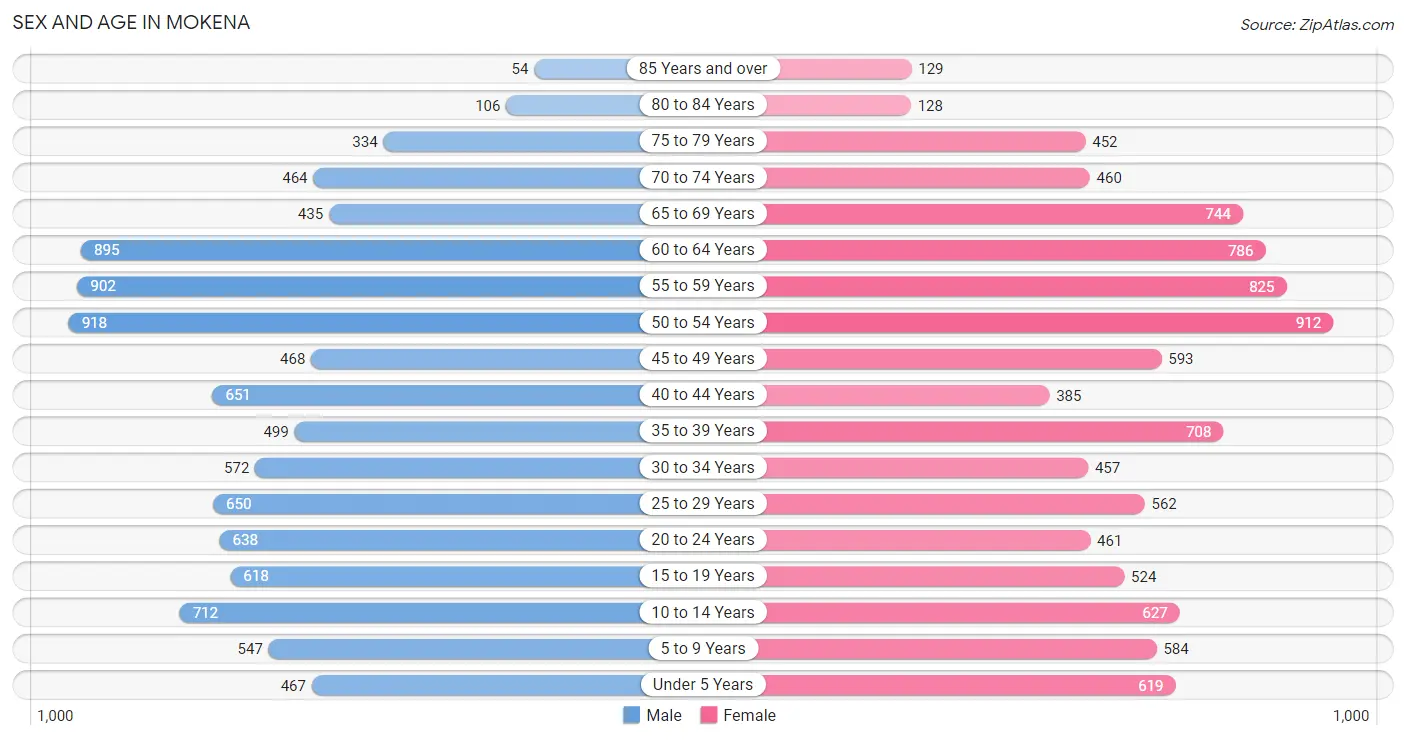
| Age Bracket | Male | Female |
| Under 5 Years | 467 (4.7%) | 619 (6.2%) |
| 5 to 9 Years | 547 (5.5%) | 584 (5.9%) |
| 10 to 14 Years | 712 (7.2%) | 627 (6.3%) |
| 15 to 19 Years | 618 (6.2%) | 524 (5.3%) |
| 20 to 24 Years | 638 (6.4%) | 461 (4.6%) |
| 25 to 29 Years | 650 (6.6%) | 562 (5.6%) |
| 30 to 34 Years | 572 (5.8%) | 457 (4.6%) |
| 35 to 39 Years | 499 (5.0%) | 708 (7.1%) |
| 40 to 44 Years | 651 (6.6%) | 385 (3.9%) |
| 45 to 49 Years | 468 (4.7%) | 593 (6.0%) |
| 50 to 54 Years | 918 (9.2%) | 912 (9.2%) |
| 55 to 59 Years | 902 (9.1%) | 825 (8.3%) |
| 60 to 64 Years | 895 (9.0%) | 786 (7.9%) |
| 65 to 69 Years | 435 (4.4%) | 744 (7.5%) |
| 70 to 74 Years | 464 (4.7%) | 460 (4.6%) |
| 75 to 79 Years | 334 (3.4%) | 452 (4.5%) |
| 80 to 84 Years | 106 (1.1%) | 128 (1.3%) |
| 85 Years and over | 54 (0.5%) | 129 (1.3%) |
| Total | 9,930 (100.0%) | 9,956 (100.0%) |
Families and Households in Mokena
Median Family Size in Mokena
The median family size in Mokena is 3.20 persons per family, with single female/mother families (387 | 7.0%) accounting for the largest median family size of 3.29 persons per family. On the other hand, single male/father families (200 | 3.6%) represent the smallest median family size with 2.86 persons per family.
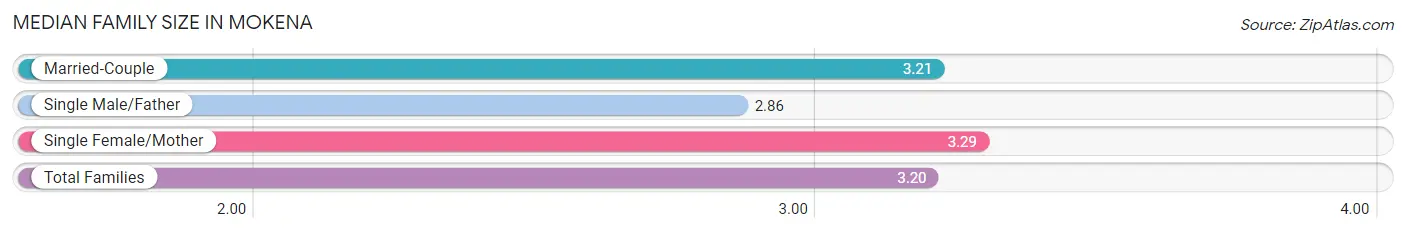
| Family Type | # Families | Family Size |
| Married-Couple | 4,969 (89.4%) | 3.21 |
| Single Male/Father | 200 (3.6%) | 2.86 |
| Single Female/Mother | 387 (7.0%) | 3.29 |
| Total Families | 5,556 (100.0%) | 3.20 |
Median Household Size in Mokena
The median household size in Mokena is 2.72 persons per household, with single female/mother households (387 | 5.3%) accounting for the largest median household size of 3.43 persons per household. non-family households (1,743 | 23.9%) represent the smallest median household size with 1.16 persons per household.
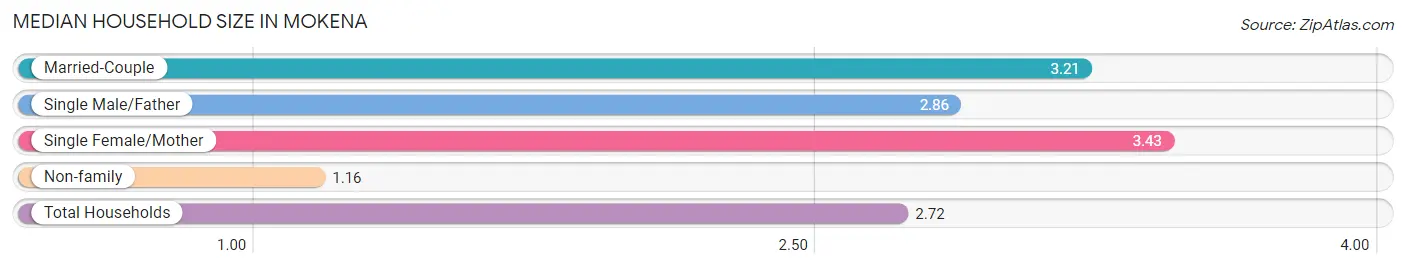
| Household Type | # Households | Household Size |
| Married-Couple | 4,969 (68.1%) | 3.21 |
| Single Male/Father | 200 (2.7%) | 2.86 |
| Single Female/Mother | 387 (5.3%) | 3.43 |
| Non-family | 1,743 (23.9%) | 1.16 |
| Total Households | 7,299 (100.0%) | 2.72 |
Household Size by Marriage Status in Mokena
Out of a total of 7,299 households in Mokena, 5,556 (76.1%) are family households, while 1,743 (23.9%) are nonfamily households. The most numerous type of family households are 2-person households, comprising 2,158, and the most common type of nonfamily households are 1-person households, comprising 1,485.
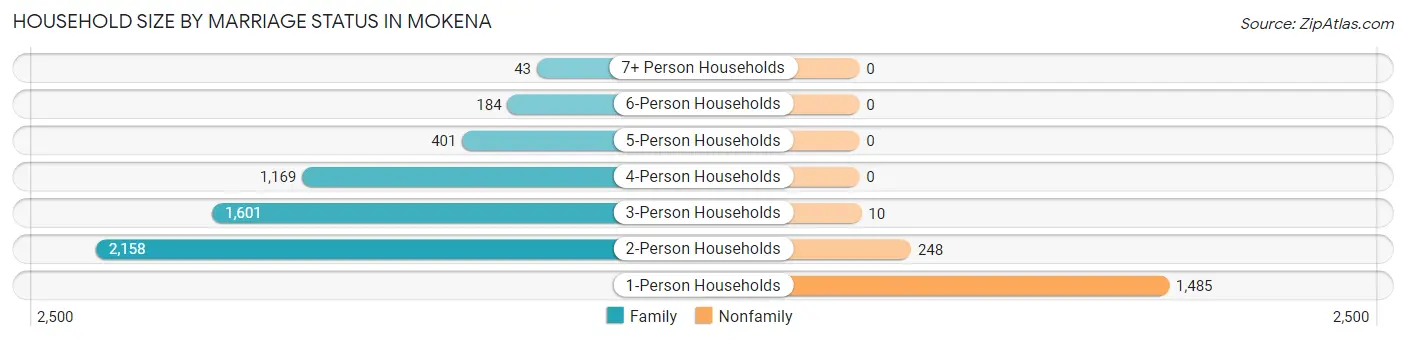
| Household Size | Family Households | Nonfamily Households |
| 1-Person Households | - | 1,485 (20.3%) |
| 2-Person Households | 2,158 (29.6%) | 248 (3.4%) |
| 3-Person Households | 1,601 (21.9%) | 10 (0.1%) |
| 4-Person Households | 1,169 (16.0%) | 0 (0.0%) |
| 5-Person Households | 401 (5.5%) | 0 (0.0%) |
| 6-Person Households | 184 (2.5%) | 0 (0.0%) |
| 7+ Person Households | 43 (0.6%) | 0 (0.0%) |
| Total | 5,556 (76.1%) | 1,743 (23.9%) |
Female Fertility in Mokena
Fertility by Age in Mokena
Average fertility rate in Mokena is 52.0 births per 1,000 women. Women in the age bracket of 20 to 34 years have the highest fertility rate with 65.0 births per 1,000 women. Women in the age bracket of 35 to 50 years acount for 51.8% of all women with births.
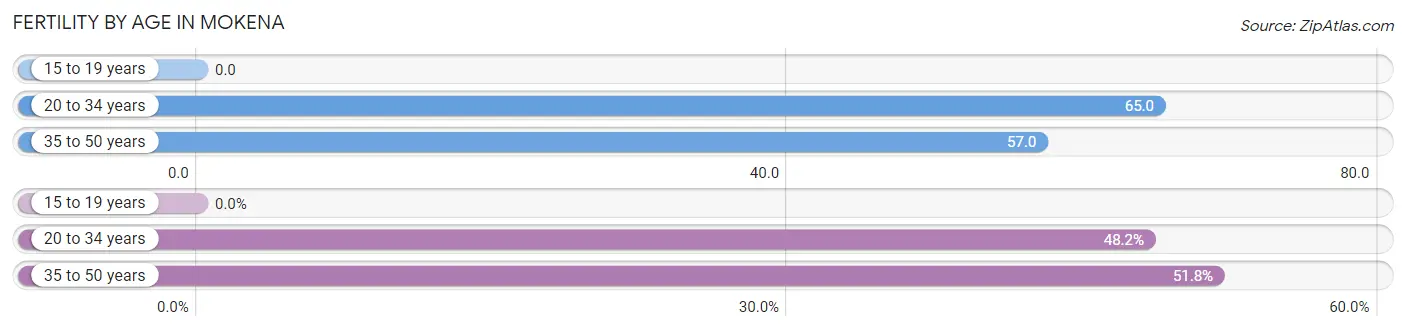
| Age Bracket | Women with Births | Births / 1,000 Women |
| 15 to 19 years | 0 (0.0%) | 0.0 |
| 20 to 34 years | 96 (48.2%) | 65.0 |
| 35 to 50 years | 103 (51.8%) | 57.0 |
| Total | 199 (100.0%) | 52.0 |
Fertility by Age by Marriage Status in Mokena
95.5% of women with births (199) in Mokena are married. The highest percentage of unmarried women with births falls into 20 to 34 years age bracket with 9.4% of them unmarried at the time of birth, while the lowest percentage of unmarried women with births belong to 35 to 50 years age bracket with 0.0% of them unmarried.
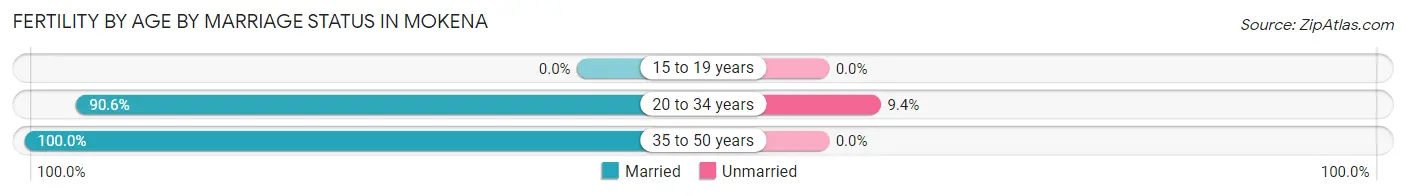
| Age Bracket | Married | Unmarried |
| 15 to 19 years | 0 (0.0%) | 0 (0.0%) |
| 20 to 34 years | 87 (90.6%) | 9 (9.4%) |
| 35 to 50 years | 103 (100.0%) | 0 (0.0%) |
| Total | 190 (95.5%) | 9 (4.5%) |
Fertility by Education in Mokena
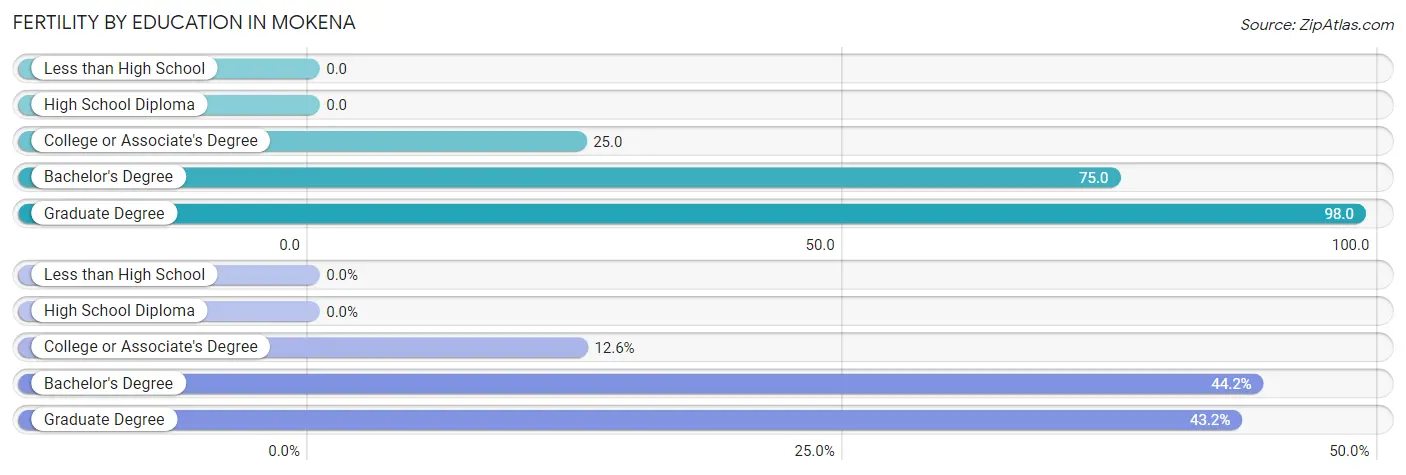
| Educational Attainment | Women with Births | Births / 1,000 Women |
| Less than High School | 0 (0.0%) | 0.0 |
| High School Diploma | 0 (0.0%) | 0.0 |
| College or Associate's Degree | 25 (12.6%) | 25.0 |
| Bachelor's Degree | 88 (44.2%) | 75.0 |
| Graduate Degree | 86 (43.2%) | 98.0 |
| Total | 199 (100.0%) | 52.0 |
Fertility by Education by Marriage Status in Mokena
4.5% of women with births in Mokena are unmarried. Women with the educational attainment of college or associate's degree are most likely to be married with 100.0% of them married at childbirth, while women with the educational attainment of bachelor's degree are least likely to be married with 10.2% of them unmarried at childbirth.
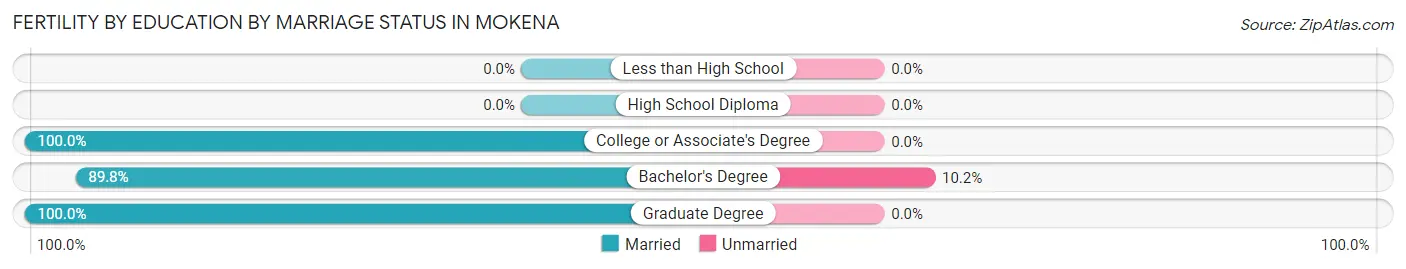
| Educational Attainment | Married | Unmarried |
| Less than High School | 0 (0.0%) | 0 (0.0%) |
| High School Diploma | 0 (0.0%) | 0 (0.0%) |
| College or Associate's Degree | 25 (100.0%) | 0 (0.0%) |
| Bachelor's Degree | 79 (89.8%) | 9 (10.2%) |
| Graduate Degree | 86 (100.0%) | 0 (0.0%) |
| Total | 190 (95.5%) | 9 (4.5%) |
Employment Characteristics in Mokena
Employment by Class of Employer in Mokena
Among the 10,906 employed individuals in Mokena, private company employees (7,268 | 66.6%), not-for-profit organizations (1,070 | 9.8%), and local government employees (855 | 7.8%) make up the most common classes of employment.
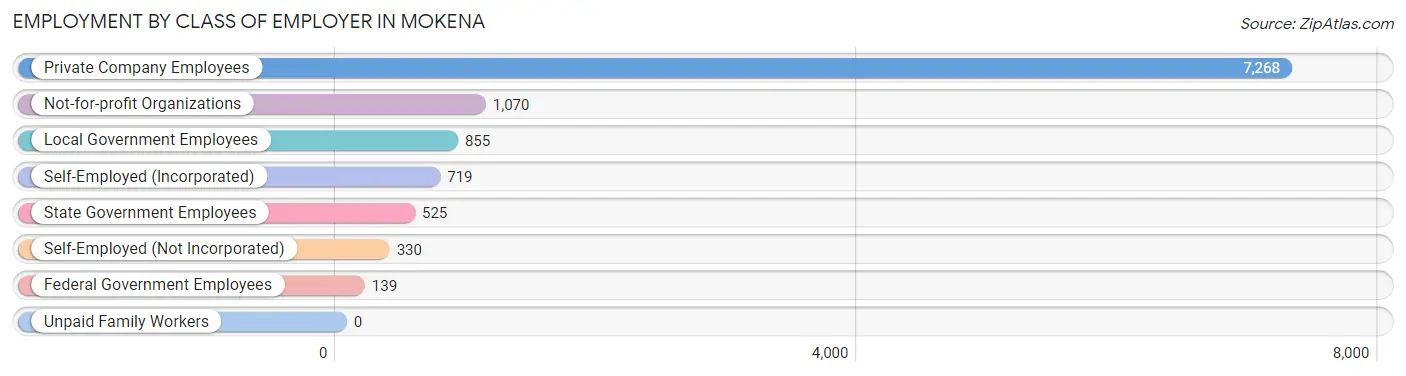
| Employer Class | # Employees | % Employees |
| Private Company Employees | 7,268 | 66.6% |
| Self-Employed (Incorporated) | 719 | 6.6% |
| Self-Employed (Not Incorporated) | 330 | 3.0% |
| Not-for-profit Organizations | 1,070 | 9.8% |
| Local Government Employees | 855 | 7.8% |
| State Government Employees | 525 | 4.8% |
| Federal Government Employees | 139 | 1.3% |
| Unpaid Family Workers | 0 | 0.0% |
| Total | 10,906 | 100.0% |
Employment Status by Age in Mokena
According to the labor force statistics for Mokena, out of the total population over 16 years of age (16,190), 70.7% or 11,446 individuals are in the labor force, with 3.4% or 389 of them unemployed. The age group with the highest labor force participation rate is 25 to 29 years, with 93.5% or 1,133 individuals in the labor force. Within the labor force, the 75 years and over age range has the highest percentage of unemployed individuals, with 13.6% or 17 of them being unemployed.
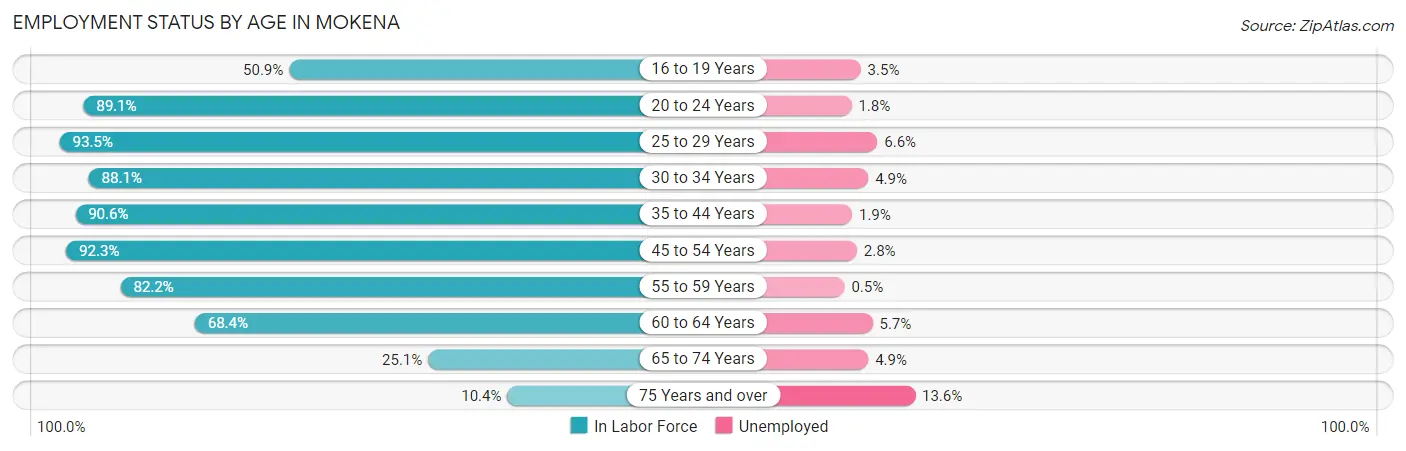
| Age Bracket | In Labor Force | Unemployed |
| 16 to 19 Years | 510 (50.9%) | 18 (3.5%) |
| 20 to 24 Years | 979 (89.1%) | 18 (1.8%) |
| 25 to 29 Years | 1,133 (93.5%) | 75 (6.6%) |
| 30 to 34 Years | 907 (88.1%) | 44 (4.9%) |
| 35 to 44 Years | 2,032 (90.6%) | 39 (1.9%) |
| 45 to 54 Years | 2,668 (92.3%) | 75 (2.8%) |
| 55 to 59 Years | 1,420 (82.2%) | 7 (0.5%) |
| 60 to 64 Years | 1,150 (68.4%) | 66 (5.7%) |
| 65 to 74 Years | 528 (25.1%) | 26 (4.9%) |
| 75 Years and over | 125 (10.4%) | 17 (13.6%) |
| Total | 11,446 (70.7%) | 389 (3.4%) |
Employment Status by Educational Attainment in Mokena
According to labor force statistics for Mokena, 86.3% of individuals (9,306) out of the total population between 25 and 64 years of age (10,783) are in the labor force, with 3.3% or 307 of them being unemployed. The group with the highest labor force participation rate are those with the educational attainment of bachelor's degree or higher, with 90.9% or 4,957 individuals in the labor force. Within the labor force, individuals with less than high school education have the highest percentage of unemployment, with 11.9% or 12 of them being unemployed.
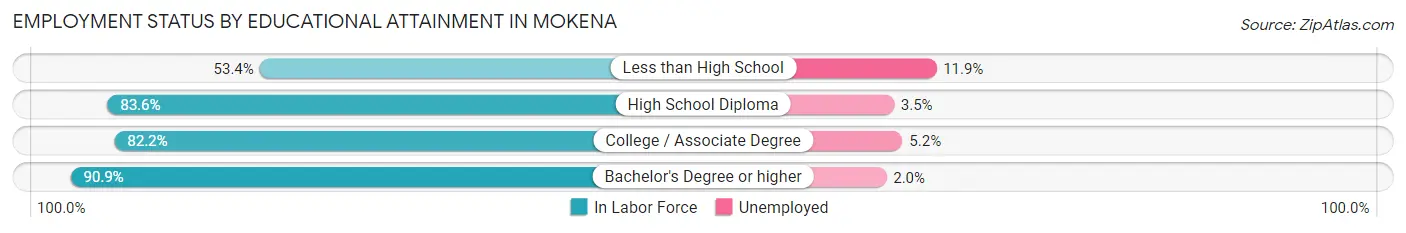
| Educational Attainment | In Labor Force | Unemployed |
| Less than High School | 101 (53.4%) | 22 (11.9%) |
| High School Diploma | 1,585 (83.6%) | 66 (3.5%) |
| College / Associate Degree | 2,667 (82.2%) | 169 (5.2%) |
| Bachelor's Degree or higher | 4,957 (90.9%) | 109 (2.0%) |
| Total | 9,306 (86.3%) | 356 (3.3%) |
Employment Occupations by Sex in Mokena
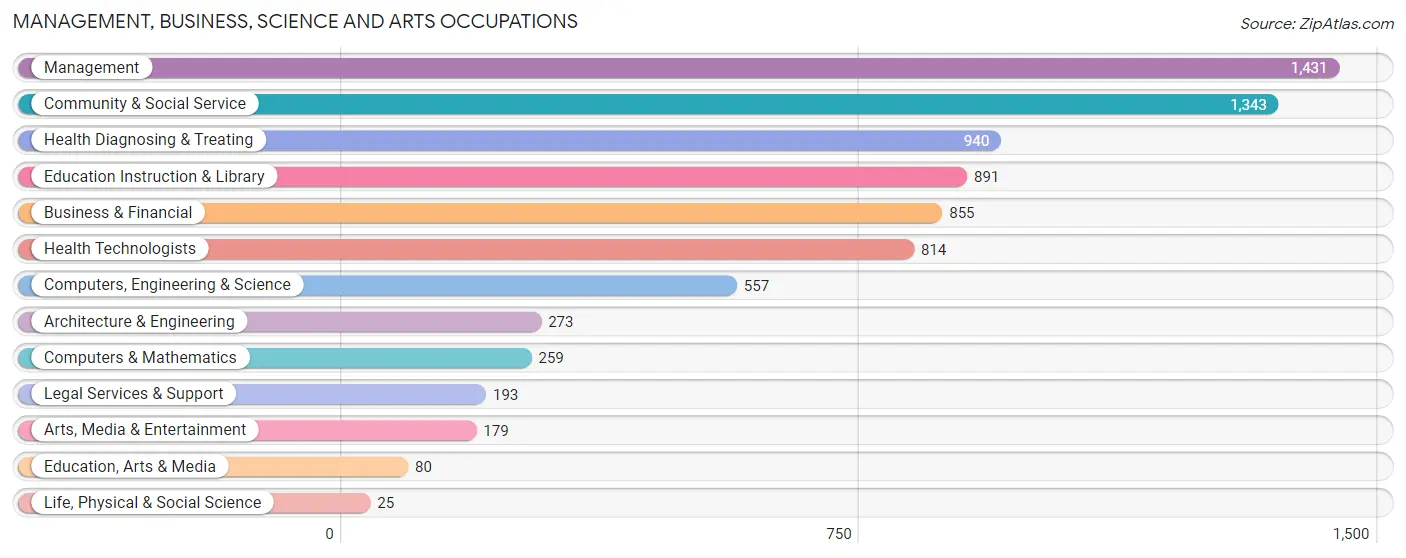
Management, Business, Science and Arts Occupations
The most common Management, Business, Science and Arts occupations in Mokena are Management (1,431 | 12.9%), Community & Social Service (1,343 | 12.1%), Health Diagnosing & Treating (940 | 8.5%), Education Instruction & Library (891 | 8.1%), and Business & Financial (855 | 7.7%).
Management, Business, Science and Arts Occupations by Sex
Within the Management, Business, Science and Arts occupations in Mokena, the most male-oriented occupations are Life, Physical & Social Science (100.0%), Architecture & Engineering (89.7%), and Computers, Engineering & Science (89.0%), while the most female-oriented occupations are Education, Arts & Media (100.0%), Health Technologists (86.0%), and Health Diagnosing & Treating (84.5%).
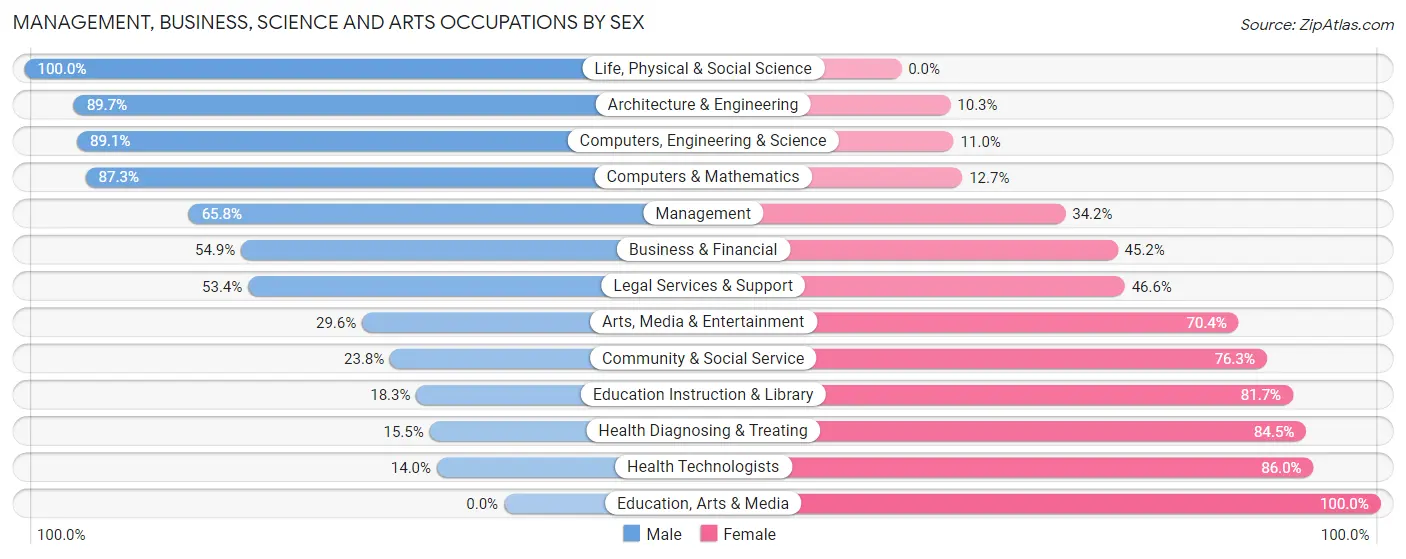
| Occupation | Male | Female |
| Management | 941 (65.8%) | 490 (34.2%) |
| Business & Financial | 469 (54.8%) | 386 (45.2%) |
| Computers, Engineering & Science | 496 (89.0%) | 61 (11.0%) |
| Computers & Mathematics | 226 (87.3%) | 33 (12.7%) |
| Architecture & Engineering | 245 (89.7%) | 28 (10.3%) |
| Life, Physical & Social Science | 25 (100.0%) | 0 (0.0%) |
| Community & Social Service | 319 (23.7%) | 1,024 (76.2%) |
| Education, Arts & Media | 0 (0.0%) | 80 (100.0%) |
| Legal Services & Support | 103 (53.4%) | 90 (46.6%) |
| Education Instruction & Library | 163 (18.3%) | 728 (81.7%) |
| Arts, Media & Entertainment | 53 (29.6%) | 126 (70.4%) |
| Health Diagnosing & Treating | 146 (15.5%) | 794 (84.5%) |
| Health Technologists | 114 (14.0%) | 700 (86.0%) |
| Total (Category) | 2,371 (46.3%) | 2,755 (53.7%) |
| Total (Overall) | 5,849 (52.8%) | 5,219 (47.1%) |
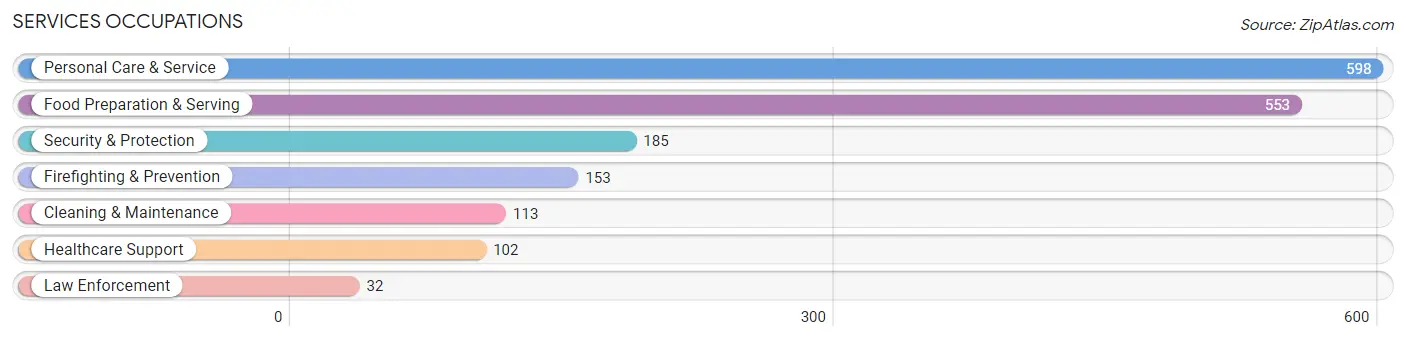
Services Occupations
The most common Services occupations in Mokena are Personal Care & Service (598 | 5.4%), Food Preparation & Serving (553 | 5.0%), Security & Protection (185 | 1.7%), Firefighting & Prevention (153 | 1.4%), and Cleaning & Maintenance (113 | 1.0%).
Services Occupations by Sex
Within the Services occupations in Mokena, the most male-oriented occupations are Cleaning & Maintenance (92.9%), Firefighting & Prevention (85.6%), and Security & Protection (84.9%), while the most female-oriented occupations are Food Preparation & Serving (76.1%), Personal Care & Service (62.7%), and Healthcare Support (56.9%).
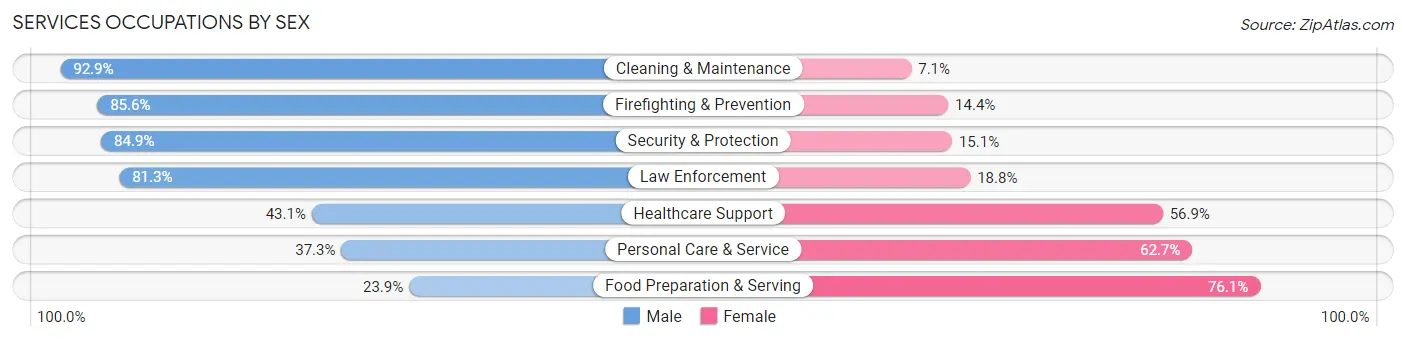
| Occupation | Male | Female |
| Healthcare Support | 44 (43.1%) | 58 (56.9%) |
| Security & Protection | 157 (84.9%) | 28 (15.1%) |
| Firefighting & Prevention | 131 (85.6%) | 22 (14.4%) |
| Law Enforcement | 26 (81.2%) | 6 (18.8%) |
| Food Preparation & Serving | 132 (23.9%) | 421 (76.1%) |
| Cleaning & Maintenance | 105 (92.9%) | 8 (7.1%) |
| Personal Care & Service | 223 (37.3%) | 375 (62.7%) |
| Total (Category) | 661 (42.6%) | 890 (57.4%) |
| Total (Overall) | 5,849 (52.8%) | 5,219 (47.1%) |
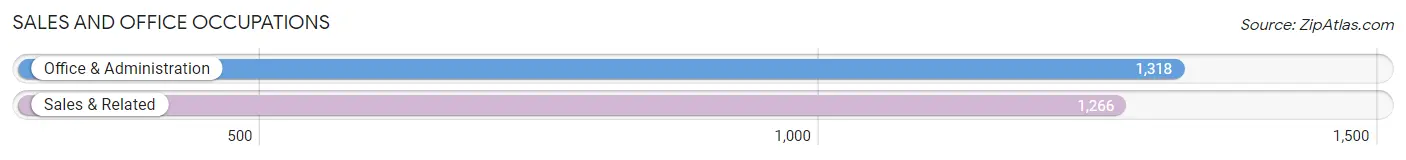
Sales and Office Occupations
The most common Sales and Office occupations in Mokena are Office & Administration (1,318 | 11.9%), and Sales & Related (1,266 | 11.4%).
Sales and Office Occupations by Sex
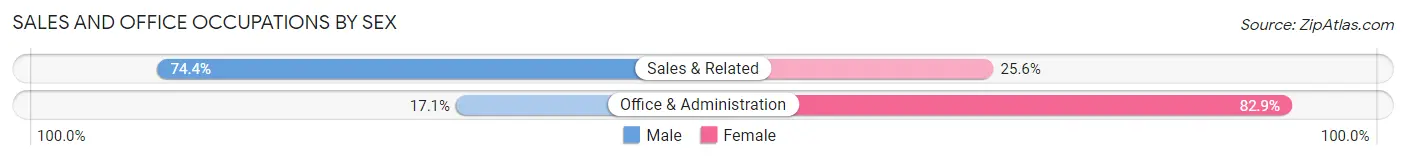
| Occupation | Male | Female |
| Sales & Related | 942 (74.4%) | 324 (25.6%) |
| Office & Administration | 225 (17.1%) | 1,093 (82.9%) |
| Total (Category) | 1,167 (45.2%) | 1,417 (54.8%) |
| Total (Overall) | 5,849 (52.8%) | 5,219 (47.1%) |
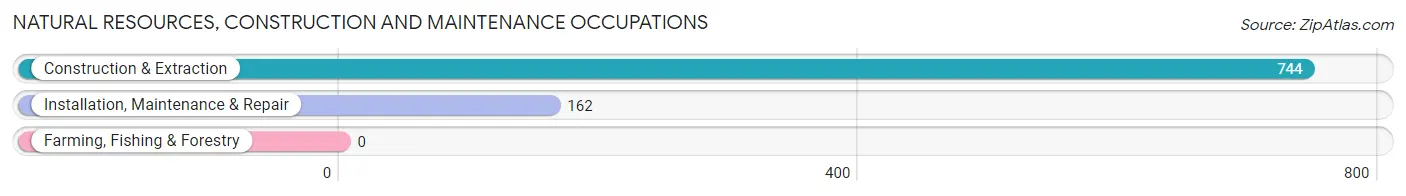
Natural Resources, Construction and Maintenance Occupations
The most common Natural Resources, Construction and Maintenance occupations in Mokena are Construction & Extraction (744 | 6.7%), and Installation, Maintenance & Repair (162 | 1.5%).
Natural Resources, Construction and Maintenance Occupations by Sex
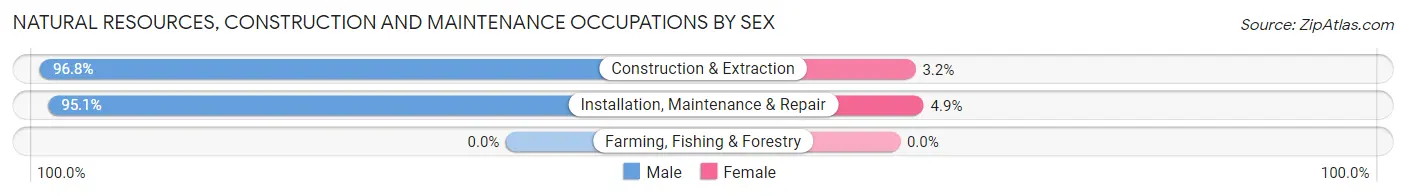
| Occupation | Male | Female |
| Farming, Fishing & Forestry | 0 (0.0%) | 0 (0.0%) |
| Construction & Extraction | 720 (96.8%) | 24 (3.2%) |
| Installation, Maintenance & Repair | 154 (95.1%) | 8 (4.9%) |
| Total (Category) | 874 (96.5%) | 32 (3.5%) |
| Total (Overall) | 5,849 (52.8%) | 5,219 (47.1%) |
Production, Transportation and Moving Occupations
The most common Production, Transportation and Moving occupations in Mokena are Production (586 | 5.3%), Material Moving (173 | 1.6%), and Transportation (142 | 1.3%).
Production, Transportation and Moving Occupations by Sex
| Occupation | Male | Female |
| Production | 486 (82.9%) | 100 (17.1%) |
| Transportation | 142 (100.0%) | 0 (0.0%) |
| Material Moving | 148 (85.6%) | 25 (14.4%) |
| Total (Category) | 776 (86.1%) | 125 (13.9%) |
| Total (Overall) | 5,849 (52.8%) | 5,219 (47.1%) |
Employment Industries by Sex in Mokena
Employment Industries in Mokena
The major employment industries in Mokena include Health Care & Social Assistance (1,705 | 15.4%), Educational Services (1,468 | 13.3%), Retail Trade (1,142 | 10.3%), Construction (1,038 | 9.4%), and Manufacturing (1,037 | 9.4%).
Employment Industries by Sex in Mokena
The Mokena industries that see more men than women are Construction (87.3%), Wholesale Trade (85.9%), and Transportation & Warehousing (79.9%), whereas the industries that tend to have a higher number of women are Health Care & Social Assistance (80.8%), Educational Services (73.8%), and Accommodation & Food Services (71.8%).
| Industry | Male | Female |
| Agriculture, Fishing & Hunting | 0 (0.0%) | 0 (0.0%) |
| Mining, Quarrying, & Extraction | 0 (0.0%) | 0 (0.0%) |
| Construction | 906 (87.3%) | 132 (12.7%) |
| Manufacturing | 820 (79.1%) | 217 (20.9%) |
| Wholesale Trade | 281 (85.9%) | 46 (14.1%) |
| Retail Trade | 664 (58.1%) | 478 (41.9%) |
| Transportation & Warehousing | 283 (79.9%) | 71 (20.1%) |
| Utilities | 33 (76.7%) | 10 (23.3%) |
| Information | 65 (73.0%) | 24 (27.0%) |
| Finance & Insurance | 497 (63.5%) | 286 (36.5%) |
| Real Estate, Rental & Leasing | 107 (78.7%) | 29 (21.3%) |
| Professional & Scientific | 453 (59.1%) | 313 (40.9%) |
| Enterprise Management | 0 (0.0%) | 0 (0.0%) |
| Administrative & Support | 142 (60.9%) | 91 (39.1%) |
| Educational Services | 384 (26.2%) | 1,084 (73.8%) |
| Health Care & Social Assistance | 327 (19.2%) | 1,378 (80.8%) |
| Arts, Entertainment & Recreation | 77 (38.5%) | 123 (61.5%) |
| Accommodation & Food Services | 169 (28.2%) | 430 (71.8%) |
| Public Administration | 283 (70.1%) | 121 (29.9%) |
| Total | 5,849 (52.8%) | 5,219 (47.1%) |
Education in Mokena
School Enrollment in Mokena
The most common levels of schooling among the 4,803 students in Mokena are high school (1,185 | 24.7%), middle school (1,032 | 21.5%), and college / undergraduate (841 | 17.5%).
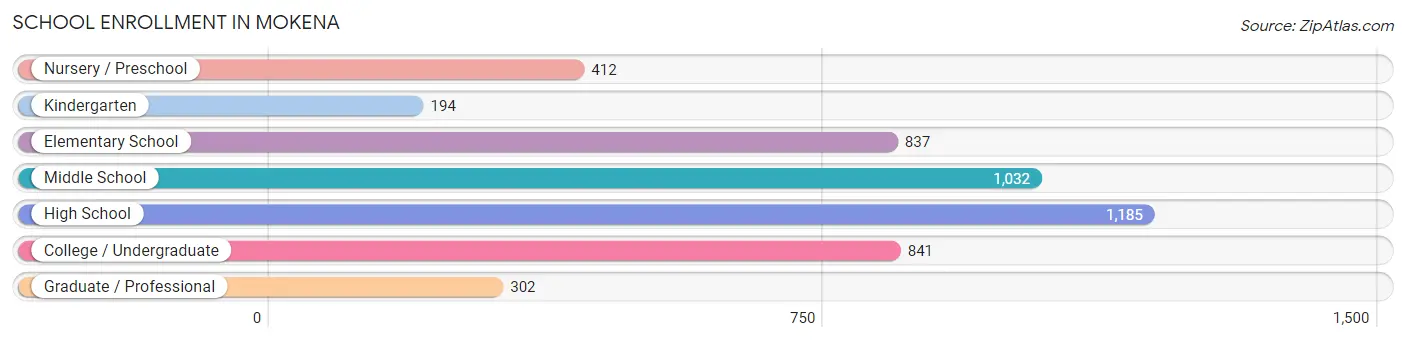
| School Level | # Students | % Students |
| Nursery / Preschool | 412 | 8.6% |
| Kindergarten | 194 | 4.0% |
| Elementary School | 837 | 17.4% |
| Middle School | 1,032 | 21.5% |
| High School | 1,185 | 24.7% |
| College / Undergraduate | 841 | 17.5% |
| Graduate / Professional | 302 | 6.3% |
| Total | 4,803 | 100.0% |
School Enrollment by Age by Funding Source in Mokena
Out of a total of 4,803 students who are enrolled in schools in Mokena, 1,287 (26.8%) attend a private institution, while the remaining 3,516 (73.2%) are enrolled in public schools. The age group of 25 to 34 year olds has the highest likelihood of being enrolled in private schools, with 136 (74.7% in the age bracket) enrolled. Conversely, the age group of 10 to 14 year olds has the lowest likelihood of being enrolled in a private school, with 1,212 (93.4% in the age bracket) attending a public institution.
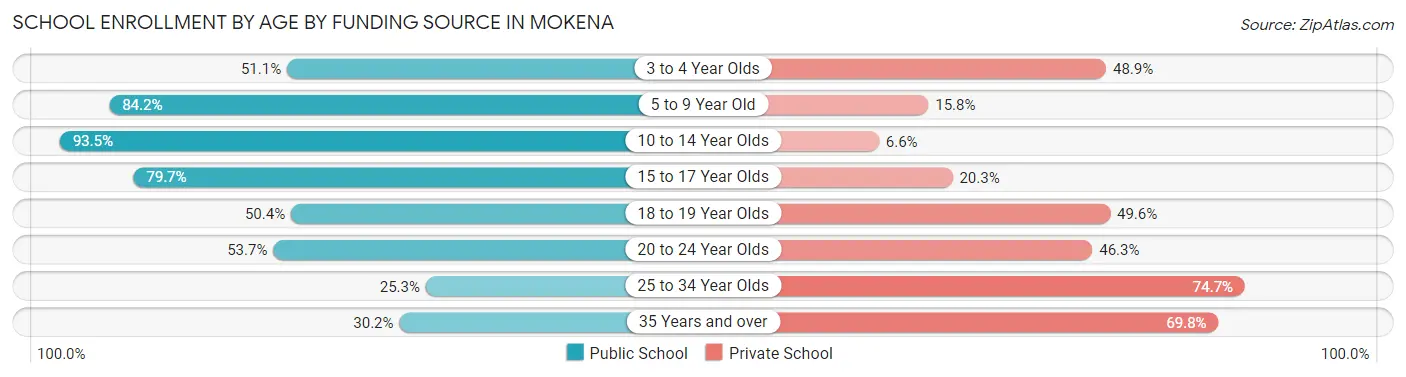
| Age Bracket | Public School | Private School |
| 3 to 4 Year Olds | 136 (51.1%) | 130 (48.9%) |
| 5 to 9 Year Old | 919 (84.2%) | 172 (15.8%) |
| 10 to 14 Year Olds | 1,212 (93.4%) | 85 (6.6%) |
| 15 to 17 Year Olds | 653 (79.7%) | 166 (20.3%) |
| 18 to 19 Year Olds | 134 (50.4%) | 132 (49.6%) |
| 20 to 24 Year Olds | 342 (53.7%) | 295 (46.3%) |
| 25 to 34 Year Olds | 46 (25.3%) | 136 (74.7%) |
| 35 Years and over | 74 (30.2%) | 171 (69.8%) |
| Total | 3,516 (73.2%) | 1,287 (26.8%) |
Educational Attainment by Field of Study in Mokena
Business (1,745 | 25.9%), education (910 | 13.5%), science & technology (851 | 12.7%), arts & humanities (474 | 7.0%), and social sciences (434 | 6.5%) are the most common fields of study among 6,728 individuals in Mokena who have obtained a bachelor's degree or higher.
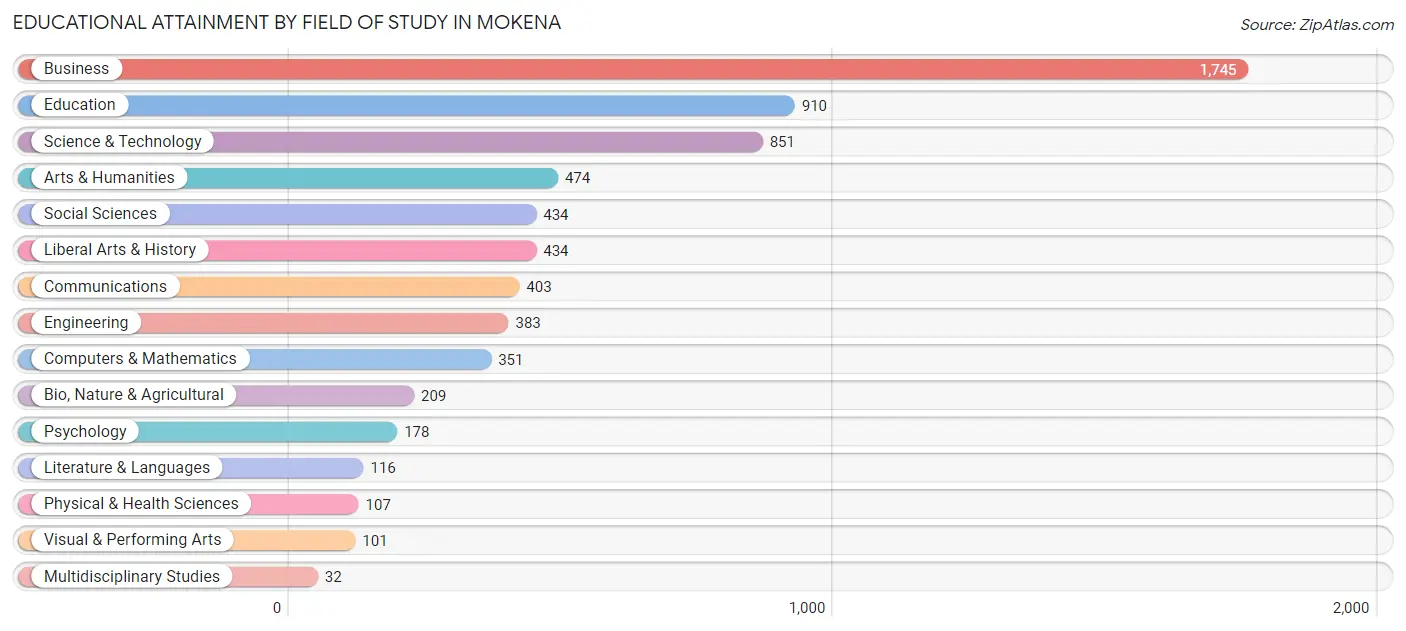
| Field of Study | # Graduates | % Graduates |
| Computers & Mathematics | 351 | 5.2% |
| Bio, Nature & Agricultural | 209 | 3.1% |
| Physical & Health Sciences | 107 | 1.6% |
| Psychology | 178 | 2.6% |
| Social Sciences | 434 | 6.5% |
| Engineering | 383 | 5.7% |
| Multidisciplinary Studies | 32 | 0.5% |
| Science & Technology | 851 | 12.7% |
| Business | 1,745 | 25.9% |
| Education | 910 | 13.5% |
| Literature & Languages | 116 | 1.7% |
| Liberal Arts & History | 434 | 6.5% |
| Visual & Performing Arts | 101 | 1.5% |
| Communications | 403 | 6.0% |
| Arts & Humanities | 474 | 7.0% |
| Total | 6,728 | 100.0% |
Transportation & Commute in Mokena
Vehicle Availability by Sex in Mokena
The most prevalent vehicle ownership categories in Mokena are males with 2 vehicles (2,418, accounting for 41.5%) and females with 2 vehicles (2,246, making up 47.5%).
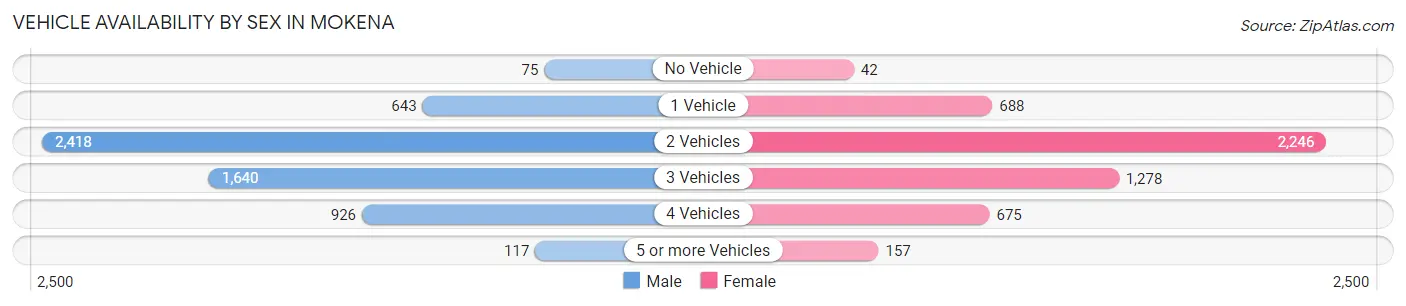
| Vehicles Available | Male | Female |
| No Vehicle | 75 (1.3%) | 42 (0.8%) |
| 1 Vehicle | 643 (11.1%) | 688 (13.5%) |
| 2 Vehicles | 2,418 (41.5%) | 2,246 (44.2%) |
| 3 Vehicles | 1,640 (28.2%) | 1,278 (25.1%) |
| 4 Vehicles | 926 (15.9%) | 675 (13.3%) |
| 5 or more Vehicles | 117 (2.0%) | 157 (3.1%) |
| Total | 5,819 (100.0%) | 5,086 (100.0%) |
Commute Time in Mokena
The most frequently occuring commute durations in Mokena are 60 to 89 minutes (1,280 commuters, 13.5%), 45 to 59 minutes (1,274 commuters, 13.4%), and 15 to 19 minutes (1,220 commuters, 12.8%).
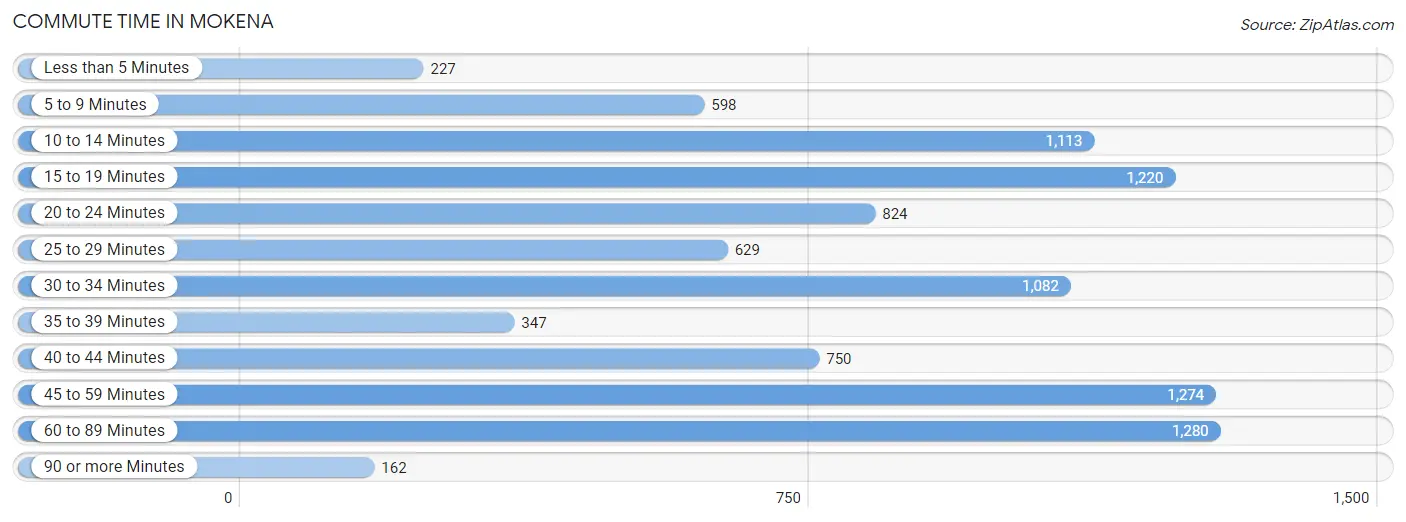
| Commute Time | # Commuters | % Commuters |
| Less than 5 Minutes | 227 | 2.4% |
| 5 to 9 Minutes | 598 | 6.3% |
| 10 to 14 Minutes | 1,113 | 11.7% |
| 15 to 19 Minutes | 1,220 | 12.8% |
| 20 to 24 Minutes | 824 | 8.7% |
| 25 to 29 Minutes | 629 | 6.6% |
| 30 to 34 Minutes | 1,082 | 11.4% |
| 35 to 39 Minutes | 347 | 3.6% |
| 40 to 44 Minutes | 750 | 7.9% |
| 45 to 59 Minutes | 1,274 | 13.4% |
| 60 to 89 Minutes | 1,280 | 13.5% |
| 90 or more Minutes | 162 | 1.7% |
Commute Time by Sex in Mokena
The most common commute times in Mokena are 60 to 89 minutes (1,050 commuters, 20.9%) for males and 15 to 19 minutes (866 commuters, 19.4%) for females.
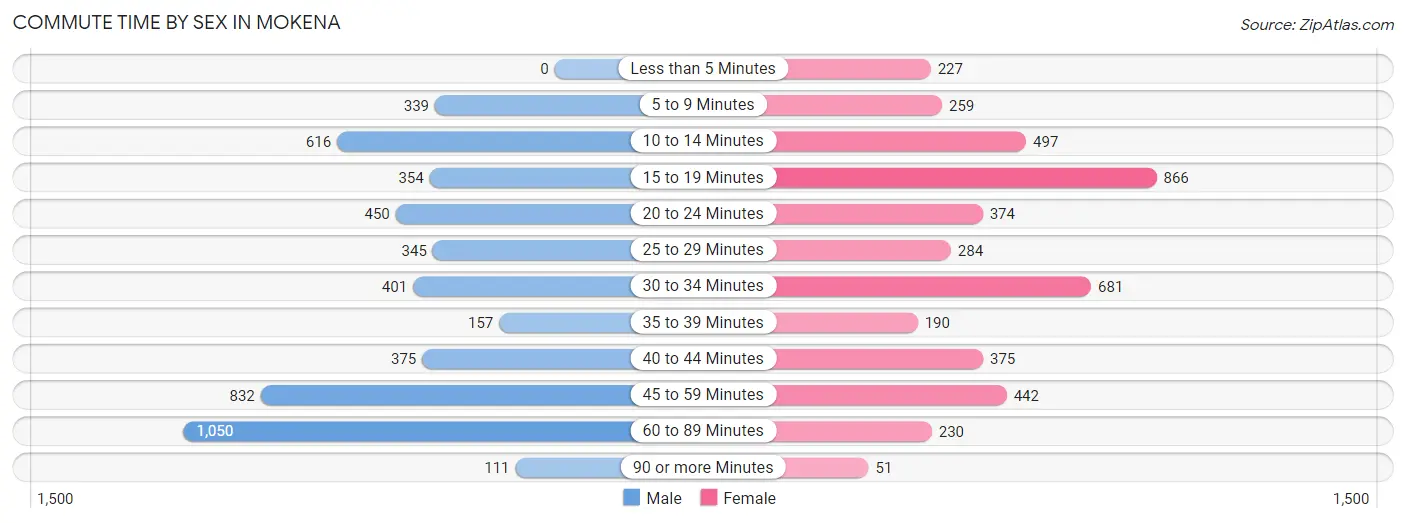
| Commute Time | Male | Female |
| Less than 5 Minutes | 0 (0.0%) | 227 (5.1%) |
| 5 to 9 Minutes | 339 (6.7%) | 259 (5.8%) |
| 10 to 14 Minutes | 616 (12.2%) | 497 (11.1%) |
| 15 to 19 Minutes | 354 (7.0%) | 866 (19.4%) |
| 20 to 24 Minutes | 450 (8.9%) | 374 (8.4%) |
| 25 to 29 Minutes | 345 (6.9%) | 284 (6.3%) |
| 30 to 34 Minutes | 401 (8.0%) | 681 (15.2%) |
| 35 to 39 Minutes | 157 (3.1%) | 190 (4.2%) |
| 40 to 44 Minutes | 375 (7.5%) | 375 (8.4%) |
| 45 to 59 Minutes | 832 (16.5%) | 442 (9.9%) |
| 60 to 89 Minutes | 1,050 (20.9%) | 230 (5.1%) |
| 90 or more Minutes | 111 (2.2%) | 51 (1.1%) |
Time of Departure to Work by Sex in Mokena
The most frequent times of departure to work in Mokena are 7:00 AM to 7:29 AM (1,114, 22.2%) for males and 7:00 AM to 7:29 AM (720, 16.1%) for females.
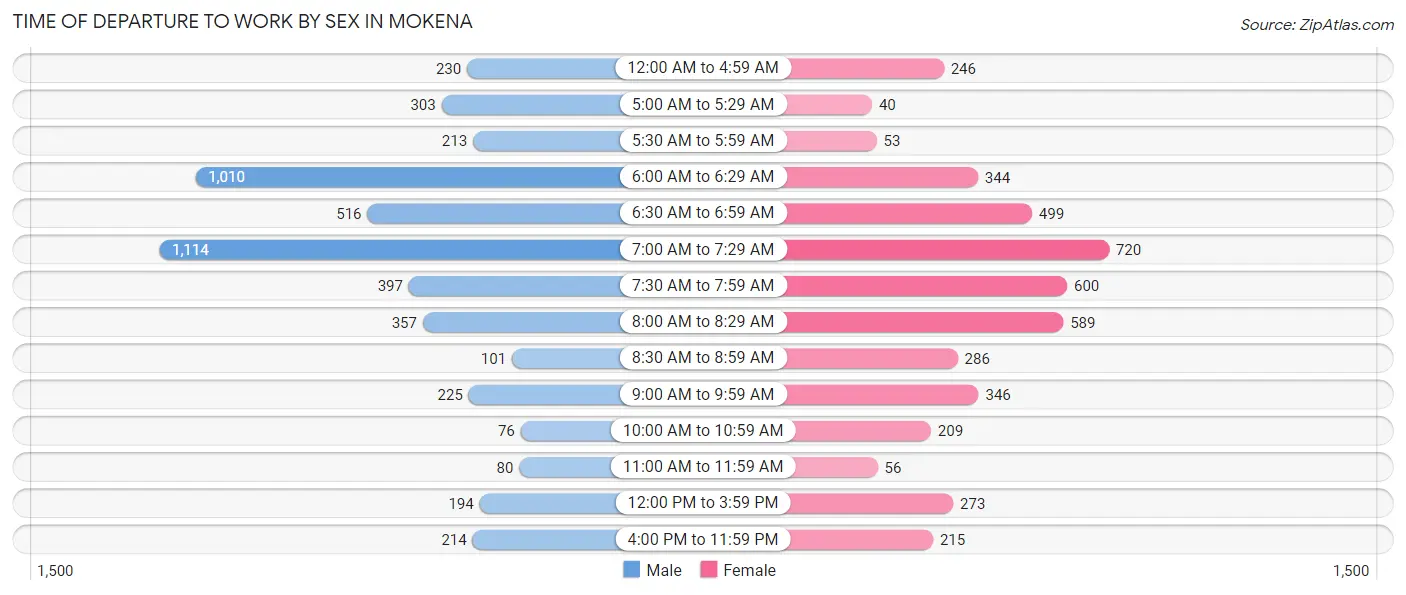
| Time of Departure | Male | Female |
| 12:00 AM to 4:59 AM | 230 (4.6%) | 246 (5.5%) |
| 5:00 AM to 5:29 AM | 303 (6.0%) | 40 (0.9%) |
| 5:30 AM to 5:59 AM | 213 (4.2%) | 53 (1.2%) |
| 6:00 AM to 6:29 AM | 1,010 (20.1%) | 344 (7.7%) |
| 6:30 AM to 6:59 AM | 516 (10.3%) | 499 (11.2%) |
| 7:00 AM to 7:29 AM | 1,114 (22.2%) | 720 (16.1%) |
| 7:30 AM to 7:59 AM | 397 (7.9%) | 600 (13.4%) |
| 8:00 AM to 8:29 AM | 357 (7.1%) | 589 (13.2%) |
| 8:30 AM to 8:59 AM | 101 (2.0%) | 286 (6.4%) |
| 9:00 AM to 9:59 AM | 225 (4.5%) | 346 (7.7%) |
| 10:00 AM to 10:59 AM | 76 (1.5%) | 209 (4.7%) |
| 11:00 AM to 11:59 AM | 80 (1.6%) | 56 (1.3%) |
| 12:00 PM to 3:59 PM | 194 (3.9%) | 273 (6.1%) |
| 4:00 PM to 11:59 PM | 214 (4.3%) | 215 (4.8%) |
| Total | 5,030 (100.0%) | 4,476 (100.0%) |
Housing Occupancy in Mokena
Occupancy by Ownership in Mokena
Of the total 7,299 dwellings in Mokena, owner-occupied units account for 6,640 (91.0%), while renter-occupied units make up 659 (9.0%).
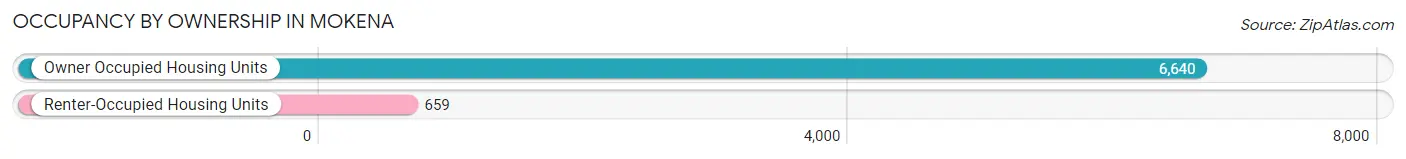
| Occupancy | # Housing Units | % Housing Units |
| Owner Occupied Housing Units | 6,640 | 91.0% |
| Renter-Occupied Housing Units | 659 | 9.0% |
| Total Occupied Housing Units | 7,299 | 100.0% |
Occupancy by Household Size in Mokena
| Household Size | # Housing Units | % Housing Units |
| 1-Person Household | 1,485 | 20.3% |
| 2-Person Household | 2,406 | 33.0% |
| 3-Person Household | 1,611 | 22.1% |
| 4+ Person Household | 1,797 | 24.6% |
| Total Housing Units | 7,299 | 100.0% |
Occupancy by Ownership by Household Size in Mokena
| Household Size | Owner-occupied | Renter-occupied |
| 1-Person Household | 1,241 (83.6%) | 244 (16.4%) |
| 2-Person Household | 2,143 (89.1%) | 263 (10.9%) |
| 3-Person Household | 1,507 (93.5%) | 104 (6.5%) |
| 4+ Person Household | 1,749 (97.3%) | 48 (2.7%) |
| Total Housing Units | 6,640 (91.0%) | 659 (9.0%) |
Occupancy by Educational Attainment in Mokena
| Household Size | Owner-occupied | Renter-occupied |
| Less than High School | 67 (61.5%) | 42 (38.5%) |
| High School Diploma | 1,035 (92.3%) | 86 (7.7%) |
| College/Associate Degree | 1,949 (88.0%) | 265 (12.0%) |
| Bachelor's Degree or higher | 3,589 (93.1%) | 266 (6.9%) |
Occupancy by Age of Householder in Mokena
| Age Bracket | # Households | % Households |
| Under 35 Years | 744 | 10.2% |
| 35 to 44 Years | 1,150 | 15.8% |
| 45 to 54 Years | 1,668 | 22.9% |
| 55 to 64 Years | 1,711 | 23.4% |
| 65 to 74 Years | 1,204 | 16.5% |
| 75 to 84 Years | 649 | 8.9% |
| 85 Years and Over | 173 | 2.4% |
| Total | 7,299 | 100.0% |
Housing Finances in Mokena
Median Income by Occupancy in Mokena
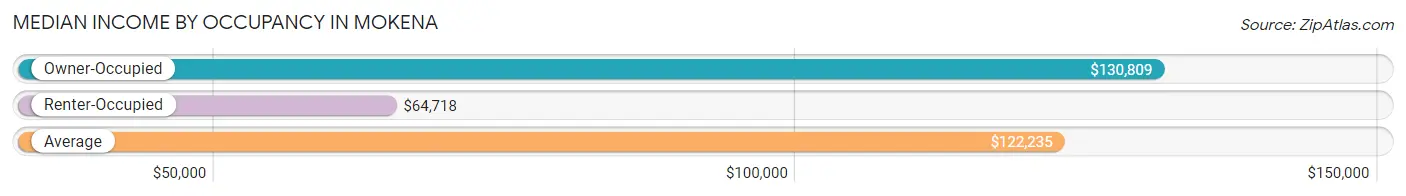
| Occupancy Type | # Households | Median Income |
| Owner-Occupied | 6,640 (91.0%) | $130,809 |
| Renter-Occupied | 659 (9.0%) | $64,718 |
| Average | 7,299 (100.0%) | $122,235 |
Occupancy by Householder Income Bracket in Mokena
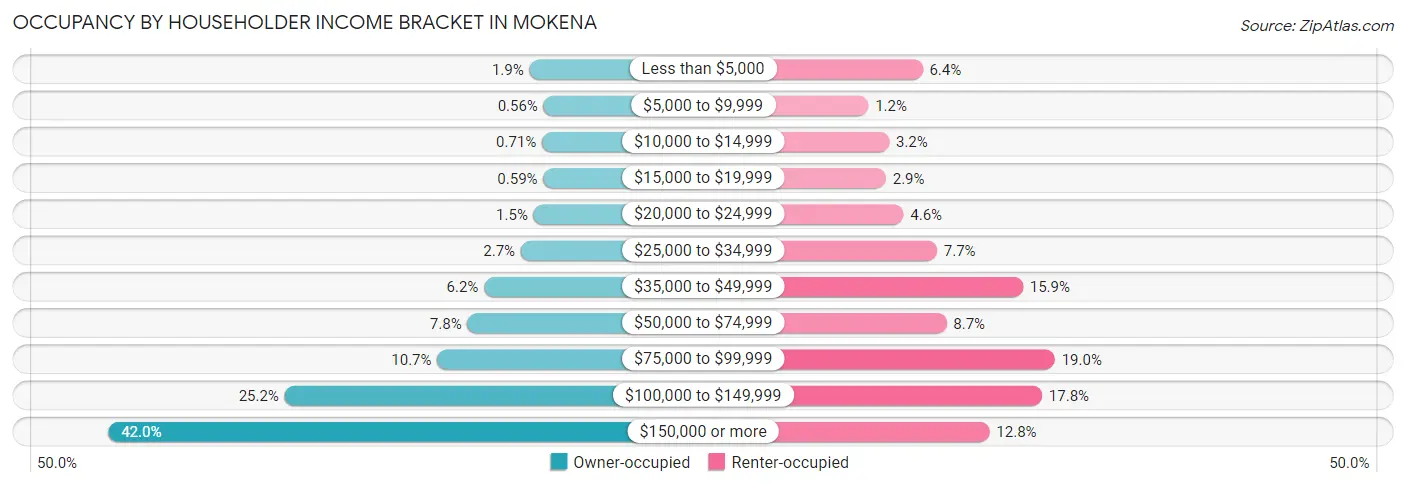
| Income Bracket | Owner-occupied | Renter-occupied |
| Less than $5,000 | 127 (1.9%) | 42 (6.4%) |
| $5,000 to $9,999 | 37 (0.6%) | 8 (1.2%) |
| $10,000 to $14,999 | 47 (0.7%) | 21 (3.2%) |
| $15,000 to $19,999 | 39 (0.6%) | 19 (2.9%) |
| $20,000 to $24,999 | 100 (1.5%) | 30 (4.5%) |
| $25,000 to $34,999 | 181 (2.7%) | 51 (7.7%) |
| $35,000 to $49,999 | 414 (6.2%) | 105 (15.9%) |
| $50,000 to $74,999 | 519 (7.8%) | 57 (8.6%) |
| $75,000 to $99,999 | 710 (10.7%) | 125 (19.0%) |
| $100,000 to $149,999 | 1,675 (25.2%) | 117 (17.7%) |
| $150,000 or more | 2,791 (42.0%) | 84 (12.8%) |
| Total | 6,640 (100.0%) | 659 (100.0%) |
Monthly Housing Cost Tiers in Mokena
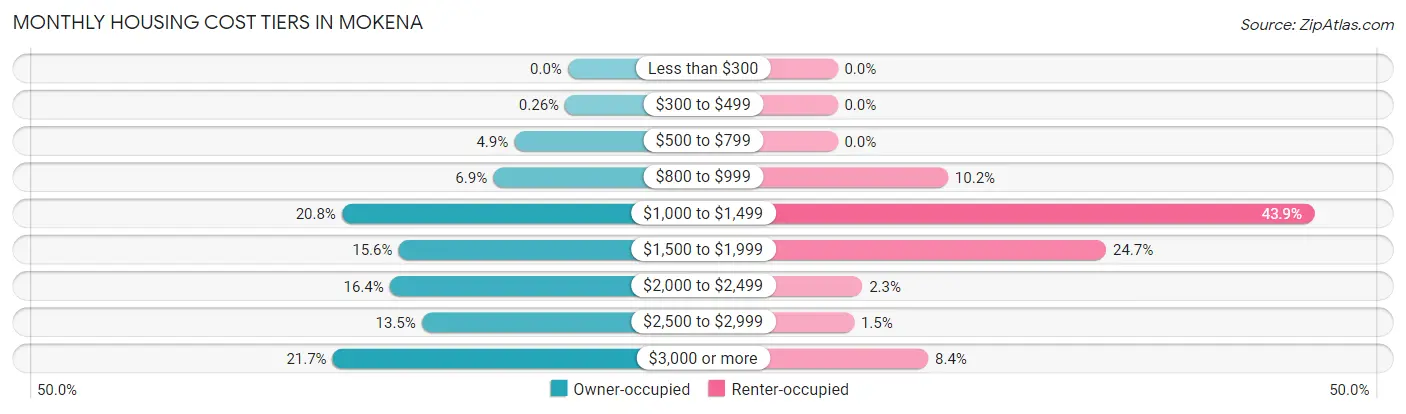
| Monthly Cost | Owner-occupied | Renter-occupied |
| Less than $300 | 0 (0.0%) | 0 (0.0%) |
| $300 to $499 | 17 (0.3%) | 0 (0.0%) |
| $500 to $799 | 328 (4.9%) | 0 (0.0%) |
| $800 to $999 | 457 (6.9%) | 67 (10.2%) |
| $1,000 to $1,499 | 1,382 (20.8%) | 289 (43.9%) |
| $1,500 to $1,999 | 1,036 (15.6%) | 163 (24.7%) |
| $2,000 to $2,499 | 1,089 (16.4%) | 15 (2.3%) |
| $2,500 to $2,999 | 893 (13.5%) | 10 (1.5%) |
| $3,000 or more | 1,438 (21.7%) | 55 (8.4%) |
| Total | 6,640 (100.0%) | 659 (100.0%) |
Physical Housing Characteristics in Mokena
Housing Structures in Mokena
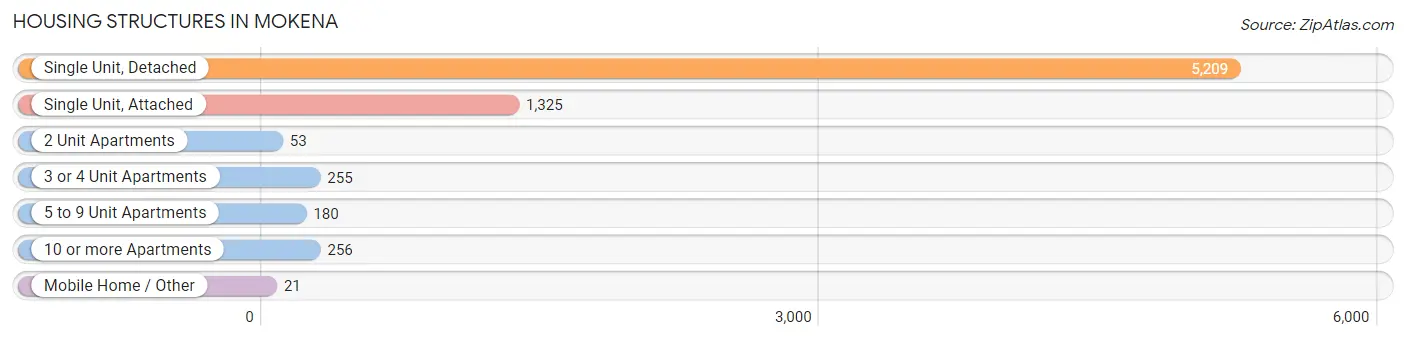
| Structure Type | # Housing Units | % Housing Units |
| Single Unit, Detached | 5,209 | 71.4% |
| Single Unit, Attached | 1,325 | 18.1% |
| 2 Unit Apartments | 53 | 0.7% |
| 3 or 4 Unit Apartments | 255 | 3.5% |
| 5 to 9 Unit Apartments | 180 | 2.5% |
| 10 or more Apartments | 256 | 3.5% |
| Mobile Home / Other | 21 | 0.3% |
| Total | 7,299 | 100.0% |
Housing Structures by Occupancy in Mokena
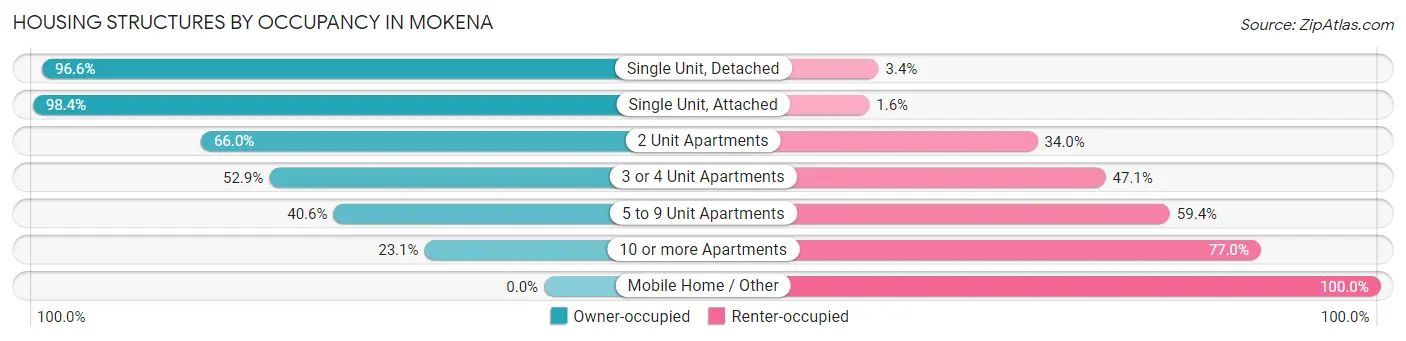
| Structure Type | Owner-occupied | Renter-occupied |
| Single Unit, Detached | 5,034 (96.6%) | 175 (3.4%) |
| Single Unit, Attached | 1,304 (98.4%) | 21 (1.6%) |
| 2 Unit Apartments | 35 (66.0%) | 18 (34.0%) |
| 3 or 4 Unit Apartments | 135 (52.9%) | 120 (47.1%) |
| 5 to 9 Unit Apartments | 73 (40.6%) | 107 (59.4%) |
| 10 or more Apartments | 59 (23.1%) | 197 (76.9%) |
| Mobile Home / Other | 0 (0.0%) | 21 (100.0%) |
| Total | 6,640 (91.0%) | 659 (9.0%) |
Housing Structures by Number of Rooms in Mokena
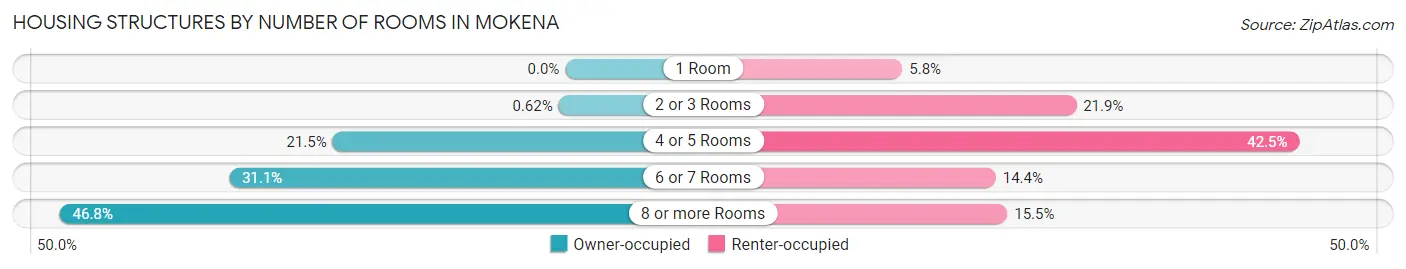
| Number of Rooms | Owner-occupied | Renter-occupied |
| 1 Room | 0 (0.0%) | 38 (5.8%) |
| 2 or 3 Rooms | 41 (0.6%) | 144 (21.8%) |
| 4 or 5 Rooms | 1,429 (21.5%) | 280 (42.5%) |
| 6 or 7 Rooms | 2,065 (31.1%) | 95 (14.4%) |
| 8 or more Rooms | 3,105 (46.8%) | 102 (15.5%) |
| Total | 6,640 (100.0%) | 659 (100.0%) |
Housing Structure by Heating Type in Mokena
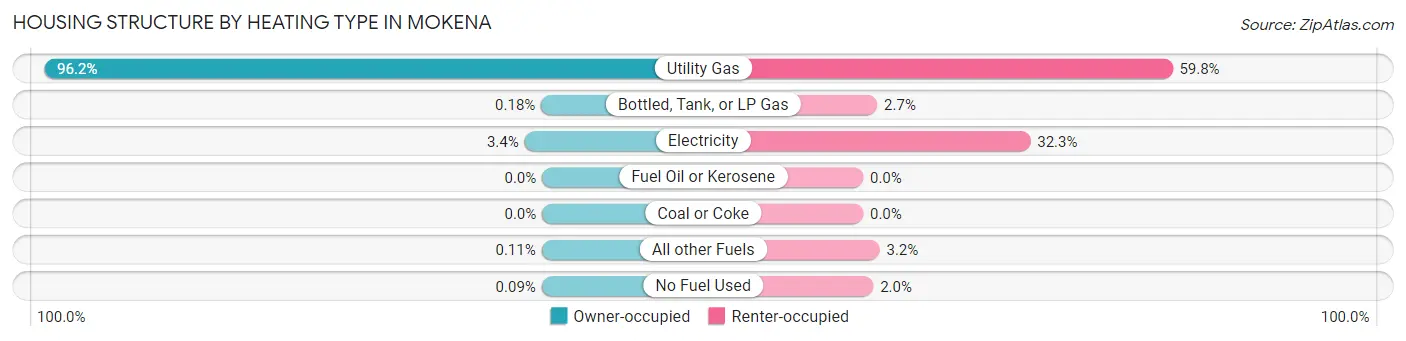
| Heating Type | Owner-occupied | Renter-occupied |
| Utility Gas | 6,390 (96.2%) | 394 (59.8%) |
| Bottled, Tank, or LP Gas | 12 (0.2%) | 18 (2.7%) |
| Electricity | 225 (3.4%) | 213 (32.3%) |
| Fuel Oil or Kerosene | 0 (0.0%) | 0 (0.0%) |
| Coal or Coke | 0 (0.0%) | 0 (0.0%) |
| All other Fuels | 7 (0.1%) | 21 (3.2%) |
| No Fuel Used | 6 (0.1%) | 13 (2.0%) |
| Total | 6,640 (100.0%) | 659 (100.0%) |
Household Vehicle Usage in Mokena
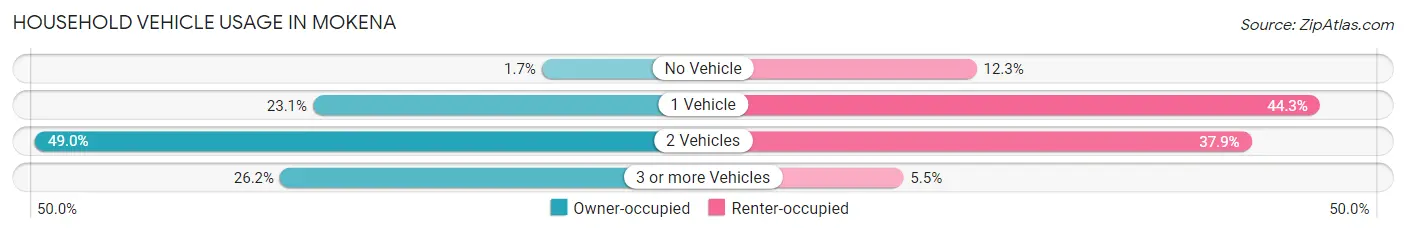
| Vehicles per Household | Owner-occupied | Renter-occupied |
| No Vehicle | 115 (1.7%) | 81 (12.3%) |
| 1 Vehicle | 1,533 (23.1%) | 292 (44.3%) |
| 2 Vehicles | 3,254 (49.0%) | 250 (37.9%) |
| 3 or more Vehicles | 1,738 (26.2%) | 36 (5.5%) |
| Total | 6,640 (100.0%) | 659 (100.0%) |
Real Estate & Mortgages in Mokena
Real Estate and Mortgage Overview in Mokena
| Characteristic | Without Mortgage | With Mortgage |
| Housing Units | 1,989 | 4,651 |
| Median Property Value | $358,600 | $373,900 |
| Median Household Income | $98,538 | $2,202 |
| Monthly Housing Costs | $1,119 | $1,438 |
| Real Estate Taxes | $8,207 | $35 |
Property Value by Mortgage Status in Mokena
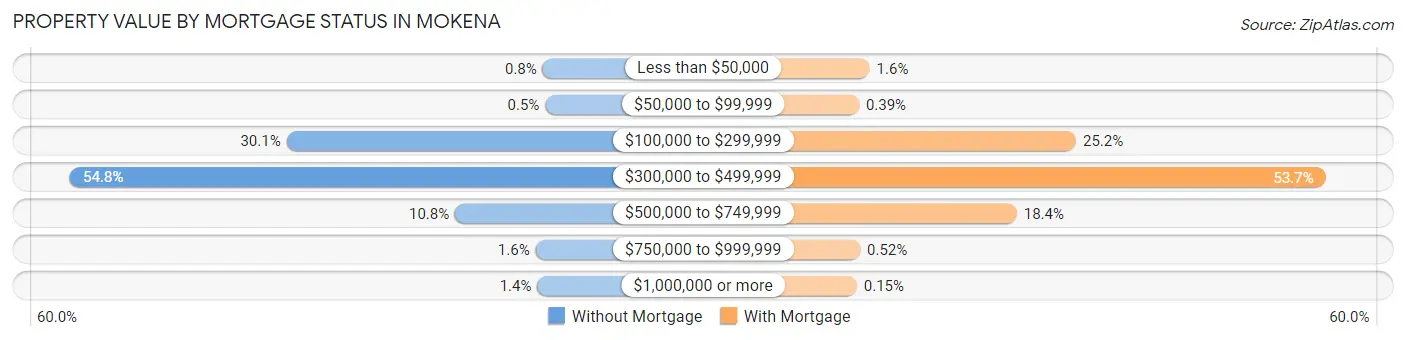
| Property Value | Without Mortgage | With Mortgage |
| Less than $50,000 | 16 (0.8%) | 75 (1.6%) |
| $50,000 to $99,999 | 10 (0.5%) | 18 (0.4%) |
| $100,000 to $299,999 | 598 (30.1%) | 1,172 (25.2%) |
| $300,000 to $499,999 | 1,090 (54.8%) | 2,498 (53.7%) |
| $500,000 to $749,999 | 215 (10.8%) | 857 (18.4%) |
| $750,000 to $999,999 | 32 (1.6%) | 24 (0.5%) |
| $1,000,000 or more | 28 (1.4%) | 7 (0.2%) |
| Total | 1,989 (100.0%) | 4,651 (100.0%) |
Household Income by Mortgage Status in Mokena
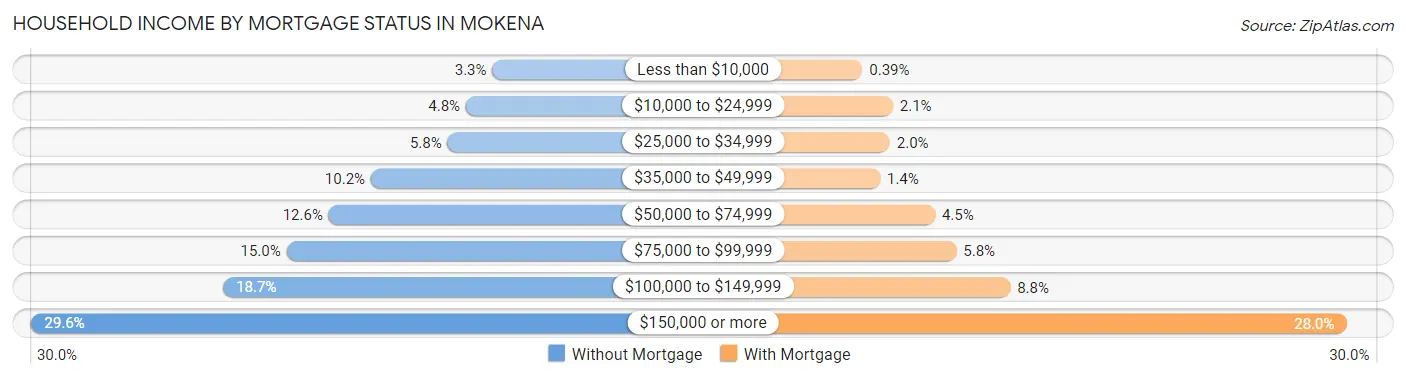
| Household Income | Without Mortgage | With Mortgage |
| Less than $10,000 | 65 (3.3%) | 18 (0.4%) |
| $10,000 to $24,999 | 95 (4.8%) | 99 (2.1%) |
| $25,000 to $34,999 | 116 (5.8%) | 91 (2.0%) |
| $35,000 to $49,999 | 203 (10.2%) | 65 (1.4%) |
| $50,000 to $74,999 | 251 (12.6%) | 211 (4.5%) |
| $75,000 to $99,999 | 299 (15.0%) | 268 (5.8%) |
| $100,000 to $149,999 | 371 (18.6%) | 411 (8.8%) |
| $150,000 or more | 589 (29.6%) | 1,304 (28.0%) |
| Total | 1,989 (100.0%) | 4,651 (100.0%) |
Property Value to Household Income Ratio in Mokena
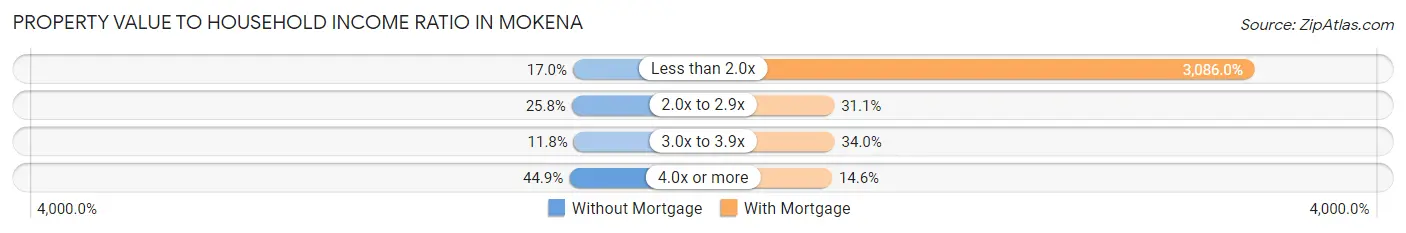
| Value-to-Income Ratio | Without Mortgage | With Mortgage |
| Less than 2.0x | 339 (17.0%) | 143,529 (3,086.0%) |
| 2.0x to 2.9x | 513 (25.8%) | 1,444 (31.0%) |
| 3.0x to 3.9x | 234 (11.8%) | 1,581 (34.0%) |
| 4.0x or more | 893 (44.9%) | 681 (14.6%) |
| Total | 1,989 (100.0%) | 4,651 (100.0%) |
Real Estate Taxes by Mortgage Status in Mokena
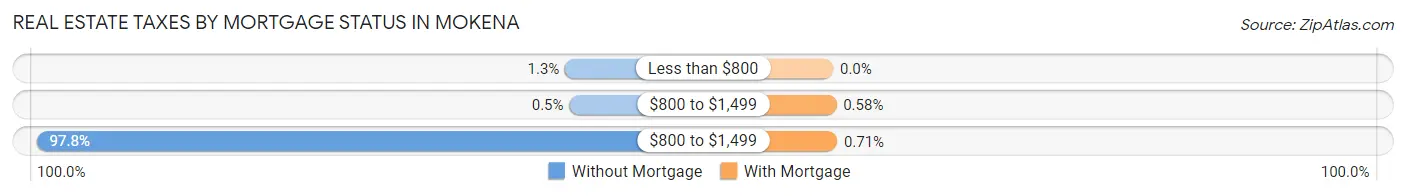
| Property Taxes | Without Mortgage | With Mortgage |
| Less than $800 | 25 (1.3%) | 0 (0.0%) |
| $800 to $1,499 | 10 (0.5%) | 27 (0.6%) |
| $800 to $1,499 | 1,945 (97.8%) | 33 (0.7%) |
| Total | 1,989 (100.0%) | 4,651 (100.0%) |
Health & Disability in Mokena
Health Insurance Coverage by Age in Mokena
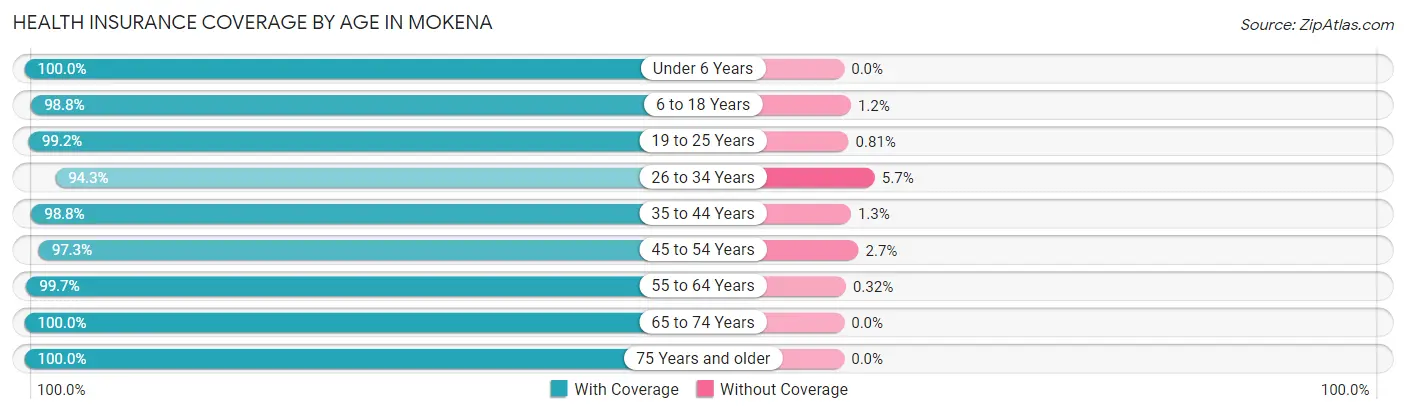
| Age Bracket | With Coverage | Without Coverage |
| Under 6 Years | 1,401 (100.0%) | 0 (0.0%) |
| 6 to 18 Years | 3,106 (98.8%) | 39 (1.2%) |
| 19 to 25 Years | 1,467 (99.2%) | 12 (0.8%) |
| 26 to 34 Years | 1,898 (94.3%) | 115 (5.7%) |
| 35 to 44 Years | 2,215 (98.8%) | 28 (1.3%) |
| 45 to 54 Years | 2,814 (97.3%) | 77 (2.7%) |
| 55 to 64 Years | 3,397 (99.7%) | 11 (0.3%) |
| 65 to 74 Years | 2,103 (100.0%) | 0 (0.0%) |
| 75 Years and older | 1,203 (100.0%) | 0 (0.0%) |
| Total | 19,604 (98.6%) | 282 (1.4%) |
Health Insurance Coverage by Citizenship Status in Mokena
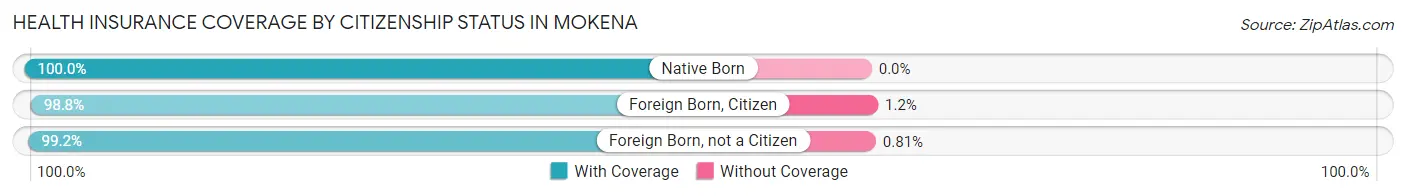
| Citizenship Status | With Coverage | Without Coverage |
| Native Born | 1,401 (100.0%) | 0 (0.0%) |
| Foreign Born, Citizen | 3,106 (98.8%) | 39 (1.2%) |
| Foreign Born, not a Citizen | 1,467 (99.2%) | 12 (0.8%) |
Health Insurance Coverage by Household Income in Mokena
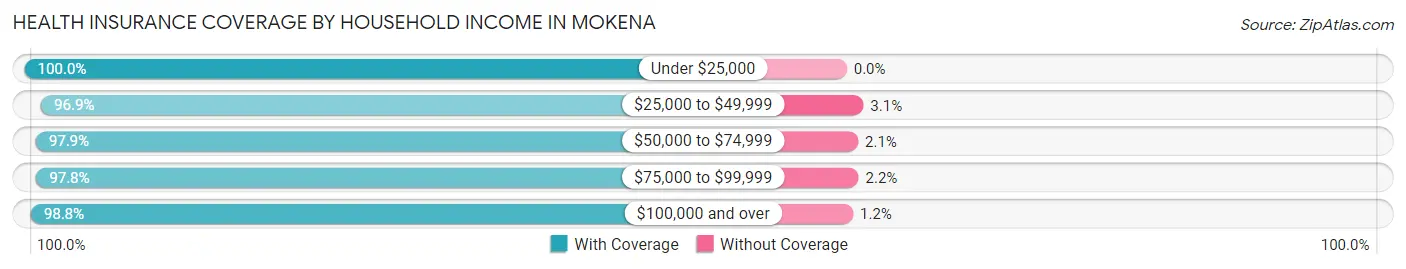
| Household Income | With Coverage | Without Coverage |
| Under $25,000 | 875 (100.0%) | 0 (0.0%) |
| $25,000 to $49,999 | 1,433 (96.9%) | 46 (3.1%) |
| $50,000 to $74,999 | 1,157 (97.9%) | 25 (2.1%) |
| $75,000 to $99,999 | 1,593 (97.8%) | 36 (2.2%) |
| $100,000 and over | 14,531 (98.8%) | 174 (1.2%) |
Public vs Private Health Insurance Coverage by Age in Mokena
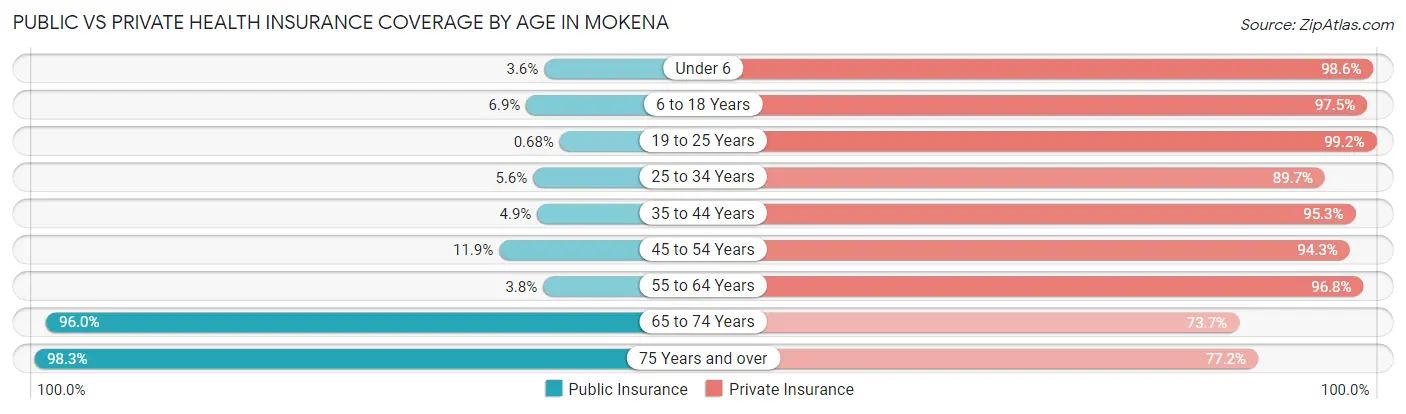
| Age Bracket | Public Insurance | Private Insurance |
| Under 6 | 50 (3.6%) | 1,382 (98.6%) |
| 6 to 18 Years | 217 (6.9%) | 3,066 (97.5%) |
| 19 to 25 Years | 10 (0.7%) | 1,467 (99.2%) |
| 25 to 34 Years | 113 (5.6%) | 1,805 (89.7%) |
| 35 to 44 Years | 109 (4.9%) | 2,138 (95.3%) |
| 45 to 54 Years | 345 (11.9%) | 2,725 (94.3%) |
| 55 to 64 Years | 128 (3.8%) | 3,299 (96.8%) |
| 65 to 74 Years | 2,019 (96.0%) | 1,550 (73.7%) |
| 75 Years and over | 1,182 (98.3%) | 929 (77.2%) |
| Total | 4,173 (21.0%) | 18,361 (92.3%) |
Disability Status by Sex by Age in Mokena
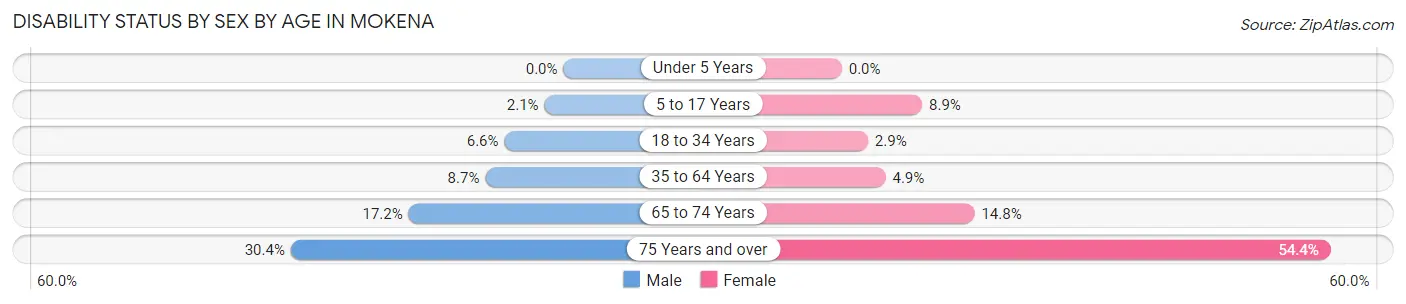
| Age Bracket | Male | Female |
| Under 5 Years | 0 (0.0%) | 0 (0.0%) |
| 5 to 17 Years | 37 (2.1%) | 137 (8.9%) |
| 18 to 34 Years | 130 (6.6%) | 49 (2.9%) |
| 35 to 64 Years | 377 (8.7%) | 205 (4.9%) |
| 65 to 74 Years | 155 (17.2%) | 178 (14.8%) |
| 75 Years and over | 150 (30.4%) | 386 (54.4%) |
Disability Class by Sex by Age in Mokena
Disability Class: Hearing Difficulty
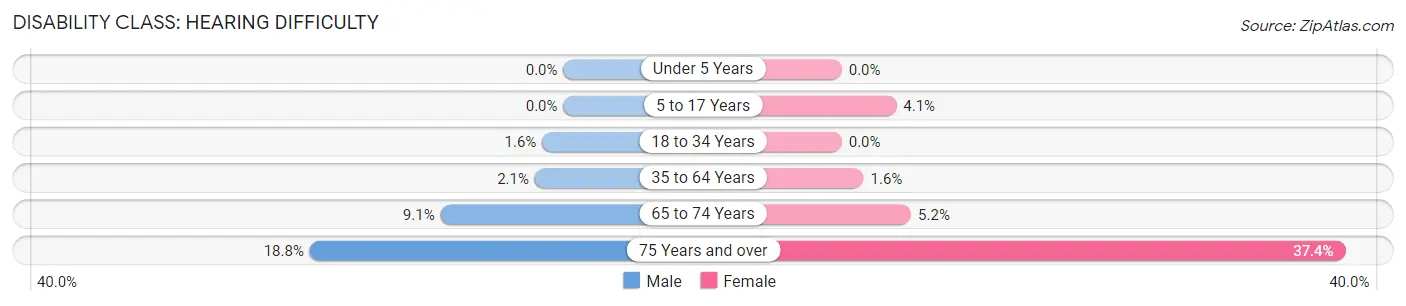
| Age Bracket | Male | Female |
| Under 5 Years | 0 (0.0%) | 0 (0.0%) |
| 5 to 17 Years | 0 (0.0%) | 62 (4.1%) |
| 18 to 34 Years | 31 (1.6%) | 0 (0.0%) |
| 35 to 64 Years | 92 (2.1%) | 68 (1.6%) |
| 65 to 74 Years | 82 (9.1%) | 62 (5.1%) |
| 75 Years and over | 93 (18.8%) | 265 (37.4%) |
Disability Class: Vision Difficulty
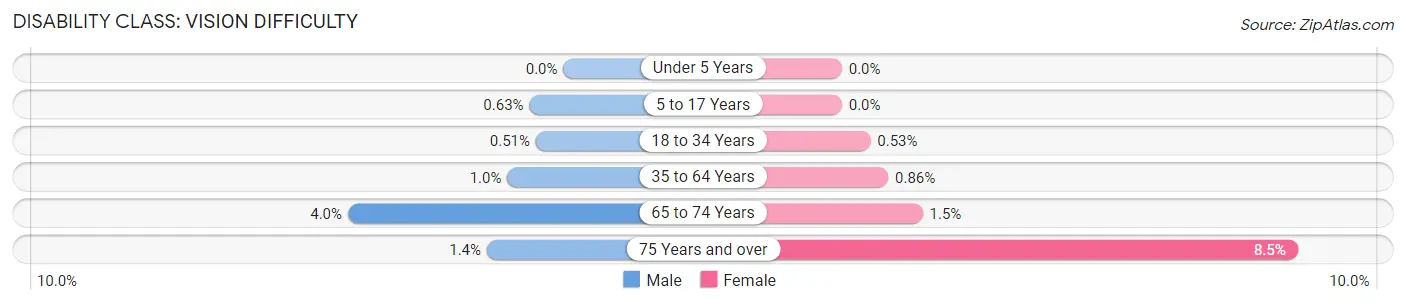
| Age Bracket | Male | Female |
| Under 5 Years | 0 (0.0%) | 0 (0.0%) |
| 5 to 17 Years | 11 (0.6%) | 0 (0.0%) |
| 18 to 34 Years | 10 (0.5%) | 9 (0.5%) |
| 35 to 64 Years | 45 (1.0%) | 36 (0.9%) |
| 65 to 74 Years | 36 (4.0%) | 18 (1.5%) |
| 75 Years and over | 7 (1.4%) | 60 (8.5%) |
Disability Class: Cognitive Difficulty
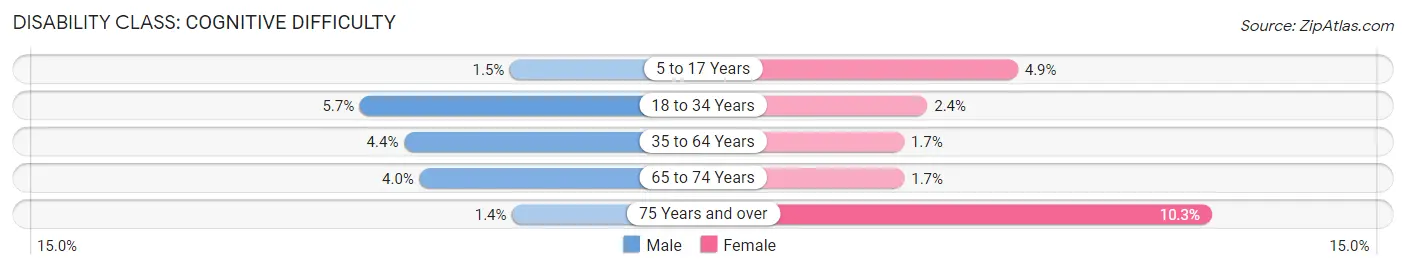
| Age Bracket | Male | Female |
| 5 to 17 Years | 26 (1.5%) | 75 (4.9%) |
| 18 to 34 Years | 112 (5.7%) | 40 (2.4%) |
| 35 to 64 Years | 192 (4.4%) | 73 (1.7%) |
| 65 to 74 Years | 36 (4.0%) | 21 (1.7%) |
| 75 Years and over | 7 (1.4%) | 73 (10.3%) |
Disability Class: Ambulatory Difficulty
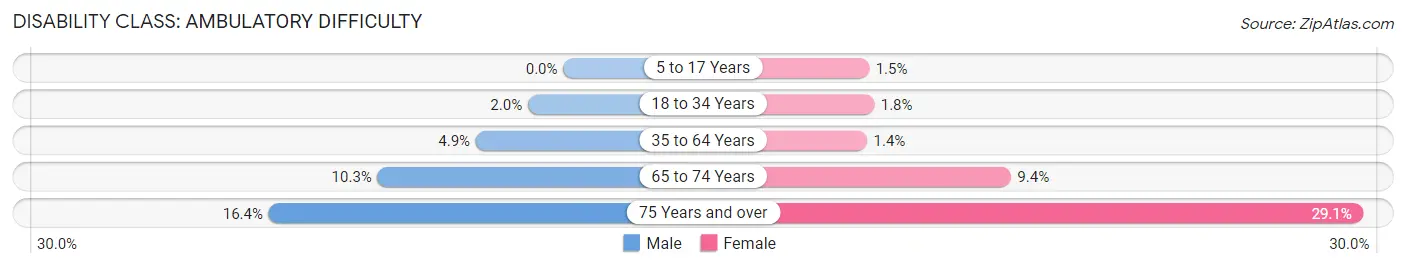
| Age Bracket | Male | Female |
| 5 to 17 Years | 0 (0.0%) | 23 (1.5%) |
| 18 to 34 Years | 39 (2.0%) | 30 (1.8%) |
| 35 to 64 Years | 211 (4.9%) | 58 (1.4%) |
| 65 to 74 Years | 93 (10.3%) | 113 (9.4%) |
| 75 Years and over | 81 (16.4%) | 206 (29.1%) |
Disability Class: Self-Care Difficulty
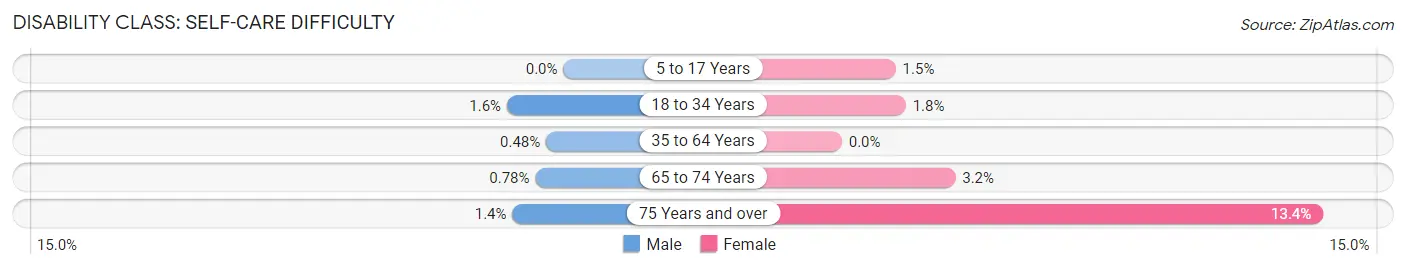
| Age Bracket | Male | Female |
| 5 to 17 Years | 0 (0.0%) | 23 (1.5%) |
| 18 to 34 Years | 31 (1.6%) | 30 (1.8%) |
| 35 to 64 Years | 21 (0.5%) | 0 (0.0%) |
| 65 to 74 Years | 7 (0.8%) | 38 (3.2%) |
| 75 Years and over | 7 (1.4%) | 95 (13.4%) |
Technology Access in Mokena
Computing Device Access in Mokena
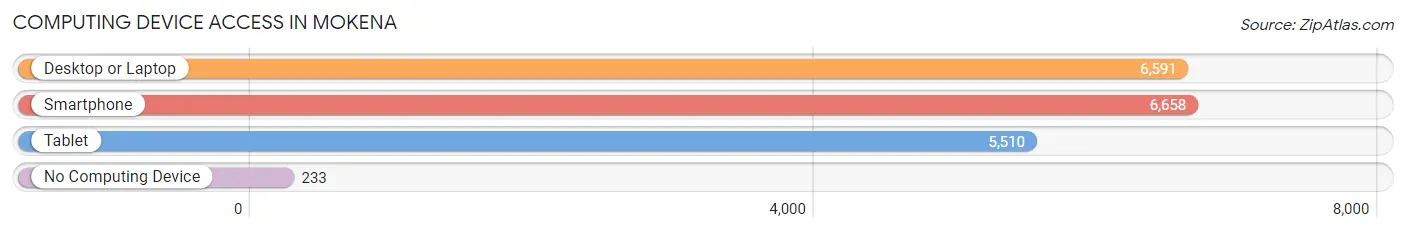
| Device Type | # Households | % Households |
| Desktop or Laptop | 6,591 | 90.3% |
| Smartphone | 6,658 | 91.2% |
| Tablet | 5,510 | 75.5% |
| No Computing Device | 233 | 3.2% |
| Total | 7,299 | 100.0% |
Internet Access in Mokena
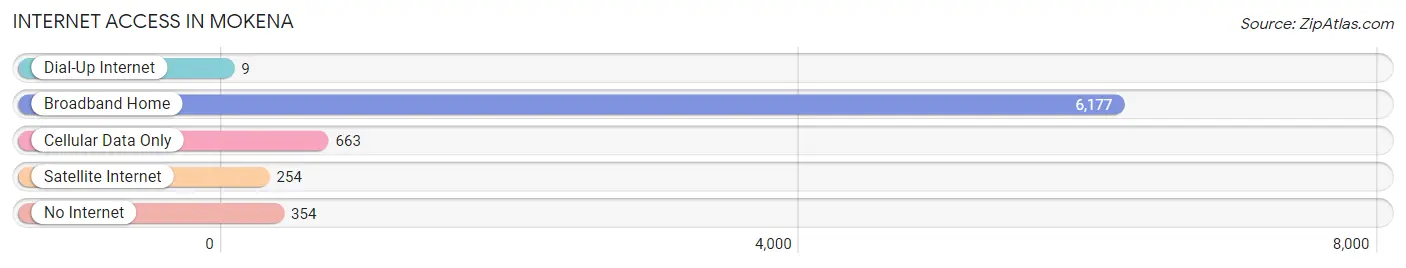
| Internet Type | # Households | % Households |
| Dial-Up Internet | 9 | 0.1% |
| Broadband Home | 6,177 | 84.6% |
| Cellular Data Only | 663 | 9.1% |
| Satellite Internet | 254 | 3.5% |
| No Internet | 354 | 4.9% |
| Total | 7,299 | 100.0% |
Mokena Summary
Mokena is a village located in Will County, Illinois, United States. The population was 19,619 at the 2010 census. It is located approximately 32 miles southwest of Chicago. Mokena is a rapidly growing suburb of Chicago and is part of the Chicago metropolitan area.
History
Mokena was first settled in 1833 by German immigrants. The village was named after a Potawatomi chief who lived in the area. The chief's name was Mokwa, which was later changed to Mokena. The village was incorporated in 1883.
In the late 19th century, Mokena was a small farming community. The village was known for its production of wheat, corn, and dairy products. In the early 20th century, the village began to grow as more people moved to the area. The population increased from 1,000 in 1920 to 4,000 in 1950.
Geography
Mokena is located at 41°31'17" North, 87°51'17" West (41.5214, -87.8548). According to the 2010 census, Mokena has a total area of 8.9 square miles, of which 8.8 square miles is land and 0.1 square miles is water.
Economy
Mokena's economy is largely based on retail and services. The village is home to several large retail stores, including Walmart, Target, and Kohl's. There are also several restaurants, banks, and other businesses located in the village.
The village is also home to several industrial and manufacturing companies. These include the Mokena Industrial Park, which is home to several large companies, including Caterpillar, Inc., and the Mokena Technology Park, which is home to several technology companies.
Demographics
As of the 2010 census, there were 19,619 people, 6,945 households, and 5,541 families residing in the village. The population density was 2,213.3 people per square mile. The racial makeup of the village was 92.2% White, 2.2% African American, 0.2% Native American, 2.3% Asian, 0.1% Pacific Islander, 1.7% from other races, and 1.4% from two or more races. Hispanic or Latino of any race were 6.2% of the population.
The median income for a household in the village was $87,945, and the median income for a family was $102,945. The per capita income for the village was $37,945. About 2.2% of families and 2.7% of the population were below the poverty line, including 3.2% of those under age 18 and 2.2% of those age 65 or over.
Common Questions
What is Per Capita Income in Mokena?
Per Capita income in Mokena is $52,631.
What is the Median Family Income in Mokena?
Median Family Income in Mokena is $147,826.
What is the Median Household income in Mokena?
Median Household Income in Mokena is $122,235.
What is Income or Wage Gap in Mokena?
Income or Wage Gap in Mokena is 27.8%.
Women in Mokena earn 72.2 cents for every dollar earned by a man.
What is Family Income Deficit in Mokena?
Family Income Deficit in Mokena is $9,417.
Families that are below poverty line in Mokena earn $9,417 less on average than the poverty threshold level.
What is Inequality or Gini Index in Mokena?
Inequality or Gini Index in Mokena is 0.37.
What is the Total Population of Mokena?
Total Population of Mokena is 19,886.
What is the Total Male Population of Mokena?
Total Male Population of Mokena is 9,930.
What is the Total Female Population of Mokena?
Total Female Population of Mokena is 9,956.
What is the Ratio of Males per 100 Females in Mokena?
There are 99.74 Males per 100 Females in Mokena.
What is the Ratio of Females per 100 Males in Mokena?
There are 100.26 Females per 100 Males in Mokena.
What is the Median Population Age in Mokena?
Median Population Age in Mokena is 43.1 Years.
What is the Average Family Size in Mokena
Average Family Size in Mokena is 3.2 People.
What is the Average Household Size in Mokena
Average Household Size in Mokena is 2.7 People.
How Large is the Labor Force in Mokena?
There are 11,446 People in the Labor Forcein in Mokena.
What is the Percentage of People in the Labor Force in Mokena?
70.7% of People are in the Labor Force in Mokena.
What is the Unemployment Rate in Mokena?
Unemployment Rate in Mokena is 3.4%.