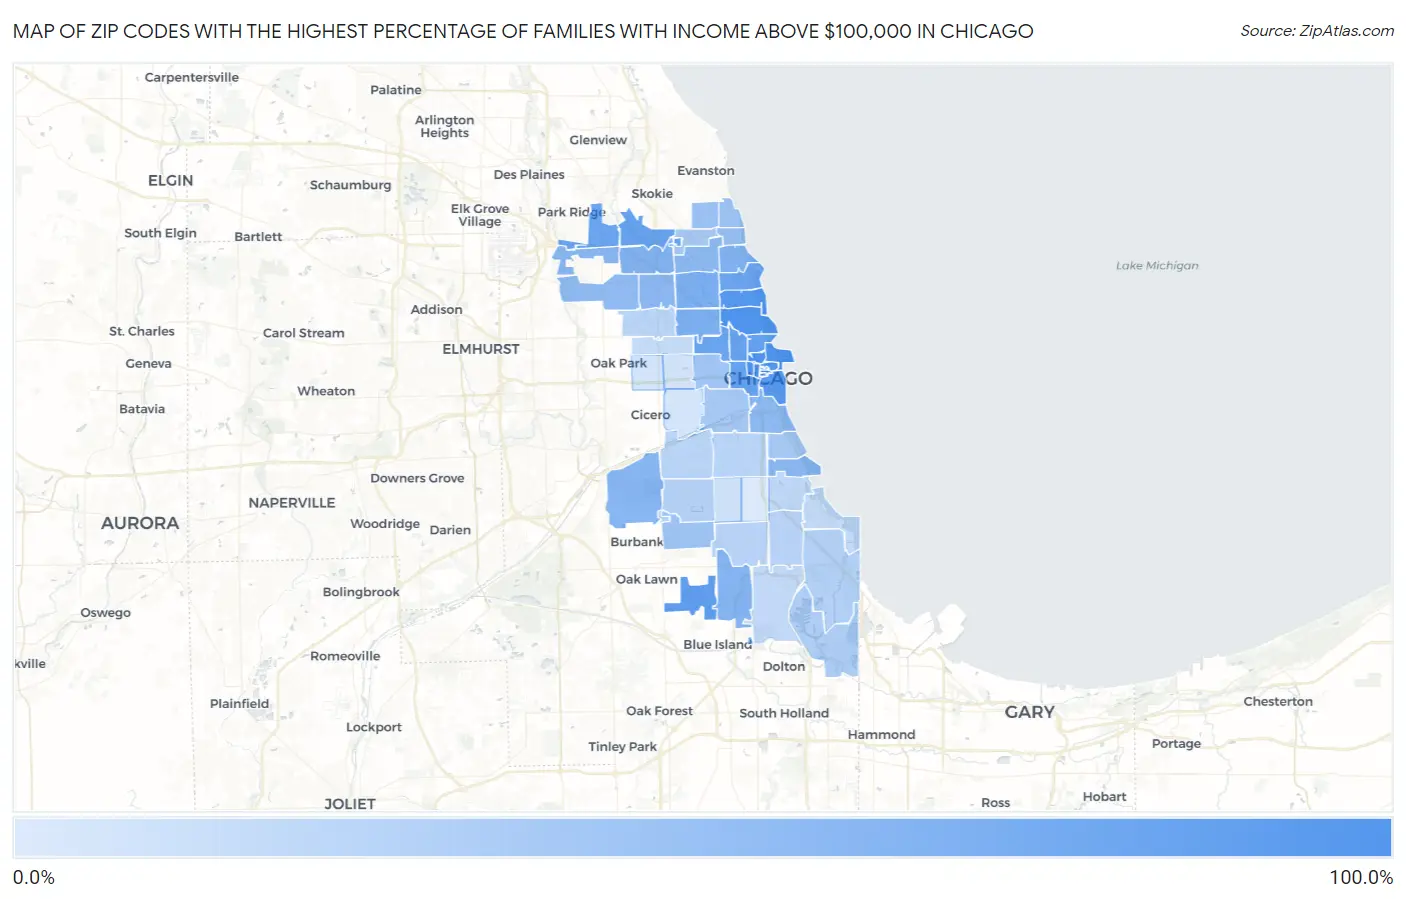
Zip Codes with the Highest Percentage of Families with Income Above $100,000 in Chicago, IL
RELATED REPORTS & OPTIONS
Family Income | $100k+
Chicago
Compare Zip Codes
Map of Zip Codes with the Highest Percentage of Families with Income Above $100,000 in Chicago
13.1%
90.5%
Zip Codes with the Highest Percentage of Families with Income Above $100,000 in Chicago, IL
| Zip Code | Families with Income > $100k | vs State | vs National | |
| 1. | 60603 | 90.5% | 49.7%(+40.8)#7 | 46.1%(+44.4)#351 |
| 2. | 60606 | 88.2% | 49.7%(+38.5)#8 | 46.1%(+42.1)#417 |
| 3. | 60654 | 87.1% | 49.7%(+37.4)#11 | 46.1%(+41.0)#470 |
| 4. | 60611 | 85.9% | 49.7%(+36.2)#15 | 46.1%(+39.8)#538 |
| 5. | 60661 | 85.9% | 49.7%(+36.2)#16 | 46.1%(+39.8)#540 |
| 6. | 60614 | 84.3% | 49.7%(+34.6)#20 | 46.1%(+38.2)#642 |
| 7. | 60657 | 81.0% | 49.7%(+31.3)#31 | 46.1%(+34.9)#911 |
| 8. | 60601 | 81.0% | 49.7%(+31.3)#32 | 46.1%(+34.9)#914 |
| 9. | 60605 | 79.8% | 49.7%(+30.1)#39 | 46.1%(+33.7)#1,046 |
| 10. | 60655 | 74.5% | 49.7%(+24.8)#67 | 46.1%(+28.4)#1,778 |
| 11. | 60610 | 73.1% | 49.7%(+23.4)#75 | 46.1%(+27.0)#2,018 |
| 12. | 60607 | 71.1% | 49.7%(+21.4)#88 | 46.1%(+25.0)#2,381 |
| 13. | 60642 | 70.4% | 49.7%(+20.7)#93 | 46.1%(+24.3)#2,521 |
| 14. | 60646 | 68.9% | 49.7%(+19.2)#108 | 46.1%(+22.8)#2,834 |
| 15. | 60622 | 68.5% | 49.7%(+18.8)#112 | 46.1%(+22.4)#2,909 |
| 16. | 60613 | 68.0% | 49.7%(+18.3)#119 | 46.1%(+21.9)#3,009 |
| 17. | 60631 | 67.3% | 49.7%(+17.6)#126 | 46.1%(+21.2)#3,181 |
| 18. | 60604 | 66.5% | 49.7%(+16.8)#134 | 46.1%(+20.4)#3,379 |
| 19. | 60602 | 64.2% | 49.7%(+14.5)#152 | 46.1%(+18.1)#3,965 |
| 20. | 60618 | 59.0% | 49.7%(+9.30)#226 | 46.1%(+12.9)#5,437 |
| 21. | 60647 | 58.9% | 49.7%(+9.20)#228 | 46.1%(+12.8)#5,471 |
| 22. | 60640 | 56.1% | 49.7%(+6.40)#275 | 46.1%(+10.0)#6,391 |
| 23. | 60630 | 54.9% | 49.7%(+5.20)#296 | 46.1%(+8.80)#6,823 |
| 24. | 60643 | 53.3% | 49.7%(+3.60)#329 | 46.1%(+7.20)#7,415 |
| 25. | 60638 | 52.1% | 49.7%(+2.40)#363 | 46.1%(+6.00)#7,921 |
| 26. | 60615 | 51.0% | 49.7%(+1.30)#385 | 46.1%(+4.90)#8,396 |
| 27. | 60656 | 51.0% | 49.7%(+1.30)#386 | 46.1%(+4.90)#8,402 |
| 28. | 60641 | 49.2% | 49.7%(-0.500)#424 | 46.1%(+3.10)#9,184 |
| 29. | 60616 | 49.0% | 49.7%(-0.700)#426 | 46.1%(+2.90)#9,256 |
| 30. | 60625 | 48.2% | 49.7%(-1.50)#448 | 46.1%(+2.10)#9,633 |
| 31. | 60634 | 47.3% | 49.7%(-2.40)#481 | 46.1%(+1.20)#10,121 |
| 32. | 60660 | 45.0% | 49.7%(-4.70)#550 | 46.1%(-1.10)#11,325 |
| 33. | 60645 | 42.3% | 49.7%(-7.40)#626 | 46.1%(-3.80)#12,922 |
| 34. | 60626 | 41.2% | 49.7%(-8.50)#671 | 46.1%(-4.90)#13,587 |
| 35. | 60652 | 40.4% | 49.7%(-9.30)#694 | 46.1%(-5.70)#14,109 |
| 36. | 60612 | 39.6% | 49.7%(-10.1)#731 | 46.1%(-6.50)#14,666 |
| 37. | 60608 | 36.6% | 49.7%(-13.1)#842 | 46.1%(-9.50)#16,741 |
| 38. | 60653 | 35.6% | 49.7%(-14.1)#879 | 46.1%(-10.5)#17,467 |
| 39. | 60659 | 35.5% | 49.7%(-14.2)#881 | 46.1%(-10.6)#17,526 |
| 40. | 60633 | 32.9% | 49.7%(-16.8)#970 | 46.1%(-13.2)#19,372 |
| 41. | 60617 | 30.3% | 49.7%(-19.4)#1,042 | 46.1%(-15.8)#21,177 |
| 42. | 60629 | 29.3% | 49.7%(-20.4)#1,068 | 46.1%(-16.8)#21,898 |
| 43. | 60620 | 28.7% | 49.7%(-21.0)#1,083 | 46.1%(-17.4)#22,297 |
| 44. | 60619 | 28.7% | 49.7%(-21.0)#1,084 | 46.1%(-17.4)#22,298 |
| 45. | 60639 | 28.0% | 49.7%(-21.7)#1,101 | 46.1%(-18.1)#22,745 |
| 46. | 60609 | 27.4% | 49.7%(-22.3)#1,120 | 46.1%(-18.7)#23,157 |
| 47. | 60632 | 27.3% | 49.7%(-22.4)#1,124 | 46.1%(-18.8)#23,216 |
| 48. | 60637 | 25.9% | 49.7%(-23.8)#1,163 | 46.1%(-20.2)#24,151 |
| 49. | 60628 | 24.9% | 49.7%(-24.8)#1,187 | 46.1%(-21.2)#24,772 |
| 50. | 60649 | 24.0% | 49.7%(-25.7)#1,205 | 46.1%(-22.1)#25,273 |
| 51. | 60651 | 23.5% | 49.7%(-26.2)#1,213 | 46.1%(-22.6)#25,545 |
| 52. | 60636 | 18.5% | 49.7%(-31.2)#1,280 | 46.1%(-27.6)#27,887 |
| 53. | 60624 | 17.4% | 49.7%(-32.3)#1,290 | 46.1%(-28.7)#28,297 |
| 54. | 60623 | 16.9% | 49.7%(-32.8)#1,292 | 46.1%(-29.2)#28,470 |
| 55. | 60644 | 16.7% | 49.7%(-33.0)#1,293 | 46.1%(-29.4)#28,547 |
| 56. | 60621 | 13.1% | 49.7%(-36.6)#1,320 | 46.1%(-33.0)#29,672 |
1
Common Questions
What are the Top 10 Zip Codes with the Highest Percentage of Families with Income Above $100,000 in Chicago, IL?
Top 10 Zip Codes with the Highest Percentage of Families with Income Above $100,000 in Chicago, IL are:
What zip code has the Highest Percentage of Families with Income Above $100,000 in Chicago, IL?
60603 has the Highest Percentage of Families with Income Above $100,000 in Chicago, IL with 90.5%.
What is the Percentage of Families with Income Above $100,000 in Chicago, IL?
Percentage of Families with Income Above $100,000 in Chicago is 44.5%.
What is the Percentage of Families with Income Above $100,000 in Illinois?
Percentage of Families with Income Above $100,000 in Illinois is 49.7%.
What is the Percentage of Families with Income Above $100,000 in the United States?
Percentage of Families with Income Above $100,000 in the United States is 46.1%.