Pennwyn, PA Map & Demographics
Pennwyn Map
Pennwyn Overview
$31,626
PER CAPITA INCOME
$120,208
AVG FAMILY INCOME
0.46
INEQUALITY / GINI INDEX
510
TOTAL POPULATION
304
MALE POPULATION
206
FEMALE POPULATION
147.57
MALES / 100 FEMALES
67.76
FEMALES / 100 MALES
50.5
MEDIAN AGE
3.5
AVG FAMILY SIZE
2.0
AVG HOUSEHOLD SIZE
265
LABOR FORCE [ PEOPLE ]
62.6%
PERCENT IN LABOR FORCE
Income in Pennwyn
Income Overview in Pennwyn
| Characteristic | Number | Measure |
| Per Capita Income | 510 | $31,626 |
| Median Family Income | 87 | $120,208 |
| Mean Family Income | 87 | $122,768 |
| Median Household Income | 252 | $0 |
| Mean Household Income | 252 | $62,017 |
| Income Deficit | 87 | $0 |
| Wage / Income Gap (%) | 510 | 0.00% |
| Wage / Income Gap ($) | 510 | 100.00¢ per $1 |
| Gini / Inequality Index | 510 | 0.46 |
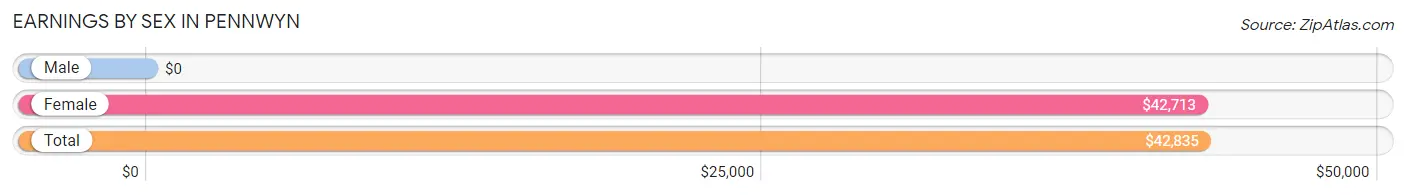
Earnings by Sex in Pennwyn
| Sex | Number | Average Earnings |
| Male | 128 (48.3%) | $0 |
| Female | 137 (51.7%) | $42,713 |
| Total | 265 (100.0%) | $42,835 |
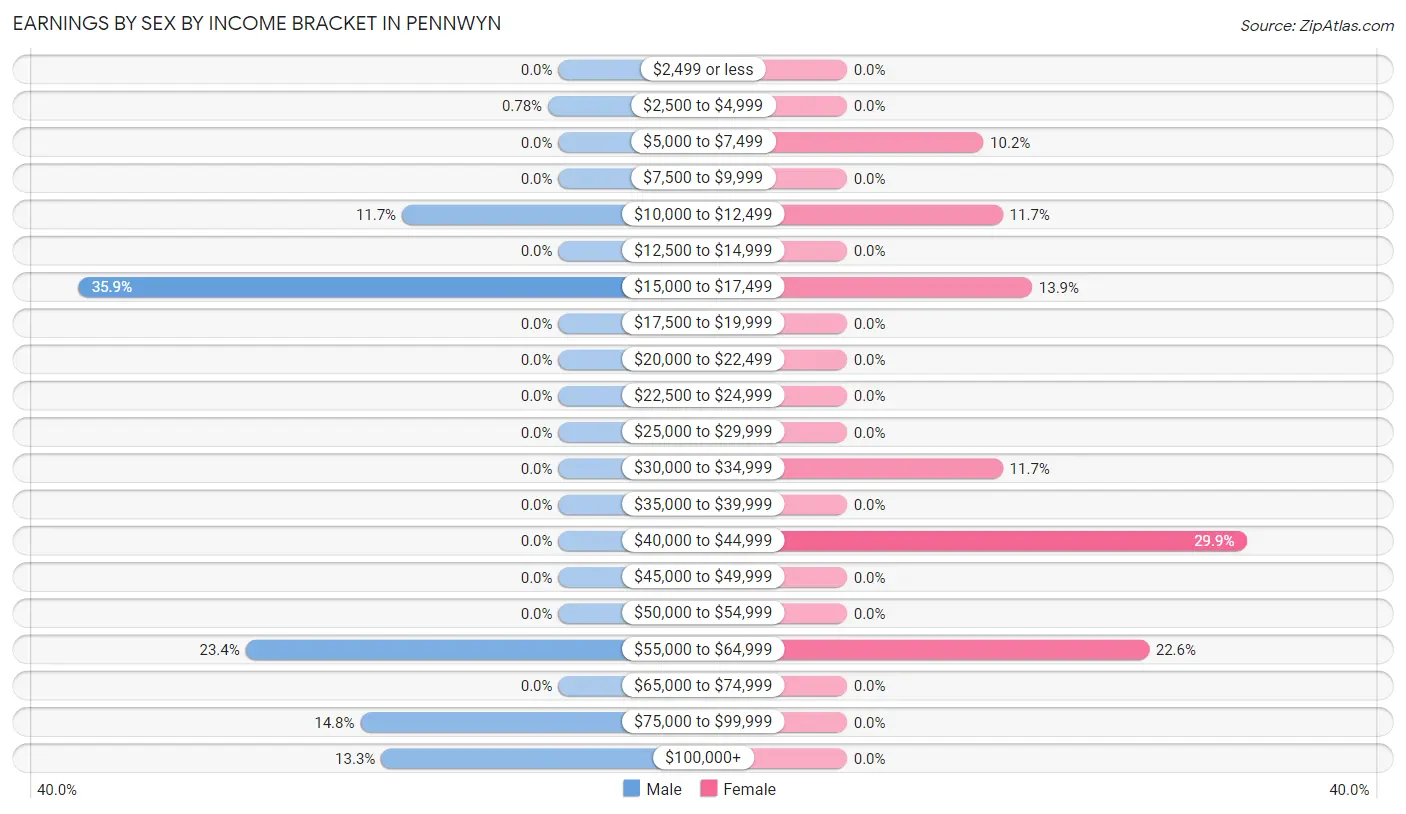
Earnings by Sex by Income Bracket in Pennwyn
The most common earnings brackets in Pennwyn are $15,000 to $17,499 for men (46 | 35.9%) and $40,000 to $44,999 for women (41 | 29.9%).
| Income | Male | Female |
| $2,499 or less | 0 (0.0%) | 0 (0.0%) |
| $2,500 to $4,999 | 1 (0.8%) | 0 (0.0%) |
| $5,000 to $7,499 | 0 (0.0%) | 14 (10.2%) |
| $7,500 to $9,999 | 0 (0.0%) | 0 (0.0%) |
| $10,000 to $12,499 | 15 (11.7%) | 16 (11.7%) |
| $12,500 to $14,999 | 0 (0.0%) | 0 (0.0%) |
| $15,000 to $17,499 | 46 (35.9%) | 19 (13.9%) |
| $17,500 to $19,999 | 0 (0.0%) | 0 (0.0%) |
| $20,000 to $22,499 | 0 (0.0%) | 0 (0.0%) |
| $22,500 to $24,999 | 0 (0.0%) | 0 (0.0%) |
| $25,000 to $29,999 | 0 (0.0%) | 0 (0.0%) |
| $30,000 to $34,999 | 0 (0.0%) | 16 (11.7%) |
| $35,000 to $39,999 | 0 (0.0%) | 0 (0.0%) |
| $40,000 to $44,999 | 0 (0.0%) | 41 (29.9%) |
| $45,000 to $49,999 | 0 (0.0%) | 0 (0.0%) |
| $50,000 to $54,999 | 0 (0.0%) | 0 (0.0%) |
| $55,000 to $64,999 | 30 (23.4%) | 31 (22.6%) |
| $65,000 to $74,999 | 0 (0.0%) | 0 (0.0%) |
| $75,000 to $99,999 | 19 (14.8%) | 0 (0.0%) |
| $100,000+ | 17 (13.3%) | 0 (0.0%) |
| Total | 128 (100.0%) | 137 (100.0%) |
Earnings by Sex by Educational Attainment in Pennwyn
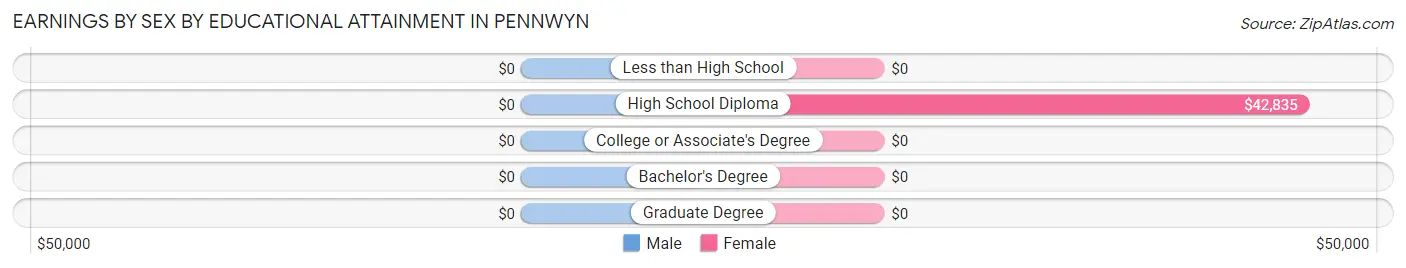
| Educational Attainment | Male Income | Female Income |
| Less than High School | - | - |
| High School Diploma | - | - |
| College or Associate's Degree | - | - |
| Bachelor's Degree | - | - |
| Graduate Degree | - | - |
| Total | - | - |
Family Income in Pennwyn
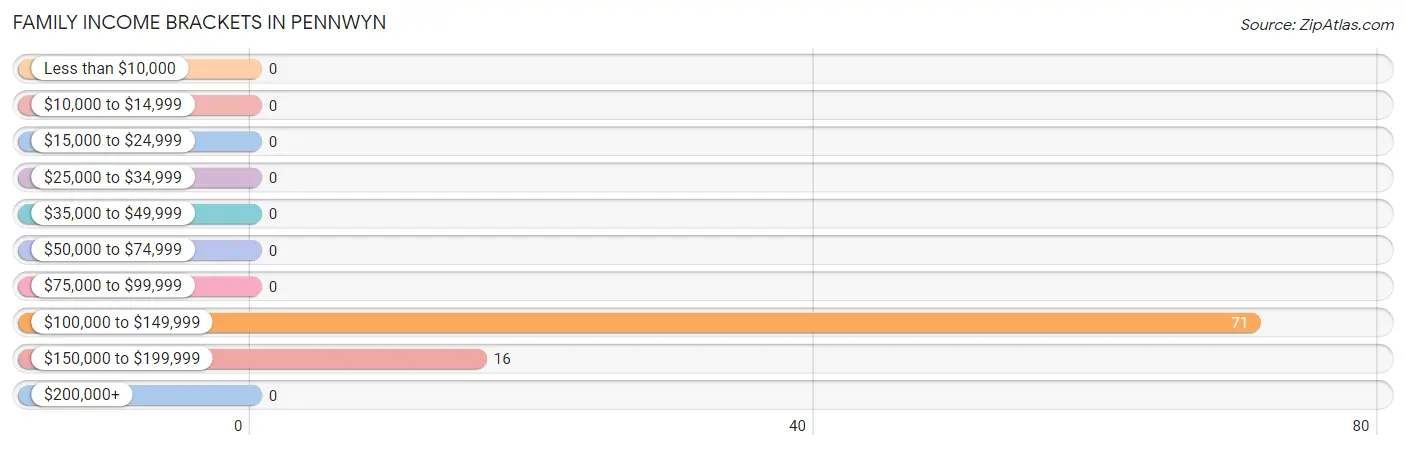
Family Income Brackets in Pennwyn
According to the Pennwyn family income data, there are 71 families falling into the $100,000 to $149,999 income range, which is the most common income bracket and makes up 81.6% of all families.
| Income Bracket | # Families | % Families |
| Less than $10,000 | 0 | 0.0% |
| $10,000 to $14,999 | 0 | 0.0% |
| $15,000 to $24,999 | 0 | 0.0% |
| $25,000 to $34,999 | 0 | 0.0% |
| $35,000 to $49,999 | 0 | 0.0% |
| $50,000 to $74,999 | 0 | 0.0% |
| $75,000 to $99,999 | 0 | 0.0% |
| $100,000 to $149,999 | 71 | 81.6% |
| $150,000 to $199,999 | 16 | 18.4% |
| $200,000+ | 0 | 0.0% |
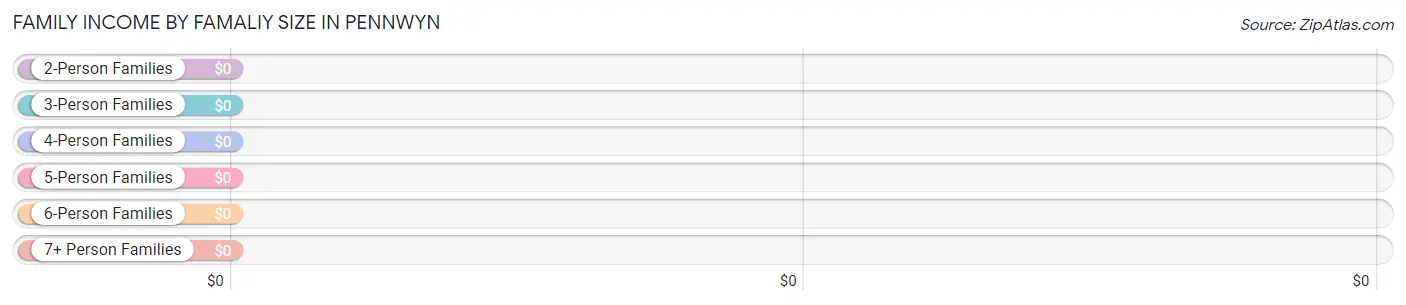
Family Income by Famaliy Size in Pennwyn
| Income Bracket | # Families | Median Income |
| 2-Person Families | 57 (65.5%) | $0 |
| 3-Person Families | 0 (0.0%) | $0 |
| 4-Person Families | 0 (0.0%) | $0 |
| 5-Person Families | 0 (0.0%) | $0 |
| 6-Person Families | 30 (34.5%) | $0 |
| 7+ Person Families | 0 (0.0%) | $0 |
| Total | 87 (100.0%) | $120,208 |
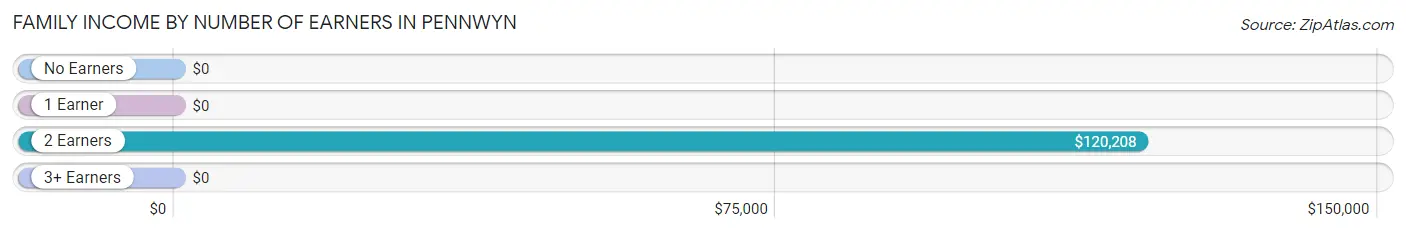
Family Income by Number of Earners in Pennwyn
| Number of Earners | # Families | Median Income |
| No Earners | 0 (0.0%) | $0 |
| 1 Earner | 0 (0.0%) | $0 |
| 2 Earners | 87 (100.0%) | $120,208 |
| 3+ Earners | 0 (0.0%) | $0 |
| Total | 87 (100.0%) | $120,208 |
Household Income in Pennwyn
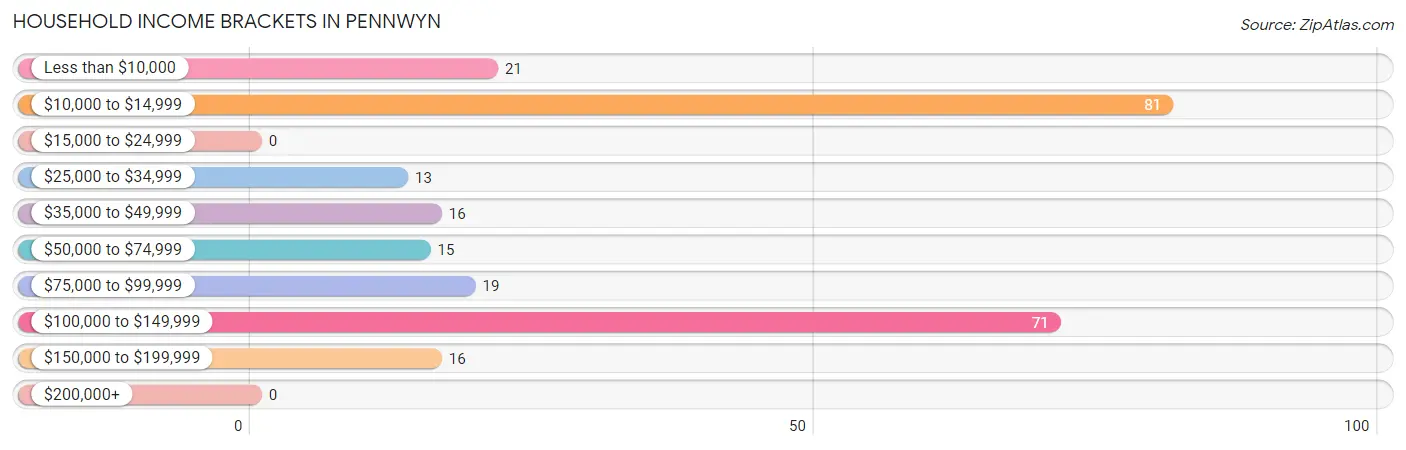
Household Income Brackets in Pennwyn
With 81 households falling in the category, the $10,000 to $14,999 income range is the most frequent in Pennwyn, accounting for 32.1% of all households.
| Income Bracket | # Households | % Households |
| Less than $10,000 | 21 | 8.3% |
| $10,000 to $14,999 | 81 | 32.1% |
| $15,000 to $24,999 | 0 | 0.0% |
| $25,000 to $34,999 | 13 | 5.2% |
| $35,000 to $49,999 | 16 | 6.3% |
| $50,000 to $74,999 | 15 | 6.0% |
| $75,000 to $99,999 | 19 | 7.5% |
| $100,000 to $149,999 | 71 | 28.2% |
| $150,000 to $199,999 | 16 | 6.3% |
| $200,000+ | 0 | 0.0% |
Household Income by Householder Age in Pennwyn
The median household income in Pennwyn is $0, with the highest median household income of $101,768 found in the 45 to 64 years age bracket for the primary householder. A total of 116 households (46.0%) fall into this category.
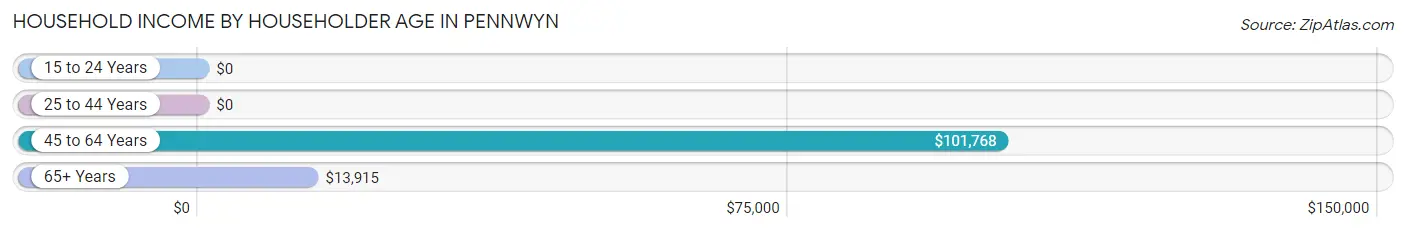
| Income Bracket | # Households | Median Income |
| 15 to 24 Years | 0 (0.0%) | $0 |
| 25 to 44 Years | 19 (7.5%) | $0 |
| 45 to 64 Years | 116 (46.0%) | $101,768 |
| 65+ Years | 117 (46.4%) | $13,915 |
| Total | 252 (100.0%) | $0 |
Poverty in Pennwyn
Income Below Poverty by Sex and Age in Pennwyn
With 28.0% poverty level for males and 18.0% for females among the residents of Pennwyn, 75 year old and over males and 75 year old and over females are the most vulnerable to poverty, with 81 males (100.0%) and 20 females (40.8%) in their respective age groups living below the poverty level.
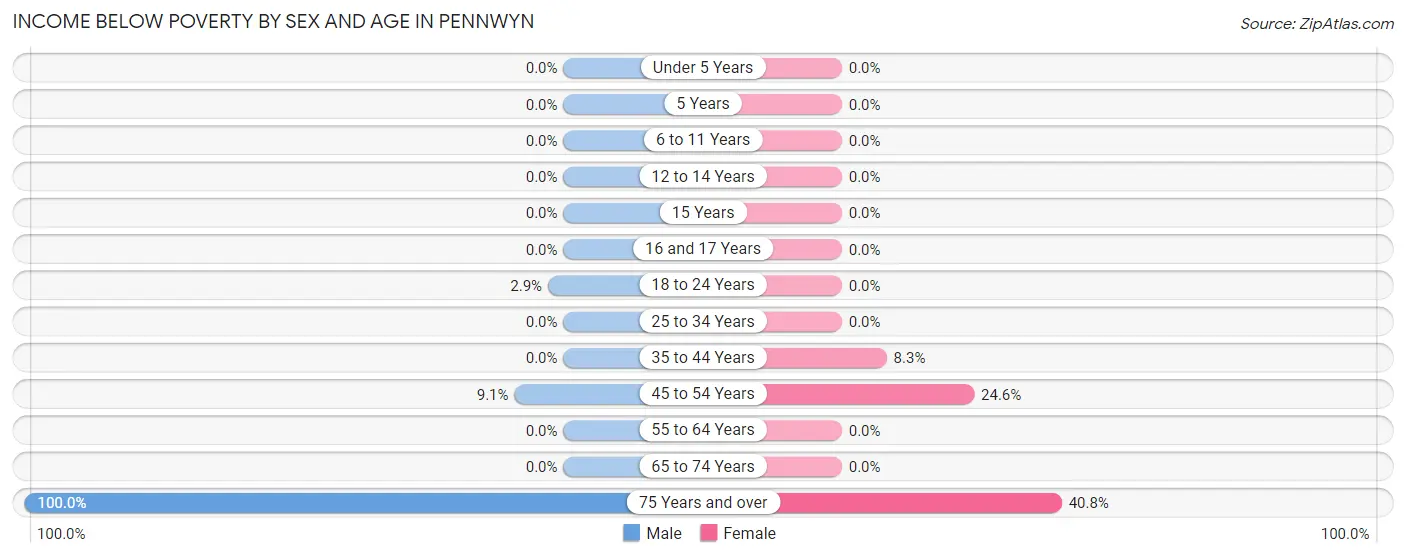
| Age Bracket | Male | Female |
| Under 5 Years | 0 (0.0%) | 0 (0.0%) |
| 5 Years | 0 (0.0%) | 0 (0.0%) |
| 6 to 11 Years | 0 (0.0%) | 0 (0.0%) |
| 12 to 14 Years | 0 (0.0%) | 0 (0.0%) |
| 15 Years | 0 (0.0%) | 0 (0.0%) |
| 16 and 17 Years | 0 (0.0%) | 0 (0.0%) |
| 18 to 24 Years | 1 (2.9%) | 0 (0.0%) |
| 25 to 34 Years | 0 (0.0%) | 0 (0.0%) |
| 35 to 44 Years | 0 (0.0%) | 3 (8.3%) |
| 45 to 54 Years | 3 (9.1%) | 14 (24.6%) |
| 55 to 64 Years | 0 (0.0%) | 0 (0.0%) |
| 65 to 74 Years | 0 (0.0%) | 0 (0.0%) |
| 75 Years and over | 81 (100.0%) | 20 (40.8%) |
| Total | 85 (28.0%) | 37 (18.0%) |
Income Above Poverty by Sex and Age in Pennwyn
According to the poverty statistics in Pennwyn, males aged under 5 years and females aged 6 to 11 years are the age groups that are most secure financially, with 100.0% of males and 100.0% of females in these age groups living above the poverty line.
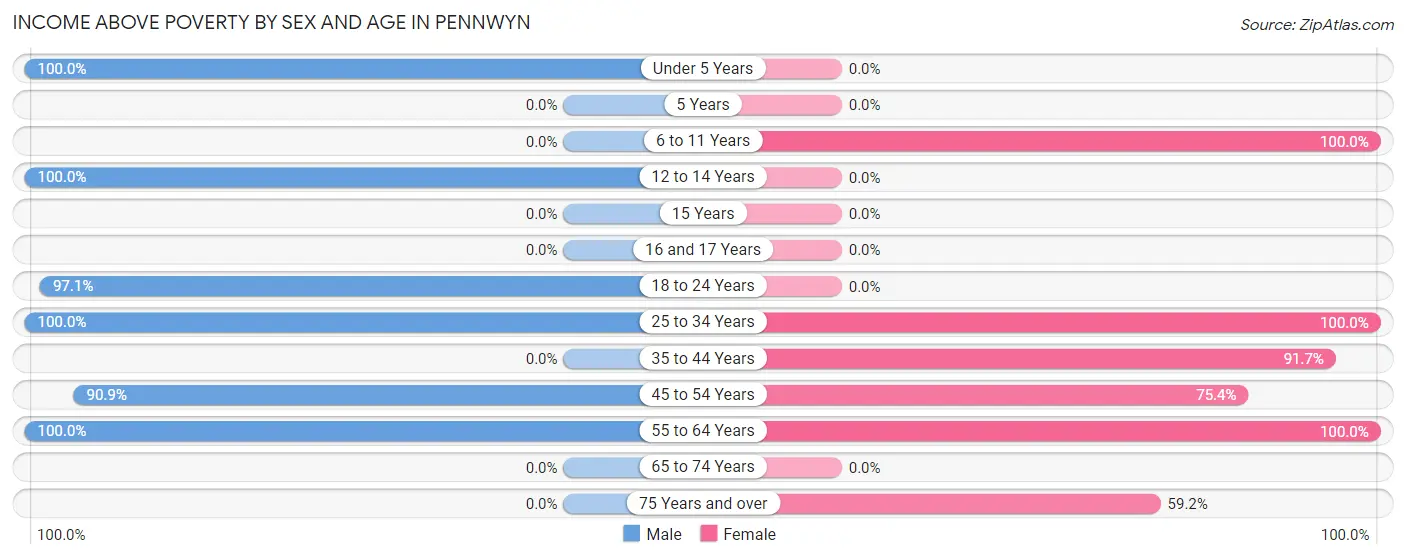
| Age Bracket | Male | Female |
| Under 5 Years | 23 (100.0%) | 0 (0.0%) |
| 5 Years | 0 (0.0%) | 0 (0.0%) |
| 6 to 11 Years | 0 (0.0%) | 29 (100.0%) |
| 12 to 14 Years | 35 (100.0%) | 0 (0.0%) |
| 15 Years | 0 (0.0%) | 0 (0.0%) |
| 16 and 17 Years | 0 (0.0%) | 0 (0.0%) |
| 18 to 24 Years | 34 (97.1%) | 0 (0.0%) |
| 25 to 34 Years | 19 (100.0%) | 19 (100.0%) |
| 35 to 44 Years | 0 (0.0%) | 33 (91.7%) |
| 45 to 54 Years | 30 (90.9%) | 43 (75.4%) |
| 55 to 64 Years | 78 (100.0%) | 16 (100.0%) |
| 65 to 74 Years | 0 (0.0%) | 0 (0.0%) |
| 75 Years and over | 0 (0.0%) | 29 (59.2%) |
| Total | 219 (72.0%) | 169 (82.0%) |
Income Below Poverty Among Married-Couple Families in Pennwyn
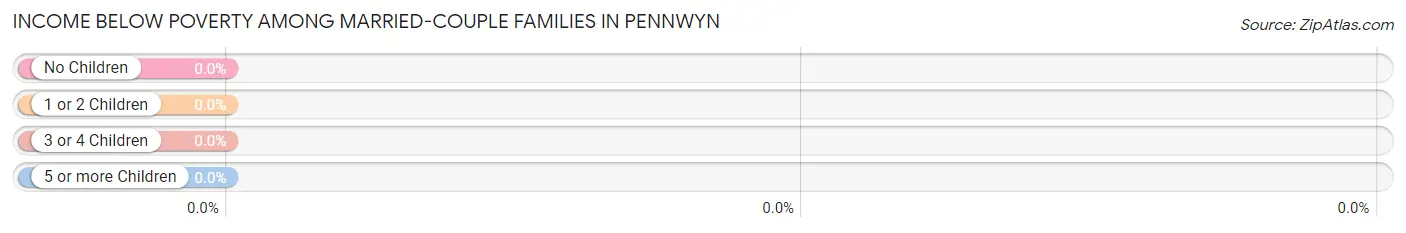
| Children | Above Poverty | Below Poverty |
| No Children | 57 (100.0%) | 0 (0.0%) |
| 1 or 2 Children | 0 (0.0%) | 0 (0.0%) |
| 3 or 4 Children | 30 (100.0%) | 0 (0.0%) |
| 5 or more Children | 0 (0.0%) | 0 (0.0%) |
| Total | 87 (100.0%) | 0 (0.0%) |
Income Below Poverty Among Single-Parent Households in Pennwyn
| Children | Single Father | Single Mother |
| No Children | 0 (0.0%) | 0 (0.0%) |
| 1 or 2 Children | 0 (0.0%) | 0 (0.0%) |
| 3 or 4 Children | 0 (0.0%) | 0 (0.0%) |
| 5 or more Children | 0 (0.0%) | 0 (0.0%) |
| Total | 0 (0.0%) | 0 (0.0%) |
Income Below Poverty Among Married-Couple vs Single-Parent Households in Pennwyn
| Children | Married-Couple Families | Single-Parent Households |
| No Children | 0 (0.0%) | 0 (0.0%) |
| 1 or 2 Children | 0 (0.0%) | 0 (0.0%) |
| 3 or 4 Children | 0 (0.0%) | 0 (0.0%) |
| 5 or more Children | 0 (0.0%) | 0 (0.0%) |
| Total | 0 (0.0%) | 0 (0.0%) |
Race in Pennwyn
The most populous races in Pennwyn are White / Caucasian (389 | 76.3%), and Two or more Races (121 | 23.7%).
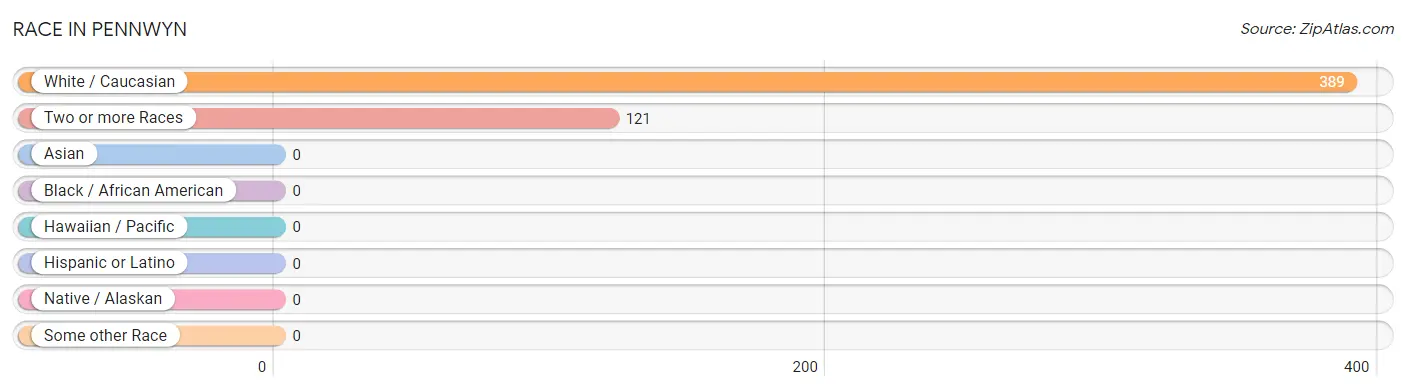
| Race | # Population | % Population |
| Asian | 0 | 0.0% |
| Black / African American | 0 | 0.0% |
| Hawaiian / Pacific | 0 | 0.0% |
| Hispanic or Latino | 0 | 0.0% |
| Native / Alaskan | 0 | 0.0% |
| White / Caucasian | 389 | 76.3% |
| Two or more Races | 121 | 23.7% |
| Some other Race | 0 | 0.0% |
| Total | 510 | 100.0% |
Ancestry in Pennwyn
The most populous ancestries reported in Pennwyn are Pennsylvania German (81 | 15.9%), German (80 | 15.7%), Ukrainian (31 | 6.1%), Romanian (30 | 5.9%), and Irish (19 | 3.7%), together accounting for 47.3% of all Pennwyn residents.
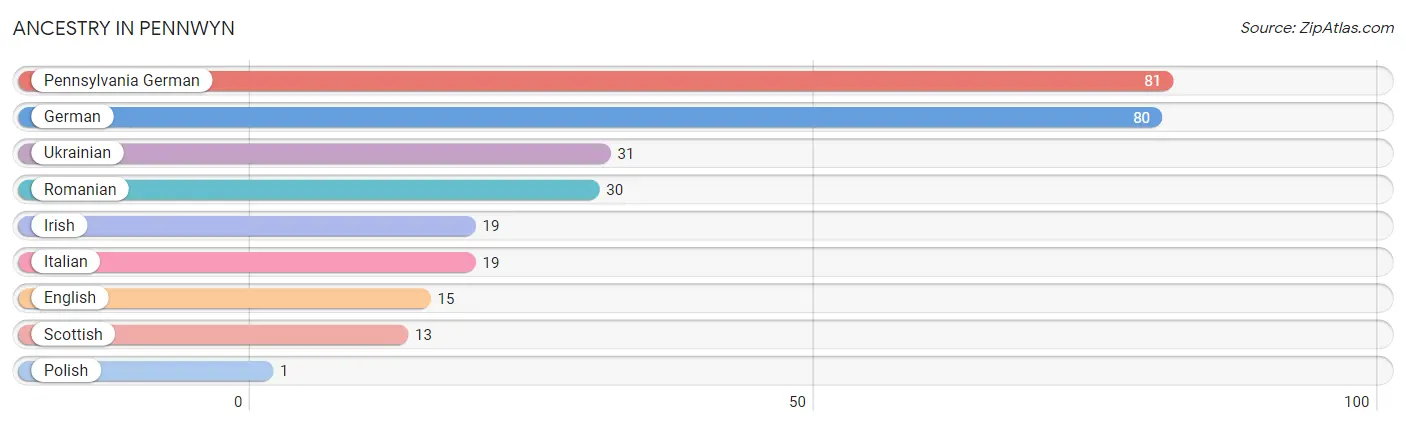
| Ancestry | # Population | % Population |
| English | 15 | 2.9% |
| German | 80 | 15.7% |
| Irish | 19 | 3.7% |
| Italian | 19 | 3.7% |
| Pennsylvania German | 81 | 15.9% |
| Polish | 1 | 0.2% |
| Romanian | 30 | 5.9% |
| Scottish | 13 | 2.5% |
| Ukrainian | 31 | 6.1% | View All 9 Rows |
Immigrants in Pennwyn

| Immigration Origin | # Population | % Population | View All 0 Rows |
Sex and Age in Pennwyn
Sex and Age in Pennwyn
The most populous age groups in Pennwyn are 85 Years and over (68 | 22.4%) for men and 50 to 54 Years (57 | 27.7%) for women.
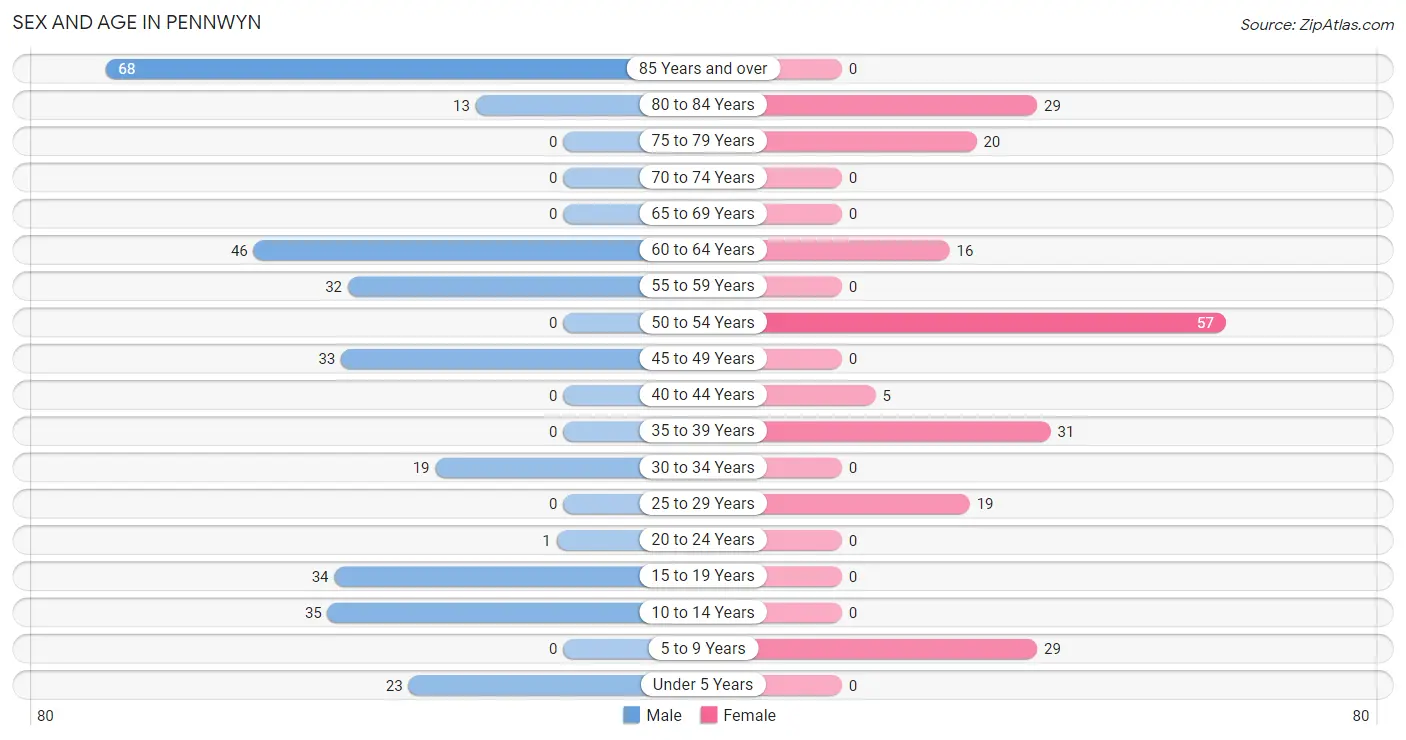
| Age Bracket | Male | Female |
| Under 5 Years | 23 (7.6%) | 0 (0.0%) |
| 5 to 9 Years | 0 (0.0%) | 29 (14.1%) |
| 10 to 14 Years | 35 (11.5%) | 0 (0.0%) |
| 15 to 19 Years | 34 (11.2%) | 0 (0.0%) |
| 20 to 24 Years | 1 (0.3%) | 0 (0.0%) |
| 25 to 29 Years | 0 (0.0%) | 19 (9.2%) |
| 30 to 34 Years | 19 (6.2%) | 0 (0.0%) |
| 35 to 39 Years | 0 (0.0%) | 31 (15.0%) |
| 40 to 44 Years | 0 (0.0%) | 5 (2.4%) |
| 45 to 49 Years | 33 (10.9%) | 0 (0.0%) |
| 50 to 54 Years | 0 (0.0%) | 57 (27.7%) |
| 55 to 59 Years | 32 (10.5%) | 0 (0.0%) |
| 60 to 64 Years | 46 (15.1%) | 16 (7.8%) |
| 65 to 69 Years | 0 (0.0%) | 0 (0.0%) |
| 70 to 74 Years | 0 (0.0%) | 0 (0.0%) |
| 75 to 79 Years | 0 (0.0%) | 20 (9.7%) |
| 80 to 84 Years | 13 (4.3%) | 29 (14.1%) |
| 85 Years and over | 68 (22.4%) | 0 (0.0%) |
| Total | 304 (100.0%) | 206 (100.0%) |
Families and Households in Pennwyn
Median Family Size in Pennwyn
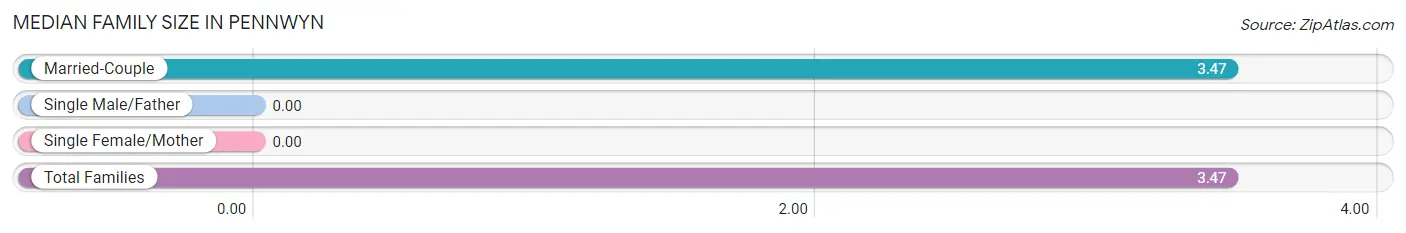
| Family Type | # Families | Family Size |
| Married-Couple | 87 (100.0%) | 3.47 |
| Single Male/Father | 0 (0.0%) | - |
| Single Female/Mother | 0 (0.0%) | - |
| Total Families | 87 (100.0%) | 3.47 |
Median Household Size in Pennwyn
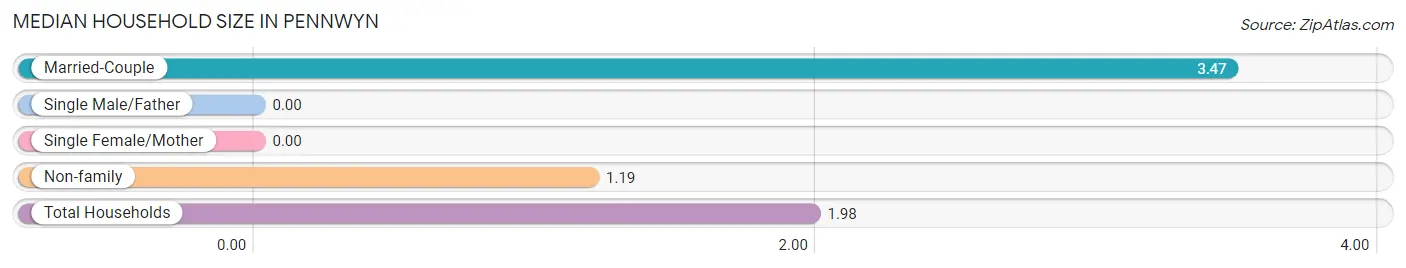
| Household Type | # Households | Household Size |
| Married-Couple | 87 (34.5%) | 3.47 |
| Single Male/Father | 0 (0.0%) | - |
| Single Female/Mother | 0 (0.0%) | - |
| Non-family | 165 (65.5%) | 1.19 |
| Total Households | 252 (100.0%) | 1.98 |
Household Size by Marriage Status in Pennwyn
Out of a total of 252 households in Pennwyn, 87 (34.5%) are family households, while 165 (65.5%) are nonfamily households. The most numerous type of family households are 2-person households, comprising 57, and the most common type of nonfamily households are 1-person households, comprising 130.
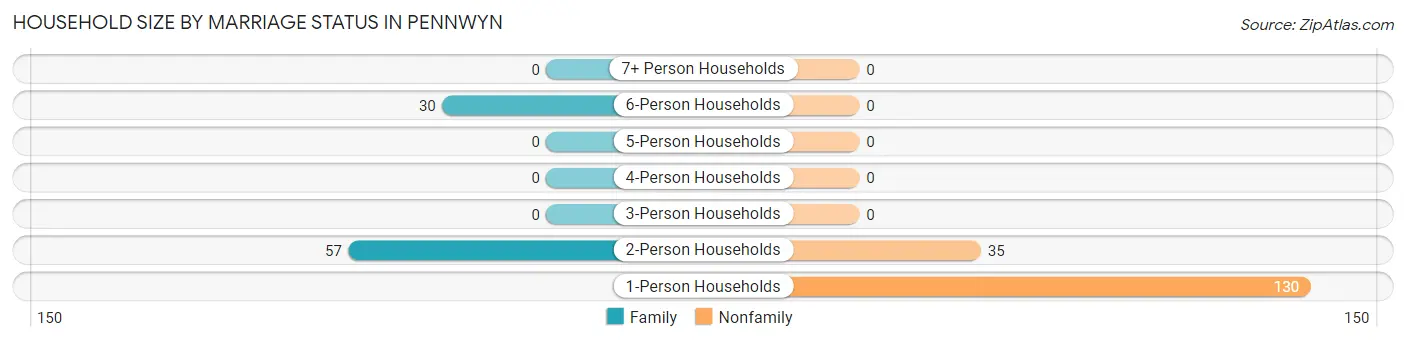
| Household Size | Family Households | Nonfamily Households |
| 1-Person Households | - | 130 (51.6%) |
| 2-Person Households | 57 (22.6%) | 35 (13.9%) |
| 3-Person Households | 0 (0.0%) | 0 (0.0%) |
| 4-Person Households | 0 (0.0%) | 0 (0.0%) |
| 5-Person Households | 0 (0.0%) | 0 (0.0%) |
| 6-Person Households | 30 (11.9%) | 0 (0.0%) |
| 7+ Person Households | 0 (0.0%) | 0 (0.0%) |
| Total | 87 (34.5%) | 165 (65.5%) |
Female Fertility in Pennwyn
Fertility by Age in Pennwyn
| Age Bracket | Women with Births | Births / 1,000 Women |
| 15 to 19 years | 0 (0.0%) | 0.0 |
| 20 to 34 years | 0 (0.0%) | 0.0 |
| 35 to 50 years | 0 (0.0%) | 0.0 |
| Total | 0 (0.0%) | 0.0 |
Fertility by Age by Marriage Status in Pennwyn
| Age Bracket | Married | Unmarried |
| 15 to 19 years | 0 (0.0%) | 0 (0.0%) |
| 20 to 34 years | 0 (0.0%) | 0 (0.0%) |
| 35 to 50 years | 0 (0.0%) | 0 (0.0%) |
| Total | 0 (0.0%) | 0 (0.0%) |
Fertility by Education in Pennwyn
| Educational Attainment | Women with Births | Births / 1,000 Women |
| Less than High School | 0 (0.0%) | 0.0 |
| High School Diploma | 0 (0.0%) | 0.0 |
| College or Associate's Degree | 0 (0.0%) | 0.0 |
| Bachelor's Degree | 0 (0.0%) | 0.0 |
| Graduate Degree | 0 (0.0%) | 0.0 |
| Total | 0 (0.0%) | 0.0 |
Fertility by Education by Marriage Status in Pennwyn
| Educational Attainment | Married | Unmarried |
| Less than High School | 0 (0.0%) | 0 (0.0%) |
| High School Diploma | 0 (0.0%) | 0 (0.0%) |
| College or Associate's Degree | 0 (0.0%) | 0 (0.0%) |
| Bachelor's Degree | 0 (0.0%) | 0 (0.0%) |
| Graduate Degree | 0 (0.0%) | 0 (0.0%) |
| Total | 0 (0.0%) | 0 (0.0%) |
Employment Characteristics in Pennwyn
Employment by Class of Employer in Pennwyn
Among the 265 employed individuals in Pennwyn, private company employees (204 | 77.0%), self-employed (incorporated) (44 | 16.6%), and self-employed (not incorporated) (17 | 6.4%) make up the most common classes of employment.
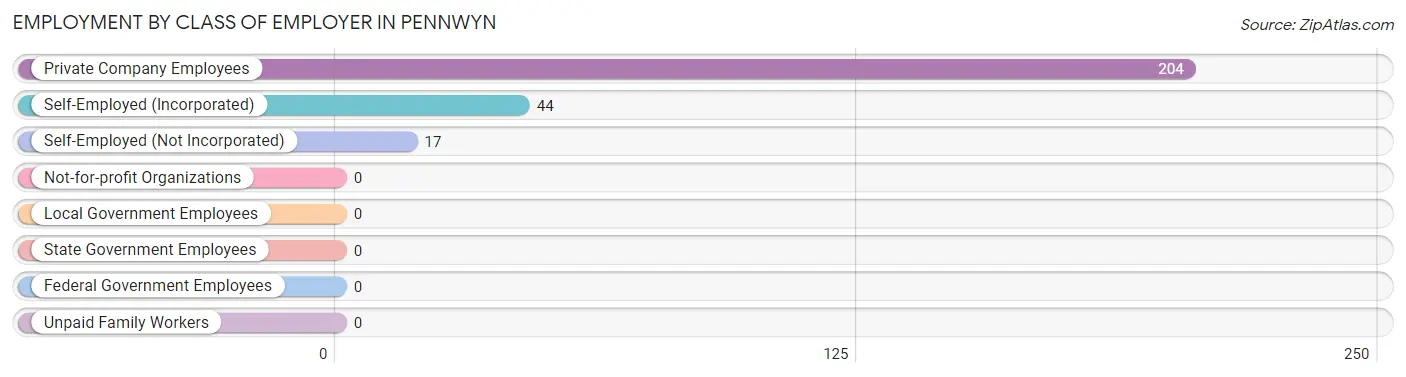
| Employer Class | # Employees | % Employees |
| Private Company Employees | 204 | 77.0% |
| Self-Employed (Incorporated) | 44 | 16.6% |
| Self-Employed (Not Incorporated) | 17 | 6.4% |
| Not-for-profit Organizations | 0 | 0.0% |
| Local Government Employees | 0 | 0.0% |
| State Government Employees | 0 | 0.0% |
| Federal Government Employees | 0 | 0.0% |
| Unpaid Family Workers | 0 | 0.0% |
| Total | 265 | 100.0% |
Employment Status by Age in Pennwyn
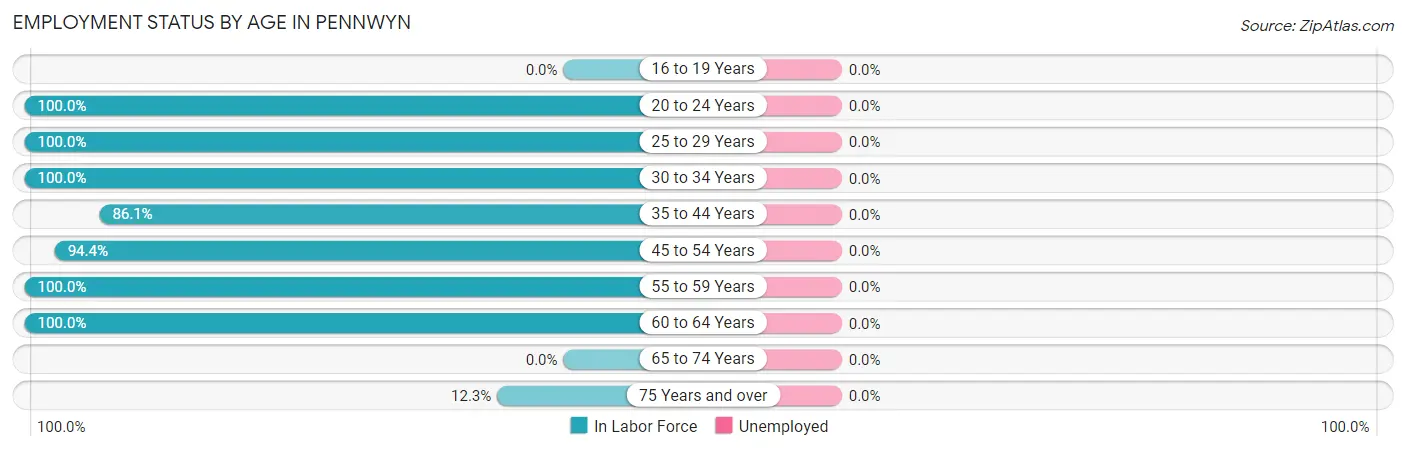
| Age Bracket | In Labor Force | Unemployed |
| 16 to 19 Years | 0 (0.0%) | 0 (0.0%) |
| 20 to 24 Years | 1 (100.0%) | 0 (0.0%) |
| 25 to 29 Years | 19 (100.0%) | 0 (0.0%) |
| 30 to 34 Years | 19 (100.0%) | 0 (0.0%) |
| 35 to 44 Years | 31 (86.1%) | 0 (0.0%) |
| 45 to 54 Years | 85 (94.4%) | 0 (0.0%) |
| 55 to 59 Years | 32 (100.0%) | 0 (0.0%) |
| 60 to 64 Years | 62 (100.0%) | 0 (0.0%) |
| 65 to 74 Years | 0 (0.0%) | 0 (0.0%) |
| 75 Years and over | 16 (12.3%) | 0 (0.0%) |
| Total | 265 (62.6%) | 0 (0.0%) |
Employment Status by Educational Attainment in Pennwyn
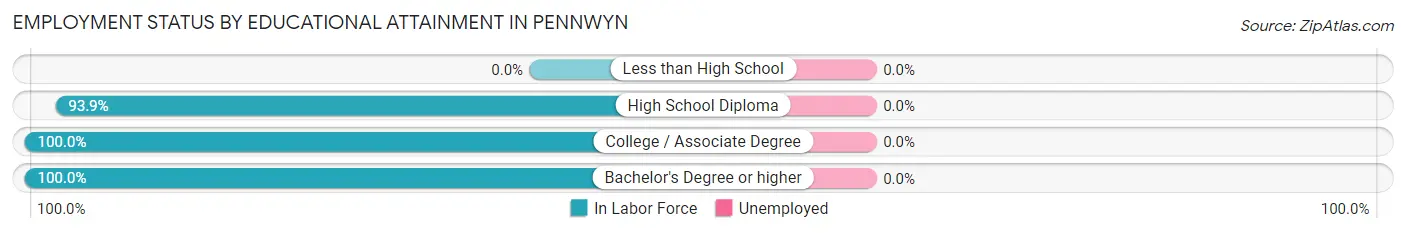
| Educational Attainment | In Labor Force | Unemployed |
| Less than High School | 0 (0.0%) | 0 (0.0%) |
| High School Diploma | 153 (93.9%) | 0 (0.0%) |
| College / Associate Degree | 50 (100.0%) | 0 (0.0%) |
| Bachelor's Degree or higher | 45 (100.0%) | 0 (0.0%) |
| Total | 248 (96.1%) | 0 (0.0%) |
Employment Occupations by Sex in Pennwyn
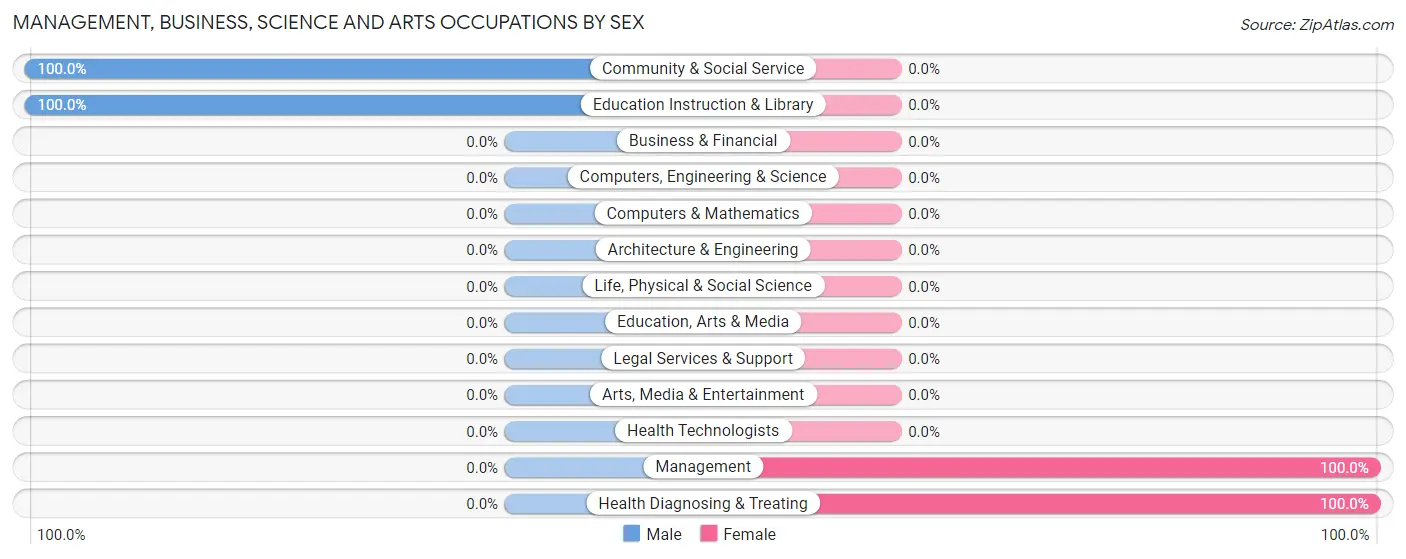
Management, Business, Science and Arts Occupations
The most common Management, Business, Science and Arts occupations in Pennwyn are Health Diagnosing & Treating (31 | 11.7%), Community & Social Service (15 | 5.7%), Education Instruction & Library (15 | 5.7%), and Management (14 | 5.3%).
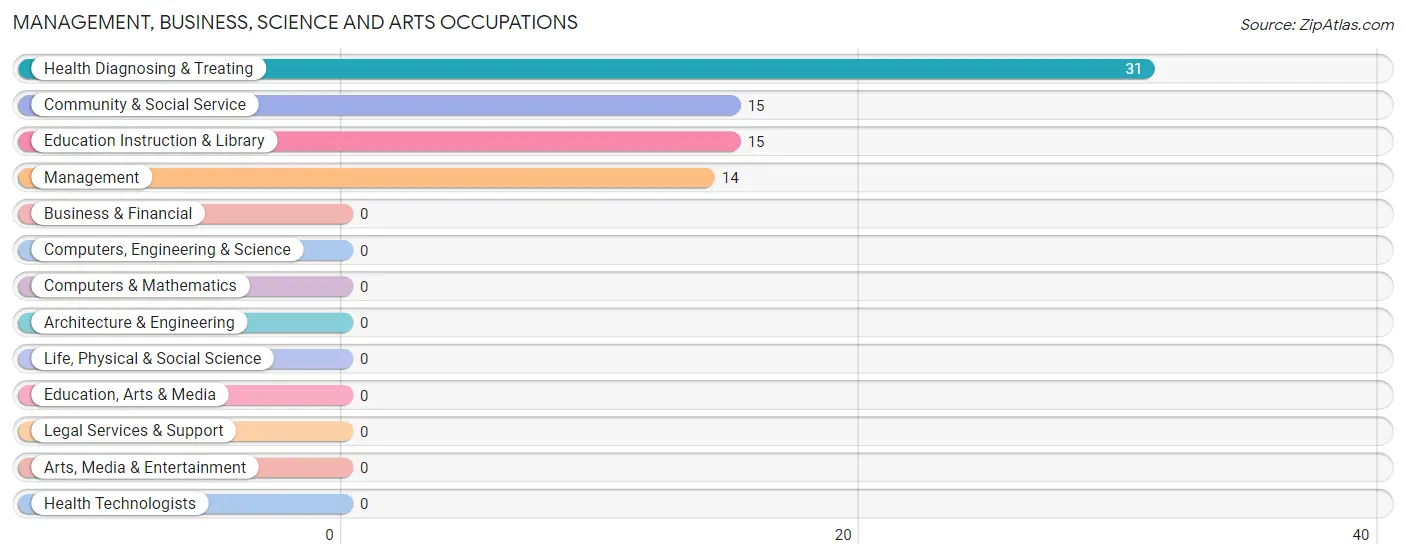
Management, Business, Science and Arts Occupations by Sex
Within the Management, Business, Science and Arts occupations in Pennwyn, the most male-oriented occupations are Community & Social Service (100.0%), and Education Instruction & Library (100.0%), while the most female-oriented occupations are Management (100.0%), and Health Diagnosing & Treating (100.0%).
| Occupation | Male | Female |
| Management | 0 (0.0%) | 14 (100.0%) |
| Business & Financial | 0 (0.0%) | 0 (0.0%) |
| Computers, Engineering & Science | 0 (0.0%) | 0 (0.0%) |
| Computers & Mathematics | 0 (0.0%) | 0 (0.0%) |
| Architecture & Engineering | 0 (0.0%) | 0 (0.0%) |
| Life, Physical & Social Science | 0 (0.0%) | 0 (0.0%) |
| Community & Social Service | 15 (100.0%) | 0 (0.0%) |
| Education, Arts & Media | 0 (0.0%) | 0 (0.0%) |
| Legal Services & Support | 0 (0.0%) | 0 (0.0%) |
| Education Instruction & Library | 15 (100.0%) | 0 (0.0%) |
| Arts, Media & Entertainment | 0 (0.0%) | 0 (0.0%) |
| Health Diagnosing & Treating | 0 (0.0%) | 31 (100.0%) |
| Health Technologists | 0 (0.0%) | 0 (0.0%) |
| Total (Category) | 15 (25.0%) | 45 (75.0%) |
| Total (Overall) | 128 (48.3%) | 137 (51.7%) |
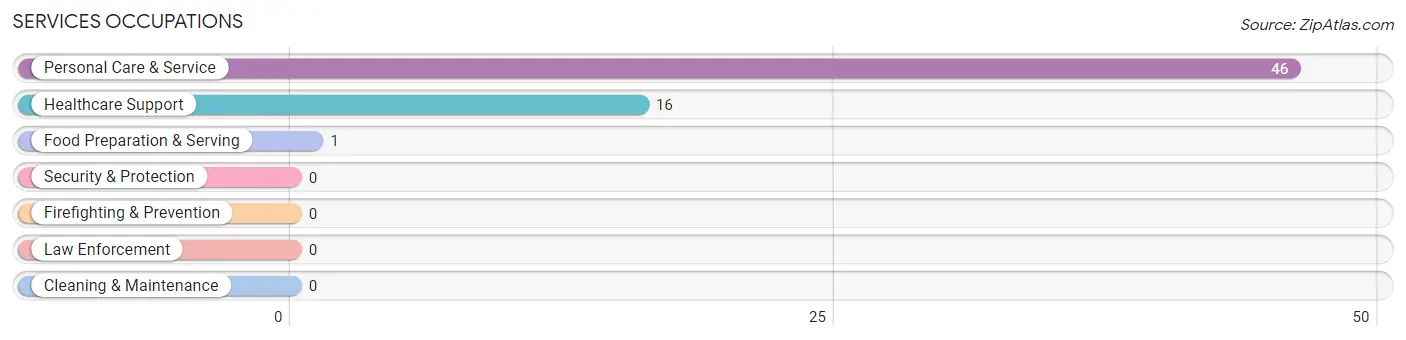
Services Occupations
The most common Services occupations in Pennwyn are Personal Care & Service (46 | 17.4%), Healthcare Support (16 | 6.0%), and Food Preparation & Serving (1 | 0.4%).
Services Occupations by Sex
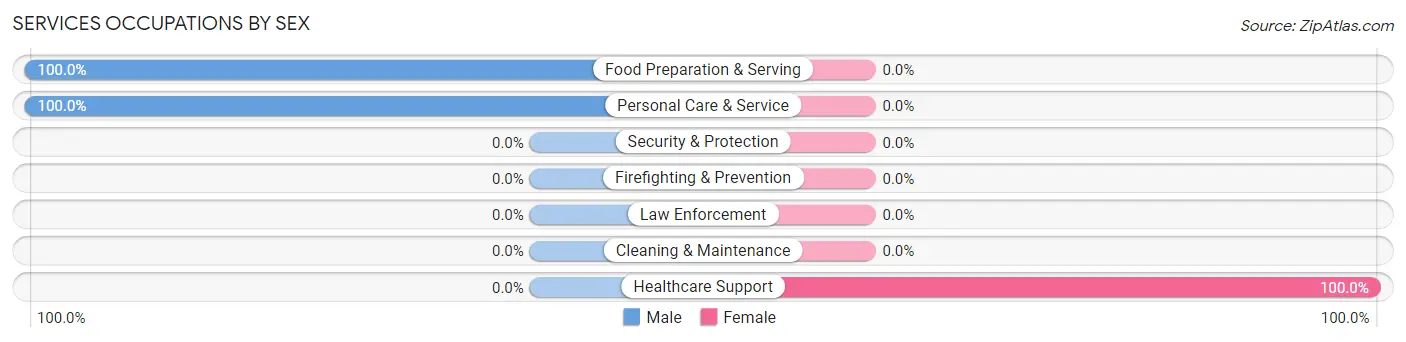
| Occupation | Male | Female |
| Healthcare Support | 0 (0.0%) | 16 (100.0%) |
| Security & Protection | 0 (0.0%) | 0 (0.0%) |
| Firefighting & Prevention | 0 (0.0%) | 0 (0.0%) |
| Law Enforcement | 0 (0.0%) | 0 (0.0%) |
| Food Preparation & Serving | 1 (100.0%) | 0 (0.0%) |
| Cleaning & Maintenance | 0 (0.0%) | 0 (0.0%) |
| Personal Care & Service | 46 (100.0%) | 0 (0.0%) |
| Total (Category) | 47 (74.6%) | 16 (25.4%) |
| Total (Overall) | 128 (48.3%) | 137 (51.7%) |
Sales and Office Occupations
The most common Sales and Office occupations in Pennwyn are Sales & Related (41 | 15.5%), and Office & Administration (19 | 7.2%).

Sales and Office Occupations by Sex

| Occupation | Male | Female |
| Sales & Related | 0 (0.0%) | 41 (100.0%) |
| Office & Administration | 0 (0.0%) | 19 (100.0%) |
| Total (Category) | 0 (0.0%) | 60 (100.0%) |
| Total (Overall) | 128 (48.3%) | 137 (51.7%) |
Natural Resources, Construction and Maintenance Occupations
The most common Natural Resources, Construction and Maintenance occupations in Pennwyn are Construction & Extraction (30 | 11.3%), and Installation, Maintenance & Repair (17 | 6.4%).
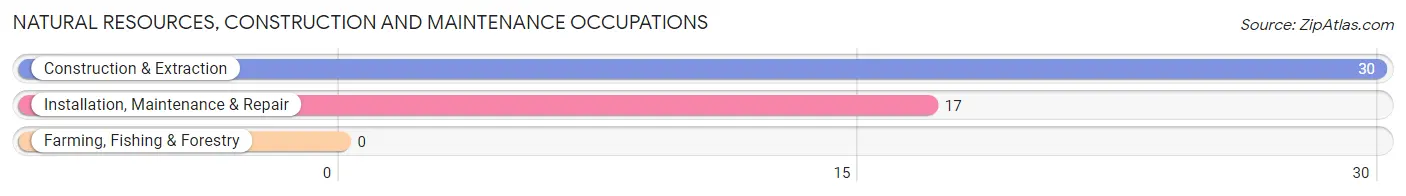
Natural Resources, Construction and Maintenance Occupations by Sex
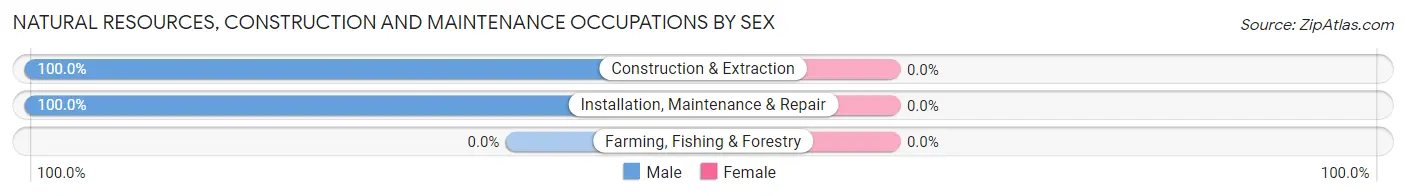
| Occupation | Male | Female |
| Farming, Fishing & Forestry | 0 (0.0%) | 0 (0.0%) |
| Construction & Extraction | 30 (100.0%) | 0 (0.0%) |
| Installation, Maintenance & Repair | 17 (100.0%) | 0 (0.0%) |
| Total (Category) | 47 (100.0%) | 0 (0.0%) |
| Total (Overall) | 128 (48.3%) | 137 (51.7%) |
Production, Transportation and Moving Occupations
The most common Production, Transportation and Moving occupations in Pennwyn are Transportation (19 | 7.2%), and Production (16 | 6.0%).
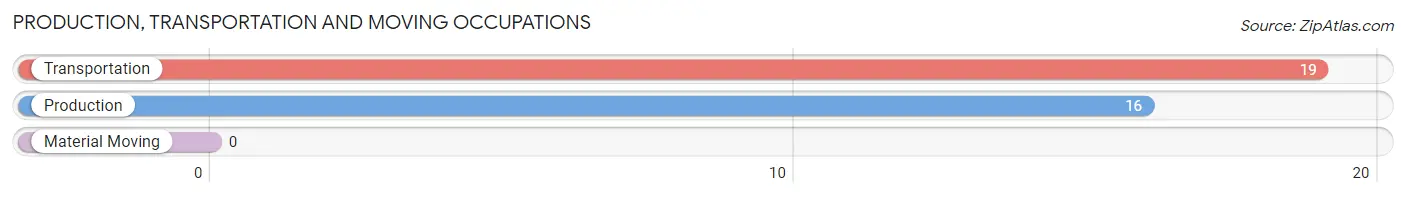
Production, Transportation and Moving Occupations by Sex
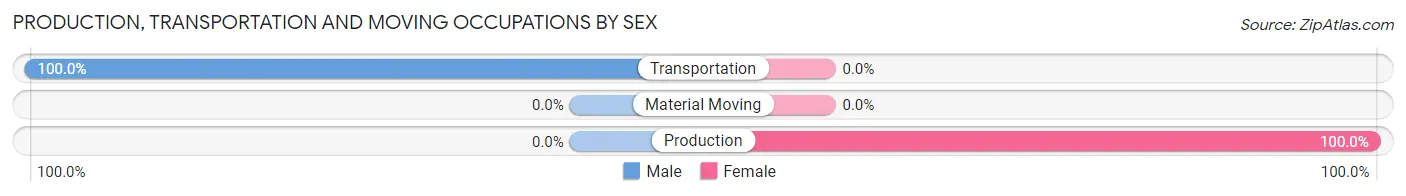
| Occupation | Male | Female |
| Production | 0 (0.0%) | 16 (100.0%) |
| Transportation | 19 (100.0%) | 0 (0.0%) |
| Material Moving | 0 (0.0%) | 0 (0.0%) |
| Total (Category) | 19 (54.3%) | 16 (45.7%) |
| Total (Overall) | 128 (48.3%) | 137 (51.7%) |
Employment Industries by Sex in Pennwyn
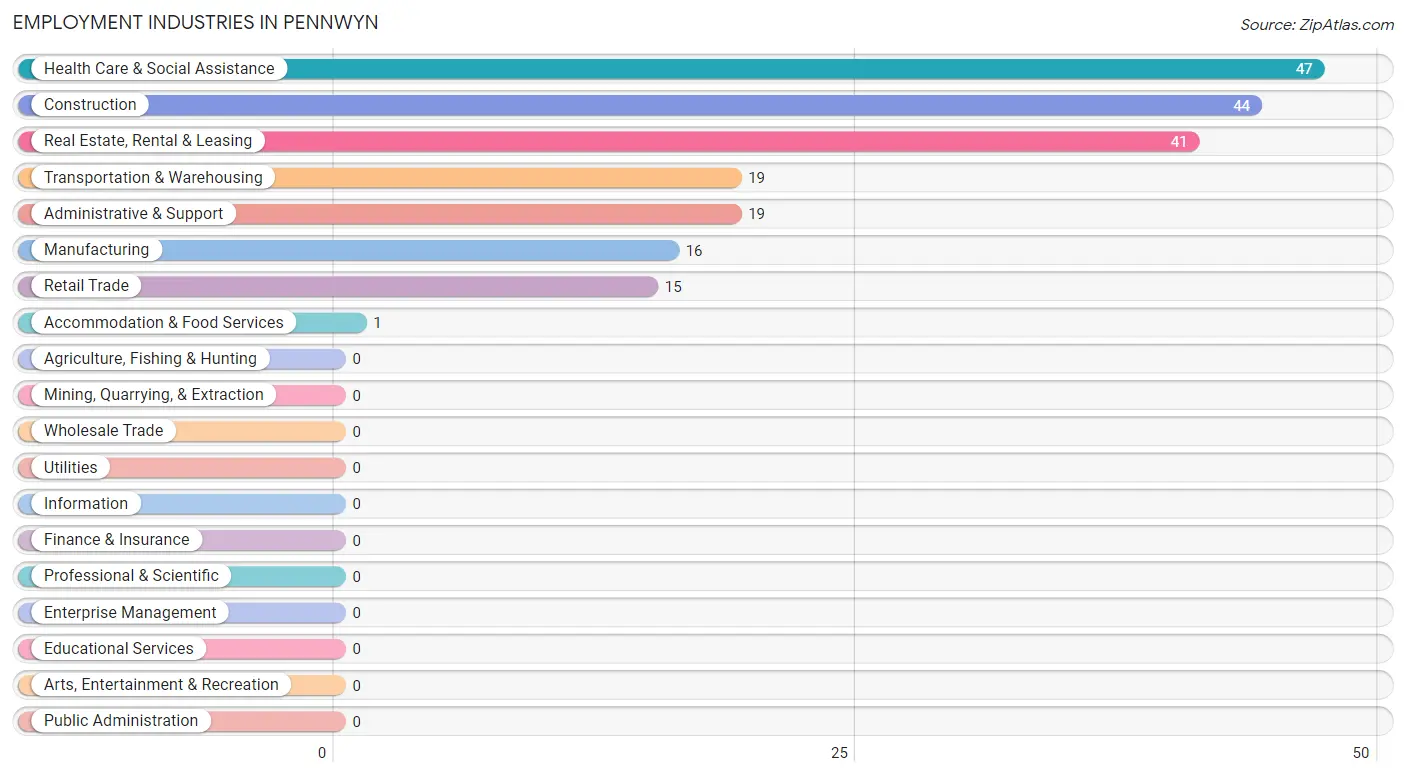
Employment Industries in Pennwyn
The major employment industries in Pennwyn include Health Care & Social Assistance (47 | 17.7%), Construction (44 | 16.6%), Real Estate, Rental & Leasing (41 | 15.5%), Transportation & Warehousing (19 | 7.2%), and Administrative & Support (19 | 7.2%).
Employment Industries by Sex in Pennwyn
The Pennwyn industries that see more men than women are Retail Trade (100.0%), Transportation & Warehousing (100.0%), and Accommodation & Food Services (100.0%), whereas the industries that tend to have a higher number of women are Manufacturing (100.0%), Real Estate, Rental & Leasing (100.0%), and Administrative & Support (100.0%).
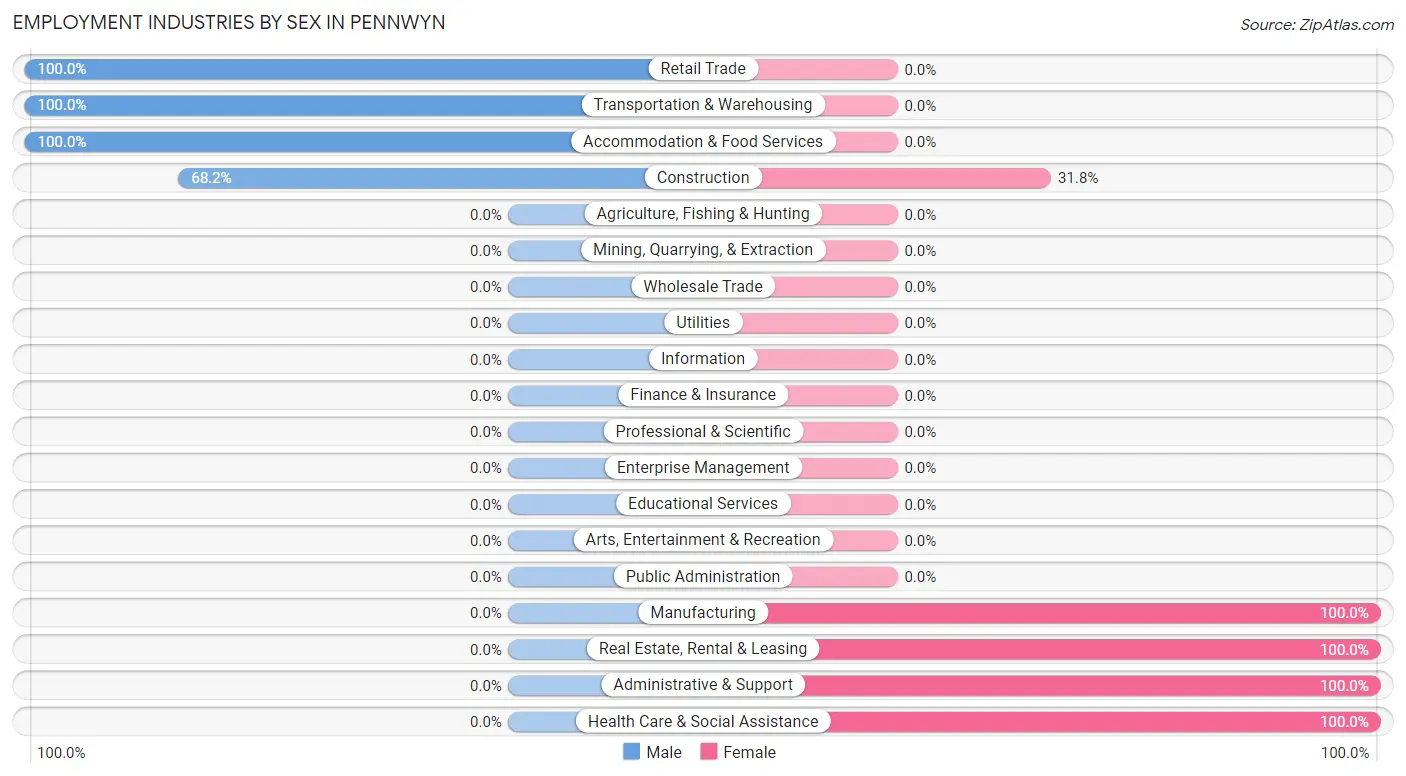
| Industry | Male | Female |
| Agriculture, Fishing & Hunting | 0 (0.0%) | 0 (0.0%) |
| Mining, Quarrying, & Extraction | 0 (0.0%) | 0 (0.0%) |
| Construction | 30 (68.2%) | 14 (31.8%) |
| Manufacturing | 0 (0.0%) | 16 (100.0%) |
| Wholesale Trade | 0 (0.0%) | 0 (0.0%) |
| Retail Trade | 15 (100.0%) | 0 (0.0%) |
| Transportation & Warehousing | 19 (100.0%) | 0 (0.0%) |
| Utilities | 0 (0.0%) | 0 (0.0%) |
| Information | 0 (0.0%) | 0 (0.0%) |
| Finance & Insurance | 0 (0.0%) | 0 (0.0%) |
| Real Estate, Rental & Leasing | 0 (0.0%) | 41 (100.0%) |
| Professional & Scientific | 0 (0.0%) | 0 (0.0%) |
| Enterprise Management | 0 (0.0%) | 0 (0.0%) |
| Administrative & Support | 0 (0.0%) | 19 (100.0%) |
| Educational Services | 0 (0.0%) | 0 (0.0%) |
| Health Care & Social Assistance | 0 (0.0%) | 47 (100.0%) |
| Arts, Entertainment & Recreation | 0 (0.0%) | 0 (0.0%) |
| Accommodation & Food Services | 1 (100.0%) | 0 (0.0%) |
| Public Administration | 0 (0.0%) | 0 (0.0%) |
| Total | 128 (48.3%) | 137 (51.7%) |
Education in Pennwyn
School Enrollment in Pennwyn
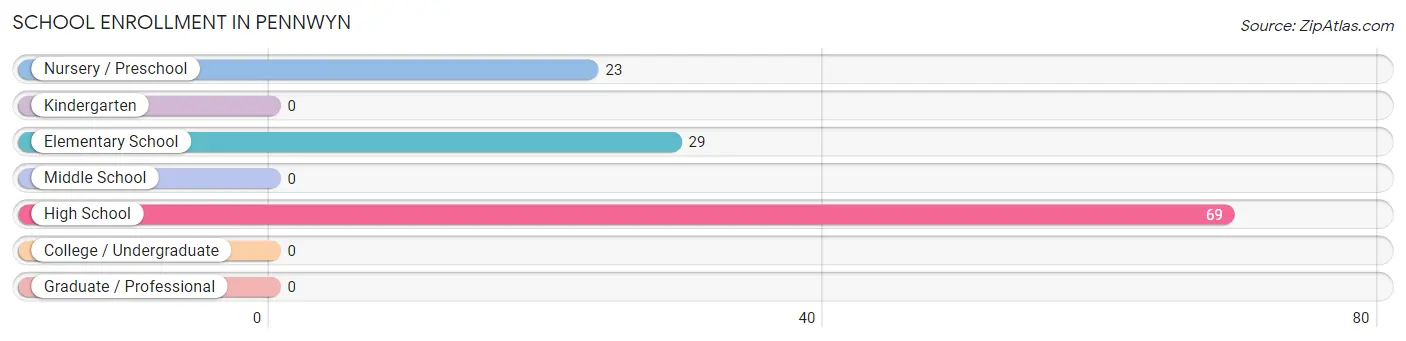
The most common levels of schooling among the 121 students in Pennwyn are high school (69 | 57.0%), elementary school (29 | 24.0%), and nursery / preschool (23 | 19.0%).
| School Level | # Students | % Students |
| Nursery / Preschool | 23 | 19.0% |
| Kindergarten | 0 | 0.0% |
| Elementary School | 29 | 24.0% |
| Middle School | 0 | 0.0% |
| High School | 69 | 57.0% |
| College / Undergraduate | 0 | 0.0% |
| Graduate / Professional | 0 | 0.0% |
| Total | 121 | 100.0% |
School Enrollment by Age by Funding Source in Pennwyn
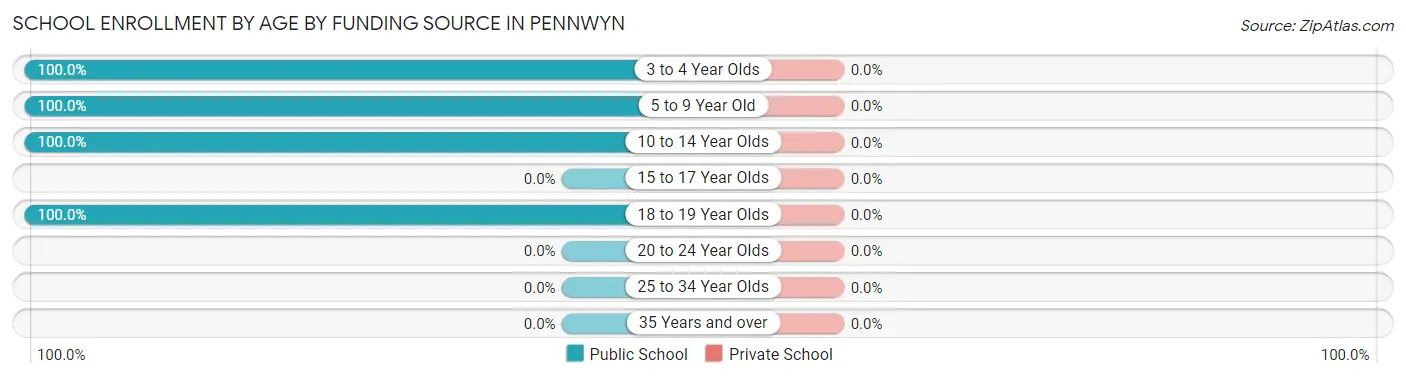
| Age Bracket | Public School | Private School |
| 3 to 4 Year Olds | 23 (100.0%) | 0 (0.0%) |
| 5 to 9 Year Old | 29 (100.0%) | 0 (0.0%) |
| 10 to 14 Year Olds | 35 (100.0%) | 0 (0.0%) |
| 15 to 17 Year Olds | 0 (0.0%) | 0 (0.0%) |
| 18 to 19 Year Olds | 34 (100.0%) | 0 (0.0%) |
| 20 to 24 Year Olds | 0 (0.0%) | 0 (0.0%) |
| 25 to 34 Year Olds | 0 (0.0%) | 0 (0.0%) |
| 35 Years and over | 0 (0.0%) | 0 (0.0%) |
| Total | 121 (100.0%) | 0 (0.0%) |
Educational Attainment by Field of Study in Pennwyn
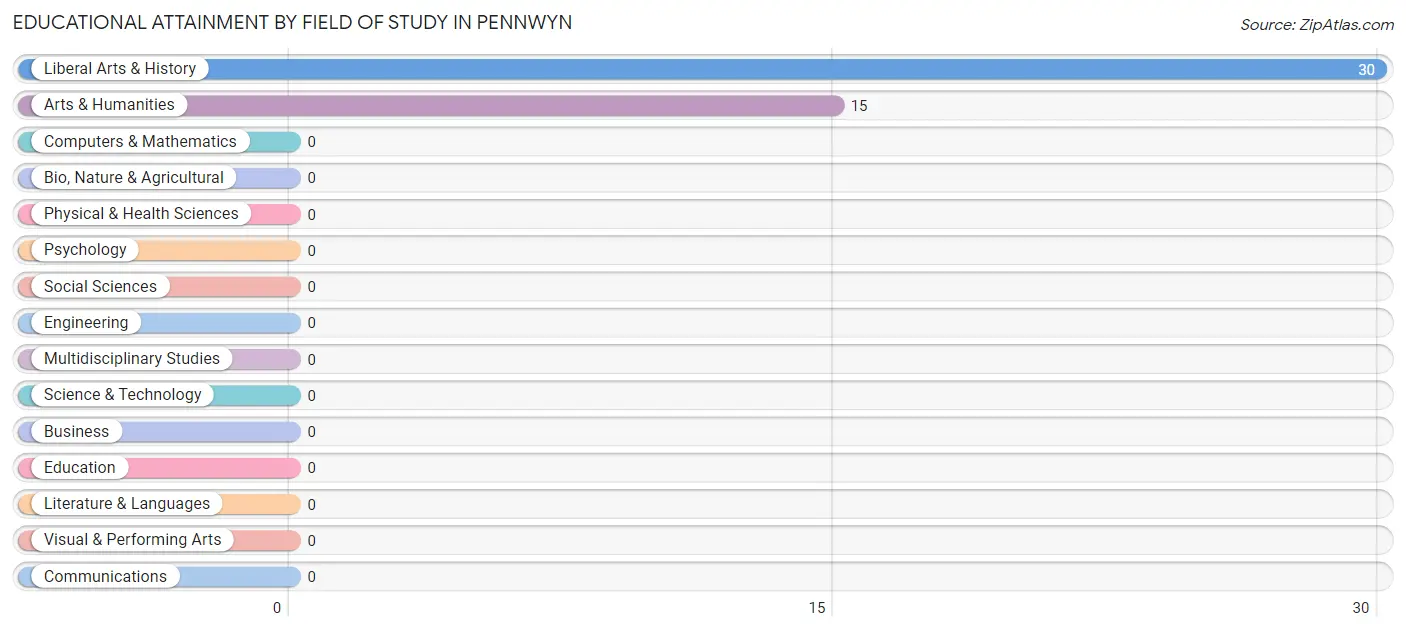
Liberal arts & history (30 | 66.7%), and arts & humanities (15 | 33.3%) are the most common fields of study among 45 individuals in Pennwyn who have obtained a bachelor's degree or higher.
| Field of Study | # Graduates | % Graduates |
| Computers & Mathematics | 0 | 0.0% |
| Bio, Nature & Agricultural | 0 | 0.0% |
| Physical & Health Sciences | 0 | 0.0% |
| Psychology | 0 | 0.0% |
| Social Sciences | 0 | 0.0% |
| Engineering | 0 | 0.0% |
| Multidisciplinary Studies | 0 | 0.0% |
| Science & Technology | 0 | 0.0% |
| Business | 0 | 0.0% |
| Education | 0 | 0.0% |
| Literature & Languages | 0 | 0.0% |
| Liberal Arts & History | 30 | 66.7% |
| Visual & Performing Arts | 0 | 0.0% |
| Communications | 0 | 0.0% |
| Arts & Humanities | 15 | 33.3% |
| Total | 45 | 100.0% |
Transportation & Commute in Pennwyn
Vehicle Availability by Sex in Pennwyn
The most prevalent vehicle ownership categories in Pennwyn are males with 2 vehicles (51, accounting for 40.2%) and females with 2 vehicles (35, making up 37.2%).
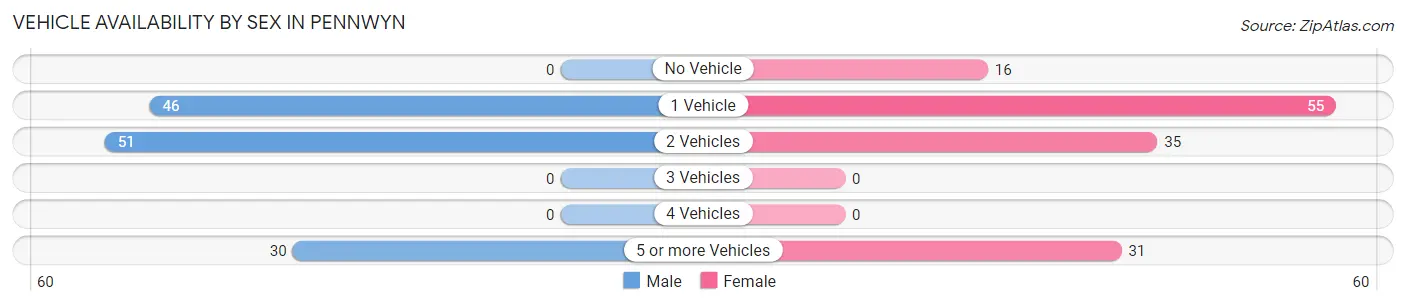
| Vehicles Available | Male | Female |
| No Vehicle | 0 (0.0%) | 16 (11.7%) |
| 1 Vehicle | 46 (36.2%) | 55 (40.2%) |
| 2 Vehicles | 51 (40.2%) | 35 (25.6%) |
| 3 Vehicles | 0 (0.0%) | 0 (0.0%) |
| 4 Vehicles | 0 (0.0%) | 0 (0.0%) |
| 5 or more Vehicles | 30 (23.6%) | 31 (22.6%) |
| Total | 127 (100.0%) | 137 (100.0%) |
Commute Time in Pennwyn
The most frequently occuring commute durations in Pennwyn are 30 to 34 minutes (75 commuters, 28.3%), 25 to 29 minutes (46 commuters, 17.4%), and 15 to 19 minutes (41 commuters, 15.5%).
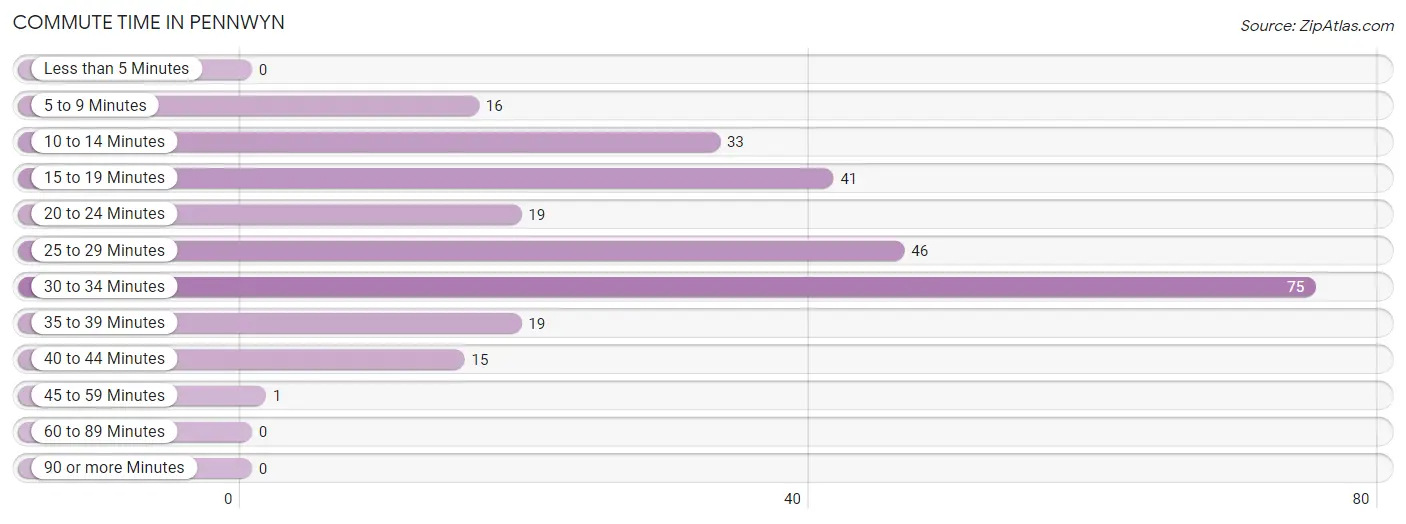
| Commute Time | # Commuters | % Commuters |
| Less than 5 Minutes | 0 | 0.0% |
| 5 to 9 Minutes | 16 | 6.0% |
| 10 to 14 Minutes | 33 | 12.4% |
| 15 to 19 Minutes | 41 | 15.5% |
| 20 to 24 Minutes | 19 | 7.2% |
| 25 to 29 Minutes | 46 | 17.4% |
| 30 to 34 Minutes | 75 | 28.3% |
| 35 to 39 Minutes | 19 | 7.2% |
| 40 to 44 Minutes | 15 | 5.7% |
| 45 to 59 Minutes | 1 | 0.4% |
| 60 to 89 Minutes | 0 | 0.0% |
| 90 or more Minutes | 0 | 0.0% |
Commute Time by Sex in Pennwyn
The most common commute times in Pennwyn are 25 to 29 minutes (46 commuters, 35.9%) for males and 30 to 34 minutes (45 commuters, 32.9%) for females.
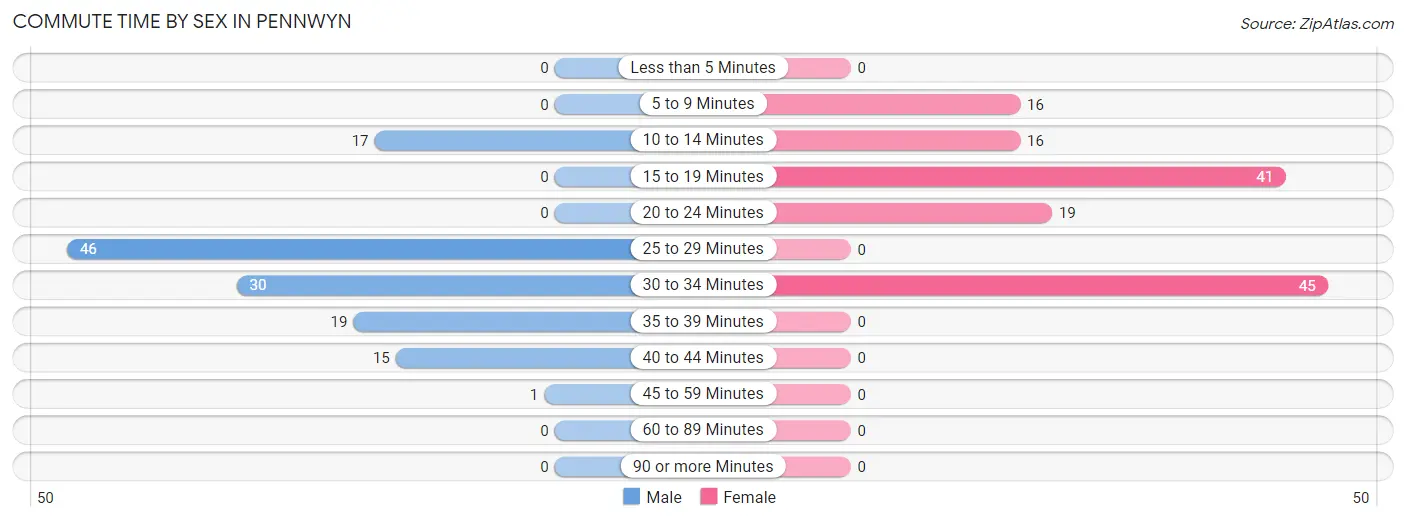
| Commute Time | Male | Female |
| Less than 5 Minutes | 0 (0.0%) | 0 (0.0%) |
| 5 to 9 Minutes | 0 (0.0%) | 16 (11.7%) |
| 10 to 14 Minutes | 17 (13.3%) | 16 (11.7%) |
| 15 to 19 Minutes | 0 (0.0%) | 41 (29.9%) |
| 20 to 24 Minutes | 0 (0.0%) | 19 (13.9%) |
| 25 to 29 Minutes | 46 (35.9%) | 0 (0.0%) |
| 30 to 34 Minutes | 30 (23.4%) | 45 (32.9%) |
| 35 to 39 Minutes | 19 (14.8%) | 0 (0.0%) |
| 40 to 44 Minutes | 15 (11.7%) | 0 (0.0%) |
| 45 to 59 Minutes | 1 (0.8%) | 0 (0.0%) |
| 60 to 89 Minutes | 0 (0.0%) | 0 (0.0%) |
| 90 or more Minutes | 0 (0.0%) | 0 (0.0%) |
Time of Departure to Work by Sex in Pennwyn
The most frequent times of departure to work in Pennwyn are 7:00 AM to 7:29 AM (76, 59.4%) for males and 7:30 AM to 7:59 AM (60, 43.8%) for females.
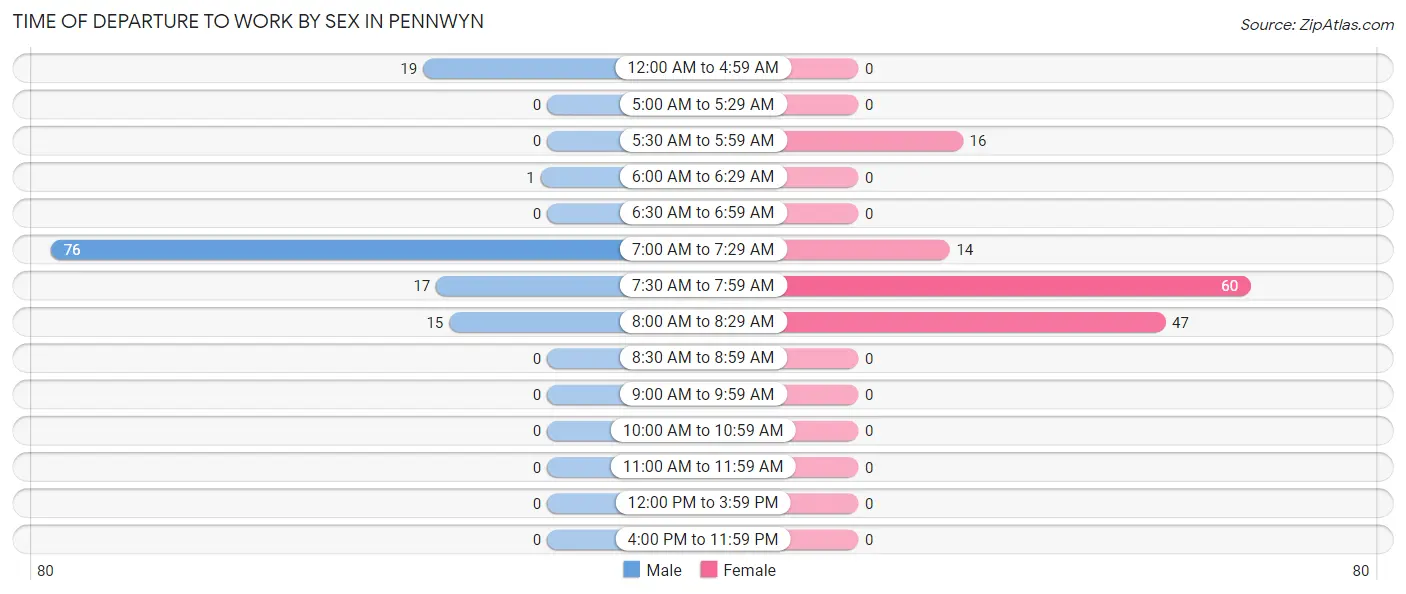
| Time of Departure | Male | Female |
| 12:00 AM to 4:59 AM | 19 (14.8%) | 0 (0.0%) |
| 5:00 AM to 5:29 AM | 0 (0.0%) | 0 (0.0%) |
| 5:30 AM to 5:59 AM | 0 (0.0%) | 16 (11.7%) |
| 6:00 AM to 6:29 AM | 1 (0.8%) | 0 (0.0%) |
| 6:30 AM to 6:59 AM | 0 (0.0%) | 0 (0.0%) |
| 7:00 AM to 7:29 AM | 76 (59.4%) | 14 (10.2%) |
| 7:30 AM to 7:59 AM | 17 (13.3%) | 60 (43.8%) |
| 8:00 AM to 8:29 AM | 15 (11.7%) | 47 (34.3%) |
| 8:30 AM to 8:59 AM | 0 (0.0%) | 0 (0.0%) |
| 9:00 AM to 9:59 AM | 0 (0.0%) | 0 (0.0%) |
| 10:00 AM to 10:59 AM | 0 (0.0%) | 0 (0.0%) |
| 11:00 AM to 11:59 AM | 0 (0.0%) | 0 (0.0%) |
| 12:00 PM to 3:59 PM | 0 (0.0%) | 0 (0.0%) |
| 4:00 PM to 11:59 PM | 0 (0.0%) | 0 (0.0%) |
| Total | 128 (100.0%) | 137 (100.0%) |
Housing Occupancy in Pennwyn
Occupancy by Ownership in Pennwyn
Of the total 252 dwellings in Pennwyn, owner-occupied units account for 245 (97.2%), while renter-occupied units make up 7 (2.8%).
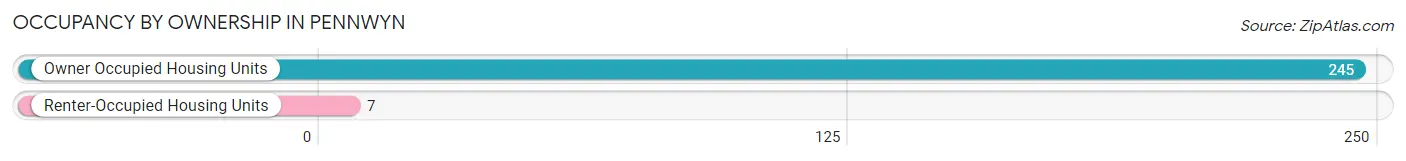
| Occupancy | # Housing Units | % Housing Units |
| Owner Occupied Housing Units | 245 | 97.2% |
| Renter-Occupied Housing Units | 7 | 2.8% |
| Total Occupied Housing Units | 252 | 100.0% |
Occupancy by Household Size in Pennwyn
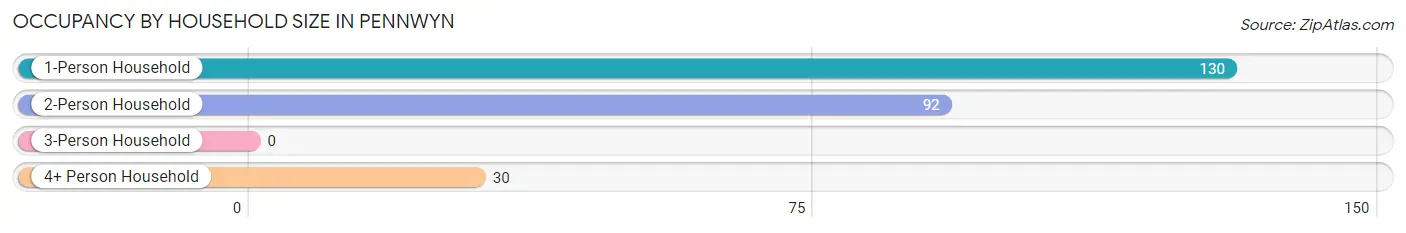
| Household Size | # Housing Units | % Housing Units |
| 1-Person Household | 130 | 51.6% |
| 2-Person Household | 92 | 36.5% |
| 3-Person Household | 0 | 0.0% |
| 4+ Person Household | 30 | 11.9% |
| Total Housing Units | 252 | 100.0% |
Occupancy by Ownership by Household Size in Pennwyn
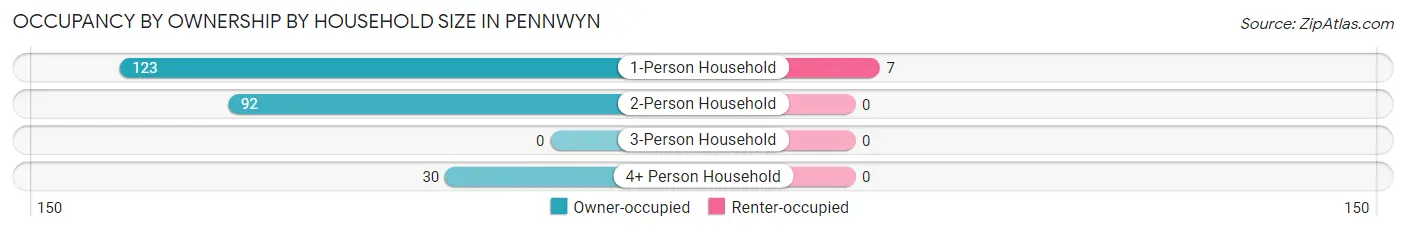
| Household Size | Owner-occupied | Renter-occupied |
| 1-Person Household | 123 (94.6%) | 7 (5.4%) |
| 2-Person Household | 92 (100.0%) | 0 (0.0%) |
| 3-Person Household | 0 (0.0%) | 0 (0.0%) |
| 4+ Person Household | 30 (100.0%) | 0 (0.0%) |
| Total Housing Units | 245 (97.2%) | 7 (2.8%) |
Occupancy by Educational Attainment in Pennwyn
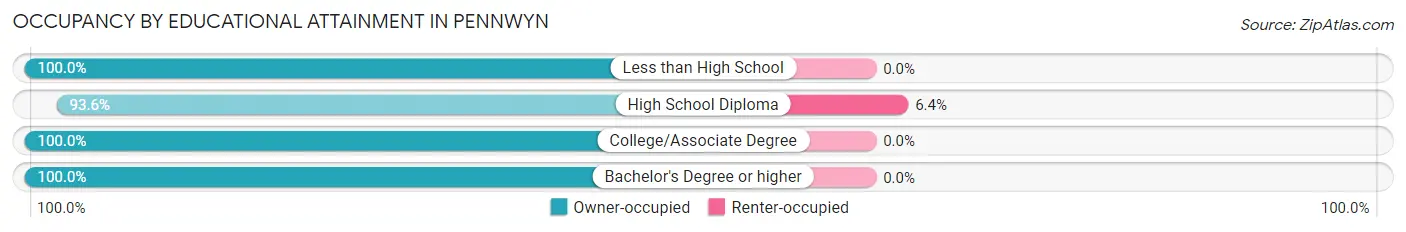
| Household Size | Owner-occupied | Renter-occupied |
| Less than High School | 84 (100.0%) | 0 (0.0%) |
| High School Diploma | 103 (93.6%) | 7 (6.4%) |
| College/Associate Degree | 13 (100.0%) | 0 (0.0%) |
| Bachelor's Degree or higher | 45 (100.0%) | 0 (0.0%) |
Occupancy by Age of Householder in Pennwyn
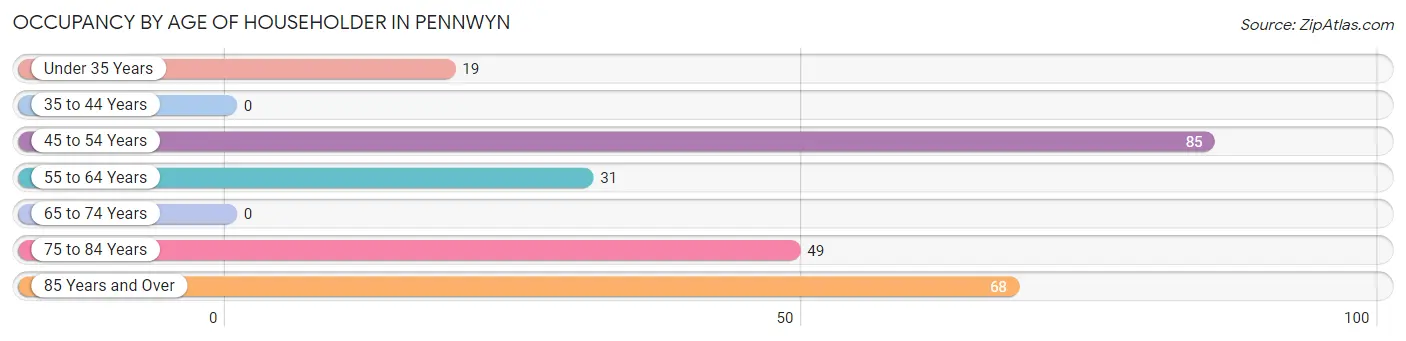
| Age Bracket | # Households | % Households |
| Under 35 Years | 19 | 7.5% |
| 35 to 44 Years | 0 | 0.0% |
| 45 to 54 Years | 85 | 33.7% |
| 55 to 64 Years | 31 | 12.3% |
| 65 to 74 Years | 0 | 0.0% |
| 75 to 84 Years | 49 | 19.4% |
| 85 Years and Over | 68 | 27.0% |
| Total | 252 | 100.0% |
Housing Finances in Pennwyn
Median Income by Occupancy in Pennwyn
| Occupancy Type | # Households | Median Income |
| Owner-Occupied | 245 (97.2%) | $0 |
| Renter-Occupied | 7 (2.8%) | $0 |
| Average | 252 (100.0%) | $0 |
Occupancy by Householder Income Bracket in Pennwyn
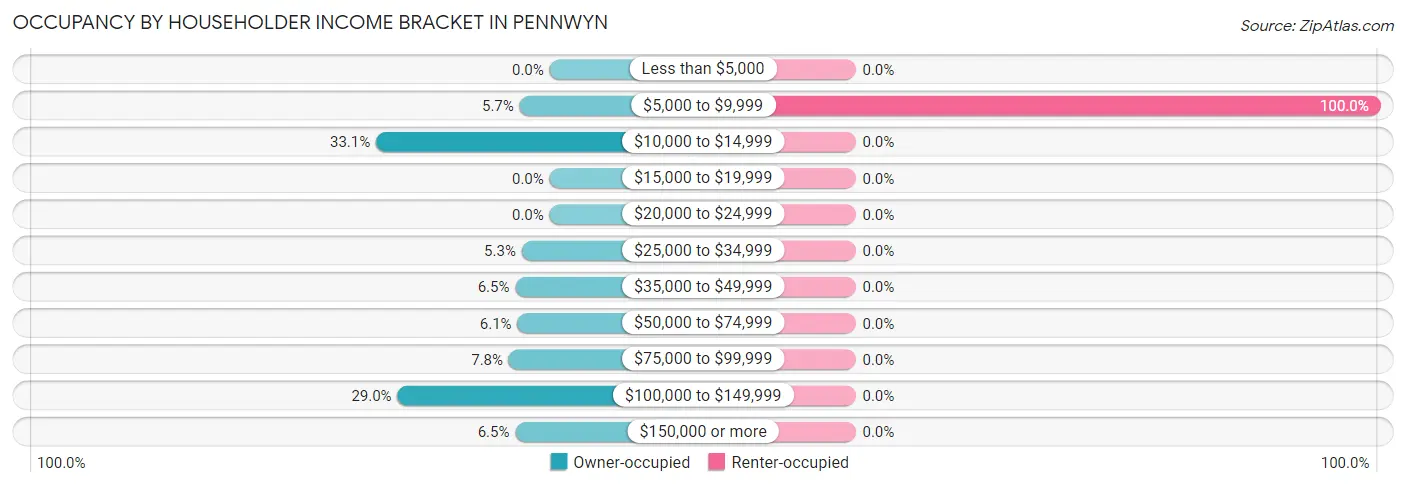
| Income Bracket | Owner-occupied | Renter-occupied |
| Less than $5,000 | 0 (0.0%) | 0 (0.0%) |
| $5,000 to $9,999 | 14 (5.7%) | 7 (100.0%) |
| $10,000 to $14,999 | 81 (33.1%) | 0 (0.0%) |
| $15,000 to $19,999 | 0 (0.0%) | 0 (0.0%) |
| $20,000 to $24,999 | 0 (0.0%) | 0 (0.0%) |
| $25,000 to $34,999 | 13 (5.3%) | 0 (0.0%) |
| $35,000 to $49,999 | 16 (6.5%) | 0 (0.0%) |
| $50,000 to $74,999 | 15 (6.1%) | 0 (0.0%) |
| $75,000 to $99,999 | 19 (7.8%) | 0 (0.0%) |
| $100,000 to $149,999 | 71 (29.0%) | 0 (0.0%) |
| $150,000 or more | 16 (6.5%) | 0 (0.0%) |
| Total | 245 (100.0%) | 7 (100.0%) |
Monthly Housing Cost Tiers in Pennwyn
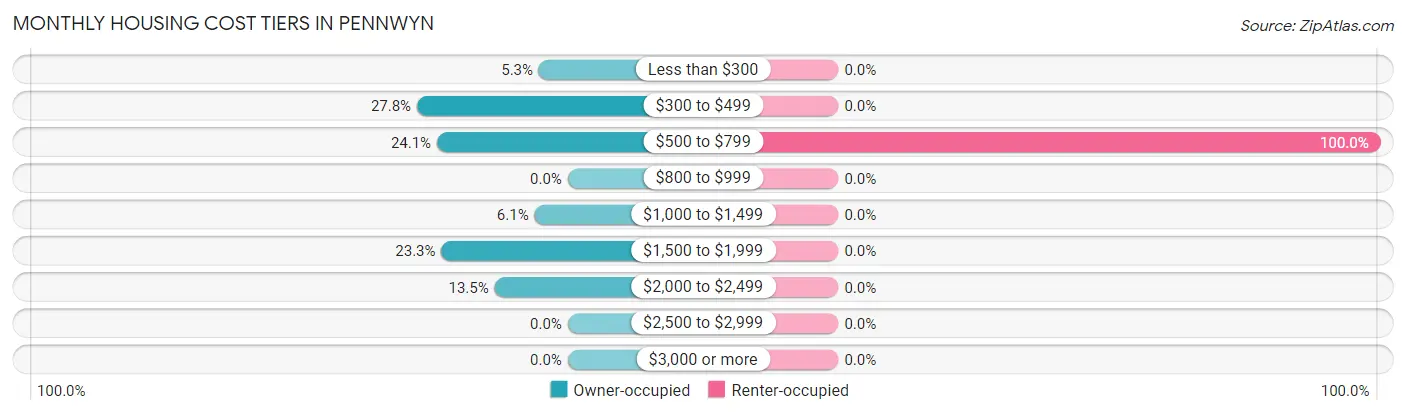
| Monthly Cost | Owner-occupied | Renter-occupied |
| Less than $300 | 13 (5.3%) | 0 (0.0%) |
| $300 to $499 | 68 (27.8%) | 0 (0.0%) |
| $500 to $799 | 59 (24.1%) | 7 (100.0%) |
| $800 to $999 | 0 (0.0%) | 0 (0.0%) |
| $1,000 to $1,499 | 15 (6.1%) | 0 (0.0%) |
| $1,500 to $1,999 | 57 (23.3%) | 0 (0.0%) |
| $2,000 to $2,499 | 33 (13.5%) | 0 (0.0%) |
| $2,500 to $2,999 | 0 (0.0%) | 0 (0.0%) |
| $3,000 or more | 0 (0.0%) | 0 (0.0%) |
| Total | 245 (100.0%) | 7 (100.0%) |
Physical Housing Characteristics in Pennwyn
Housing Structures in Pennwyn
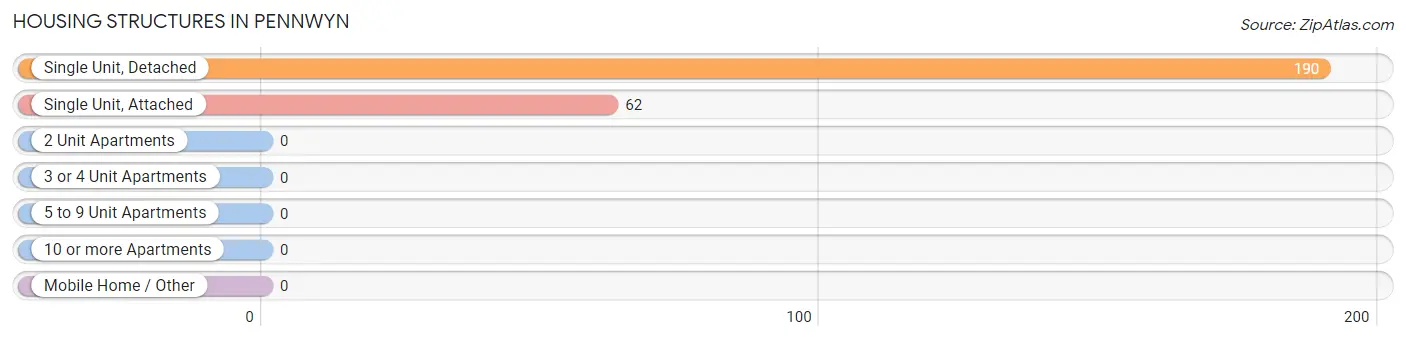
| Structure Type | # Housing Units | % Housing Units |
| Single Unit, Detached | 190 | 75.4% |
| Single Unit, Attached | 62 | 24.6% |
| 2 Unit Apartments | 0 | 0.0% |
| 3 or 4 Unit Apartments | 0 | 0.0% |
| 5 to 9 Unit Apartments | 0 | 0.0% |
| 10 or more Apartments | 0 | 0.0% |
| Mobile Home / Other | 0 | 0.0% |
| Total | 252 | 100.0% |
Housing Structures by Occupancy in Pennwyn
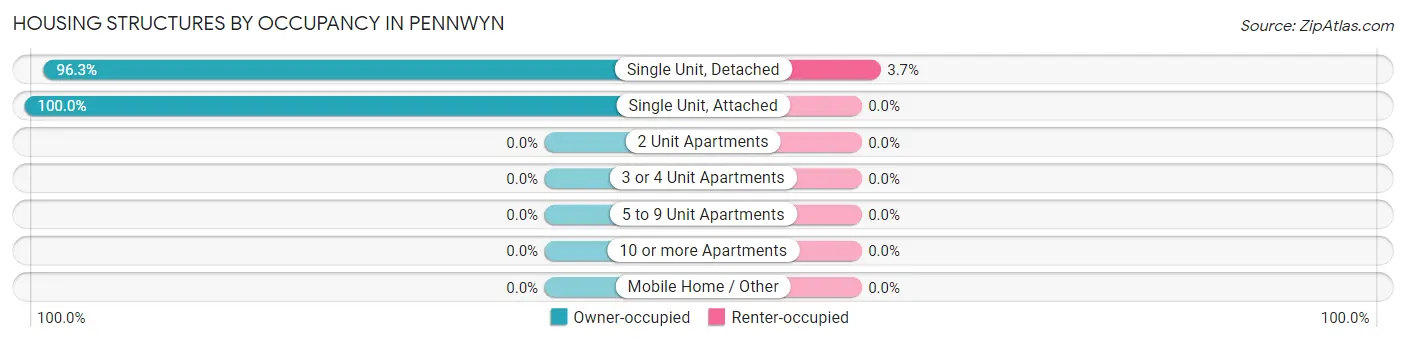
| Structure Type | Owner-occupied | Renter-occupied |
| Single Unit, Detached | 183 (96.3%) | 7 (3.7%) |
| Single Unit, Attached | 62 (100.0%) | 0 (0.0%) |
| 2 Unit Apartments | 0 (0.0%) | 0 (0.0%) |
| 3 or 4 Unit Apartments | 0 (0.0%) | 0 (0.0%) |
| 5 to 9 Unit Apartments | 0 (0.0%) | 0 (0.0%) |
| 10 or more Apartments | 0 (0.0%) | 0 (0.0%) |
| Mobile Home / Other | 0 (0.0%) | 0 (0.0%) |
| Total | 245 (97.2%) | 7 (2.8%) |
Housing Structures by Number of Rooms in Pennwyn
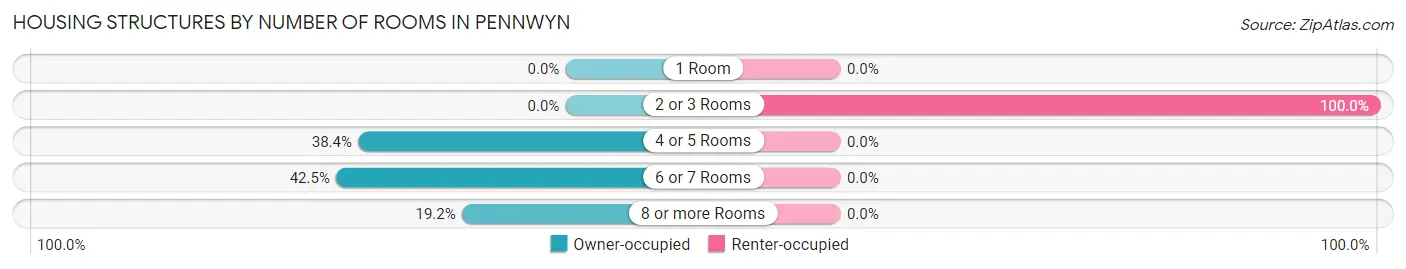
| Number of Rooms | Owner-occupied | Renter-occupied |
| 1 Room | 0 (0.0%) | 0 (0.0%) |
| 2 or 3 Rooms | 0 (0.0%) | 7 (100.0%) |
| 4 or 5 Rooms | 94 (38.4%) | 0 (0.0%) |
| 6 or 7 Rooms | 104 (42.4%) | 0 (0.0%) |
| 8 or more Rooms | 47 (19.2%) | 0 (0.0%) |
| Total | 245 (100.0%) | 7 (100.0%) |
Housing Structure by Heating Type in Pennwyn
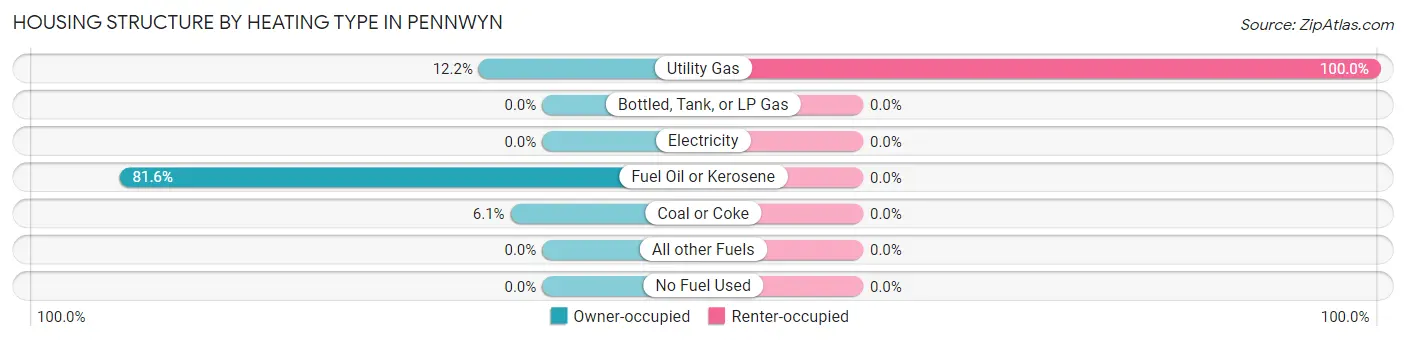
| Heating Type | Owner-occupied | Renter-occupied |
| Utility Gas | 30 (12.2%) | 7 (100.0%) |
| Bottled, Tank, or LP Gas | 0 (0.0%) | 0 (0.0%) |
| Electricity | 0 (0.0%) | 0 (0.0%) |
| Fuel Oil or Kerosene | 200 (81.6%) | 0 (0.0%) |
| Coal or Coke | 15 (6.1%) | 0 (0.0%) |
| All other Fuels | 0 (0.0%) | 0 (0.0%) |
| No Fuel Used | 0 (0.0%) | 0 (0.0%) |
| Total | 245 (100.0%) | 7 (100.0%) |
Household Vehicle Usage in Pennwyn
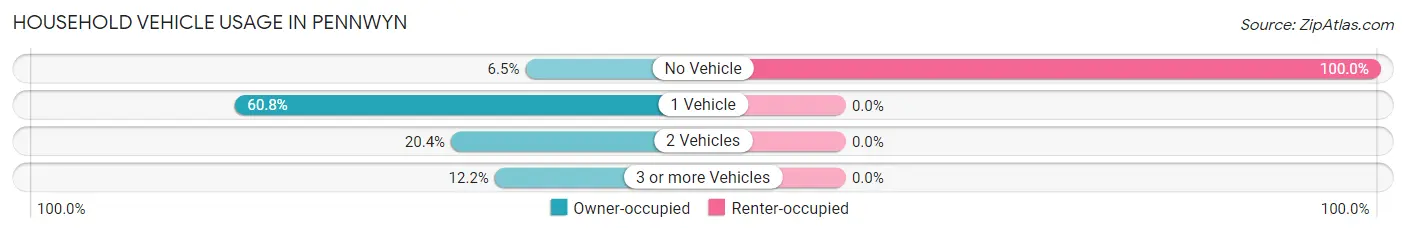
| Vehicles per Household | Owner-occupied | Renter-occupied |
| No Vehicle | 16 (6.5%) | 7 (100.0%) |
| 1 Vehicle | 149 (60.8%) | 0 (0.0%) |
| 2 Vehicles | 50 (20.4%) | 0 (0.0%) |
| 3 or more Vehicles | 30 (12.2%) | 0 (0.0%) |
| Total | 245 (100.0%) | 7 (100.0%) |
Real Estate & Mortgages in Pennwyn
Real Estate and Mortgage Overview in Pennwyn
| Characteristic | Without Mortgage | With Mortgage |
| Housing Units | 124 | 121 |
| Median Property Value | - | - |
| Median Household Income | - | - |
| Monthly Housing Costs | $472 | $0 |
| Real Estate Taxes | $2,660 | $0 |
Property Value by Mortgage Status in Pennwyn
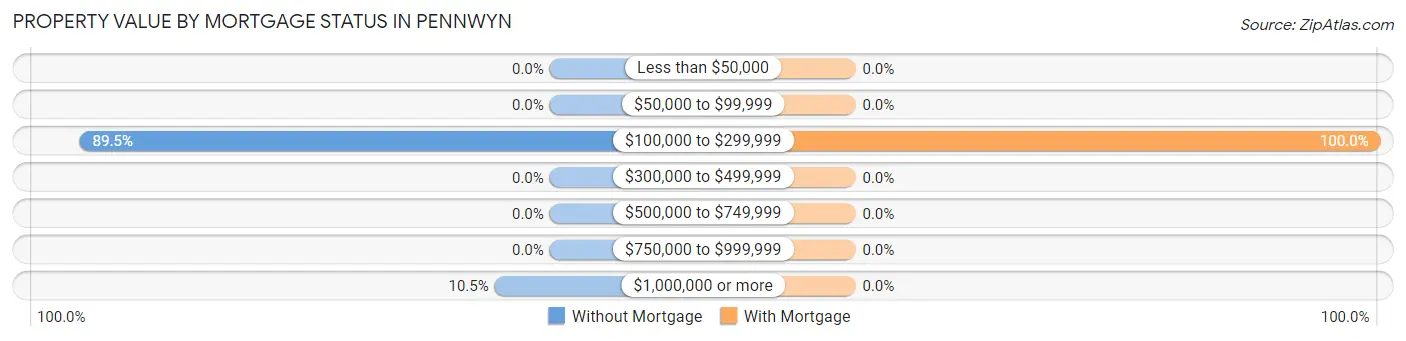
| Property Value | Without Mortgage | With Mortgage |
| Less than $50,000 | 0 (0.0%) | 0 (0.0%) |
| $50,000 to $99,999 | 0 (0.0%) | 0 (0.0%) |
| $100,000 to $299,999 | 111 (89.5%) | 121 (100.0%) |
| $300,000 to $499,999 | 0 (0.0%) | 0 (0.0%) |
| $500,000 to $749,999 | 0 (0.0%) | 0 (0.0%) |
| $750,000 to $999,999 | 0 (0.0%) | 0 (0.0%) |
| $1,000,000 or more | 13 (10.5%) | 0 (0.0%) |
| Total | 124 (100.0%) | 121 (100.0%) |
Household Income by Mortgage Status in Pennwyn
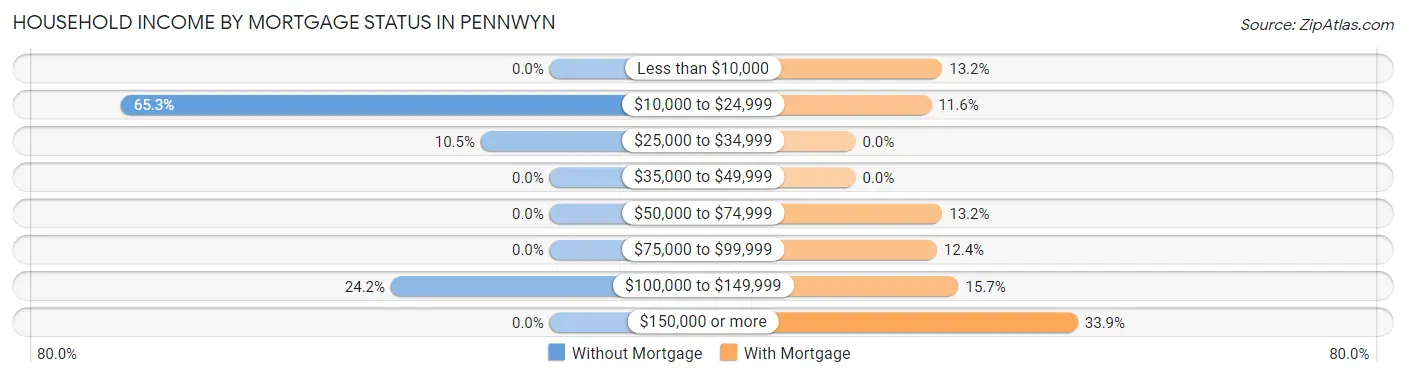
| Household Income | Without Mortgage | With Mortgage |
| Less than $10,000 | 0 (0.0%) | 16 (13.2%) |
| $10,000 to $24,999 | 81 (65.3%) | 14 (11.6%) |
| $25,000 to $34,999 | 13 (10.5%) | 0 (0.0%) |
| $35,000 to $49,999 | 0 (0.0%) | 0 (0.0%) |
| $50,000 to $74,999 | 0 (0.0%) | 16 (13.2%) |
| $75,000 to $99,999 | 0 (0.0%) | 15 (12.4%) |
| $100,000 to $149,999 | 30 (24.2%) | 19 (15.7%) |
| $150,000 or more | 0 (0.0%) | 41 (33.9%) |
| Total | 124 (100.0%) | 121 (100.0%) |
Property Value to Household Income Ratio in Pennwyn
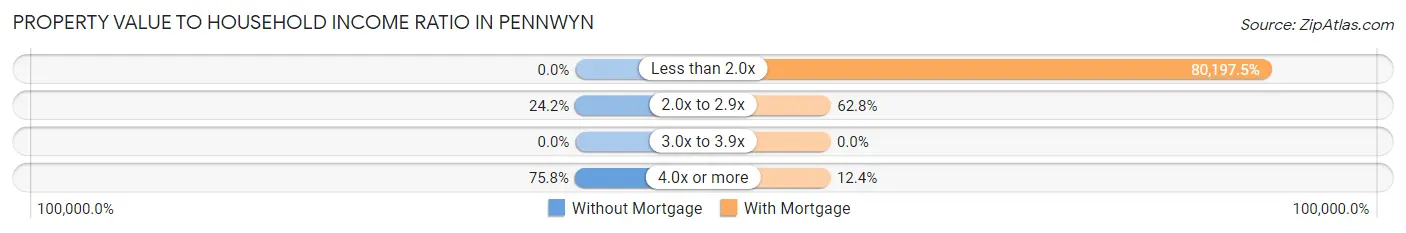
| Value-to-Income Ratio | Without Mortgage | With Mortgage |
| Less than 2.0x | 0 (0.0%) | 97,039 (80,197.5%) |
| 2.0x to 2.9x | 30 (24.2%) | 76 (62.8%) |
| 3.0x to 3.9x | 0 (0.0%) | 0 (0.0%) |
| 4.0x or more | 94 (75.8%) | 15 (12.4%) |
| Total | 124 (100.0%) | 121 (100.0%) |
Real Estate Taxes by Mortgage Status in Pennwyn
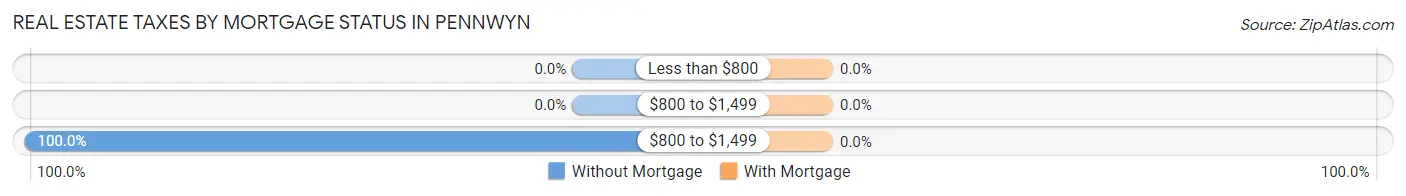
| Property Taxes | Without Mortgage | With Mortgage |
| Less than $800 | 0 (0.0%) | 0 (0.0%) |
| $800 to $1,499 | 0 (0.0%) | 0 (0.0%) |
| $800 to $1,499 | 124 (100.0%) | 0 (0.0%) |
| Total | 124 (100.0%) | 121 (100.0%) |
Health & Disability in Pennwyn
Health Insurance Coverage by Age in Pennwyn
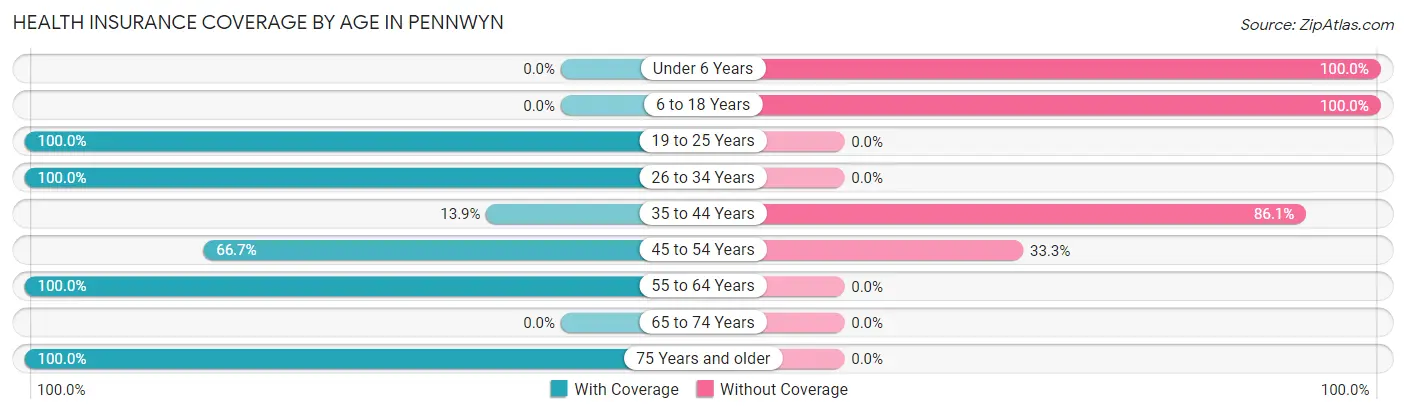
| Age Bracket | With Coverage | Without Coverage |
| Under 6 Years | 0 (0.0%) | 23 (100.0%) |
| 6 to 18 Years | 0 (0.0%) | 98 (100.0%) |
| 19 to 25 Years | 1 (100.0%) | 0 (0.0%) |
| 26 to 34 Years | 38 (100.0%) | 0 (0.0%) |
| 35 to 44 Years | 5 (13.9%) | 31 (86.1%) |
| 45 to 54 Years | 60 (66.7%) | 30 (33.3%) |
| 55 to 64 Years | 94 (100.0%) | 0 (0.0%) |
| 65 to 74 Years | 0 (0.0%) | 0 (0.0%) |
| 75 Years and older | 130 (100.0%) | 0 (0.0%) |
| Total | 328 (64.3%) | 182 (35.7%) |
Health Insurance Coverage by Citizenship Status in Pennwyn
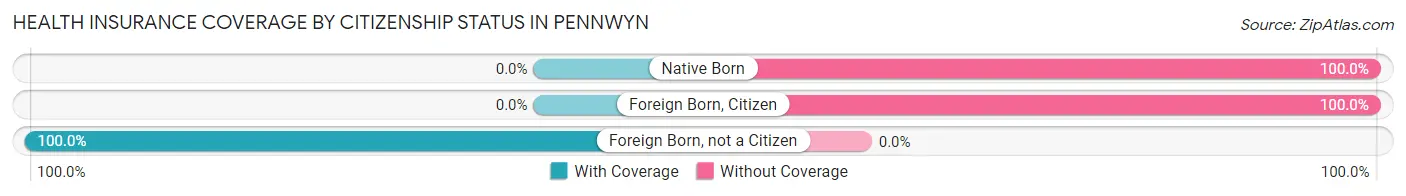
| Citizenship Status | With Coverage | Without Coverage |
| Native Born | 0 (0.0%) | 23 (100.0%) |
| Foreign Born, Citizen | 0 (0.0%) | 98 (100.0%) |
| Foreign Born, not a Citizen | 1 (100.0%) | 0 (0.0%) |
Health Insurance Coverage by Household Income in Pennwyn
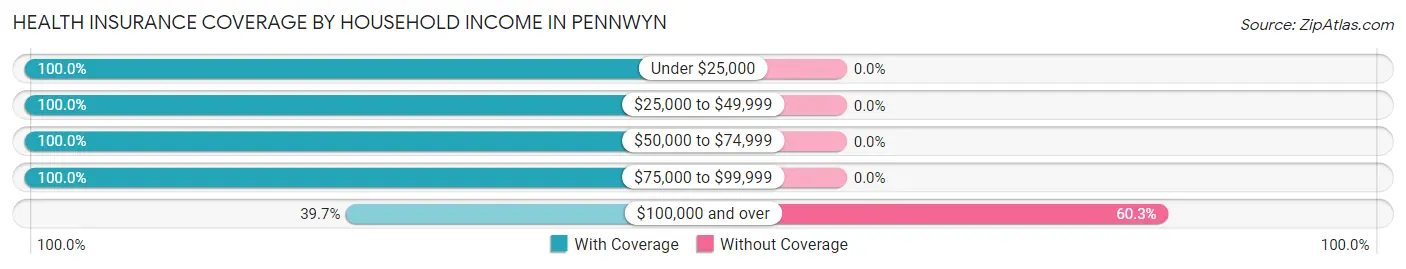
| Household Income | With Coverage | Without Coverage |
| Under $25,000 | 102 (100.0%) | 0 (0.0%) |
| $25,000 to $49,999 | 42 (100.0%) | 0 (0.0%) |
| $50,000 to $74,999 | 15 (100.0%) | 0 (0.0%) |
| $75,000 to $99,999 | 38 (100.0%) | 0 (0.0%) |
| $100,000 and over | 120 (39.7%) | 182 (60.3%) |
Public vs Private Health Insurance Coverage by Age in Pennwyn
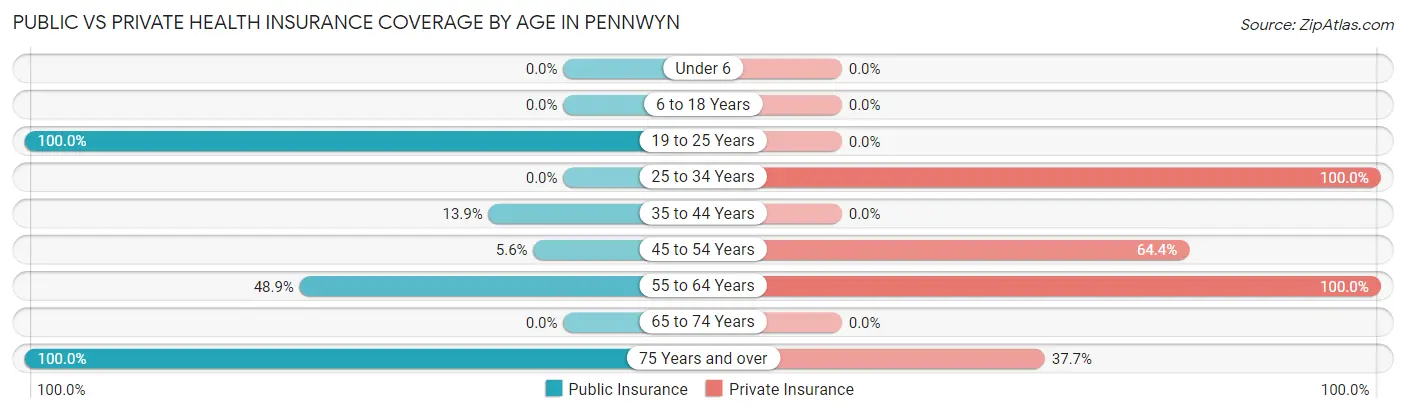
| Age Bracket | Public Insurance | Private Insurance |
| Under 6 | 0 (0.0%) | 0 (0.0%) |
| 6 to 18 Years | 0 (0.0%) | 0 (0.0%) |
| 19 to 25 Years | 1 (100.0%) | 0 (0.0%) |
| 25 to 34 Years | 0 (0.0%) | 38 (100.0%) |
| 35 to 44 Years | 5 (13.9%) | 0 (0.0%) |
| 45 to 54 Years | 5 (5.6%) | 58 (64.4%) |
| 55 to 64 Years | 46 (48.9%) | 94 (100.0%) |
| 65 to 74 Years | 0 (0.0%) | 0 (0.0%) |
| 75 Years and over | 130 (100.0%) | 49 (37.7%) |
| Total | 187 (36.7%) | 239 (46.9%) |
Disability Status by Sex by Age in Pennwyn
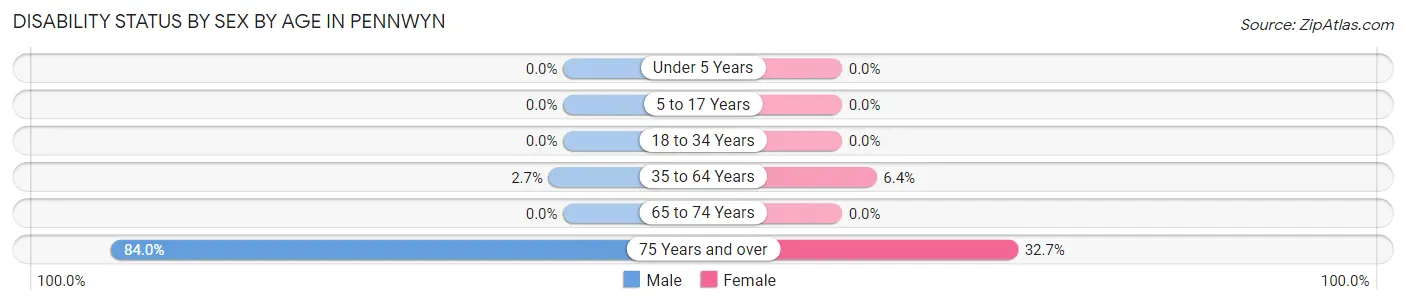
| Age Bracket | Male | Female |
| Under 5 Years | 0 (0.0%) | 0 (0.0%) |
| 5 to 17 Years | 0 (0.0%) | 0 (0.0%) |
| 18 to 34 Years | 0 (0.0%) | 0 (0.0%) |
| 35 to 64 Years | 3 (2.7%) | 7 (6.4%) |
| 65 to 74 Years | 0 (0.0%) | 0 (0.0%) |
| 75 Years and over | 68 (84.0%) | 16 (32.7%) |
Disability Class by Sex by Age in Pennwyn
Disability Class: Hearing Difficulty
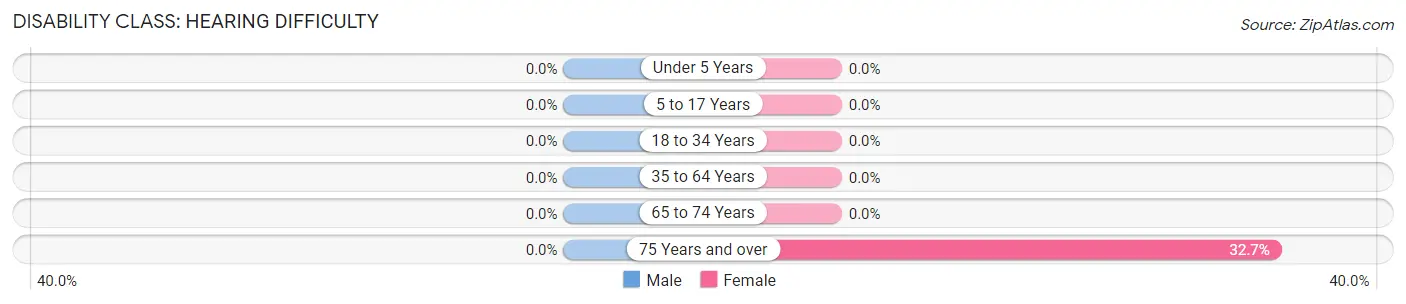
| Age Bracket | Male | Female |
| Under 5 Years | 0 (0.0%) | 0 (0.0%) |
| 5 to 17 Years | 0 (0.0%) | 0 (0.0%) |
| 18 to 34 Years | 0 (0.0%) | 0 (0.0%) |
| 35 to 64 Years | 0 (0.0%) | 0 (0.0%) |
| 65 to 74 Years | 0 (0.0%) | 0 (0.0%) |
| 75 Years and over | 0 (0.0%) | 16 (32.7%) |
Disability Class: Vision Difficulty
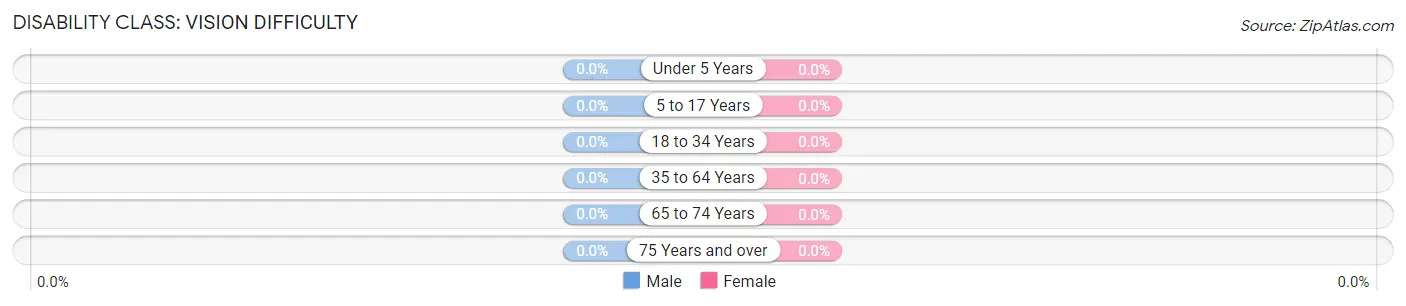
| Age Bracket | Male | Female |
| Under 5 Years | 0 (0.0%) | 0 (0.0%) |
| 5 to 17 Years | 0 (0.0%) | 0 (0.0%) |
| 18 to 34 Years | 0 (0.0%) | 0 (0.0%) |
| 35 to 64 Years | 0 (0.0%) | 0 (0.0%) |
| 65 to 74 Years | 0 (0.0%) | 0 (0.0%) |
| 75 Years and over | 0 (0.0%) | 0 (0.0%) |
Disability Class: Cognitive Difficulty
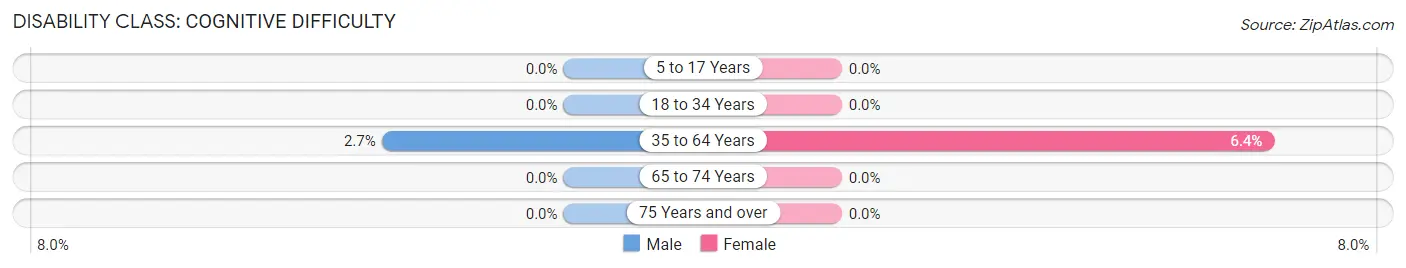
| Age Bracket | Male | Female |
| 5 to 17 Years | 0 (0.0%) | 0 (0.0%) |
| 18 to 34 Years | 0 (0.0%) | 0 (0.0%) |
| 35 to 64 Years | 3 (2.7%) | 7 (6.4%) |
| 65 to 74 Years | 0 (0.0%) | 0 (0.0%) |
| 75 Years and over | 0 (0.0%) | 0 (0.0%) |
Disability Class: Ambulatory Difficulty
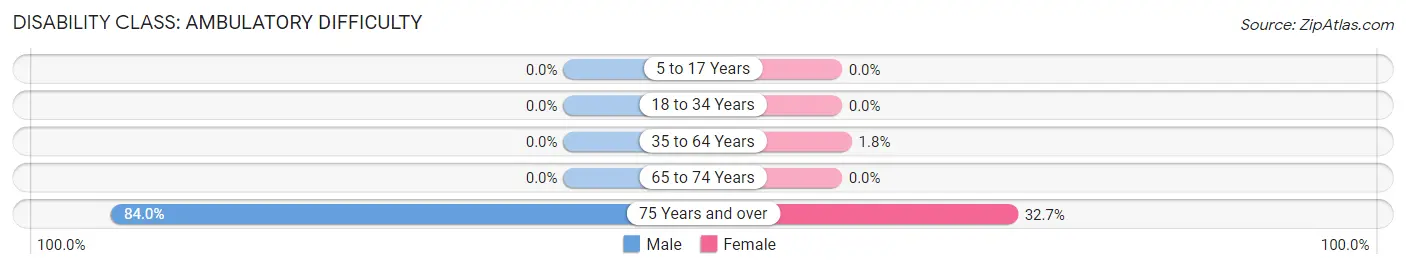
| Age Bracket | Male | Female |
| 5 to 17 Years | 0 (0.0%) | 0 (0.0%) |
| 18 to 34 Years | 0 (0.0%) | 0 (0.0%) |
| 35 to 64 Years | 0 (0.0%) | 2 (1.8%) |
| 65 to 74 Years | 0 (0.0%) | 0 (0.0%) |
| 75 Years and over | 68 (84.0%) | 16 (32.7%) |
Disability Class: Self-Care Difficulty

| Age Bracket | Male | Female |
| 5 to 17 Years | 0 (0.0%) | 0 (0.0%) |
| 18 to 34 Years | 0 (0.0%) | 0 (0.0%) |
| 35 to 64 Years | 3 (2.7%) | 7 (6.4%) |
| 65 to 74 Years | 0 (0.0%) | 0 (0.0%) |
| 75 Years and over | 0 (0.0%) | 0 (0.0%) |
Technology Access in Pennwyn
Computing Device Access in Pennwyn
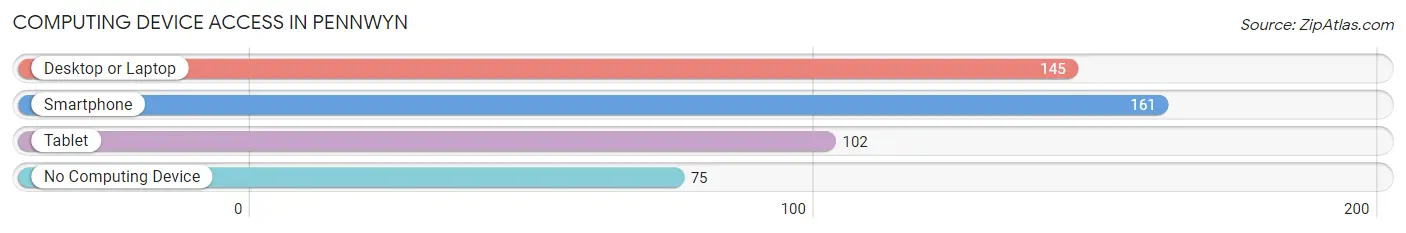
| Device Type | # Households | % Households |
| Desktop or Laptop | 145 | 57.5% |
| Smartphone | 161 | 63.9% |
| Tablet | 102 | 40.5% |
| No Computing Device | 75 | 29.8% |
| Total | 252 | 100.0% |
Internet Access in Pennwyn
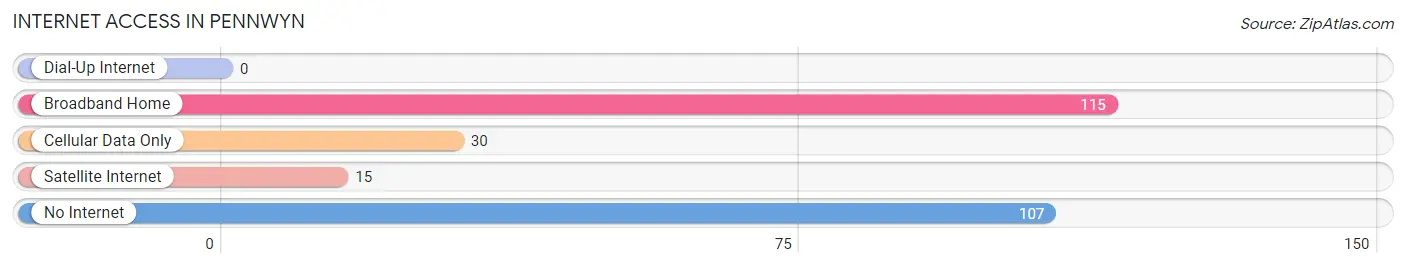
| Internet Type | # Households | % Households |
| Dial-Up Internet | 0 | 0.0% |
| Broadband Home | 115 | 45.6% |
| Cellular Data Only | 30 | 11.9% |
| Satellite Internet | 15 | 5.9% |
| No Internet | 107 | 42.5% |
| Total | 252 | 100.0% |
Pennwyn Summary
Pennwyn is a small unincorporated community located in Montgomery County, Pennsylvania. It is situated in the southeastern corner of the county, just north of the city of Philadelphia. The population of Pennwyn was estimated to be around 1,000 people in 2000.
History
Pennwyn was first settled in the late 1700s by a group of German immigrants. The area was originally known as “Penn’s Woods”, named after William Penn, the founder of Pennsylvania. The name was later changed to Pennwyn, which is derived from the Welsh word for “hill”.
The area was primarily agricultural until the late 1800s, when the railroad was built through the area. This allowed for the development of industry and commerce in the area, and Pennwyn began to grow.
In the early 1900s, Pennwyn was home to a number of small businesses, including a general store, a blacksmith, a post office, and a few other small shops. The area also had a number of churches, including the Pennwyn United Methodist Church, which was founded in 1883.
Geography
Pennwyn is located in southeastern Montgomery County, just north of the city of Philadelphia. It is situated on the banks of the Schuylkill River, and is bordered by the townships of Lower Merion, Upper Merion, and Upper Providence.
The area is mostly flat, with some rolling hills in the northern part of the community. The climate is temperate, with hot summers and cold winters.
Economy
The economy of Pennwyn is largely based on small businesses and services. There are a number of small shops and restaurants in the area, as well as a few larger businesses. The area also has a number of professional services, such as lawyers, accountants, and doctors.
The area is also home to a number of light industrial businesses, such as printing companies and machine shops.
Demographics
The population of Pennwyn was estimated to be around 1,000 people in 2000. The majority of the population is white (90%), with a small percentage of African Americans (5%) and other races (5%). The median household income is around $50,000, and the median home value is around $200,000.
The area is served by the Pennwyn School District, which includes two elementary schools and one middle school. The area is also home to a number of churches, including the Pennwyn United Methodist Church.
Conclusion
Pennwyn is a small unincorporated community located in Montgomery County, Pennsylvania. It is situated in the southeastern corner of the county, just north of the city of Philadelphia. The population of Pennwyn was estimated to be around 1,000 people in 2000. The economy of Pennwyn is largely based on small businesses and services, and the area is served by the Pennwyn School District. The majority of the population is white, with a small percentage of African Americans and other races.
Common Questions
What is Per Capita Income in Pennwyn?
Per Capita income in Pennwyn is $31,626.
What is the Median Family Income in Pennwyn?
Median Family Income in Pennwyn is $120,208.
What is Inequality or Gini Index in Pennwyn?
Inequality or Gini Index in Pennwyn is 0.46.
What is the Total Population of Pennwyn?
Total Population of Pennwyn is 510.
What is the Total Male Population of Pennwyn?
Total Male Population of Pennwyn is 304.
What is the Total Female Population of Pennwyn?
Total Female Population of Pennwyn is 206.
What is the Ratio of Males per 100 Females in Pennwyn?
There are 147.57 Males per 100 Females in Pennwyn.
What is the Ratio of Females per 100 Males in Pennwyn?
There are 67.76 Females per 100 Males in Pennwyn.
What is the Median Population Age in Pennwyn?
Median Population Age in Pennwyn is 50.5 Years.
What is the Average Family Size in Pennwyn
Average Family Size in Pennwyn is 3.5 People.
What is the Average Household Size in Pennwyn
Average Household Size in Pennwyn is 2.0 People.
How Large is the Labor Force in Pennwyn?
There are 265 People in the Labor Forcein in Pennwyn.
What is the Percentage of People in the Labor Force in Pennwyn?
62.6% of People are in the Labor Force in Pennwyn.