Newport borough, PA Map & Demographics
Newport borough Overview
$30,844
PER CAPITA INCOME
$84,018
AVG FAMILY INCOME
$59,868
AVG HOUSEHOLD INCOME
22.2%
WAGE / INCOME GAP [ % ]
77.8¢/ $1
WAGE / INCOME GAP [ $ ]
0.42
INEQUALITY / GINI INDEX
1,584
TOTAL POPULATION
788
MALE POPULATION
796
FEMALE POPULATION
98.99
MALES / 100 FEMALES
101.02
FEMALES / 100 MALES
33.4
MEDIAN AGE
3.2
AVG FAMILY SIZE
2.6
AVG HOUSEHOLD SIZE
854
LABOR FORCE [ PEOPLE ]
69.4%
PERCENT IN LABOR FORCE
4.1%
UNEMPLOYMENT RATE
Income in Newport borough
Income Overview in Newport borough
Per Capita Income in Newport borough is $30,844, while median incomes of families and households are $84,018 and $59,868 respectively.
| Characteristic | Number | Measure |
| Per Capita Income | 1,584 | $30,844 |
| Median Family Income | 373 | $84,018 |
| Mean Family Income | 373 | $86,172 |
| Median Household Income | 606 | $59,868 |
| Mean Household Income | 606 | $76,222 |
| Income Deficit | 373 | $0 |
| Wage / Income Gap (%) | 1,584 | 22.18% |
| Wage / Income Gap ($) | 1,584 | 77.82¢ per $1 |
| Gini / Inequality Index | 1,584 | 0.42 |
Earnings by Sex in Newport borough
Average Earnings in Newport borough are $40,560, $45,129 for men and $35,119 for women, a difference of 22.2%.
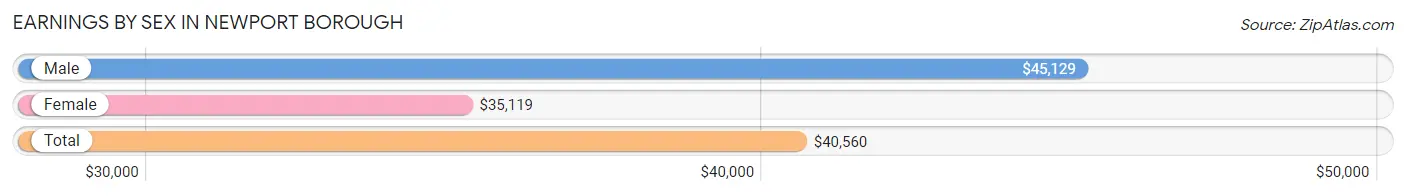
| Sex | Number | Average Earnings |
| Male | 495 (57.1%) | $45,129 |
| Female | 372 (42.9%) | $35,119 |
| Total | 867 (100.0%) | $40,560 |
Earnings by Sex by Income Bracket in Newport borough
The most common earnings brackets in Newport borough are $45,000 to $49,999 for men (90 | 18.2%) and $30,000 to $34,999 for women (62 | 16.7%).
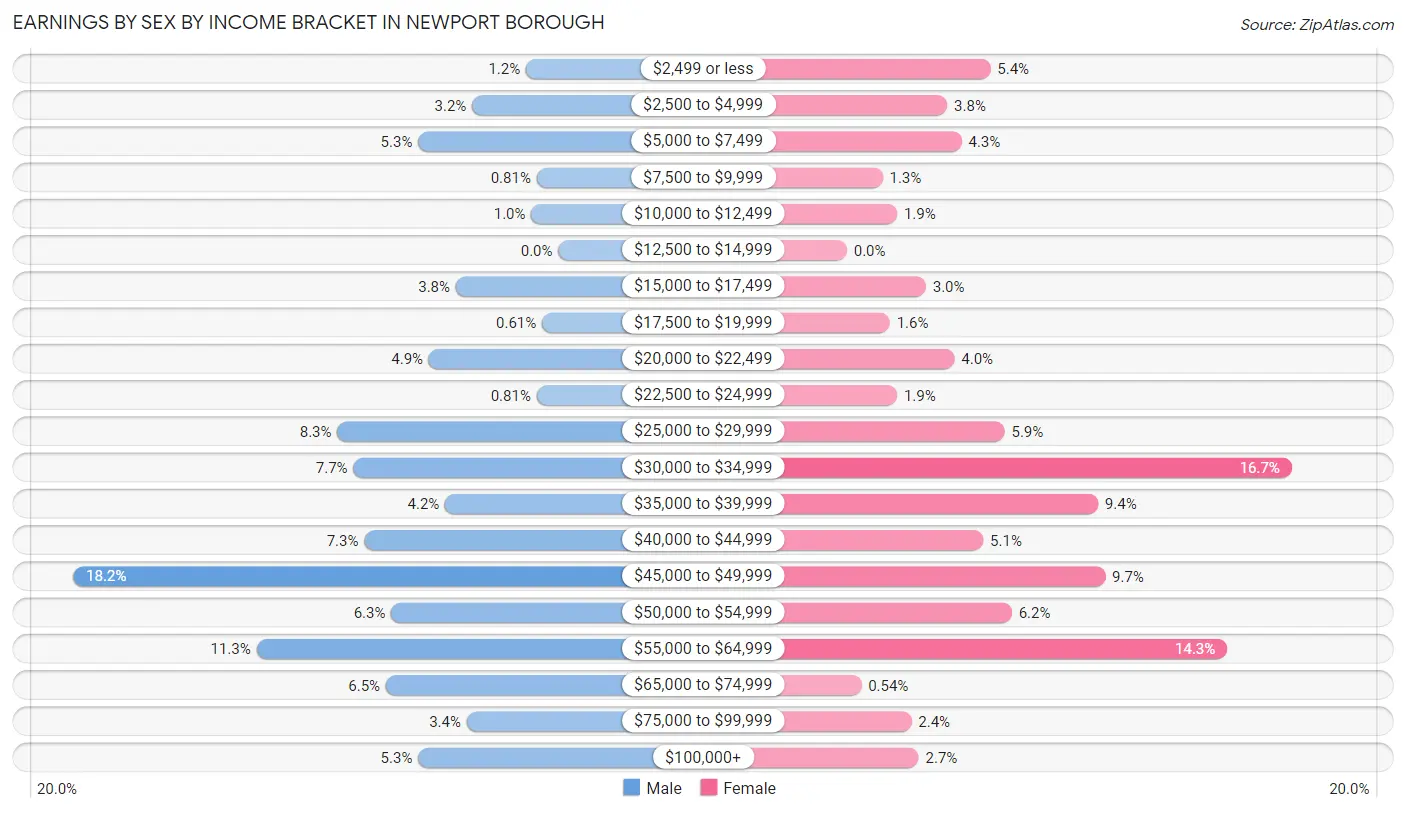
| Income | Male | Female |
| $2,499 or less | 6 (1.2%) | 20 (5.4%) |
| $2,500 to $4,999 | 16 (3.2%) | 14 (3.8%) |
| $5,000 to $7,499 | 26 (5.2%) | 16 (4.3%) |
| $7,500 to $9,999 | 4 (0.8%) | 5 (1.3%) |
| $10,000 to $12,499 | 5 (1.0%) | 7 (1.9%) |
| $12,500 to $14,999 | 0 (0.0%) | 0 (0.0%) |
| $15,000 to $17,499 | 19 (3.8%) | 11 (3.0%) |
| $17,500 to $19,999 | 3 (0.6%) | 6 (1.6%) |
| $20,000 to $22,499 | 24 (4.9%) | 15 (4.0%) |
| $22,500 to $24,999 | 4 (0.8%) | 7 (1.9%) |
| $25,000 to $29,999 | 41 (8.3%) | 22 (5.9%) |
| $30,000 to $34,999 | 38 (7.7%) | 62 (16.7%) |
| $35,000 to $39,999 | 21 (4.2%) | 35 (9.4%) |
| $40,000 to $44,999 | 36 (7.3%) | 19 (5.1%) |
| $45,000 to $49,999 | 90 (18.2%) | 36 (9.7%) |
| $50,000 to $54,999 | 31 (6.3%) | 23 (6.2%) |
| $55,000 to $64,999 | 56 (11.3%) | 53 (14.2%) |
| $65,000 to $74,999 | 32 (6.5%) | 2 (0.5%) |
| $75,000 to $99,999 | 17 (3.4%) | 9 (2.4%) |
| $100,000+ | 26 (5.2%) | 10 (2.7%) |
| Total | 495 (100.0%) | 372 (100.0%) |
Earnings by Sex by Educational Attainment in Newport borough
Average earnings in Newport borough are $42,353 for men and $38,864 for women, a difference of 8.2%. Men with an educational attainment of less than high school enjoy the highest average annual earnings of $106,250, while those with high school diploma education earn the least with $39,792. Women with an educational attainment of graduate degree earn the most with the average annual earnings of $53,750, while those with college or associate's degree education have the smallest earnings of $32,061.
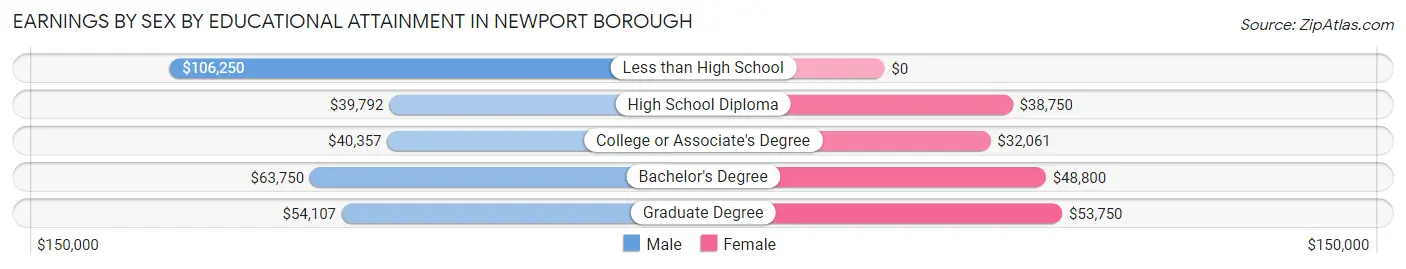
| Educational Attainment | Male Income | Female Income |
| Less than High School | $106,250 | $0 |
| High School Diploma | $39,792 | $38,750 |
| College or Associate's Degree | $40,357 | $32,061 |
| Bachelor's Degree | $63,750 | $48,800 |
| Graduate Degree | $54,107 | $53,750 |
| Total | $42,353 | $38,864 |
Family Income in Newport borough
Family Income Brackets in Newport borough
According to the Newport borough family income data, there are 76 families falling into the $75,000 to $99,999 income range, which is the most common income bracket and makes up 20.4% of all families. Conversely, the $15,000 to $24,999 income bracket is the least frequent group with only 3 families (0.8%) belonging to this category.
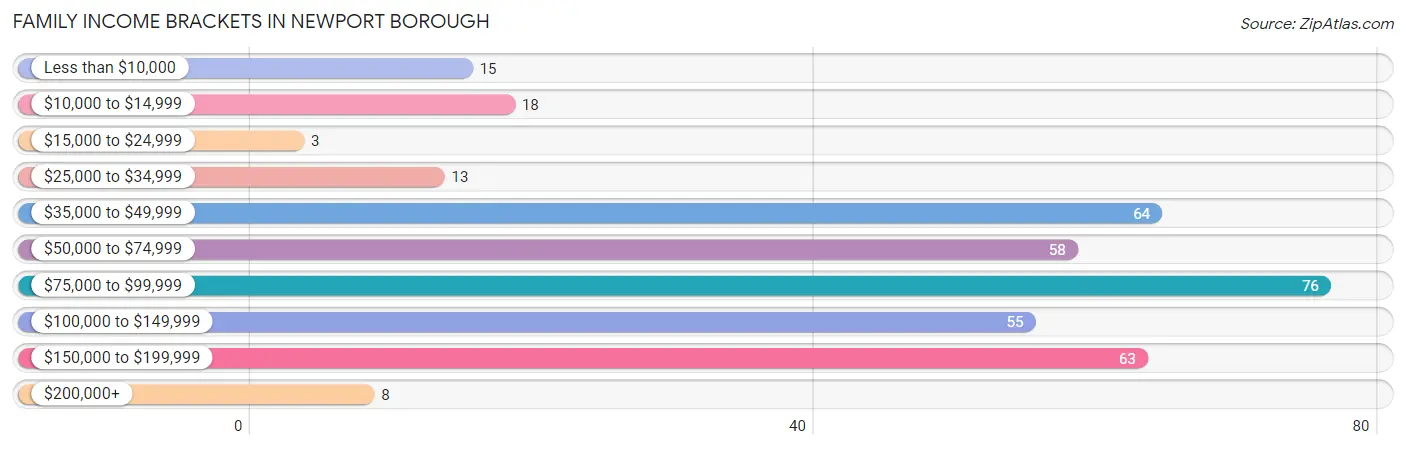
| Income Bracket | # Families | % Families |
| Less than $10,000 | 15 | 4.0% |
| $10,000 to $14,999 | 18 | 4.8% |
| $15,000 to $24,999 | 3 | 0.8% |
| $25,000 to $34,999 | 13 | 3.5% |
| $35,000 to $49,999 | 64 | 17.2% |
| $50,000 to $74,999 | 58 | 15.5% |
| $75,000 to $99,999 | 76 | 20.4% |
| $100,000 to $149,999 | 55 | 14.7% |
| $150,000 to $199,999 | 63 | 16.9% |
| $200,000+ | 8 | 2.1% |
Family Income by Famaliy Size in Newport borough
3-person families (96 | 25.7%) account for the highest median family income in Newport borough with $107,083 per family, while 3-person families (96 | 25.7%) have the highest median income of $35,694 per family member.
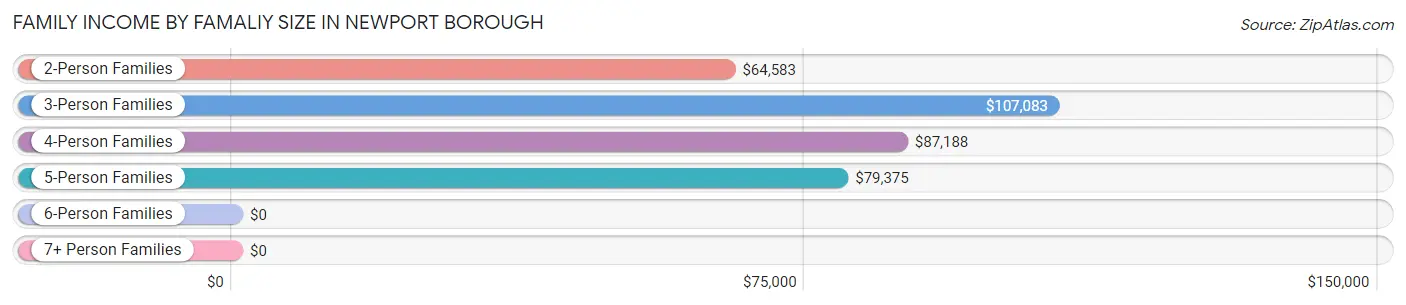
| Income Bracket | # Families | Median Income |
| 2-Person Families | 181 (48.5%) | $64,583 |
| 3-Person Families | 96 (25.7%) | $107,083 |
| 4-Person Families | 53 (14.2%) | $87,188 |
| 5-Person Families | 22 (5.9%) | $79,375 |
| 6-Person Families | 18 (4.8%) | $0 |
| 7+ Person Families | 3 (0.8%) | $0 |
| Total | 373 (100.0%) | $84,018 |
Family Income by Number of Earners in Newport borough
The median family income in Newport borough is $84,018, with families comprising 3+ earners (24) having the highest median family income of $120,833, while families with 1 earner (173) have the lowest median family income of $43,750, accounting for 6.4% and 46.4% of families, respectively.
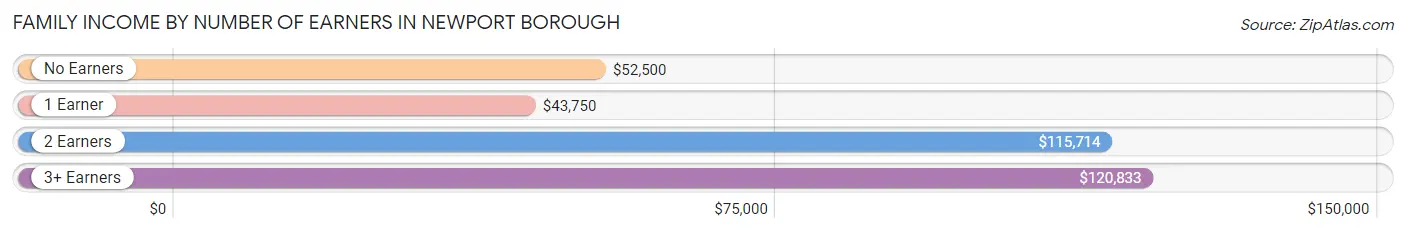
| Number of Earners | # Families | Median Income |
| No Earners | 26 (7.0%) | $52,500 |
| 1 Earner | 173 (46.4%) | $43,750 |
| 2 Earners | 150 (40.2%) | $115,714 |
| 3+ Earners | 24 (6.4%) | $120,833 |
| Total | 373 (100.0%) | $84,018 |
Household Income in Newport borough
Household Income Brackets in Newport borough
With 110 households falling in the category, the $75,000 to $99,999 income range is the most frequent in Newport borough, accounting for 18.1% of all households. In contrast, only 26 households (4.3%) fall into the less than $10,000 income bracket, making it the least populous group.
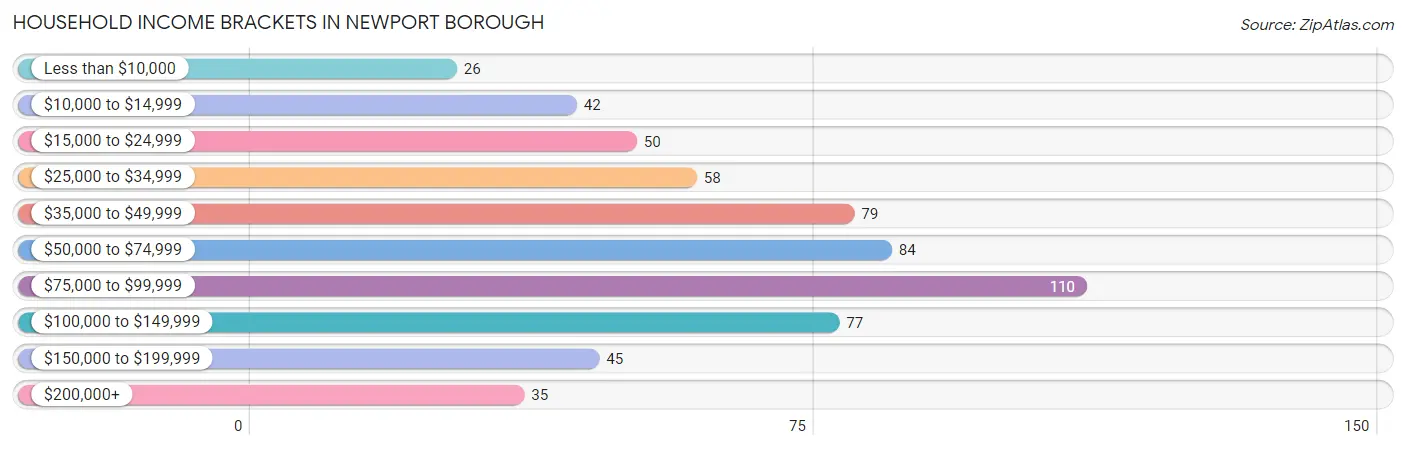
| Income Bracket | # Households | % Households |
| Less than $10,000 | 26 | 4.3% |
| $10,000 to $14,999 | 42 | 6.9% |
| $15,000 to $24,999 | 50 | 8.3% |
| $25,000 to $34,999 | 58 | 9.6% |
| $35,000 to $49,999 | 79 | 13.0% |
| $50,000 to $74,999 | 84 | 13.9% |
| $75,000 to $99,999 | 110 | 18.2% |
| $100,000 to $149,999 | 77 | 12.7% |
| $150,000 to $199,999 | 45 | 7.4% |
| $200,000+ | 35 | 5.8% |
Household Income by Householder Age in Newport borough
The median household income in Newport borough is $59,868, with the highest median household income of $82,917 found in the 15 to 24 years age bracket for the primary householder. A total of 29 households (4.8%) fall into this category. Meanwhile, the 65+ years age bracket for the primary householder has the lowest median household income of $34,583, with 120 households (19.8%) in this group.
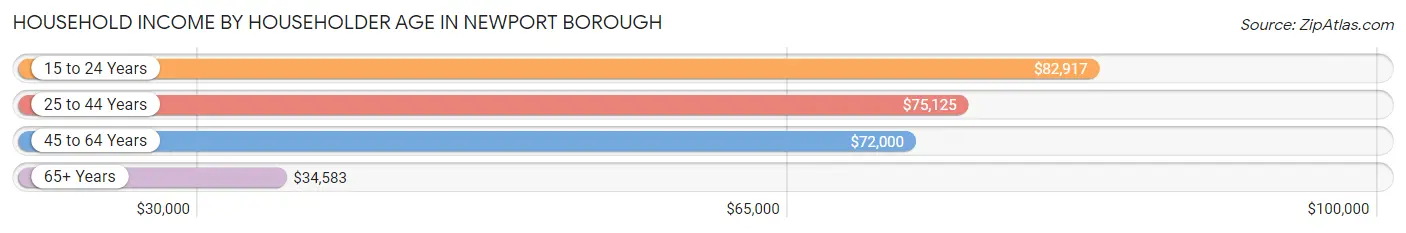
| Income Bracket | # Households | Median Income |
| 15 to 24 Years | 29 (4.8%) | $82,917 |
| 25 to 44 Years | 205 (33.8%) | $75,125 |
| 45 to 64 Years | 252 (41.6%) | $72,000 |
| 65+ Years | 120 (19.8%) | $34,583 |
| Total | 606 (100.0%) | $59,868 |
Poverty in Newport borough
Income Below Poverty by Sex and Age in Newport borough
With 11.1% poverty level for males and 9.4% for females among the residents of Newport borough, under 5 year old males and 6 to 11 year old females are the most vulnerable to poverty, with 14 males (31.8%) and 13 females (17.8%) in their respective age groups living below the poverty level.
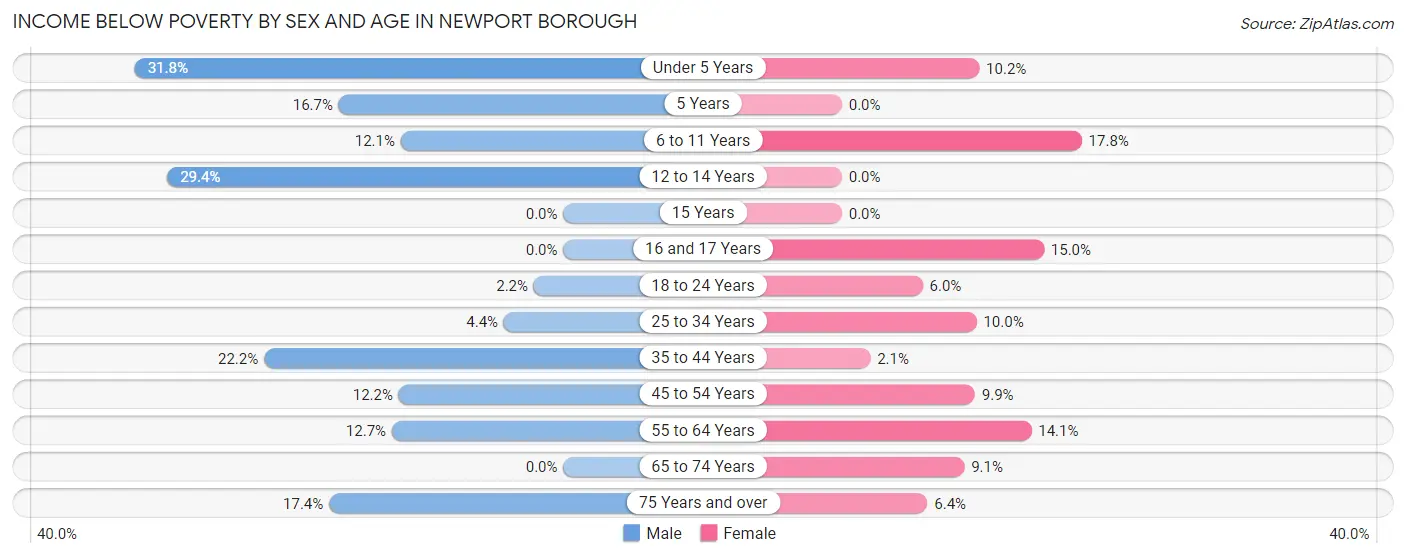
| Age Bracket | Male | Female |
| Under 5 Years | 14 (31.8%) | 5 (10.2%) |
| 5 Years | 2 (16.7%) | 0 (0.0%) |
| 6 to 11 Years | 7 (12.1%) | 13 (17.8%) |
| 12 to 14 Years | 10 (29.4%) | 0 (0.0%) |
| 15 Years | 0 (0.0%) | 0 (0.0%) |
| 16 and 17 Years | 0 (0.0%) | 3 (15.0%) |
| 18 to 24 Years | 3 (2.2%) | 3 (6.0%) |
| 25 to 34 Years | 6 (4.4%) | 12 (10.0%) |
| 35 to 44 Years | 22 (22.2%) | 2 (2.1%) |
| 45 to 54 Years | 11 (12.2%) | 8 (9.9%) |
| 55 to 64 Years | 7 (12.7%) | 19 (14.1%) |
| 65 to 74 Years | 0 (0.0%) | 4 (9.1%) |
| 75 Years and over | 4 (17.4%) | 4 (6.4%) |
| Total | 86 (11.1%) | 73 (9.4%) |
Income Above Poverty by Sex and Age in Newport borough
According to the poverty statistics in Newport borough, males aged 15 years and females aged 5 years are the age groups that are most secure financially, with 100.0% of males and 100.0% of females in these age groups living above the poverty line.
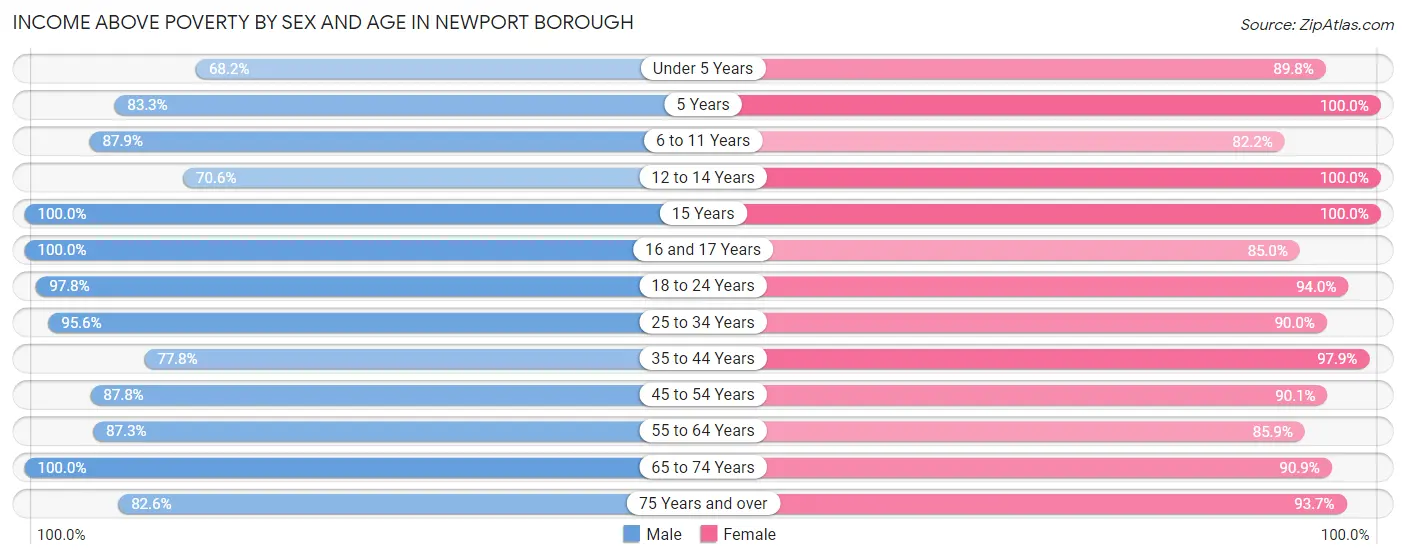
| Age Bracket | Male | Female |
| Under 5 Years | 30 (68.2%) | 44 (89.8%) |
| 5 Years | 10 (83.3%) | 10 (100.0%) |
| 6 to 11 Years | 51 (87.9%) | 60 (82.2%) |
| 12 to 14 Years | 24 (70.6%) | 25 (100.0%) |
| 15 Years | 5 (100.0%) | 10 (100.0%) |
| 16 and 17 Years | 10 (100.0%) | 17 (85.0%) |
| 18 to 24 Years | 134 (97.8%) | 47 (94.0%) |
| 25 to 34 Years | 130 (95.6%) | 108 (90.0%) |
| 35 to 44 Years | 77 (77.8%) | 93 (97.9%) |
| 45 to 54 Years | 79 (87.8%) | 73 (90.1%) |
| 55 to 64 Years | 48 (87.3%) | 116 (85.9%) |
| 65 to 74 Years | 73 (100.0%) | 40 (90.9%) |
| 75 Years and over | 19 (82.6%) | 59 (93.6%) |
| Total | 690 (88.9%) | 702 (90.6%) |
Income Below Poverty Among Married-Couple Families in Newport borough
The poverty statistics for married-couple families in Newport borough show that 5.6% or 11 of the total 196 families live below the poverty line. Families with 3 or 4 children have the highest poverty rate of 13.5%, comprising of 5 families. On the other hand, families with 5 or more children have the lowest poverty rate of 0.0%, which includes 0 families.
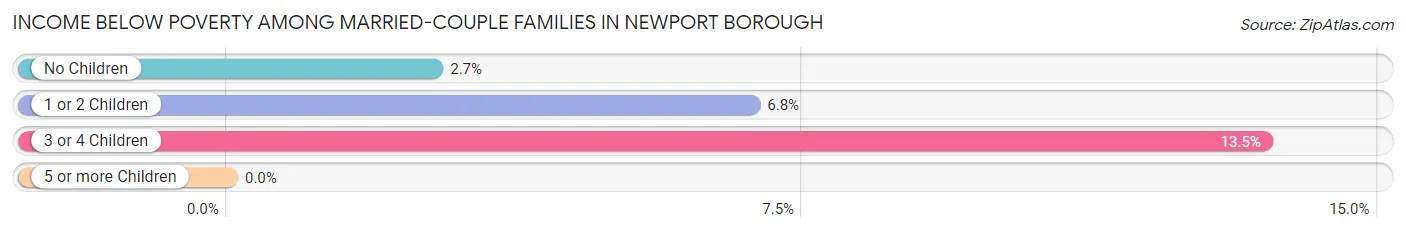
| Children | Above Poverty | Below Poverty |
| No Children | 109 (97.3%) | 3 (2.7%) |
| 1 or 2 Children | 41 (93.2%) | 3 (6.8%) |
| 3 or 4 Children | 32 (86.5%) | 5 (13.5%) |
| 5 or more Children | 3 (100.0%) | 0 (0.0%) |
| Total | 185 (94.4%) | 11 (5.6%) |
Income Below Poverty Among Single-Parent Households in Newport borough
According to the poverty data in Newport borough, 35.3% or 12 single-father households and 11.2% or 16 single-mother households are living below the poverty line. Among single-father households, those with 1 or 2 children have the highest poverty rate, with 12 households (37.5%) experiencing poverty. Likewise, among single-mother households, those with 5 or more children have the highest poverty rate, with 3 households (100.0%) falling below the poverty line.
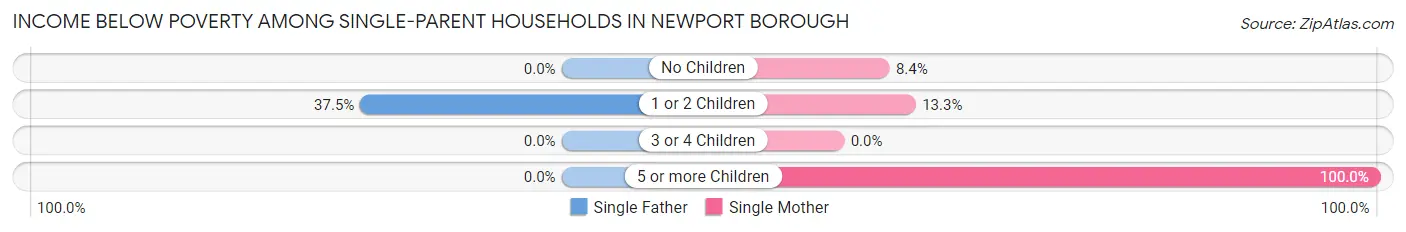
| Children | Single Father | Single Mother |
| No Children | 0 (0.0%) | 7 (8.4%) |
| 1 or 2 Children | 12 (37.5%) | 6 (13.3%) |
| 3 or 4 Children | 0 (0.0%) | 0 (0.0%) |
| 5 or more Children | 0 (0.0%) | 3 (100.0%) |
| Total | 12 (35.3%) | 16 (11.2%) |
Income Below Poverty Among Married-Couple vs Single-Parent Households in Newport borough
The poverty data for Newport borough shows that 11 of the married-couple family households (5.6%) and 28 of the single-parent households (15.8%) are living below the poverty level. Within the married-couple family households, those with 3 or 4 children have the highest poverty rate, with 5 households (13.5%) falling below the poverty line. Among the single-parent households, those with 5 or more children have the highest poverty rate, with 3 household (100.0%) living below poverty.
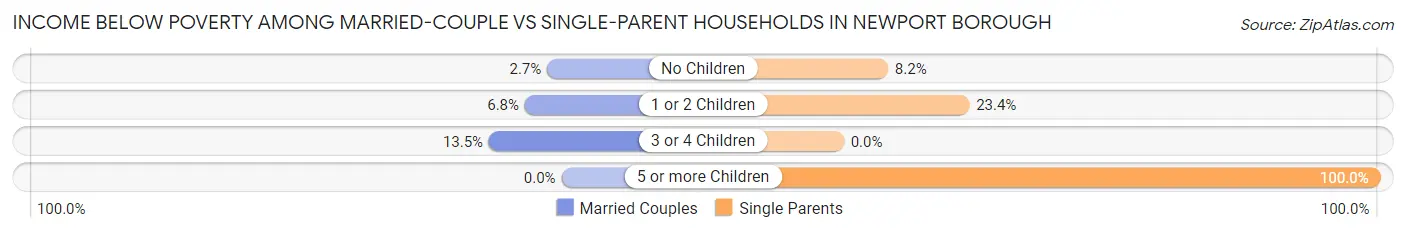
| Children | Married-Couple Families | Single-Parent Households |
| No Children | 3 (2.7%) | 7 (8.2%) |
| 1 or 2 Children | 3 (6.8%) | 18 (23.4%) |
| 3 or 4 Children | 5 (13.5%) | 0 (0.0%) |
| 5 or more Children | 0 (0.0%) | 3 (100.0%) |
| Total | 11 (5.6%) | 28 (15.8%) |
Race in Newport borough
The most populous races in Newport borough are White / Caucasian (1,348 | 85.1%), Two or more Races (102 | 6.4%), and Black / African American (72 | 4.5%).
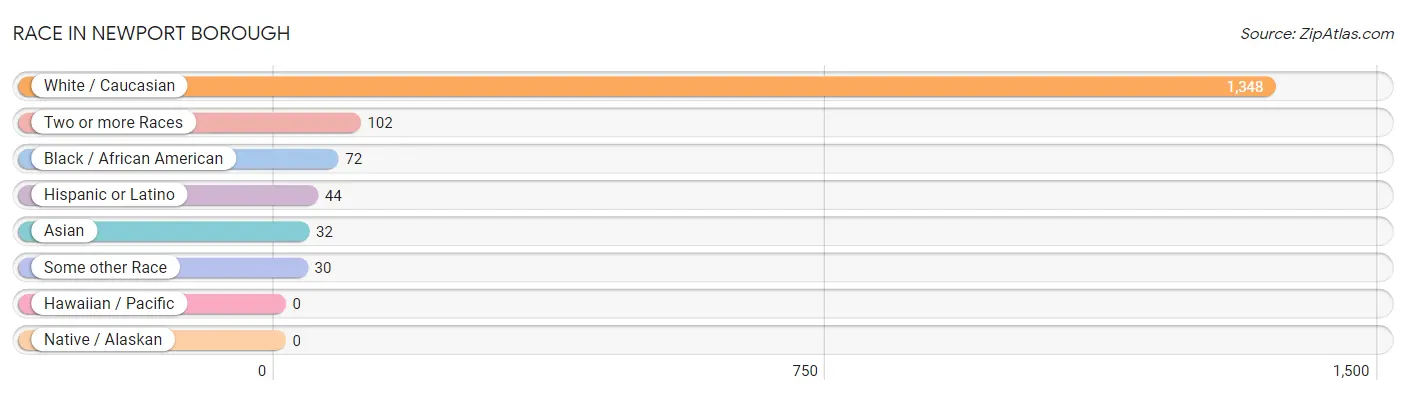
| Race | # Population | % Population |
| Asian | 32 | 2.0% |
| Black / African American | 72 | 4.5% |
| Hawaiian / Pacific | 0 | 0.0% |
| Hispanic or Latino | 44 | 2.8% |
| Native / Alaskan | 0 | 0.0% |
| White / Caucasian | 1,348 | 85.1% |
| Two or more Races | 102 | 6.4% |
| Some other Race | 30 | 1.9% |
| Total | 1,584 | 100.0% |
Ancestry in Newport borough
The most populous ancestries reported in Newport borough are German (484 | 30.6%), Irish (260 | 16.4%), American (170 | 10.7%), Slovene (82 | 5.2%), and English (72 | 4.5%), together accounting for 67.4% of all Newport borough residents.
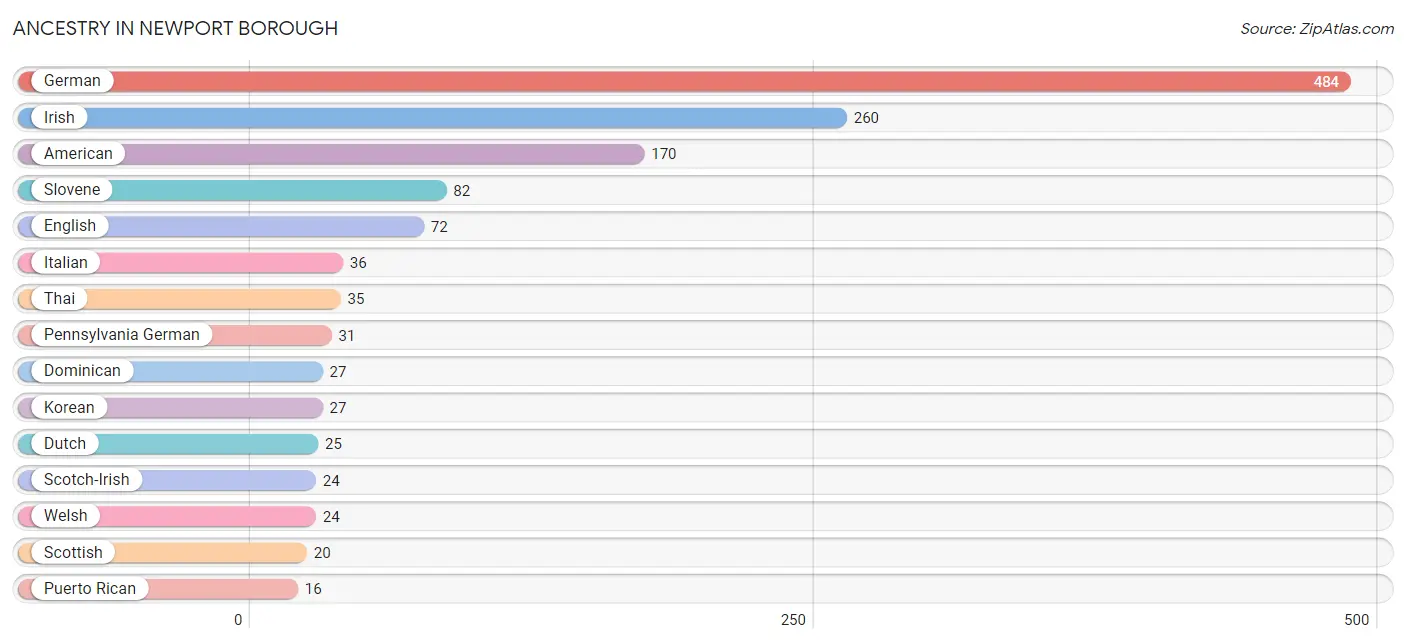
| Ancestry | # Population | % Population |
| African | 7 | 0.4% |
| American | 170 | 10.7% |
| British | 3 | 0.2% |
| Cherokee | 3 | 0.2% |
| Dominican | 27 | 1.7% |
| Dutch | 25 | 1.6% |
| English | 72 | 4.5% |
| European | 9 | 0.6% |
| French | 11 | 0.7% |
| German | 484 | 30.6% |
| Hungarian | 3 | 0.2% |
| Irish | 260 | 16.4% |
| Italian | 36 | 2.3% |
| Korean | 27 | 1.7% |
| Lithuanian | 2 | 0.1% |
| Pennsylvania German | 31 | 2.0% |
| Polish | 5 | 0.3% |
| Puerto Rican | 16 | 1.0% |
| Romanian | 4 | 0.3% |
| Scotch-Irish | 24 | 1.5% |
| Scottish | 20 | 1.3% |
| Slovene | 82 | 5.2% |
| Subsaharan African | 7 | 0.4% |
| Swedish | 2 | 0.1% |
| Swiss | 15 | 0.9% |
| Thai | 35 | 2.2% |
| Turkish | 3 | 0.2% |
| Welsh | 24 | 1.5% | View All 28 Rows |
Immigrants in Newport borough
The most numerous immigrant groups reported in Newport borough came from Asia (17 | 1.1%), Europe (5 | 0.3%), Germany (5 | 0.3%), Western Europe (5 | 0.3%), and India (4 | 0.3%), together accounting for 2.3% of all Newport borough residents.
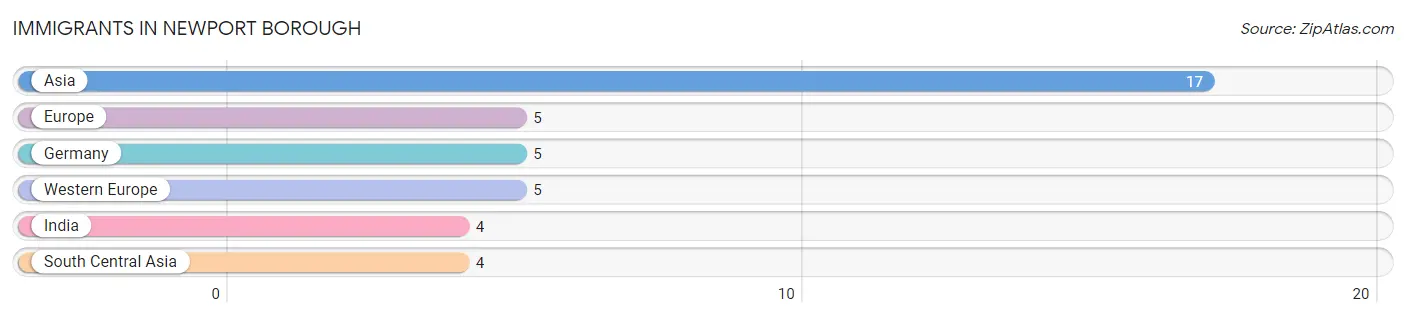
| Immigration Origin | # Population | % Population |
| Asia | 17 | 1.1% |
| Europe | 5 | 0.3% |
| Germany | 5 | 0.3% |
| India | 4 | 0.3% |
| South Central Asia | 4 | 0.3% |
| Western Europe | 5 | 0.3% | View All 6 Rows |
Sex and Age in Newport borough
Sex and Age in Newport borough
The most populous age groups in Newport borough are 20 to 24 Years (133 | 16.9%) for men and 55 to 59 Years (80 | 10.1%) for women.
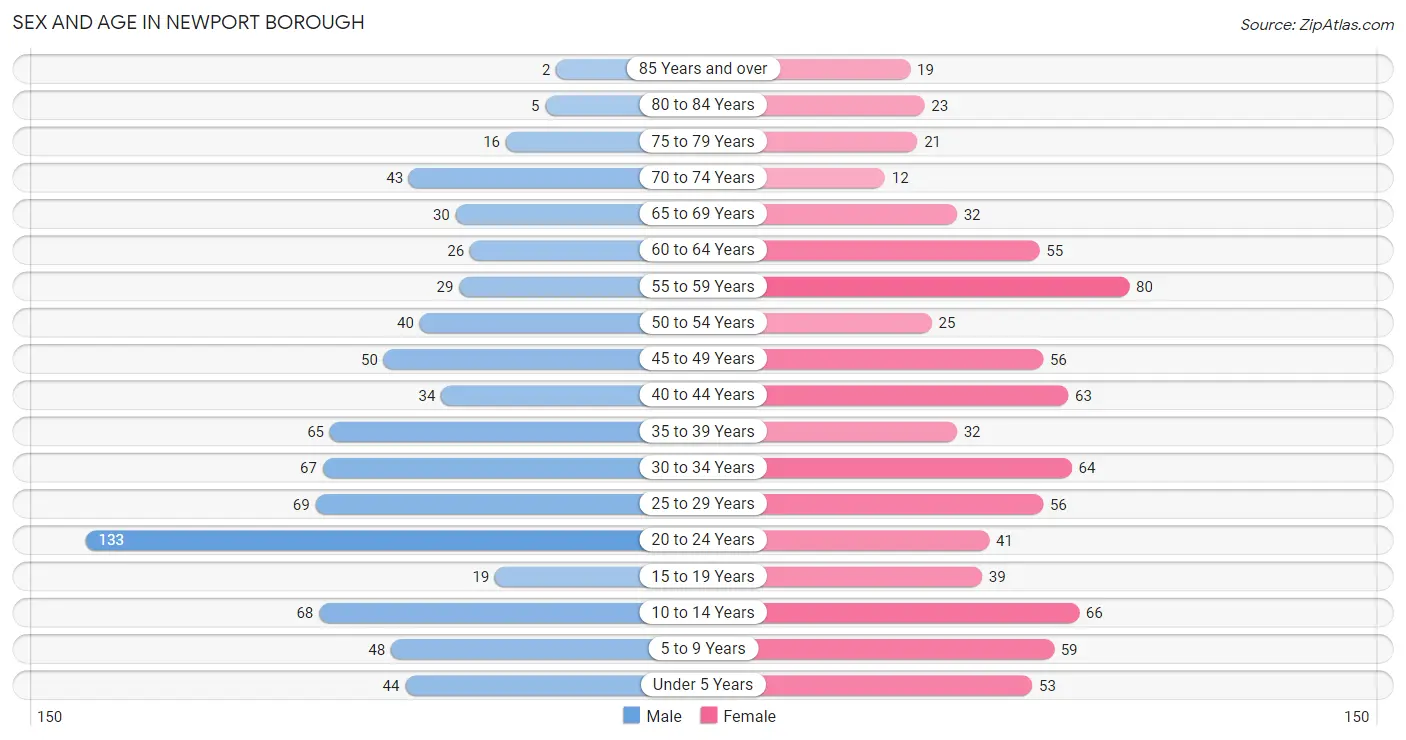
| Age Bracket | Male | Female |
| Under 5 Years | 44 (5.6%) | 53 (6.7%) |
| 5 to 9 Years | 48 (6.1%) | 59 (7.4%) |
| 10 to 14 Years | 68 (8.6%) | 66 (8.3%) |
| 15 to 19 Years | 19 (2.4%) | 39 (4.9%) |
| 20 to 24 Years | 133 (16.9%) | 41 (5.1%) |
| 25 to 29 Years | 69 (8.8%) | 56 (7.0%) |
| 30 to 34 Years | 67 (8.5%) | 64 (8.0%) |
| 35 to 39 Years | 65 (8.3%) | 32 (4.0%) |
| 40 to 44 Years | 34 (4.3%) | 63 (7.9%) |
| 45 to 49 Years | 50 (6.4%) | 56 (7.0%) |
| 50 to 54 Years | 40 (5.1%) | 25 (3.1%) |
| 55 to 59 Years | 29 (3.7%) | 80 (10.1%) |
| 60 to 64 Years | 26 (3.3%) | 55 (6.9%) |
| 65 to 69 Years | 30 (3.8%) | 32 (4.0%) |
| 70 to 74 Years | 43 (5.5%) | 12 (1.5%) |
| 75 to 79 Years | 16 (2.0%) | 21 (2.6%) |
| 80 to 84 Years | 5 (0.6%) | 23 (2.9%) |
| 85 Years and over | 2 (0.3%) | 19 (2.4%) |
| Total | 788 (100.0%) | 796 (100.0%) |
Families and Households in Newport borough
Median Family Size in Newport borough
The median family size in Newport borough is 3.20 persons per family, with married-couple families (196 | 52.5%) accounting for the largest median family size of 3.38 persons per family. On the other hand, single male/father families (34 | 9.1%) represent the smallest median family size with 2.88 persons per family.
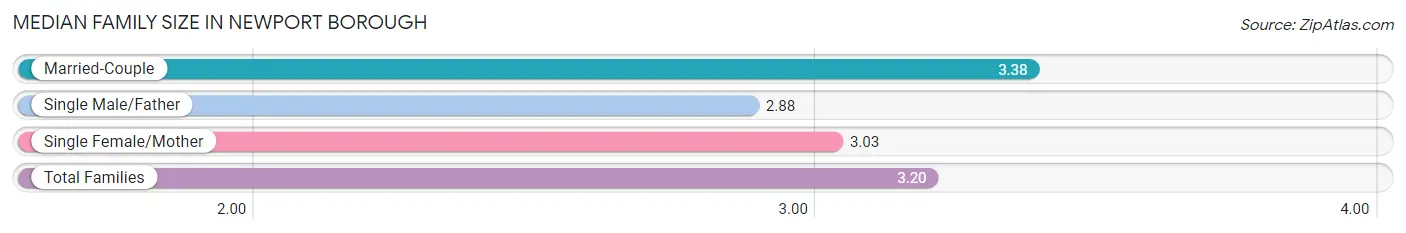
| Family Type | # Families | Family Size |
| Married-Couple | 196 (52.5%) | 3.38 |
| Single Male/Father | 34 (9.1%) | 2.88 |
| Single Female/Mother | 143 (38.3%) | 3.03 |
| Total Families | 373 (100.0%) | 3.20 |
Median Household Size in Newport borough
The median household size in Newport borough is 2.60 persons per household, with single male/father households (34 | 5.6%) accounting for the largest median household size of 4.32 persons per household. non-family households (233 | 38.5%) represent the smallest median household size with 1.20 persons per household.
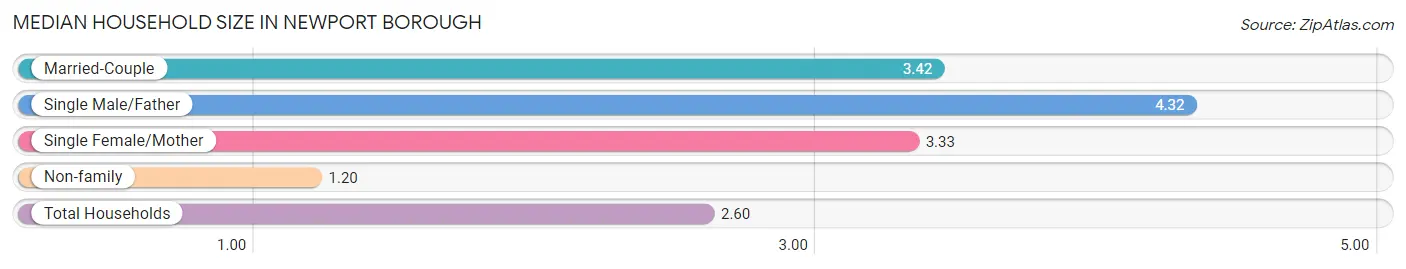
| Household Type | # Households | Household Size |
| Married-Couple | 196 (32.3%) | 3.42 |
| Single Male/Father | 34 (5.6%) | 4.32 |
| Single Female/Mother | 143 (23.6%) | 3.33 |
| Non-family | 233 (38.5%) | 1.20 |
| Total Households | 606 (100.0%) | 2.60 |
Household Size by Marriage Status in Newport borough
Out of a total of 606 households in Newport borough, 373 (61.6%) are family households, while 233 (38.5%) are nonfamily households. The most numerous type of family households are 2-person households, comprising 164, and the most common type of nonfamily households are 1-person households, comprising 183.
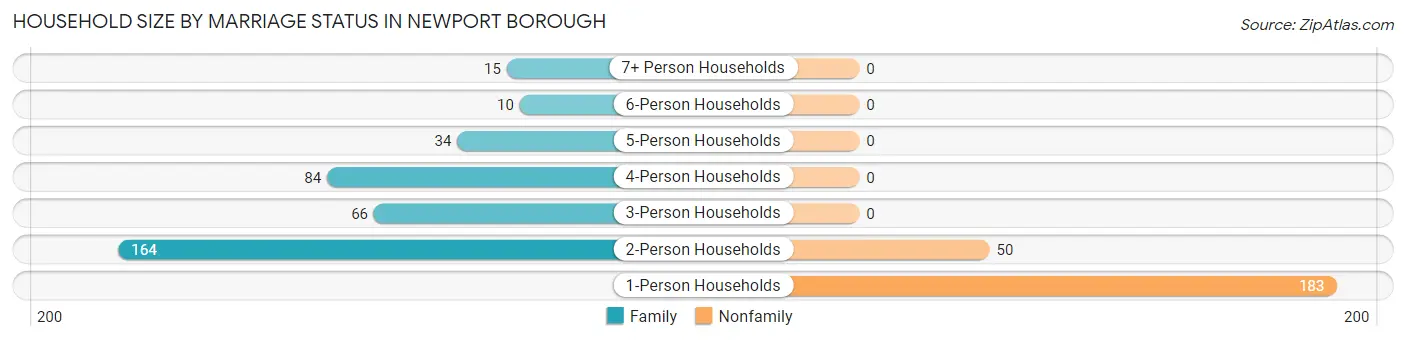
| Household Size | Family Households | Nonfamily Households |
| 1-Person Households | - | 183 (30.2%) |
| 2-Person Households | 164 (27.1%) | 50 (8.3%) |
| 3-Person Households | 66 (10.9%) | 0 (0.0%) |
| 4-Person Households | 84 (13.9%) | 0 (0.0%) |
| 5-Person Households | 34 (5.6%) | 0 (0.0%) |
| 6-Person Households | 10 (1.7%) | 0 (0.0%) |
| 7+ Person Households | 15 (2.5%) | 0 (0.0%) |
| Total | 373 (61.6%) | 233 (38.5%) |
Female Fertility in Newport borough
Fertility by Age in Newport borough
Average fertility rate in Newport borough is 25.0 births per 1,000 women. Women in the age bracket of 20 to 34 years have the highest fertility rate with 56.0 births per 1,000 women. Women in the age bracket of 20 to 34 years acount for 100.0% of all women with births.
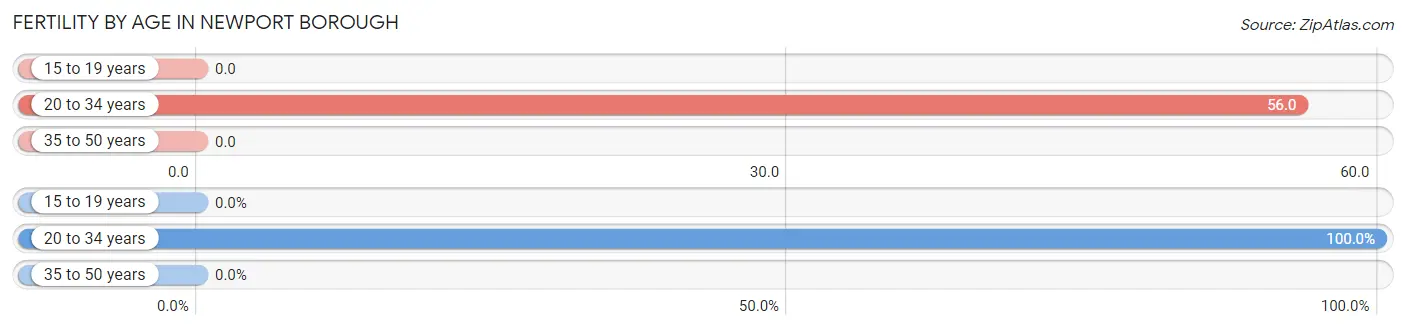
| Age Bracket | Women with Births | Births / 1,000 Women |
| 15 to 19 years | 0 (0.0%) | 0.0 |
| 20 to 34 years | 9 (100.0%) | 56.0 |
| 35 to 50 years | 0 (0.0%) | 0.0 |
| Total | 9 (100.0%) | 25.0 |
Fertility by Age by Marriage Status in Newport borough
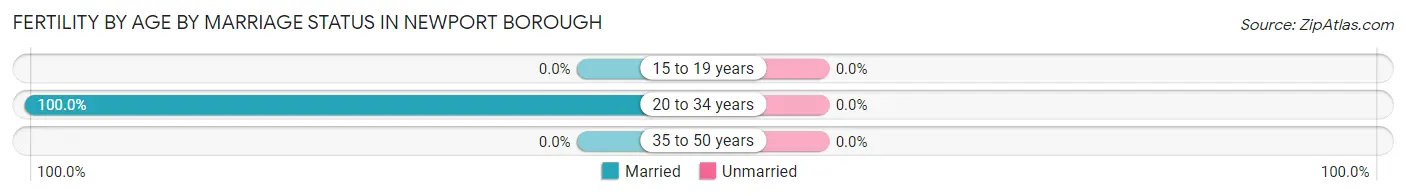
| Age Bracket | Married | Unmarried |
| 15 to 19 years | 0 (0.0%) | 0 (0.0%) |
| 20 to 34 years | 9 (100.0%) | 0 (0.0%) |
| 35 to 50 years | 0 (0.0%) | 0 (0.0%) |
| Total | 9 (100.0%) | 0 (0.0%) |
Fertility by Education in Newport borough
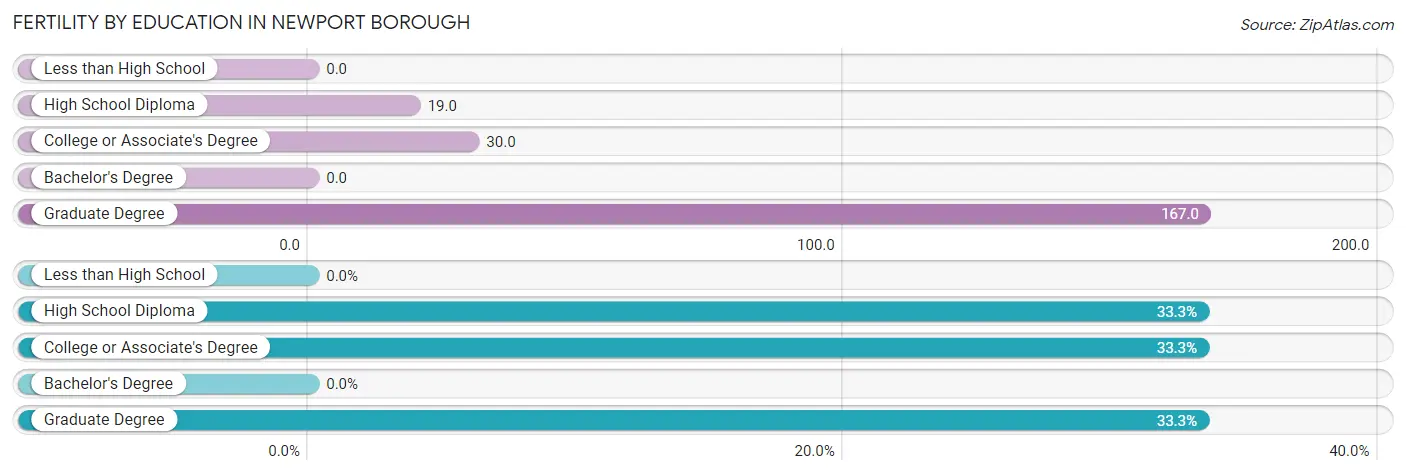
| Educational Attainment | Women with Births | Births / 1,000 Women |
| Less than High School | 0 (0.0%) | 0.0 |
| High School Diploma | 3 (33.3%) | 19.0 |
| College or Associate's Degree | 3 (33.3%) | 30.0 |
| Bachelor's Degree | 0 (0.0%) | 0.0 |
| Graduate Degree | 3 (33.3%) | 167.0 |
| Total | 9 (100.0%) | 25.0 |
Fertility by Education by Marriage Status in Newport borough
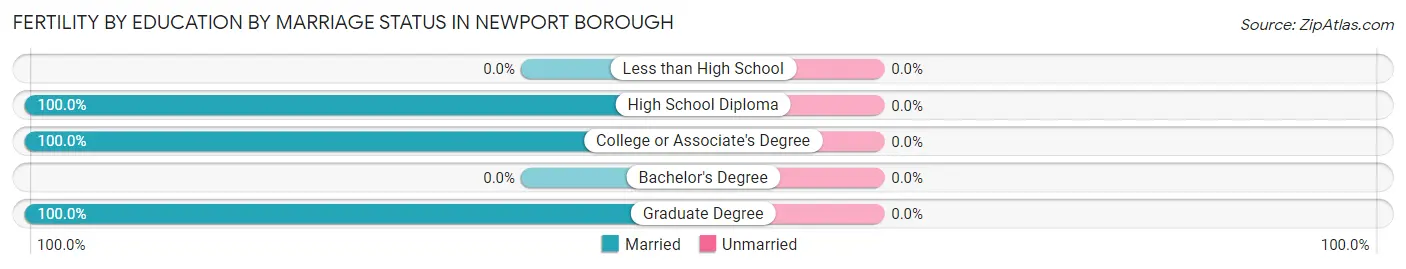
| Educational Attainment | Married | Unmarried |
| Less than High School | 0 (0.0%) | 0 (0.0%) |
| High School Diploma | 3 (100.0%) | 0 (0.0%) |
| College or Associate's Degree | 3 (100.0%) | 0 (0.0%) |
| Bachelor's Degree | 0 (0.0%) | 0 (0.0%) |
| Graduate Degree | 3 (100.0%) | 0 (0.0%) |
| Total | 9 (100.0%) | 0 (0.0%) |
Employment Characteristics in Newport borough
Employment by Class of Employer in Newport borough
Among the 816 employed individuals in Newport borough, private company employees (627 | 76.8%), state government employees (70 | 8.6%), and not-for-profit organizations (58 | 7.1%) make up the most common classes of employment.
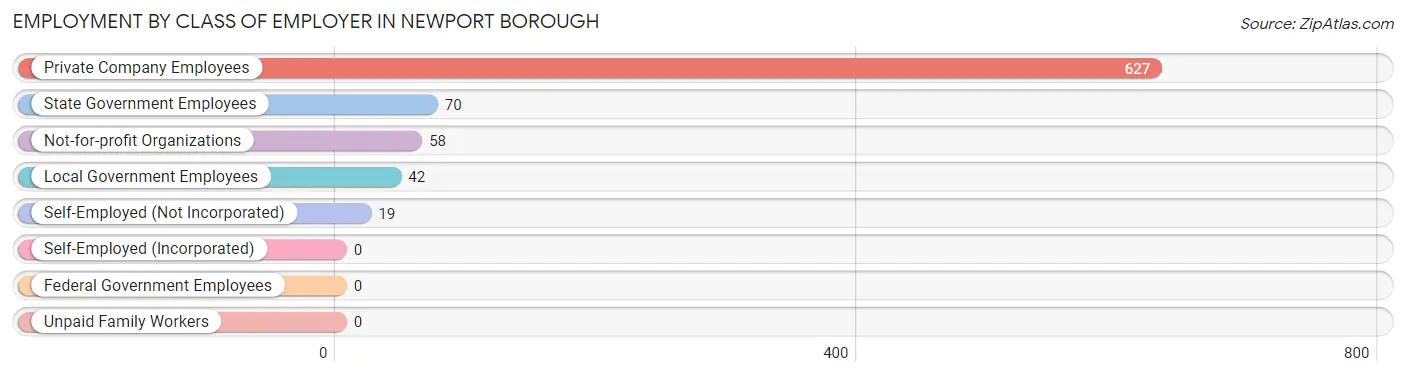
| Employer Class | # Employees | % Employees |
| Private Company Employees | 627 | 76.8% |
| Self-Employed (Incorporated) | 0 | 0.0% |
| Self-Employed (Not Incorporated) | 19 | 2.3% |
| Not-for-profit Organizations | 58 | 7.1% |
| Local Government Employees | 42 | 5.1% |
| State Government Employees | 70 | 8.6% |
| Federal Government Employees | 0 | 0.0% |
| Unpaid Family Workers | 0 | 0.0% |
| Total | 816 | 100.0% |
Employment Status by Age in Newport borough
According to the labor force statistics for Newport borough, out of the total population over 16 years of age (1,231), 69.4% or 854 individuals are in the labor force, with 4.1% or 35 of them unemployed. The age group with the highest labor force participation rate is 20 to 24 years, with 97.1% or 169 individuals in the labor force. Within the labor force, the 45 to 54 years age range has the highest percentage of unemployed individuals, with 7.9% or 12 of them being unemployed.
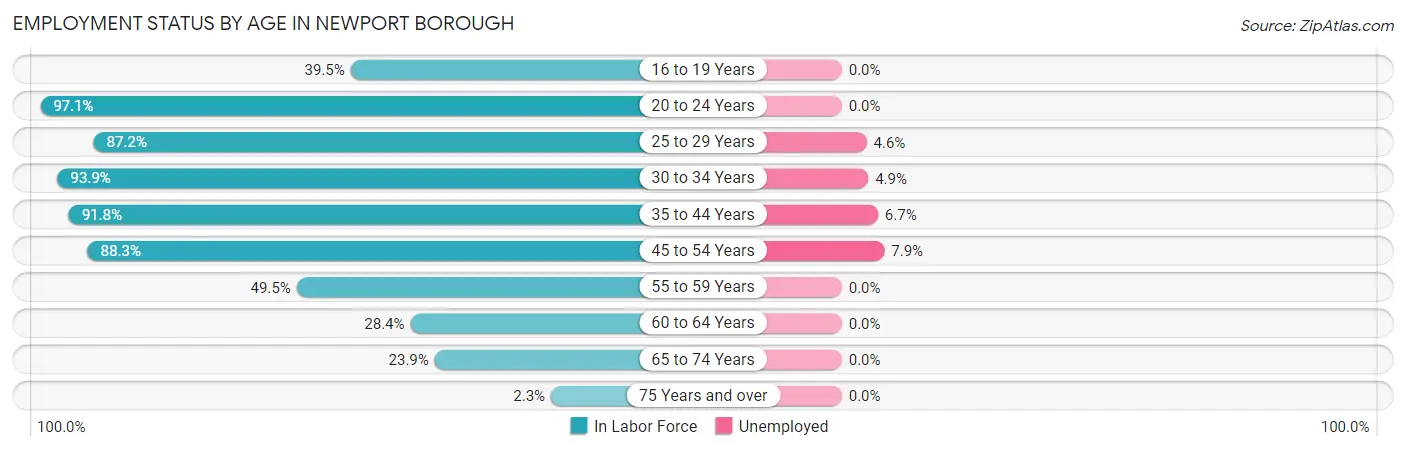
| Age Bracket | In Labor Force | Unemployed |
| 16 to 19 Years | 17 (39.5%) | 0 (0.0%) |
| 20 to 24 Years | 169 (97.1%) | 0 (0.0%) |
| 25 to 29 Years | 109 (87.2%) | 5 (4.6%) |
| 30 to 34 Years | 123 (93.9%) | 6 (4.9%) |
| 35 to 44 Years | 178 (91.8%) | 12 (6.7%) |
| 45 to 54 Years | 151 (88.3%) | 12 (7.9%) |
| 55 to 59 Years | 54 (49.5%) | 0 (0.0%) |
| 60 to 64 Years | 23 (28.4%) | 0 (0.0%) |
| 65 to 74 Years | 28 (23.9%) | 0 (0.0%) |
| 75 Years and over | 2 (2.3%) | 0 (0.0%) |
| Total | 854 (69.4%) | 35 (4.1%) |
Employment Status by Educational Attainment in Newport borough
According to labor force statistics for Newport borough, 78.7% of individuals (638) out of the total population between 25 and 64 years of age (811) are in the labor force, with 5.5% or 35 of them being unemployed. The group with the highest labor force participation rate are those with the educational attainment of college / associate degree, with 93.6% or 247 individuals in the labor force. Within the labor force, individuals with high school diploma education have the highest percentage of unemployment, with 7.1% or 18 of them being unemployed.
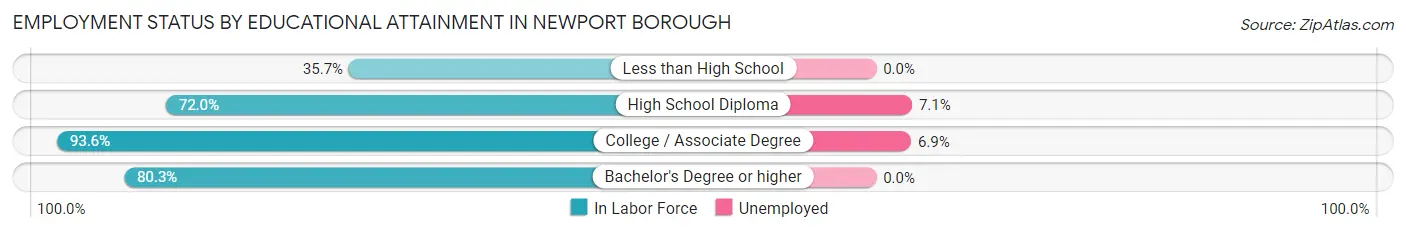
| Educational Attainment | In Labor Force | Unemployed |
| Less than High School | 15 (35.7%) | 0 (0.0%) |
| High School Diploma | 254 (72.0%) | 25 (7.1%) |
| College / Associate Degree | 247 (93.6%) | 18 (6.9%) |
| Bachelor's Degree or higher | 122 (80.3%) | 0 (0.0%) |
| Total | 638 (78.7%) | 45 (5.5%) |
Employment Occupations by Sex in Newport borough
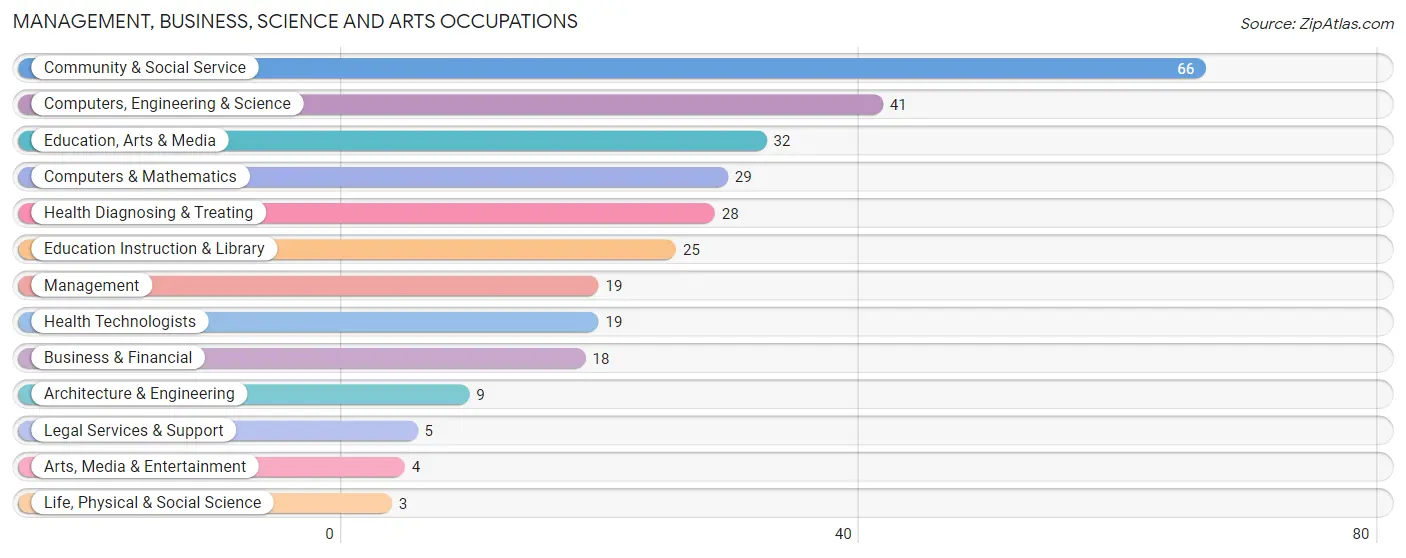
Management, Business, Science and Arts Occupations
The most common Management, Business, Science and Arts occupations in Newport borough are Community & Social Service (66 | 8.1%), Computers, Engineering & Science (41 | 5.0%), Education, Arts & Media (32 | 3.9%), Computers & Mathematics (29 | 3.5%), and Health Diagnosing & Treating (28 | 3.4%).
Management, Business, Science and Arts Occupations by Sex
Within the Management, Business, Science and Arts occupations in Newport borough, the most male-oriented occupations are Architecture & Engineering (100.0%), Arts, Media & Entertainment (100.0%), and Management (52.6%), while the most female-oriented occupations are Life, Physical & Social Science (100.0%), Education, Arts & Media (100.0%), and Health Technologists (100.0%).
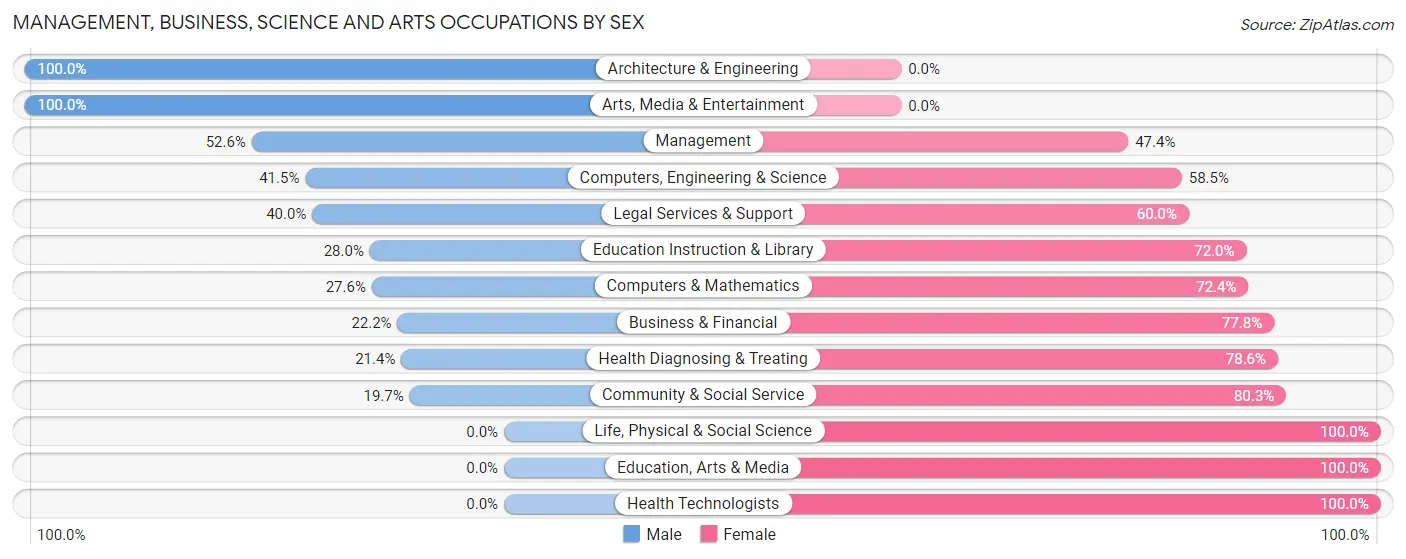
| Occupation | Male | Female |
| Management | 10 (52.6%) | 9 (47.4%) |
| Business & Financial | 4 (22.2%) | 14 (77.8%) |
| Computers, Engineering & Science | 17 (41.5%) | 24 (58.5%) |
| Computers & Mathematics | 8 (27.6%) | 21 (72.4%) |
| Architecture & Engineering | 9 (100.0%) | 0 (0.0%) |
| Life, Physical & Social Science | 0 (0.0%) | 3 (100.0%) |
| Community & Social Service | 13 (19.7%) | 53 (80.3%) |
| Education, Arts & Media | 0 (0.0%) | 32 (100.0%) |
| Legal Services & Support | 2 (40.0%) | 3 (60.0%) |
| Education Instruction & Library | 7 (28.0%) | 18 (72.0%) |
| Arts, Media & Entertainment | 4 (100.0%) | 0 (0.0%) |
| Health Diagnosing & Treating | 6 (21.4%) | 22 (78.6%) |
| Health Technologists | 0 (0.0%) | 19 (100.0%) |
| Total (Category) | 50 (29.1%) | 122 (70.9%) |
| Total (Overall) | 464 (56.7%) | 355 (43.3%) |
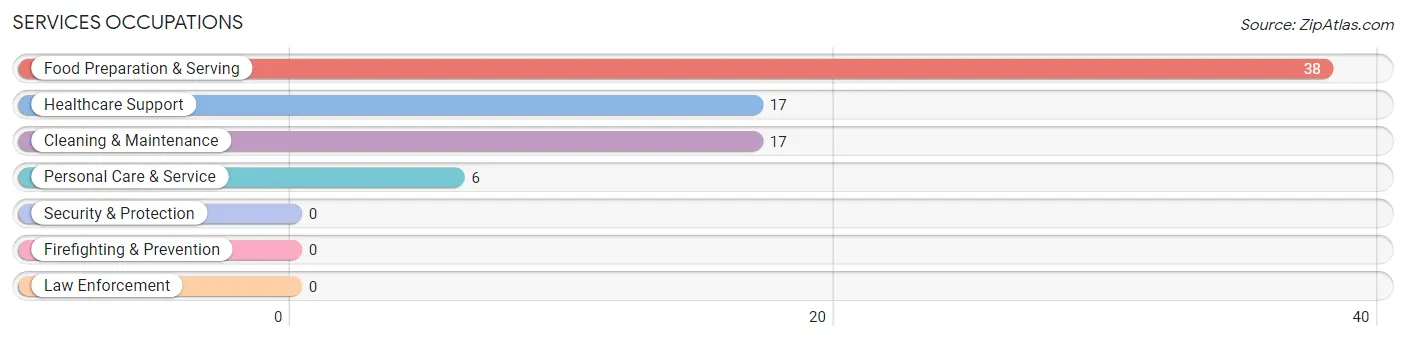
Services Occupations
The most common Services occupations in Newport borough are Food Preparation & Serving (38 | 4.6%), Healthcare Support (17 | 2.1%), Cleaning & Maintenance (17 | 2.1%), and Personal Care & Service (6 | 0.7%).
Services Occupations by Sex
Within the Services occupations in Newport borough, the most male-oriented occupations are Cleaning & Maintenance (29.4%), and Food Preparation & Serving (5.3%), while the most female-oriented occupations are Healthcare Support (100.0%), Personal Care & Service (100.0%), and Food Preparation & Serving (94.7%).
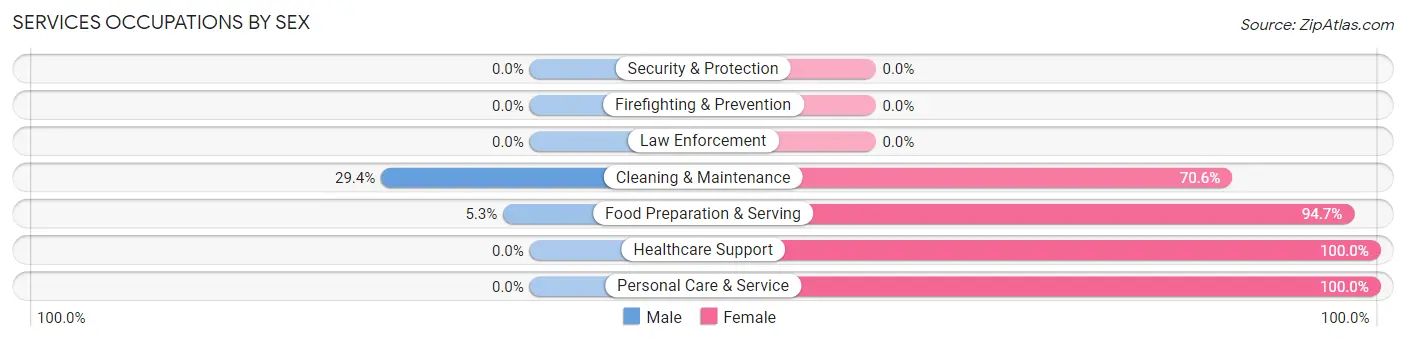
| Occupation | Male | Female |
| Healthcare Support | 0 (0.0%) | 17 (100.0%) |
| Security & Protection | 0 (0.0%) | 0 (0.0%) |
| Firefighting & Prevention | 0 (0.0%) | 0 (0.0%) |
| Law Enforcement | 0 (0.0%) | 0 (0.0%) |
| Food Preparation & Serving | 2 (5.3%) | 36 (94.7%) |
| Cleaning & Maintenance | 5 (29.4%) | 12 (70.6%) |
| Personal Care & Service | 0 (0.0%) | 6 (100.0%) |
| Total (Category) | 7 (9.0%) | 71 (91.0%) |
| Total (Overall) | 464 (56.7%) | 355 (43.3%) |
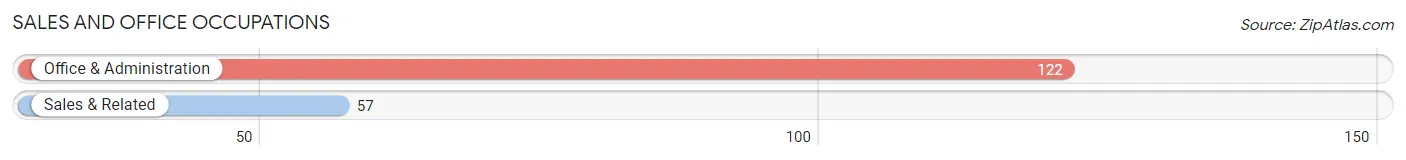
Sales and Office Occupations
The most common Sales and Office occupations in Newport borough are Office & Administration (122 | 14.9%), and Sales & Related (57 | 7.0%).
Sales and Office Occupations by Sex
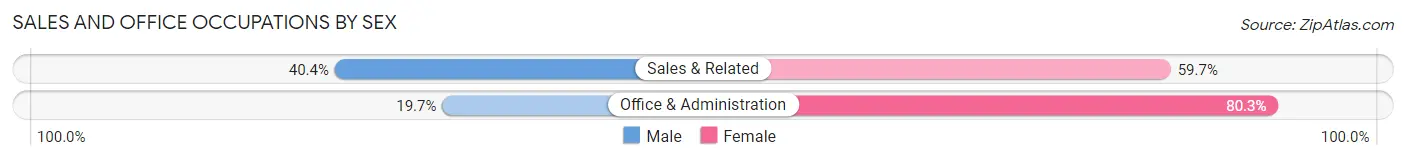
| Occupation | Male | Female |
| Sales & Related | 23 (40.4%) | 34 (59.7%) |
| Office & Administration | 24 (19.7%) | 98 (80.3%) |
| Total (Category) | 47 (26.3%) | 132 (73.7%) |
| Total (Overall) | 464 (56.7%) | 355 (43.3%) |
Natural Resources, Construction and Maintenance Occupations
The most common Natural Resources, Construction and Maintenance occupations in Newport borough are Installation, Maintenance & Repair (61 | 7.4%), and Construction & Extraction (45 | 5.5%).
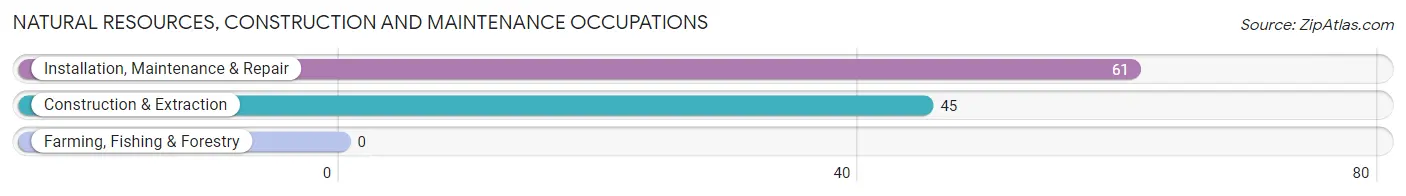
Natural Resources, Construction and Maintenance Occupations by Sex
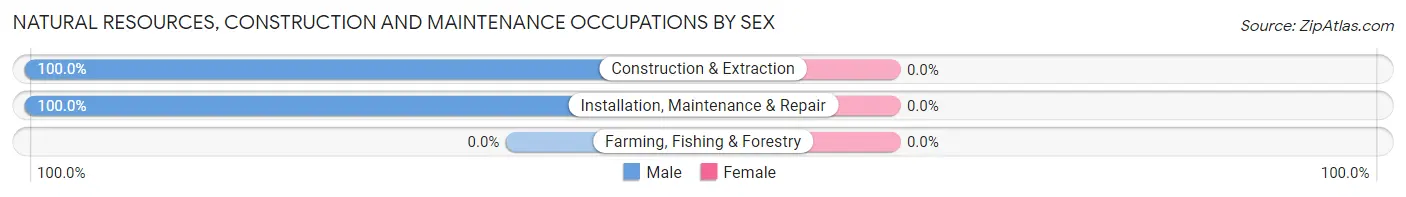
| Occupation | Male | Female |
| Farming, Fishing & Forestry | 0 (0.0%) | 0 (0.0%) |
| Construction & Extraction | 45 (100.0%) | 0 (0.0%) |
| Installation, Maintenance & Repair | 61 (100.0%) | 0 (0.0%) |
| Total (Category) | 106 (100.0%) | 0 (0.0%) |
| Total (Overall) | 464 (56.7%) | 355 (43.3%) |
Production, Transportation and Moving Occupations
The most common Production, Transportation and Moving occupations in Newport borough are Transportation (104 | 12.7%), Production (103 | 12.6%), and Material Moving (77 | 9.4%).
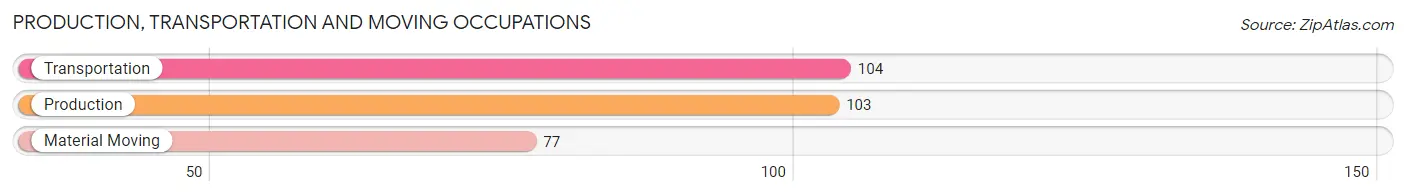
Production, Transportation and Moving Occupations by Sex
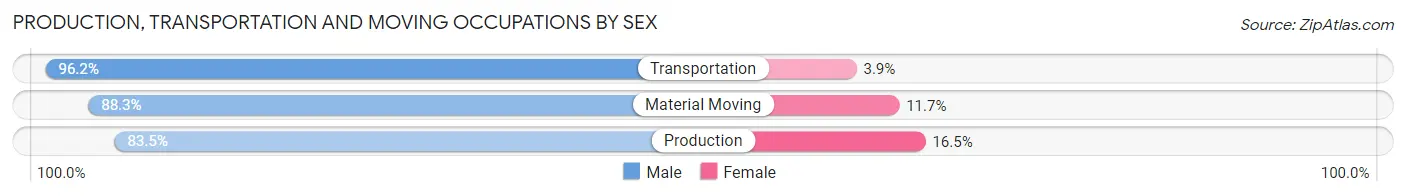
| Occupation | Male | Female |
| Production | 86 (83.5%) | 17 (16.5%) |
| Transportation | 100 (96.2%) | 4 (3.8%) |
| Material Moving | 68 (88.3%) | 9 (11.7%) |
| Total (Category) | 254 (89.4%) | 30 (10.6%) |
| Total (Overall) | 464 (56.7%) | 355 (43.3%) |
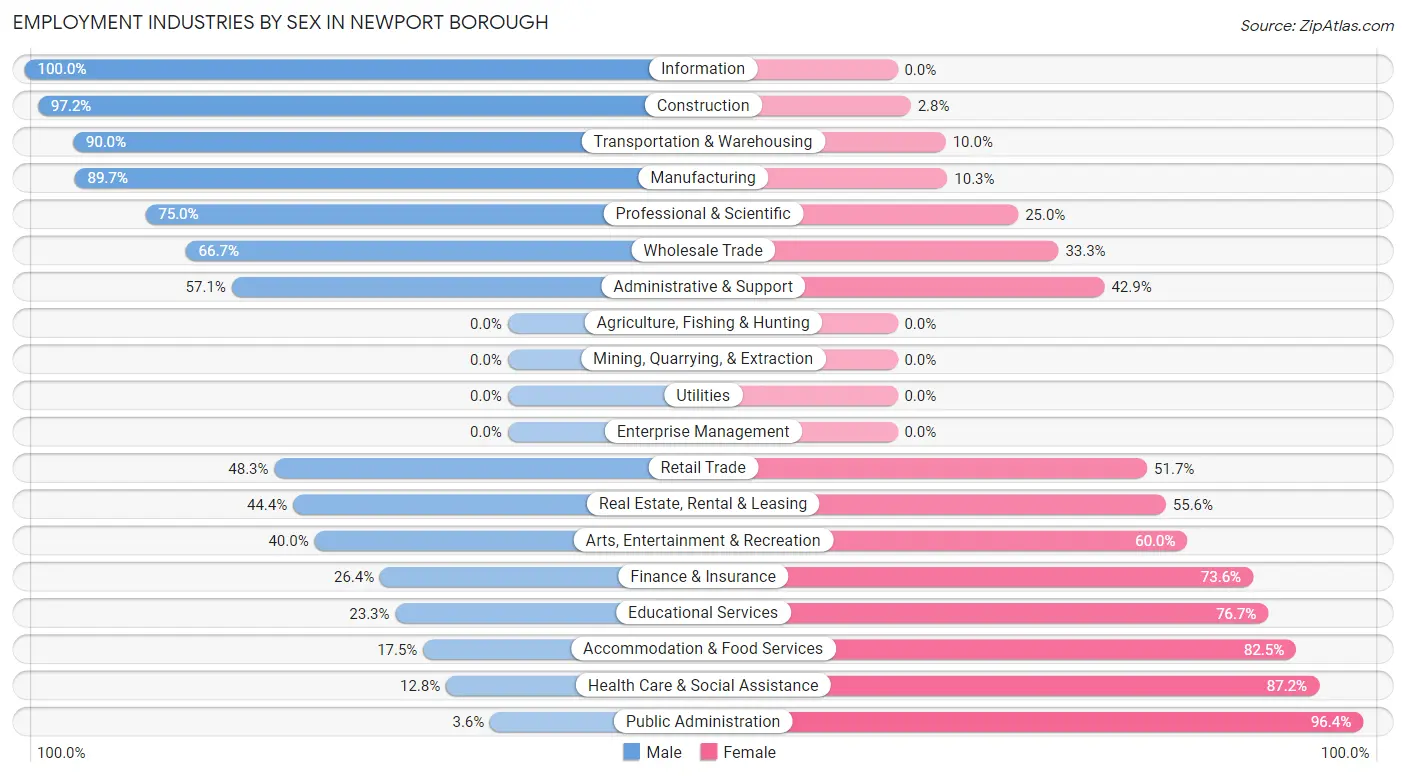
Employment Industries by Sex in Newport borough
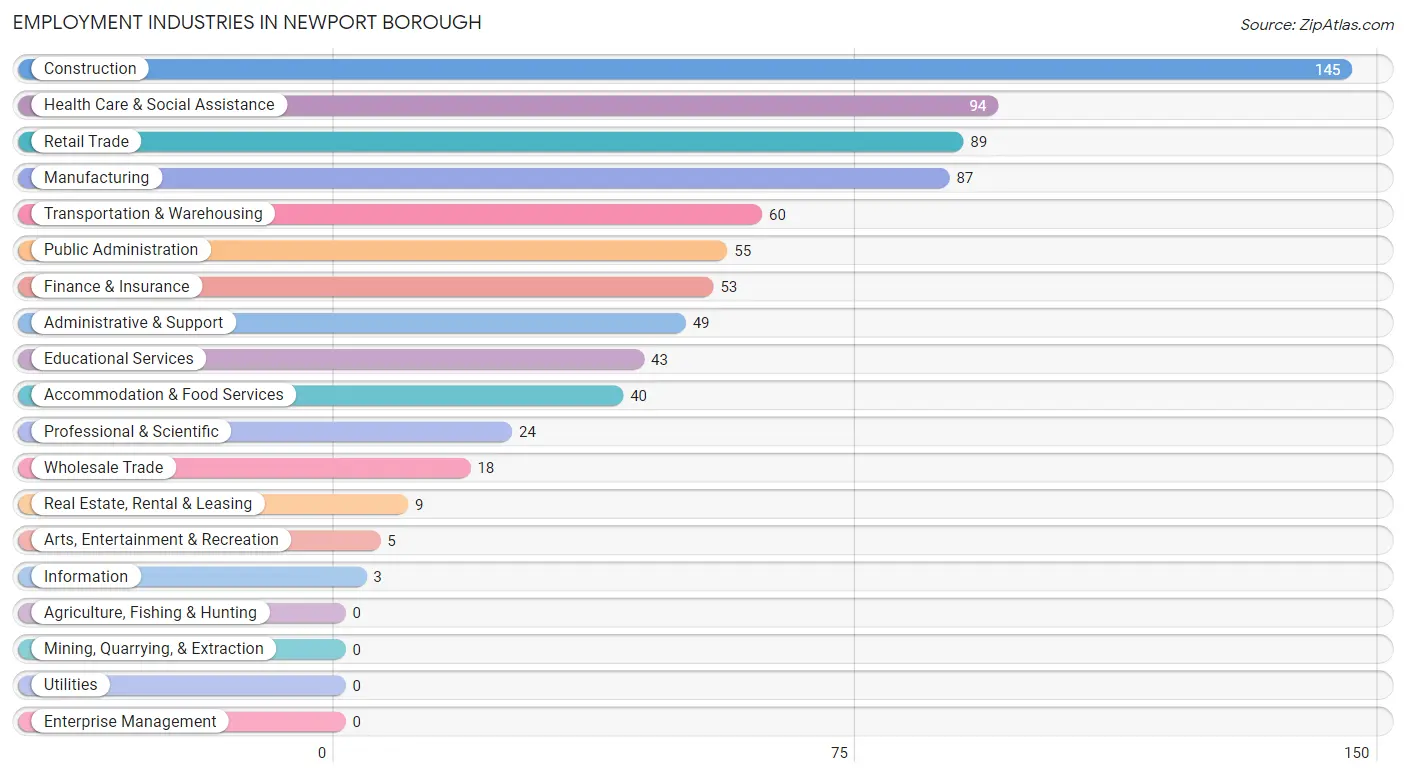
Employment Industries in Newport borough
The major employment industries in Newport borough include Construction (145 | 17.7%), Health Care & Social Assistance (94 | 11.5%), Retail Trade (89 | 10.9%), Manufacturing (87 | 10.6%), and Transportation & Warehousing (60 | 7.3%).
Employment Industries by Sex in Newport borough
The Newport borough industries that see more men than women are Information (100.0%), Construction (97.2%), and Transportation & Warehousing (90.0%), whereas the industries that tend to have a higher number of women are Public Administration (96.4%), Health Care & Social Assistance (87.2%), and Accommodation & Food Services (82.5%).
| Industry | Male | Female |
| Agriculture, Fishing & Hunting | 0 (0.0%) | 0 (0.0%) |
| Mining, Quarrying, & Extraction | 0 (0.0%) | 0 (0.0%) |
| Construction | 141 (97.2%) | 4 (2.8%) |
| Manufacturing | 78 (89.7%) | 9 (10.3%) |
| Wholesale Trade | 12 (66.7%) | 6 (33.3%) |
| Retail Trade | 43 (48.3%) | 46 (51.7%) |
| Transportation & Warehousing | 54 (90.0%) | 6 (10.0%) |
| Utilities | 0 (0.0%) | 0 (0.0%) |
| Information | 3 (100.0%) | 0 (0.0%) |
| Finance & Insurance | 14 (26.4%) | 39 (73.6%) |
| Real Estate, Rental & Leasing | 4 (44.4%) | 5 (55.6%) |
| Professional & Scientific | 18 (75.0%) | 6 (25.0%) |
| Enterprise Management | 0 (0.0%) | 0 (0.0%) |
| Administrative & Support | 28 (57.1%) | 21 (42.9%) |
| Educational Services | 10 (23.3%) | 33 (76.7%) |
| Health Care & Social Assistance | 12 (12.8%) | 82 (87.2%) |
| Arts, Entertainment & Recreation | 2 (40.0%) | 3 (60.0%) |
| Accommodation & Food Services | 7 (17.5%) | 33 (82.5%) |
| Public Administration | 2 (3.6%) | 53 (96.4%) |
| Total | 464 (56.7%) | 355 (43.3%) |
Education in Newport borough
School Enrollment in Newport borough
The most common levels of schooling among the 366 students in Newport borough are middle school (112 | 30.6%), elementary school (84 | 23.0%), and high school (52 | 14.2%).
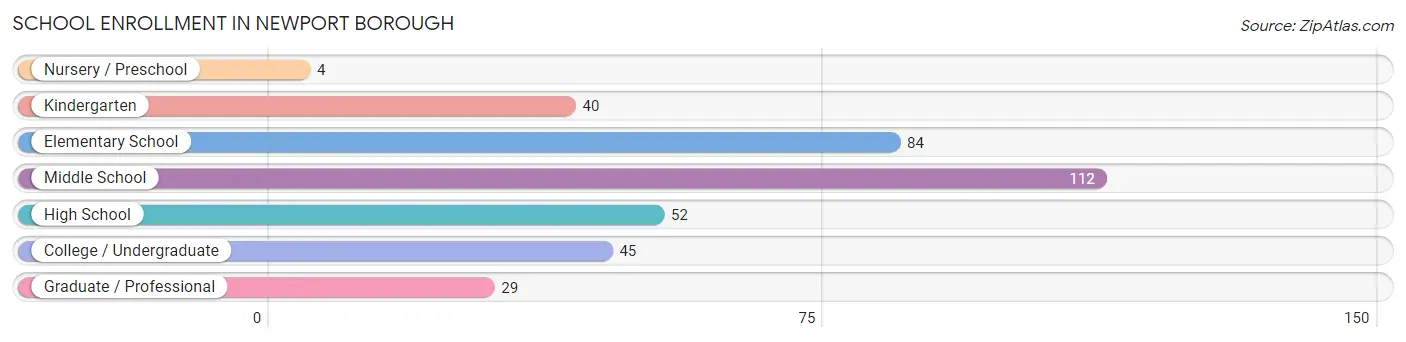
| School Level | # Students | % Students |
| Nursery / Preschool | 4 | 1.1% |
| Kindergarten | 40 | 10.9% |
| Elementary School | 84 | 23.0% |
| Middle School | 112 | 30.6% |
| High School | 52 | 14.2% |
| College / Undergraduate | 45 | 12.3% |
| Graduate / Professional | 29 | 7.9% |
| Total | 366 | 100.0% |
School Enrollment by Age by Funding Source in Newport borough
Out of a total of 366 students who are enrolled in schools in Newport borough, 54 (14.8%) attend a private institution, while the remaining 312 (85.2%) are enrolled in public schools. The age group of 35 years and over has the highest likelihood of being enrolled in private schools, with 25 (80.6% in the age bracket) enrolled. Conversely, the age group of 10 to 14 year olds has the lowest likelihood of being enrolled in a private school, with 134 (100.0% in the age bracket) attending a public institution.
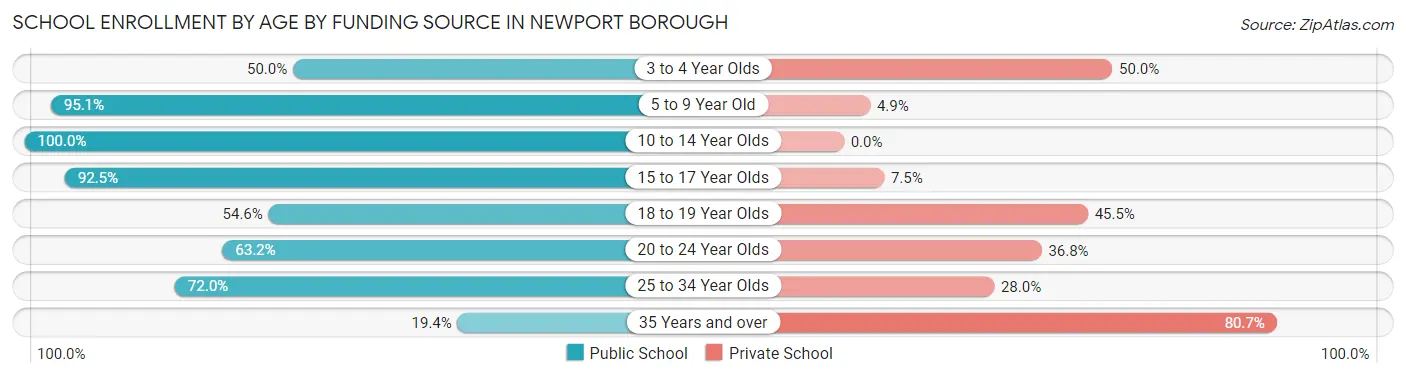
| Age Bracket | Public School | Private School |
| 3 to 4 Year Olds | 2 (50.0%) | 2 (50.0%) |
| 5 to 9 Year Old | 97 (95.1%) | 5 (4.9%) |
| 10 to 14 Year Olds | 134 (100.0%) | 0 (0.0%) |
| 15 to 17 Year Olds | 37 (92.5%) | 3 (7.5%) |
| 18 to 19 Year Olds | 6 (54.5%) | 5 (45.5%) |
| 20 to 24 Year Olds | 12 (63.2%) | 7 (36.8%) |
| 25 to 34 Year Olds | 18 (72.0%) | 7 (28.0%) |
| 35 Years and over | 6 (19.4%) | 25 (80.6%) |
| Total | 312 (85.2%) | 54 (14.8%) |
Educational Attainment by Field of Study in Newport borough
Liberal arts & history (65 | 30.2%), education (29 | 13.5%), communications (29 | 13.5%), business (21 | 9.8%), and science & technology (16 | 7.4%) are the most common fields of study among 215 individuals in Newport borough who have obtained a bachelor's degree or higher.
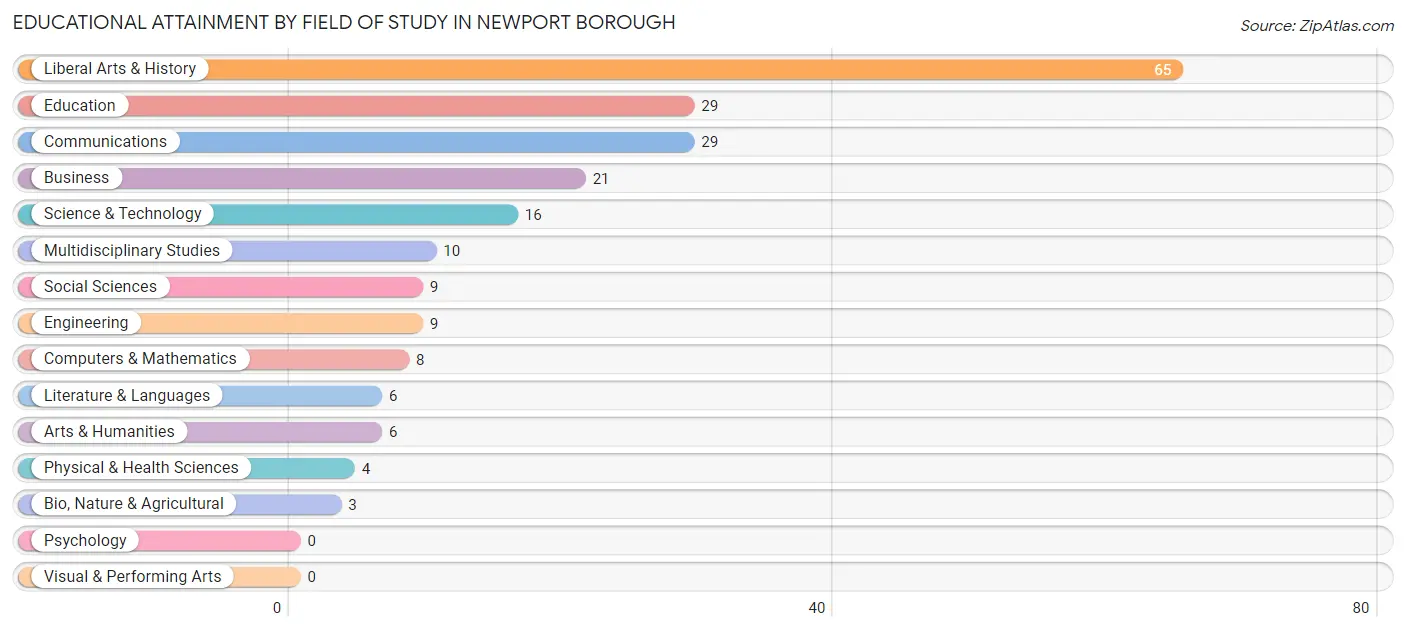
| Field of Study | # Graduates | % Graduates |
| Computers & Mathematics | 8 | 3.7% |
| Bio, Nature & Agricultural | 3 | 1.4% |
| Physical & Health Sciences | 4 | 1.9% |
| Psychology | 0 | 0.0% |
| Social Sciences | 9 | 4.2% |
| Engineering | 9 | 4.2% |
| Multidisciplinary Studies | 10 | 4.6% |
| Science & Technology | 16 | 7.4% |
| Business | 21 | 9.8% |
| Education | 29 | 13.5% |
| Literature & Languages | 6 | 2.8% |
| Liberal Arts & History | 65 | 30.2% |
| Visual & Performing Arts | 0 | 0.0% |
| Communications | 29 | 13.5% |
| Arts & Humanities | 6 | 2.8% |
| Total | 215 | 100.0% |
Transportation & Commute in Newport borough
Vehicle Availability by Sex in Newport borough
The most prevalent vehicle ownership categories in Newport borough are males with 2 vehicles (170, accounting for 36.6%) and females with 2 vehicles (186, making up 48.3%).
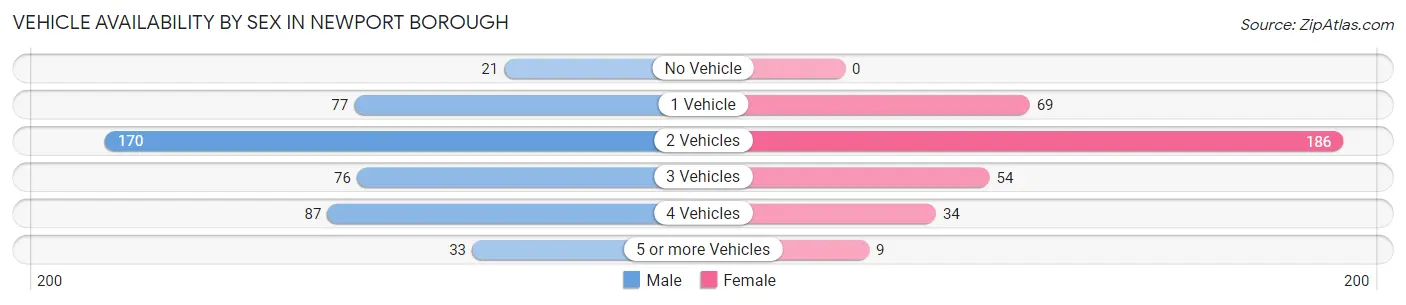
| Vehicles Available | Male | Female |
| No Vehicle | 21 (4.5%) | 0 (0.0%) |
| 1 Vehicle | 77 (16.6%) | 69 (19.6%) |
| 2 Vehicles | 170 (36.6%) | 186 (52.8%) |
| 3 Vehicles | 76 (16.4%) | 54 (15.3%) |
| 4 Vehicles | 87 (18.8%) | 34 (9.7%) |
| 5 or more Vehicles | 33 (7.1%) | 9 (2.6%) |
| Total | 464 (100.0%) | 352 (100.0%) |
Commute Time in Newport borough
The most frequently occuring commute durations in Newport borough are 45 to 59 minutes (169 commuters, 21.8%), 20 to 24 minutes (106 commuters, 13.7%), and 35 to 39 minutes (70 commuters, 9.0%).
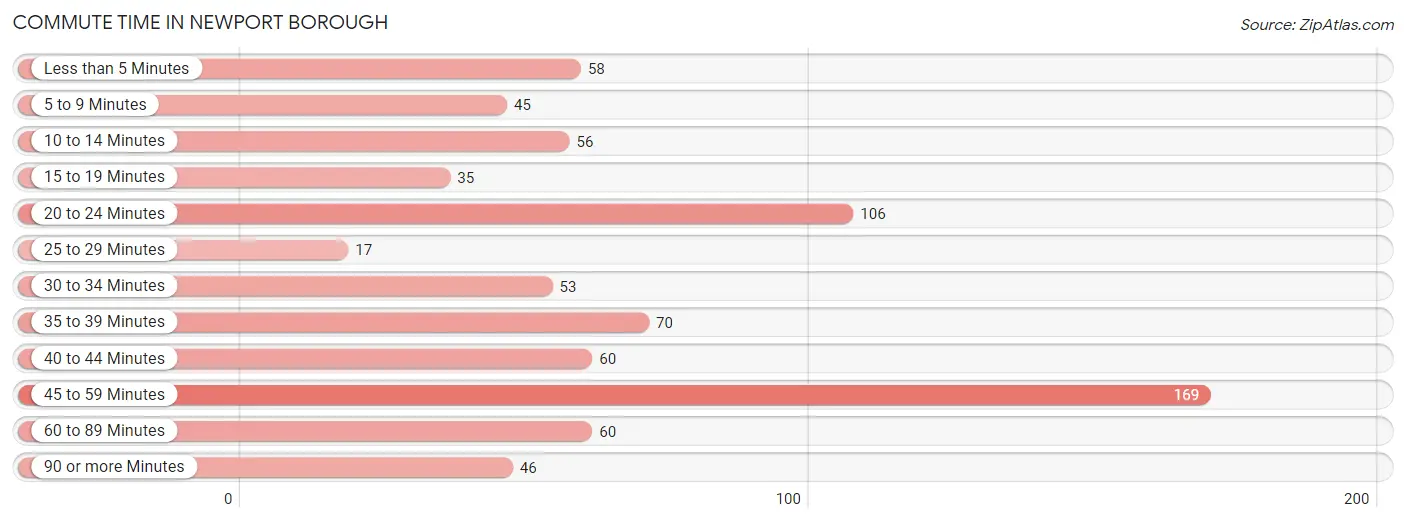
| Commute Time | # Commuters | % Commuters |
| Less than 5 Minutes | 58 | 7.5% |
| 5 to 9 Minutes | 45 | 5.8% |
| 10 to 14 Minutes | 56 | 7.2% |
| 15 to 19 Minutes | 35 | 4.5% |
| 20 to 24 Minutes | 106 | 13.7% |
| 25 to 29 Minutes | 17 | 2.2% |
| 30 to 34 Minutes | 53 | 6.8% |
| 35 to 39 Minutes | 70 | 9.0% |
| 40 to 44 Minutes | 60 | 7.7% |
| 45 to 59 Minutes | 169 | 21.8% |
| 60 to 89 Minutes | 60 | 7.7% |
| 90 or more Minutes | 46 | 5.9% |
Commute Time by Sex in Newport borough
The most common commute times in Newport borough are 45 to 59 minutes (104 commuters, 23.0%) for males and 45 to 59 minutes (65 commuters, 20.1%) for females.
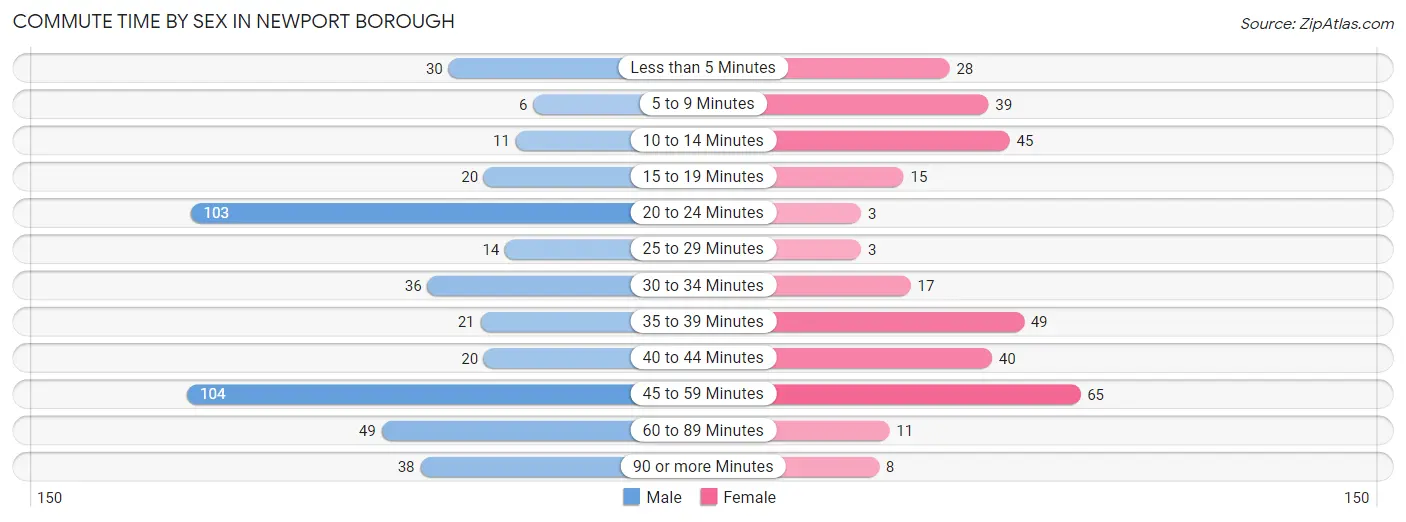
| Commute Time | Male | Female |
| Less than 5 Minutes | 30 (6.6%) | 28 (8.7%) |
| 5 to 9 Minutes | 6 (1.3%) | 39 (12.1%) |
| 10 to 14 Minutes | 11 (2.4%) | 45 (13.9%) |
| 15 to 19 Minutes | 20 (4.4%) | 15 (4.6%) |
| 20 to 24 Minutes | 103 (22.8%) | 3 (0.9%) |
| 25 to 29 Minutes | 14 (3.1%) | 3 (0.9%) |
| 30 to 34 Minutes | 36 (8.0%) | 17 (5.3%) |
| 35 to 39 Minutes | 21 (4.6%) | 49 (15.2%) |
| 40 to 44 Minutes | 20 (4.4%) | 40 (12.4%) |
| 45 to 59 Minutes | 104 (23.0%) | 65 (20.1%) |
| 60 to 89 Minutes | 49 (10.8%) | 11 (3.4%) |
| 90 or more Minutes | 38 (8.4%) | 8 (2.5%) |
Time of Departure to Work by Sex in Newport borough
The most frequent times of departure to work in Newport borough are 6:00 AM to 6:29 AM (101, 22.4%) for males and 4:00 PM to 11:59 PM (53, 16.4%) for females.
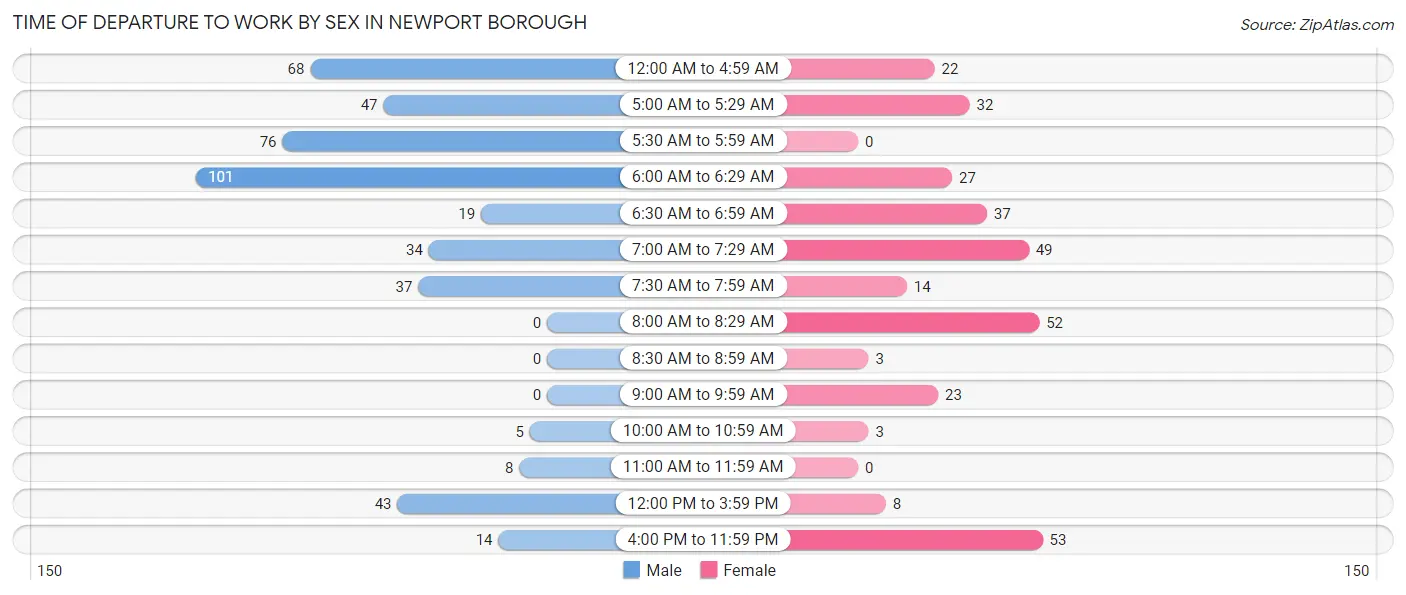
| Time of Departure | Male | Female |
| 12:00 AM to 4:59 AM | 68 (15.0%) | 22 (6.8%) |
| 5:00 AM to 5:29 AM | 47 (10.4%) | 32 (9.9%) |
| 5:30 AM to 5:59 AM | 76 (16.8%) | 0 (0.0%) |
| 6:00 AM to 6:29 AM | 101 (22.4%) | 27 (8.4%) |
| 6:30 AM to 6:59 AM | 19 (4.2%) | 37 (11.5%) |
| 7:00 AM to 7:29 AM | 34 (7.5%) | 49 (15.2%) |
| 7:30 AM to 7:59 AM | 37 (8.2%) | 14 (4.3%) |
| 8:00 AM to 8:29 AM | 0 (0.0%) | 52 (16.1%) |
| 8:30 AM to 8:59 AM | 0 (0.0%) | 3 (0.9%) |
| 9:00 AM to 9:59 AM | 0 (0.0%) | 23 (7.1%) |
| 10:00 AM to 10:59 AM | 5 (1.1%) | 3 (0.9%) |
| 11:00 AM to 11:59 AM | 8 (1.8%) | 0 (0.0%) |
| 12:00 PM to 3:59 PM | 43 (9.5%) | 8 (2.5%) |
| 4:00 PM to 11:59 PM | 14 (3.1%) | 53 (16.4%) |
| Total | 452 (100.0%) | 323 (100.0%) |
Housing Occupancy in Newport borough
Occupancy by Ownership in Newport borough
Of the total 606 dwellings in Newport borough, owner-occupied units account for 268 (44.2%), while renter-occupied units make up 338 (55.8%).
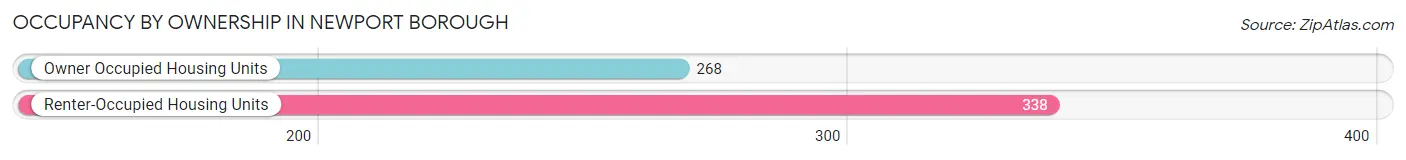
| Occupancy | # Housing Units | % Housing Units |
| Owner Occupied Housing Units | 268 | 44.2% |
| Renter-Occupied Housing Units | 338 | 55.8% |
| Total Occupied Housing Units | 606 | 100.0% |
Occupancy by Household Size in Newport borough
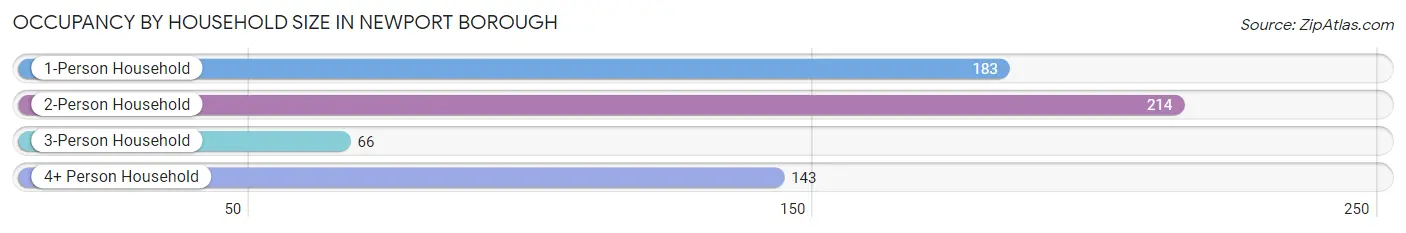
| Household Size | # Housing Units | % Housing Units |
| 1-Person Household | 183 | 30.2% |
| 2-Person Household | 214 | 35.3% |
| 3-Person Household | 66 | 10.9% |
| 4+ Person Household | 143 | 23.6% |
| Total Housing Units | 606 | 100.0% |
Occupancy by Ownership by Household Size in Newport borough
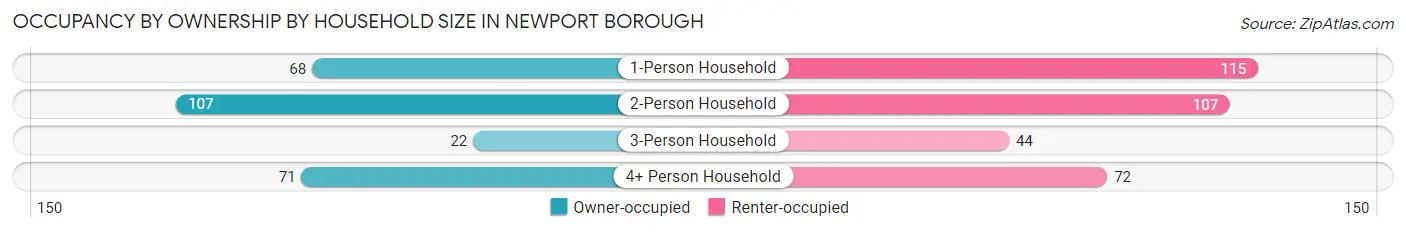
| Household Size | Owner-occupied | Renter-occupied |
| 1-Person Household | 68 (37.2%) | 115 (62.8%) |
| 2-Person Household | 107 (50.0%) | 107 (50.0%) |
| 3-Person Household | 22 (33.3%) | 44 (66.7%) |
| 4+ Person Household | 71 (49.6%) | 72 (50.3%) |
| Total Housing Units | 268 (44.2%) | 338 (55.8%) |
Occupancy by Educational Attainment in Newport borough
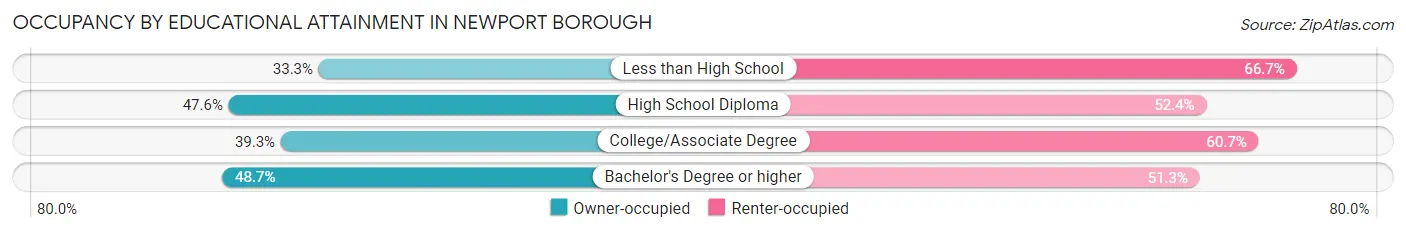
| Household Size | Owner-occupied | Renter-occupied |
| Less than High School | 10 (33.3%) | 20 (66.7%) |
| High School Diploma | 120 (47.6%) | 132 (52.4%) |
| College/Associate Degree | 83 (39.3%) | 128 (60.7%) |
| Bachelor's Degree or higher | 55 (48.7%) | 58 (51.3%) |
Occupancy by Age of Householder in Newport borough
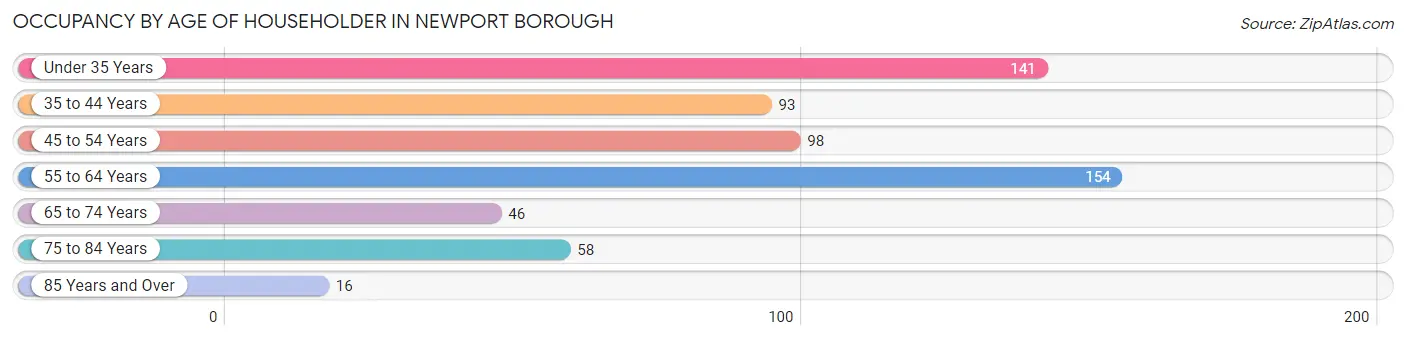
| Age Bracket | # Households | % Households |
| Under 35 Years | 141 | 23.3% |
| 35 to 44 Years | 93 | 15.3% |
| 45 to 54 Years | 98 | 16.2% |
| 55 to 64 Years | 154 | 25.4% |
| 65 to 74 Years | 46 | 7.6% |
| 75 to 84 Years | 58 | 9.6% |
| 85 Years and Over | 16 | 2.6% |
| Total | 606 | 100.0% |
Housing Finances in Newport borough
Median Income by Occupancy in Newport borough
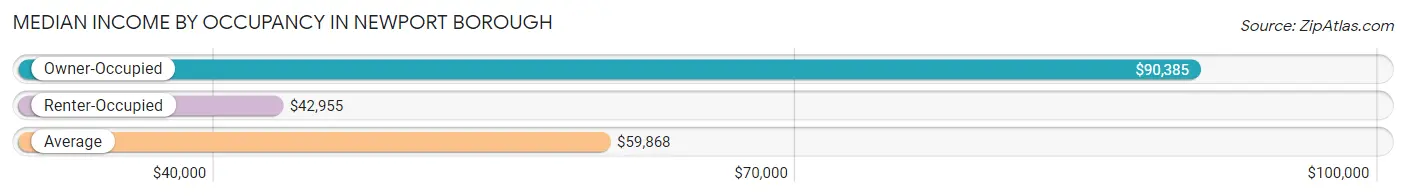
| Occupancy Type | # Households | Median Income |
| Owner-Occupied | 268 (44.2%) | $90,385 |
| Renter-Occupied | 338 (55.8%) | $42,955 |
| Average | 606 (100.0%) | $59,868 |
Occupancy by Householder Income Bracket in Newport borough
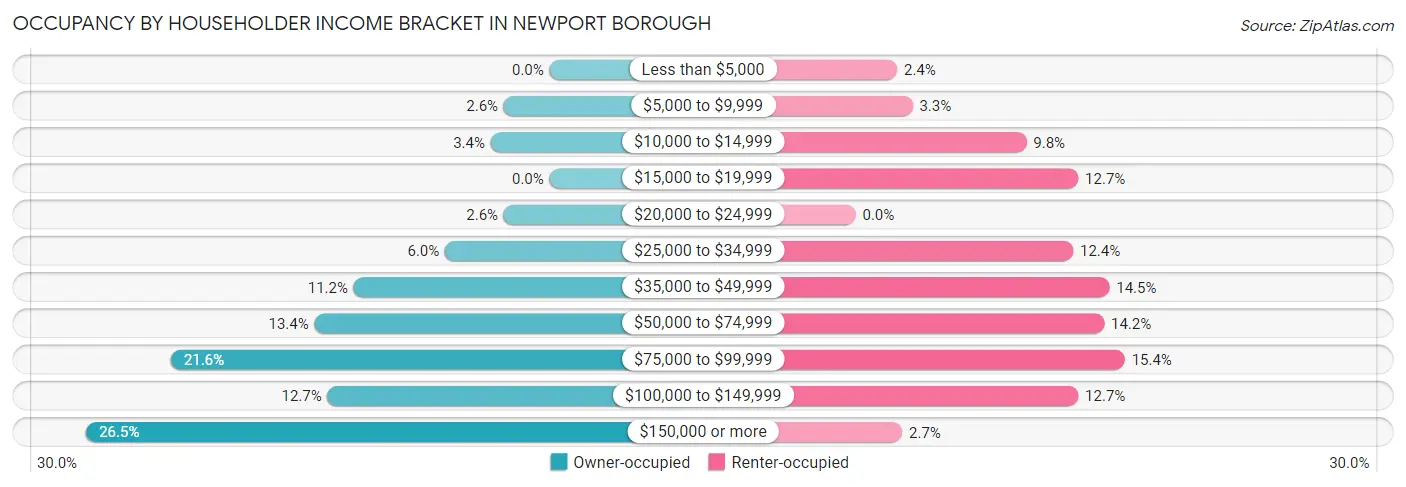
| Income Bracket | Owner-occupied | Renter-occupied |
| Less than $5,000 | 0 (0.0%) | 8 (2.4%) |
| $5,000 to $9,999 | 7 (2.6%) | 11 (3.3%) |
| $10,000 to $14,999 | 9 (3.4%) | 33 (9.8%) |
| $15,000 to $19,999 | 0 (0.0%) | 43 (12.7%) |
| $20,000 to $24,999 | 7 (2.6%) | 0 (0.0%) |
| $25,000 to $34,999 | 16 (6.0%) | 42 (12.4%) |
| $35,000 to $49,999 | 30 (11.2%) | 49 (14.5%) |
| $50,000 to $74,999 | 36 (13.4%) | 48 (14.2%) |
| $75,000 to $99,999 | 58 (21.6%) | 52 (15.4%) |
| $100,000 to $149,999 | 34 (12.7%) | 43 (12.7%) |
| $150,000 or more | 71 (26.5%) | 9 (2.7%) |
| Total | 268 (100.0%) | 338 (100.0%) |
Monthly Housing Cost Tiers in Newport borough
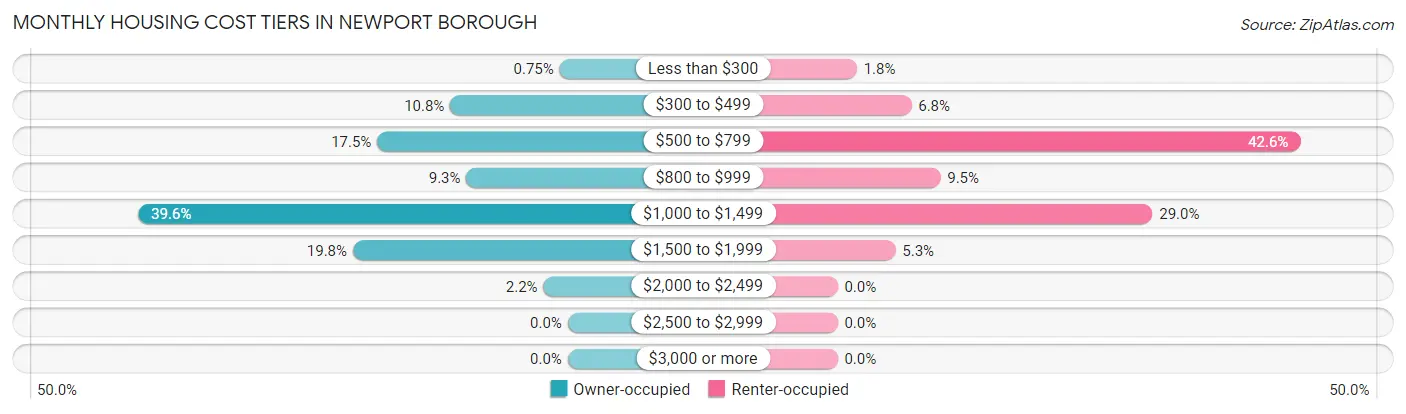
| Monthly Cost | Owner-occupied | Renter-occupied |
| Less than $300 | 2 (0.7%) | 6 (1.8%) |
| $300 to $499 | 29 (10.8%) | 23 (6.8%) |
| $500 to $799 | 47 (17.5%) | 144 (42.6%) |
| $800 to $999 | 25 (9.3%) | 32 (9.5%) |
| $1,000 to $1,499 | 106 (39.6%) | 98 (29.0%) |
| $1,500 to $1,999 | 53 (19.8%) | 18 (5.3%) |
| $2,000 to $2,499 | 6 (2.2%) | 0 (0.0%) |
| $2,500 to $2,999 | 0 (0.0%) | 0 (0.0%) |
| $3,000 or more | 0 (0.0%) | 0 (0.0%) |
| Total | 268 (100.0%) | 338 (100.0%) |
Physical Housing Characteristics in Newport borough
Housing Structures in Newport borough
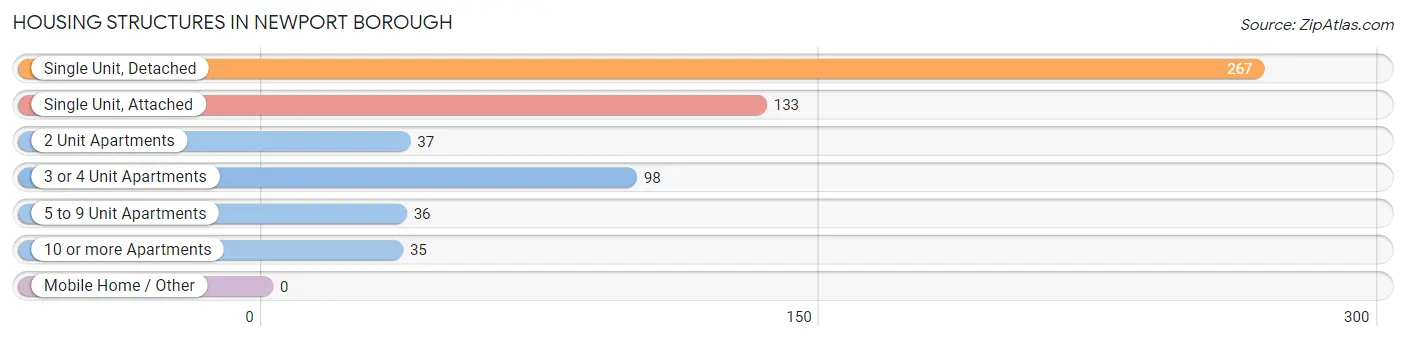
| Structure Type | # Housing Units | % Housing Units |
| Single Unit, Detached | 267 | 44.1% |
| Single Unit, Attached | 133 | 22.0% |
| 2 Unit Apartments | 37 | 6.1% |
| 3 or 4 Unit Apartments | 98 | 16.2% |
| 5 to 9 Unit Apartments | 36 | 5.9% |
| 10 or more Apartments | 35 | 5.8% |
| Mobile Home / Other | 0 | 0.0% |
| Total | 606 | 100.0% |
Housing Structures by Occupancy in Newport borough
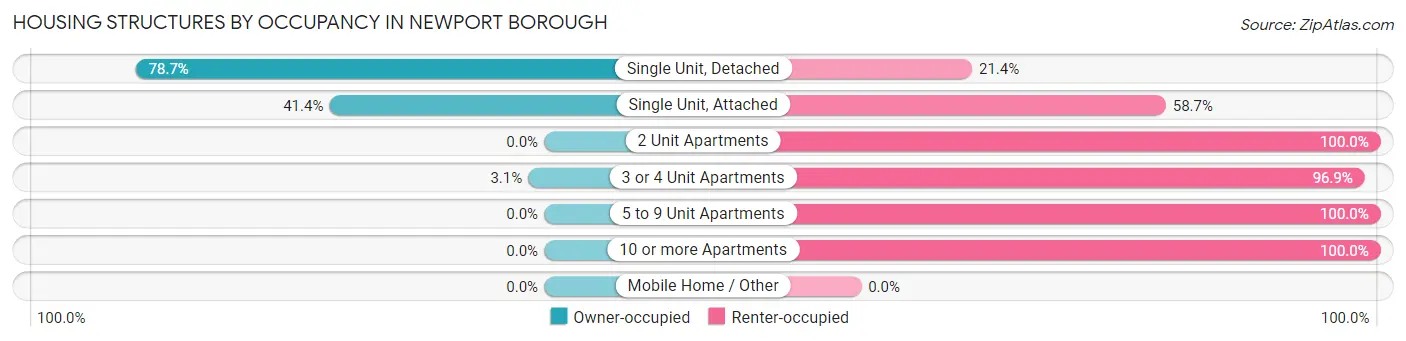
| Structure Type | Owner-occupied | Renter-occupied |
| Single Unit, Detached | 210 (78.6%) | 57 (21.3%) |
| Single Unit, Attached | 55 (41.3%) | 78 (58.7%) |
| 2 Unit Apartments | 0 (0.0%) | 37 (100.0%) |
| 3 or 4 Unit Apartments | 3 (3.1%) | 95 (96.9%) |
| 5 to 9 Unit Apartments | 0 (0.0%) | 36 (100.0%) |
| 10 or more Apartments | 0 (0.0%) | 35 (100.0%) |
| Mobile Home / Other | 0 (0.0%) | 0 (0.0%) |
| Total | 268 (44.2%) | 338 (55.8%) |
Housing Structures by Number of Rooms in Newport borough
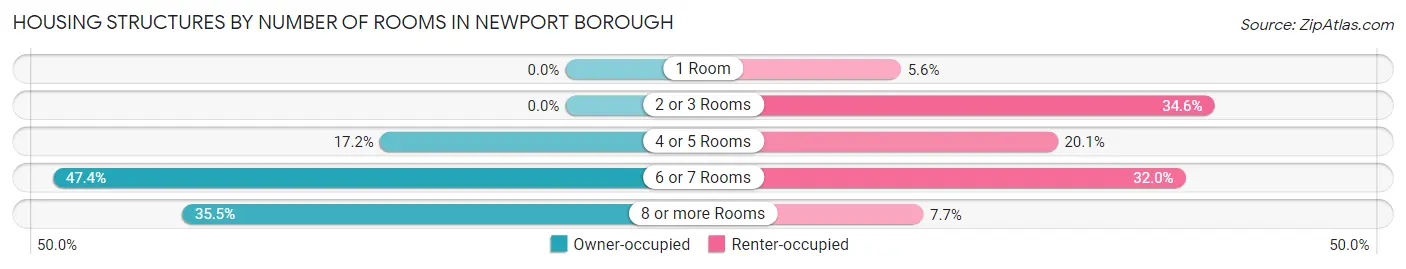
| Number of Rooms | Owner-occupied | Renter-occupied |
| 1 Room | 0 (0.0%) | 19 (5.6%) |
| 2 or 3 Rooms | 0 (0.0%) | 117 (34.6%) |
| 4 or 5 Rooms | 46 (17.2%) | 68 (20.1%) |
| 6 or 7 Rooms | 127 (47.4%) | 108 (32.0%) |
| 8 or more Rooms | 95 (35.4%) | 26 (7.7%) |
| Total | 268 (100.0%) | 338 (100.0%) |
Housing Structure by Heating Type in Newport borough
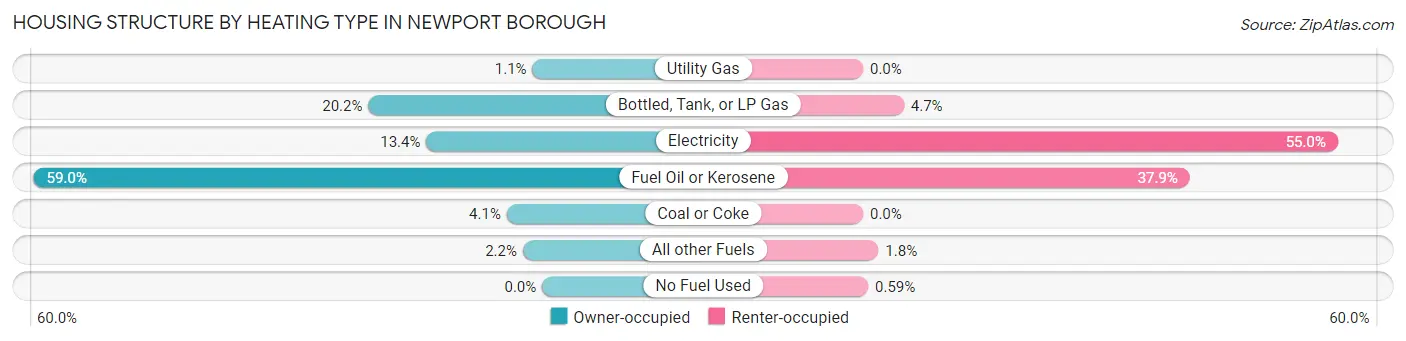
| Heating Type | Owner-occupied | Renter-occupied |
| Utility Gas | 3 (1.1%) | 0 (0.0%) |
| Bottled, Tank, or LP Gas | 54 (20.2%) | 16 (4.7%) |
| Electricity | 36 (13.4%) | 186 (55.0%) |
| Fuel Oil or Kerosene | 158 (59.0%) | 128 (37.9%) |
| Coal or Coke | 11 (4.1%) | 0 (0.0%) |
| All other Fuels | 6 (2.2%) | 6 (1.8%) |
| No Fuel Used | 0 (0.0%) | 2 (0.6%) |
| Total | 268 (100.0%) | 338 (100.0%) |
Household Vehicle Usage in Newport borough
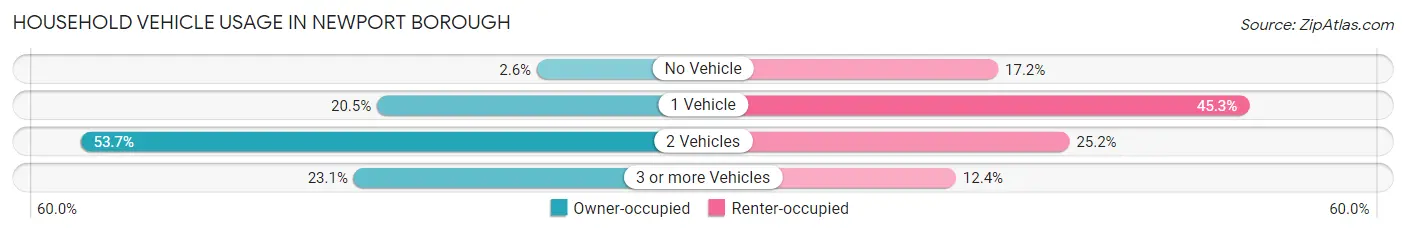
| Vehicles per Household | Owner-occupied | Renter-occupied |
| No Vehicle | 7 (2.6%) | 58 (17.2%) |
| 1 Vehicle | 55 (20.5%) | 153 (45.3%) |
| 2 Vehicles | 144 (53.7%) | 85 (25.2%) |
| 3 or more Vehicles | 62 (23.1%) | 42 (12.4%) |
| Total | 268 (100.0%) | 338 (100.0%) |
Real Estate & Mortgages in Newport borough
Real Estate and Mortgage Overview in Newport borough
| Characteristic | Without Mortgage | With Mortgage |
| Housing Units | 94 | 174 |
| Median Property Value | $153,900 | $146,700 |
| Median Household Income | $58,333 | $58 |
| Monthly Housing Costs | $658 | $0 |
| Real Estate Taxes | $2,260 | $0 |
Property Value by Mortgage Status in Newport borough
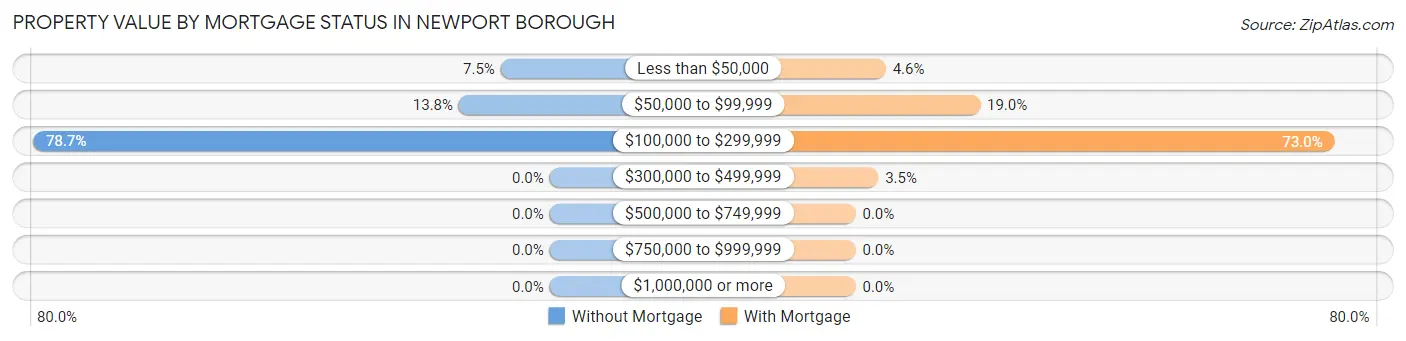
| Property Value | Without Mortgage | With Mortgage |
| Less than $50,000 | 7 (7.4%) | 8 (4.6%) |
| $50,000 to $99,999 | 13 (13.8%) | 33 (19.0%) |
| $100,000 to $299,999 | 74 (78.7%) | 127 (73.0%) |
| $300,000 to $499,999 | 0 (0.0%) | 6 (3.5%) |
| $500,000 to $749,999 | 0 (0.0%) | 0 (0.0%) |
| $750,000 to $999,999 | 0 (0.0%) | 0 (0.0%) |
| $1,000,000 or more | 0 (0.0%) | 0 (0.0%) |
| Total | 94 (100.0%) | 174 (100.0%) |
Household Income by Mortgage Status in Newport borough
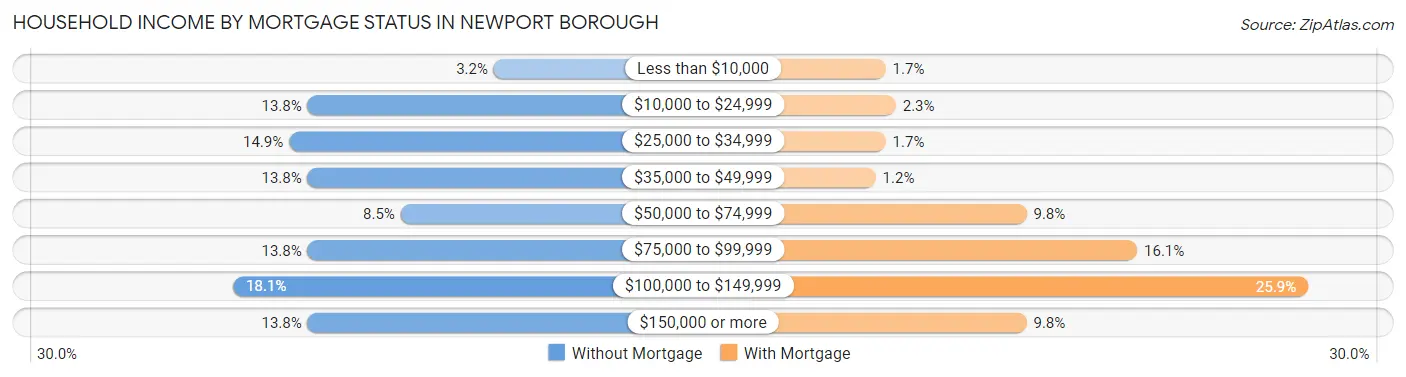
| Household Income | Without Mortgage | With Mortgage |
| Less than $10,000 | 3 (3.2%) | 3 (1.7%) |
| $10,000 to $24,999 | 13 (13.8%) | 4 (2.3%) |
| $25,000 to $34,999 | 14 (14.9%) | 3 (1.7%) |
| $35,000 to $49,999 | 13 (13.8%) | 2 (1.1%) |
| $50,000 to $74,999 | 8 (8.5%) | 17 (9.8%) |
| $75,000 to $99,999 | 13 (13.8%) | 28 (16.1%) |
| $100,000 to $149,999 | 17 (18.1%) | 45 (25.9%) |
| $150,000 or more | 13 (13.8%) | 17 (9.8%) |
| Total | 94 (100.0%) | 174 (100.0%) |
Property Value to Household Income Ratio in Newport borough
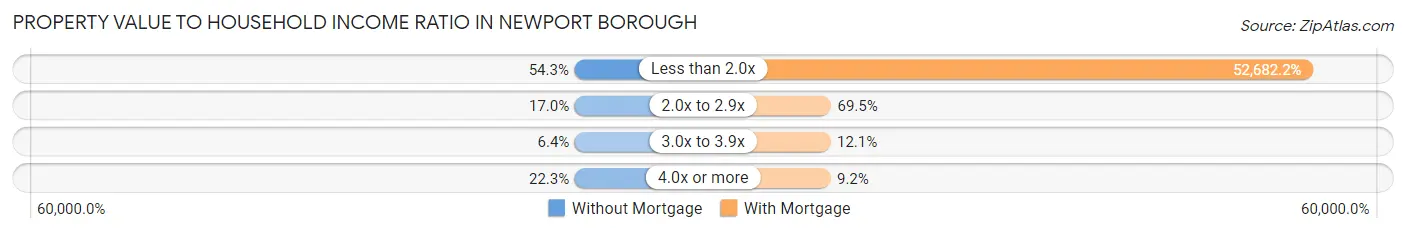
| Value-to-Income Ratio | Without Mortgage | With Mortgage |
| Less than 2.0x | 51 (54.3%) | 91,667 (52,682.2%) |
| 2.0x to 2.9x | 16 (17.0%) | 121 (69.5%) |
| 3.0x to 3.9x | 6 (6.4%) | 21 (12.1%) |
| 4.0x or more | 21 (22.3%) | 16 (9.2%) |
| Total | 94 (100.0%) | 174 (100.0%) |
Real Estate Taxes by Mortgage Status in Newport borough
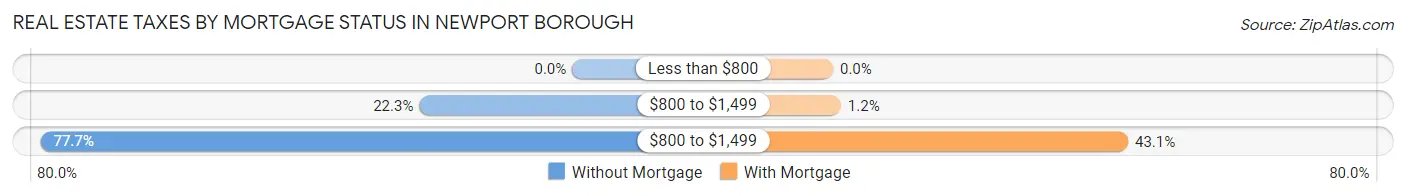
| Property Taxes | Without Mortgage | With Mortgage |
| Less than $800 | 0 (0.0%) | 0 (0.0%) |
| $800 to $1,499 | 21 (22.3%) | 2 (1.1%) |
| $800 to $1,499 | 73 (77.7%) | 75 (43.1%) |
| Total | 94 (100.0%) | 174 (100.0%) |
Health & Disability in Newport borough
Health Insurance Coverage by Age in Newport borough
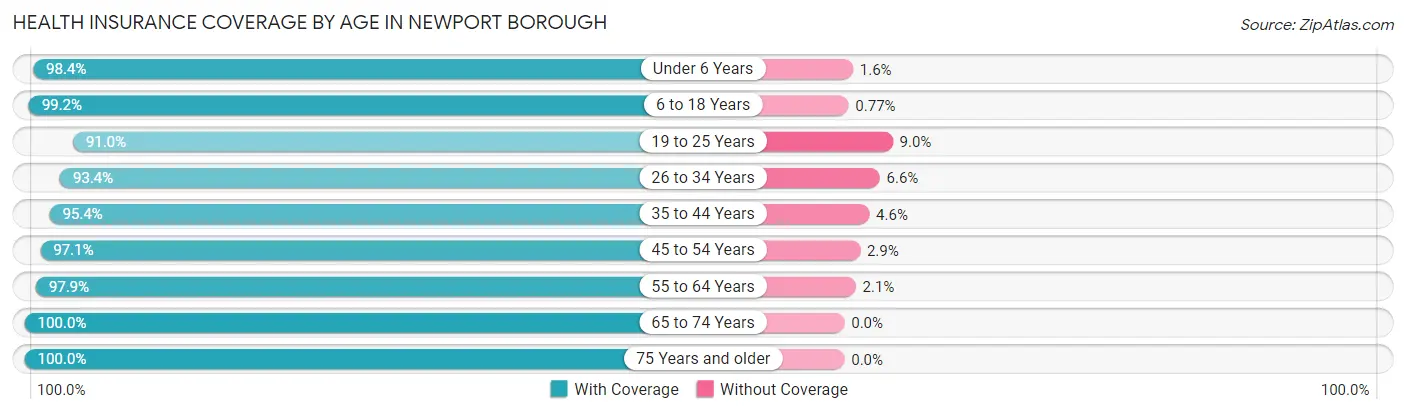
| Age Bracket | With Coverage | Without Coverage |
| Under 6 Years | 124 (98.4%) | 2 (1.6%) |
| 6 to 18 Years | 259 (99.2%) | 2 (0.8%) |
| 19 to 25 Years | 192 (91.0%) | 19 (9.0%) |
| 26 to 34 Years | 213 (93.4%) | 15 (6.6%) |
| 35 to 44 Years | 185 (95.4%) | 9 (4.6%) |
| 45 to 54 Years | 166 (97.1%) | 5 (2.9%) |
| 55 to 64 Years | 186 (97.9%) | 4 (2.1%) |
| 65 to 74 Years | 117 (100.0%) | 0 (0.0%) |
| 75 Years and older | 86 (100.0%) | 0 (0.0%) |
| Total | 1,528 (96.5%) | 56 (3.5%) |
Health Insurance Coverage by Citizenship Status in Newport borough
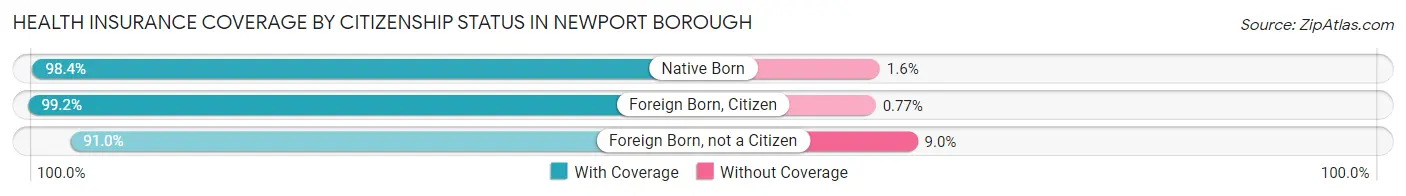
| Citizenship Status | With Coverage | Without Coverage |
| Native Born | 124 (98.4%) | 2 (1.6%) |
| Foreign Born, Citizen | 259 (99.2%) | 2 (0.8%) |
| Foreign Born, not a Citizen | 192 (91.0%) | 19 (9.0%) |
Health Insurance Coverage by Household Income in Newport borough
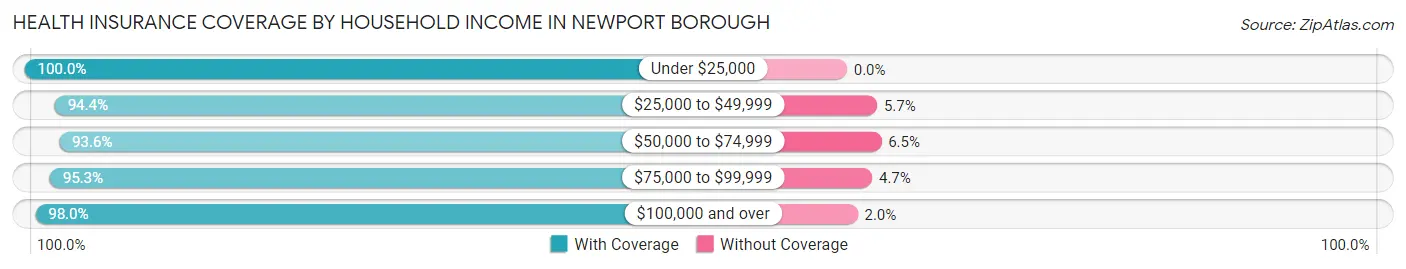
| Household Income | With Coverage | Without Coverage |
| Under $25,000 | 190 (100.0%) | 0 (0.0%) |
| $25,000 to $49,999 | 234 (94.4%) | 14 (5.7%) |
| $50,000 to $74,999 | 174 (93.5%) | 12 (6.5%) |
| $75,000 to $99,999 | 383 (95.3%) | 19 (4.7%) |
| $100,000 and over | 536 (98.0%) | 11 (2.0%) |
Public vs Private Health Insurance Coverage by Age in Newport borough
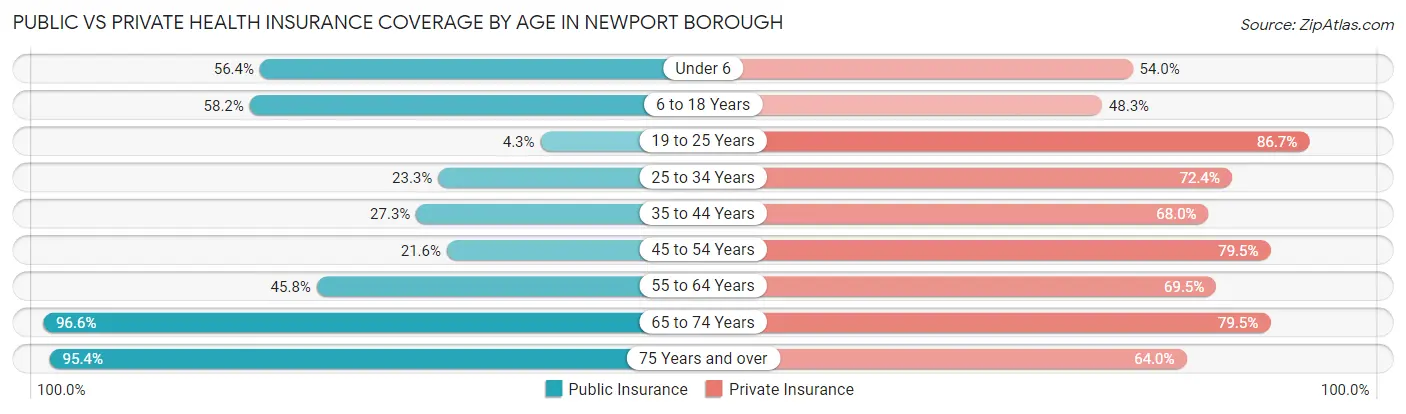
| Age Bracket | Public Insurance | Private Insurance |
| Under 6 | 71 (56.4%) | 68 (54.0%) |
| 6 to 18 Years | 152 (58.2%) | 126 (48.3%) |
| 19 to 25 Years | 9 (4.3%) | 183 (86.7%) |
| 25 to 34 Years | 53 (23.3%) | 165 (72.4%) |
| 35 to 44 Years | 53 (27.3%) | 132 (68.0%) |
| 45 to 54 Years | 37 (21.6%) | 136 (79.5%) |
| 55 to 64 Years | 87 (45.8%) | 132 (69.5%) |
| 65 to 74 Years | 113 (96.6%) | 93 (79.5%) |
| 75 Years and over | 82 (95.4%) | 55 (63.9%) |
| Total | 657 (41.5%) | 1,090 (68.8%) |
Disability Status by Sex by Age in Newport borough
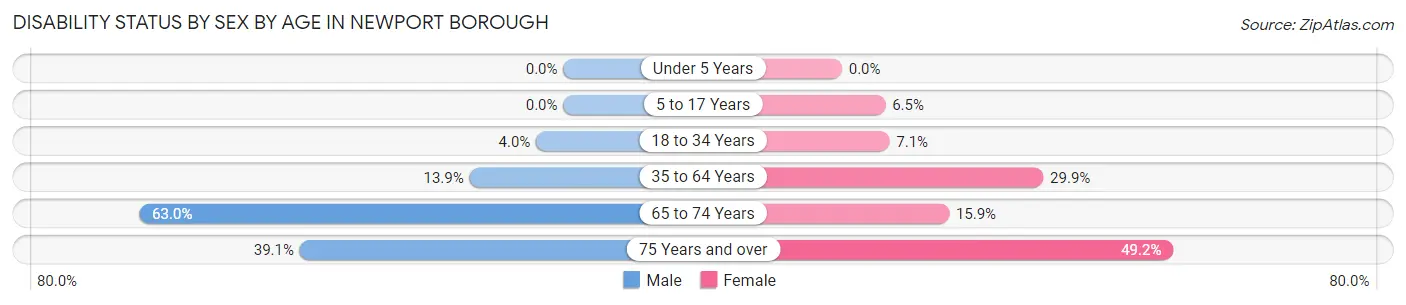
| Age Bracket | Male | Female |
| Under 5 Years | 0 (0.0%) | 0 (0.0%) |
| 5 to 17 Years | 0 (0.0%) | 10 (6.5%) |
| 18 to 34 Years | 11 (4.0%) | 12 (7.1%) |
| 35 to 64 Years | 34 (13.9%) | 93 (29.9%) |
| 65 to 74 Years | 46 (63.0%) | 7 (15.9%) |
| 75 Years and over | 9 (39.1%) | 31 (49.2%) |
Disability Class by Sex by Age in Newport borough
Disability Class: Hearing Difficulty
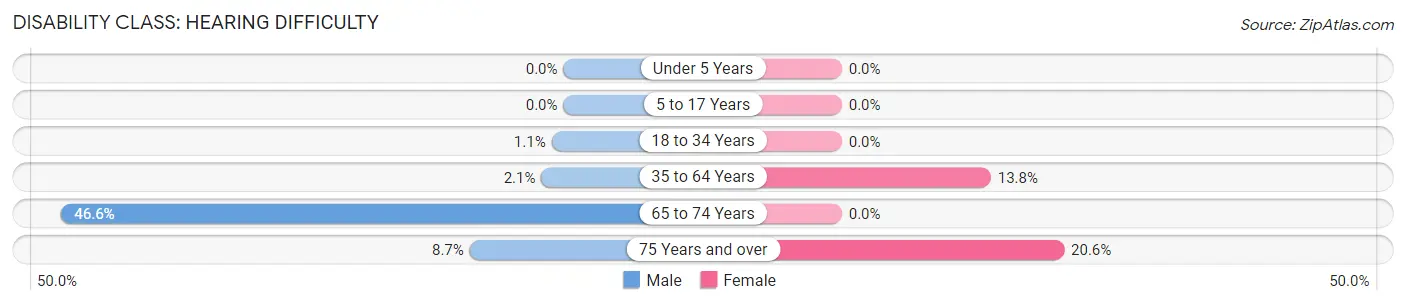
| Age Bracket | Male | Female |
| Under 5 Years | 0 (0.0%) | 0 (0.0%) |
| 5 to 17 Years | 0 (0.0%) | 0 (0.0%) |
| 18 to 34 Years | 3 (1.1%) | 0 (0.0%) |
| 35 to 64 Years | 5 (2.1%) | 43 (13.8%) |
| 65 to 74 Years | 34 (46.6%) | 0 (0.0%) |
| 75 Years and over | 2 (8.7%) | 13 (20.6%) |
Disability Class: Vision Difficulty
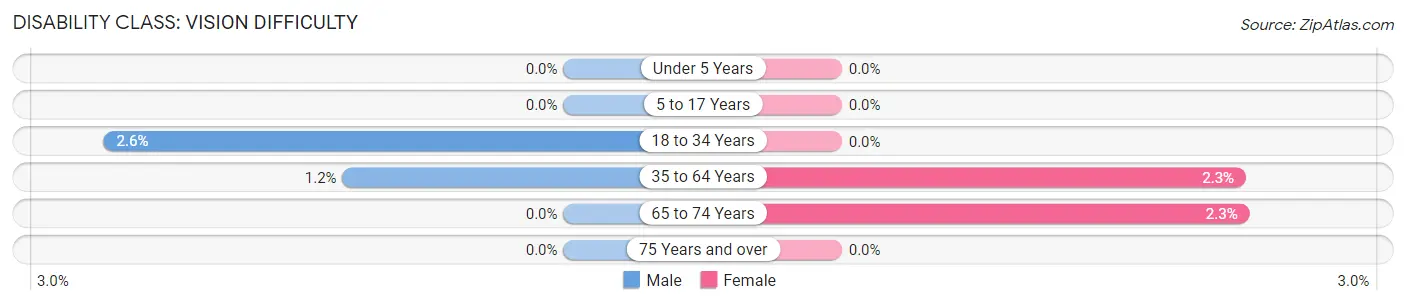
| Age Bracket | Male | Female |
| Under 5 Years | 0 (0.0%) | 0 (0.0%) |
| 5 to 17 Years | 0 (0.0%) | 0 (0.0%) |
| 18 to 34 Years | 7 (2.6%) | 0 (0.0%) |
| 35 to 64 Years | 3 (1.2%) | 7 (2.2%) |
| 65 to 74 Years | 0 (0.0%) | 1 (2.3%) |
| 75 Years and over | 0 (0.0%) | 0 (0.0%) |
Disability Class: Cognitive Difficulty
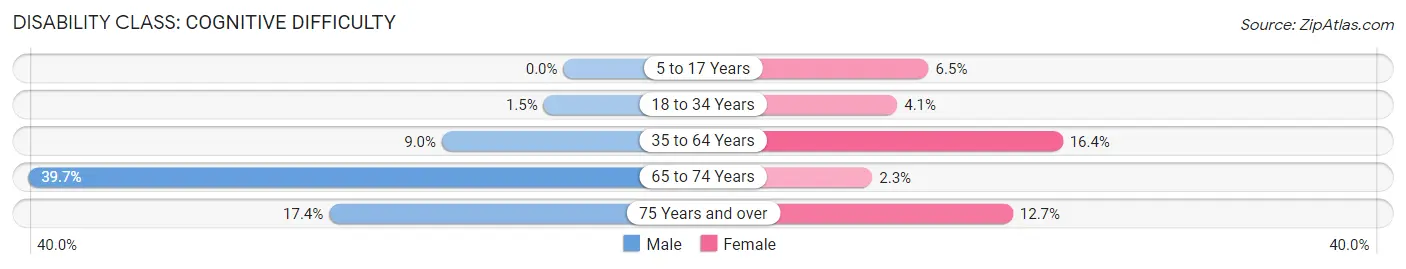
| Age Bracket | Male | Female |
| 5 to 17 Years | 0 (0.0%) | 10 (6.5%) |
| 18 to 34 Years | 4 (1.5%) | 7 (4.1%) |
| 35 to 64 Years | 22 (9.0%) | 51 (16.4%) |
| 65 to 74 Years | 29 (39.7%) | 1 (2.3%) |
| 75 Years and over | 4 (17.4%) | 8 (12.7%) |
Disability Class: Ambulatory Difficulty
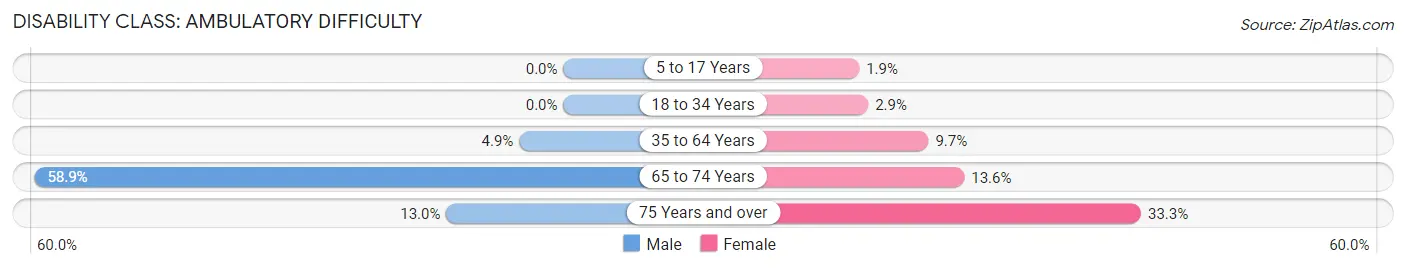
| Age Bracket | Male | Female |
| 5 to 17 Years | 0 (0.0%) | 3 (1.9%) |
| 18 to 34 Years | 0 (0.0%) | 5 (2.9%) |
| 35 to 64 Years | 12 (4.9%) | 30 (9.7%) |
| 65 to 74 Years | 43 (58.9%) | 6 (13.6%) |
| 75 Years and over | 3 (13.0%) | 21 (33.3%) |
Disability Class: Self-Care Difficulty
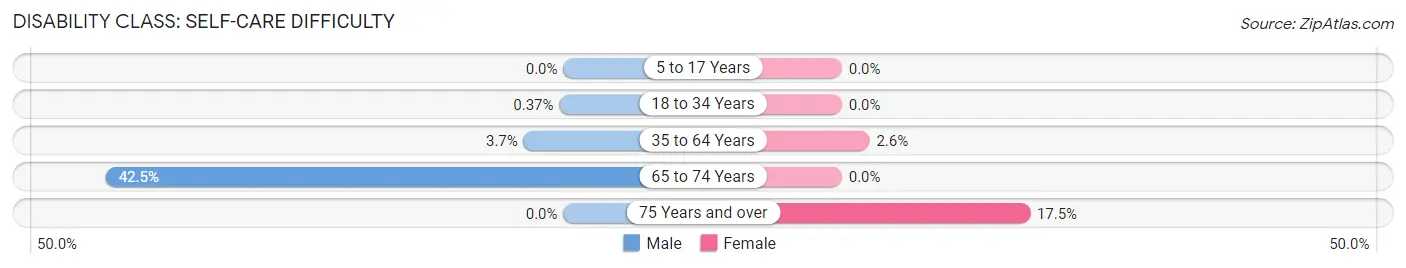
| Age Bracket | Male | Female |
| 5 to 17 Years | 0 (0.0%) | 0 (0.0%) |
| 18 to 34 Years | 1 (0.4%) | 0 (0.0%) |
| 35 to 64 Years | 9 (3.7%) | 8 (2.6%) |
| 65 to 74 Years | 31 (42.5%) | 0 (0.0%) |
| 75 Years and over | 0 (0.0%) | 11 (17.5%) |
Technology Access in Newport borough
Computing Device Access in Newport borough
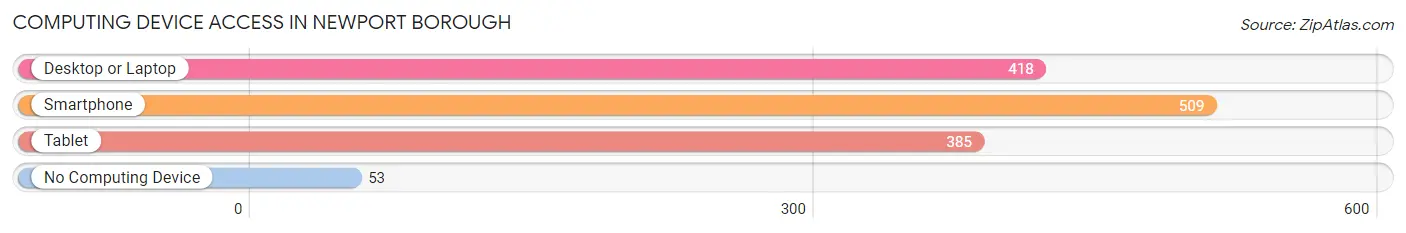
| Device Type | # Households | % Households |
| Desktop or Laptop | 418 | 69.0% |
| Smartphone | 509 | 84.0% |
| Tablet | 385 | 63.5% |
| No Computing Device | 53 | 8.7% |
| Total | 606 | 100.0% |
Internet Access in Newport borough
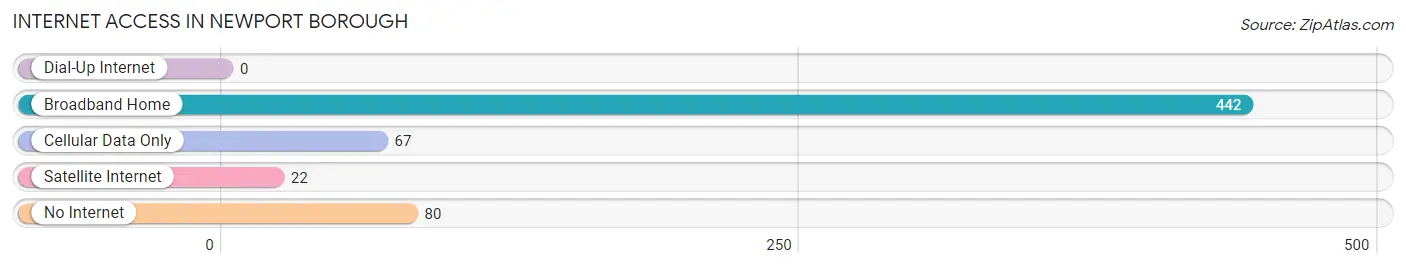
| Internet Type | # Households | % Households |
| Dial-Up Internet | 0 | 0.0% |
| Broadband Home | 442 | 72.9% |
| Cellular Data Only | 67 | 11.1% |
| Satellite Internet | 22 | 3.6% |
| No Internet | 80 | 13.2% |
| Total | 606 | 100.0% |
Newport borough Summary
Newport Borough is a small borough located in Perry County, Pennsylvania. It is situated in the Susquehanna Valley, approximately 10 miles northwest of Harrisburg, the state capital. The borough is part of the Harrisburg-Carlisle Metropolitan Statistical Area. As of the 2010 census, the population of Newport Borough was 2,077.
History
Newport Borough was founded in 1814 by a group of settlers from Lancaster County. The town was named after Newport, Rhode Island, and was originally part of Perry County. In 1820, the borough was incorporated and the first mayor was elected.
In the 19th century, Newport Borough was a thriving industrial center. The town was home to several mills, including a woolen mill, a paper mill, and a flour mill. The town also had a tannery, a brewery, and a distillery. In the late 19th century, the town was home to several factories, including a cigar factory, a shoe factory, and a furniture factory.
Geography
Newport Borough is located in Perry County, Pennsylvania. It is situated in the Susquehanna Valley, approximately 10 miles northwest of Harrisburg, the state capital. The borough is part of the Harrisburg-Carlisle Metropolitan Statistical Area.
The borough is located in the Juniata River Valley, and is bordered by the Juniata River to the east and the Susquehanna River to the west. The borough is located in a rural area, and is surrounded by rolling hills and farmland.
Economy
Newport Borough is a small, rural community with a limited economy. The town is home to several small businesses, including a grocery store, a hardware store, and a few restaurants. The town also has a few small manufacturing companies, including a furniture factory and a printing company.
The town is also home to a few tourist attractions, including the Newport Historical Society Museum and the Newport Aquarium. The town is also home to a few festivals, including the Newport Music Festival and the Newport Arts Festival.
Demographics
As of the 2010 census, the population of Newport Borough was 2,077. The racial makeup of the borough was 97.3% White, 0.9% African American, 0.3% Native American, 0.2% Asian, 0.1% Pacific Islander, 0.3% from other races, and 0.9% from two or more races. Hispanic or Latino of any race were 1.2% of the population.
The median household income in Newport Borough was $41,944, and the median family income was $50,000. The per capita income in the borough was $20,945. About 8.3% of families and 10.2% of the population were below the poverty line, including 14.2% of those under age 18 and 8.2% of those age 65 or over.
Common Questions
What is Per Capita Income in Newport borough?
Per Capita income in Newport borough is $30,844.
What is the Median Family Income in Newport borough?
Median Family Income in Newport borough is $84,018.
What is the Median Household income in Newport borough?
Median Household Income in Newport borough is $59,868.
What is Income or Wage Gap in Newport borough?
Income or Wage Gap in Newport borough is 22.2%.
Women in Newport borough earn 77.8 cents for every dollar earned by a man.
What is Inequality or Gini Index in Newport borough?
Inequality or Gini Index in Newport borough is 0.42.
What is the Total Population of Newport borough?
Total Population of Newport borough is 1,584.
What is the Total Male Population of Newport borough?
Total Male Population of Newport borough is 788.
What is the Total Female Population of Newport borough?
Total Female Population of Newport borough is 796.
What is the Ratio of Males per 100 Females in Newport borough?
There are 98.99 Males per 100 Females in Newport borough.
What is the Ratio of Females per 100 Males in Newport borough?
There are 101.02 Females per 100 Males in Newport borough.
What is the Median Population Age in Newport borough?
Median Population Age in Newport borough is 33.4 Years.
What is the Average Family Size in Newport borough
Average Family Size in Newport borough is 3.2 People.
What is the Average Household Size in Newport borough
Average Household Size in Newport borough is 2.6 People.
How Large is the Labor Force in Newport borough?
There are 854 People in the Labor Forcein in Newport borough.
What is the Percentage of People in the Labor Force in Newport borough?
69.4% of People are in the Labor Force in Newport borough.
What is the Unemployment Rate in Newport borough?
Unemployment Rate in Newport borough is 4.1%.