Zip Codes with the Highest Percentage of Population with a Degree in Liberal Arts and History in Chambersburg, PA
RELATED REPORTS & OPTIONS
Liberal Arts and History
Chambersburg
Compare Zip Codes
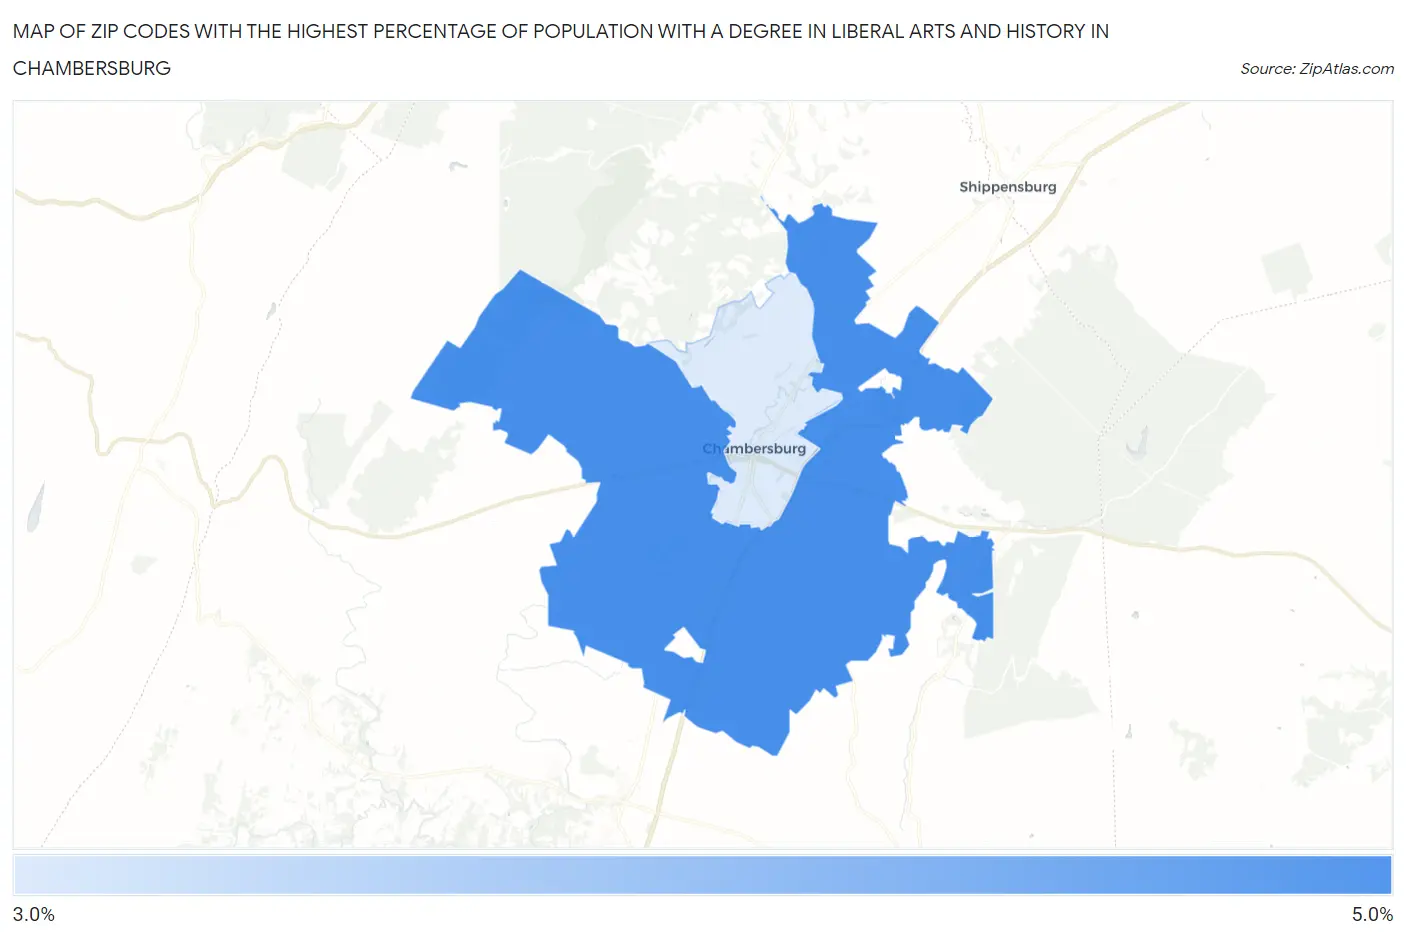
Map of Zip Codes with the Highest Percentage of Population with a Degree in Liberal Arts and History in Chambersburg
3.9%
4.4%
Zip Codes with the Highest Percentage of Population with a Degree in Liberal Arts and History in Chambersburg, PA
| Zip Code | % Graduates | vs State | vs National | |
| 1. | 17202 | 4.4% | 4.6%(-0.181)#662 | 4.9%(-0.443)#13,193 |
| 2. | 17201 | 3.9% | 4.6%(-0.747)#770 | 4.9%(-1.01)#15,285 |
1
Common Questions
What are the Top Zip Codes with the Highest Percentage of Population with a Degree in Liberal Arts and History in Chambersburg, PA?
Top Zip Codes with the Highest Percentage of Population with a Degree in Liberal Arts and History in Chambersburg, PA are:
What zip code has the Highest Percentage of Population with a Degree in Liberal Arts and History in Chambersburg, PA?
17202 has the Highest Percentage of Population with a Degree in Liberal Arts and History in Chambersburg, PA with 4.4%.
What is the Percentage of Population with a Degree in Liberal Arts and History in Pennsylvania?
Percentage of Population with a Degree in Liberal Arts and History in Pennsylvania is 4.6%.
What is the Percentage of Population with a Degree in Liberal Arts and History in the United States?
Percentage of Population with a Degree in Liberal Arts and History in the United States is 4.9%.